Embed Size (px)
Citation preview
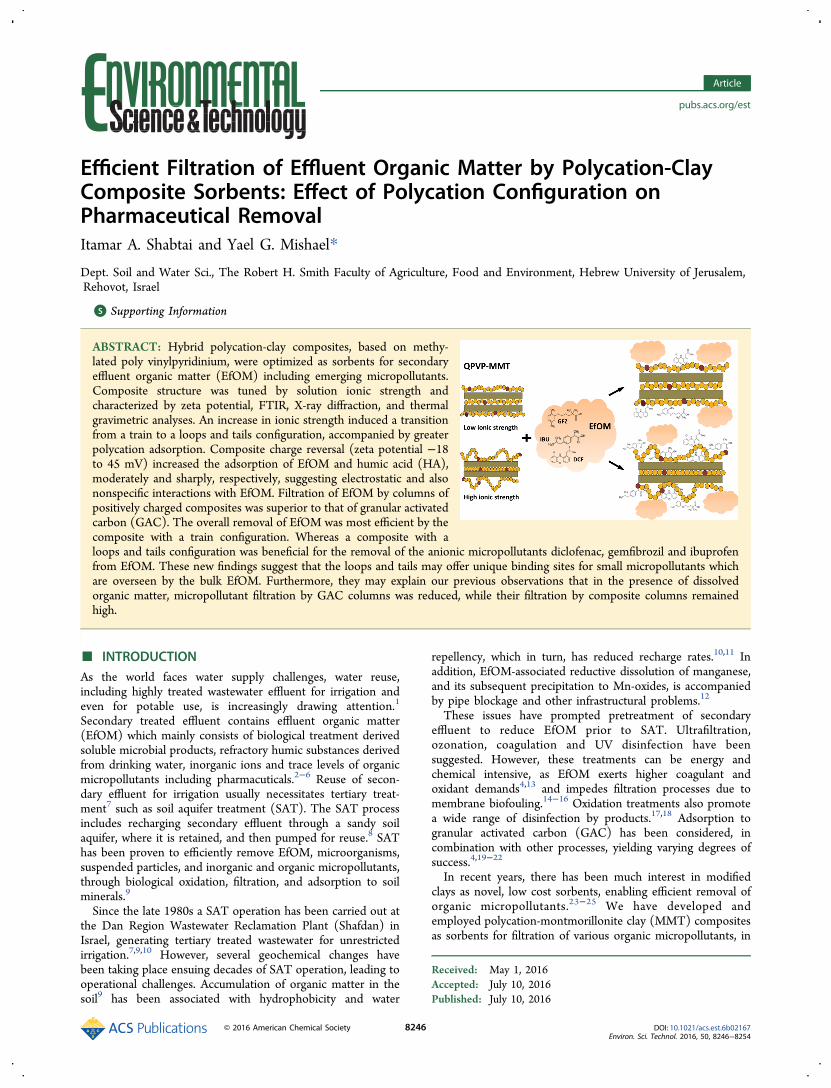
Efficient Filtration of Effluent Organic Matter by Polycation-ClayComposite Sorbents: Effect of Polycation Configuration onPharmaceutical RemovalItamar A. Shabtai and Yael G. Mishael*
Dept. Soil and Water Sci., The Robert H. Smith Faculty of Agriculture, Food and Environment, Hebrew University of Jerusalem,Rehovot, Israel
*S Supporting Information
ABSTRACT: Hybrid polycation-clay composites, based on methy-lated poly vinylpyridinium, were optimized as sorbents for secondaryeffluent organic matter (EfOM) including emerging micropollutants.Composite structure was tuned by solution ionic strength andcharacterized by zeta potential, FTIR, X-ray diffraction, and thermalgravimetric analyses. An increase in ionic strength induced a transitionfrom a train to a loops and tails configuration, accompanied by greaterpolycation adsorption. Composite charge reversal (zeta potential −18to 45 mV) increased the adsorption of EfOM and humic acid (HA),moderately and sharply, respectively, suggesting electrostatic and alsononspecific interactions with EfOM. Filtration of EfOM by columns ofpositively charged composites was superior to that of granular activatedcarbon (GAC). The overall removal of EfOM was most efficient by thecomposite with a train configuration. Whereas a composite with aloops and tails configuration was beneficial for the removal of the anionic micropollutants diclofenac, gemfibrozil and ibuprofenfrom EfOM. These new findings suggest that the loops and tails may offer unique binding sites for small micropollutants whichare overseen by the bulk EfOM. Furthermore, they may explain our previous observations that in the presence of dissolvedorganic matter, micropollutant filtration by GAC columns was reduced, while their filtration by composite columns remainedhigh.
■ INTRODUCTIONAs the world faces water supply challenges, water reuse,including highly treated wastewater effluent for irrigation andeven for potable use, is increasingly drawing attention.1
Secondary treated effluent contains effluent organic matter(EfOM) which mainly consists of biological treatment derivedsoluble microbial products, refractory humic substances derivedfrom drinking water, inorganic ions and trace levels of organicmicropollutants including pharmacuticals.2−6 Reuse of secon-dary effluent for irrigation usually necessitates tertiary treat-ment7 such as soil aquifer treatment (SAT). The SAT processincludes recharging secondary effluent through a sandy soilaquifer, where it is retained, and then pumped for reuse.8 SAThas been proven to efficiently remove EfOM, microorganisms,suspended particles, and inorganic and organic micropollutants,through biological oxidation, filtration, and adsorption to soilminerals.9
Since the late 1980s a SAT operation has been carried out atthe Dan Region Wastewater Reclamation Plant (Shafdan) inIsrael, generating tertiary treated wastewater for unrestrictedirrigation.7,9,10 However, several geochemical changes havebeen taking place ensuing decades of SAT operation, leading tooperational challenges. Accumulation of organic matter in thesoil9 has been associated with hydrophobicity and water
repellency, which in turn, has reduced recharge rates.10,11 Inaddition, EfOM-associated reductive dissolution of manganese,and its subsequent precipitation to Mn-oxides, is accompaniedby pipe blockage and other infrastructural problems.12
These issues have prompted pretreatment of secondaryeffluent to reduce EfOM prior to SAT. Ultrafiltration,ozonation, coagulation and UV disinfection have beensuggested. However, these treatments can be energy andchemical intensive, as EfOM exerts higher coagulant andoxidant demands4,13 and impedes filtration processes due tomembrane biofouling.14−16 Oxidation treatments also promotea wide range of disinfection by products.17,18 Adsorption togranular activated carbon (GAC) has been considered, incombination with other processes, yielding varying degrees ofsuccess.4,19−22
In recent years, there has been much interest in modifiedclays as novel, low cost sorbents, enabling efficient removal oforganic micropollutants.23−25 We have developed andemployed polycation-montmorillonite clay (MMT) compositesas sorbents for filtration of various organic micropollutants, in
Received: May 1, 2016Accepted: July 10, 2016Published: July 10, 2016
Article
pubs.acs.org/est
© 2016 American Chemical Society 8246 DOI: 10.1021/acs.est.6b02167Environ. Sci. Technol. 2016, 50, 8246−8254
the presence of dissolved organic matter (DOM) or humic acid(HA).26−28 The designed composites were based on poly-4-vinylpyridine-co-styrene (PVP), protonated PVP (HPVP) andmethylated PVP (QPVP), for the removal of pyrene,27
atrazine26 and diclofenac,28 respectively. In all cases, thefiltration of the micropollutants by columns of the designedcomposite was more efficient than by GAC columns. Moreimportantly, in the presence of DOM (for atrazine) or HA (forpyrene and diclofenac) micropollutant filtration by the GACcolumns was reduced, as reported by many studies,29,30 whilethe removal of the micropollutants by the composite columnswas not compromised and remained high.This high removal of micropollutants in the presence of
DOM by the PVP composites was not fully understood butthree main mechanisms were suggested: coadsorption (asconcluded in the case of pyrene27), competition and/orindependently.28 To unveil which mechanisms are involved itis necessary to 1. Investigate pollutant-DOM interactions 2.Explore DOM removal by the composites and, mostchallenging 3. To distinguish between the adsorption sites ofthe DOM and the micropollutants. Anionic pharmaceuticals (atenvironmentally relevant pH) were selected to minimizepollutant-DOM interactions, excluding coadsorption. Ourprevious study on diclofenac (DCF) removal by QPVP-MMT composites suggested that at high polycation loadings inwhich the polycation adopts a loops and tails configuration,DCF may adsorb to unique sites on the composite, implyingthat independent adsorption may occur.28
In the current study we explored the filtration of EfOM fromthe Shafdan by GAC and by QPVP-MMT composites andaimed to elucidate the role of QPVP configuration (at theadsorbed state) in the removal of EfOM, and anionicpharmaceuticals commonly detected in the effluent: diclofenac(DCF), ibuprofen (IBP) and gemfibrozil (GFZ). QPVPloading and configuration on the clay were tuned by polycationsolution ionic strength (IS) and the effect of both properties onremoval efficiency was tested. The effect of solution IS on theinteractions between oppositely charged colloids (polycationsand clay minerals) has been investigated experimentally andmodeled.31−34 However, the consequent effect of polycationloading and configuration on composite functionality, that is,binding abilities, has not been widely explored and therefore isaddressed here.
■ MATERIALS AND METHODSMaterials. Wyoming Na-montmorillonite SWy-2 (MMT)
was obtained from the Source Clays Repository of the ClayMineral Society (Columbia, MO). Poly(4-vinylpyridine-co-styrene) (PVP; MW = 1200−1500 kDa; 9/1 pyridine/styrene),dimethylformamide, methyl iodide, humic acid sodium salttechnical grade (HA), diclofenac sodium salt (pKa 4.15),gemfibrozil (pKa 4.42) and ibuprofen (pKa 4.34) and all otherreagents were purchased from Sigma-Aldrich. Dialysis bags witha cutoff of 1000 Da were used (Spectra/Por 6, Spectrumlabs).Granular activated carbon (GAC) was NORIT GAC 1240. Apeat bog based GAC, 8−20 mesh, was purchased from Sigma-Aldrich (only used in the experiment outlined in Figure 7,denoted GAC 2). Quartz sand (grain size 0.8−1.5 mm) waspurchased from Shoshani and Weinstein (Israel). Sandy soil(<2 mm) was sampled from the vicinity of SAT infiltration sites(not subjected to SAT in the past) and denoted Shafdan soil.The sandy media were washed in deionized water untilsupernatant was free of dissolved carbon and UV absorbance
and dried at 105 °C. Stock solutions of HA (50 mg/L) wereprepared as described,35 filtered through a 0.45 μm filter paper,diluted with filtered tap water to the required concentration,and used immediately (pH 7.8). Secondary effluent (prior toSAT) from the Shafdan (Supporting Information (SI) S1 foreffluent properties) was collected, immediately refrigerated (2°C) and used within 24 h.
Methods. Composite Preparation. Preparation of methy-lated PVP (QPVP) and polycation-clay composites was carriedout as described.26,28 Briefly, MMT clay suspension (1.67 g/L,0.5 mL) was added to QPVP solutions (0.05−2 g/L, 1 mL) inEppendorf vials (1.5 mL). In addition, QPVP (2 g/L)adsorption on MMT (1.67 g/L) was determined as a functionof polycation solution IS (0−4 M NaCl). The clay-polycationsuspensions were agitated for 2 h (equilibrium was reachedwithin 1 h) using a shaker, centrifuged (10 000g; 15 min), andsupernatants were separated from the settled composites whichwere washed with deionized water (1.5 mL) and centrifugedagain.The absorbance of the supernatants was measured using
UV−Vis spectrophotometry (Thermo Scientific, Evolution 300,Waltham, MA) at an excitation wavelength of 256 nm. Astandard calibration curve was fitted and the amount ofpolycation adsorbed was calculated accordingly. Compositesprepared for column experiments were prepared in a 20 L glasscarboy and gently mixed with a magnetic stirrer for 2 h. QPVP-MMT composites prepared from polycation solution with IS of0 M, 0.01 and 1 M, are denoted QPVP 0 M-, QPVP 0.01 M-,and QPVP 1 M-MMT, respectively.
Composite Characterization. FTIR Measurements. Thespectra were obtained by pellets (100 mg) from freeze-driedQPVP solutions (3 g/L, 1 mg) and QPVP-MMT composites(2 mg) prepared at different IS mixed with KBr and recorded atroom temperature in the range of 500−4000 cm−1 using anFTIR spectrometer (Nicolet Magna-IR-550, Madison WI).
X-ray Diffraction (XRD) Measurements. The basal (d 001)spacings of QPVP-MMT composites prepared at different ISwere measured by XRD. Composite suspensions (1−2 mL;0.1%) were placed on a glass slide and left to sediment(oriented sample) for 1 day. The basal spacing was measuredusing an X-ray diffractometer (Philips PW1830/3710/3020)with Cu KR radiation, λ = 1.526 Å.
Thermal Measurements. Thermal gravimetric analysis(TGA) of freeze-dried, air equilibrated QPVP and QPVP-MMT composites prepared at different IS were carried out on aQ500 Thermogravimetric Analyzer (TA Instruments Inc.).Heating rate was 10 °C/min using the high resolution-dynamicprogram (sensitivity 3, resolution 2); temperature ranged from30 to 900 °C; air flow rate was 60 mL/min.
Zeta Potential Measurements. Zeta potentials of 0.1% (w/w) suspensions of GAC and QPVP-MMT composites (0.1−2.8mmol QPVP/g clay) were measured using a ZetasizerNanosystem (Malvern Instruments, Southborough, MA).
Exchangeable Anion Capacity. Upon QPVP adsorption tothe clay the counter-anions (I− and Cl−) of the monomerswhich are in direct interaction with the clay are released. Theexchangeable anion capacity (QPVP monomers not in directinteraction with the clay) of QPVP composites was determinedby displacement of the counteranions with bromide. QPVP 0M-, QPVP 0.01 M-, and QPVP 1 M-MMT (22 mg) weredialyzed (Spectra/Por 6, molecular weight cutoff 1000 da)against several changes of deionized water to remove excesselectrolytes and low-weight polycation fractions (monitored by
Environmental Science & Technology Article
DOI: 10.1021/acs.est.6b02167Environ. Sci. Technol. 2016, 50, 8246−8254
8247
EC (electrical conductivity) and UV absorbance at 256 nm,respectively). Since QPVP 0.01 M-MMT and QPVP 1 M-MMT contain chloride as well as iodide, they were firstsaturated with iodide by repeated dialysis against potassiumiodide (200 mL, 1 mM) and then against deionized water, toremove excess iodide and electrolyte. Then, KBr (200 mL, 5mM) was added to the solution surrounding the dialysis bagscontaining the composites and stirred for 24 h. Theconcentration of iodide in the dialysate was determined byUV absorbance at 226 nm. The KBr solution was replacedrepeatedly to ensure complete exchange of iodide. A calibrationcurve was prepared with potassium iodide and the exchangeableanion capacity was calculated accordingly.Analysis of EfOM and HA. Samples of EfOM and HA were
filtered through a 0.45 μm Acrodisc syringe filter prior tomeasurement.Zeta Potential Measurements. Zeta potentials of Shafdan
effluent (12.2 mg/L dissolved organic carbon (DOC)) and HA(3 mg/L (DOC)) solutions were measured as described above.UV−Vis Spectrophotometry. UV absorbance at a wave-
length of 254 nm (UV254) was measured (Thermo Scientific,Evolution 300, Waltham, MA).Dissolved Organic Carbon (DOC) Measurements. DOC
(mg/L) was measured at the Nesin laboratory of Mekorot,National Water Carrier, following the Standard Methods.36
Comparison of UV−Vis and DOC Measurements. Shafdansecondary effluent was passed through QPVP-MMT, Shafdansoil and GAC columns (see details below). The DOC contentand UV254 of the eluent were determined (as described above)at timed intervals, and their values plotted against each otherfor the GAC and composite columns separately. Since nosignificant difference between sorbents was observed, astatistically significant (P < 0.0001) regression was obtainedfor the whole data set (SI Figure S2), as reported elsewhere(Goren et al., 2008). This indicated that UV−vis spectropho-tometry may be used to compare the removal efficiency of thedifferent sorbents.Removal of EfOM and Humic Acid by QPVP-MMT
Composites and GAC. EfOM and HA Adsorption to QPVP-MMT Composites. EfOM (12.2 mg/L DOC) or HA (3 mg/LDOC) were added to centrifuge tubes containing QPVP-MMTcomposites (0−1.1 mmol QPVP/g clay). In both cases, theratio of added dissolved organics to clay was 18 mg DOC/gclay. Control samples (i.e., HA or EfOM without sorbent) wereincluded. The tubes were agitated for 24 h, supernatants wereseparated by centrifugation (10000 g; 15 min) and their UV254was measured. Amount of EfOM or HA adsorbed (% removal)was calculated accordingly.Filtration of EfOM and HA by QPVP-MMT and GAC
Columns. Glass columns (20 cm length, 1 cm diameter, 6 mLpore volume) were filled with 20 g of quartz sand and 0.2 gsorbent (Low QPVP-MMT and QPVP 0 M-, 0.01 M- and 1 M-MMT, or GAC) to achieve a weight ratio of 1:100 (w/w). Thesorbents were mixed with excess quartz sand to enable a highflow rate through the column. These composite columns werewashed by passing tap water, and polycation concentration inthe leachate was monitored and quantified by UV−vis, asdescribed above. Cumulative polycation desorption from eachcomposite was ∼5% of initial polycation content. Nopolycation was detected in the water after 18 pore volumesfor QPVP 0 M- and 0.01 M-MMT and after 130 pore volumesfor QPVP 1 M-MMT (SI Figure S3).
Filtration of HA (3 mg/L DOC) and Shafdan EfOM (12.2mg/L DOC) by the columns was studied (150−200 porevolumes). Experiments were carried out in duplicates at 25 °C,at a flow rate of 2 mL/min, obtaining a filter velocity of 1.5 m/h.A filtration experiment at higher composite/sand ratio (1:20
(w/w)) testing the most efficient composite was conducted.Glass columns (20 cm length, 1.5 cm diameter, 30 mL porevolume) were filled with either Shafdan soil (74 g), QPVP 0 M-MMT or GAC (3.5 g) mixed with 70.5 g of quartz sand.Shafdan secondary effluent was passed through each of thefilters at a flow rate of 3.6 mL/min, obtaining a filter velocity of1.3 m/h. The eluents and stock solutions were collected intimed intervals and analyzed for EfOM concentration by UV−vis spectrophotometry. UV254 and DOC of Shafdan effluentand HA stock solution remained constant in the time frame ofthe filtration experiments.
Removal of Anionic Micropollutants by QPVP Composites.Micropollutant Analysis. Micropollutant concentration in thesupernatants was measured by an Agilent 1200 series HPLCinstrument equipped with a G1315D diode-array detector and aG1321A fluorescence detector. HPLC column was Phenom-enox Luna C18(2) (5 μm). DCF was measured with the diode-array detector (λ = 276 nm) and IBU and GFZ were measuredby fluorescence (λex = 210 λem = 300 nm and λex = 220 λem =300 nm, respectively). Measurements were carried outisocratically at 30 °C. The mobile phase was acetonitrile andacidified double distilled water (0.1% formic acid) (80/20 forDCF and GFZ and 90/10 for IBU). The flow rate was 1 mL/min for DCF and GFZ and 1.2 mL/min for IBU. LOQ was0.05, 0.025, and 0.05 mg/L for DCF, GFZ, and IBU,respectively. Initial micropollutant concentration in the Shafdaneffluent (SI Table S1) was below the LOD of the abovemethod.
Adsorption of Micropollutant to QPVP Composites. Stocksolutions of DCF, GFZ, and IBU were prepared in methanol(30, 17, 15 mg/mL). Tap water or Shafdan effluent (pH 7.8)were spiked (0.1% v/v) with the above stock solutions yieldingworking solutions of DCF, GFZ, and IBU, (30 mg/L, 0.094mM) (17 mg/L, 0.068 mM), (15 mg/L, 0.073 mM),respectively. These concentrations correspond to approximately12 mg DOC/L, similar to the DOC concentration of EfOM inthe Shafdan effluent. Micropollutant working solutions wereadded to 50 mL Teflon tubes containing QPVP 0 M-, QPVP0.01 M- or QPVP 1 M-MMT composites (1.67 g/L) andagitated for 24 h. Supernatants were separated by centrifugation(10 000g; 15 min) and filtered with 0.45 μm PTFE syringefilters (AXIVA). Analyte loss in control samples (i.e., micropollutant without composite) was negligible.
Anionic Micropollutant Interactions with EfOM. Shafdaneffluent (50 mL) was added to dialysis bags (1000 Da cutoff)and immersed in tap water (150 mL) (to minimize excessdilution of electrolyte) which was spiked with DCF, GFZ orIBU to obtain a final concentration of 20, 11.3, and 10 mg/L,respectively, and agitated for 48 h. Micropollutant concen-trations inside and outside of the dialysis bags were determined.Different micropollutant concentrations inside and outside thebags would suggest micropollutant-EfOM interactions. How-ever, the concentration of DCF, GFZ, and IBU inside andoutside of the dialysis bag did not differ significantly, indicatingthat interactions between negatively charged EfOM andmicropollutants were negligible, as expected.
Environmental Science & Technology Article
DOI: 10.1021/acs.est.6b02167Environ. Sci. Technol. 2016, 50, 8246−8254
8248
Control samples which included the micropollutants in theabsence of effluent, verified that DCF, GFZ, or IBUconcentrations inside and outside the dialysis bag were equal.Adsorption of the tested micropollutants to the dialysis bag wasfound to be negligible (<%5). Micropollutant concentration didnot decrease upon incubation with Shafdan effluent (48 h).Additional control tubes containing Shafdan effluent (in theabsence of micropollutants) indicated that approximately 50%of the EfOM diffused outside the dialysis bags as previouslyreported.37,38 The low molecular weight fraction was notdiscarded in order to determine the interactions of themicropollutants with both EfOM size fractions.
■ RESULTS AND DISCUSSIONEffect of IS on QPVP Adsorption to Clay. Polycation
configuration on a surface is strongly affected by its loading.39
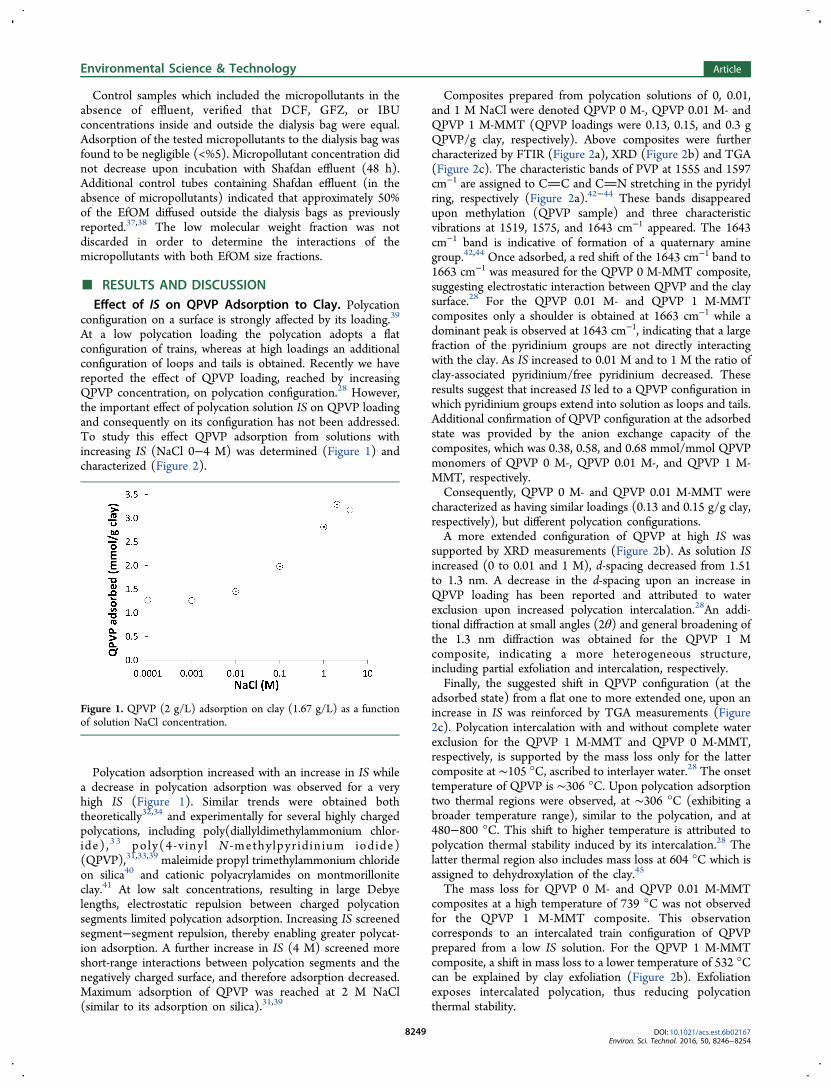
At a low polycation loading the polycation adopts a flatconfiguration of trains, whereas at high loadings an additionalconfiguration of loops and tails is obtained. Recently we havereported the effect of QPVP loading, reached by increasingQPVP concentration, on polycation configuration.28 However,the important effect of polycation solution IS on QPVP loadingand consequently on its configuration has not been addressed.To study this effect QPVP adsorption from solutions withincreasing IS (NaCl 0−4 M) was determined (Figure 1) andcharacterized (Figure 2).
Polycation adsorption increased with an increase in IS whilea decrease in polycation adsorption was observed for a veryhigh IS (Figure 1). Similar trends were obtained boththeoretically32,34 and experimentally for several highly chargedpolycations, including poly(diallyldimethylammonium chlor-ide) , 3 3 poly(4-v inyl N -methy lpyr id in ium iodide)(QPVP),31,33,39 maleimide propyl trimethylammonium chlorideon silica40 and cationic polyacrylamides on montmorilloniteclay.41 At low salt concentrations, resulting in large Debyelengths, electrostatic repulsion between charged polycationsegments limited polycation adsorption. Increasing IS screenedsegment−segment repulsion, thereby enabling greater polycat-ion adsorption. A further increase in IS (4 M) screened moreshort-range interactions between polycation segments and thenegatively charged surface, and therefore adsorption decreased.Maximum adsorption of QPVP was reached at 2 M NaCl(similar to its adsorption on silica).31,39
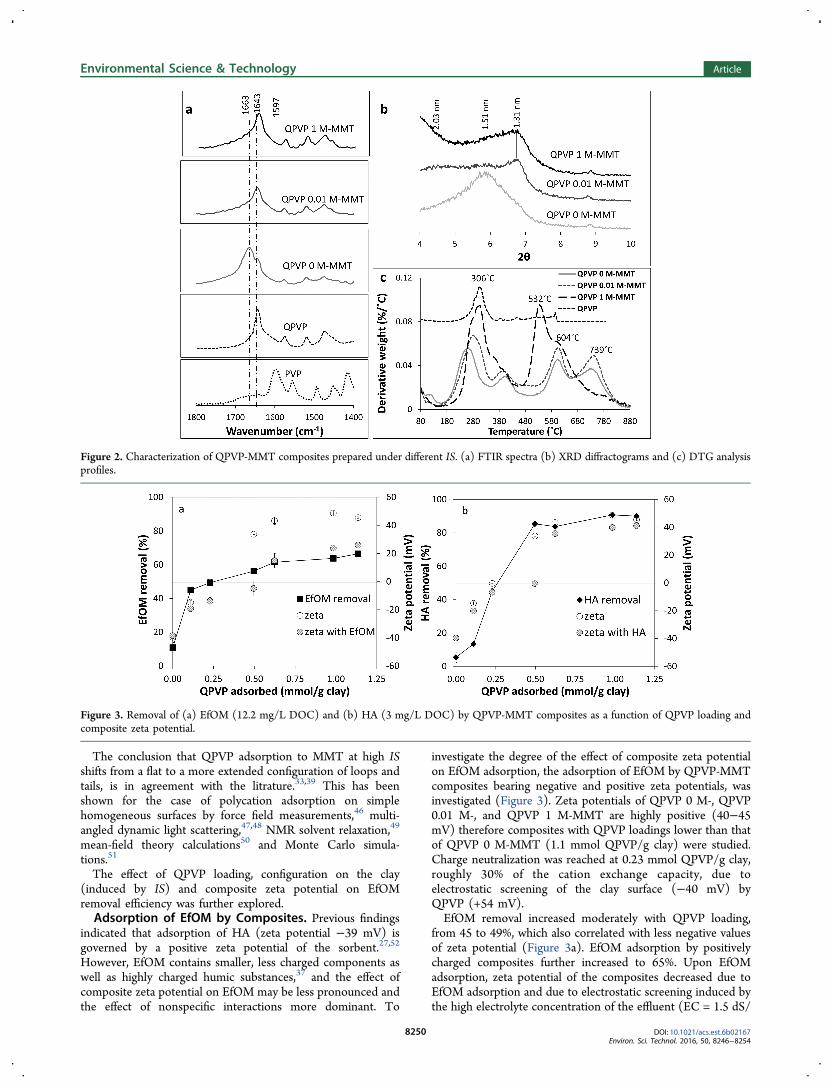
Composites prepared from polycation solutions of 0, 0.01,and 1 M NaCl were denoted QPVP 0 M-, QPVP 0.01 M- andQPVP 1 M-MMT (QPVP loadings were 0.13, 0.15, and 0.3 gQPVP/g clay, respectively). Above composites were furthercharacterized by FTIR (Figure 2a), XRD (Figure 2b) and TGA(Figure 2c). The characteristic bands of PVP at 1555 and 1597cm−1 are assigned to CC and CN stretching in the pyridylring, respectively (Figure 2a).42−44 These bands disappearedupon methylation (QPVP sample) and three characteristicvibrations at 1519, 1575, and 1643 cm−1 appeared. The 1643cm−1 band is indicative of formation of a quaternary aminegroup.42,44 Once adsorbed, a red shift of the 1643 cm−1 band to1663 cm−1 was measured for the QPVP 0 M-MMT composite,suggesting electrostatic interaction between QPVP and the claysurface.28 For the QPVP 0.01 M- and QPVP 1 M-MMTcomposites only a shoulder is obtained at 1663 cm−1 while adominant peak is observed at 1643 cm−1, indicating that a largefraction of the pyridinium groups are not directly interactingwith the clay. As IS increased to 0.01 M and to 1 M the ratio ofclay-associated pyridinium/free pyridinium decreased. Theseresults suggest that increased IS led to a QPVP configuration inwhich pyridinium groups extend into solution as loops and tails.Additional confirmation of QPVP configuration at the adsorbedstate was provided by the anion exchange capacity of thecomposites, which was 0.38, 0.58, and 0.68 mmol/mmol QPVPmonomers of QPVP 0 M-, QPVP 0.01 M-, and QPVP 1 M-MMT, respectively.Consequently, QPVP 0 M- and QPVP 0.01 M-MMT were
characterized as having similar loadings (0.13 and 0.15 g/g clay,respectively), but different polycation configurations.A more extended configuration of QPVP at high IS was
supported by XRD measurements (Figure 2b). As solution ISincreased (0 to 0.01 and 1 M), d-spacing decreased from 1.51to 1.3 nm. A decrease in the d-spacing upon an increase inQPVP loading has been reported and attributed to waterexclusion upon increased polycation intercalation.28An addi-tional diffraction at small angles (2θ) and general broadening ofthe 1.3 nm diffraction was obtained for the QPVP 1 Mcomposite, indicating a more heterogeneous structure,including partial exfoliation and intercalation, respectively.Finally, the suggested shift in QPVP configuration (at the
adsorbed state) from a flat one to more extended one, upon anincrease in IS was reinforced by TGA measurements (Figure2c). Polycation intercalation with and without complete waterexclusion for the QPVP 1 M-MMT and QPVP 0 M-MMT,respectively, is supported by the mass loss only for the lattercomposite at ∼105 °C, ascribed to interlayer water.28 The onsettemperature of QPVP is ∼306 °C. Upon polycation adsorptiontwo thermal regions were observed, at ∼306 °C (exhibiting abroader temperature range), similar to the polycation, and at480−800 °C. This shift to higher temperature is attributed topolycation thermal stability induced by its intercalation.28 Thelatter thermal region also includes mass loss at 604 °C which isassigned to dehydroxylation of the clay.45
The mass loss for QPVP 0 M- and QPVP 0.01 M-MMTcomposites at a high temperature of 739 °C was not observedfor the QPVP 1 M-MMT composite. This observationcorresponds to an intercalated train configuration of QPVPprepared from a low IS solution. For the QPVP 1 M-MMTcomposite, a shift in mass loss to a lower temperature of 532 °Ccan be explained by clay exfoliation (Figure 2b). Exfoliationexposes intercalated polycation, thus reducing polycationthermal stability.
Figure 1. QPVP (2 g/L) adsorption on clay (1.67 g/L) as a functionof solution NaCl concentration.
Environmental Science & Technology Article
DOI: 10.1021/acs.est.6b02167Environ. Sci. Technol. 2016, 50, 8246−8254
8249
The conclusion that QPVP adsorption to MMT at high ISshifts from a flat to a more extended configuration of loops andtails, is in agreement with the litrature.33,39 This has beenshown for the case of polycation adsorption on simplehomogeneous surfaces by force field measurements,46 multi-angled dynamic light scattering,47,48 NMR solvent relaxation,49
mean-field theory calculations50 and Monte Carlo simula-tions.51
The effect of QPVP loading, configuration on the clay(induced by IS) and composite zeta potential on EfOMremoval efficiency was further explored.Adsorption of EfOM by Composites. Previous findings
indicated that adsorption of HA (zeta potential −39 mV) isgoverned by a positive zeta potential of the sorbent.27,52
However, EfOM contains smaller, less charged components aswell as highly charged humic substances,37 and the effect ofcomposite zeta potential on EfOM may be less pronounced andthe effect of nonspecific interactions more dominant. To
investigate the degree of the effect of composite zeta potentialon EfOM adsorption, the adsorption of EfOM by QPVP-MMTcomposites bearing negative and positive zeta potentials, wasinvestigated (Figure 3). Zeta potentials of QPVP 0 M-, QPVP0.01 M-, and QPVP 1 M-MMT are highly positive (40−45mV) therefore composites with QPVP loadings lower than thatof QPVP 0 M-MMT (1.1 mmol QPVP/g clay) were studied.Charge neutralization was reached at 0.23 mmol QPVP/g clay,roughly 30% of the cation exchange capacity, due toelectrostatic screening of the clay surface (−40 mV) byQPVP (+54 mV).EfOM removal increased moderately with QPVP loading,
from 45 to 49%, which also correlated with less negative valuesof zeta potential (Figure 3a). EfOM adsorption by positivelycharged composites further increased to 65%. Upon EfOMadsorption, zeta potential of the composites decreased due toEfOM adsorption and due to electrostatic screening induced bythe high electrolyte concentration of the effluent (EC = 1.5 dS/
Figure 2. Characterization of QPVP-MMT composites prepared under different IS. (a) FTIR spectra (b) XRD diffractograms and (c) DTG analysisprofiles.
Figure 3. Removal of (a) EfOM (12.2 mg/L DOC) and (b) HA (3 mg/L DOC) by QPVP-MMT composites as a function of QPVP loading andcomposite zeta potential.
Environmental Science & Technology Article
DOI: 10.1021/acs.est.6b02167Environ. Sci. Technol. 2016, 50, 8246−8254
8250
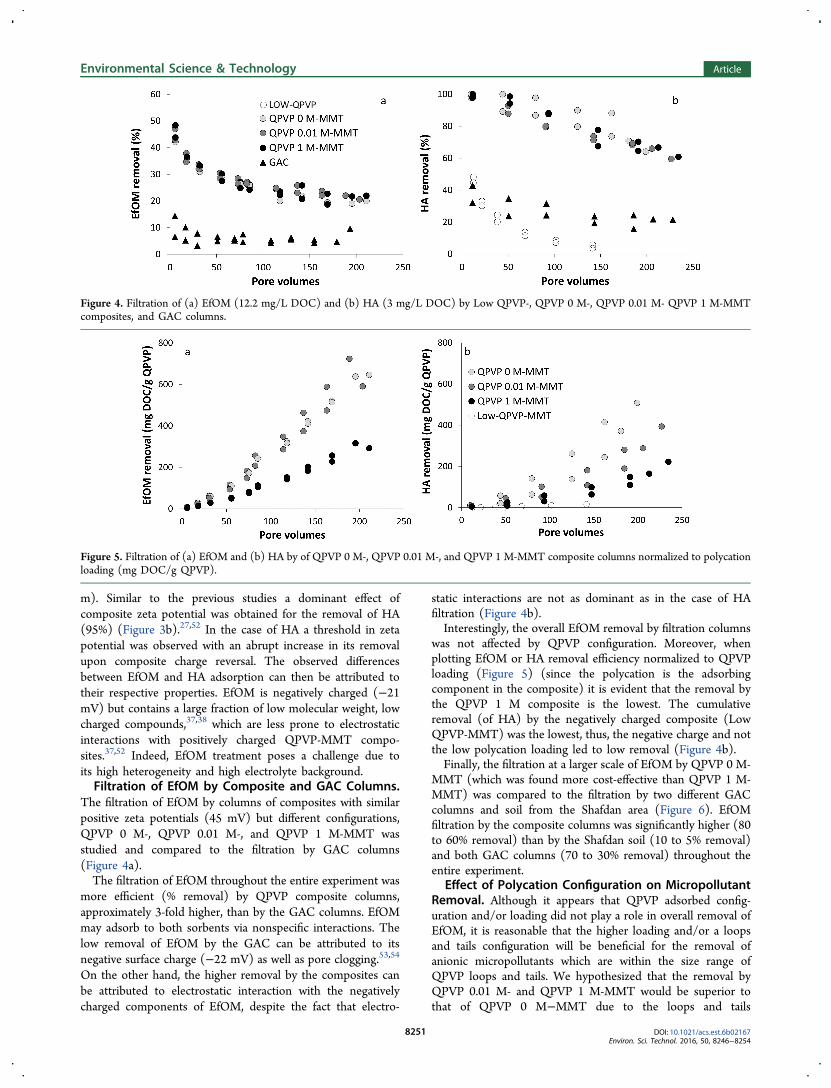
m). Similar to the previous studies a dominant effect ofcomposite zeta potential was obtained for the removal of HA(95%) (Figure 3b).27,52 In the case of HA a threshold in zetapotential was observed with an abrupt increase in its removalupon composite charge reversal. The observed differencesbetween EfOM and HA adsorption can then be attributed totheir respective properties. EfOM is negatively charged (−21mV) but contains a large fraction of low molecular weight, lowcharged compounds,37,38 which are less prone to electrostaticinteractions with positively charged QPVP-MMT compo-sites.37,52 Indeed, EfOM treatment poses a challenge due toits high heterogeneity and high electrolyte background.Filtration of EfOM by Composite and GAC Columns.
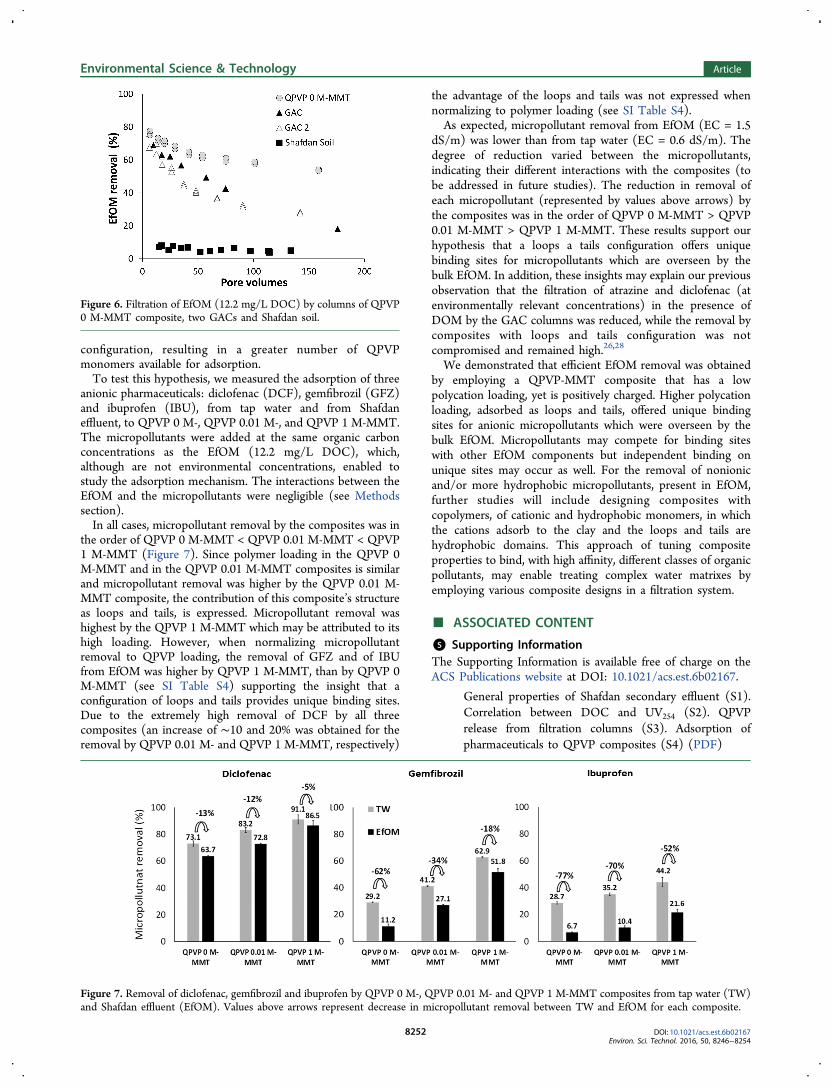
The filtration of EfOM by columns of composites with similarpositive zeta potentials (45 mV) but different configurations,QPVP 0 M-, QPVP 0.01 M-, and QPVP 1 M-MMT wasstudied and compared to the filtration by GAC columns(Figure 4a).The filtration of EfOM throughout the entire experiment was
more efficient (% removal) by QPVP composite columns,approximately 3-fold higher, than by the GAC columns. EfOMmay adsorb to both sorbents via nonspecific interactions. Thelow removal of EfOM by the GAC can be attributed to itsnegative surface charge (−22 mV) as well as pore clogging.53,54
On the other hand, the higher removal by the composites canbe attributed to electrostatic interaction with the negativelycharged components of EfOM, despite the fact that electro-
static interactions are not as dominant as in the case of HAfiltration (Figure 4b).Interestingly, the overall EfOM removal by filtration columns
was not affected by QPVP configuration. Moreover, whenplotting EfOM or HA removal efficiency normalized to QPVPloading (Figure 5) (since the polycation is the adsorbingcomponent in the composite) it is evident that the removal bythe QPVP 1 M composite is the lowest. The cumulativeremoval (of HA) by the negatively charged composite (LowQPVP-MMT) was the lowest, thus, the negative charge and notthe low polycation loading led to low removal (Figure 4b).Finally, the filtration at a larger scale of EfOM by QPVP 0 M-
MMT (which was found more cost-effective than QPVP 1 M-MMT) was compared to the filtration by two different GACcolumns and soil from the Shafdan area (Figure 6). EfOMfiltration by the composite columns was significantly higher (80to 60% removal) than by the Shafdan soil (10 to 5% removal)and both GAC columns (70 to 30% removal) throughout theentire experiment.
Effect of Polycation Configuration on MicropollutantRemoval. Although it appears that QPVP adsorbed config-uration and/or loading did not play a role in overall removal ofEfOM, it is reasonable that the higher loading and/or a loopsand tails configuration will be beneficial for the removal ofanionic micropollutants which are within the size range ofQPVP loops and tails. We hypothesized that the removal byQPVP 0.01 M- and QPVP 1 M-MMT would be superior tothat of QPVP 0 M−MMT due to the loops and tails
Figure 4. Filtration of (a) EfOM (12.2 mg/L DOC) and (b) HA (3 mg/L DOC) by Low QPVP-, QPVP 0 M-, QPVP 0.01 M- QPVP 1 M-MMTcomposites, and GAC columns.
Figure 5. Filtration of (a) EfOM and (b) HA by of QPVP 0 M-, QPVP 0.01 M-, and QPVP 1 M-MMT composite columns normalized to polycationloading (mg DOC/g QPVP).
Environmental Science & Technology Article
DOI: 10.1021/acs.est.6b02167Environ. Sci. Technol. 2016, 50, 8246−8254
8251
configuration, resulting in a greater number of QPVPmonomers available for adsorption.To test this hypothesis, we measured the adsorption of three
anionic pharmaceuticals: diclofenac (DCF), gemfibrozil (GFZ)and ibuprofen (IBU), from tap water and from Shafdaneffluent, to QPVP 0 M-, QPVP 0.01 M-, and QPVP 1 M-MMT.The micropollutants were added at the same organic carbonconcentrations as the EfOM (12.2 mg/L DOC), which,although are not environmental concentrations, enabled tostudy the adsorption mechanism. The interactions between theEfOM and the micropollutants were negligible (see Methodssection).In all cases, micropollutant removal by the composites was in
the order of QPVP 0 M-MMT < QPVP 0.01 M-MMT < QPVP1 M-MMT (Figure 7). Since polymer loading in the QPVP 0M-MMT and in the QPVP 0.01 M-MMT composites is similarand micropollutant removal was higher by the QPVP 0.01 M-MMT composite, the contribution of this composite’s structureas loops and tails, is expressed. Micropollutant removal washighest by the QPVP 1 M-MMT which may be attributed to itshigh loading. However, when normalizing micropollutantremoval to QPVP loading, the removal of GFZ and of IBUfrom EfOM was higher by QPVP 1 M-MMT, than by QPVP 0M-MMT (see SI Table S4) supporting the insight that aconfiguration of loops and tails provides unique binding sites.Due to the extremely high removal of DCF by all threecomposites (an increase of ∼10 and 20% was obtained for theremoval by QPVP 0.01 M- and QPVP 1 M-MMT, respectively)
the advantage of the loops and tails was not expressed whennormalizing to polymer loading (see SI Table S4).As expected, micropollutant removal from EfOM (EC = 1.5
dS/m) was lower than from tap water (EC = 0.6 dS/m). Thedegree of reduction varied between the micropollutants,indicating their different interactions with the composites (tobe addressed in future studies). The reduction in removal ofeach micropollutant (represented by values above arrows) bythe composites was in the order of QPVP 0 M-MMT > QPVP0.01 M-MMT > QPVP 1 M-MMT. These results support ourhypothesis that a loops a tails configuration offers uniquebinding sites for micropollutants which are overseen by thebulk EfOM. In addition, these insights may explain our previousobservation that the filtration of atrazine and diclofenac (atenvironmentally relevant concentrations) in the presence ofDOM by the GAC columns was reduced, while the removal bycomposites with loops and tails configuration was notcompromised and remained high.26,28
We demonstrated that efficient EfOM removal was obtainedby employing a QPVP-MMT composite that has a lowpolycation loading, yet is positively charged. Higher polycationloading, adsorbed as loops and tails, offered unique bindingsites for anionic micropollutants which were overseen by thebulk EfOM. Micropollutants may compete for binding siteswith other EfOM components but independent binding onunique sites may occur as well. For the removal of nonionicand/or more hydrophobic micropollutants, present in EfOM,further studies will include designing composites withcopolymers, of cationic and hydrophobic monomers, in whichthe cations adsorb to the clay and the loops and tails arehydrophobic domains. This approach of tuning compositeproperties to bind, with high affinity, different classes of organicpollutants, may enable treating complex water matrixes byemploying various composite designs in a filtration system.
■ ASSOCIATED CONTENT
*S Supporting InformationThe Supporting Information is available free of charge on theACS Publications website at DOI: 10.1021/acs.est.6b02167.
General properties of Shafdan secondary effluent (S1).Correlation between DOC and UV254 (S2). QPVPrelease from filtration columns (S3). Adsorption ofpharmaceuticals to QPVP composites (S4) (PDF)
Figure 6. Filtration of EfOM (12.2 mg/L DOC) by columns of QPVP0 M-MMT composite, two GACs and Shafdan soil.
Figure 7. Removal of diclofenac, gemfibrozil and ibuprofen by QPVP 0 M-, QPVP 0.01 M- and QPVP 1 M-MMT composites from tap water (TW)and Shafdan effluent (EfOM). Values above arrows represent decrease in micropollutant removal between TW and EfOM for each composite.
Environmental Science & Technology Article
DOI: 10.1021/acs.est.6b02167Environ. Sci. Technol. 2016, 50, 8246−8254
8252
■ AUTHOR INFORMATION
Corresponding Author*Phone: 972-8-948-9171; fax: 972-8-948-9856; e-mail: [email protected].
NotesThe authors declare no competing financial interest.
■ ACKNOWLEDGMENTS
This research was supported by the Israeli Ministry of Tradeand Industry, Kamin Project (grant 54914) by the IsraeliMinistry of Agriculture.
■ REFERENCES(1) Water Reuse: Potential for Expanding the Nation’s Water SupplyThrough Reuse of Municipal Wastewater; National Research Council:Washington D.C., 2012.(2) Drewes, J. E.; Quanrud, D. M.; Amy, G. L.; Westerhoff, P. K.;Sites, F. Character of organic matter in soil-aquifer treatment systems.J. Environ. Eng. 2006, 132, 1447−1458.(3) Amy, G.; Drewes, J. Soil aquifer treatment (SAT) as a natural andsustainable wastewater reclamation/reuse technology: Fate of waste-water effluent organic matter (EfOM) and trace organic compounds.Environ. Monit. Assess. 2007, 129, 19−26.(4) Shon, H. K.; Vigneswaran, S.; Snyder, S. A. Effluent organicmatter (EfOM) in wastewater: Constituents, effects, and treatment.Crit. Rev. Environ. Sci. Technol. 2006, 36, 327−374.(5) Lindqvist, N.; Tuhkanen, T.; Kronberg, L. Occurrence of acidicpharmaceuticals in raw and treated sewages and in receiving waters.Water Res. 2005, 39, 2219.(6) Schwarzenbach, R. P. The Challenge of Micropollutants inAquatic Systems. Science (Washington, DC, U. S.) 2006, 313, 1072−1077.(7) Icekson-Tal, N.; Avraham, O.; Sack, J.; Cikurel, H. Water reuse inIsrael − the Dan Region Project: evaluation of water quality andreliability of plant’s operation. Water Supply 2003, 3, 231−237.(8) Lin, C.; Eshel, G.; Negev, I.; Banin, A. Long-term accumulationand material balance of organic matter in the soil of an effluentinfiltration basin. Geoderma 2008, 148, 35−42.(9) Lin, C.; Eshel, G.; Negev, I.; Banin, A. Long-term accumulationand material balance of organic matter in the soil of an effluentinfiltration basin. Geoderma 2008, 148, 35−42.(10) Nadav, I.; Arye, G.; Tarchitzky, J.; Chen, Y. Enhancedinfiltration regime for treated-wastewater purification in soil aquifertreatment (SAT). J. Hydrol. 2012, 420−421, 275−283.(11) Arye, G.; Tarchitzky, J.; Chen, Y. Treated wastewater effects onwater repellency and soil hydraulic properties of soil aquifer treatmentinfiltration basins. J. Hydrol. 2011, 397, 136−145.(12) Oren, O.; Gavrieli, I.; Burg, A.; Guttman, J.; Lazar, B.Manganese mobilization and enrichment during soil aquifer treatment(SAT) of effluents, the Dan Region Sewage Reclamation Project(Shafdan), Israel. Environ. Sci. Technol. 2007, 41, 766−772.(13) Rosario-Ortiz, F. L.; Mezyk, S. P.; Doud, D. F. R.; Snyder, S. A.Quantitative correlation of absolute hydroxyl radical rate constantswith non-isolated effluent organic matter bulk properties in water.Environ. Sci. Technol. 2008, 42, 5924−5930.(14) Jarusutthirak, C.; Amy, G.; Croue,́ J. P. Fouling characteristics ofwastewater effluent organic matter (EfOM) isolates on NF and UFmembranes. Desalination 2002, 145, 247−255.(15) Zheng, X.; Khan, M. T.; Croue, J. Contribution of effluentorganic matter (EfOM) to ultrafiltration (UF) membrane fouling:Isolation, characterization, and fouling effect of EfOM fractions. WaterRes. 2014, 65, 414−424.(16) Kim, H. C.; Dempsey, B. a. Comparison of two fractionationstrategies for characterization of wastewater effluent organic matterand diagnosis of membrane fouling. Water Res. 2012, 46, 3714−3722.
(17) Krasner, S. W.; Westerhoff, P.; Chen, B.; Rittmann, B. E.; Amy,G. Occurrence of disinfection byproducts in United States wastewatertreatment plant effluents. Environ. Sci. Technol. 2009, 43, 8320−8325.(18) Zhang, H.; Qu, J.; Liu, H.; Zhao, X. Characterization of isolatedfractions of dissolved organic matter from sewage treatment plant andthe related disinfection by-products formation potential. J. Hazard.Mater. 2009, 164, 1433−1438.(19) Vigneswaran, S.; Shon, H. K.; Kandasamy, J.; Shim, W. G.Performance of granular activated carbon (GAC) adsorption andbiofiltration in the treatment of biologically treated sewage effluent.Sep. Sci. Technol. 2007, 42, 3101−3116.(20) Qian, F.; Sun, X.; Liu, Y.; Xu, H. Removal and transformation ofeffluent organic matter (EfOM) in biotreated textile wastewater byGAC/O3 pre-oxidation and enhanced coagulation. Environ. Technol.2012, 34, 1513−1520.(21) Wei, L. L.; Zhao, Q. L.; Xue, S.; Chang, C. C.; Tang, F.; Liang,G. L.; Jia, T. Reduction of trihalomethane precursors of dissolvedorganic matter in the secondary effluent by advanced treatmentprocesses. J. Hazard. Mater. 2009, 169, 1012−1021.(22) Shon, H. K.; Vigneswaran, S.; Kim, I. S.; Cho, J.; Ngo, H. H.The effect of pretreatment to ultrafiltration of biologically treatedsewage effluent: a detailed effluent organic matter (EfOM) character-ization. Water Res. 2004, 38, 1933−1939.(23) Beall, G. The use of organo-clays in water treatment. Appl. ClaySci. 2003, 24, 11−20.(24) Unuabonah, E. I.; Taubert, A. Clay−polymer nanocomposites(CPNs): Adsorbents of the future for water treatment. Appl. Clay Sci.2014, 99, 83−92.(25) Ruiz-Hitzky, E.; Aranda, P.; Darder, M.; Rytwo, G. Hybridmaterials based on clays for environmental and biomedicalapplications. J. Mater. Chem. 2010, 20, 9306.(26) Zadaka, D.; Nir, S. Radian, A.; Mishael, Y. G. Atrazine removalfrom water by polycation-clay composites: effect of dissolved organicmatter and comparison to activated carbon. Water Res. 2009, 43, 677−683.(27) Radian, A.; Mishael, Y. Effect of humic acid on pyrene removalfrom water by polycation-clay mineral composites and activatedcarbon. Environ. Sci. Technol. 2012, 46, 6228−6235.(28) Kohay, H.; Izbitski, A.; Mishael, Y. G. Developing Polycation-Clay Sorbents for Efficient Filtration of Diclofenac: Effect of DissolvedOrganic Matter and Comparison to Activated Carbon. Environ. Sci.Technol. 2015, 49, 9280−9288.(29) Yu, Z.; Peldszus, S.; Huck, P. M. Adsorption of selectedpharmaceuticals and an endocrine disrupting compound by granularactivated carbon. 1. Adsorption capacity and kinetics. Environ. Sci.Technol. 2009, 43, 1467−1473.(30) Corwin, C. J.; Summers, R. S. Scaling trace organic contaminantadsorption capacity by granular activated carbon. Environ. Sci. Technol.2010, 44, 5403−5408.(31) Mishael, Y. G.; Dubin, P. L. Uptake of organic pollutants bysilica-polycation-immobilized micelles for groundwater remediation.Environ. Sci. Technol. 2005, 39, 8475−8480.(32) Dobrynin, A. V.; Rubinstein, M. Effect of short-rangeinteractions on polyelectrolyte adsorption at charged surfaces. J.Phys. Chem. B 2003, 107, 8260−8269.(33) Xie, F.; Nylander, T.; Piculell, L.; Utsel, S.; Wag̊berg, L.;Åkesson, T.; Forsman, J. Polyelectrolyte adsorption on solid surfaces:theoretical predictions and experimental measurements. Langmuir2013, 29, 12421−12431.(34) Van de Steeg, H. G. M.; Cohen Stuart, M. a.; De Keizer, A.;Bijsterbosch, B. H. Polyelectrolyte adsorption: a subtle balance offorces. Langmuir 1992, 8, 2538−2546.(35) Kam, S. K.; Gregory, J. The interaction of humic substances withcationic polyelectrolytes. Water Res. 2001, 35, 3557−3566.(36) Standard Methods for the Examination of Water and Wastewater,19th ed.; Eaton, A. D., Clesceri, L. S., G, A., Ed.; American PublicHealth Association: Washington D.C., 1995.
Environmental Science & Technology Article
DOI: 10.1021/acs.est.6b02167Environ. Sci. Technol. 2016, 50, 8246−8254
8253
(37) Kim, H. C.; Dempsey, B. A. Membrane fouling due to alginate,SMP, EfOM, humic acid, and NOM. J. Membr. Sci. 2013, 428, 190−197.(38) Goren, U.; Aharoni, A.; Kummel, M.; Messalem, R.; Mukmenev,I.; Brenner, A.; Gitis, V. Role of membrane pore size in tertiaryflocculation/adsorption/ultrafiltration treatment of municipal waste-water. Sep. Purif. Technol. 2008, 61, 193−203.(39) Sukhishvili, S. A.; Granick, S. Polyelectrolyte adsorption onto aninitially-bare solid surface of opposite electrical charge. J. Chem. Phys.1998, 109, 6861.(40) Liufu, S. C.; Xiao, H. N.; Li, Y. P. Adsorption of cationicpolyelectrolyte at the solid/liquid interface and dispersion of nanosizedsilica in water. J. Colloid Interface Sci. 2005, 285, 33−40.(41) Durand, G.; Lafuma, F.; Audebert, R. Adsorption of cationicpolyelectrolytes at clay-colloid interface in dilute aqueous suspensions effect of the ionic strength of the medium. In Trends in Colloid andInterface Science II SE- 47; Degiorgio, V., Ed.; Progress in Colloid &Polymer Science; Steinkopff, 1988; Vol. 76, pp 278−282.(42) Smith, P.; Eisenberg, A. Infrared spectroscopic study of blendsof poly (styrene-co-styrenesulfonic acid) with poly (styrene-co-(4-vinylpyridine)). Macromolecules 1994, 27, 545−552.(43) Khaligh, N. G.; Shirini, F. Preparation, characterization and useof poly(4-vinylpyridinium) hydrogen sulfate salt as an eco-benign,efficient and reusable solid acid catalyst for the chemoselective 1,1-diacetate protection and deprotection of aldehydes. J. Mol. Catal. A:Chem. 2011, 348, 20−29.(44) Fournaris, K. G.; Karakassides, M. A.; Petridis, D.;Yiannakopoulou, K. Clay-polyvinylpyridine nanocomposites. Chem.Mater. 1999, 11, 2372−2381.(45) Guggenheim, S.; Groos, A. F. K. van. Baseline studies of the clayminerals society of source clay minerals: Thermal analysis. Clays ClayMiner. 2001, 49, 433−443.(46) Marra, J.; Hair, M. L. Forces between two poly (2-vinylpyridine)-covered surfaces as a function of ionic strength andpolymer charge. J. Phys. Chem. 1988, 92, 6044−6051.(47) Seyrek, E.; Hierrezuelo, J.; Sadeghpour, A.; Szilagyi, I.;Borkovec, M. Molecular mass dependence of adsorbed amount andhydrodynamic thickness of polyelectrolyte layers. Phys. Chem. Chem.Phys. 2011, 13, 12716−12719.(48) Hierrezuelo, J.; Szilagyi, I.; Vaccaro, A.; Borkovec, M. Probingnanometer-thick polyelectrolyte layers adsorbed on oppositely chargedparticles by dynamic light scattering. Macromolecules 2010, 43, 9108−9116.(49) Nelson, A.; Jack, K. S.; Cosgrove, T.; Kozak, D. NMR solventrelaxation in studies of multicomponent polymer adsorption. Langmuir2002, 18, 2750−2755.(50) Shafir, A.; Andelman, D.; Netz, R. Adsorption and depletion ofpolyelectrolytes from charged surfaces. J. Chem. Phys. 2003, 19, 2355−2362.(51) Beltran, S.; Harvey, H. H.; Prausnitz, J. M. Monte Carlo study ofpolyelectrolyte adsorption. Isolated chains on a planar charged surface.Macromolecules 1991, 24, 3178−3184.(52) Zhang, X.; Bai, R. Mechanisms and kinetics of humic acidadsorption onto chitosan-coated granules. J. Colloid Interface Sci. 2003,264, 30−38.(53) Quinlivan, P. A.; Li, L.; Knappe, D. R. U. Effects of activatedcarbon characteristics on the simultaneous adsorption of aqueousorganic micropollutants and natural organic matter. Water Res. 2005,39, 1663−1673.(54) Pelekani, C.; Snoeyink, V. L. Competitive adsorption betweenatrazine and methylene blue on activated carbon: the importance ofpore size distribution. Carbon 2000, 38, 1423−1436.
Environmental Science & Technology Article
DOI: 10.1021/acs.est.6b02167Environ. Sci. Technol. 2016, 50, 8246−8254
8254