Embed Size (px)
Citation preview
EIA Report
For The Proposed Capacity Enhancement by Increasing Pulp Production from 62,000 BD TPA to 90,000 BD TPA by upgrading the existing pulp mill without increasing the permitted paper production capacity
of 1,00,000 TPA by M/s Orient Paper and Industries Ltd at Amlai, Dist. Shahdol,
Madhya Pradesh
Project Proponent
M/s Orient Paper Mills Prop: Orient Paper & Industries Limited,
Amlai,PO Amlai Paper Mills, Dist. Shahdol, Madhya Pradesh, Pin – 484117
EIA Consultant
Cholamandalam MS Risk Services Limited
An ISO 9001:2008 Certified Organization Parry House, 3rd Floor, No: 2, NSC Bose Road
Parry’s, Chennai
November 2018
EIA for the Proposed Capacity Enhancement by Increasing Pulp Production from 62,000 BD TPA to 90,000 BD TPA by upgrading the existing pulp mill without increasing the permitted paper production capacity of 1,00,000 TPA
Project No: PJ-ENVIR-2018419-1689 Dated: November 2018
Declaration
Page 2
This EIA report has been prepared by “Cholamandalam MS Risk Services
Limited (CMSRSL), in line with EIA Notification, dated 14th September 2006,
seeking prior Environmental Clearance from the Ministry of Environment,
Forests and Climate Change, New Delhi.
This work has been undertaken in accordance with ISO 9001:2008 Quality
Management System with all reasonable skill, care and diligence within the
terms of the contract with the client, incorporating our General Terms &
Conditions of Business and taking account of the resources devoted to it by
agreement with the client.
We disclaim any responsibility to the client and others in respect of any matters
outside the scope of the above.
Further, this report is confidential to the client and the use of this report by
unauthorized third parties without written authorization from CMSRSL shall
be at their own risk.
For and on behalf of Cholamandalam MS Risk Services Limited
Approved by : N.V.Subba Rao
Sign :
Designation : Chief Executive
Date : 10th November 2018
DECLARATION BY EIA CONSULTANT
EIA for the Proposed Capacity Enhancement by Increasing Pulp Production from 62,000 BD TPA to 90,000 BD TPA by upgrading the existing pulp mill without increasing the permitted paper production capacity of 1,00,000 TPA
Project No: PJ-ENVIR-2018419-1689 Dated: November 2018
Declaration
Page 3
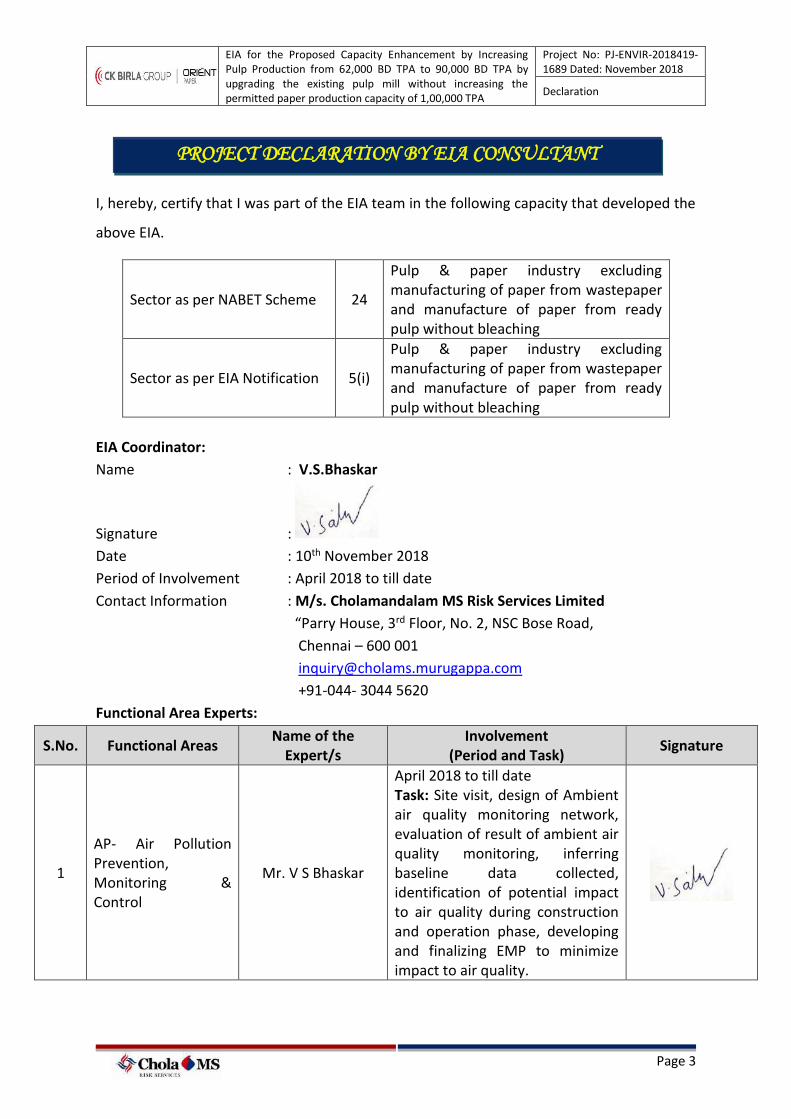
I, hereby, certify that I was part of the EIA team in the following capacity that developed the
above EIA.
Sector as per NABET Scheme 24
Pulp & paper industry excluding manufacturing of paper from wastepaper and manufacture of paper from ready pulp without bleaching
Sector as per EIA Notification 5(i)
Pulp & paper industry excluding manufacturing of paper from wastepaper and manufacture of paper from ready pulp without bleaching
EIA Coordinator:
Name : V.S.Bhaskar
Signature :
Date : 10th November 2018
Period of Involvement : April 2018 to till date
Contact Information : M/s. Cholamandalam MS Risk Services Limited
“Parry House, 3rd Floor, No. 2, NSC Bose Road,
Chennai – 600 001
+91-044- 3044 5620
Functional Area Experts:
S.No. Functional Areas Name of the
Expert/s Involvement
(Period and Task) Signature
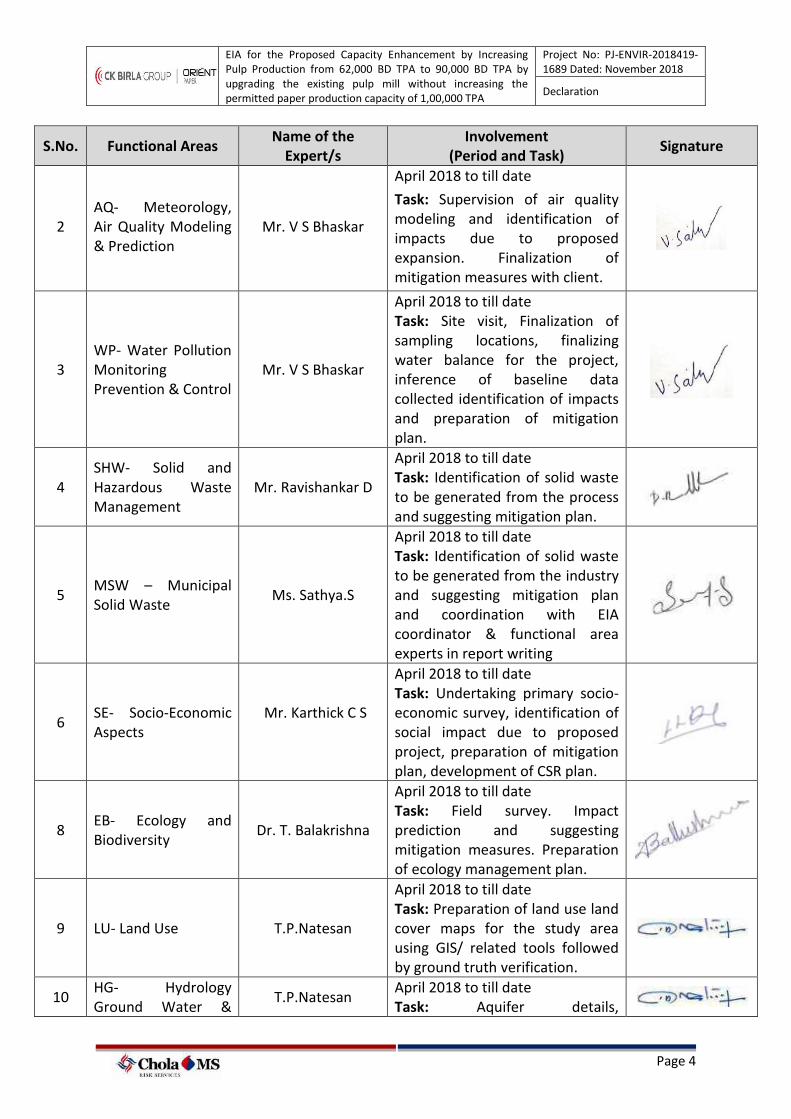
1
AP- Air Pollution Prevention, Monitoring & Control
Mr. V S Bhaskar
April 2018 to till date Task: Site visit, design of Ambient air quality monitoring network, evaluation of result of ambient air quality monitoring, inferring baseline data collected, identification of potential impact to air quality during construction and operation phase, developing and finalizing EMP to minimize impact to air quality.
PROJECT DECLARATION BY EIA CONSULTANT
ORGANIZATION
EIA for the Proposed Capacity Enhancement by Increasing Pulp Production from 62,000 BD TPA to 90,000 BD TPA by upgrading the existing pulp mill without increasing the permitted paper production capacity of 1,00,000 TPA
Project No: PJ-ENVIR-2018419-1689 Dated: November 2018
Declaration
Page 4
S.No. Functional Areas Name of the
Expert/s Involvement
(Period and Task) Signature
2 AQ- Meteorology, Air Quality Modeling & Prediction
Mr. V S Bhaskar
April 2018 to till date
Task: Supervision of air quality modeling and identification of impacts due to proposed expansion. Finalization of mitigation measures with client.
3 WP- Water Pollution Monitoring Prevention & Control
Mr. V S Bhaskar
April 2018 to till date Task: Site visit, Finalization of sampling locations, finalizing water balance for the project, inference of baseline data collected identification of impacts and preparation of mitigation plan.
4 SHW- Solid and Hazardous Waste Management
Mr. Ravishankar D
April 2018 to till date Task: Identification of solid waste to be generated from the process and suggesting mitigation plan.
5 MSW – Municipal Solid Waste
Ms. Sathya.S
April 2018 to till date Task: Identification of solid waste to be generated from the industry and suggesting mitigation plan and coordination with EIA coordinator & functional area experts in report writing
6 SE- Socio-Economic Aspects
Mr. Karthick C S
April 2018 to till date Task: Undertaking primary socio-economic survey, identification of social impact due to proposed project, preparation of mitigation plan, development of CSR plan.
8 EB- Ecology and Biodiversity
Dr. T. Balakrishna
April 2018 to till date Task: Field survey. Impact prediction and suggesting mitigation measures. Preparation of ecology management plan.
9 LU- Land Use T.P.Natesan
April 2018 to till date Task: Preparation of land use land cover maps for the study area using GIS/ related tools followed by ground truth verification.
10 HG- Hydrology Ground Water &
T.P.Natesan April 2018 to till date Task: Aquifer details,
EIA for the Proposed Capacity Enhancement by Increasing Pulp Production from 62,000 BD TPA to 90,000 BD TPA by upgrading the existing pulp mill without increasing the permitted paper production capacity of 1,00,000 TPA
Project No: PJ-ENVIR-2018419-1689 Dated: November 2018
Declaration
Page 5
S.No. Functional Areas Name of the
Expert/s Involvement
(Period and Task) Signature
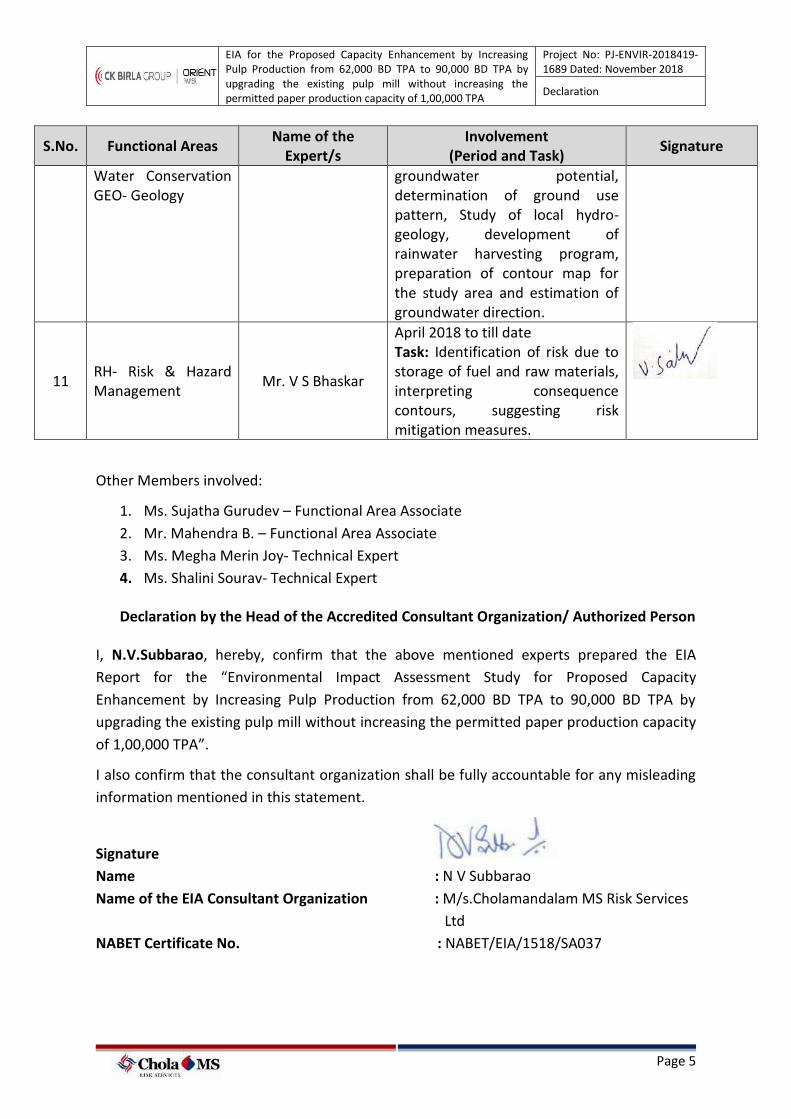
Water Conservation GEO- Geology
groundwater potential, determination of ground use pattern, Study of local hydro-geology, development of rainwater harvesting program, preparation of contour map for the study area and estimation of groundwater direction.
11 RH- Risk & Hazard Management
Mr. V S Bhaskar
April 2018 to till date Task: Identification of risk due to storage of fuel and raw materials, interpreting consequence contours, suggesting risk mitigation measures.
Other Members involved:
1. Ms. Sujatha Gurudev – Functional Area Associate
2. Mr. Mahendra B. – Functional Area Associate
3. Ms. Megha Merin Joy- Technical Expert
4. Ms. Shalini Sourav- Technical Expert
Declaration by the Head of the Accredited Consultant Organization/ Authorized Person
I, N.V.Subbarao, hereby, confirm that the above mentioned experts prepared the EIA
Report for the “Environmental Impact Assessment Study for Proposed Capacity
Enhancement by Increasing Pulp Production from 62,000 BD TPA to 90,000 BD TPA by
upgrading the existing pulp mill without increasing the permitted paper production capacity
of 1,00,000 TPA”.
I also confirm that the consultant organization shall be fully accountable for any misleading
information mentioned in this statement.
Signature
Name : N V Subbarao
Name of the EIA Consultant Organization : M/s.Cholamandalam MS Risk Services
Ltd
NABET Certificate No. : NABET/EIA/1518/SA037
EIA for the Proposed Capacity Enhancement by Increasing Pulp Production from 62,000 BD TPA to 90,000 BD TPA by upgrading the existing pulp mill without increasing the permitted paper production capacity of 1,00,000 TPA
Project No: PJ-ENVIR-2018419-1689 Dated: November 2018
Executive Summary
Page 6
Executive Summary
1. INTRODUCTION
The Orient Paper & Industries Limited (OPIL) operates an integrated pulp & paper mill on
the west bank of the River Sone at Village Amlai in Shahdol District in Madhya Pradesh
which was installed in the year 1965. The company produces a wide range of writing,
printing, and Tissue papers.
The proposed project falls under category “A” under sector 5(i) of the EIA notification 2006.
Since the existing mill site does not fall under any notified industrial area, public
consultation was conducted on 23/10/2018 as per the Environmental Impact Assessment
(EIA) Notification 2006. The EIA study was undertaken by M/s Cholamandalam MS Risk
Services Limited, a NABET accredited EIA consultant organization in conformity with the
guidelines of Ministry of Environment, Forests and Climate Change (MoEF&CC), covering all
the aspects of the conditions mentioned in the Terms of Reference issued by MoEF &CC File
no. J-11011/1142/2007-IA-II(I), dated, 17th April 2018.
1.1 Proposed Project
Although the unit has the capacity to produce 275 BD TPD of pulp with all the required
pulping system, the production is limited to 62,000 BD TPA (182 BD TPD) based on the EC
granted by MOEF dated 17th Oct’16. In view of upgrading existing pulp mill by addition of
balancing equipment and by adopting Elemental Chlorine Free (ECF) bleaching operations
and also due to availability of adequate installed capacity of pulping system along with
utilities such as water, power and raw materials, the management of Orient Paper Mills
(OPM) has proposed to enhance the in-house pulp production throughput to 90,000 BD TPA
(265 BD TPD) without increasing the total consented paper production capacity of 1,00,000
TPA (303 TPD). Enhanced in-house pulp production will help to reduce the foreign exchange
outgo on account of reduction in quantity of Imported Pulp.
The salient features of the proposed project are listed as follows;
• No increase in the total consented paper production of 1,00,000 TPA
• The existing wood chipper and pulp mill have adequate capacities to produce
90,000 BD TPA and hence no additional units will be installed (except for addition

EIA for the Proposed Capacity Enhancement by Increasing Pulp Production from 62,000 BD TPA to 90,000 BD TPA by upgrading the existing pulp mill without increasing the permitted paper production capacity of 1,00,000 TPA
Project No: PJ-ENVIR-2018419-1689 Dated: November 2018
Executive Summary
Page 7
of balancing equipment and adopting Elemental Chlorine Free (ECF) bleaching
operations)
• No additional land is required as the proposed project includes only up-gradation
of existing pulp mill and enhancement of the production of in-house pulp.
• Upgradation of the existing pulp mill by replacing the existing chlorine based
bleaching technology with Elemental Chlorine Free (ECF) Bleaching which is
environmental friendly technology.
• No increase in freshwater consumption during the post project scenario due to
increase in recycling options and also upgrading the pulp mill to ECF technology
thereby reducing the specific water consumption per tonne of paper production.
No increase in coal consumption as the additional steam requirement for the increase in
pulp production will be met by firing additional Black Liquor solids in chemical recovery
boiler. Hence retrofitting of chemical recovery boiler with ESP (Electrostatic Precipitator)
upgradation is proposed.
2. Existing Environmental Compliance
The existing facility is currently permitted and consented to produce 1,00,000 TPA (~303
TPD) of writing paper and specialty tissue paper (45,000 TPA of writing/printing paper
machine and 55,000 TPA of tissue paper machines). The facility is granted Consent to
Operate from MPPCB vide their Consent No. AW-48319 dated 14.05.2018, valid up to
30.04.2019 under Water (Prevention and Control of Pollution) Act 1974 and Air (Prevention
and Control of Pollution) Act 1981 as amended. OPM is regularly submitting the compliance
report to Regional Office, MoEF&CC, and has obtained certified compliance report of EC
2016 by Regional Office, MoEF&CC- Bhopal vide letter No 5-210/2008(ENV)/1259 dated
23.03.2018.
The existing plant mill is having a total land of 1479 acres. Out of which the total
greenbelt/plantation area is 633 acres. The existing facility consists of two stoker fired
boiler, a CFBC boiler, an AFBC boiler and a recovery boiler that are catering to the steam
requirements of the process, main plant and power generation needs. Necessary permits
and consent to operate exist for the installed capacities of all the boilers. All the existing
four boilers are provided with dedicated electrostatic precipitators and continuous
EIA for the Proposed Capacity Enhancement by Increasing Pulp Production from 62,000 BD TPA to 90,000 BD TPA by upgrading the existing pulp mill without increasing the permitted paper production capacity of 1,00,000 TPA
Project No: PJ-ENVIR-2018419-1689 Dated: November 2018
Executive Summary
Page 8
emissions monitoring systems are being installed on all the stacks. Entire fly ash is disposed
to cement manufacturing units. In order to control the fugitive emissions from the coal
storage yards, water sprinkling systems are in place. Precipitated Calcium Carbonate (PCC)
plant has been installed at site that utilizes CO2 gas from Lime kiln flue gas which is then
used as filler in paper manufacturing.
The facility is permitted to draw about 36,000 m3/day of water from the Sone River, which
is flowing at about 3 to 5 km from the plant. The total fresh water demand in the existing
facility is about 20,250 m3/day as against the consented level of 22,150 m3/day. Significant
quantities of water are being reused within the paper machine for stock preparation.
Coloured effluents are segregated from the non-coloured effluents in the pulp mill and
bleach section for effective treatment. The coloured effluents are being treated in a
dedicated ETP of installed capacity 20,500 m3/day as against the current wastewater flow
of 10,800 m3/day. The quality of the treated wastewater as per the MPPCB (Madhya
Pradesh Pollution Control Board) test reports and external laboratory indicates that the
values are well within the permissible range as prescribed by MPPCB. Treated wastewater
for land irrigation application is carried out through HRTS (High Rate Transpiration System)
design developed by NEERI, Nagpur. The total land available for utilizing treated
wastewater for irrigation is about 633 acres including greenbelt and plantation. There are
sixteen piezometric points installed to monitor ground water quality on monthly basis. No
treated wastewater is being discharged to River Sone.
Wood saw dust is being used in the boiler as fuel. Fly ash generated is being used in cement
industry. The sludge from the primary clarifier of the ETP is sent for board manufacturing.
OPM has obtained valid hazardous waste authorization letter from MPPCB.
3. Details of the Proposed Project
OPM is proposing to increase pulp production level from current consented level of 62,000
BD TPA (182 BD TPD) to 90,000 BD TPA (265 BD TPD) by upgrading the existing pulp mill
with installation of balancing equipment and adoption of ECF technology. The overview of
the proposed project capacities are presented in Table 1.
EIA for the Proposed Capacity Enhancement by Increasing Pulp Production from 62,000 BD TPA to 90,000 BD TPA by upgrading the existing pulp mill without increasing the permitted paper production capacity of 1,00,000 TPA
Project No: PJ-ENVIR-2018419-1689 Dated: November 2018
Executive Summary
Page 9
Table.1 Overview of the Plant Capacities during Post Project Scenario
SL No
. Description Units
Existing Installe
d Capacity
Existing Permitte
d Capacity
Post Project Scenari
o
Remarks
1 Products
1.1
Paper (Writing, printing and color)
Tpa 45,000 45,000 45,000 No change
1.2 Tissue Paper Tpa 55,000 55,000 55,000 No change
1.3 Total Paper Production
Tpa 1,00,000 1,00,000 1,00,00
0 No change
2 Pulp Mill
2.1 In house Pulp Mill
BD tpa 93,500 62,000 90,000
The existing chlorine based bleaching technology will be replaced with ECF bleaching.
Upgradation/Augmentation of Black liquor Evaporation capacity
3 Steam Generation
3.1 Stoker fired boilers
TPH 2x90 2x90 2x90 No Change
3.2 CFBC boiler TPH 1x100 1x100 1x100 No Change
3.3 AFBC boiler TPH 1x150 1x150 1x150 No Change
3.4 Recovery Boiler steam generation
TPH 70 60 70 Retrofitting the existing recovery boiler to meet the additional solids firing and to produce desired additional steam 3.5
Total Steam Generation
TPH 500 490 500
4 Captive Power Generation
4.1 TG#1 MW 30 30 30 No Change
4.2 TG#2 MW 25 25 25 No Change
4.3 Total Captive Power Plant
MW 55 55 55 No Change
EIA for the Proposed Capacity Enhancement by Increasing Pulp Production from 62,000 BD TPA to 90,000 BD TPA by upgrading the existing pulp mill without increasing the permitted paper production capacity of 1,00,000 TPA
Project No: PJ-ENVIR-2018419-1689 Dated: November 2018
Executive Summary
Page 10
SL No
. Description Units
Existing Installe
d Capacity
Existing Permitte
d Capacity
Post Project Scenari
o
Remarks
Capacity
5 Others
5.1 Producer Gas (PG) Plant
Nm³/hr
4645 4645 4645 No Change
5.2
Precipitated Calcium Carbonate (PCC) Plant (Slurry form)
Tpa 8000 8000 8000 No Change
5.3 Rotary Lime Kiln
Tpa 39,600 39,600 39,600 No Change
6 Water and Wastewater
6.1
Water Allocation for withdrawl from River
m3/day 36,000 36,000 36,000
The facility has obtained water allocation permission from Water Resource Department, Madhya Pradesh is 12.46 M.Cum/ annum (36000 m3/day).
6.2
Fresh water consumption for main plant
m3/day 20,250 22,150 17,225
Reduction due to increased recycling and adoption of ECF bleaching in pulp mill
6.3
Fresh water supply to nearby villages as part of CSR program
m3/day 5000 5000 5000 No change
6.4 Wastewater generation
m3/day 10,790 12,120 9265 Reduction due to reduced fresh water consumption
6.5
Wastewater Treatment Plant capacity
m3/day 20,500 20,500 20,500 Existing ETP is adequate
EIA for the Proposed Capacity Enhancement by Increasing Pulp Production from 62,000 BD TPA to 90,000 BD TPA by upgrading the existing pulp mill without increasing the permitted paper production capacity of 1,00,000 TPA
Project No: PJ-ENVIR-2018419-1689 Dated: November 2018
Executive Summary
Page 11
3.1. Project Requirements
Wood: The total wood requirement during the post project scenario is estimated as
2,40,000 TPA (705 TPD). Hence the additional 80,000 TPA of wood is required for the
proposed project which will be sourced as per existing practice from plantation area of OPM
and farm forestry program undertaken in 18 districts of Madhya Pradesh and Chhattisgarh.
The sourcing of imported pulp will reduce.
Chemicals: Although the requirement of digesting chemicals is increasing, due to the
adoption of Elemental Free Chlorine bleaching, there will be elimination of Chlorine usage &
Lime for Hypo while increase in Chlorine Dioxide by about 20 kg/T of pulp production.
Power: The power demand will increase by an order of 1 MW after proposed project, which
will be sourced from the existing captive power plant. Since the facility is already permitted
to generate 55MW power, no additional power generation units (boilers and steam
turbines) will be installed under the proposed scheme.
Steam: Total steam requirement for the proposed project will be in the order of 18 TPH.
Steam generated from the firing of additional black liquor solids in the Solids Recovery
boiler will meet the additional steam demand in the plant. The existing Recovery Boiler will
be retrofitted to fire additional black liquor solids generated from the pulp mill.
Fuel: Since the additional steam required is being met from firing the additional bio-mass
solids, no change is envisaged in the coal consumption in the existing plant.
Water: The total fresh water consumption in the existing facility is about 20,250 m3/day
whereas during the post project scenario the total fresh water consumption will be reduced
to 17,225 m3/day. Fresh water consumption for production of pulp and paper is about
11,250 m3/day and the same will be reduced to 9,725 m3/day in spite of increase in pulp
production during the post project scenario due to the adoption of ECF bleaching and
increased recycling options.
4. Summary of Baseline Monitoring Studies
EIA for the Proposed Capacity Enhancement by Increasing Pulp Production from 62,000 BD TPA to 90,000 BD TPA by upgrading the existing pulp mill without increasing the permitted paper production capacity of 1,00,000 TPA
Project No: PJ-ENVIR-2018419-1689 Dated: November 2018
Executive Summary
Page 12
The study area covers 10 km radius around the boundaries of the proposed project site. As a
part of EIA, and ToR File no. J-11011/1142/2007-IA-II(I), dated, 17th April 2018, the primary
baseline data monitoring was conducted in the study area covering three (3) months dated
(16th April 2018 and 17th July 2018) and secondary data was collected from Government
and Semi-Government organizations. The primary baseline data was generated by
M/s.Vardan Enviro Laboratory, Gurgaon an NABL/MoEF&CC approved Environmental
Testing Laboratory.
The proposed mill site lies within the coordinates 23o11’ N Latitude and 81o35’ E Longitude.
National Highway (NH-78, Katni to Ranchi) is passing adjacent of the project site running
between Burhar and Annupur. Nearest Amlai railway station is located close to the project
site in Southern side at about 1.8 km. The Study area exhibits undulating terrain. The
minimum and maximum elevation of the study area (10 km radius) is 420 and 660 m AMSL
(above mean sea level) respectively. The entire district is drained by Sone River and its
tributaries. The depth of the river near the project site is around 2.2 m. As per the results of
LU/LC study, the agricultural land occupies the majority of the study area (69.70 %). District
Shahdol is very rich in its mineral resources. Minerals found in district are coal, fire clay,
ocher’s and marble. Sohagpur Coal field contributes a major part in the revenue of the state.
Soils of the study area are mostly silty clay and sandy loamy. The project site is located in
Sandy –Loamy Soil. Eight (8) locations within the 10 km radius around the study area were
selected for soil sampling. The pH of the soil was observed to be in the range of 7.63 to 8.42
indicating that the soil is alkaline. Study area has fertile soils in most of the regions.
As per the meteorological data recorded during the study period, it was observed that the
maximum mean ambient dry bulb temperature observed to be 45.3ᵒC, whereas the
minimum mean ambient dry bulb temperature of 13.6ᵒC was observed during the study
period. The predominant wind direction during the study period was from West to East.
Based on the results of ambient air quality monitoring conducted at 8 locations in the study
area, it was observed that the average values of PM2.5 ranged from 44.5 µg/m3 to 50.6
µg/m3. Average concentration of PM10 varied from 74.5 µg/m3 to 89 µg/m3 which is within
the NAAQ standards prescribed by CPCB. The higher concentration in the area may be due
to vehicular movement and the industries in the surrounding area. The area also has many
coal mining projects due to the availability of coal in Sohagpur block which will contribute to
EIA for the Proposed Capacity Enhancement by Increasing Pulp Production from 62,000 BD TPA to 90,000 BD TPA by upgrading the existing pulp mill without increasing the permitted paper production capacity of 1,00,000 TPA
Project No: PJ-ENVIR-2018419-1689 Dated: November 2018
Executive Summary
Page 13
the PM concentration in the ambient air. The average SO2 and NOx values were found to be
in the range of 9.3 µg/m3 to 10.8 µg/m3and 29.1 µg/m3to 33.8 µg/m3 respectively which is
much lower than the respective NAAQ standard of 80 µg/m3. The surface water sample was
collected from Sone River and as per the analysis results, pH, total hardness, total coliform
was found to be 7.36, 153 mg/l and 130 MPN/100 mL respectively. Heavy metal
concentrations were found to be below detectable limit/within the permissible limit. To
assess the water quality of the study area, eight (8) ground water sampling locations were
selected sampling locations were selected. All the values of the analysis results were
compared with drinking water standards as stipulated by CPCB and were found that the
values are well within the permissible.
There are four reserved forests in the study area Burhar, Maikal, Mauhari reserve forest
belongs to Anuppur forest range of Anuppur subdivision. The forests block in the study area
represent peninsular Sal region mostly dry deciduous type of forest, mixed deciduous
vegetation structure. In general, flora in south and south west part of study area was
observed to be rich due to Sone River. Overall 65 tree and 14 shrub species were recorded
during present survey. Overall 56 species of birds were recorded from entire study area
during this survey period.
Primary Socio-Economic Survey was conducted from 03rd to 08th May 2018. During this
survey, primary data for geographical features, settlements, roads and amenities in the
respective villages were observed. In addition to the site observations, focused group
discussion along with primary survey was conducted in the villages falling within 10 km
radius of the project site.
5. Prediction of Impacts and Environmental Management Plan
The proposed project requires minimal construction as the existing facility already has the
adequate capacity of pulp mill to increase the production level. Hence no major impacts
during the construction phase is envisaged. About 100 contract labours will be employed
during the construction phase.
Rehabilitation and resettlement activities are not applicable for the proposed project. No
adverse impact on the land use is envisaged as no additional land is required for the
EIA for the Proposed Capacity Enhancement by Increasing Pulp Production from 62,000 BD TPA to 90,000 BD TPA by upgrading the existing pulp mill without increasing the permitted paper production capacity of 1,00,000 TPA
Project No: PJ-ENVIR-2018419-1689 Dated: November 2018
Executive Summary
Page 14
proposed project. The facility has already developed extensive green belt and plantation
area of about 633 acres (43% of the total existing land area) around the plant.
No additional coal consumption is envisaged beyond the existing consumption and hence no
additional emissions from the Captive Power Plant are envisaged. The additional steam
required for increased pulp production will be generated by firing of additional solids (Black
liquor) generated from the pulp mill. Also, additional solids will be processed in the lime kiln
due to the increase in the production of lime sludge during the post project scenario. The
increase in emission rates were estimated for the increased solids firing in chemical
recovery boiler and lime kiln based on the pro-rata basis considering the existing emission
scenario. Prediction of impacts on air environment has been carried out by employing
mathematical model based on a steady state Gaussian Plume Dispersion Model designed for
multiple point sources for short term. In the present case, ISCST3 dispersion model was
used. The peak predicted GLCs due to the proposed project is found be minimal, in the
order of 0.65 µg/m3, 1.05 µg/m3and 0.75 µg/m3 respectively for PM10, SO2 and NOX and thus
the resultant cumulative concentration for emissions within impact area will comply with
the NAAQ standards. The existing stacks and ESPs are adequate. However, the ESP of
Chemical Recovery boiler will be upgraded during the post project scenario as per the
requirement to meet the emission norms as prescribed by MPPCB. The existing pollution
control systems and monitoring plan will be continued during the post project scenario. No
increase in coal dust emissions are envisaged. The existing facility has adequate covered
coal storage yards and sprinkler systems to control fugitive emissions. It is proposed to
install NCG gas collection system to capture non-condensable gases (NCG) from various
sources of the pulp mill and the extracted NCGs will be fired in lime kin. No additional noise
generating units will be installed.
Although the proposed project includes increasing pulp production levels, no additional
water requirement is envisaged due to the adoption of ECF bleaching technology and
increased water conservation measures. There will be reduction in the freshwater
consumption from the existing water consumption level of 20,250 m3/day to 17,225 m3/day.
Specific water consumption will be reduced considerably in the main plant from 45 m3/T of
paper production to 32 m3/T of paper production due to the adoption of ECF bleaching and
EIA for the Proposed Capacity Enhancement by Increasing Pulp Production from 62,000 BD TPA to 90,000 BD TPA by upgrading the existing pulp mill without increasing the permitted paper production capacity of 1,00,000 TPA
Project No: PJ-ENVIR-2018419-1689 Dated: November 2018
Executive Summary
Page 15
increased recycling options. The wastewater generation quantity during the post project
scenario will be reduced from 10,790 m3/day to 9,265 m3/day. The specific wastewater
generation will be reduced from 39 m3/T of paper production to 27 m3/T of paper
production. In addition, the COD load on the ETP will reduce from 44 kg/T of pulp
production to 18 kg/T of pulp production due to the replacement of existing chlorine based
bleaching technology with ECF Bleaching technology. As there is no increase in hydraulic
load and COD load on the effluent treatment plant (ETP), the existing ETP which is designed
for a capacity to handle 20,500 m3/day is adequate to treat the wastewater during the post
project scenario. TDS load will reduce from 80 kg/T of paper production to 54 kg/T of paper
production during the post project scenario due to the reduced inorganic chemical
consumption. Thus, the treated wastewater will comply with the discharge standards as
prescribed by MPPCB.
No treated wastewater will be discharged into the River Sone. Out of the total treated
wastewater (9265 m3/day), about 250 m3/day of treated wastewater will be utilized for dust
suppression, firewater, reuse for plant domestic etc. The remaining 9015 m3/day of treated
effluent from ETP will discharged for land irrigation application carried out through HRTS
(High Rate Transpiration System) design as per the existing practice. The total land area
available for utilization of treated wastewater is about 633 acres including green belt and
plantation. The hazardous waste generation during the post project scenario will not
increase beyond the quantities as prescribed in the consent. All the existing solid and
hazardous waste handling and management practices will be continued during the post
project scenario.
OPM, Amlai has implemented social and farm forestry plantations of Eucalyptus, Poplar and
Subabul in the nearby areas around the project site (Uttar Pradesh, Chhattisgarh, Madhya
Pradesh and West Bengal). Thus, as a part of sustainable agro forestry, it is proposed to
cover 5000 ha areas every year under plantation.
6. Public Hearing
In accordance with Environmental Impact Assessment Notification dated 14.09.2006 of
Ministry of Environment, Forests and Climate Change (MoEF&CC), Government of India,
EIA for the Proposed Capacity Enhancement by Increasing Pulp Production from 62,000 BD TPA to 90,000 BD TPA by upgrading the existing pulp mill without increasing the permitted paper production capacity of 1,00,000 TPA
Project No: PJ-ENVIR-2018419-1689 Dated: November 2018
Executive Summary
Page 16
New Delhi, a Public Hearing for obtaining Environmental Clearance for the proposed project
of M/s Orient Paper Mills, Amlai for enhancing pulp manaufacturing capacity was organized
at project site OPM SikhshanSansthan, Amlai, Dist. Shahdol, M.P from 11.00 AM.
The draft Environmental Impact Assessment Study Report along with Executive Summary,
both in English and vernacular language (Hindi) was submitted to Madhya Pradesh Pollution
Control Board requesting for conduct of Public Hearing for the proposed project.
In compliance to provision of the EIA notification dated 14.09.2006, the board issued public
notice of 30 days in two daily newspapers on 21st and 22nd September 2018 namely, ‘The
Times of India’ (English Daily) and ‘Dainik Bhaskar, Dainik Raj Express’ for getting reponses
from public and intimating time, date and venue of the public hearing fixed for 23.10.2018
at the project site. In addition, announcements were made on nearby places on
loudspeakers and banners were pasted at various locations. Thereafter, public hearing for
the said project was conducted on 23.10.2018, which was attended by 202 persons. The
Public hearing was supervised and presided over by the Additional District Magistrate (ADM)
and Regional Officer, MPPCB.
Views, suggestions and concerns for the proposed project were raised by the public for
which brief reply/clarifications were provided by OPM.
7. Conclusions
No major adverse impacts are envisaged from the proposed project. No treated wastewater
will be discharged into the River.
Total project cost is about 40 crores out of which 28 crores is allocated for environmental
pollution control including upgradation of pulp mill with ECF bleaching and ESP upgrades for
the chemical recovery boiler.
Additional budget of CER (Corporate Environment Responsibility) of 40 lakhs is allocated as
per the office memorandum Corporate Environment Responsibility (CER) issued by
MoEF&CC dated 1st May 2018. The need-based Community development programs are
proposed for the villages adjacent to the project site. Hence the allocated budget on CER
will be spent accordingly for community development.

EIA for the Proposed Capacity Enhancement by Increasing Pulp Production from 62,000 BD TPA to 90,000 BD TPA by upgrading the existing pulp mill without increasing the permitted paper production capacity of 1,00,000 TPA
Project No: PJ-ENVIR-2018419-1689 Dated: November 2018
Table of Contents
Page 1

EIA for the Proposed Capacity Enhancement by Increasing Pulp Production from 62,000 BD TPA to 90,000 BD TPA by upgrading the existing pulp mill without increasing the permitted paper production capacity of 1,00,000 TPA
Project No: PJ-ENVIR-2018419-1689 Dated: November 2018
Table of Contents
Page 2
Table of Contents
1 INTRODUCTION .................................................................................................................. 1
1.1 Overview of the CK Birla Group .................................................................................. 1
1.2 Project Proponent- Orient Paper & Industries Ltd (OPIL) ........................................... 1
1.3 Awards and Public Accolades ...................................................................................... 1
1.4 Proposed Project ......................................................................................................... 3
1.5 Existing Plant Location ................................................................................................ 4
1.5.1 Environmental Setting of the Mill ........................................................................ 7
1.6 Need for the EIA study ................................................................................................ 7
1.6.1 Project Appraisal and ToR .................................................................................... 8
1.7 EIA Study ..................................................................................................................... 8
1.8 Overview of the Methodology of the EIA Study ......................................................... 9
1.9 Regulatory Context .................................................................................................... 12
1.9.1 Ambient Air Quality Standards .......................................................................... 12
1.9.2 Air Emission Discharge Standards ...................................................................... 13
1.9.3 Minimum Stack Height Standards ..................................................................... 13
1.9.4 Ambient Noise Standards .................................................................................. 13
1.9.5 Pulp and Paper Mill – Specific Wastewater Discharge Standards ..................... 14
1.9.6 Hazardous and Other Wastes (Management, Handling and Transboundary
Movement) Rules, 2016 ................................................................................................... 14
1.10 Structure of the EIA Report ................................................................................... 15
2 ENVIRONMENTAL MANAGEMENT ASPECTS IN THE EXISTING FACILITY ......................... 18
2.1 Overview of the Existing Facility ............................................................................... 18
2.2 Land Use Breakup of the Existing Facility ................................................................. 21
2.3 Process Description of the Existing facilities ............................................................. 21
2.3.1 Overview ............................................................................................................ 21
2.3.2 Digester section ................................................................................................. 21
2.3.3 Pulp Screening, Washing & Bleaching Operations ............................................ 25
2.3.4 Recovery area .................................................................................................... 25
2.3.5 Paper Machines & Tissue Paper Machine ......................................................... 29
EIA for the Proposed Capacity Enhancement by Increasing Pulp Production from 62,000 BD TPA to 90,000 BD TPA by upgrading the existing pulp mill without increasing the permitted paper production capacity of 1,00,000 TPA
Project No: PJ-ENVIR-2018419-1689 Dated: November 2018
Table of Contents
Page 3
2.3.6 Steam Requirement and Generation Facilities .................................................. 31
2.3.7 Power Requirement and Generation Facilities .................................................. 33
2.3.8 Water Requirement and Treatment Facilities ................................................... 33
2.4 Summary of Various Environmental Management Aspects Implemented in the
Existing Facility ..................................................................................................................... 38
2.4.1 Air Quality Management Aspects ...................................................................... 38
2.4.2 Wastewater generation, treatment, reuse and discharge. ............................... 41
2.4.3 Discharge of Treated Effluent ............................................................................ 43
2.4.4 Noise Management ............................................................................................ 44
2.4.5 Solid and hazardous waste management .......................................................... 45
2.5 Greenbelt and plantation .......................................................................................... 46
2.6 Occupational Health Programs ................................................................................. 47
2.7 Safety Systems........................................................................................................... 49
2.8 Summary of various CSR Programme Implemented ................................................ 50
3 DETAILS OF THE PROPOSED PROJECT .............................................................................. 55
3.1 Overview of the Proposal .......................................................................................... 55
3.2 Details of the Proposed Increase in Pulp Production ............................................... 55
3.2.1 Proposed Pulping Process .................................................................................. 57
3.3 Input Requirements and Sources .............................................................................. 63
3.3.1 Land Requirement.............................................................................................. 63
3.3.2 Raw Material requirement: ............................................................................... 63
3.3.3 Chemical Requirement ...................................................................................... 64
3.3.4 Power requirement ............................................................................................ 64
3.3.5 Steam requirement ............................................................................................ 64
3.3.6 Fuel Requirement .............................................................................................. 65
3.3.7 Water requirement ............................................................................................ 65
3.3.8 Proposed Project Cost ........................................................................................ 67
3.3.9 Project Schedule ................................................................................................ 67
4 BASELINE ENVIRONMENTAL STATUS ............................................................................... 68
4.1 Introduction............................................................................................................... 68
4.2 Study Area ................................................................................................................. 68
EIA for the Proposed Capacity Enhancement by Increasing Pulp Production from 62,000 BD TPA to 90,000 BD TPA by upgrading the existing pulp mill without increasing the permitted paper production capacity of 1,00,000 TPA
Project No: PJ-ENVIR-2018419-1689 Dated: November 2018
Table of Contents
Page 4
4.3 Scope and Methodology of Baseline Study .............................................................. 72
4.4 Administration Setup of the Study Area District ....................................................... 74
4.5 Land Environment ..................................................................................................... 76
4.5.1 Physiography and Drainage ............................................................................... 76
4.5.2 List of Industries ................................................................................................. 91
4.6 Geology ..................................................................................................................... 92
4.6.1 Minerals & Ores ................................................................................................. 93
4.7 Geomorphology & Structure ..................................................................................... 93
4.8 Soil Environment ....................................................................................................... 95
4.8.1 Soil of the Region ............................................................................................... 95
4.8.2 Soil in the Study Area ......................................................................................... 96
4.9 Seismic zone ............................................................................................................ 101
4.10 Meteorological Data ............................................................................................ 103
4.10.1 Climatological Data-IMD Jabalpur Observatory (Nearest IMD Station) .......... 103
4.10.2 Site-specific Meteorological Data .................................................................... 106
4.11 Ambient Air Quality Monitoring .......................................................................... 107
4.11.1 Methodology Adopted for Air Quality Monitoring .......................................... 107
4.12 Noise Environment .............................................................................................. 120
4.13 Water Environment ............................................................................................. 122
4.13.1 Surface Water Resources in the Study Area .................................................... 122
4.13.2 Surface Water Quality ...................................................................................... 123
4.13.3 Ground Water Resources ................................................................................. 125
4.13.4 Ground Water Quality and Movement of Pollutants in Study Area ................ 133
4.13.5 Ground Water Quality ..................................................................................... 134
4.14 Ecological Environment ....................................................................................... 139
4.14.1 Necessity of the Ecology Management Plan ................................................... 140
4.14.2 Objectives of Ecological Monitoring ................................................................ 141
4.14.3 Location and Geographical Area ...................................................................... 141
4.14.4 Topography ...................................................................................................... 141
4.14.5 Forest Blocks in Study Area .............................................................................. 142
4.14.6 General Ecology of the Study Area .................................................................. 142
EIA for the Proposed Capacity Enhancement by Increasing Pulp Production from 62,000 BD TPA to 90,000 BD TPA by upgrading the existing pulp mill without increasing the permitted paper production capacity of 1,00,000 TPA
Project No: PJ-ENVIR-2018419-1689 Dated: November 2018
Table of Contents
Page 5
4.14.7 Survey Methodology ........................................................................................ 143
4.14.8 Quantitative Analysis of Vegetation ................................................................ 146
4.14.9 Aquatic Environment ....................................................................................... 148
4.14.10 Results .......................................................................................................... 149
4.14.11 General Characteristics of Floral Diversity ................................................... 149
4.14.12 Flora in Zone II – up to 5 km from Project Site ............................................ 151
4.14.13 Flora of Zone III – 5 to 10 km from Project Site ........................................... 153
4.14.14 Agriculture in the study Area ....................................................................... 158
4.14.15 Forest Blocks in Study Area .......................................................................... 160
4.14.16 Faunal Diversity ............................................................................................ 161
4.14.17 Diversity Indices ........................................................................................... 164
4.15 Socio Economic Environment .............................................................................. 166
4.15.1 Methodology of the Study ............................................................................... 167
4.15.2 Socio Economic Survey .................................................................................... 168
4.15.3 Primary Survey ................................................................................................. 169
4.15.4 Regional Socioeconomic Profile ....................................................................... 172
4.15.5 Socioeconomic Profile of Study Area ............................................................... 174
5 Assessment of Impacts and Mitigation Measures ......................................................... 183
5.1 General .................................................................................................................... 183
5.2 Impacts and Mitigation Measures during Construction Stage ............................... 183
5.2.1 Land Use ........................................................................................................... 183
5.2.2 Air Quality ........................................................................................................ 184
5.2.3 Noise Levels ..................................................................................................... 184
5.2.4 Water Quality ................................................................................................... 184
5.2.5 Terrestrial Ecology ........................................................................................... 184
5.2.6 Socio-Economic ................................................................................................ 185
5.3 Impacts and Mitigation Measures during Operation Phase ................................... 185
5.3.1 Overview .......................................................................................................... 185
5.3.2 Impact on Land Use ......................................................................................... 186
5.3.3 Impact on Air Quality ....................................................................................... 186
5.3.4 Impacts of Fugitive Emissions .......................................................................... 190
EIA for the Proposed Capacity Enhancement by Increasing Pulp Production from 62,000 BD TPA to 90,000 BD TPA by upgrading the existing pulp mill without increasing the permitted paper production capacity of 1,00,000 TPA
Project No: PJ-ENVIR-2018419-1689 Dated: November 2018
Table of Contents
Page 6
5.3.5 Non-Condensable Emissions and its Control ................................................... 191
5.3.6 Traffic Impact Assessment ............................................................................... 191
5.3.7 Noise Emissions ................................................................................................ 194
5.3.8 Impact on Water Environment ........................................................................ 194
5.3.9 AOX Levels in the treated effluent ................................................................... 200
5.3.10 Soil and Groundwater Quality Related Impacts .............................................. 200
5.3.11 Solid Waste Generation and Disposal .............................................................. 201
5.3.12 Impacts on Ecological Environment ................................................................. 202
5.3.13 Socio Economic Impacts .................................................................................. 202
6 ANALYSIS OF ALTERNATIVES .......................................................................................... 204
6.1 Introduction............................................................................................................. 204
6.2 Site Alternative ........................................................................................................ 204
6.3 Technology Alternative ........................................................................................... 204
7 ENVIRONMENT MONITORING PROGRAM ..................................................................... 205
7.1. Introduction............................................................................................................. 205
7.2. Objectives of Environmental Monitoring Plan ........................................................ 205
7.3. Environmental Monitoring and Reporting Procedure ............................................ 207
7.4. Environmental Monitoring Program ....................................................................... 207
7.5. Data Analysis ........................................................................................................... 209
7.6. Reporting Schedule ................................................................................................. 210
8 ADDITIONAL STUDIES ..................................................................................................... 211
8.1 Public Consultation ................................................................................................. 211
8.2 Risk Assessment Study and Risk Mitigation Measures ........................................... 214
8.3 Fire Hazards and Risk Mitigation Plan ..................................................................... 214
8.4 Occupational Health and Noise Management Plan ................................................ 215
8.5 Occupational Safety Management and Surveillance Programme .......................... 215
9 PROJECT BENEFITS ......................................................................................................... 218
9.1 Corporate Environment Responsibility ................................................................... 218
10 ENVIRONMENTAL MANAGEMENT PLAN ....................................................................... 219
10.1 General ................................................................................................................ 219
10.2 Administrative Aspects ........................................................................................ 219

EIA for the Proposed Capacity Enhancement by Increasing Pulp Production from 62,000 BD TPA to 90,000 BD TPA by upgrading the existing pulp mill without increasing the permitted paper production capacity of 1,00,000 TPA
Project No: PJ-ENVIR-2018419-1689 Dated: November 2018
Table of Contents
Page 7
10.2.1 Commitment and Policy ................................................................................... 219
10.2.2 Planning............................................................................................................ 221
10.2.3 Implementation ............................................................................................... 221
10.2.4 Measurement and Evaluation ......................................................................... 222
10.3 Environmental Management during Construction Phase ................................... 222
10.4 Environmental Management Plan during Operation Phase ............................... 223
10.4.1 Air Quality Management Plan .......................................................................... 223
10.4.2 Noise Management Plan .................................................................................. 224
10.4.3 Water and Wastewater Management ............................................................. 224
10.4.4 Solid and Hazardous Waste Management....................................................... 230
10.4.5 Sustainable Agro-Forestry ................................................................................ 231
10.4.6 Rainwater Harvesting ....................................................................................... 232
10.5 Conservation Measures ....................................................................................... 234
10.5.1 Roof top Collection .......................................................................................... 234
10.5.2 Ecology and Biodiversity Management Plan ................................................... 237
10.5.3 Need Based CSR Development ........................................................................ 237
10.6 Budgetary Cost Estimates for Environmental Management ............................... 240
11 Conclusions .................................................................................................................... 241
12 Disclosure of Consultants .............................................................................................. 243
12.1.1 Introduction ..................................................................................................... 243
12.1.2 Cholamandalam MS Risk Services Limited – EIA Consultant ........................... 243
12.1.3 Details of Experts/Consultants Engaged for this EIA Study ............................. 243
12.1.4 Other Technical Team Members ..................................................................... 244
12.1.5 External Labs/Agencies involved in EIA Study ................................................. 244
12.1.6 NABET Certificate ............................................................................................. 245
12.1.7 NABET Extension Letter ................................................................................... 246
EIA for the Proposed Capacity Enhancement by Increasing Pulp Production from 62,000 BD TPA to 90,000 BD TPA by upgrading the existing pulp mill without increasing the permitted paper production capacity of 1,00,000 TPA
Project No: PJ-ENVIR-2018419-1689 Dated: November 2018
Table of Contents
Page 8
List of Tables
Table 1-1 Environmental Setting of the Project Site ................................................................. 7
Table 1-2 National Ambient Air Quality Standards .................................................................. 12
Table 1-3 General Noise Standards ......................................................................................... 14
Table 1-4 Wastewater Discharge Standards ............................................................................ 14
Table 1-5 List of Hazardous Wastes as Applicable to Pulp & Paper Industry .......................... 15
Table 2-1 Chronology of the Existing Environmental Clearances ............................................ 18
Table 2-2 Overview of the Details of the Existing Facility ....................................................... 19
Table 2-3 Land Use Breakup of the Existing Facility ................................................................ 21
Table 2-4 Steam Generation Capacities in the Facility ............................................................ 31
Table 2-5 Water Balance during the Existing Scenario ............................................................ 37
Table 2-6 Stack emission details (MPPCB Test Report and Plant Report) ............................... 39
Table 2-7 Stack emission details (External Lab Test Report) ................................................... 39
Table 2-8 Ambient Air Quality Details in the Existing Plant (MPPCB Test Report) .................. 40
Table 2-9 Treated Wastewater Quality as per MPPCB Test Report ........................................ 41
Table 2-10 Average Ambient Noise Level (MPPCB Test Report) ............................................. 44
Table 2-11 Solid and hazardous Waste Generation and Disposal ........................................... 45
Table 2-12 Types of Medical Tests Undertaken ...................................................................... 47
Table 3-1 Overview of the Plant Capacities during Post Project Scenario .............................. 56
Table 3-2 Overall Material Balance of the Existing and Post Project Scenario ....................... 60
Table 3-3 Raw Material Requirement (Existing v/s Post project Scenario) ............................. 63
Table 3-4 Chemical Requirement for Pulp Production (Existing v/s Post Project Scenario) ... 64
Table 3-5 Steam and Power Requirement for the Proposed Project ...................................... 65
Table 3-6 Water Balance – Post Project Scenario .................................................................... 66
Table 3-7 Project Cost Estimate- Pulp Mill upgradation to manufacture 90,000 TPA of Pulp
production ................................................................................................................................ 67
Table 4-1 Various Environmental Attributes ........................................................................... 72
Table 4-2 Frequency and Monitoring Methodology................................................................ 73
Table 4-3 Land Use/Land Cover Classification System ............................................................ 86
Table 4-4 Built Up Land in 10 km radius from the Project Site ............................................... 87
Table 4-5 Agricultural Land in 10 km radius from the Project Site .......................................... 88
Table 4-6 Forest Land in 10 km radius from the Project Site .................................................. 88
Table 4-7 Wasteland in 10 km radius from the proposed project site .................................... 89
Table 4-8 Water Bodies in 10 km radius from the Project Site ............................................... 90
Table 4-9 Overall Summary of the Statistics of LU/LC in the study Area ................................ 91
Table 4-10 Details of Soil Sampling Locations ......................................................................... 97
Table 4-11 Physico-Chemical Characteristics of Soil samples Collected within the Study Area
................................................................................................................................................ 100
Table 4-12 Indian Meteorological Department – Climatological Tables 30 Years Data: 1971-
2000 (Jabalpur IMD station) .................................................................................................. 103
EIA for the Proposed Capacity Enhancement by Increasing Pulp Production from 62,000 BD TPA to 90,000 BD TPA by upgrading the existing pulp mill without increasing the permitted paper production capacity of 1,00,000 TPA
Project No: PJ-ENVIR-2018419-1689 Dated: November 2018
Table of Contents
Page 9
Table 4-13 AAQ monitoring Stations Location details ........................................................... 108
Table 4-14 Summary of the Average Baseline Concentrations of Pollutants during the Study
Period (16th April 2018 to 17h July 2018) ............................................................................... 111
Table 4-15 PM2.5 Concentration in the Study Area during the study period......................... 112
Table 4-16 PM10 Concentration in the Study Area during the study period ......................... 113
Table 4-17 SO2 Concentration in the Study Area during the study period ............................ 115
Table 4-18 NOx Concentration in the Study Area during the study period ........................... 116
Table 4-19 Ammonia Concentration in the Study Area during the study period (16th April
2018 to 17h July 2018) ........................................................................................................... 117
Table 4-20 Ozone Concentration in the Study Area during the study period (16th April 2018
to 17h July 2018) .................................................................................................................... 118
Table 4-21 Carbon Monoxide Concentration in the Study Area during the study period (16th
April 2018 to 17h July 2018) ................................................................................................... 119
Table 4-22 Noise Sampling Locations .................................................................................... 120
Table 4-23 Recorded Noise Levels ......................................................................................... 121
Table 4-24 Surface Water Sampling Locations ...................................................................... 123
Table 4-25 Analysis Results of Surface Water Samples ......................................................... 124
Table 4-26 Stage of Groundwater Development of Sohagpur Block, Shahdol District,
Madhya Pradesh .................................................................................................................... 130
Table 4-27 Ground Water Sampling Location Details............................................................ 135
Table 4-28 Analyzed Ground Water Quality for Various parameters in the Study Area ...... 137
Table 4-29 Terrestrial Ecology Survey Locations ................................................................... 146
Table 4-30 Density, abundance and frequency of occurrence of flora in the zone II ........... 151
Table 4-31 Density, abundance and frequency of occurrence of flora in the zone III ......... 153
Table 4-32 List of ground level storey herbaceous species observed in the study area ....... 155
Table 4-33 List of Shrub species observed in the study area ................................................ 156
Table 4-34 List of Trees species observed in the study area (Buffer zone) ........................... 157
Table 4-35 List of Agriculture crops observed in the study area ........................................... 159
Table 4-36 List of ecologically important plant species observed in the study area ............. 160
Table 4-37 List of mammals in the study area (Buffer zone) ................................................. 161
Table 4-38 List of birds species observed in the study area .................................................. 163
Table 4-39 List of mammals in the study area (Buffer zone) ................................................. 164
Table 4-40 Biodiversity indices of the study area .................................................................. 166
Table 4-41 Administrative Status of Project Area Villages/Towns ........................................ 168
Table 4-42 Summary Socioeconomic Indicators .................................................................... 174
Table 4-43 Demography of the Project Area ......................................................................... 175
Table 4-44 Working and Non-Working Population of Project Area ...................................... 175
Table 4-45 Occupational Structure in Project Area ............................................................... 176
Table 4-46 Educational Status of Project Area ...................................................................... 177
EIA for the Proposed Capacity Enhancement by Increasing Pulp Production from 62,000 BD TPA to 90,000 BD TPA by upgrading the existing pulp mill without increasing the permitted paper production capacity of 1,00,000 TPA
Project No: PJ-ENVIR-2018419-1689 Dated: November 2018
Table of Contents
Page 10
Table 5-1 Estimation of Emissions due to additional solids firing in Chemical Recovery Boiler
................................................................................................................................................ 187
Table 5-2 Estimation of emissions due to additional solids firing in Lime kiln ...................... 187
Table 5-3 Summary of the Predicted GLCs in the Study Area ............................................... 190
Table 5-4 PCU Equivalent Factor............................................................................................ 193
Table 5-5 Average Traffic Count for the Location .................................................................. 193
Table 5-6 Existing and Post Project Truck Traffic Details ...................................................... 194
Table 5-7 Fresh water consumption and wastewater generation quantities for existing and
post project scenario ............................................................................................................. 194
Table 5-8 Adequacy of Existing ETP ....................................................................................... 196
Table 5-9 Solid and Hazardous Waste Generation and Disposal........................................... 202
Table 7-1 Environmental Monitoring Program ...................................................................... 208
Table 7-2 Recommended Environmental Monitoring Plan ................................................... 209
Table 8-1 Suggested Frequency of Medical Examination under Occupational Health
Surveillance Programme ........................................................................................................ 217
Table 8-2 Suggested Medical Tests under Occupational Health Surveillance Programme .. 217
Table 10-1 Expected Estimated Treated Wastewater Characteristics during Post Project
Scenario .................................................................................................................................. 227
Table 10-2 Solid and Hazardous Waste Generation and Disposal ........................................ 230
Table 10-3 Details of Sustainable wood sourcing at the existing facility and proposed
operations .............................................................................................................................. 231
Table 10-4 Run off Estimations .............................................................................................. 233
Table 10-5 Rainwater Harvesting Scheme – Roof Top Collection ......................................... 234
Table 10-6 CER Budget ........................................................................................................... 240
List of Figures
Figure 1-1 Certificates and Awards ............................................................................................ 3
Figure 1-2 Location of the Project Site ...................................................................................... 5
Figure 1-3 Location of Amlai and its Neighbourhood ................................................................ 6
Figure 1-4 Google Earth Imagery showing 10 km radius of project site ................................... 6
Figure 2-1 Typical Manufacturing Process at the existing facility ........................................... 22
Figure 2-2 Google Map Showing the OPM Amlai Facilities ..................................................... 23
Figure 2-3 Layout Drawing of OPM Amlai Facility ................................................................... 24
Figure 2-4 Typical View of Digester area and Bleaching Area ................................................. 27
Figure 2-5 Typical Process Flow Diagram of Chemical Recovery Section ................................ 28
Figure 2-6 Typical View of Paper Machines ............................................................................. 30
Figure 2-7 Typical View Co-generation Boilers with ESPs........................................................ 32
Figure 2-8 Typical View of the TG Units in the Existing Facility ............................................... 33
Figure 2-9 Typical Raw Water Intake and Pre-treatment Scheme .......................................... 35
EIA for the Proposed Capacity Enhancement by Increasing Pulp Production from 62,000 BD TPA to 90,000 BD TPA by upgrading the existing pulp mill without increasing the permitted paper production capacity of 1,00,000 TPA
Project No: PJ-ENVIR-2018419-1689 Dated: November 2018
Table of Contents
Page 11
Figure 2-10 Photographs showing Raw Water Intake and Pre-Treatment ............................. 36
Figure 2-11 Water Balance Diagram for the Existing Scenario ................................................ 37
Figure 2-12 Environmental Management Cell ......................................................................... 38
Figure 2-13 Typical View of Existing Pollution Control Systems .............................................. 40
Figure 2-14 Typical View of Existing ETP Facilities ................................................................... 42
Figure 2-15 Discharge of Treated Effluent ............................................................................... 43
Figure 2-16 Typical View of Plantation and Greenbelt ............................................................ 46
Figure 2-17 Facilities at Occupational Health Centre .............................................................. 48
Figure 2-18 Fire Hydrant and Safety Systems .......................................................................... 49
Figure 2-19 Corporate Social Responsibility Initiatives and Activities ..................................... 51
Figure 2-20 Watershed Management Program Activities ....................................................... 53
Figure 2-21 Temple at OPM, Amlai .......................................................................................... 53
Figure 3-1 Chlorine Dioxide manufacturing Palnt -HP-A (Hydrogen Peroxide – Atmospheric)
Process ..................................................................................................................................... 59
Figure 3-2 Process Flow Diagram – Material Balance ............................................................. 62
Figure 3-3 Water Balance Diagram for the Post Project Scenario ........................................... 66
Figure 4-1High Resolution Satellite image showing project site ............................................. 69
Figure 4-2Location of the Project site and its landscape ......................................................... 69
Figure 4-3Topo Sheet of 10 km radius from the Project Site .................................................. 70
Figure 4-4Road Map around the Project Site .......................................................................... 71
Figure 4-5 District Map showing the Administrative Set up .................................................... 75
Figure 4-6 Physiographic Map of the Study Area .................................................................... 77
Figure 4-7 Photographs showing the physiographic features of the study area .................... 77
Figure 4-8 Digital elevation model of the study area .............................................................. 78
Figure 4-9 Shahdol River Map .................................................................................................. 79
Figure 4-10Photographs showing the view of Sone River ....................................................... 79
Figure 4-11Drainage Map of the study area ............................................................................ 80
Figure 4-12 View of Chachai Tank in the study area ............................................................... 81
Figure 4-13 Chachai Tank Sluices ............................................................................................. 81
Figure 4-14 IRS P6 Satellite Imagery of 10 km radius from the Project Site ........................... 84
Figure 4-15 Flow Chart showing Methodology of Land Use Mapping .................................... 85
Figure 4-16 Land Use Classification of 10 km radius from the Project Site ............................. 86
Figure 4-17 Built Up Land in Rural Area ................................................................................... 87
Figure 4-18 Agricultural Land in Rural Area ............................................................................. 88
Figure 4-19 Forest Land in Rural Area ..................................................................................... 89
Figure 4-20 Photographs showing the wasteland/ land with or without scrub in the Study
area .......................................................................................................................................... 90
Figure 4-21 Land use classes around 10 km radius from the project site ............................... 91
Figure 4-22 Geology Map of 10 km Radius .............................................................................. 92
Figure 4-23Sand stone exposure in the Sone river bed and in the banks of Sone river ......... 93
EIA for the Proposed Capacity Enhancement by Increasing Pulp Production from 62,000 BD TPA to 90,000 BD TPA by upgrading the existing pulp mill without increasing the permitted paper production capacity of 1,00,000 TPA
Project No: PJ-ENVIR-2018419-1689 Dated: November 2018
Table of Contents
Page 12
Figure 4-24 Geomorphology and Structure of the study area ................................................ 94
Figure 4-25 Hills in the Study area ........................................................................................... 95
Figure 4-26 Soil Map of Madhya Pradesh ................................................................................ 96
Figure 4-27 Soil in the Study area ............................................................................................ 96
Figure 4-28 Photographs of Soil Sampling ............................................................................... 98
Figure 4-29 Soil Quality Monitoring Location of the Study area ............................................. 99
Figure 4-30 Seismic Zone Map of India .................................................................................. 101
Figure 4-31 Earthquake Hazard Map of India ........................................................................ 102
Figure 4-32 Seismic Zone Map of Madhya Pradesh .............................................................. 102
Figure 4-33 Annual Wind rose as per IMD Jabalpur Observatory data ................................. 105
Figure 4-34 Seasonal Wind rose as per IMD Jabalpur Observatory Data .............................. 105
Figure 4-35 Site Specific Wind Rose for the Study Period (16th April 2018 to 15th July 2018)
................................................................................................................................................ 106
Figure 4-36 Site Photographs of AAQ Stations ...................................................................... 108
Figure 4-37 Map showing the air quality monitoring stations in the Study Area ................. 110
Figure 4-38 Trends of Ambient PM2.5 Concentration in the Study Area ............................... 113
Figure 4-39 Trends of PM10 concentration in the study area ............................................... 114
Figure 4-40 Trends of Ambient SO2 Concentration in the Study Area .................................. 115
Figure 4-41 Trends of Ambient NOx Concentration in the Study Area .................................. 116
Figure 4-42 Trends of Ambient Ammonia Concentration in the Study Area ........................ 117
Figure 4-43 Trends of Ambient Ozone Concentration in the Study Area .............................. 118
Figure 4-44 Trends of Ambient Carbon Monoxide Concentration in the Study Area ........... 119
Figure 4-45 Noise Sampling Locations in the Study Area ...................................................... 121
Figure 4-46 Sone River Basin ................................................................................................. 123
Figure 4-47 Location of Surface Water Sampling during the Study Period ........................... 123
Figure 4-48 Hydrogeology of Shahdol District ....................................................................... 127
Figure 4-49 Depth to Water Level- Pre-Monsoon (May 2012) District Shahdol ................... 128
Figure 4-50 Depth to Water Level- Pre-Monsoon – Study Area ............................................ 128
Figure 4-51 Depth to Water Level Post – Monsoon (Nov 2012) District Shahdol, MP ......... 129
Figure 4-52 Depth to Water Level Post – Monsoon – Study Area ......................................... 129
Figure 4-53 Occurrence of ground water in the study area .................................................. 131
Figure 4-54 Ground Water Table Pre– Monsoon – Study Area ............................................. 132
Figure 4-55 Ground Water Table Pre– Monsoon – Study Area ............................................. 133
Figure 4-56 Total Dissolved Solids in the Study Area ............................................................ 134
Figure 4-57 Photographs of Groundwater Sampling ............................................................. 135
Figure 4-58 Ground Water Quality Monitoring Sampling Locations in the Study Area ........ 136
Figure 4-59 Floral and Faunal Observation at Core (Zone I) and Buffer (Zone II and III) ...... 145
Figure 4-60 Google Map Showing Ecology Survey Locations ................................................ 145
Figure 4-61 Chachai Lake and Plankton sampling ................................................................. 149
EIA for the Proposed Capacity Enhancement by Increasing Pulp Production from 62,000 BD TPA to 90,000 BD TPA by upgrading the existing pulp mill without increasing the permitted paper production capacity of 1,00,000 TPA
Project No: PJ-ENVIR-2018419-1689 Dated: November 2018
Table of Contents
Page 13
Figure 4-62 Plantations Green cover inside Existing Orient Paper Mill and their clonal plant
production center .................................................................................................................. 150
Figure 4-63 Agriculture fields in the study area .................................................................... 159
Figure 4-64 Burhar Forest in the study area ......................................................................... 160
Figure 4-65 Birds species observed in the study area ........................................................... 162
Figure 4-66 Google Earth Image of the Project Site showing villages in the 10 km radius ... 168
Figure 4-67 Socio Economic Survey Photographs interacting with villagers /panchyat
member, Aaganwadi center .................................................................................................. 169
Figure 4-68 State and District map (Madhya Pradesh and Shahdol) ..................................... 173
Figure 4-69 Occupational Structure of the Project Area ....................................................... 176
Figure 4-70 Educational Status of the Project Area in Percentage (%) ................................. 177
Figure 4-71 Primary school at project area ........................................................................... 178
Figure 4-72 E- Panchayat Center at Panchayat Village .......................................................... 180
Figure 4-73 Drinking Water Facilities nearby Project Area ................................................... 181
Figure 5-1 Predicted 24-Hrs Avg. GLC’s of PM within 10 km Radius of the Study Area ........ 189
Figure 5-2 Predicted 24-Hrs Avg. GLC’s of SO2 within 10 km Radius of the Study Area ....... 189
Figure 5-3 Predicted 24-Hrs Avg. GLC’s of NOx within 10 km Radius of the Study Area ...... 190
Figure 5-4 Road Connectivity around the Existing Facility .................................................... 191
Figure 5-5 Location of Traffic Volume Survey Conducted in the Study Area ........................ 192
Figure 5-6 Flow Sheet of Existing ETP of capacity 20,500 m3/day ......................................... 199
Figure 8-1 Advertisement of Public Hearing Published in Local News Paper ........................ 212
Figure 8-2 Photographs of Public Hearing conducted at OPM site ....................................... 214
Figure 10-1 Certifications of OPM ......................................................................................... 220
Figure 10-2 Integrated Management System (IMS) Policy .................................................... 221
Figure 10-3 Typical View of Existing ETP ................................................................................ 226
Figure 10-4 Online Continuous Treated Wastewater Monitoring System ............................ 228
Figure 10-5 Photographs of the Plantation Sites ................................................................... 229
Figure 10-6 Photographs of the Existing Piezometric Points ................................................. 230
Figure 10-7 Existing Storm Water Drain ................................................................................ 236
Figure 10-8 Photographs of the Existing Reservoir ............................................................... 237
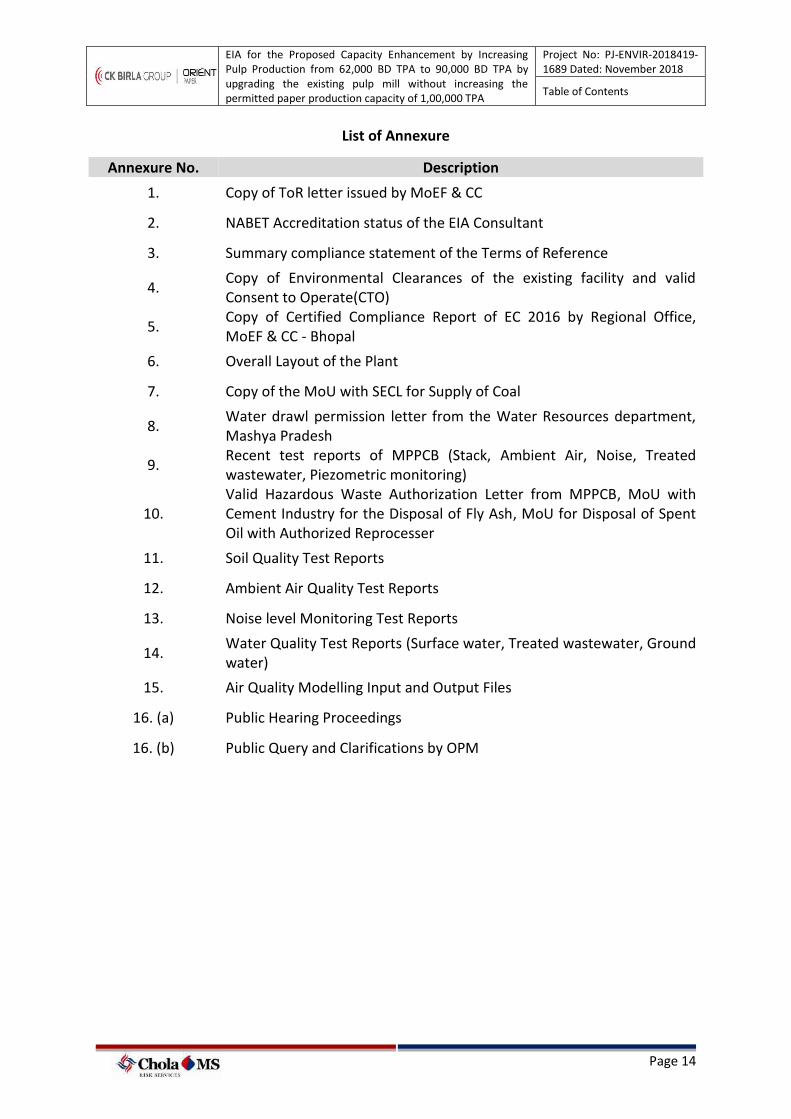
EIA for the Proposed Capacity Enhancement by Increasing Pulp Production from 62,000 BD TPA to 90,000 BD TPA by upgrading the existing pulp mill without increasing the permitted paper production capacity of 1,00,000 TPA
Project No: PJ-ENVIR-2018419-1689 Dated: November 2018
Table of Contents
Page 14
List of Annexure
Annexure No. Description
1. Copy of ToR letter issued by MoEF & CC
2. NABET Accreditation status of the EIA Consultant
3. Summary compliance statement of the Terms of Reference
4. Copy of Environmental Clearances of the existing facility and valid Consent to Operate(CTO)
5. Copy of Certified Compliance Report of EC 2016 by Regional Office, MoEF & CC - Bhopal
6. Overall Layout of the Plant
7. Copy of the MoU with SECL for Supply of Coal
8. Water drawl permission letter from the Water Resources department, Mashya Pradesh
9. Recent test reports of MPPCB (Stack, Ambient Air, Noise, Treated wastewater, Piezometric monitoring)
10. Valid Hazardous Waste Authorization Letter from MPPCB, MoU with Cement Industry for the Disposal of Fly Ash, MoU for Disposal of Spent Oil with Authorized Reprocesser
11. Soil Quality Test Reports
12. Ambient Air Quality Test Reports
13. Noise level Monitoring Test Reports
14. Water Quality Test Reports (Surface water, Treated wastewater, Ground water)
15. Air Quality Modelling Input and Output Files
16. (a) Public Hearing Proceedings
16. (b) Public Query and Clarifications by OPM
EIA for the Proposed Capacity Enhancement by Increasing Pulp Production from 62,000 BD TPA to 90,000 BD TPA by upgrading the existing pulp mill without increasing the permitted paper production capacity of 1,00,000 TPA
Project No: PJ-ENVIR-2018419-1689 Dated: November 2018
Chapter-1 Introduction
Page 1
1 INTRODUCTION
1.1 Overview of the CK Birla Group
The C.K. Birla Group is a growing US$1.6 billion conglomerate with Group’s businesses being
present across five continents operating in three industry clusters namely, technology and
automotive, home and building and healthcare and education. C.K. Birla Group companies
include Orient Cement, Birla Soft, Orient Electric, Orient Papers, Avtec Ltd., Gmmco Ltd., etc.
C.K Birla Group companies are guided by the values of the Group and they create enduring
value for all stakeholders and forge long-term relationships with customers and partners.
1.2 Project Proponent- Orient Paper & Industries Ltd (OPIL)
Orient Paper & Industries Ltd (OPIL), an ISO 14001:2015, 9001:2015, 18001:2007 &
50001:2011 certified unit of the CK Birla Group is one of the major players in the Indian Pulp
& Paper Industry. The Orient Paper & Industries Limited operates an integrated pulp &
paper mill on the west bank of the River Sone at Village Amlai in Shahdol District in Madhya
Pradesh which was installed in the year 1965.
The company produces a wide range of writing, printing, and Tissue papers. It is also
certified for FSC-COC (Forest Stewardship Council - Chain of Custody), denoting compliance
with all norms related to wood based raw materials in paper production. The Company’s
products are being sold throughout the country through a wide range and well-established
dealer network. The main markets in the country are in the Central & Northern regions
particularly Delhi, U.P., and Punjab & Haryana. The products are also exported to different
countries mainly UAE, Qatar, Saudi Arabia, Sri Lanka, Mauritius, Nepal, Bangladesh,
Singapore, Myanmar etc.
1.3 Awards and Public Accolades
Various initiatives have brought in recognition for the company by way of the following
awards:
• The industry is having well defined Environmental Policy and very well adopted in
practice.
• The industry is having well defined Quality Policy, Energy Policy, Occupational
Health, Safety Policy and it is very well adopted in practice.
EIA for the Proposed Capacity Enhancement by Increasing Pulp Production from 62,000 BD TPA to 90,000 BD TPA by upgrading the existing pulp mill without increasing the permitted paper production capacity of 1,00,000 TPA
Project No: PJ-ENVIR-2018419-1689 Dated: November 2018
Chapter-1 Introduction
Page 2
• Capexill Award as Two Star Export House by the Ministry of Commerce & Industry,
Govt. of India in the year 2002-03.
• TERI Corporate Environmental Award (3rd Rank) for Best Practices in Environment
(Indian Paper Sector) by the Energy & Resource Institute (TERI), New Delhi in the
year 2001-02.
• Green tech Gold Award for Outstanding performance in Environment Management
(Indian Paper Sector) by the Green tech Foundation, New Delhi (An Indo-German
NGO) for the years 2001-02,2002-03,2003-04, 2006-07, 2014-15, 2015-16 and
recently in the year 2018
• Golden Peacock Award for Outstanding performance in Environment Management
(Indian Paper Sector) by the World Environmental Foundation, IOD, New Delhi in
2006-07, and recently in the year 2018.
• National Award for Excellence in Water Management for Efficient Water
Management by the Confederation of Indian Industries-Green Business Centre,
Hyderabad in the year 2006-07 & Certificate for Excellence in Water Management by
CII in year 2017
• Highly improved environmental performance (ranked 15th position out of 28)
recognized by the Centre for Science & Environment, New Delhi during the green
rating study carried out by them in the year 2004.
• Best Employer of state of Madhya Pradesh for year 2014
• Grow Care India Environment & Safety Award 2017 & 2018.
• Golden Peacock Eco – Innovation Award 2016 & 2017.
• “Gold” Award in “2nd Annual EKDKN EXCEED AWARD” in Environment – 2018
• Orient Paper mills, Amlai is ISO 9001-2015, ISO 14001-2015, OSHAS 18001-2007,
EnMS 50001-2011 & FSC- COC & CW certified company.
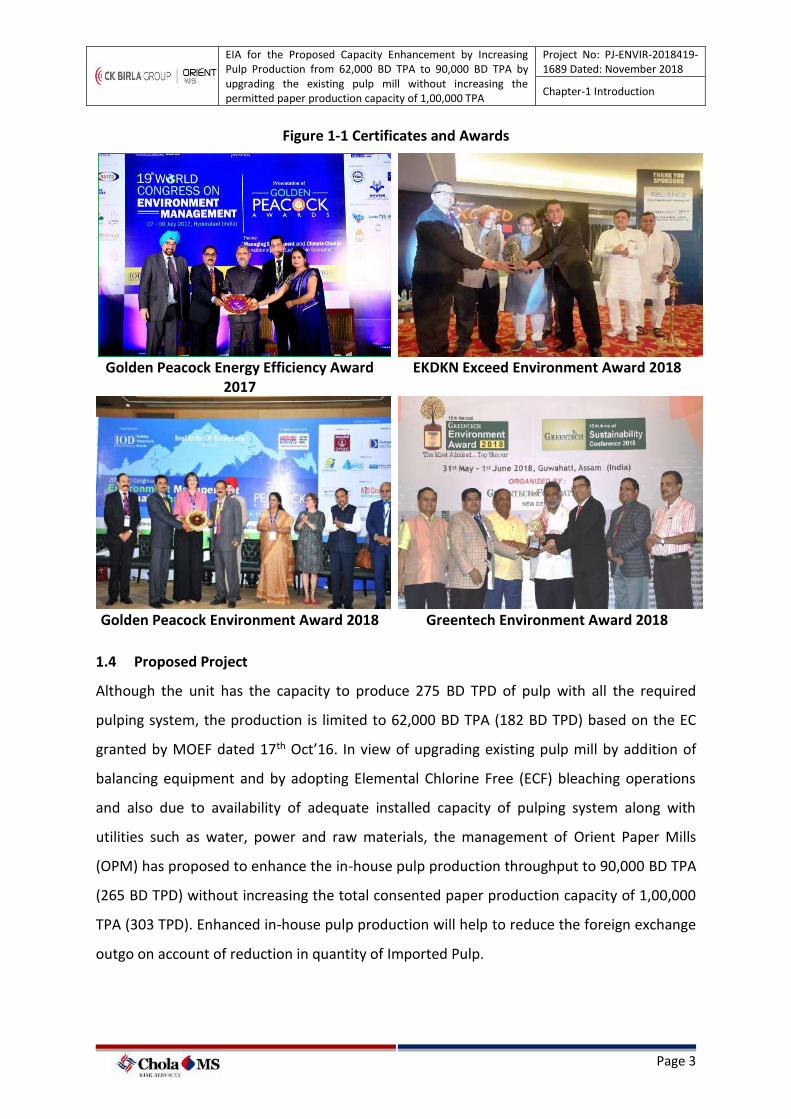
EIA for the Proposed Capacity Enhancement by Increasing Pulp Production from 62,000 BD TPA to 90,000 BD TPA by upgrading the existing pulp mill without increasing the permitted paper production capacity of 1,00,000 TPA
Project No: PJ-ENVIR-2018419-1689 Dated: November 2018
Chapter-1 Introduction
Page 3
Figure 1-1 Certificates and Awards
Golden Peacock Energy Efficiency Award
2017 EKDKN Exceed Environment Award 2018
Golden Peacock Environment Award 2018 Greentech Environment Award 2018
1.4 Proposed Project
Although the unit has the capacity to produce 275 BD TPD of pulp with all the required
pulping system, the production is limited to 62,000 BD TPA (182 BD TPD) based on the EC
granted by MOEF dated 17th Oct’16. In view of upgrading existing pulp mill by addition of
balancing equipment and by adopting Elemental Chlorine Free (ECF) bleaching operations
and also due to availability of adequate installed capacity of pulping system along with
utilities such as water, power and raw materials, the management of Orient Paper Mills
(OPM) has proposed to enhance the in-house pulp production throughput to 90,000 BD TPA
(265 BD TPD) without increasing the total consented paper production capacity of 1,00,000
TPA (303 TPD). Enhanced in-house pulp production will help to reduce the foreign exchange
outgo on account of reduction in quantity of Imported Pulp.
EIA for the Proposed Capacity Enhancement by Increasing Pulp Production from 62,000 BD TPA to 90,000 BD TPA by upgrading the existing pulp mill without increasing the permitted paper production capacity of 1,00,000 TPA
Project No: PJ-ENVIR-2018419-1689 Dated: November 2018
Chapter-1 Introduction
Page 4
The salient features of the proposed project are listed as follows;
• No increase in the total consented paper production of 1,00,000 TPA
• The existing wood chipper and pulp mill have adequate capacities to produce
90,000 BD TPA and hence no additional units will be installed (except for addition
of balancing equipment and adopting Elemental Chlorine Free (ECF) bleaching
operations)
• No additional land is required as the proposed project includes only up-gradation
of existing pulp mill and enhancement of the production of in-house pulp.
• ECF Bleaching technology will be adopted, which will be environmental friendly
option to help reduce the specific water consumption and pollution load
• No increase in freshwater consumption during the post project scenario due to
increase in recycling options and also upgrading the pulp mill to ECF technology
thereby reducing the specific water consumption per tonne of paper production.
1.5 Existing Plant Location
The plant is situated at Village Amlai, Block Burhar, Shahdol Dist in the state of Madhya
Pradesh (Figure 1.2). The plant is adjacent to the National Highway NH 78 and about 26 km
distance from Shahdol and 420 km distance (aerial) from the State Capital Bhopal
respectively. The total extent of the land is 1479 acres and out of the total area of the green
belt and plantations comprise to an extent of 633 acres with well-developed lush green belt
of tall eucalyptus trees, irrigated by the mill’s fully treated effluent.
Amlai is located at North Latitude of 23011’, East Longitude of 81035’ at about 500 m above
MSL. The area is predominantly rural, dotted with coal mines all around with agriculture as
the main activity. There are no ecologically sensitive locations, viz. forests, biosphere
reserves, sanctuaries, national parks, archaeological monuments etc. within 10 Km. area of
the plant site. The area is mountainous with little ground water availability and the irrigation
in the region is mainly rain fed. The location of the existing facility is presented in the
following Figures.1.3 & 1.4.
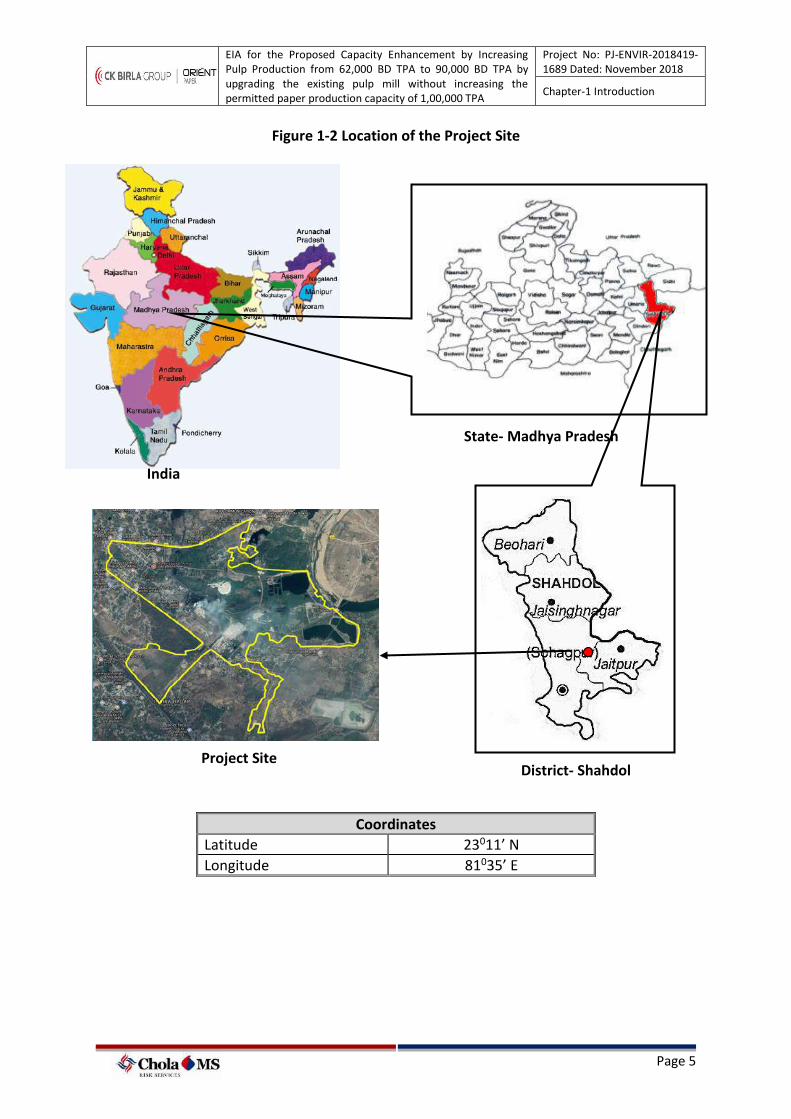
EIA for the Proposed Capacity Enhancement by Increasing Pulp Production from 62,000 BD TPA to 90,000 BD TPA by upgrading the existing pulp mill without increasing the permitted paper production capacity of 1,00,000 TPA
Project No: PJ-ENVIR-2018419-1689 Dated: November 2018
Chapter-1 Introduction
Page 5
Figure 1-2 Location of the Project Site
Coordinates
Latitude 23011’ N
Longitude 81035’ E
India
State- Madhya Pradesh
Project Site District- Shahdol
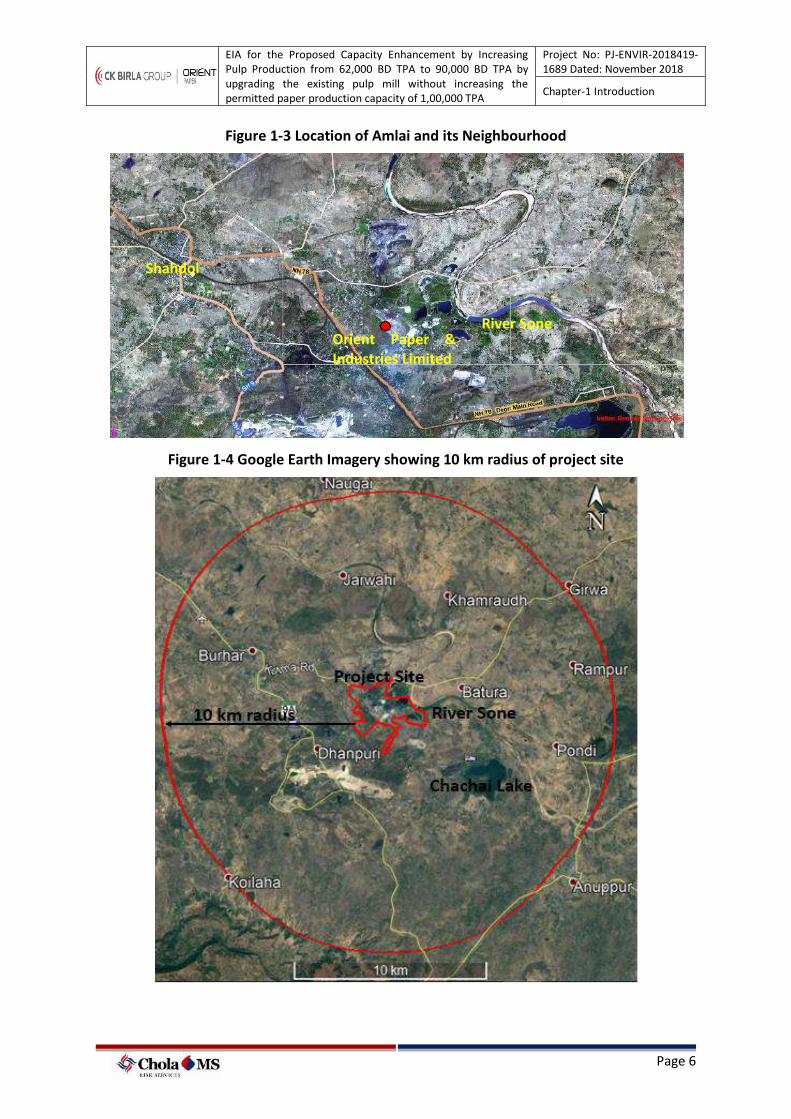
EIA for the Proposed Capacity Enhancement by Increasing Pulp Production from 62,000 BD TPA to 90,000 BD TPA by upgrading the existing pulp mill without increasing the permitted paper production capacity of 1,00,000 TPA
Project No: PJ-ENVIR-2018419-1689 Dated: November 2018
Chapter-1 Introduction
Page 6
Figure 1-3 Location of Amlai and its Neighbourhood
Figure 1-4 Google Earth Imagery showing 10 km radius of project site
Orient Paper & Industries Limited
River Sone
Shahdol
EIA for the Proposed Capacity Enhancement by Increasing Pulp Production from 62,000 BD TPA to 90,000 BD TPA by upgrading the existing pulp mill without increasing the permitted paper production capacity of 1,00,000 TPA
Project No: PJ-ENVIR-2018419-1689 Dated: November 2018
Chapter-1 Introduction
Page 7
1.5.1 Environmental Setting of the Mill
The environmental setting of the project site is presented in the Table 1.1
Table 1-1 Environmental Setting of the Project Site
S.No. Particulars Details
1 Latitude 23011’ N
2 Longitude 81035’ E
3 Site Elevation above MSL 500 m
5 Present land use at the site Industrial
6 Nearest highway National Highway NH 78 adjacent to the project site
7 Nearest railway station Amlai Railway Station-1.8 Km, South Shahdol railway Station- 25.3Km, NW
8 Nearest airport Raipur Airport – 220 Km, S
9 Nearest town / city Town- Dhanpuri-3 Km, SW District- Shahdol-26Km, NW
10 Water body Sone River - 2.3 km, East Chachai Lake - 6.3 Km, SE Semra dam - 8.9 Km, NW
13 Archaeologically important places
Nil in 10 Km radius
14 National parks / Wildlife Sanctuaries
Nil in 10 Km radius
15 Reserved / Protected Forests
Burhar, Maikal, Mauhari Reserved Forests
16 Seismicity Seismic zone-II as per IS-1893 (Part-1) - 2002
17 Defense Installations Nil in 10 Km radius
18 Major Industries Located around the area
Orient Paper Mills – Caustic Soda Unit, Amarkantak Thermal Power Station, Moserbaer Thermal Power plant, Reliance Industries Limited, South Eastern Coalfields Limited
1.6 Need for the EIA study
According to the Environmental Impact Assessment Notification issued by Ministry of
Environment, Forests & Climate Change (MoEF&CC) under Environment Protection Act, pulp
and paper industries (excluding manufacture of paper from waste paper) are required to
obtain environmental clearance for any expansion or modernization.
The proposal is to increase pulp production level from 62,000 BD TPA (182 BD TPD) to
90,000 BD TPA (265 BD TPD) by upgrading the existing pulp mill with addition of balancing
EIA for the Proposed Capacity Enhancement by Increasing Pulp Production from 62,000 BD TPA to 90,000 BD TPA by upgrading the existing pulp mill without increasing the permitted paper production capacity of 1,00,000 TPA
Project No: PJ-ENVIR-2018419-1689 Dated: November 2018
Chapter-1 Introduction
Page 8
equipment and adoption of ECF technology, and the project falls under category “A” under
sector 5(i) of the EIA notification 2006. Since the existing mill site does not fall under any
notified industrial area, public consultation was conducted on 23/10/2018 as per the
Environmental Impact Assessment (EIA) Notification 2006.
1.6.1 Project Appraisal and ToR
The proposed project was appraised by the Expert Appraisal Committee (Industry-I),
Ministry of Environment Forest and Climate change (MoEF&CC) during the 30th Expert
Appraisal Committee meeting held on 9th to 10th April 2018 for obtaining environmental
clearance under 7(ii) of EIA notification. The committee observed that the Environmental
Clearance granted vide F. No. J-11011/1142/2007-IA-II(I), dated 19th March 2008 for
modernization, balancing and expansion of paper mill (85,000 TPA to 1,00,000 TPA) under
the provisions of clause 7(ii) of EIA Notification without conduct of public hearing, Later on
amendment of EC was obtained vide F. No. J-11011/1142/2007-IA-II(I), dated August 18
2008; 10th December 2010; and 17th October 2016. Since the project had not undergone for
public consultation during its life time and also due to the increase pollution load it was
proposed to undergo EIA studies. Therefore, the project was accorded Terms of Reference
(ToR) with Specific ToR vide File no. J-11011/1142/2007-IA-II(I), dated, 17th April 2018 and
the copy of the ToR is enclosed as Annexure.1.
1.7 EIA Study
The EIA study was undertaken in conformity with the guidelines of Ministry of Environment
Forests and Climate Change (MoEF&CC) and Expert Appraisal Committee (EAC), covering all
the aspects of the specific conditions mentioned in the terms of reference issued by
MoEF&CC.
This EIA study was undertaken by M/s Cholamandalam MS Risk Services Limited, a NABET
accredited EIA consultant organisation, with specific project related inputs required for
undertaking the EIA studies. M/s Cholamandalam MS Risk Services Ltd has been accredited
to undertake EIA studies for pulp and paper sector as per the NABET accreditation scheme.
A copy of the latest accreditation status is presented in Annexure 2.
EIA for the Proposed Capacity Enhancement by Increasing Pulp Production from 62,000 BD TPA to 90,000 BD TPA by upgrading the existing pulp mill without increasing the permitted paper production capacity of 1,00,000 TPA
Project No: PJ-ENVIR-2018419-1689 Dated: November 2018
Chapter-1 Introduction
Page 9
1.8 Overview of the Methodology of the EIA Study
This Environmental Impact Assessment (EIA) report has been prepared based on the
methods and guidelines suggested by MoEF&CC to address all the specific conditions
stipulated in the Terms of Reference issued by MoEF&CC, File no. J-11011/1142/2007-IA-
II(I), dated, 17th April 2018. A summary compliance statement to the specific conditions of
the Terms of Reference is presented in Annexure 3.
The EIA study team, headed by an accredited EIA Coordinator, along with the approved
Functional Area Experts & Team members undertook detailed baseline studies as per ToR,
between 16th April 2018 and 17th July 2018.
Micro-meteorological data comprising hourly readings of wind speed, wind direction, dry
bulb temperature, relative humidity and rainfall were measured by installing an onsite
meteorological station. Hourly readings were collected for a period of three (3) months.
Micro-meteorological data was adopted for generating wind-rose diagrams and also to
predict the ground level concentrations due to release of emissions from the proposed
expansion facility.
Ambient Air Quality (AAQ) was measured at eight (8) locations in the study area as per the
methods and procedures recommended by Central Pollution Control Board (CPCB) Air
quality sampling was undertaken for a period of 12 weeks with a total of 24 samples per site
were taken as per the MoEF&CC guidelines. Stipulated criteria pollutants such as particulate
matter size less than 10 microns (PM10), particulate matter size less than 2.5 microns
(PM2.5), Sulphur Dioxide (SOx), Nitrogen Dioxide (NO2), Ammonia (NH3), Ozone (O3), Carbon
Monoxide (CO), Lead (Pb), Nickel (Ni), Arsenic (As), Benzene and Particulate phase Benzo (a)
Pyrene (BaP) were analyzed at all the eight locations. The measured background air quality
data was compared with that of the prevailing National Ambient Air Quality Standards and
this will also form the basis for predicting the cumulative air quality scenario due to the
operation of the expansion facility.
Hydro-geological studies were undertaken during the study period. Data on sub-surface soil
profile in the study area was obtained. In addition, a preliminary study on the regional and
local aquifer status was studied based on primary and secondary published long-term data.
EIA for the Proposed Capacity Enhancement by Increasing Pulp Production from 62,000 BD TPA to 90,000 BD TPA by upgrading the existing pulp mill without increasing the permitted paper production capacity of 1,00,000 TPA
Project No: PJ-ENVIR-2018419-1689 Dated: November 2018
Chapter-1 Introduction
Page 10
Ground water samples from eight (8) locations were analysed as per the terms of reference
for all the designated parameters. The measured values were compared with drinking water
standards. Secondary data on the regional ground water status was also collected from the
Central Ground Water Board and the State Ground Water Board.
All seasonal streams and rivers located within the study area were mapped through latest
remote sensing data under land use and land cover study. Walkthrough surveys were
undertaken to assess the current status of the water resources. Details about the major
cropping pattern and irrigation methods etc. were collected from local village offices and
also published district census data. Surface water quality samples at upstream downstream
of River Sone were also collected and analyzed for designated physiochemical, elemental
and biological parameters.
Land use and land cover was mapped using remote satellite imagery, IRS-P6, LISS III satellite.
The data was processed using applicable software models and level 1 land use classification
within the study area was developed and level 2 land use classification within the study area
was developed. Digital Elevation Model of the study area was developed to assess the
terrain conditions and also possible flooding scenarios
A walkthrough survey was also undertaken in the study area, major settlements and
plantation areas to verify the land use as a part of the ground truth survey procedures. Soil
samples were collected as per the terms of reference and all relevant parameters such as
texture, nutrients, heavy metals, oil and grease and other parameters were analyzed in the
soil samples.
Ecological & Biological survey was undertaken in the study area and all spotted ecological
and biological aspects were mapped based on grid sampling method. Bio-diversity density
and abundance were estimated. Walkthrough surveys were conducted in the study area to
assess the ecology.
Primary socio-economic survey was undertaken in the study area to capture the
socioeconomic conditions, major occupation of the people, drinking water and sanitation
facilities, transportation and other amenities in the study area, with a specific reference to
the villages located within five (5) km radius of the existing project site.

EIA for the Proposed Capacity Enhancement by Increasing Pulp Production from 62,000 BD TPA to 90,000 BD TPA by upgrading the existing pulp mill without increasing the permitted paper production capacity of 1,00,000 TPA
Project No: PJ-ENVIR-2018419-1689 Dated: November 2018
Chapter-1 Introduction
Page 11
In addition to the above, district level census data published by National Informatics Centre
(NIC) was also collected from 10 km radius study area for a detailed analysis on the socio-
economic aspects. Based on the socio-economic survey, a need-based Community
Development Plan under Corporate Environment Responsibility (CER) was suggested as per
the recent MoEF&CC Office Memorandum dated 1st May 2018. Since, existing mill premises
will be used for the proposed installation no land acquisition involved, detailed
Rehabilitation and Resettlement studies are not envisaged under this study; however, the
indirect impacts on the local and regional community due to the proposed expansion
project were studied.
A detailed review on the process and material balance of the proposed operations were
undertaken. Water balance diagrams were developed as per the terms of reference issued
for the project. In addition, a detailed review on the process technology, material balance,
source of raw materials, fuels etc were also studied.
As a part of the environmental impact assessment study, an attempt was made to predict
the possible and likely impacts on background environment. No additional coal consumption
is envisaged beyond the existing levels and hence no additional emissions from the Captive
Power Plant will be envisaged. The additional steam required for increased pulp production
will be generated by firing of additional solids (Black liquor) generated from the pulp mill
and hence no additional boilers are proposed. Therefore, there will not any increase in
pollution load from the existing scenario.
No additional noise generating units will be installed during the post project scenario. The
total fresh water consumption will be reduced from the existing consumption due to
increase in recycling options. There will be reduction in wastewater generation from main
plant (pulp mill and paper mill) during the post project scenario. No treated wastewater will
be discharged into nearby water bodies and thus zero liquid discharge to river will be
adopted. No additional solid or hazardous waste generation is envisaged due to the
proposed project.
An outline of the proposed environmental management systems, environmental cell and
environmental monitoring programme were also presented in this report.
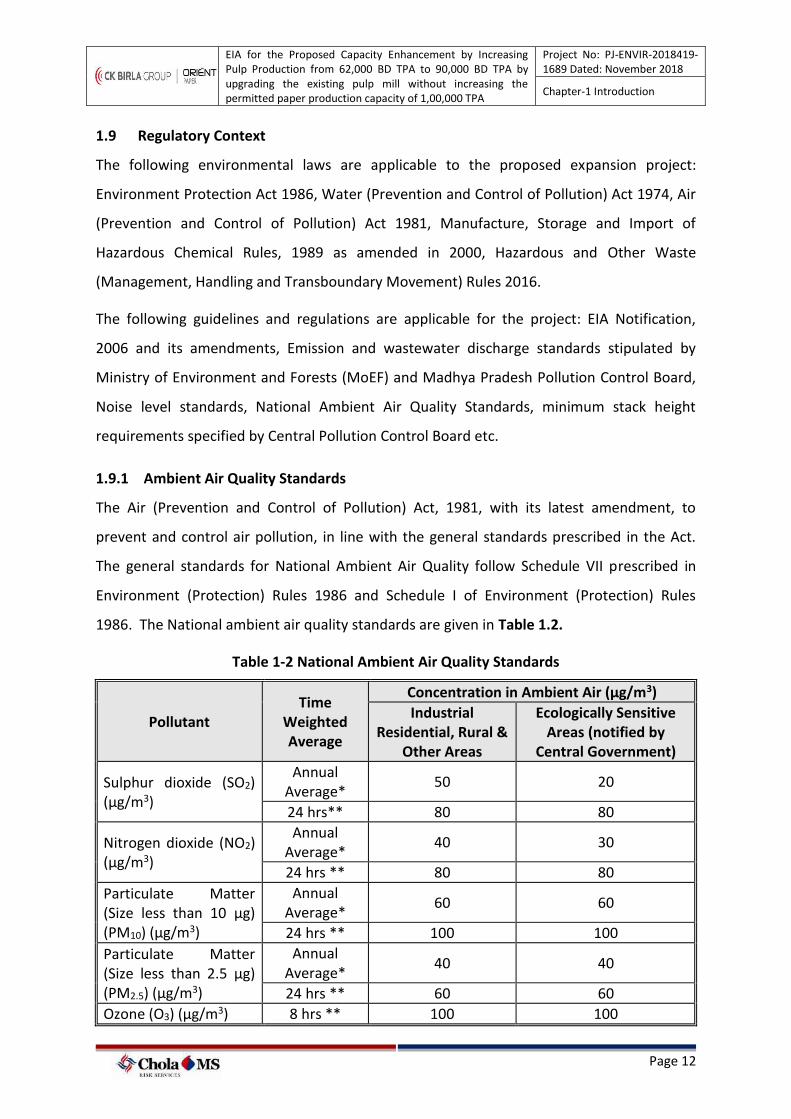
EIA for the Proposed Capacity Enhancement by Increasing Pulp Production from 62,000 BD TPA to 90,000 BD TPA by upgrading the existing pulp mill without increasing the permitted paper production capacity of 1,00,000 TPA
Project No: PJ-ENVIR-2018419-1689 Dated: November 2018
Chapter-1 Introduction
Page 12
1.9 Regulatory Context
The following environmental laws are applicable to the proposed expansion project:
Environment Protection Act 1986, Water (Prevention and Control of Pollution) Act 1974, Air
(Prevention and Control of Pollution) Act 1981, Manufacture, Storage and Import of
Hazardous Chemical Rules, 1989 as amended in 2000, Hazardous and Other Waste
(Management, Handling and Transboundary Movement) Rules 2016.
The following guidelines and regulations are applicable for the project: EIA Notification,
2006 and its amendments, Emission and wastewater discharge standards stipulated by
Ministry of Environment and Forests (MoEF) and Madhya Pradesh Pollution Control Board,
Noise level standards, National Ambient Air Quality Standards, minimum stack height
requirements specified by Central Pollution Control Board etc.
1.9.1 Ambient Air Quality Standards
The Air (Prevention and Control of Pollution) Act, 1981, with its latest amendment, to
prevent and control air pollution, in line with the general standards prescribed in the Act.
The general standards for National Ambient Air Quality follow Schedule VII prescribed in
Environment (Protection) Rules 1986 and Schedule I of Environment (Protection) Rules
1986. The National ambient air quality standards are given in Table 1.2.
Table 1-2 National Ambient Air Quality Standards
Pollutant Time
Weighted Average
Concentration in Ambient Air (µg/m3)
Industrial Residential, Rural &
Other Areas
Ecologically Sensitive Areas (notified by
Central Government)
Sulphur dioxide (SO2) (µg/m3)
Annual Average*
50 20
24 hrs** 80 80
Nitrogen dioxide (NO2) (µg/m3)
Annual Average*
40 30
24 hrs ** 80 80
Particulate Matter (Size less than 10 µg) (PM10) (µg/m3)
Annual Average*
60 60
24 hrs ** 100 100
Particulate Matter (Size less than 2.5 µg) (PM2.5) (µg/m3)
Annual Average*
40 40
24 hrs ** 60 60
Ozone (O3) (µg/m3) 8 hrs ** 100 100
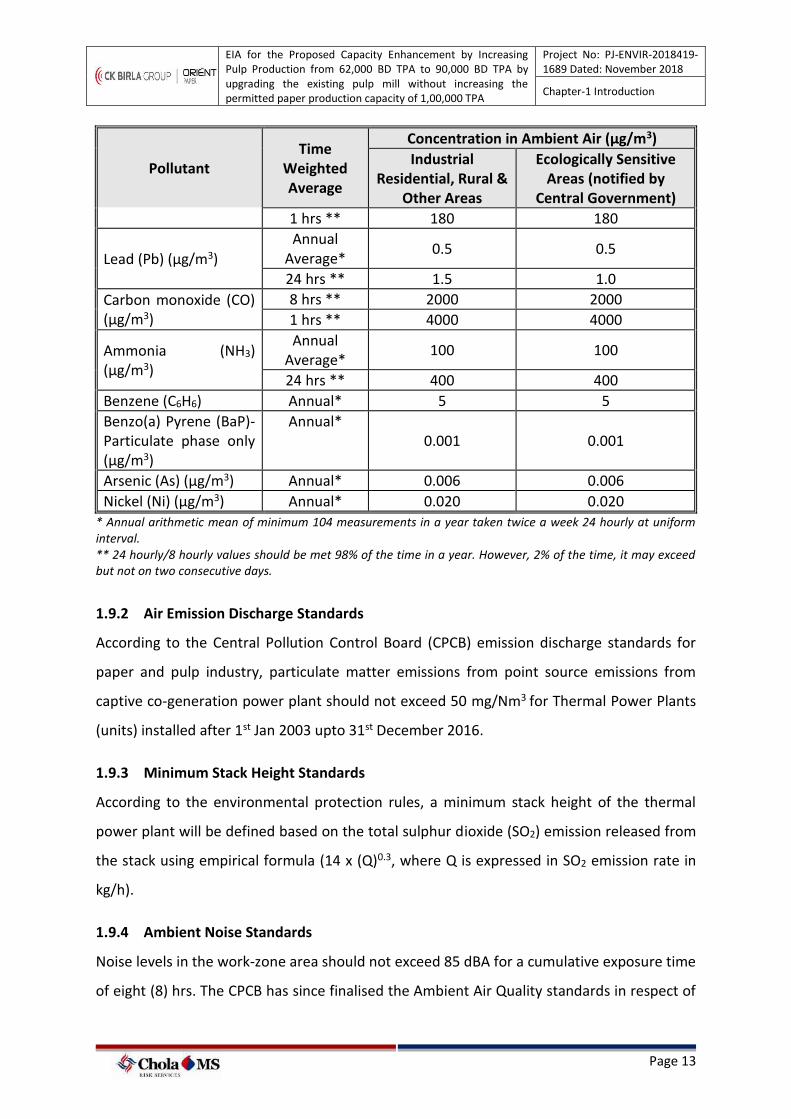
EIA for the Proposed Capacity Enhancement by Increasing Pulp Production from 62,000 BD TPA to 90,000 BD TPA by upgrading the existing pulp mill without increasing the permitted paper production capacity of 1,00,000 TPA
Project No: PJ-ENVIR-2018419-1689 Dated: November 2018
Chapter-1 Introduction
Page 13
Pollutant Time
Weighted Average
Concentration in Ambient Air (µg/m3)
Industrial Residential, Rural &
Other Areas
Ecologically Sensitive Areas (notified by
Central Government)
1 hrs ** 180 180
Lead (Pb) (µg/m3)
Annual Average*
0.5 0.5
24 hrs ** 1.5 1.0
Carbon monoxide (CO) (µg/m3)
8 hrs ** 2000 2000
1 hrs ** 4000 4000
Ammonia (NH3) (µg/m3)
Annual Average*
100 100
24 hrs ** 400 400
Benzene (C6H6) Annual* 5 5
Benzo(a) Pyrene (BaP)- Particulate phase only (µg/m3)
Annual* 0.001 0.001
Arsenic (As) (µg/m3) Annual* 0.006 0.006
Nickel (Ni) (µg/m3) Annual* 0.020 0.020 * Annual arithmetic mean of minimum 104 measurements in a year taken twice a week 24 hourly at uniform interval. ** 24 hourly/8 hourly values should be met 98% of the time in a year. However, 2% of the time, it may exceed but not on two consecutive days.
1.9.2 Air Emission Discharge Standards
According to the Central Pollution Control Board (CPCB) emission discharge standards for
paper and pulp industry, particulate matter emissions from point source emissions from
captive co-generation power plant should not exceed 50 mg/Nm3 for Thermal Power Plants
(units) installed after 1st Jan 2003 upto 31st December 2016.
1.9.3 Minimum Stack Height Standards
According to the environmental protection rules, a minimum stack height of the thermal
power plant will be defined based on the total sulphur dioxide (SO2) emission released from
the stack using empirical formula (14 x (Q)0.3, where Q is expressed in SO2 emission rate in
kg/h).
1.9.4 Ambient Noise Standards
Noise levels in the work-zone area should not exceed 85 dBA for a cumulative exposure time
of eight (8) hrs. The CPCB has since finalised the Ambient Air Quality standards in respect of
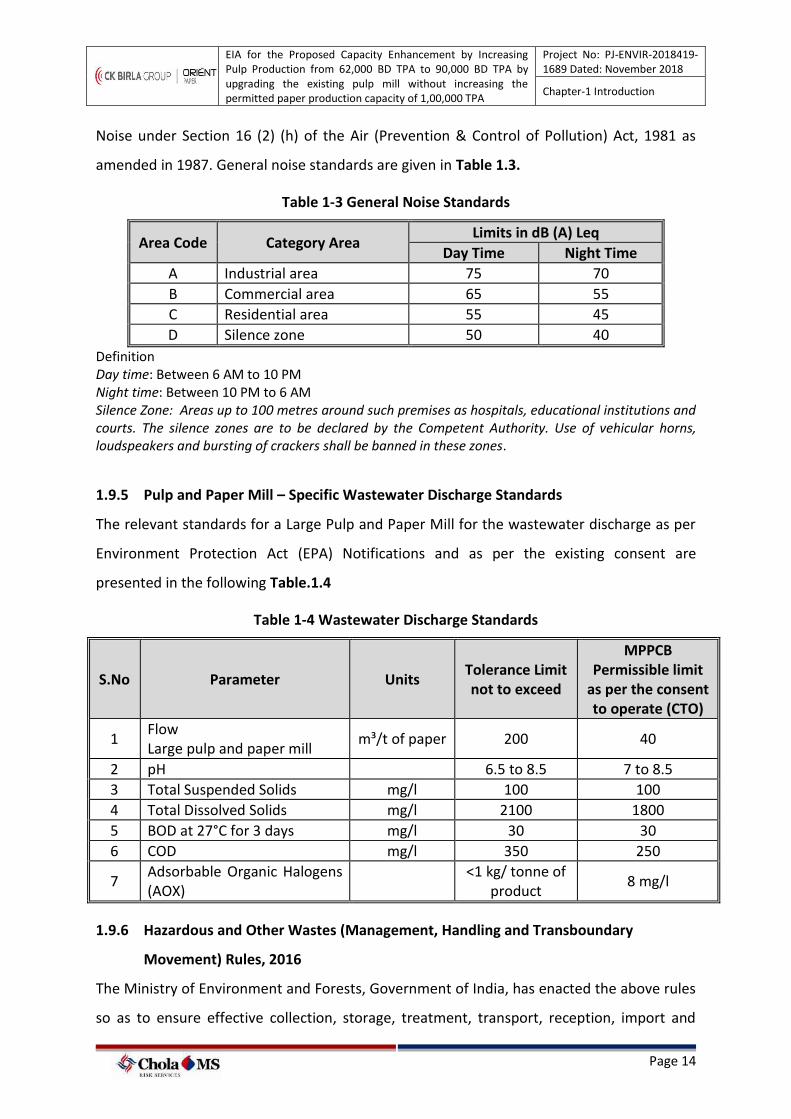
EIA for the Proposed Capacity Enhancement by Increasing Pulp Production from 62,000 BD TPA to 90,000 BD TPA by upgrading the existing pulp mill without increasing the permitted paper production capacity of 1,00,000 TPA
Project No: PJ-ENVIR-2018419-1689 Dated: November 2018
Chapter-1 Introduction
Page 14
Noise under Section 16 (2) (h) of the Air (Prevention & Control of Pollution) Act, 1981 as
amended in 1987. General noise standards are given in Table 1.3.
Table 1-3 General Noise Standards
Area Code Category Area Limits in dB (A) Leq
Day Time Night Time
A Industrial area 75 70
B Commercial area 65 55
C Residential area 55 45
D Silence zone 50 40
Definition Day time: Between 6 AM to 10 PM Night time: Between 10 PM to 6 AM Silence Zone: Areas up to 100 metres around such premises as hospitals, educational institutions and courts. The silence zones are to be declared by the Competent Authority. Use of vehicular horns, loudspeakers and bursting of crackers shall be banned in these zones.
1.9.5 Pulp and Paper Mill – Specific Wastewater Discharge Standards
The relevant standards for a Large Pulp and Paper Mill for the wastewater discharge as per
Environment Protection Act (EPA) Notifications and as per the existing consent are
presented in the following Table.1.4
Table 1-4 Wastewater Discharge Standards
S.No Parameter Units Tolerance Limit not to exceed
MPPCB Permissible limit
as per the consent to operate (CTO)
1 Flow Large pulp and paper mill
m³/t of paper 200 40
2 pH 6.5 to 8.5 7 to 8.5
3 Total Suspended Solids mg/l 100 100
4 Total Dissolved Solids mg/l 2100 1800
5 BOD at 27°C for 3 days mg/l 30 30
6 COD mg/l 350 250
7 Adsorbable Organic Halogens (AOX)
<1 kg/ tonne of product
8 mg/l
1.9.6 Hazardous and Other Wastes (Management, Handling and Transboundary
Movement) Rules, 2016
The Ministry of Environment and Forests, Government of India, has enacted the above rules
so as to ensure effective collection, storage, treatment, transport, reception, import and
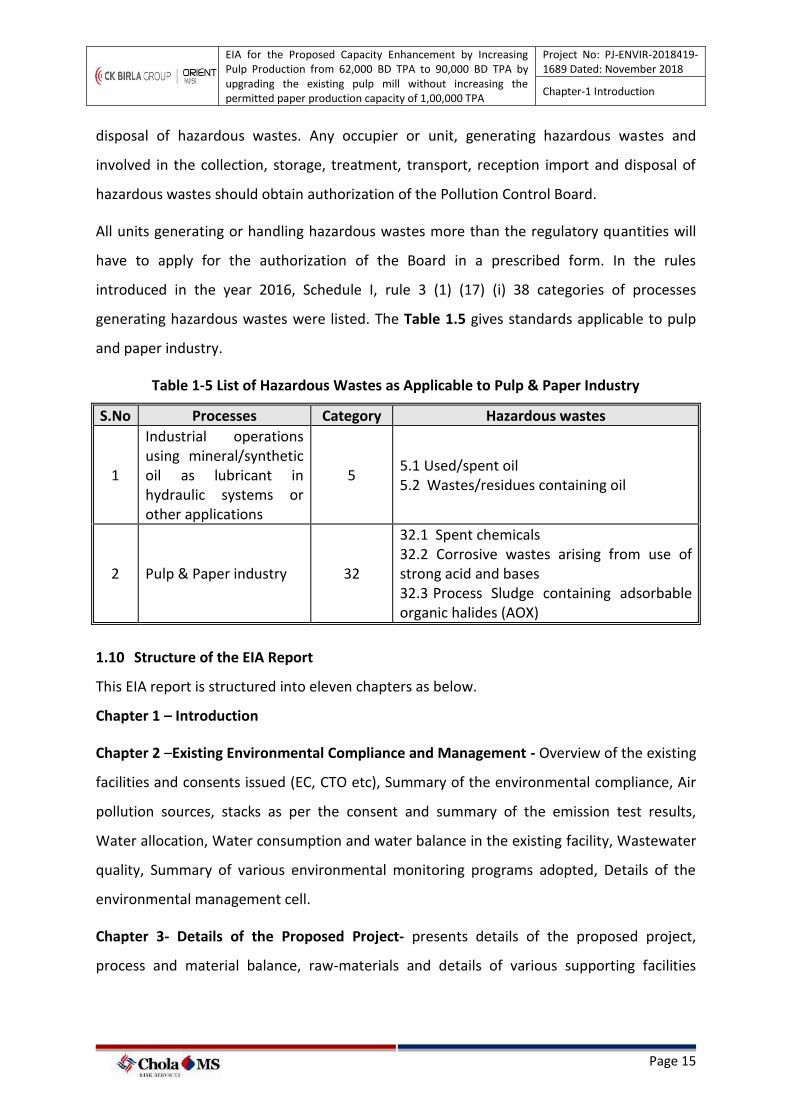
EIA for the Proposed Capacity Enhancement by Increasing Pulp Production from 62,000 BD TPA to 90,000 BD TPA by upgrading the existing pulp mill without increasing the permitted paper production capacity of 1,00,000 TPA
Project No: PJ-ENVIR-2018419-1689 Dated: November 2018
Chapter-1 Introduction
Page 15
disposal of hazardous wastes. Any occupier or unit, generating hazardous wastes and
involved in the collection, storage, treatment, transport, reception import and disposal of
hazardous wastes should obtain authorization of the Pollution Control Board.
All units generating or handling hazardous wastes more than the regulatory quantities will
have to apply for the authorization of the Board in a prescribed form. In the rules
introduced in the year 2016, Schedule I, rule 3 (1) (17) (i) 38 categories of processes
generating hazardous wastes were listed. The Table 1.5 gives standards applicable to pulp
and paper industry.
Table 1-5 List of Hazardous Wastes as Applicable to Pulp & Paper Industry
S.No Processes Category Hazardous wastes
1
Industrial operations using mineral/synthetic oil as lubricant in hydraulic systems or other applications
5 5.1 Used/spent oil 5.2 Wastes/residues containing oil
2 Pulp & Paper industry 32
32.1 Spent chemicals 32.2 Corrosive wastes arising from use of strong acid and bases 32.3 Process Sludge containing adsorbable organic halides (AOX)
1.10 Structure of the EIA Report
This EIA report is structured into eleven chapters as below.
Chapter 1 – Introduction
Chapter 2 –Existing Environmental Compliance and Management - Overview of the existing
facilities and consents issued (EC, CTO etc), Summary of the environmental compliance, Air
pollution sources, stacks as per the consent and summary of the emission test results,
Water allocation, Water consumption and water balance in the existing facility, Wastewater
quality, Summary of various environmental monitoring programs adopted, Details of the
environmental management cell.
Chapter 3- Details of the Proposed Project- presents details of the proposed project,
process and material balance, raw-materials and details of various supporting facilities
EIA for the Proposed Capacity Enhancement by Increasing Pulp Production from 62,000 BD TPA to 90,000 BD TPA by upgrading the existing pulp mill without increasing the permitted paper production capacity of 1,00,000 TPA
Project No: PJ-ENVIR-2018419-1689 Dated: November 2018
Chapter-1 Introduction
Page 16
required for the project, and an outline of the project cost and project implementation
schedules.
Chapter 4 - (Baseline Environmental Status) presents a comprehensive description of the
baseline environmental conditions of the study area. This includes the data obtained from
primary surveys and also secondary published data from various authentic sources. All the
specified environmental components such as meteorological data, air quality, noise levels,
surface and ground water resources, surface and ground water quality, geological and
mineralogical features, soil quality, land use and land cover in the study area, cropping
pattern, ecological and biological environmental conditions and socioeconomic and cultural
aspects of the Mill site. All the relevant aspects as mentioned in the Terms of Reference
(ToR) were thoroughly addressed.
Chapter 5 – (Prediction of Environmental Impacts and Mitigation Measures) presents the
environmental aspects associated with the proposed project, envisaged emissions and
discharges from the facility, an overview of various pollution control systems proposed
under project planning activities in the detailed project report and construction and
operational phase environmental impacts.
Chapter 6 – (Analysis of Alternatives) Description of any alternatives considered for the
project.
Chapter 7 – (Environmental Monitoring Plan) presents monitoring plan which include
measurement methodologies, frequency, location, data analysis, reporting schedules,
emergency procedures.
Chapter 8 – (Additional Studies) presents details of the public hearing and an overview of
risk mitigation plan and various occupational health programmes adopted by OPM at its
existing facilities
Chapter 9 – (Project Benefits) presents the benefits of the project.
Chapter 10– (Environmental Management Plan EMP) presents the administrative aspects
of OPM ensuring that mitigation measures are implemented and their effectiveness
monitored, after approval of the EIA.

EIA for the Proposed Capacity Enhancement by Increasing Pulp Production from 62,000 BD TPA to 90,000 BD TPA by upgrading the existing pulp mill without increasing the permitted paper production capacity of 1,00,000 TPA
Project No: PJ-ENVIR-2018419-1689 Dated: November 2018
Chapter-1 Introduction
Page 17
Chapter 11– (Summary and Conclusion) presents the summary and Conclusion of EIA
report.
Chapter 12– (Disclosure of Consultant) presents the declaration by the EIA consultant
organization as per the NABET requirements.
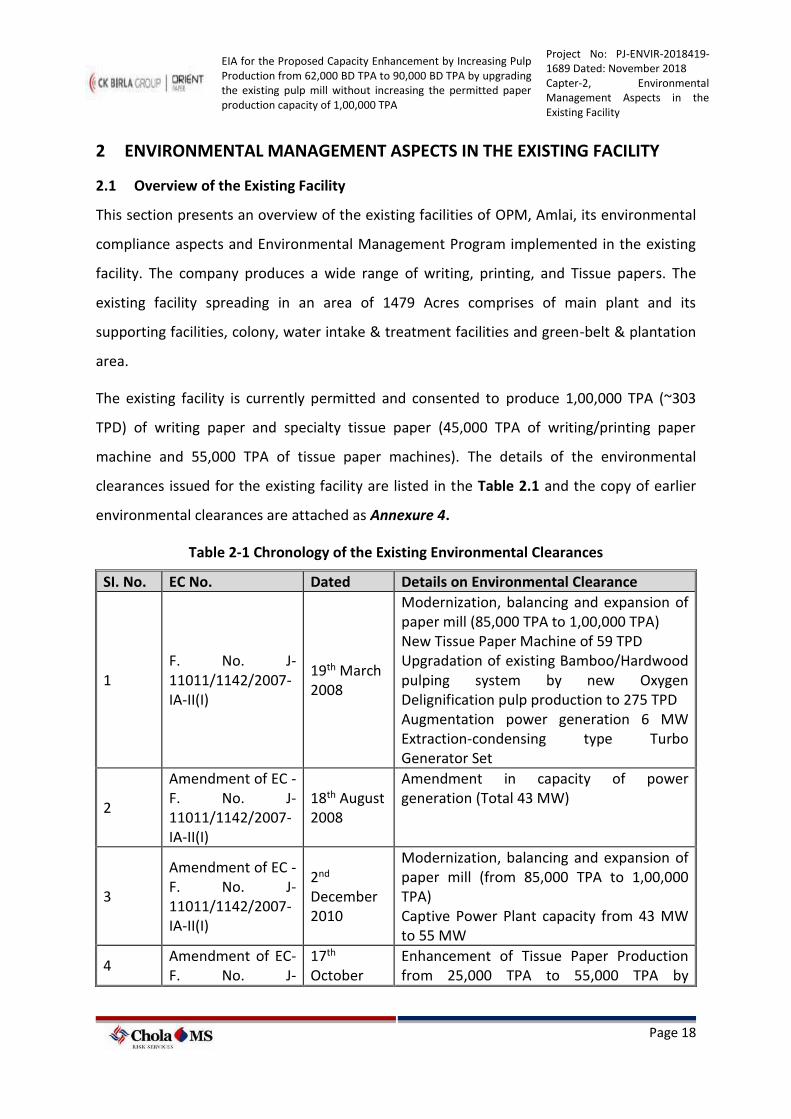
EIA for the Proposed Capacity Enhancement by Increasing Pulp Production from 62,000 BD TPA to 90,000 BD TPA by upgrading the existing pulp mill without increasing the permitted paper production capacity of 1,00,000 TPA
Project No: PJ-ENVIR-2018419-1689 Dated: November 2018 Capter-2, Environmental Management Aspects in the Existing Facility
Page 18
2 ENVIRONMENTAL MANAGEMENT ASPECTS IN THE EXISTING FACILITY
2.1 Overview of the Existing Facility
This section presents an overview of the existing facilities of OPM, Amlai, its environmental
compliance aspects and Environmental Management Program implemented in the existing
facility. The company produces a wide range of writing, printing, and Tissue papers. The
existing facility spreading in an area of 1479 Acres comprises of main plant and its
supporting facilities, colony, water intake & treatment facilities and green-belt & plantation
area.
The existing facility is currently permitted and consented to produce 1,00,000 TPA (~303
TPD) of writing paper and specialty tissue paper (45,000 TPA of writing/printing paper
machine and 55,000 TPA of tissue paper machines). The details of the environmental
clearances issued for the existing facility are listed in the Table 2.1 and the copy of earlier
environmental clearances are attached as Annexure 4.
Table 2-1 Chronology of the Existing Environmental Clearances
SI. No. EC No. Dated Details on Environmental Clearance
1 F. No. J-11011/1142/2007-IA-II(I)
19th March 2008
Modernization, balancing and expansion of paper mill (85,000 TPA to 1,00,000 TPA) New Tissue Paper Machine of 59 TPD Upgradation of existing Bamboo/Hardwood pulping system by new Oxygen Delignification pulp production to 275 TPD Augmentation power generation 6 MW Extraction-condensing type Turbo Generator Set
2
Amendment of EC -F. No. J-11011/1142/2007-IA-II(I)
18th August 2008
Amendment in capacity of power generation (Total 43 MW)
3
Amendment of EC -F. No. J-11011/1142/2007-IA-II(I)
2nd December 2010
Modernization, balancing and expansion of paper mill (from 85,000 TPA to 1,00,000 TPA) Captive Power Plant capacity from 43 MW to 55 MW
4 Amendment of EC- F. No. J-
17th October
Enhancement of Tissue Paper Production from 25,000 TPA to 55,000 TPA by
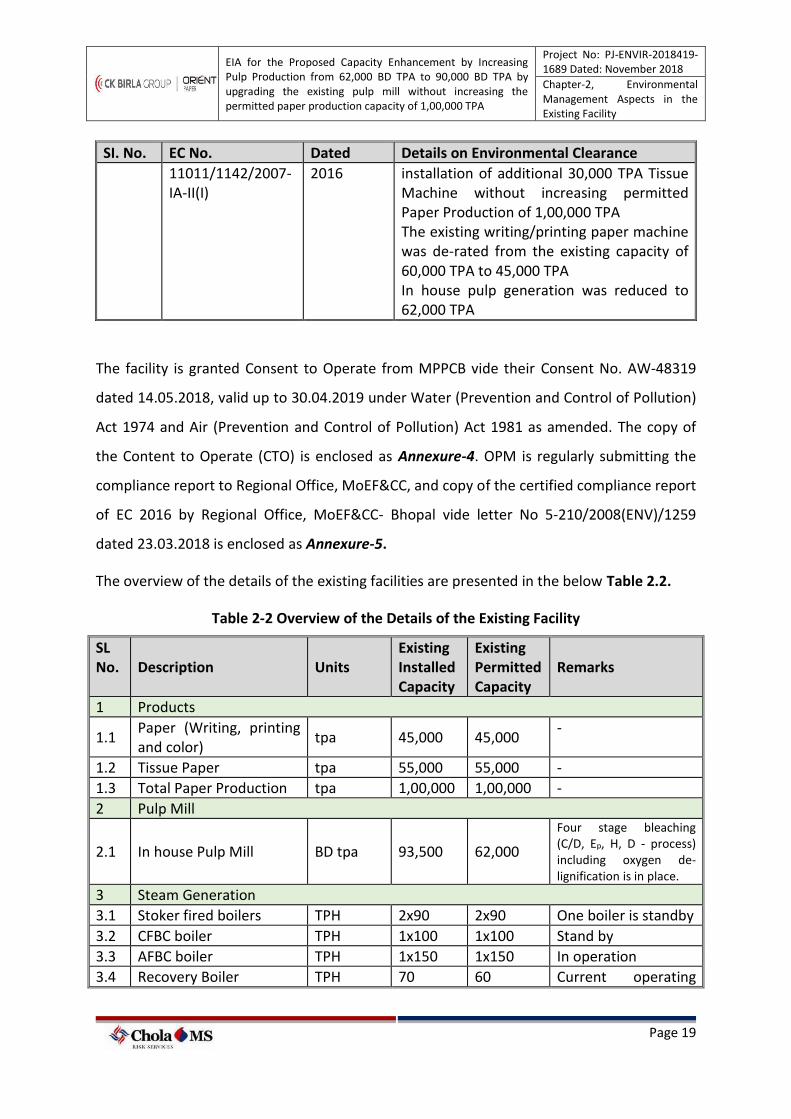
EIA for the Proposed Capacity Enhancement by Increasing Pulp Production from 62,000 BD TPA to 90,000 BD TPA by upgrading the existing pulp mill without increasing the permitted paper production capacity of 1,00,000 TPA
Project No: PJ-ENVIR-2018419-1689 Dated: November 2018
Chapter-2, Environmental Management Aspects in the Existing Facility
Page 19
SI. No. EC No. Dated Details on Environmental Clearance
11011/1142/2007-IA-II(I)
2016 installation of additional 30,000 TPA Tissue Machine without increasing permitted Paper Production of 1,00,000 TPA The existing writing/printing paper machine was de-rated from the existing capacity of 60,000 TPA to 45,000 TPA In house pulp generation was reduced to 62,000 TPA
The facility is granted Consent to Operate from MPPCB vide their Consent No. AW-48319
dated 14.05.2018, valid up to 30.04.2019 under Water (Prevention and Control of Pollution)
Act 1974 and Air (Prevention and Control of Pollution) Act 1981 as amended. The copy of
the Content to Operate (CTO) is enclosed as Annexure-4. OPM is regularly submitting the
compliance report to Regional Office, MoEF&CC, and copy of the certified compliance report
of EC 2016 by Regional Office, MoEF&CC- Bhopal vide letter No 5-210/2008(ENV)/1259
dated 23.03.2018 is enclosed as Annexure-5.
The overview of the details of the existing facilities are presented in the below Table 2.2.
Table 2-2 Overview of the Details of the Existing Facility
SL No. Description Units
Existing Installed Capacity
Existing Permitted Capacity
Remarks
1 Products
1.1 Paper (Writing, printing and color)
tpa 45,000 45,000 -
1.2 Tissue Paper tpa 55,000 55,000 -
1.3 Total Paper Production tpa 1,00,000 1,00,000 -
2 Pulp Mill
2.1 In house Pulp Mill BD tpa 93,500 62,000
Four stage bleaching (C/D, Ep, H, D - process) including oxygen de-lignification is in place.
3 Steam Generation
3.1 Stoker fired boilers TPH 2x90 2x90 One boiler is standby
3.2 CFBC boiler TPH 1x100 1x100 Stand by
3.3 AFBC boiler TPH 1x150 1x150 In operation
3.4 Recovery Boiler TPH 70 60 Current operating
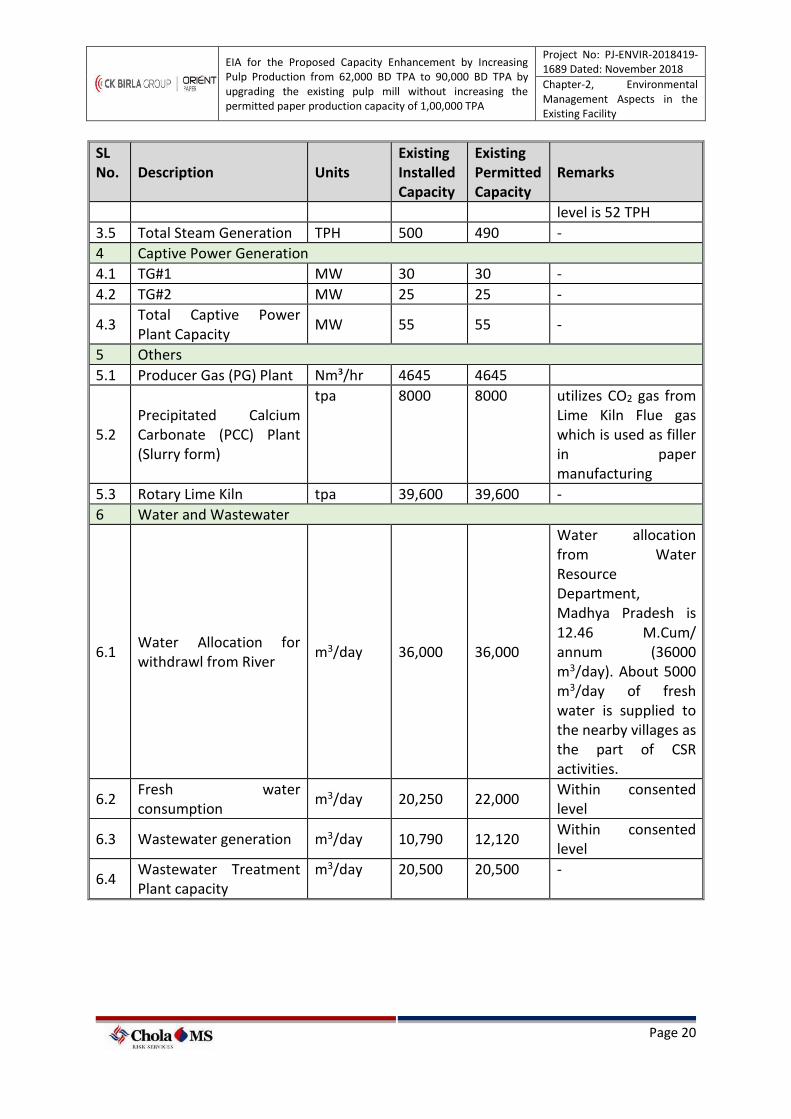
EIA for the Proposed Capacity Enhancement by Increasing Pulp Production from 62,000 BD TPA to 90,000 BD TPA by upgrading the existing pulp mill without increasing the permitted paper production capacity of 1,00,000 TPA
Project No: PJ-ENVIR-2018419-1689 Dated: November 2018
Chapter-2, Environmental Management Aspects in the Existing Facility
Page 20
SL No. Description Units
Existing Installed Capacity
Existing Permitted Capacity
Remarks
level is 52 TPH
3.5 Total Steam Generation TPH 500 490 -
4 Captive Power Generation
4.1 TG#1 MW 30 30 -
4.2 TG#2 MW 25 25 -
4.3 Total Captive Power Plant Capacity
MW 55 55 -
5 Others
5.1 Producer Gas (PG) Plant Nm³/hr 4645 4645
5.2 Precipitated Calcium Carbonate (PCC) Plant (Slurry form)
tpa 8000 8000 utilizes CO2 gas from Lime Kiln Flue gas which is used as filler in paper manufacturing
5.3 Rotary Lime Kiln tpa 39,600 39,600 -
6 Water and Wastewater
6.1 Water Allocation for withdrawl from River
m3/day 36,000 36,000
Water allocation from Water Resource Department, Madhya Pradesh is 12.46 M.Cum/ annum (36000 m3/day). About 5000 m3/day of fresh water is supplied to the nearby villages as the part of CSR activities.
6.2 Fresh water consumption
m3/day 20,250 22,000 Within consented level
6.3 Wastewater generation m3/day 10,790 12,120 Within consented level
6.4 Wastewater Treatment Plant capacity
m3/day 20,500 20,500 -
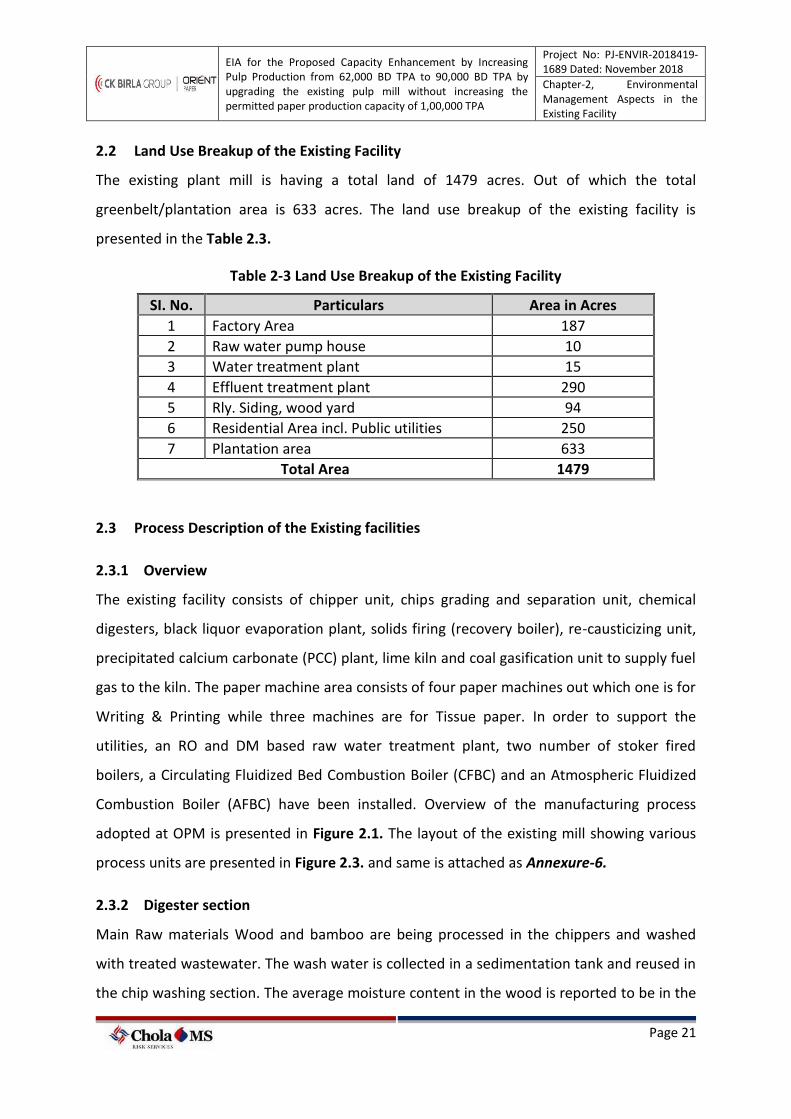
EIA for the Proposed Capacity Enhancement by Increasing Pulp Production from 62,000 BD TPA to 90,000 BD TPA by upgrading the existing pulp mill without increasing the permitted paper production capacity of 1,00,000 TPA
Project No: PJ-ENVIR-2018419-1689 Dated: November 2018
Chapter-2, Environmental Management Aspects in the Existing Facility
Page 21
2.2 Land Use Breakup of the Existing Facility
The existing plant mill is having a total land of 1479 acres. Out of which the total
greenbelt/plantation area is 633 acres. The land use breakup of the existing facility is
presented in the Table 2.3.
Table 2-3 Land Use Breakup of the Existing Facility
SI. No. Particulars Area in Acres
1 Factory Area 187
2 Raw water pump house 10
3 Water treatment plant 15
4 Effluent treatment plant 290
5 Rly. Siding, wood yard 94
6 Residential Area incl. Public utilities 250
7 Plantation area 633
Total Area 1479
2.3 Process Description of the Existing facilities
2.3.1 Overview
The existing facility consists of chipper unit, chips grading and separation unit, chemical
digesters, black liquor evaporation plant, solids firing (recovery boiler), re-causticizing unit,
precipitated calcium carbonate (PCC) plant, lime kiln and coal gasification unit to supply fuel
gas to the kiln. The paper machine area consists of four paper machines out which one is for
Writing & Printing while three machines are for Tissue paper. In order to support the
utilities, an RO and DM based raw water treatment plant, two number of stoker fired
boilers, a Circulating Fluidized Bed Combustion Boiler (CFBC) and an Atmospheric Fluidized
Combustion Boiler (AFBC) have been installed. Overview of the manufacturing process
adopted at OPM is presented in Figure 2.1. The layout of the existing mill showing various
process units are presented in Figure 2.3. and same is attached as Annexure-6.
2.3.2 Digester section
Main Raw materials Wood and bamboo are being processed in the chippers and washed
with treated wastewater. The wash water is collected in a sedimentation tank and reused in
the chip washing section. The average moisture content in the wood is reported to be in the
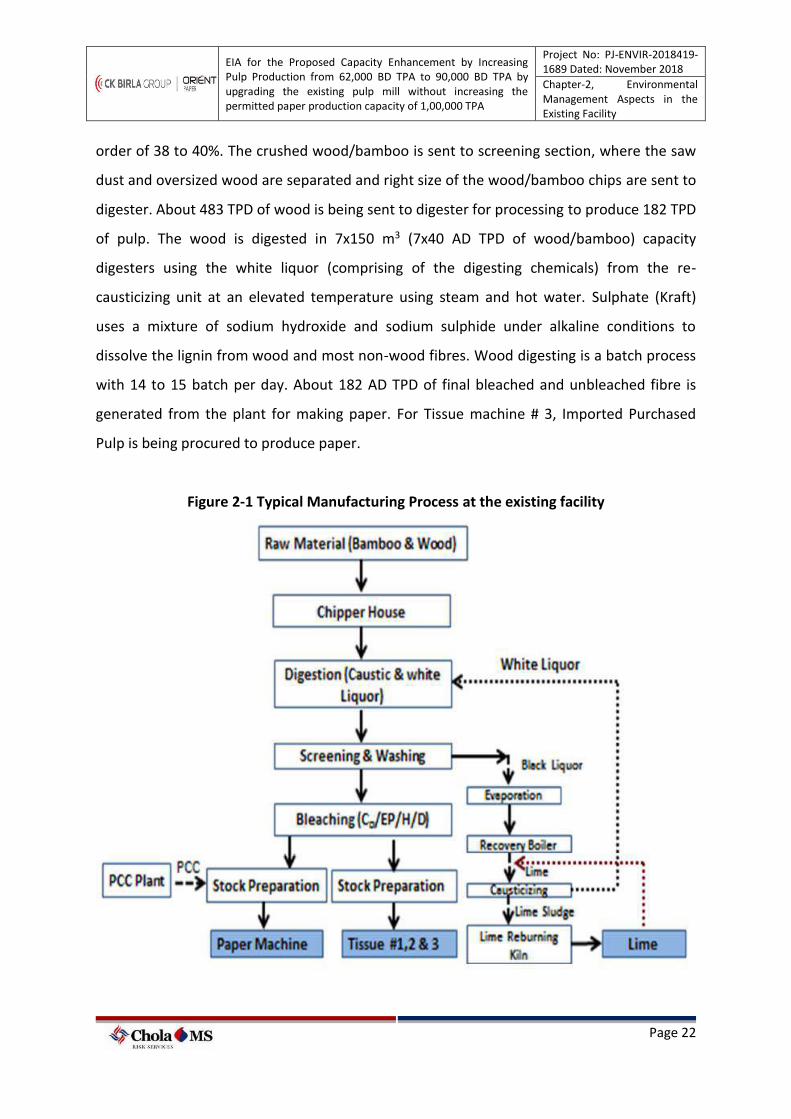
EIA for the Proposed Capacity Enhancement by Increasing Pulp Production from 62,000 BD TPA to 90,000 BD TPA by upgrading the existing pulp mill without increasing the permitted paper production capacity of 1,00,000 TPA
Project No: PJ-ENVIR-2018419-1689 Dated: November 2018
Chapter-2, Environmental Management Aspects in the Existing Facility
Page 22
order of 38 to 40%. The crushed wood/bamboo is sent to screening section, where the saw
dust and oversized wood are separated and right size of the wood/bamboo chips are sent to
digester. About 483 TPD of wood is being sent to digester for processing to produce 182 TPD
of pulp. The wood is digested in 7x150 m3 (7x40 AD TPD of wood/bamboo) capacity
digesters using the white liquor (comprising of the digesting chemicals) from the re-
causticizing unit at an elevated temperature using steam and hot water. Sulphate (Kraft)
uses a mixture of sodium hydroxide and sodium sulphide under alkaline conditions to
dissolve the lignin from wood and most non-wood fibres. Wood digesting is a batch process
with 14 to 15 batch per day. About 182 AD TPD of final bleached and unbleached fibre is
generated from the plant for making paper. For Tissue machine # 3, Imported Purchased
Pulp is being procured to produce paper.
Figure 2-1 Typical Manufacturing Process at the existing facility
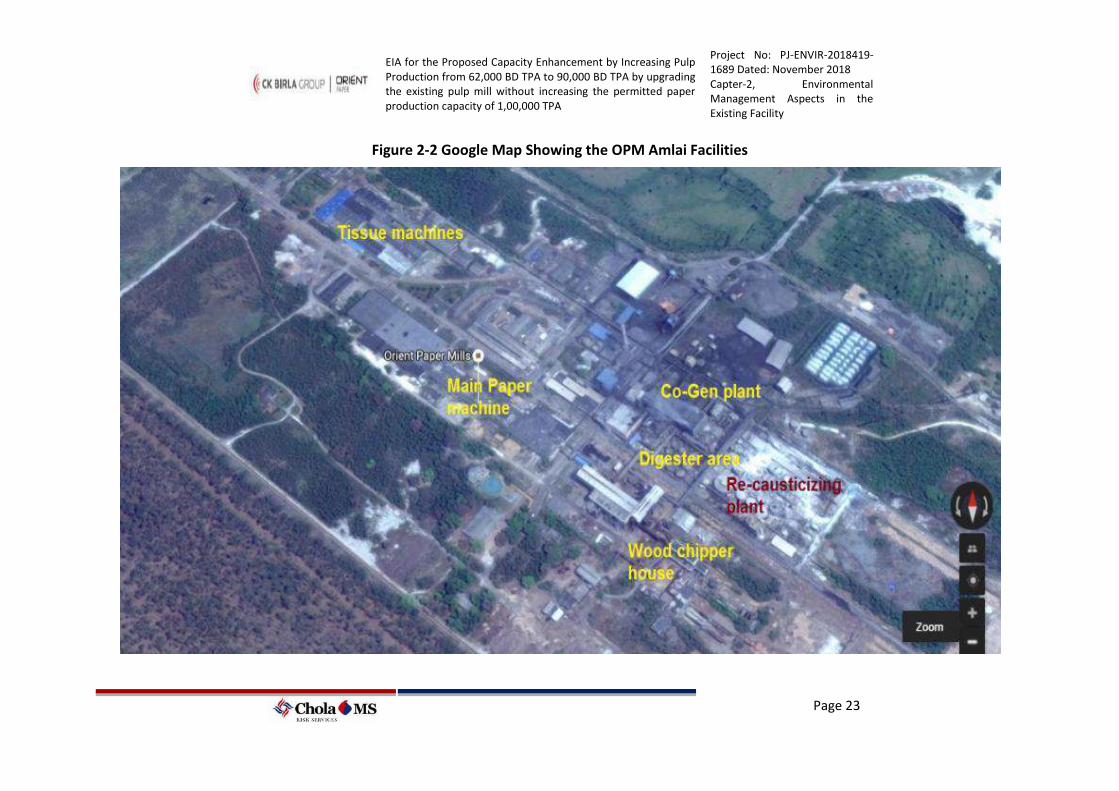
EIA for the Proposed Capacity Enhancement by Increasing Pulp Production from 62,000 BD TPA to 90,000 BD TPA by upgrading the existing pulp mill without increasing the permitted paper production capacity of 1,00,000 TPA
Project No: PJ-ENVIR-2018419-1689 Dated: November 2018 Capter-2, Environmental Management Aspects in the Existing Facility
Page 23
Figure 2-2 Google Map Showing the OPM Amlai Facilities
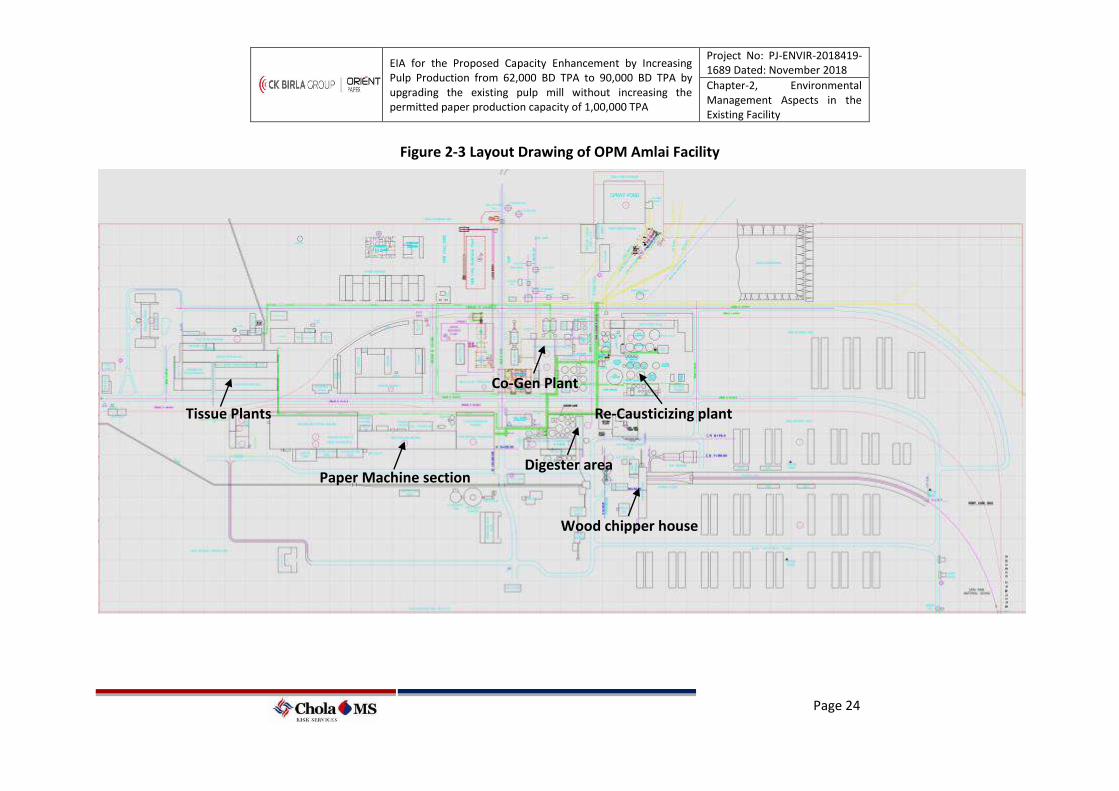
EIA for the Proposed Capacity Enhancement by Increasing Pulp Production from 62,000 BD TPA to 90,000 BD TPA by upgrading the existing pulp mill without increasing the permitted paper production capacity of 1,00,000 TPA
Project No: PJ-ENVIR-2018419-1689 Dated: November 2018
Chapter-2, Environmental Management Aspects in the Existing Facility
Page 24
Figure 2-3 Layout Drawing of OPM Amlai Facility
Tissue Plants
Paper Machine section
Co-Gen Plant
Digester area
Re-Causticizing plant
Wood chipper house
EIA for the Proposed Capacity Enhancement by Increasing Pulp Production from 62,000 BD TPA to 90,000 BD TPA by upgrading the existing pulp mill without increasing the permitted paper production capacity of 1,00,000 TPA
Project No: PJ-ENVIR-2018419-1689 Dated: November 2018 Capter-2, Environmental Management Aspects in the Existing Facility
Page 25
2.3.3 Pulp Screening, Washing & Bleaching Operations
Bleaching after pulping is a chemical process applied to pulp in order to increase their
brightness. To reach the required brightness level, bleaching should be performed by
removing the residual lignin of chemical pulps (delignification or lignin-removing bleaching).
Pulp is bleached in four stage process at OPM. The Cooked brown pulp from digester is
pumped to Blow tank from where it is further processed through Screening process and
dropped to Unbleached Pulp Tower through Vacuum Thickener. Unbleached pulp is then
processed through two stage Oxygen Delignification process and then forwarded to
Bleaching stage. The bleaching sequence consists of four stages with intermediate washing
operations. The bleaching sequence adopted at the OPM is CD(Chlorine stage)- EP (Alkaline
extraction - Dissolution of reaction products with NaOH), H (Reaction with hypochlorite in
alkaline medium) and D (Reaction with chlorine dioxide) respectively. OPM has also installed
oxygen de-lignification stage to adopt environment friendly operation and to minimize the
chemical consumption in the bleaching operations.
2.3.4 Recovery area
About 328 TPD (dry basis) of Black liquor is generated while producing 182 TPD of pulp.
Black liquor generated from the Brown stock Pulp washing & Screening area in Pulp Mill is
being subjected to heat recovery followed by six stage multiple evaporator to increase the
consistency of the solids from 14% to 55%. The solids generated from the evaporator are
further processed through the Cascade Evaporator utilising the heat from Flue gas of
Recovery Boiler & then fired at 65% solids concentration (named as Bio-mass) in a recovery
boiler. The condensate from the multiple effect evaporator is utilized in the re- causticizing
plant for making the white liquor. Typical manufacturing process of the recovery process is
presented in Figure 2.5.
The recovery system in a kraft pulp mill has two functions:
(1). Recovery of the inorganic pulping chemicals which is recycled back to Pulp Mill as
cooking chemical named as White Liquor
EIA for the Proposed Capacity Enhancement by Increasing Pulp Production from 62,000 BD TPA to 90,000 BD TPA by upgrading the existing pulp mill without increasing the permitted paper production capacity of 1,00,000 TPA
Project No: PJ-ENVIR-2018419-1689 Dated: November 2018
Chapter-2, Environmental Management Aspects in the Existing Facility
Page 26
(2). Organic material of Bio-mass is burnt in Recovery boiler to generate Steam as
byproduct. The fuel value of the recoverable black liquor is enough to make the kraft pulp
mills more than self-sufficient in heat and electrical energy. The main process units in the
chemical recovery system are the evaporation of the black liquor, incineration of the
concentrated thick Black liquor in a recovery boiler and recovering back the caustic in the
form of White Liquor used back in pulp Mill as cooking liquor in digesters. Lime sludge from
the recausticising is burnt in the Lime Kiln to recover back the Lime used in the generation of
white Liquor. The recovery system includes the following processes: (1). Evaporation of
black liquor, (2). Salt cake (Na2SO4) makeup to liquor, (3). Burning of concentrated black
liquor in recovery boiler, (4). Dissolving of boiler smelt in the form of green liquor, (5).
Incineration of limestone in the lime kiln, (6). Lime slaking and mixing with green liquor, (7).
White liquor clarification and lime mud filtering.
Soda Recovery: The concentrated black liquor solids are burnt in the existing Solids
Recovery Boiler. The existing recovery boiler is designed to fire 480 TPD of black liquor solids
(dry basis) as against the current solids firing rate of 328 TPD. High-pressure steam is
obtained as a by-product from Recovery Boiler. Sodium sulphate, added as make up
chemical, reacts with carbon and around 90% of Na2SO4 is converted into sodium sulphide
as per following reaction.
Na2SO4 + 2 C → Na2S + 2 CO2
The smelt moves downward through the fuel beds and is discharged from the bottom of
boiler furnace as molten stream, which consists of Na2CO3 and Na2S. The smelt is dissolved
in weak liquor and is known as green liquor.
Causticizing of green liquor: Green liquor is clarified in a clarifier to remove impurities
picked up in smelt operation. Lime is added to green liquor. The process of converting
sodium carbonate to sodium hydroxide is referred as causticizing. The reaction is as follows:
CaO + H2O + Na2CO3 → 2 NaOH + CaCO3
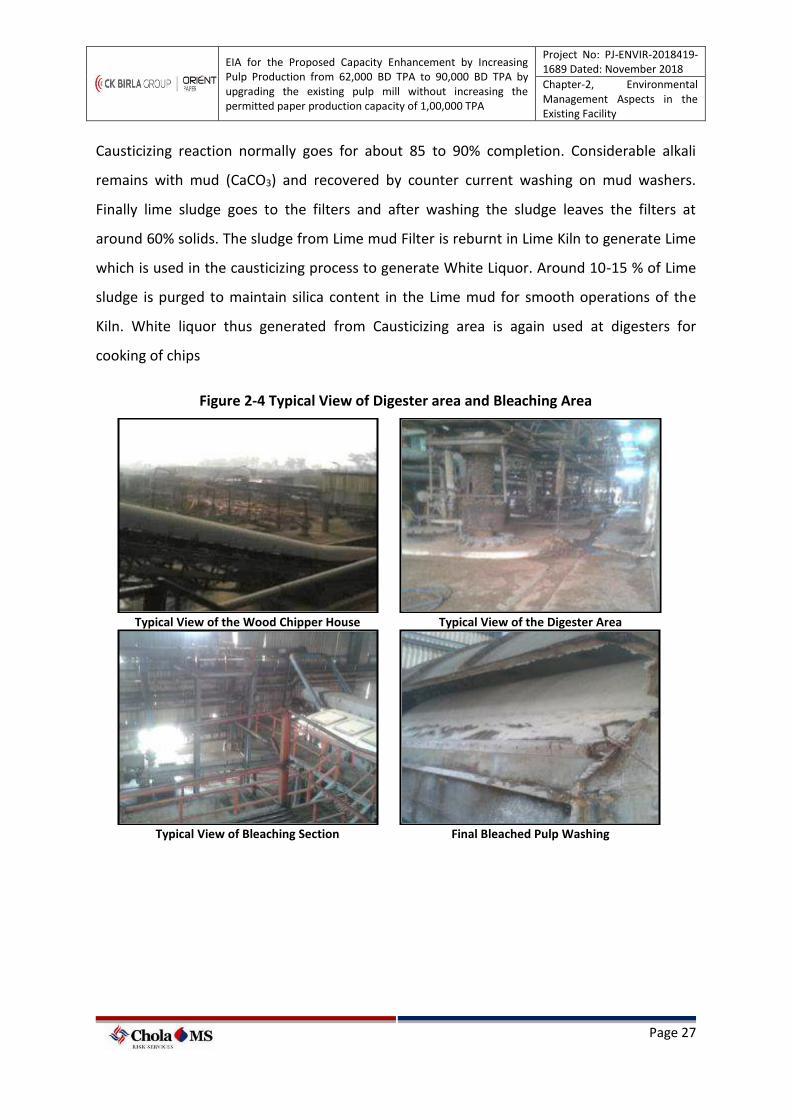
EIA for the Proposed Capacity Enhancement by Increasing Pulp Production from 62,000 BD TPA to 90,000 BD TPA by upgrading the existing pulp mill without increasing the permitted paper production capacity of 1,00,000 TPA
Project No: PJ-ENVIR-2018419-1689 Dated: November 2018
Chapter-2, Environmental Management Aspects in the Existing Facility
Page 27
Causticizing reaction normally goes for about 85 to 90% completion. Considerable alkali
remains with mud (CaCO3) and recovered by counter current washing on mud washers.
Finally lime sludge goes to the filters and after washing the sludge leaves the filters at
around 60% solids. The sludge from Lime mud Filter is reburnt in Lime Kiln to generate Lime
which is used in the causticizing process to generate White Liquor. Around 10-15 % of Lime
sludge is purged to maintain silica content in the Lime mud for smooth operations of the
Kiln. White liquor thus generated from Causticizing area is again used at digesters for
cooking of chips
Figure 2-4 Typical View of Digester area and Bleaching Area
Typical View of the Wood Chipper House Typical View of the Digester Area
Typical View of Bleaching Section Final Bleached Pulp Washing
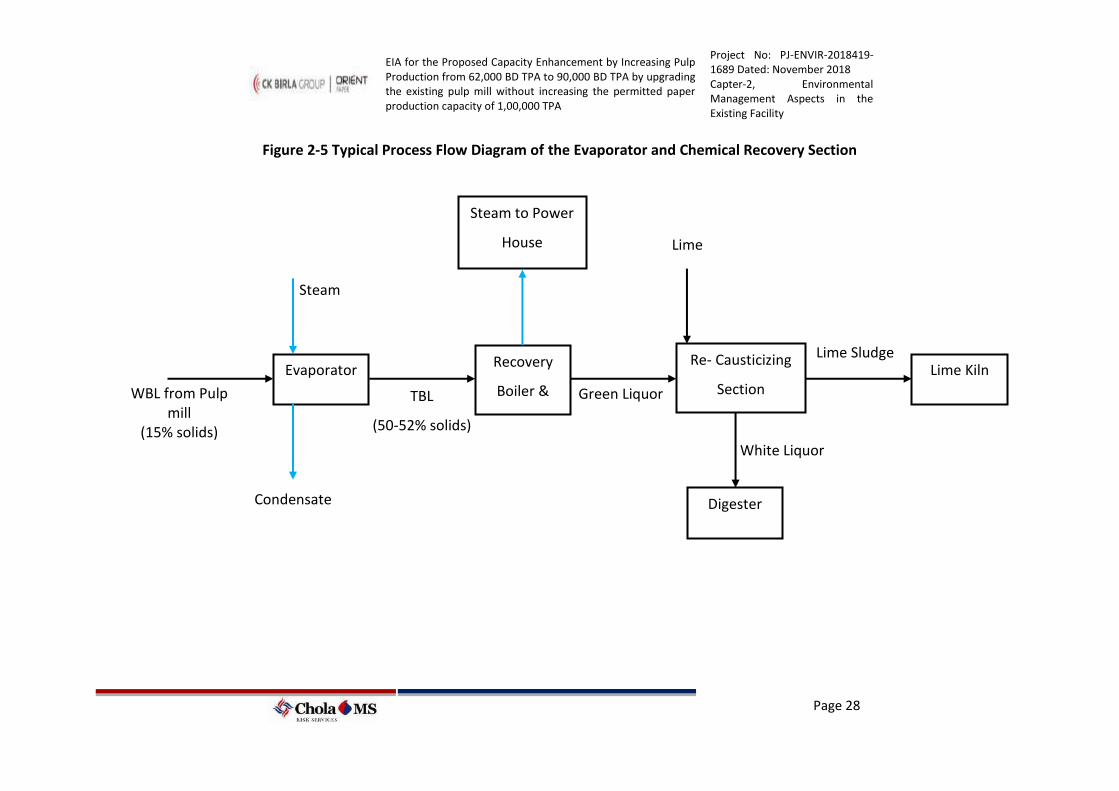
EIA for the Proposed Capacity Enhancement by Increasing Pulp Production from 62,000 BD TPA to 90,000 BD TPA by upgrading the existing pulp mill without increasing the permitted paper production capacity of 1,00,000 TPA
Project No: PJ-ENVIR-2018419-1689 Dated: November 2018 Capter-2, Environmental Management Aspects in the Existing Facility
Page 28
Figure 2-5 Typical Process Flow Diagram of the Evaporator and Chemical Recovery Section
Evaporator Recovery
Boiler &
Cascade
Re- Causticizing
Section
Digester
WBL from Pulp mill
(15% solids)
TBL
(50-52% solids)
Steam
Condensate
Steam to Power
House
Green Liquor
White Liquor
Lime
Lime Kiln Lime Sludge
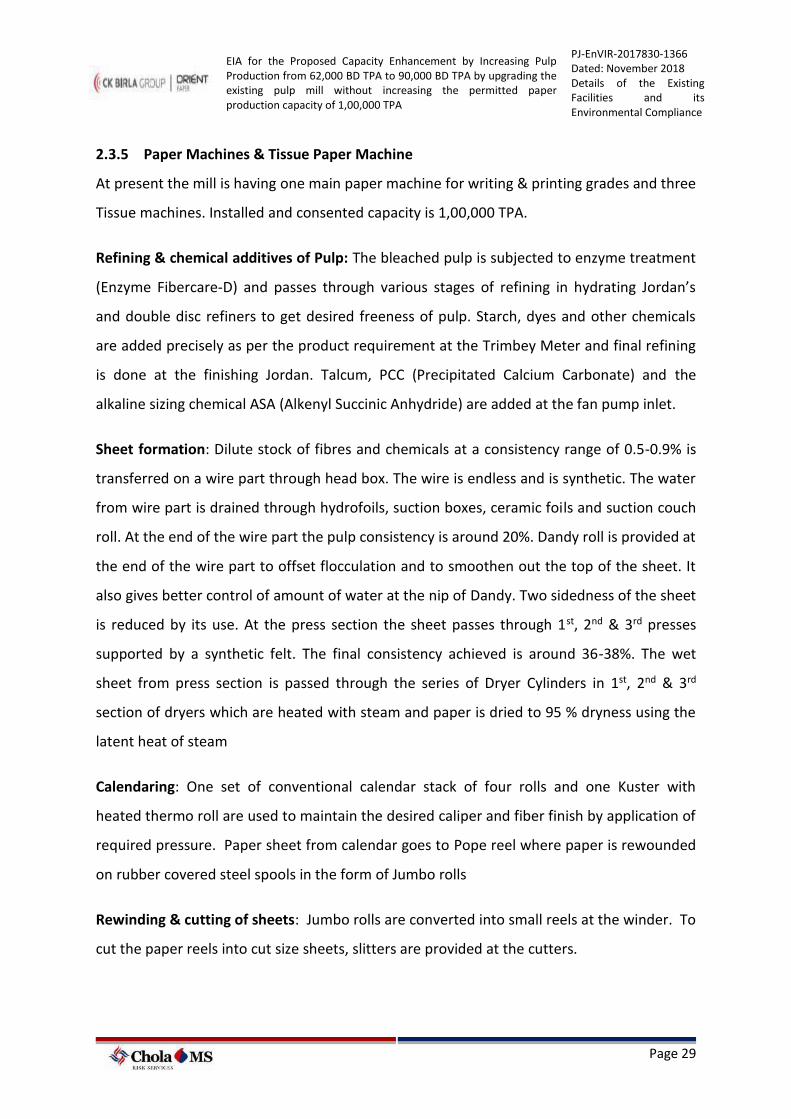
EIA for the Proposed Capacity Enhancement by Increasing Pulp Production from 62,000 BD TPA to 90,000 BD TPA by upgrading the existing pulp mill without increasing the permitted paper production capacity of 1,00,000 TPA
PJ-EnVIR-2017830-1366 Dated: November 2018 Details of the Existing Facilities and its Environmental Compliance
Page 29
2.3.5 Paper Machines & Tissue Paper Machine
At present the mill is having one main paper machine for writing & printing grades and three
Tissue machines. Installed and consented capacity is 1,00,000 TPA.
Refining & chemical additives of Pulp: The bleached pulp is subjected to enzyme treatment
(Enzyme Fibercare-D) and passes through various stages of refining in hydrating Jordan’s
and double disc refiners to get desired freeness of pulp. Starch, dyes and other chemicals
are added precisely as per the product requirement at the Trimbey Meter and final refining
is done at the finishing Jordan. Talcum, PCC (Precipitated Calcium Carbonate) and the
alkaline sizing chemical ASA (Alkenyl Succinic Anhydride) are added at the fan pump inlet.
Sheet formation: Dilute stock of fibres and chemicals at a consistency range of 0.5-0.9% is
transferred on a wire part through head box. The wire is endless and is synthetic. The water
from wire part is drained through hydrofoils, suction boxes, ceramic foils and suction couch
roll. At the end of the wire part the pulp consistency is around 20%. Dandy roll is provided at
the end of the wire part to offset flocculation and to smoothen out the top of the sheet. It
also gives better control of amount of water at the nip of Dandy. Two sidedness of the sheet
is reduced by its use. At the press section the sheet passes through 1st, 2nd & 3rd presses
supported by a synthetic felt. The final consistency achieved is around 36-38%. The wet
sheet from press section is passed through the series of Dryer Cylinders in 1st, 2nd & 3rd
section of dryers which are heated with steam and paper is dried to 95 % dryness using the
latent heat of steam
Calendaring: One set of conventional calendar stack of four rolls and one Kuster with
heated thermo roll are used to maintain the desired caliper and fiber finish by application of
required pressure. Paper sheet from calendar goes to Pope reel where paper is rewounded
on rubber covered steel spools in the form of Jumbo rolls
Rewinding & cutting of sheets: Jumbo rolls are converted into small reels at the winder. To
cut the paper reels into cut size sheets, slitters are provided at the cutters.
EIA for the Proposed Capacity Enhancement by Increasing Pulp Production from 62,000 BD TPA to 90,000 BD TPA by upgrading the existing pulp mill without increasing the permitted paper production capacity of 1,00,000 TPA
Project No: PJ-ENVIR-2018419-1689 Dated: November 2018
Chapter-2, Environmental Management Aspects in the Existing Facility
Page 30
Packing: Paper reels and sheets in the form of ream are packed in finishing house. Paper
reels and sheet packets from finishing house are taken to paper godown where these are
properly stacked. Fire hydrants and hose reels are provided all around the paper godown in
accordance with fire protection rules. Paper ream and reels are transported by trucks and
rail to the desired destination.
Figure 2-6 Typical View of Paper Machines
Typical View of Main Paper Machine Typical View of Tissue Machine # 1
Typical View of Tissue Machine #2 Typical View of Tissue Machine # 3
Typical View of Fibre recovery and water recovery Unit in Main Paper Machine
Typical View of Fibre recovery and water recovery Unit in Tissue Paper Machines
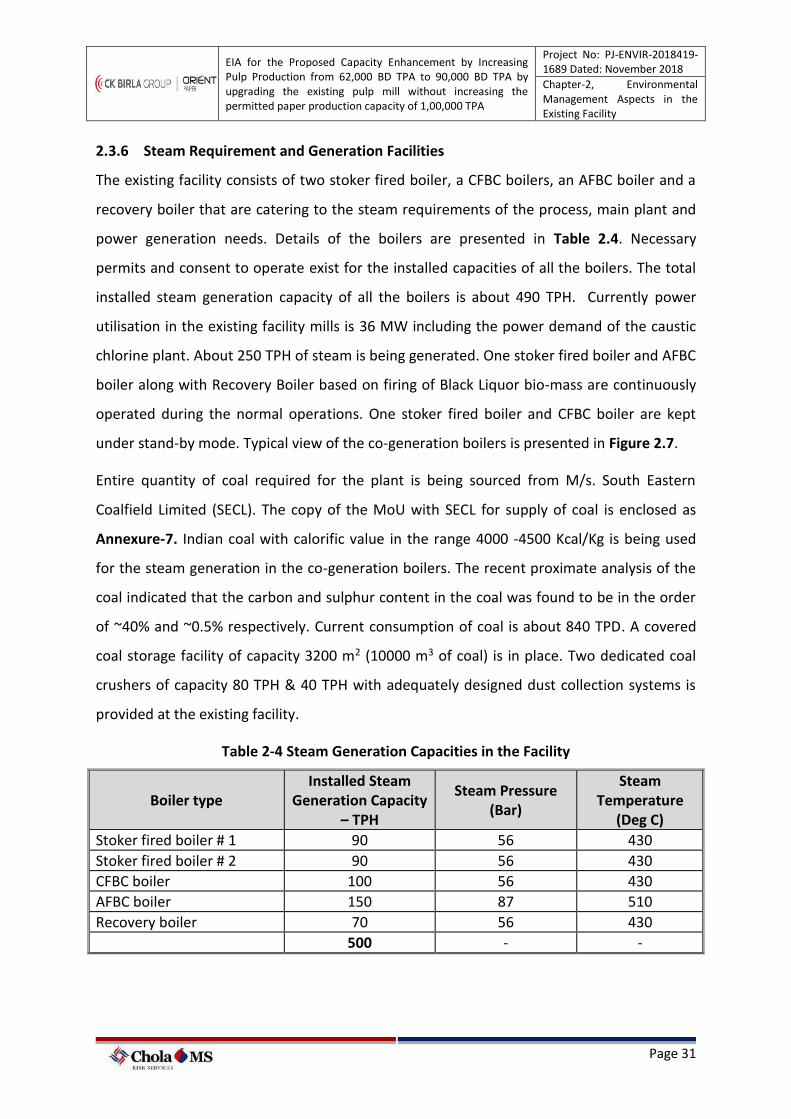
EIA for the Proposed Capacity Enhancement by Increasing Pulp Production from 62,000 BD TPA to 90,000 BD TPA by upgrading the existing pulp mill without increasing the permitted paper production capacity of 1,00,000 TPA
Project No: PJ-ENVIR-2018419-1689 Dated: November 2018
Chapter-2, Environmental Management Aspects in the Existing Facility
Page 31
2.3.6 Steam Requirement and Generation Facilities
The existing facility consists of two stoker fired boiler, a CFBC boilers, an AFBC boiler and a
recovery boiler that are catering to the steam requirements of the process, main plant and
power generation needs. Details of the boilers are presented in Table 2.4. Necessary
permits and consent to operate exist for the installed capacities of all the boilers. The total
installed steam generation capacity of all the boilers is about 490 TPH. Currently power
utilisation in the existing facility mills is 36 MW including the power demand of the caustic
chlorine plant. About 250 TPH of steam is being generated. One stoker fired boiler and AFBC
boiler along with Recovery Boiler based on firing of Black Liquor bio-mass are continuously
operated during the normal operations. One stoker fired boiler and CFBC boiler are kept
under stand-by mode. Typical view of the co-generation boilers is presented in Figure 2.7.
Entire quantity of coal required for the plant is being sourced from M/s. South Eastern
Coalfield Limited (SECL). The copy of the MoU with SECL for supply of coal is enclosed as
Annexure-7. Indian coal with calorific value in the range 4000 -4500 Kcal/Kg is being used
for the steam generation in the co-generation boilers. The recent proximate analysis of the
coal indicated that the carbon and sulphur content in the coal was found to be in the order
of ~40% and ~0.5% respectively. Current consumption of coal is about 840 TPD. A covered
coal storage facility of capacity 3200 m2 (10000 m3 of coal) is in place. Two dedicated coal
crushers of capacity 80 TPH & 40 TPH with adequately designed dust collection systems is
provided at the existing facility.
Table 2-4 Steam Generation Capacities in the Facility
Boiler type Installed Steam
Generation Capacity – TPH
Steam Pressure (Bar)
Steam Temperature
(Deg C)
Stoker fired boiler # 1 90 56 430
Stoker fired boiler # 2 90 56 430
CFBC boiler 100 56 430
AFBC boiler 150 87 510
Recovery boiler 70 56 430
500 - -
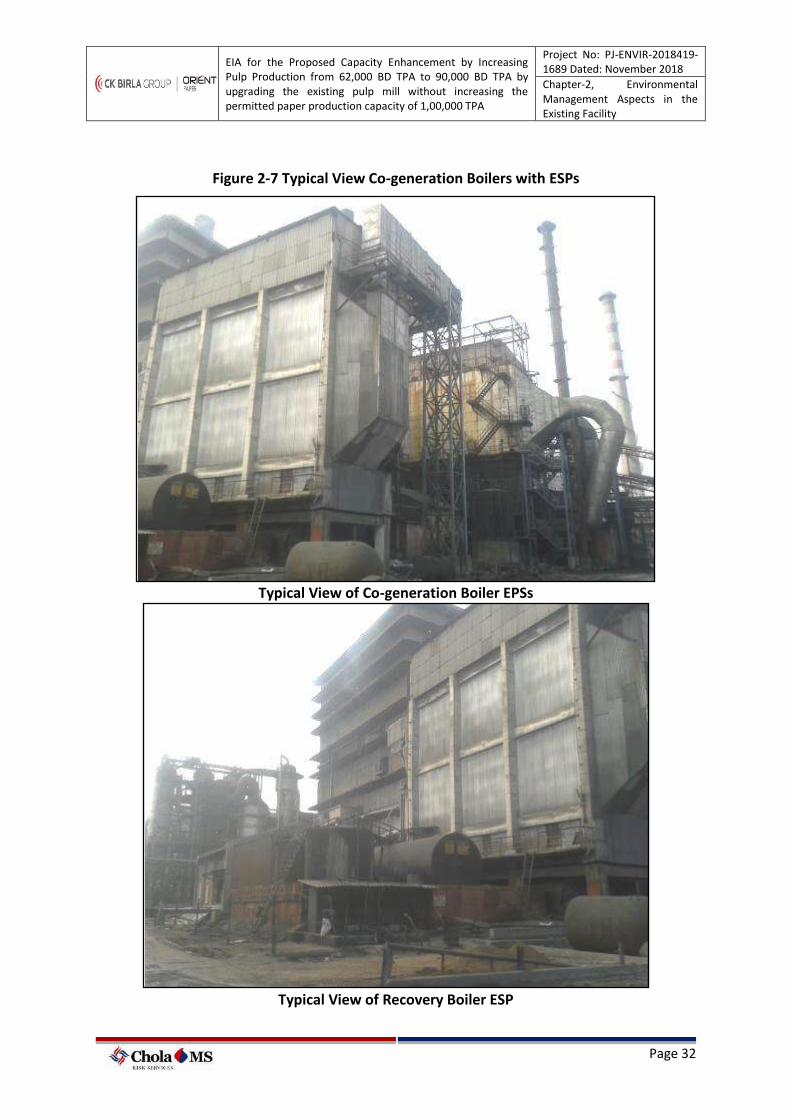
EIA for the Proposed Capacity Enhancement by Increasing Pulp Production from 62,000 BD TPA to 90,000 BD TPA by upgrading the existing pulp mill without increasing the permitted paper production capacity of 1,00,000 TPA
Project No: PJ-ENVIR-2018419-1689 Dated: November 2018
Chapter-2, Environmental Management Aspects in the Existing Facility
Page 32
Figure 2-7 Typical View Co-generation Boilers with ESPs
Typical View of Co-generation Boiler EPSs
Typical View of Recovery Boiler ESP
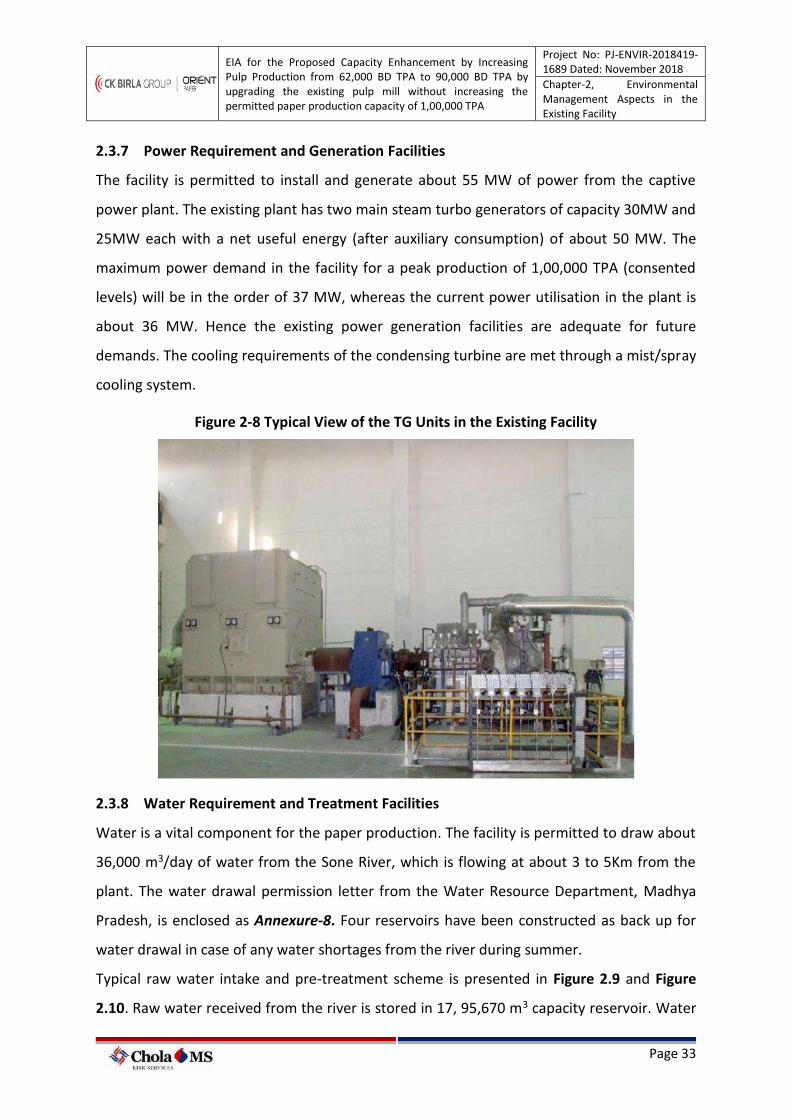
EIA for the Proposed Capacity Enhancement by Increasing Pulp Production from 62,000 BD TPA to 90,000 BD TPA by upgrading the existing pulp mill without increasing the permitted paper production capacity of 1,00,000 TPA
Project No: PJ-ENVIR-2018419-1689 Dated: November 2018
Chapter-2, Environmental Management Aspects in the Existing Facility
Page 33
2.3.7 Power Requirement and Generation Facilities
The facility is permitted to install and generate about 55 MW of power from the captive
power plant. The existing plant has two main steam turbo generators of capacity 30MW and
25MW each with a net useful energy (after auxiliary consumption) of about 50 MW. The
maximum power demand in the facility for a peak production of 1,00,000 TPA (consented
levels) will be in the order of 37 MW, whereas the current power utilisation in the plant is
about 36 MW. Hence the existing power generation facilities are adequate for future
demands. The cooling requirements of the condensing turbine are met through a mist/spray
cooling system.
Figure 2-8 Typical View of the TG Units in the Existing Facility
2.3.8 Water Requirement and Treatment Facilities
Water is a vital component for the paper production. The facility is permitted to draw about
36,000 m3/day of water from the Sone River, which is flowing at about 3 to 5Km from the
plant. The water drawal permission letter from the Water Resource Department, Madhya
Pradesh, is enclosed as Annexure-8. Four reservoirs have been constructed as back up for
water drawal in case of any water shortages from the river during summer.
Typical raw water intake and pre-treatment scheme is presented in Figure 2.9 and Figure
2.10. Raw water received from the river is stored in 17, 95,670 m3 capacity reservoir. Water
EIA for the Proposed Capacity Enhancement by Increasing Pulp Production from 62,000 BD TPA to 90,000 BD TPA by upgrading the existing pulp mill without increasing the permitted paper production capacity of 1,00,000 TPA
Project No: PJ-ENVIR-2018419-1689 Dated: November 2018
Chapter-2, Environmental Management Aspects in the Existing Facility
Page 34
is subjected to gravity settling in a large clarifier of capacity 45000 m3. About 20,250 m3/day
of water is used for process, cooling and domestic applications. Water used for boiler make
up is subjected a four-stage rigorous treatment (multi-media filter, Ultra Filtration, Reverse
Osmosis Plant, De-mineralization plant) to remove dissolved solids.
Currently the Fresh water consumption for pulp and paper making is about 11,250 m3/day,
whereas water demand in the cogeneration power plant and domestic use is 6500 m3/day
and 2500 m3/day respectively. The total fresh water demand in the existing facility is about
20,250 m3/day as against the consented level of 22,150 m3/day. The specific water
consumption for the main plant (pulp and paper production) is thus in the order of ~45 m3/t
of paper produced based on the plant data for the past 6 months. The water balance for the
existing operations is as shown in the Table 2.5.
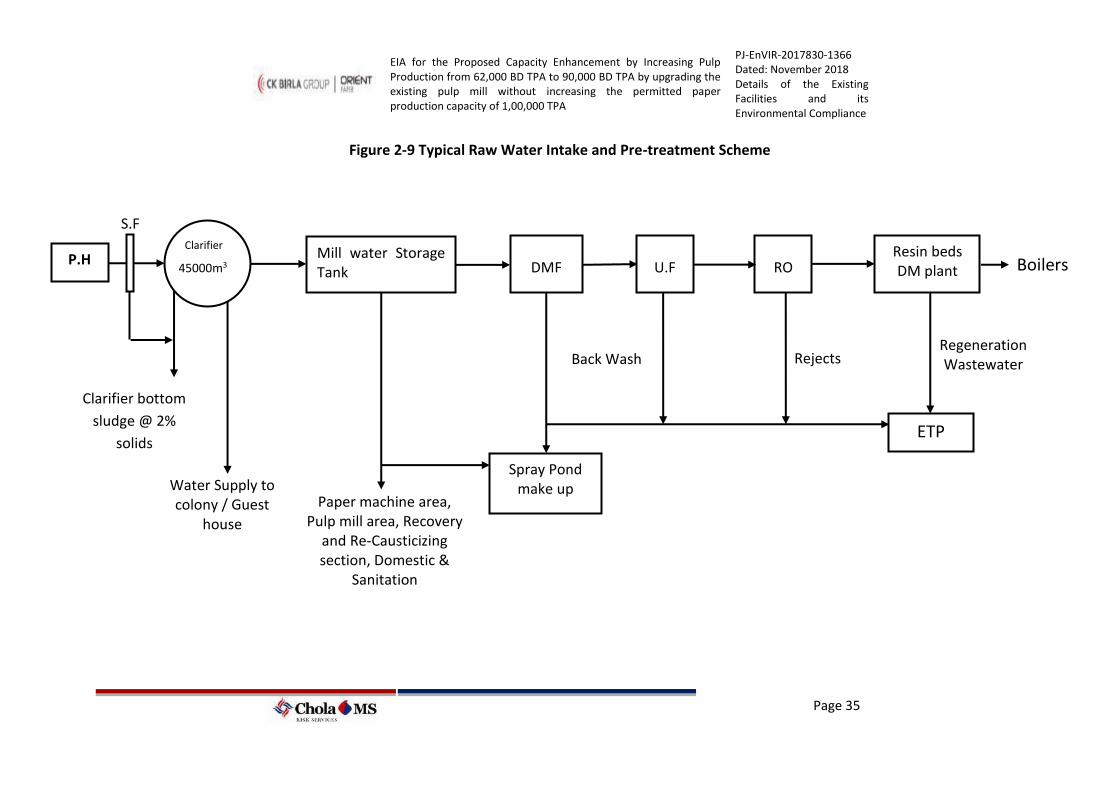
EIA for the Proposed Capacity Enhancement by Increasing Pulp Production from 62,000 BD TPA to 90,000 BD TPA by upgrading the existing pulp mill without increasing the permitted paper production capacity of 1,00,000 TPA
PJ-EnVIR-2017830-1366 Dated: November 2018 Details of the Existing Facilities and its Environmental Compliance
Page 35
Figure 2-9 Typical Raw Water Intake and Pre-treatment Scheme
Clarifier
45000m3 Mill water Storage Tank DMF U.F RO
Resin beds DM plant
Spray Pond make up
ETP
Water Supply to colony / Guest
house
Clarifier bottom
sludge @ 2%
solids
P.H
S.F
Regeneration Wastewater
Boilers
Back Wash Rejects
Paper machine area, Pulp mill area, Recovery
and Re-Causticizing section, Domestic &
Sanitation
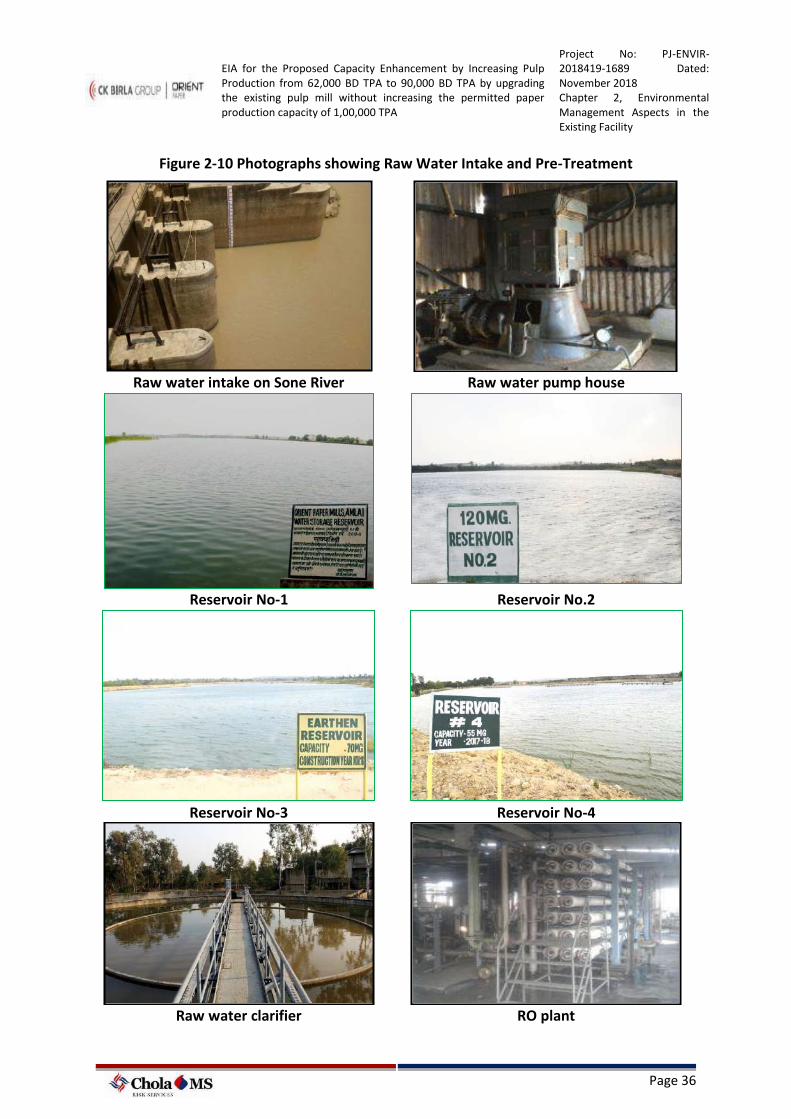
EIA for the Proposed Capacity Enhancement by Increasing Pulp Production from 62,000 BD TPA to 90,000 BD TPA by upgrading the existing pulp mill without increasing the permitted paper production capacity of 1,00,000 TPA
Project No: PJ-ENVIR-2018419-1689 Dated: November 2018 Chapter 2, Environmental Management Aspects in the Existing Facility
Page 36
Figure 2-10 Photographs showing Raw Water Intake and Pre-Treatment
Raw water intake on Sone River Raw water pump house
Reservoir No-1 Reservoir No.2
Reservoir No-3 Reservoir No-4
Raw water clarifier RO plant
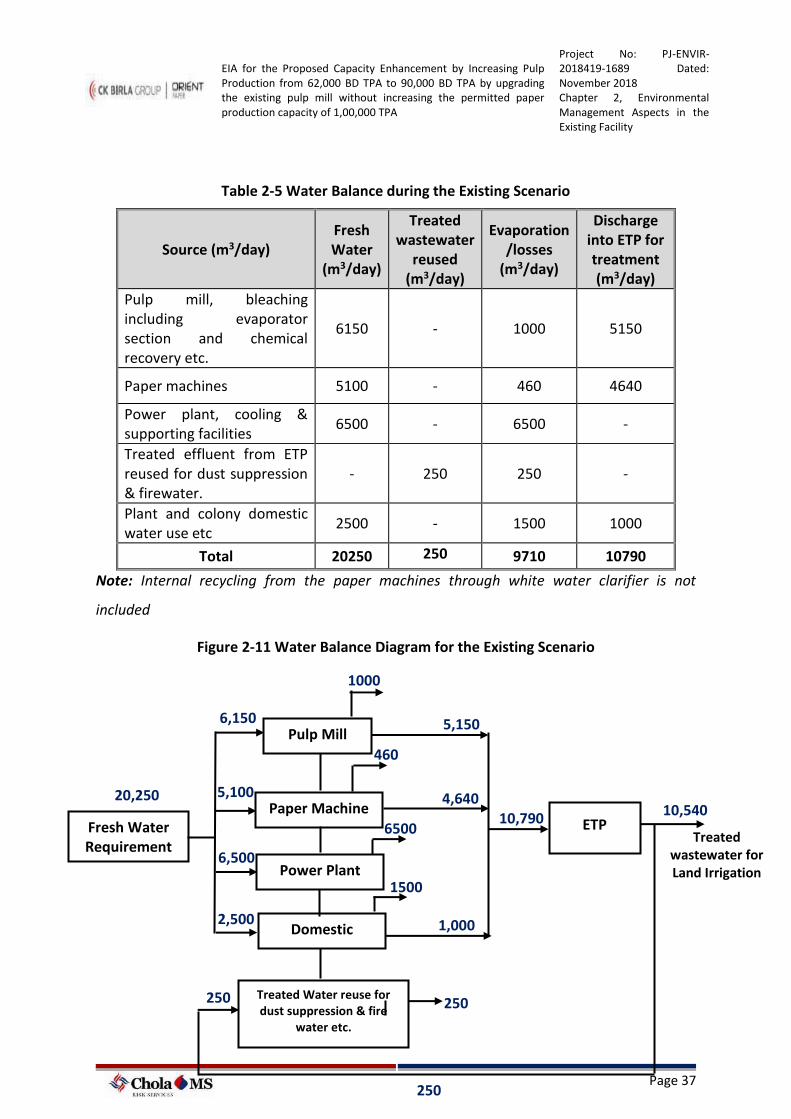
EIA for the Proposed Capacity Enhancement by Increasing Pulp Production from 62,000 BD TPA to 90,000 BD TPA by upgrading the existing pulp mill without increasing the permitted paper production capacity of 1,00,000 TPA
Project No: PJ-ENVIR-2018419-1689 Dated: November 2018 Chapter 2, Environmental Management Aspects in the Existing Facility
Page 37
Table 2-5 Water Balance during the Existing Scenario
Source (m3/day) Fresh Water
(m3/day)
Treated wastewater
reused (m3/day)
Evaporation /losses
(m3/day)
Discharge into ETP for treatment (m3/day)
Pulp mill, bleaching including evaporator section and chemical recovery etc.
6150 - 1000 5150
Paper machines 5100 - 460 4640
Power plant, cooling & supporting facilities
6500 - 6500 -
Treated effluent from ETP reused for dust suppression & firewater.
- 250 250 -
Plant and colony domestic water use etc
2500 - 1500 1000
Total 20250 250 9710 10790
Note: Internal recycling from the paper machines through white water clarifier is not
included
Figure 2-11 Water Balance Diagram for the Existing Scenario
1000
Pulp Mill
Paper Machine
Power Plant
Domestic
Fresh Water Requirement
Treated Water reuse for dust suppression & fire
water etc.
20,250
6,150
5,100
6,500
2,500
250 250
1500
6500
460
ETP
5,150
4,640
1,000
10,790
250
10,540
Treated wastewater for Land Irrigation
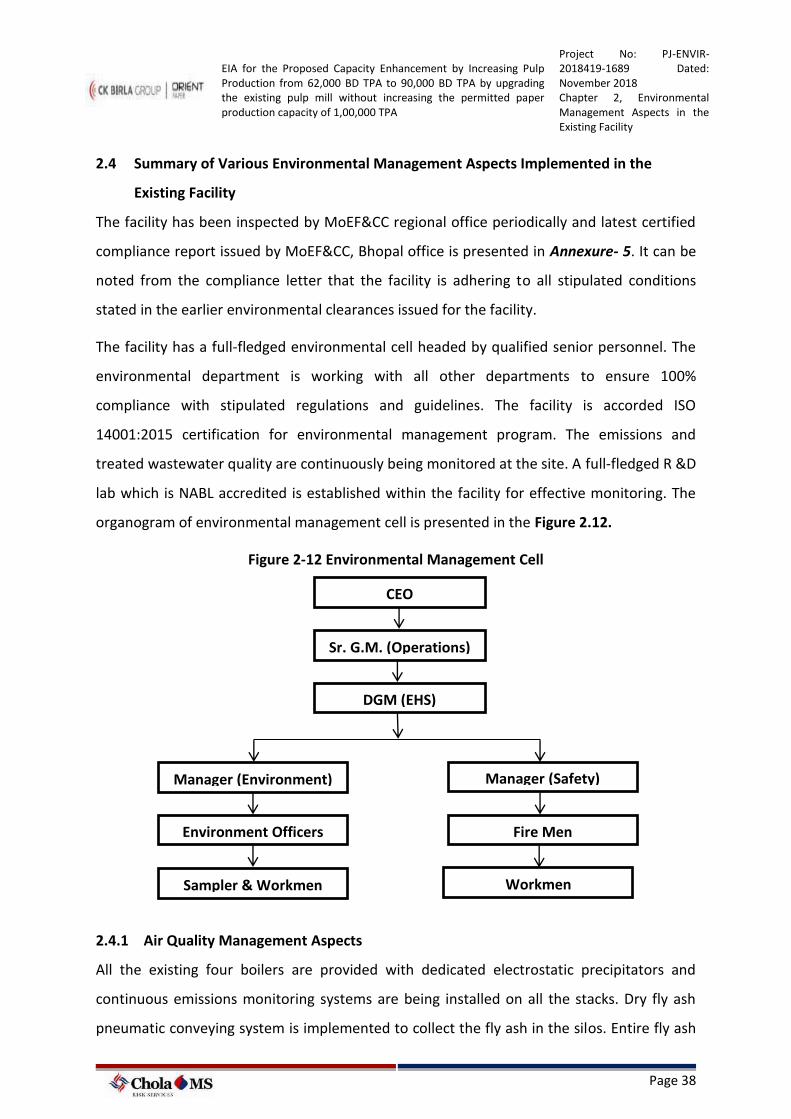
EIA for the Proposed Capacity Enhancement by Increasing Pulp Production from 62,000 BD TPA to 90,000 BD TPA by upgrading the existing pulp mill without increasing the permitted paper production capacity of 1,00,000 TPA
Project No: PJ-ENVIR-2018419-1689 Dated: November 2018 Chapter 2, Environmental Management Aspects in the Existing Facility
Page 38
2.4 Summary of Various Environmental Management Aspects Implemented in the
Existing Facility
The facility has been inspected by MoEF&CC regional office periodically and latest certified
compliance report issued by MoEF&CC, Bhopal office is presented in Annexure- 5. It can be
noted from the compliance letter that the facility is adhering to all stipulated conditions
stated in the earlier environmental clearances issued for the facility.
The facility has a full-fledged environmental cell headed by qualified senior personnel. The
environmental department is working with all other departments to ensure 100%
compliance with stipulated regulations and guidelines. The facility is accorded ISO
14001:2015 certification for environmental management program. The emissions and
treated wastewater quality are continuously being monitored at the site. A full-fledged R &D
lab which is NABL accredited is established within the facility for effective monitoring. The
organogram of environmental management cell is presented in the Figure 2.12.
Figure 2-12 Environmental Management Cell
2.4.1 Air Quality Management Aspects
All the existing four boilers are provided with dedicated electrostatic precipitators and
continuous emissions monitoring systems are being installed on all the stacks. Dry fly ash
pneumatic conveying system is implemented to collect the fly ash in the silos. Entire fly ash
CEO
Sr. G.M. (Operations)
DGM (EHS)
Manager (Environment) Manager (Safety)
Environment Officers
Sampler & Workmen
Fire Men
Workmen
EIA for the Proposed Capacity Enhancement by Increasing Pulp Production from 62,000 BD TPA to 90,000 BD TPA by upgrading the existing pulp mill without increasing the permitted paper production capacity of 1,00,000 TPA
Project No: PJ-ENVIR-2018419-1689 Dated: November 2018 Chapter 2, Environmental Management Aspects in the Existing Facility
Page 39
is disposed to cement manufacturing units. In order to control the fugitive emissions from
the coal storage yards, water sprinkling systems are in place. All coal transfer points are
provided with dust extraction and collection systems. Entire coal storage yard is covered
under the shed. Dedicated dust collection systems are in place in all the Tissue machines.
Precipitated Calcium Carbonate (PCC) plant has been installed at site that utilizes CO2 gas
from Lime Kiln flue gas which is then used as filler in paper manufacturing. There is a
reduction of CO2 emission to the extent of about 6000 m3 /day. The Typical view of various
pollution control systems in the existing facility are shown in Figure 2.13. Mill is in the
process to install Continuous Ambient Air Quality Monitoring Stations (AAQMS). Two AAQM
stations are installed & commissioned while the balance two AAQM stations shall be
installed within a year. The stack emissions and ambient air quality at the facility are
periodically being monitored by plant, external lab and MPPCB. The stack emission and AAQ
details are presented in the Table 2.6 and Table 2.7 respectively and the recent test reports
of MPPCB for stack and ambient monitoring is attached as Annexure 9.
Table 2-6 Stack emission details (MPPCB Test Report and Plant Report)
SL. No.
Parameter Unit Stack-1(Soda recovery boiler)
Stack-2(Power Boiler No2 ESP Stack)
Lime Kiln
MPPCB Limit
1 Particulate Matter (PM)
mg/Nm3 135.2* 116.0* 125.4 150
2 Sulphur Dioxide (SO2)
mg/Nm3 119** 251** - 600
3 Nitrogen Dioxide (NOx)
mg/Nm3 60** 161** - 600
Source: * MPPCB Analysis Report dated 30/10/2017 ** Plant data from CEMS (Continuous Emission Monitoring System
Table 2-7 Stack emission details (External Lab Test Report)
SL. No.
Parameter Unit Stack-1 (Soda recovery boiler)
Stack-2 (Power Boiler No1 ESP Stack)
AFBC Boiler
MPPCB Limit
1 Particulate Matter (PM)
mg/Nm3
108 94 41 (MPPCB Limit 50)
150
2 Hydrogen mg/Nm 4.7 - - 10
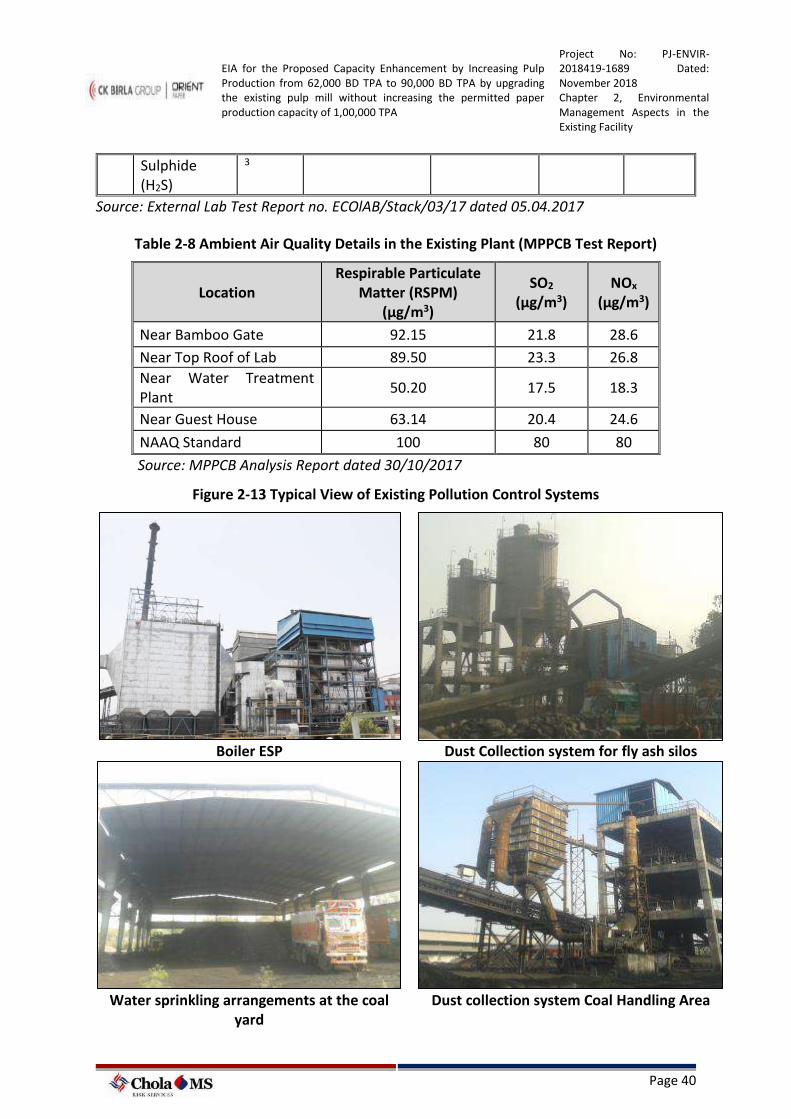
EIA for the Proposed Capacity Enhancement by Increasing Pulp Production from 62,000 BD TPA to 90,000 BD TPA by upgrading the existing pulp mill without increasing the permitted paper production capacity of 1,00,000 TPA
Project No: PJ-ENVIR-2018419-1689 Dated: November 2018 Chapter 2, Environmental Management Aspects in the Existing Facility
Page 40
Sulphide (H2S)
3
Source: External Lab Test Report no. ECOlAB/Stack/03/17 dated 05.04.2017
Table 2-8 Ambient Air Quality Details in the Existing Plant (MPPCB Test Report)
Location Respirable Particulate
Matter (RSPM) (µg/m3)
SO2
(µg/m3) NOx
(µg/m3)
Near Bamboo Gate 92.15 21.8 28.6
Near Top Roof of Lab 89.50 23.3 26.8
Near Water Treatment Plant
50.20 17.5 18.3
Near Guest House 63.14 20.4 24.6
NAAQ Standard 100 80 80
Source: MPPCB Analysis Report dated 30/10/2017
Figure 2-13 Typical View of Existing Pollution Control Systems
Boiler ESP Dust Collection system for fly ash silos
Water sprinkling arrangements at the coal
yard Dust collection system Coal Handling Area
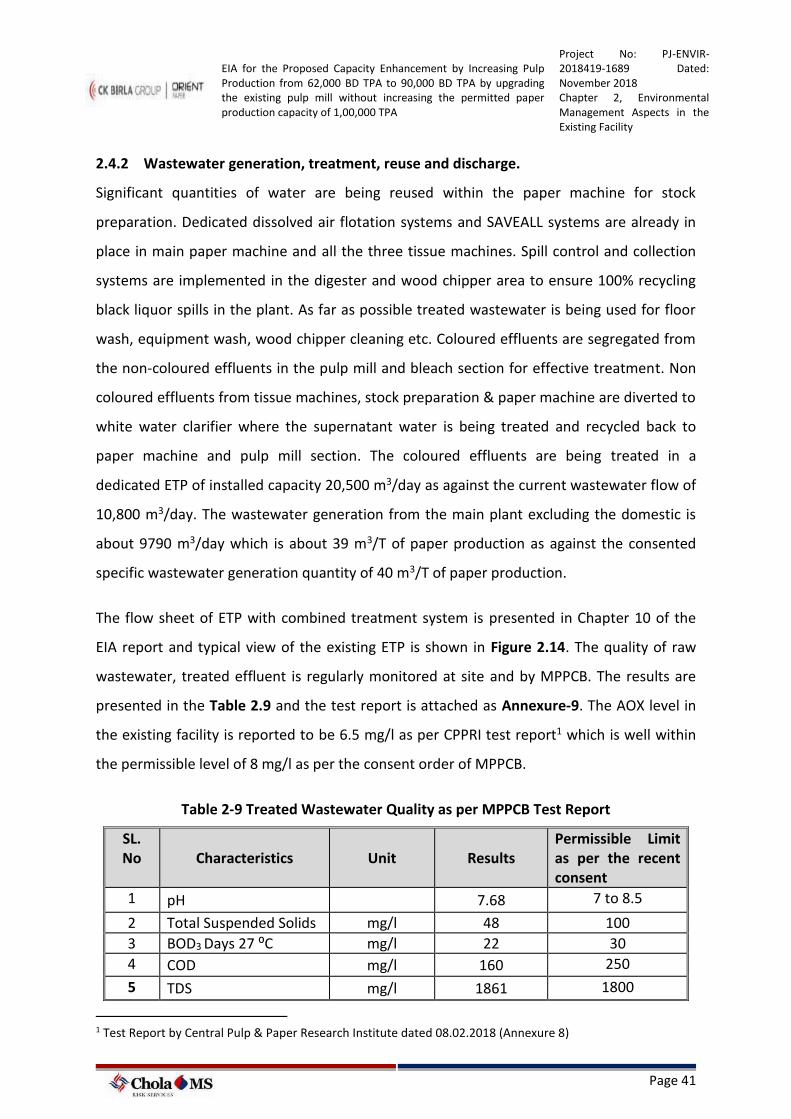
EIA for the Proposed Capacity Enhancement by Increasing Pulp Production from 62,000 BD TPA to 90,000 BD TPA by upgrading the existing pulp mill without increasing the permitted paper production capacity of 1,00,000 TPA
Project No: PJ-ENVIR-2018419-1689 Dated: November 2018 Chapter 2, Environmental Management Aspects in the Existing Facility
Page 41
2.4.2 Wastewater generation, treatment, reuse and discharge.
Significant quantities of water are being reused within the paper machine for stock
preparation. Dedicated dissolved air flotation systems and SAVEALL systems are already in
place in main paper machine and all the three tissue machines. Spill control and collection
systems are implemented in the digester and wood chipper area to ensure 100% recycling
black liquor spills in the plant. As far as possible treated wastewater is being used for floor
wash, equipment wash, wood chipper cleaning etc. Coloured effluents are segregated from
the non-coloured effluents in the pulp mill and bleach section for effective treatment. Non
coloured effluents from tissue machines, stock preparation & paper machine are diverted to
white water clarifier where the supernatant water is being treated and recycled back to
paper machine and pulp mill section. The coloured effluents are being treated in a
dedicated ETP of installed capacity 20,500 m3/day as against the current wastewater flow of
10,800 m3/day. The wastewater generation from the main plant excluding the domestic is
about 9790 m3/day which is about 39 m3/T of paper production as against the consented
specific wastewater generation quantity of 40 m3/T of paper production.
The flow sheet of ETP with combined treatment system is presented in Chapter 10 of the
EIA report and typical view of the existing ETP is shown in Figure 2.14. The quality of raw
wastewater, treated effluent is regularly monitored at site and by MPPCB. The results are
presented in the Table 2.9 and the test report is attached as Annexure-9. The AOX level in
the existing facility is reported to be 6.5 mg/l as per CPPRI test report1 which is well within
the permissible level of 8 mg/l as per the consent order of MPPCB.
Table 2-9 Treated Wastewater Quality as per MPPCB Test Report
SL. No Characteristics Unit Results
Permissible Limit as per the recent consent
1 pH 7.68 7 to 8.5
2 Total Suspended Solids mg/l 48 100
3 BOD3 Days 27 ⁰C mg/l 22 30
4 COD mg/l 160 250
5 TDS mg/l 1861 1800
1 Test Report by Central Pulp & Paper Research Institute dated 08.02.2018 (Annexure 8)
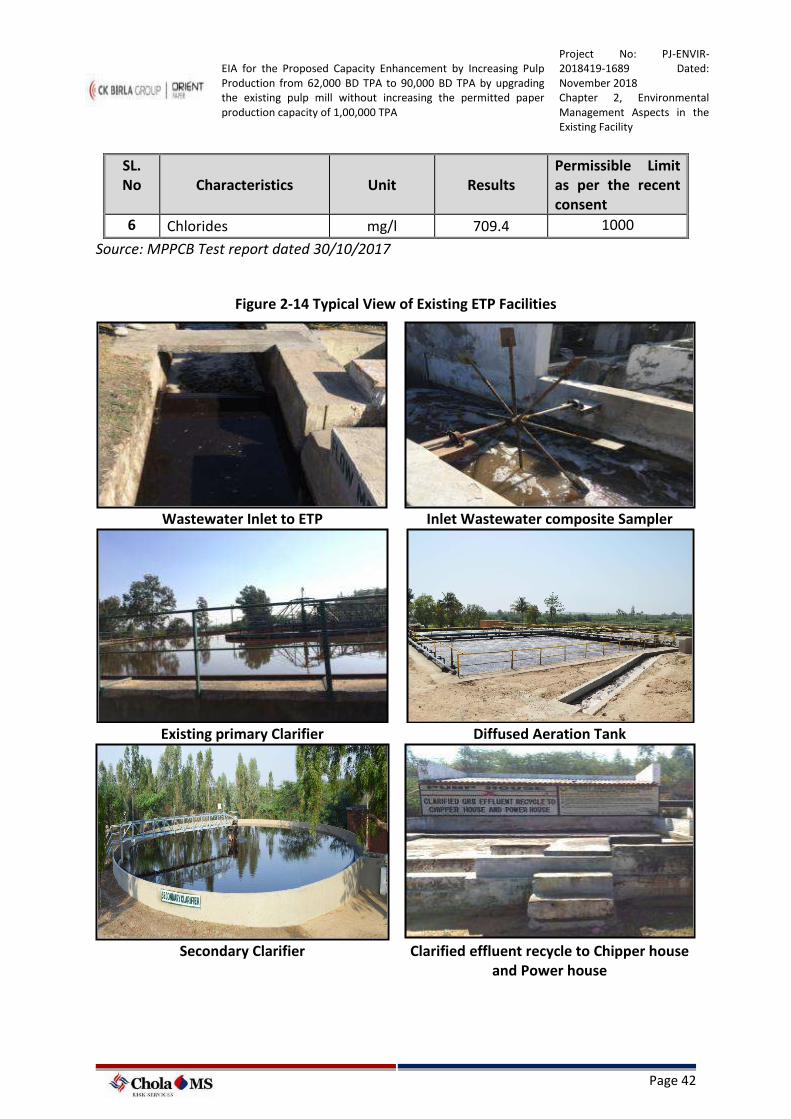
EIA for the Proposed Capacity Enhancement by Increasing Pulp Production from 62,000 BD TPA to 90,000 BD TPA by upgrading the existing pulp mill without increasing the permitted paper production capacity of 1,00,000 TPA
Project No: PJ-ENVIR-2018419-1689 Dated: November 2018 Chapter 2, Environmental Management Aspects in the Existing Facility
Page 42
SL. No Characteristics Unit Results
Permissible Limit as per the recent consent
6 Chlorides mg/l 709.4 1000
Source: MPPCB Test report dated 30/10/2017
Figure 2-14 Typical View of Existing ETP Facilities
Wastewater Inlet to ETP Inlet Wastewater composite Sampler
Existing primary Clarifier Diffused Aeration Tank
Secondary Clarifier Clarified effluent recycle to Chipper house
and Power house
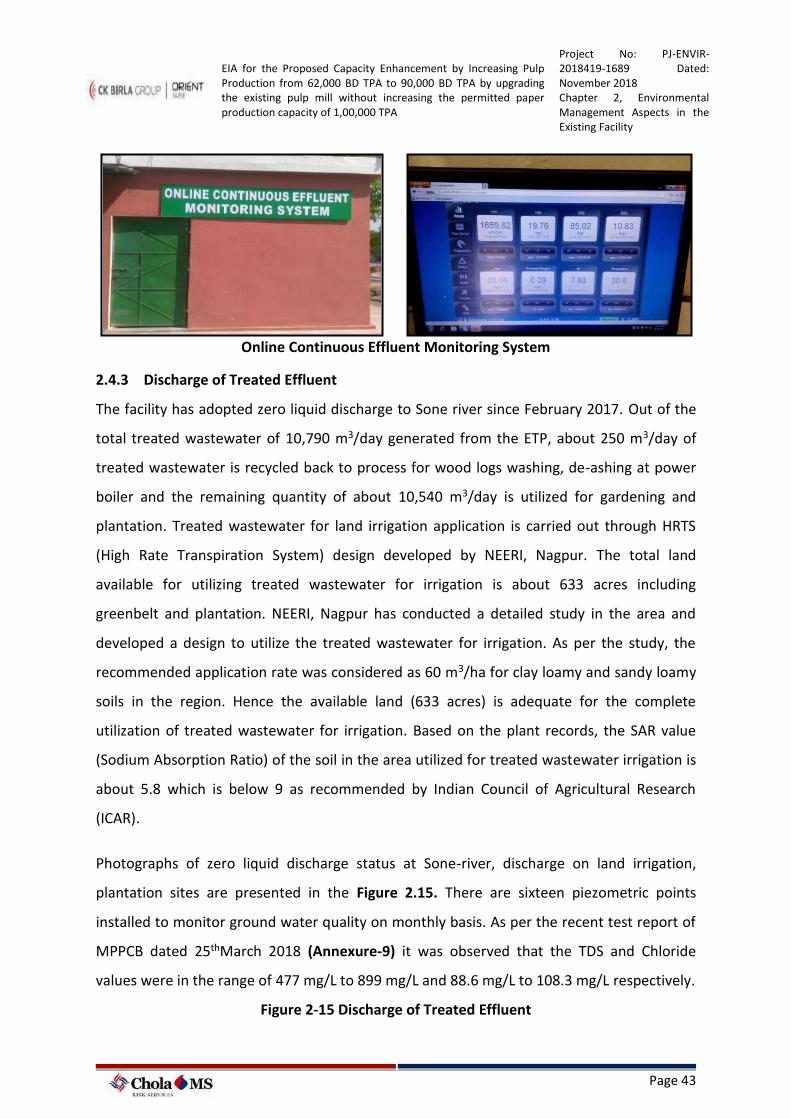
EIA for the Proposed Capacity Enhancement by Increasing Pulp Production from 62,000 BD TPA to 90,000 BD TPA by upgrading the existing pulp mill without increasing the permitted paper production capacity of 1,00,000 TPA
Project No: PJ-ENVIR-2018419-1689 Dated: November 2018 Chapter 2, Environmental Management Aspects in the Existing Facility
Page 43
Online Continuous Effluent Monitoring System
2.4.3 Discharge of Treated Effluent
The facility has adopted zero liquid discharge to Sone river since February 2017. Out of the
total treated wastewater of 10,790 m3/day generated from the ETP, about 250 m3/day of
treated wastewater is recycled back to process for wood logs washing, de-ashing at power
boiler and the remaining quantity of about 10,540 m3/day is utilized for gardening and
plantation. Treated wastewater for land irrigation application is carried out through HRTS
(High Rate Transpiration System) design developed by NEERI, Nagpur. The total land
available for utilizing treated wastewater for irrigation is about 633 acres including
greenbelt and plantation. NEERI, Nagpur has conducted a detailed study in the area and
developed a design to utilize the treated wastewater for irrigation. As per the study, the
recommended application rate was considered as 60 m3/ha for clay loamy and sandy loamy
soils in the region. Hence the available land (633 acres) is adequate for the complete
utilization of treated wastewater for irrigation. Based on the plant records, the SAR value
(Sodium Absorption Ratio) of the soil in the area utilized for treated wastewater irrigation is
about 5.8 which is below 9 as recommended by Indian Council of Agricultural Research
(ICAR).
Photographs of zero liquid discharge status at Sone-river, discharge on land irrigation,
plantation sites are presented in the Figure 2.15. There are sixteen piezometric points
installed to monitor ground water quality on monthly basis. As per the recent test report of
MPPCB dated 25thMarch 2018 (Annexure-9) it was observed that the TDS and Chloride
values were in the range of 477 mg/L to 899 mg/L and 88.6 mg/L to 108.3 mg/L respectively.
Figure 2-15 Discharge of Treated Effluent
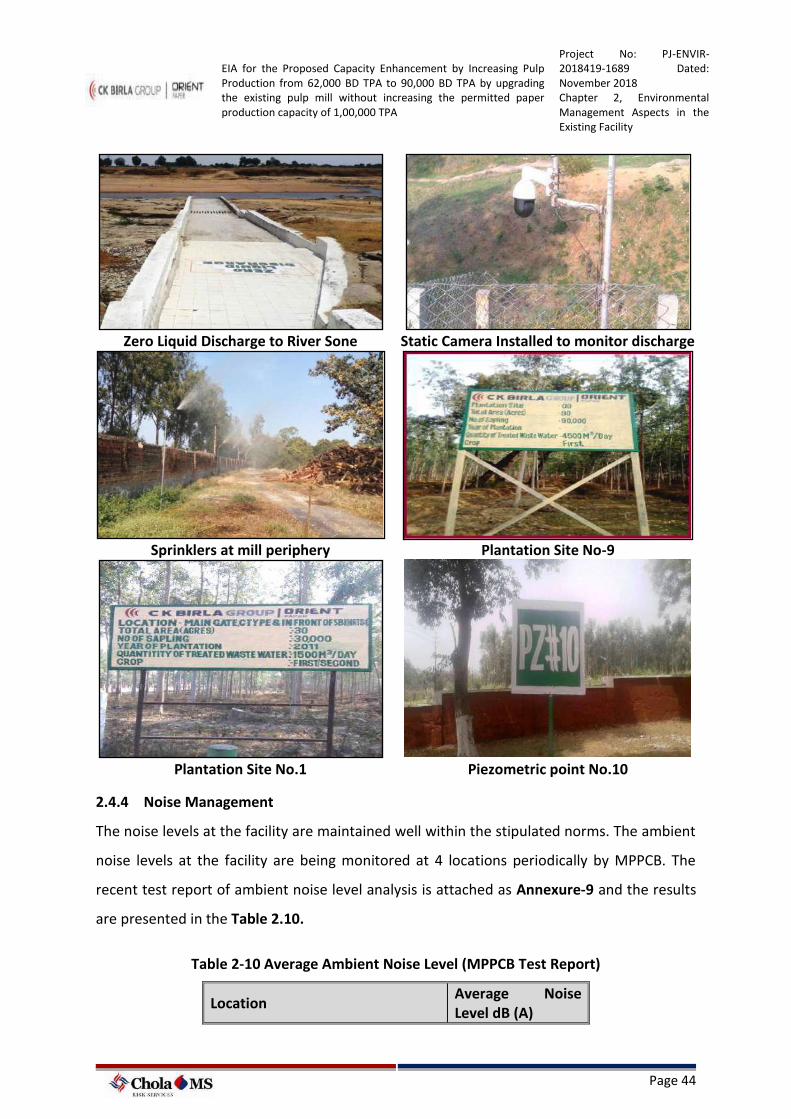
EIA for the Proposed Capacity Enhancement by Increasing Pulp Production from 62,000 BD TPA to 90,000 BD TPA by upgrading the existing pulp mill without increasing the permitted paper production capacity of 1,00,000 TPA
Project No: PJ-ENVIR-2018419-1689 Dated: November 2018 Chapter 2, Environmental Management Aspects in the Existing Facility
Page 44
Zero Liquid Discharge to River Sone Static Camera Installed to monitor discharge
Sprinklers at mill periphery Plantation Site No-9
Plantation Site No.1 Piezometric point No.10
2.4.4 Noise Management
The noise levels at the facility are maintained well within the stipulated norms. The ambient
noise levels at the facility are being monitored at 4 locations periodically by MPPCB. The
recent test report of ambient noise level analysis is attached as Annexure-9 and the results
are presented in the Table 2.10.
Table 2-10 Average Ambient Noise Level (MPPCB Test Report)
Location Average Noise Level dB (A)
EIA for the Proposed Capacity Enhancement by Increasing Pulp Production from 62,000 BD TPA to 90,000 BD TPA by upgrading the existing pulp mill without increasing the permitted paper production capacity of 1,00,000 TPA
Project No: PJ-ENVIR-2018419-1689 Dated: November 2018 Chapter 2, Environmental Management Aspects in the Existing Facility
Page 45
Location Average Noise Level dB (A)
Near Bamboo Gate 71.5
Near Top Roof of Lab 73.6
Near Water Treatment Plant 56.4
Near Guest House 57.8
Ambient Noise level Standard for Industrial Area (Day Time)
75
Source: MPPCB Test Report dated 30/10/2017
2.4.5 Solid and hazardous waste management
Wood saw dust is being used in the boiler as fuel. Fly ash generated is being used in cement
industry and the MoU with cement industry for lifting, disposal and utilization of dry fly ash
is attached as Annexure-10. The sludge from the primary clarifier of the ETP is being
disposed as secondary fibre to the local secondary board manufacturing units for making
egg trays etc and the MoU with industry for dewatering and lifting of sludge for use and the
valid hazardous waste authorization letter from MPPCB is attached as Annexure- 10. The
details of the quantity of solid and hazardous waste generated within the facility are
presented in the Table 2.11.
Table 2-11 Solid and hazardous Waste Generation and Disposal
Sl No Particulars Quantity TPD Recycling/Reuse
1 Bamboo/Wood Dust
8 to 10 Used as fuel in Boiler
2 Coal Ash/ Fly Ash 140 to 180 Used in Cement/Brick manufacturing plants
3 Lime Sludge 50 Reburnt in Lime Kiln installed in plant
4 Lime Grit 10 Used for Road making and filling of low lying area within the mill premises.
5 ETP Sludge – Brown 4 to 5 Sent for Board manufacturing
6 Spent Oil 4 to 5 KL/year Given to authorized reprocessor (MoU attached as Annexure-10)
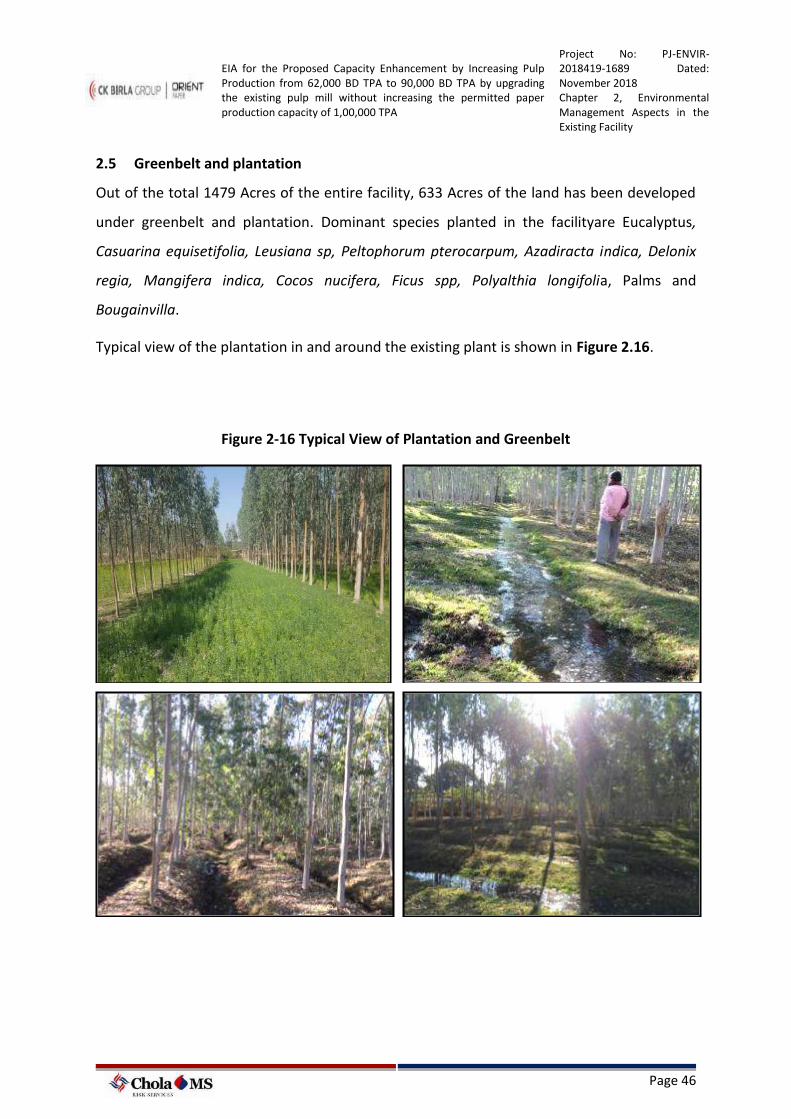
EIA for the Proposed Capacity Enhancement by Increasing Pulp Production from 62,000 BD TPA to 90,000 BD TPA by upgrading the existing pulp mill without increasing the permitted paper production capacity of 1,00,000 TPA
Project No: PJ-ENVIR-2018419-1689 Dated: November 2018 Chapter 2, Environmental Management Aspects in the Existing Facility
Page 46
2.5 Greenbelt and plantation
Out of the total 1479 Acres of the entire facility, 633 Acres of the land has been developed
under greenbelt and plantation. Dominant species planted in the facilityare Eucalyptus,
Casuarina equisetifolia, Leusiana sp, Peltophorum pterocarpum, Azadiracta indica, Delonix
regia, Mangifera indica, Cocos nucifera, Ficus spp, Polyalthia longifolia, Palms and
Bougainvilla.
Typical view of the plantation in and around the existing plant is shown in Figure 2.16.
Figure 2-16 Typical View of Plantation and Greenbelt
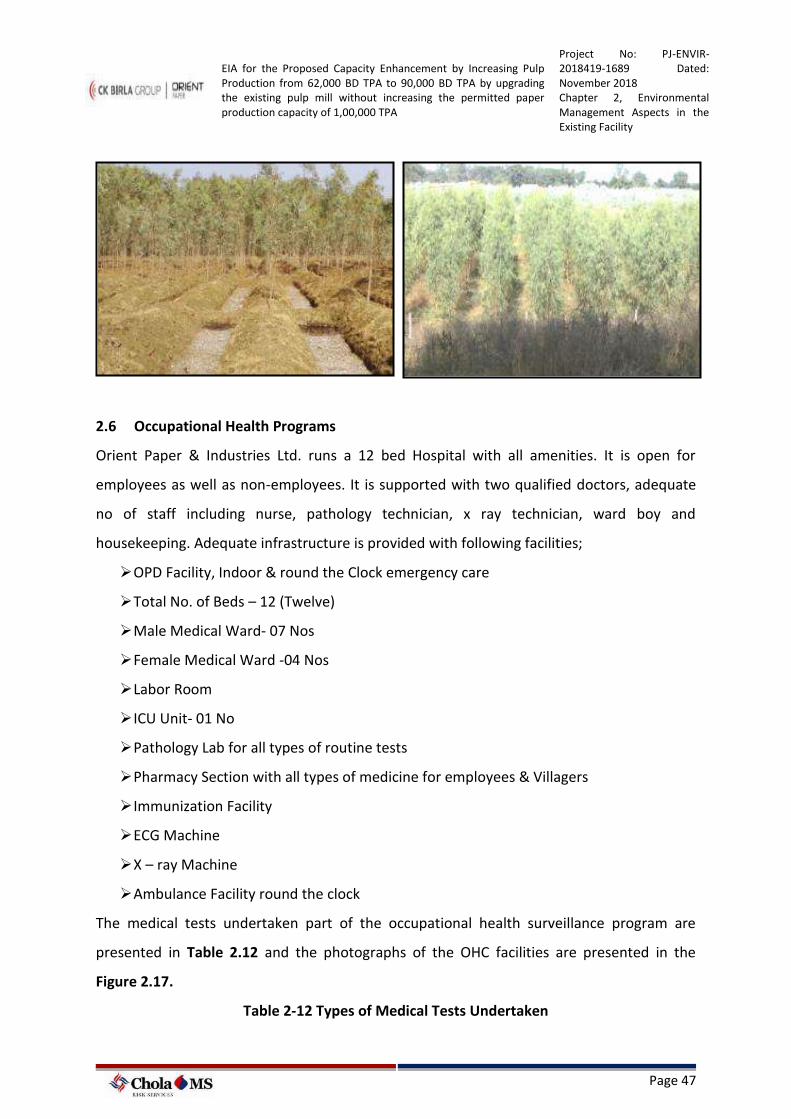
EIA for the Proposed Capacity Enhancement by Increasing Pulp Production from 62,000 BD TPA to 90,000 BD TPA by upgrading the existing pulp mill without increasing the permitted paper production capacity of 1,00,000 TPA
Project No: PJ-ENVIR-2018419-1689 Dated: November 2018 Chapter 2, Environmental Management Aspects in the Existing Facility
Page 47
2.6 Occupational Health Programs
Orient Paper & Industries Ltd. runs a 12 bed Hospital with all amenities. It is open for
employees as well as non-employees. It is supported with two qualified doctors, adequate
no of staff including nurse, pathology technician, x ray technician, ward boy and
housekeeping. Adequate infrastructure is provided with following facilities;
➢ OPD Facility, Indoor & round the Clock emergency care
➢ Total No. of Beds – 12 (Twelve)
➢ Male Medical Ward- 07 Nos
➢ Female Medical Ward -04 Nos
➢ Labor Room
➢ ICU Unit- 01 No
➢ Pathology Lab for all types of routine tests
➢ Pharmacy Section with all types of medicine for employees & Villagers
➢ Immunization Facility
➢ ECG Machine
➢ X – ray Machine
➢ Ambulance Facility round the clock
The medical tests undertaken part of the occupational health surveillance program are
presented in Table 2.12 and the photographs of the OHC facilities are presented in the
Figure 2.17.
Table 2-12 Types of Medical Tests Undertaken
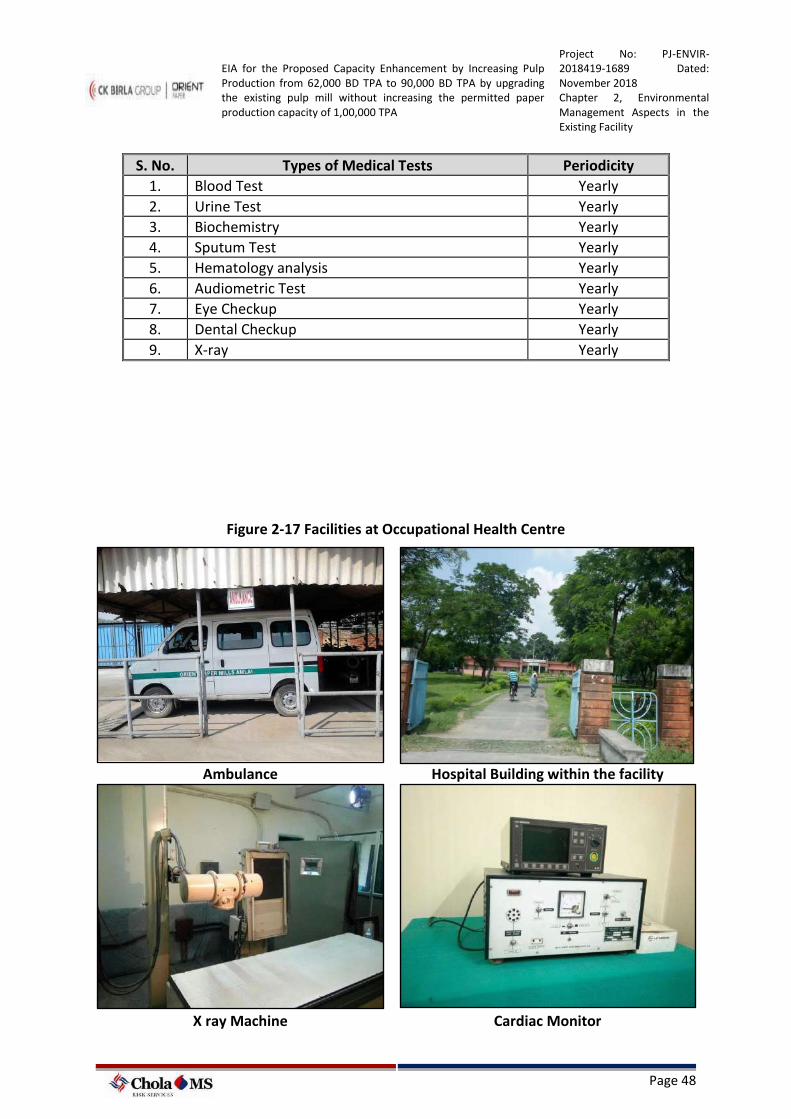
EIA for the Proposed Capacity Enhancement by Increasing Pulp Production from 62,000 BD TPA to 90,000 BD TPA by upgrading the existing pulp mill without increasing the permitted paper production capacity of 1,00,000 TPA
Project No: PJ-ENVIR-2018419-1689 Dated: November 2018 Chapter 2, Environmental Management Aspects in the Existing Facility
Page 48
S. No. Types of Medical Tests Periodicity
1. Blood Test Yearly
2. Urine Test Yearly
3. Biochemistry Yearly
4. Sputum Test Yearly
5. Hematology analysis Yearly
6. Audiometric Test Yearly
7. Eye Checkup Yearly
8. Dental Checkup Yearly
9. X-ray Yearly
Figure 2-17 Facilities at Occupational Health Centre
Ambulance Hospital Building within the facility
X ray Machine Cardiac Monitor
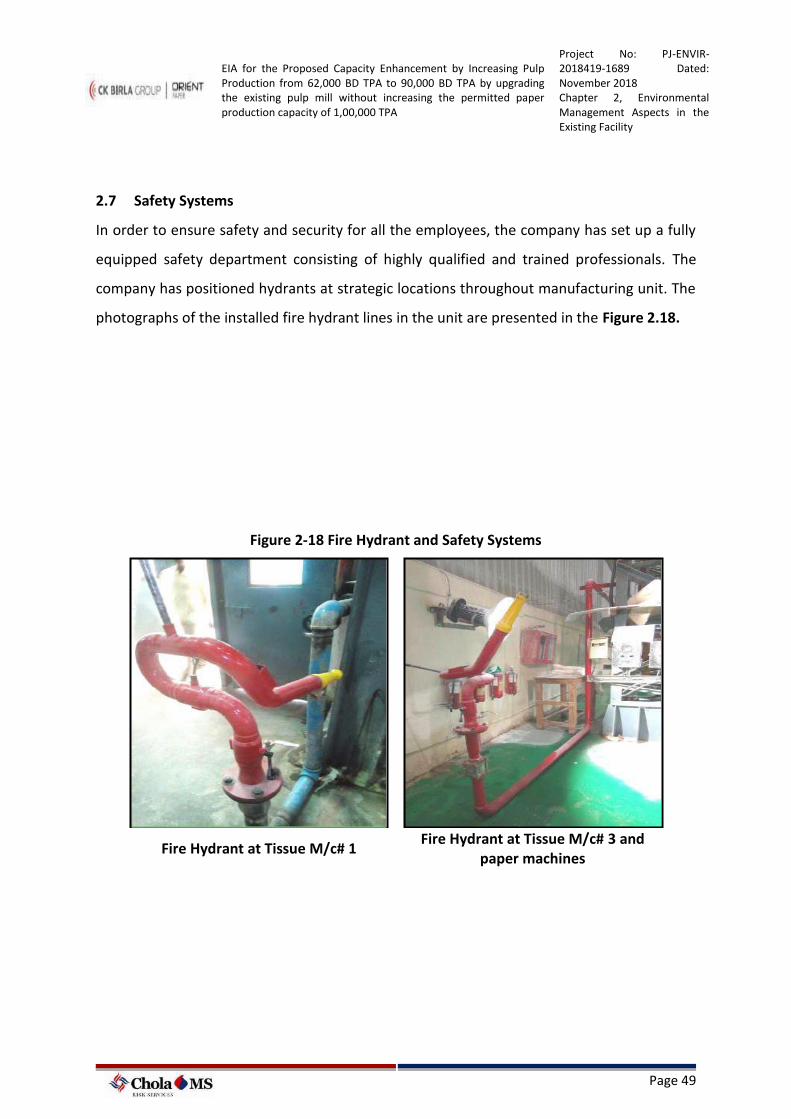
EIA for the Proposed Capacity Enhancement by Increasing Pulp Production from 62,000 BD TPA to 90,000 BD TPA by upgrading the existing pulp mill without increasing the permitted paper production capacity of 1,00,000 TPA
Project No: PJ-ENVIR-2018419-1689 Dated: November 2018 Chapter 2, Environmental Management Aspects in the Existing Facility
Page 49
2.7 Safety Systems
In order to ensure safety and security for all the employees, the company has set up a fully
equipped safety department consisting of highly qualified and trained professionals. The
company has positioned hydrants at strategic locations throughout manufacturing unit. The
photographs of the installed fire hydrant lines in the unit are presented in the Figure 2.18.
Figure 2-18 Fire Hydrant and Safety Systems
Fire Hydrant at Tissue M/c# 1 Fire Hydrant at Tissue M/c# 3 and
paper machines
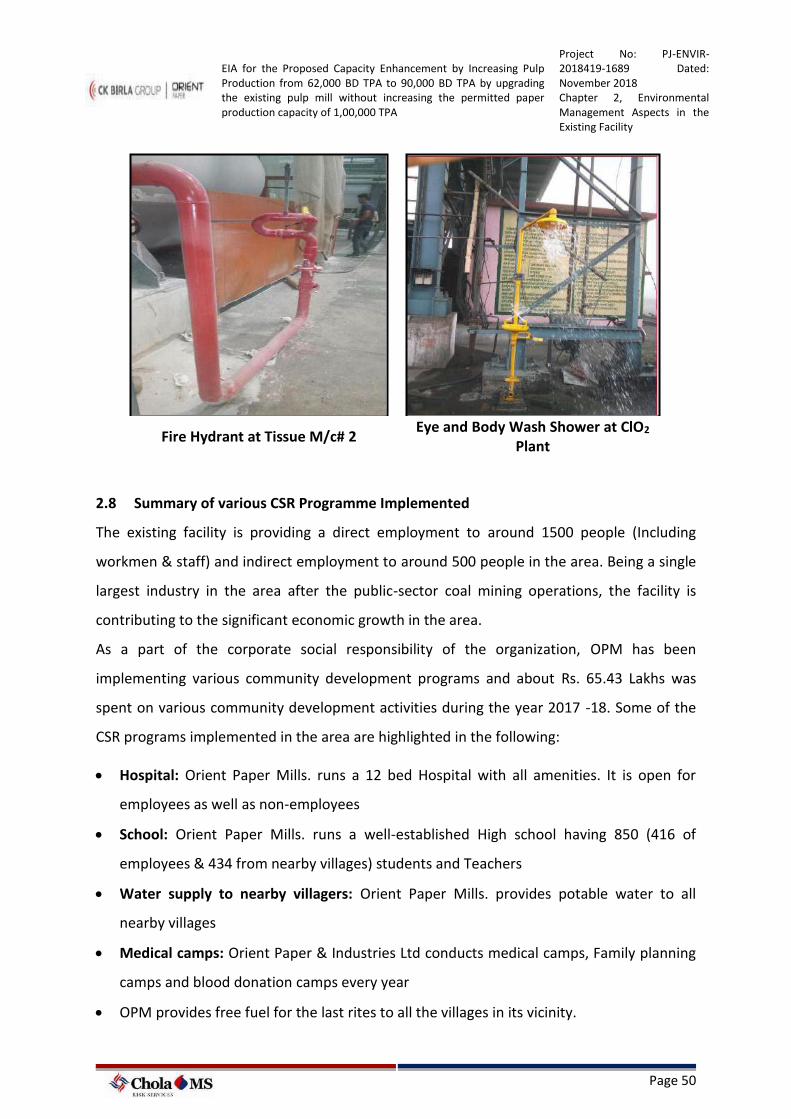
EIA for the Proposed Capacity Enhancement by Increasing Pulp Production from 62,000 BD TPA to 90,000 BD TPA by upgrading the existing pulp mill without increasing the permitted paper production capacity of 1,00,000 TPA
Project No: PJ-ENVIR-2018419-1689 Dated: November 2018 Chapter 2, Environmental Management Aspects in the Existing Facility
Page 50
Fire Hydrant at Tissue M/c# 2 Eye and Body Wash Shower at ClO2
Plant
2.8 Summary of various CSR Programme Implemented
The existing facility is providing a direct employment to around 1500 people (Including
workmen & staff) and indirect employment to around 500 people in the area. Being a single
largest industry in the area after the public-sector coal mining operations, the facility is
contributing to the significant economic growth in the area.
As a part of the corporate social responsibility of the organization, OPM has been
implementing various community development programs and about Rs. 65.43 Lakhs was
spent on various community development activities during the year 2017 -18. Some of the
CSR programs implemented in the area are highlighted in the following:
• Hospital: Orient Paper Mills. runs a 12 bed Hospital with all amenities. It is open for
employees as well as non-employees
• School: Orient Paper Mills. runs a well-established High school having 850 (416 of
employees & 434 from nearby villages) students and Teachers
• Water supply to nearby villagers: Orient Paper Mills. provides potable water to all
nearby villages
• Medical camps: Orient Paper & Industries Ltd conducts medical camps, Family planning
camps and blood donation camps every year
• OPM provides free fuel for the last rites to all the villages in its vicinity.
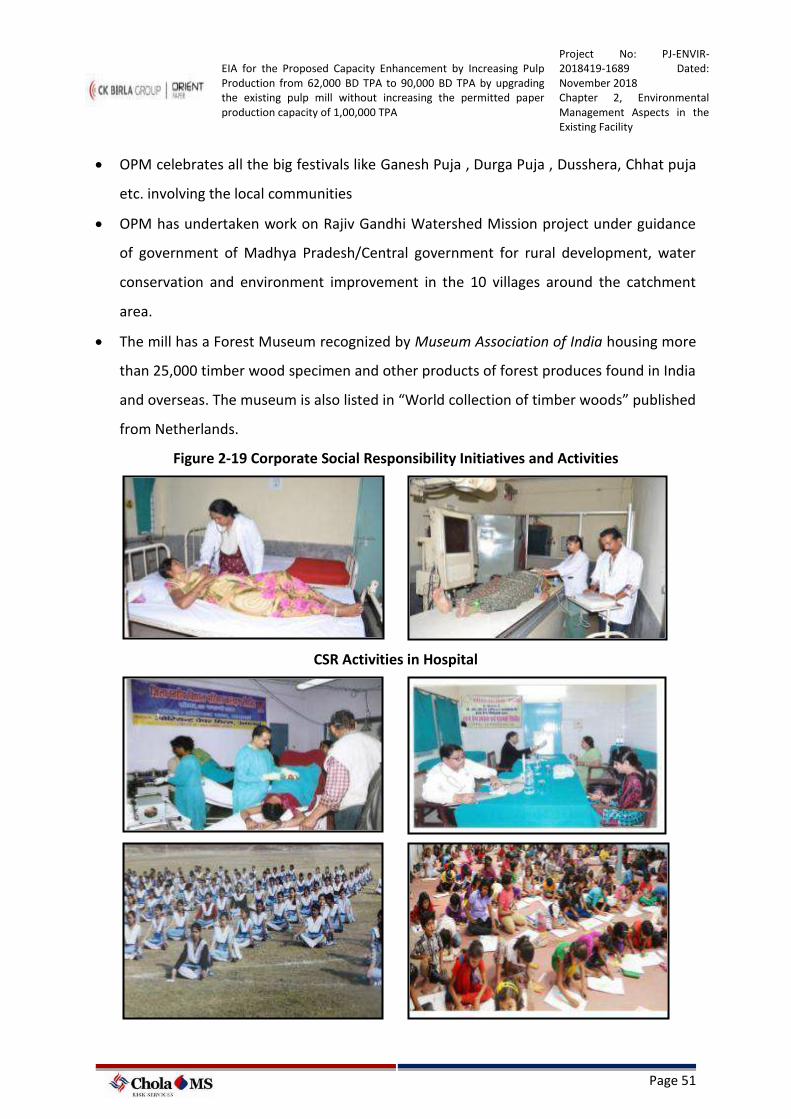
EIA for the Proposed Capacity Enhancement by Increasing Pulp Production from 62,000 BD TPA to 90,000 BD TPA by upgrading the existing pulp mill without increasing the permitted paper production capacity of 1,00,000 TPA
Project No: PJ-ENVIR-2018419-1689 Dated: November 2018 Chapter 2, Environmental Management Aspects in the Existing Facility
Page 51
• OPM celebrates all the big festivals like Ganesh Puja , Durga Puja , Dusshera, Chhat puja
etc. involving the local communities
• OPM has undertaken work on Rajiv Gandhi Watershed Mission project under guidance
of government of Madhya Pradesh/Central government for rural development, water
conservation and environment improvement in the 10 villages around the catchment
area.
• The mill has a Forest Museum recognized by Museum Association of India housing more
than 25,000 timber wood specimen and other products of forest produces found in India
and overseas. The museum is also listed in “World collection of timber woods” published
from Netherlands.
Figure 2-19 Corporate Social Responsibility Initiatives and Activities
CSR Activities in Hospital
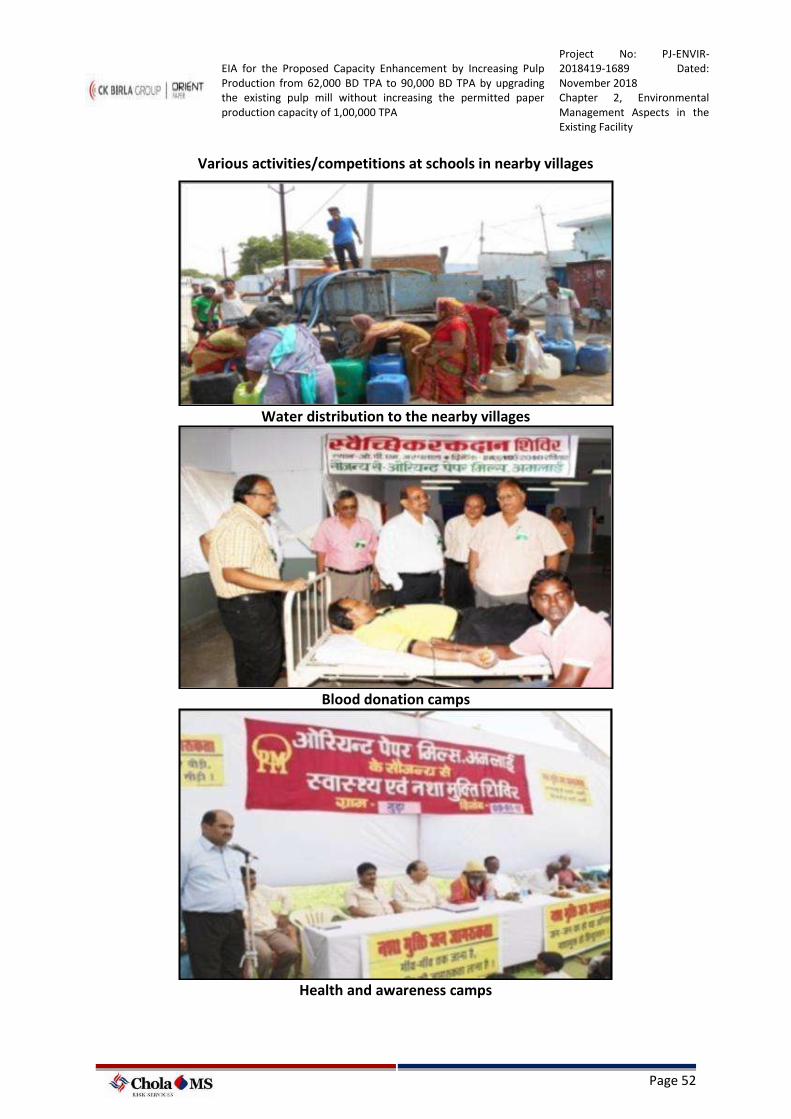
EIA for the Proposed Capacity Enhancement by Increasing Pulp Production from 62,000 BD TPA to 90,000 BD TPA by upgrading the existing pulp mill without increasing the permitted paper production capacity of 1,00,000 TPA
Project No: PJ-ENVIR-2018419-1689 Dated: November 2018 Chapter 2, Environmental Management Aspects in the Existing Facility
Page 52
Various activities/competitions at schools in nearby villages
Water distribution to the nearby villages
Blood donation camps
Health and awareness camps
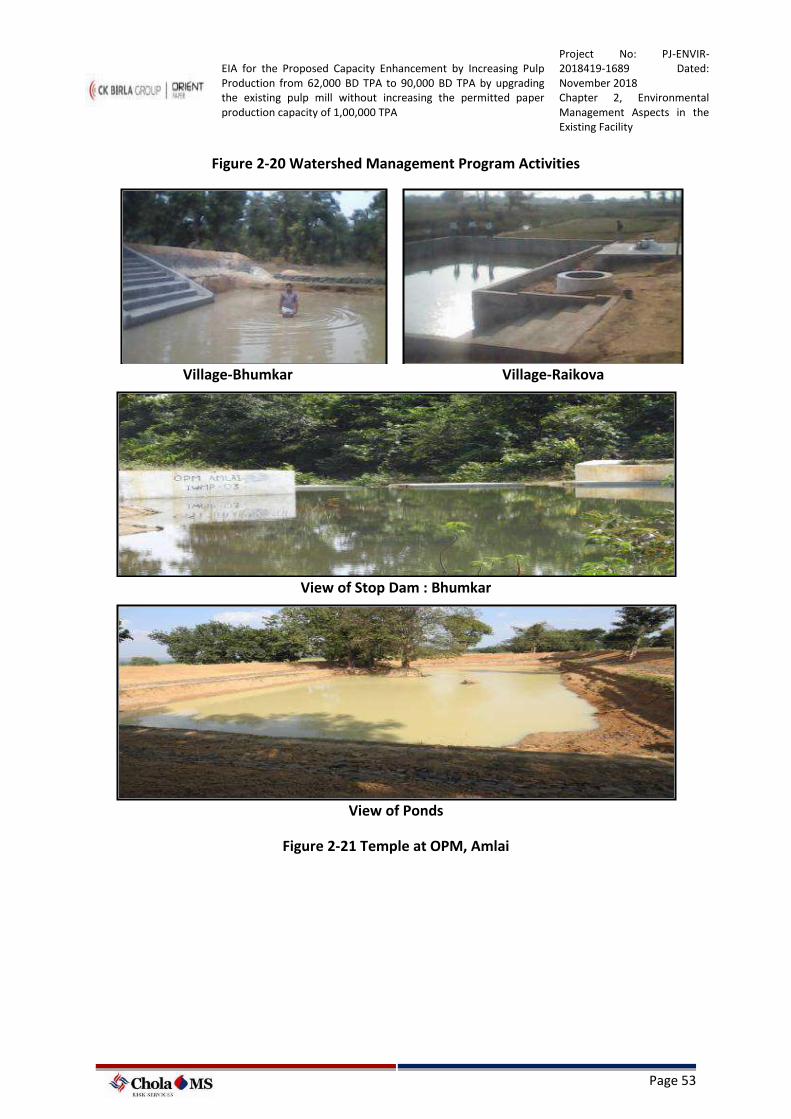
EIA for the Proposed Capacity Enhancement by Increasing Pulp Production from 62,000 BD TPA to 90,000 BD TPA by upgrading the existing pulp mill without increasing the permitted paper production capacity of 1,00,000 TPA
Project No: PJ-ENVIR-2018419-1689 Dated: November 2018 Chapter 2, Environmental Management Aspects in the Existing Facility
Page 53
Figure 2-20 Watershed Management Program Activities
Village-Bhumkar Village-Raikova
View of Stop Dam : Bhumkar
View of Ponds
Figure 2-21 Temple at OPM, Amlai
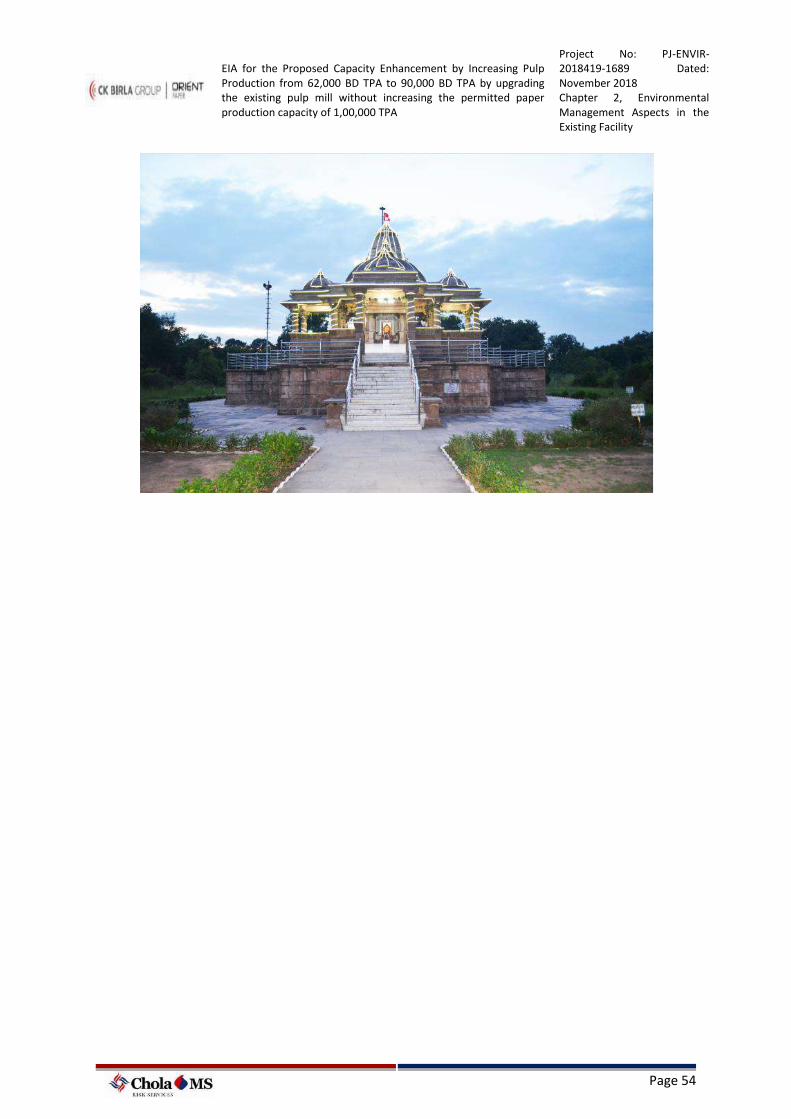
EIA for the Proposed Capacity Enhancement by Increasing Pulp Production from 62,000 BD TPA to 90,000 BD TPA by upgrading the existing pulp mill without increasing the permitted paper production capacity of 1,00,000 TPA
Project No: PJ-ENVIR-2018419-1689 Dated: November 2018 Chapter 2, Environmental Management Aspects in the Existing Facility
Page 54
EIA for the Proposed Capacity Enhancement by Increasing Pulp Production from 62,000 BD TPA to 90,000 BD TPA by upgrading the existing pulp mill without increasing the permitted paper production capacity of 1,00,000 TPA
Project No: PJ-ENVIR-2018419-1689 Dated: November 2018
Chapter-3, Details of the Proposed Project
Page 55
3 DETAILS OF THE PROPOSED PROJECT
3.1 Overview of the Proposal
This chapter illustrates the details of proposed project highlighting the features of
proposals, details of the process to be adopted, raw material requirement, utilities and
services, infrastructural facilities and sources of waste generation, their quantity, treatment
and safe disposal of the waste.
The environmental scenario as achieved in pre-project stage will continue in post project
scenario, without any adverse impact on the environment.
OPM is proposing to increase pulp production level from current consented level of 62,000
BD TPA (182 BD TPD) to 90,000 BD TPA (265 BD TPD) by upgrading the existing pulp mill
with installation of balancing equipment and adoption of ECF technology. No change in the
existing consented paper production capacity of 1,00,000 TPA is envisaged. No additional
land is required as the proposed project includes only up-gradation of existing pulp mill and
enhancement of the production level of in-house pulp.
3.2 Details of the Proposed Increase in Pulp Production
The pulp mill manufacturing process for the proposed project remains same which is
explained in detail in the Chapter 2 of EIA report, except that the existing pulp mill will be
optimized by installation of balancing equipment and adoption of ECF technology. The
following are salient features of the proposal;
• Increasing pulp production level to 90,000 BD TPA from the existing consented level
of 62,000 BD TPA.
• Adoption of ECF Bleaching Technology to eliminate the usage of elemental chlorine.
• Upgradation/Augmentation of Black Liquor (BL) Evaporation capacity.
• Retrofitting of existing Recovery Boiler to handle additional BL solids generated.
• No additional units such as Re-causticizing plant, co-generation plant will be
envisaged as the existing units are adequate for additional pulp production.
• Decrease in freshwater consumption and wastewater generation quantities.
EIA for the Proposed Capacity Enhancement by Increasing Pulp Production from 62,000 BD TPA to 90,000 BD TPA by upgrading the existing pulp mill without increasing the permitted paper production capacity of 1,00,000 TPA
Project No: PJ-ENVIR-2018419-1689 Dated: November 2018
Chapter-3, Details of the Proposed Project
Page 56
The overview of the proposed capacities are presented in the Table 3.1.
Table 3-1 Overview of the Plant Capacities during Post Project Scenario
SL No
. Description Units
Existing Installe
d Capacity
Existing Permitte
d Capacity
Post Project Scenari
o
Remarks
1 Products
1.1
Paper (Writing, printing and color)
tpa 45,000 45,000 45,000 No change
1.2 Tissue Paper tpa 55,000 55,000 55,000 No change
1.3 Total Paper Production
tpa 1,00,000 1,00,000 1,00,00
0 No change
2 Pulp Mill
2.1 In house Pulp Mill
BD tpa 93,500 62,000 90,000
The existing chlorine based bleaching technology will be replaced with ECF bleaching. Upgradation/Augmentation of Black liquor Evaporation capacity
3 Steam Generation
3.1 Stoker fired boilers
TPH 2x90 2x90 2x90 No Change
3.2 CFBC boiler TPH 1x100 1x100 1x100 No Change
3.3 AFBC boiler TPH 1x150 1x150 1x150 No Change
3.4 Recovery Boiler steam generation
TPH 70 60 70 Retrofitting the existing recovery boiler to meet the additional solids firing and to produce desired additional steam
3.5 Total Steam Generation
TPH 500 490 500
4 Captive Power Generation
4.1 TG#1 MW 30 30 30 No Change
4.2 TG#2 MW 25 25 25 No Change
4.3
Total Captive Power Plant Capacity
MW 55 55 55 No Change
5 Others
5.1 Producer Gas (PG) Plant
Nm³/hr
4645 4645 4645 No Change
EIA for the Proposed Capacity Enhancement by Increasing Pulp Production from 62,000 BD TPA to 90,000 BD TPA by upgrading the existing pulp mill without increasing the permitted paper production capacity of 1,00,000 TPA
Project No: PJ-ENVIR-2018419-1689 Dated: November 2018
Chapter-3, Details of the Proposed Project
Page 57
SL No
. Description Units
Existing Installe
d Capacity
Existing Permitte
d Capacity
Post Project Scenari
o
Remarks
5.2
Precipitated Calcium Carbonate (PCC) Plant (Slurry form)
tpa 8000 8000 8000 No Change
5.3 Rotary Lime Kiln
tpa 39,600 39,600 39,600 No Change
6 Water and Wastewater
6.1
Water Allocation for withdrawl from River
m3/day 36,000 36,000 36,000
The facility has obtained water allocation permission from Water Resource Department, Madhya Pradesh is 12.46 M.Cum/ annum (36000 m3/day).
6.2 Fresh water consumption
m3/day 20,250 22,150 17225 Reduction due to increased recycling and adoption of ECF bleaching in pulp mill
6.3
Supply of Fresh water to nearby villages as a part of CSR program
m3/day 5,000 5,000 5,000 No Change
6.3 Wastewater generation
m3/day 10,790 12,120 9265 Reduction due to reduced fresh water consumption
6.4
Wastewater Treatment Plant capacity
m3/day 20,500 20,500 20,500 Existing ETP is adequate
3.2.1 Proposed Pulping Process
3.2.1.1 Wood processing and Digestion
Additional wood required for the proposed project will be in the order of 222 TPD as against
the current consumption of about 483 TPD. The wood and bamboo will be processed in the
existing chipper house with 3 numbers of chippers of adequate capacity and washed with
treated wastewater. The processed wood will be then digested in the existing digesters
EIA for the Proposed Capacity Enhancement by Increasing Pulp Production from 62,000 BD TPA to 90,000 BD TPA by upgrading the existing pulp mill without increasing the permitted paper production capacity of 1,00,000 TPA
Project No: PJ-ENVIR-2018419-1689 Dated: November 2018
Chapter-3, Details of the Proposed Project
Page 58
using the white liquor (comprising of the digesting chemicals) from the re- causticizing unit
at an elevated temperature using steam and hot water. Additional quantity of digesting
chemicals of about 37 TPD will be required for producing additional 83 TPD pulp.
3.2.1.2 Bleaching Process
In order to optimize the existing pulp mill manufacturing process, it is proposed to install
balancing equipment and adoption of ECF technology in the bleaching section of the pulp
mill. Elemental Chlorine free (ECF) is a technique that uses Chlorine Dioxide for the
bleaching of pulp whereas conventional bleaching uses elemental Chlorine, the advantages
of ECF bleaching are lower energy consumption, better fiber properties with better yield,
thus saving natural resources. Presently up to 60 Kg of Chlorine (Cl2) and 6 Kg of Chlorine
Dioxide (ClO2) per tonne of pulp production, is being used with the existing bleaching
process (CDEpHD- Chlorine Stage, Alkaline Extraction, Hypochlorite, Chlorine Dioxide).
During the post project scenario this bleaching sequence will be replaced with proposed ECF
Bleaching sequence (D0EpD1D2 – chlorine dioxide, alkaline extraction) where Chlorine
Dioxide (ClO2) will be used up to 25 Kg/T and use of Chlorine & Lime for Hypo for direct
bleaching will be eliminated. Hence the proposed project involves in increasing the
production of Chlorine Dioxide to cater to the requirements of ECF bleaching. The existing
ClO2 plant shall be upgraded from 2.5 TPD to 7.5 TPD capacity.
The manufacturing process of ClO2 is presented below;
3.2.1.3 Chlorine Dioxide Manufacturing Process
The increased ClO2 consumption for the proposed project will be generated from existing
ClO2 plant which shall be upgraded from existing 2.5 TPD to 7.5 TPD capacity.
The existing Chlorine Dioxide Manufacturing Plant (@2500 kg/day of 7g/L) was originally
designed to produce chlorine dioxide by the R-2 process, where sodium chlorate is
converted to chlorine dioxide using Sodium Chloride in a strong solution of Sulphuric acid.
This process was converted to eco-friendly HP-A (Hydrogen Peroxide Atmospheric) process
in the year 2015, where the usage of sodium chloride is eliminated and H2O2 is used as
reducing agent, which reduces sodium chlorate in presence of strong acid medium of
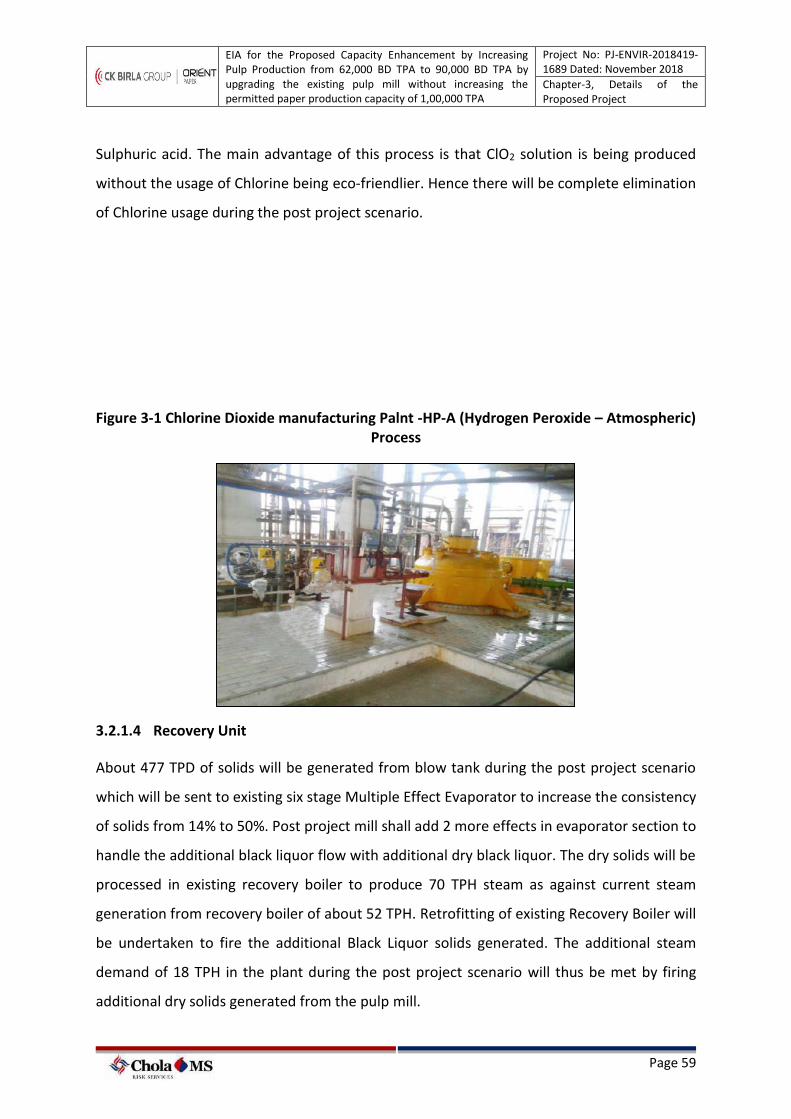
EIA for the Proposed Capacity Enhancement by Increasing Pulp Production from 62,000 BD TPA to 90,000 BD TPA by upgrading the existing pulp mill without increasing the permitted paper production capacity of 1,00,000 TPA
Project No: PJ-ENVIR-2018419-1689 Dated: November 2018
Chapter-3, Details of the Proposed Project
Page 59
Sulphuric acid. The main advantage of this process is that ClO2 solution is being produced
without the usage of Chlorine being eco-friendlier. Hence there will be complete elimination
of Chlorine usage during the post project scenario.
Figure 3-1 Chlorine Dioxide manufacturing Palnt -HP-A (Hydrogen Peroxide – Atmospheric) Process
3.2.1.4 Recovery Unit
About 477 TPD of solids will be generated from blow tank during the post project scenario
which will be sent to existing six stage Multiple Effect Evaporator to increase the consistency
of solids from 14% to 50%. Post project mill shall add 2 more effects in evaporator section to
handle the additional black liquor flow with additional dry black liquor. The dry solids will be
processed in existing recovery boiler to produce 70 TPH steam as against current steam
generation from recovery boiler of about 52 TPH. Retrofitting of existing Recovery Boiler will
be undertaken to fire the additional Black Liquor solids generated. The additional steam
demand of 18 TPH in the plant during the post project scenario will thus be met by firing
additional dry solids generated from the pulp mill.
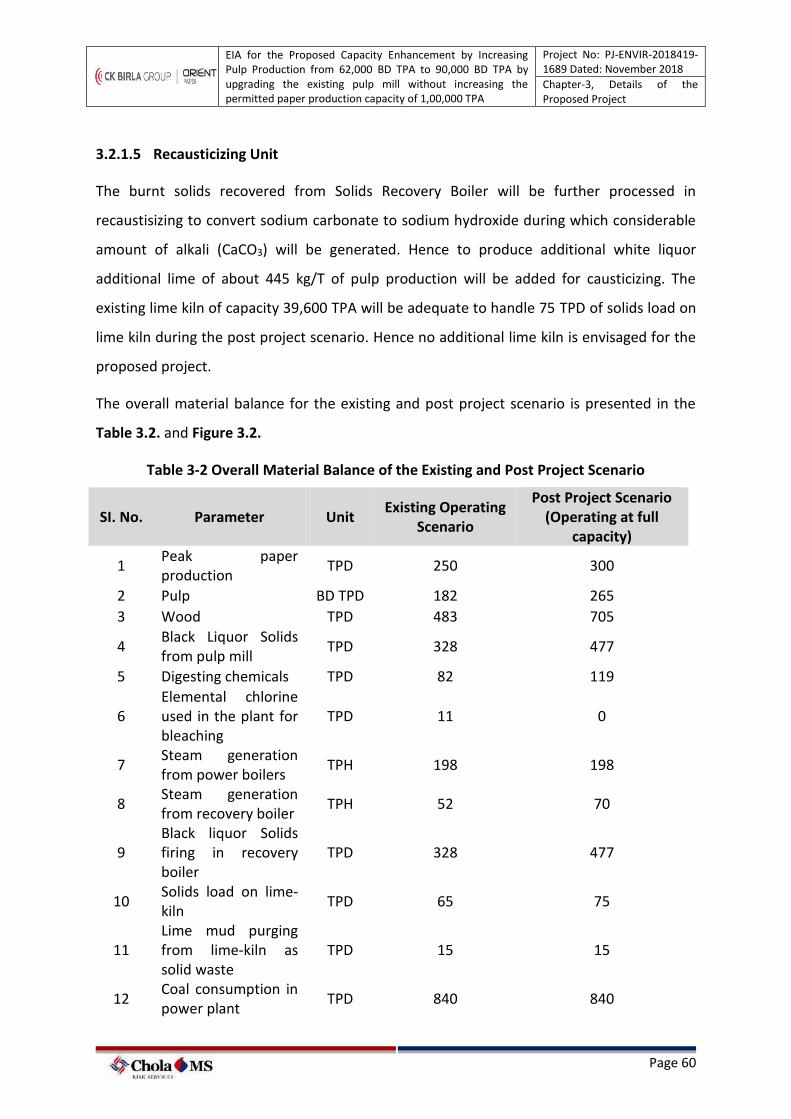
EIA for the Proposed Capacity Enhancement by Increasing Pulp Production from 62,000 BD TPA to 90,000 BD TPA by upgrading the existing pulp mill without increasing the permitted paper production capacity of 1,00,000 TPA
Project No: PJ-ENVIR-2018419-1689 Dated: November 2018
Chapter-3, Details of the Proposed Project
Page 60
3.2.1.5 Recausticizing Unit
The burnt solids recovered from Solids Recovery Boiler will be further processed in
recaustisizing to convert sodium carbonate to sodium hydroxide during which considerable
amount of alkali (CaCO3) will be generated. Hence to produce additional white liquor
additional lime of about 445 kg/T of pulp production will be added for causticizing. The
existing lime kiln of capacity 39,600 TPA will be adequate to handle 75 TPD of solids load on
lime kiln during the post project scenario. Hence no additional lime kiln is envisaged for the
proposed project.
The overall material balance for the existing and post project scenario is presented in the
Table 3.2. and Figure 3.2.
Table 3-2 Overall Material Balance of the Existing and Post Project Scenario
SI. No. Parameter Unit Existing Operating
Scenario
Post Project Scenario (Operating at full
capacity)
1 Peak paper production
TPD 250 300
2 Pulp BD TPD 182 265
3 Wood TPD 483 705
4 Black Liquor Solids from pulp mill
TPD 328 477
5 Digesting chemicals TPD 82 119
6 Elemental chlorine used in the plant for bleaching
TPD 11 0
7 Steam generation from power boilers
TPH 198 198
8 Steam generation from recovery boiler
TPH 52 70
9 Black liquor Solids firing in recovery boiler
TPD 328 477
10 Solids load on lime-kiln
TPD 65 75
11 Lime mud purging from lime-kiln as solid waste
TPD 15 15
12 Coal consumption in power plant
TPD 840 840

EIA for the Proposed Capacity Enhancement by Increasing Pulp Production from 62,000 BD TPA to 90,000 BD TPA by upgrading the existing pulp mill without increasing the permitted paper production capacity of 1,00,000 TPA
Project No: PJ-ENVIR-2018419-1689 Dated: November 2018
Chapter-3, Details of the Proposed Project
Page 61
13 Power Demand (including auxiliary power)
MW 36 37
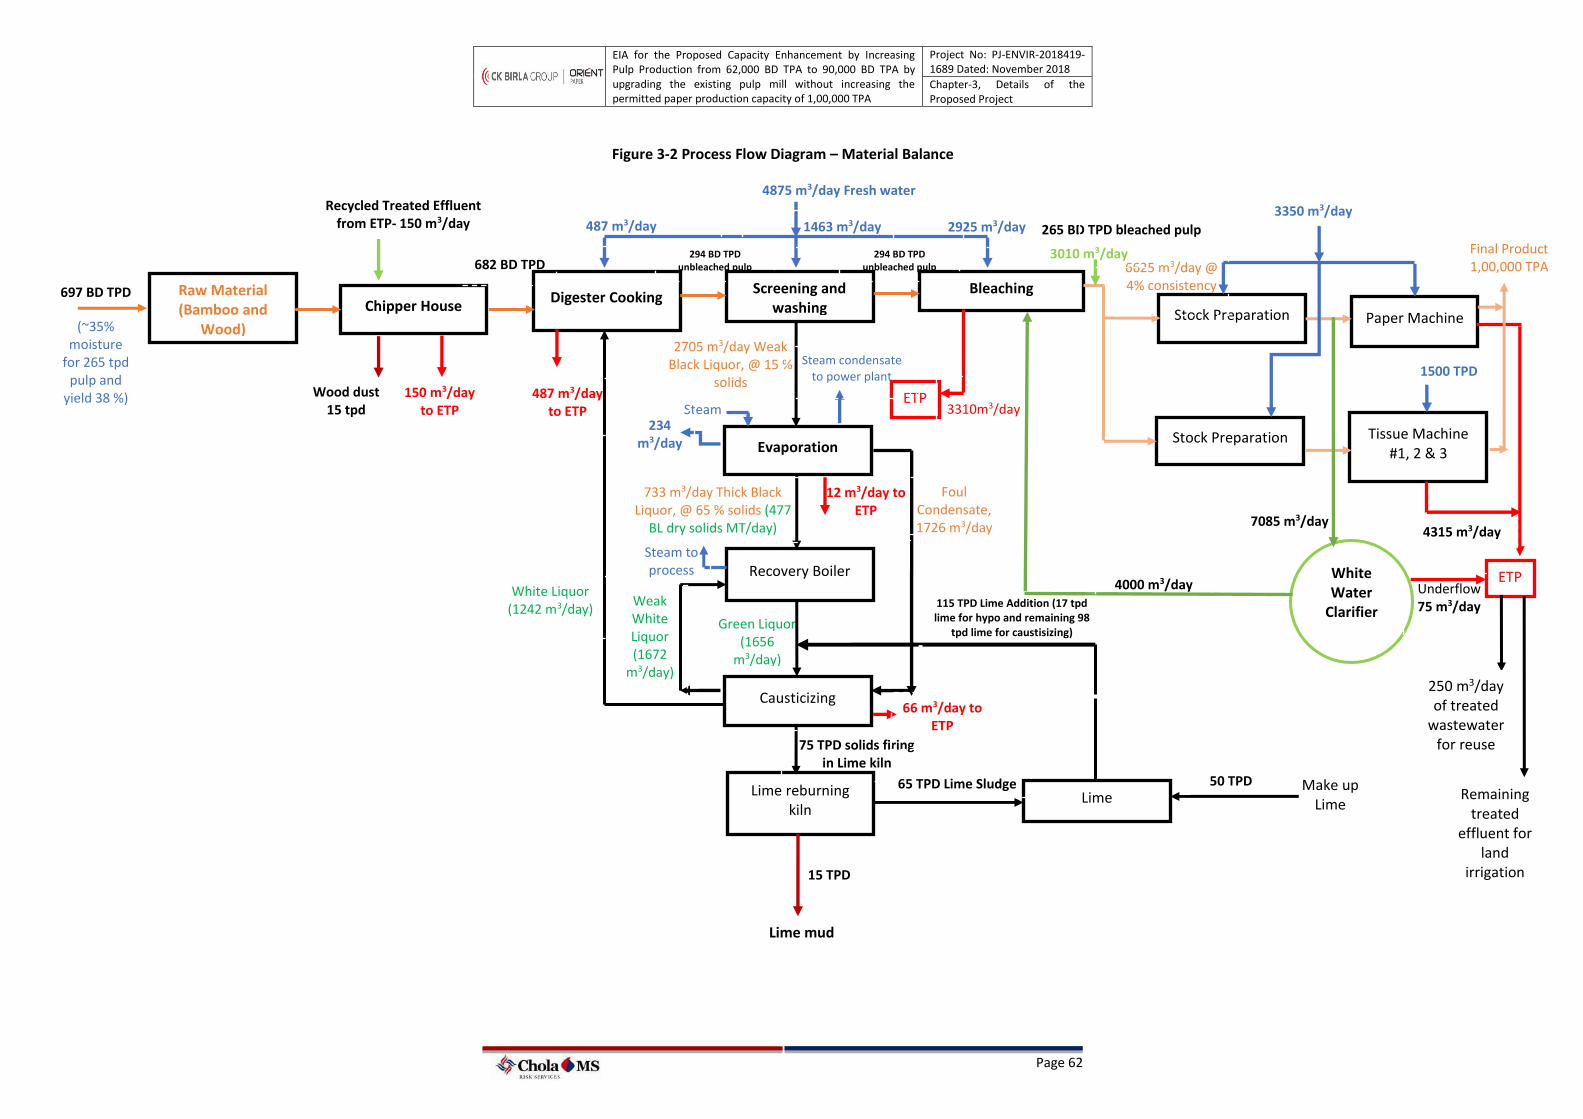
EIA for the Proposed Capacity Enhancement by Increasing Pulp Production from 62,000 BD TPA to 90,000 BD TPA by upgrading the existing pulp mill without increasing the permitted paper production capacity of 1,00,000 TPA
Project No: PJ-ENVIR-2018419-1689 Dated: November 2018
Chapter-3, Details of the Proposed Project
Page 62
7085 m3/day
Figure 3-2 Process Flow Diagram – Material Balance
2705 m3/day Weak Black Liquor, @ 15 %
solids
Green Liquor (1656
m3/day)
697 BD TPD Raw Material (Bamboo and
Wood)
Chipper House Digester Cooking
Screening and washing
Bleaching
Stock Preparation
Stock Preparation Tissue Machine #1, 2 & 3
Paper Machine
Evaporation
Recovery Boiler
Causticizing
Lime reburning kiln
Lime
4875 m3/day Fresh water
Steam ETP
Foul Condensate, 1726 m3/day
733 m3/day Thick Black Liquor, @ 65 % solids (477
BL dry solids MT/day)
115 TPD Lime Addition (17 tpd lime for hypo and remaining 98
tpd lime for caustisizing)
75 TPD solids firing in Lime kiln
65 TPD Lime Sludge
15 TPD
Lime mud
Make up Lime
50 TPD
ETP
3310m3/day
3350 m3/day
1500 TPD
7859 TPD 4315 m3/day
(~35% moisture
for 265 tpd pulp and
yield 38 %)
White Water
Clarifier
Recycled Treated Effluent from ETP- 150 m3/day
150 m3/day to ETP
Steam to process
6625 m3/day @ 4% consistency
4000 m3/day Underflow 75 m3/day
Final Product 1,00,000 TPA
250 m3/day of treated
wastewater for reuse
Remaining treated
effluent for land
irrigation
294 BD TPD unbleached pulp
265 BD TPD bleached pulp
294 BD TPD unbleached pulp
White Liquor (1242 m3/day)
Wood dust 15 tpd
682 BD TPD
Steam condensate to power plant
Weak White Liquor (1672
m3/day)
2925 m3/day
234 m3/day
1463 m3/day 487 m3/day
12 m3/day to ETP
66 m3/day to ETP
487 m3/day to ETP
3010 m3/day
EIA for the Proposed Capacity Enhancement by Increasing Pulp Production from 62,000 BD TPA to 90,000 BD TPA by upgrading the existing pulp mill without increasing the permitted paper production capacity of 1,00,000 TPA
Project No: PJ-ENVIR-2018419-1689 Dated: November 2018
Chapter-3, Details of the Proposed Project
Page 63
3.3 Input Requirements and Sources
The major inputs for the production of pulp are
➢ Wood
➢ Chemicals
➢ Steam
➢ Power
➢ Water
3.3.1 Land Requirement
No additional land is required as the proposed project includes only up-gradation of existing
pulp mill and enhancement of the production of in-house pulp.
3.3.2 Raw Material requirement:
Existing consented wood consumption is 1,65,000 TPA (483 TPD). The total Wood
requirement during the post project scenario is estimated as 2,40,000 TPD. Hence the
additional 80,000 TPA of wood is required for the proposed project which will be sourced as
per existing practice from plantation area of OPM and farm forestry program undertaken in
18 districts of Madhya Pradesh and Chhattisgarh. Since the in-house pulp production level
will be increased, there will be a reduction in usage of costly imported purchased pulp.
Currently the existing facility is consented with usage of 32,000 TPA of imported pulp which
will be reduced to 4000 TPA during the post project scenario. The Table 3.3 presents the
details of raw material requirement.
Table 3-3 Raw Material Requirement (Existing v/s Post project Scenario)
Description Unit Existing Scenario
Additional requirement
Post Project Scenario
Total Wood TPA 1,60,000 80,000 2,40,000
Imported Purchased Pulp
TPA 32,000 Reduction by
28,000 4000
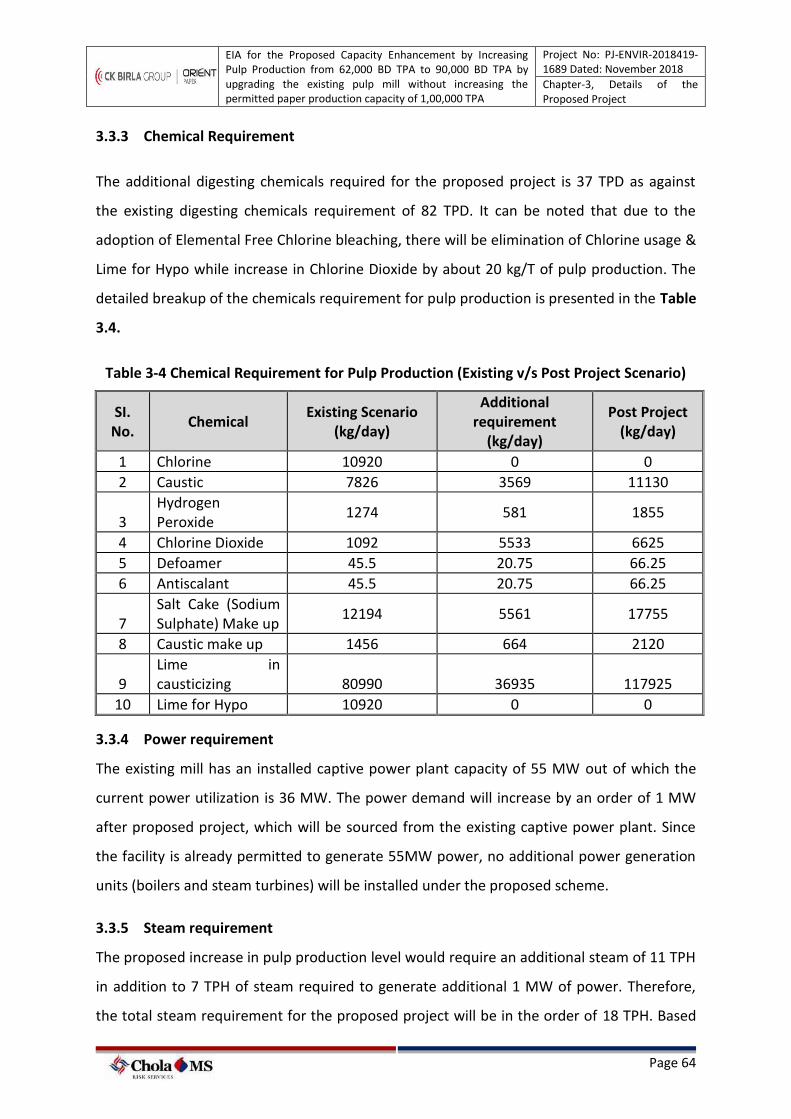
EIA for the Proposed Capacity Enhancement by Increasing Pulp Production from 62,000 BD TPA to 90,000 BD TPA by upgrading the existing pulp mill without increasing the permitted paper production capacity of 1,00,000 TPA
Project No: PJ-ENVIR-2018419-1689 Dated: November 2018
Chapter-3, Details of the Proposed Project
Page 64
3.3.3 Chemical Requirement
The additional digesting chemicals required for the proposed project is 37 TPD as against
the existing digesting chemicals requirement of 82 TPD. It can be noted that due to the
adoption of Elemental Free Chlorine bleaching, there will be elimination of Chlorine usage &
Lime for Hypo while increase in Chlorine Dioxide by about 20 kg/T of pulp production. The
detailed breakup of the chemicals requirement for pulp production is presented in the Table
3.4.
Table 3-4 Chemical Requirement for Pulp Production (Existing v/s Post Project Scenario)
SI. No.
Chemical Existing Scenario
(kg/day)
Additional requirement
(kg/day)
Post Project (kg/day)
1 Chlorine 10920 0 0
2 Caustic 7826 3569 11130
3 Hydrogen Peroxide
1274 581 1855
4 Chlorine Dioxide 1092 5533 6625
5 Defoamer 45.5 20.75 66.25
6 Antiscalant 45.5 20.75 66.25
7 Salt Cake (Sodium Sulphate) Make up
12194 5561 17755
8 Caustic make up 1456 664 2120
9 Lime in causticizing 80990 36935 117925
10 Lime for Hypo 10920 0 0
3.3.4 Power requirement
The existing mill has an installed captive power plant capacity of 55 MW out of which the
current power utilization is 36 MW. The power demand will increase by an order of 1 MW
after proposed project, which will be sourced from the existing captive power plant. Since
the facility is already permitted to generate 55MW power, no additional power generation
units (boilers and steam turbines) will be installed under the proposed scheme.
3.3.5 Steam requirement
The proposed increase in pulp production level would require an additional steam of 11 TPH
in addition to 7 TPH of steam required to generate additional 1 MW of power. Therefore,
the total steam requirement for the proposed project will be in the order of 18 TPH. Based
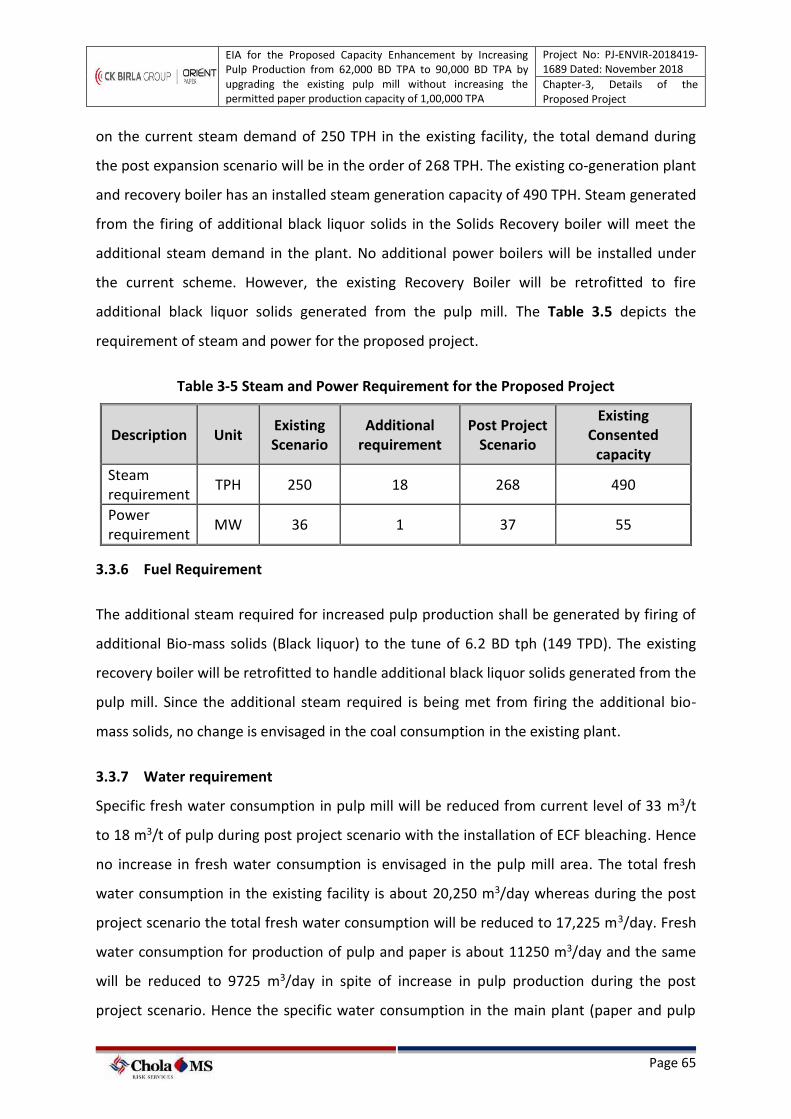
EIA for the Proposed Capacity Enhancement by Increasing Pulp Production from 62,000 BD TPA to 90,000 BD TPA by upgrading the existing pulp mill without increasing the permitted paper production capacity of 1,00,000 TPA
Project No: PJ-ENVIR-2018419-1689 Dated: November 2018
Chapter-3, Details of the Proposed Project
Page 65
on the current steam demand of 250 TPH in the existing facility, the total demand during
the post expansion scenario will be in the order of 268 TPH. The existing co-generation plant
and recovery boiler has an installed steam generation capacity of 490 TPH. Steam generated
from the firing of additional black liquor solids in the Solids Recovery boiler will meet the
additional steam demand in the plant. No additional power boilers will be installed under
the current scheme. However, the existing Recovery Boiler will be retrofitted to fire
additional black liquor solids generated from the pulp mill. The Table 3.5 depicts the
requirement of steam and power for the proposed project.
Table 3-5 Steam and Power Requirement for the Proposed Project
Description Unit Existing Scenario
Additional requirement
Post Project Scenario
Existing Consented
capacity
Steam requirement
TPH 250 18 268 490
Power requirement
MW 36 1 37 55
3.3.6 Fuel Requirement
The additional steam required for increased pulp production shall be generated by firing of
additional Bio-mass solids (Black liquor) to the tune of 6.2 BD tph (149 TPD). The existing
recovery boiler will be retrofitted to handle additional black liquor solids generated from the
pulp mill. Since the additional steam required is being met from firing the additional bio-
mass solids, no change is envisaged in the coal consumption in the existing plant.
3.3.7 Water requirement
Specific fresh water consumption in pulp mill will be reduced from current level of 33 m3/t
to 18 m3/t of pulp during post project scenario with the installation of ECF bleaching. Hence
no increase in fresh water consumption is envisaged in the pulp mill area. The total fresh
water consumption in the existing facility is about 20,250 m3/day whereas during the post
project scenario the total fresh water consumption will be reduced to 17,225 m3/day. Fresh
water consumption for production of pulp and paper is about 11250 m3/day and the same
will be reduced to 9725 m3/day in spite of increase in pulp production during the post
project scenario. Hence the specific water consumption in the main plant (paper and pulp
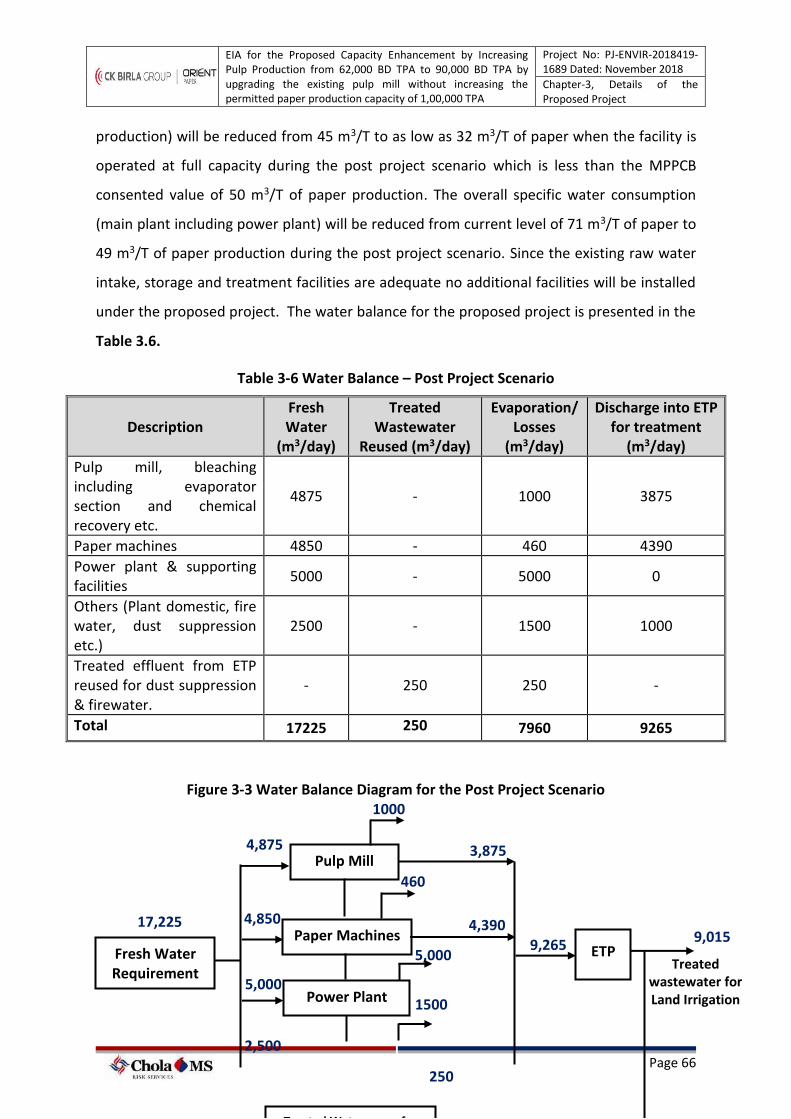
EIA for the Proposed Capacity Enhancement by Increasing Pulp Production from 62,000 BD TPA to 90,000 BD TPA by upgrading the existing pulp mill without increasing the permitted paper production capacity of 1,00,000 TPA
Project No: PJ-ENVIR-2018419-1689 Dated: November 2018
Chapter-3, Details of the Proposed Project
Page 66
production) will be reduced from 45 m3/T to as low as 32 m3/T of paper when the facility is
operated at full capacity during the post project scenario which is less than the MPPCB
consented value of 50 m3/T of paper production. The overall specific water consumption
(main plant including power plant) will be reduced from current level of 71 m3/T of paper to
49 m3/T of paper production during the post project scenario. Since the existing raw water
intake, storage and treatment facilities are adequate no additional facilities will be installed
under the proposed project. The water balance for the proposed project is presented in the
Table 3.6.
Table 3-6 Water Balance – Post Project Scenario
Description Fresh Water
(m3/day)
Treated Wastewater
Reused (m3/day)
Evaporation/Losses
(m3/day)
Discharge into ETP for treatment
(m3/day)
Pulp mill, bleaching including evaporator section and chemical recovery etc.
4875 - 1000 3875
Paper machines 4850 - 460 4390
Power plant & supporting facilities
5000 - 5000 0
Others (Plant domestic, fire water, dust suppression etc.)
2500 - 1500 1000
Treated effluent from ETP reused for dust suppression & firewater.
- 250 250 -
Total 17225 250 7960 9265
Figure 3-3 Water Balance Diagram for the Post Project Scenario
Pulp Mill
Paper Machines
Power Plant
Fresh Water Requirement
Treated Water reuse for
17,225
4,875
4,850
5,000
2,500
250
250
1500
5,000
460
1000
ETP
3,875
4,390 9,265
9,015
Treated wastewater for Land Irrigation
EIA for the Proposed Capacity Enhancement by Increasing Pulp Production from 62,000 BD TPA to 90,000 BD TPA by upgrading the existing pulp mill without increasing the permitted paper production capacity of 1,00,000 TPA
Project No: PJ-ENVIR-2018419-1689 Dated: November 2018
Chapter-3, Details of the Proposed Project
Page 67
3.3.8 Proposed Project Cost
The estimated project cost for the proposed project is Rs 40 crores. Out of this, about Rs. 28
crores is allocated for ECF technology upgrades for improving the environmental
performance of the mill and for the upgradation of ESP of chemical recovery boiler.
Table 3-7 Project Cost Estimate- Pulp Mill upgradation to manufacture 90,000 TPA of Pulp production
S.No Description of Item Estimated Cost
(Rs. Crores)
1 Machinery and Equipment Cost in Pulp Mill & Recovery section
30
2 Electrical and Instrumentation Cost & Piping 8
3 Civil Works Cost 2
Total 40
3.3.9 Project Schedule
The proposed upgradation of pulp mill will be commissioned in 12 months from the date of
receipt of necessary permits and clearances from various statutory agencies.
Domestic 1,000
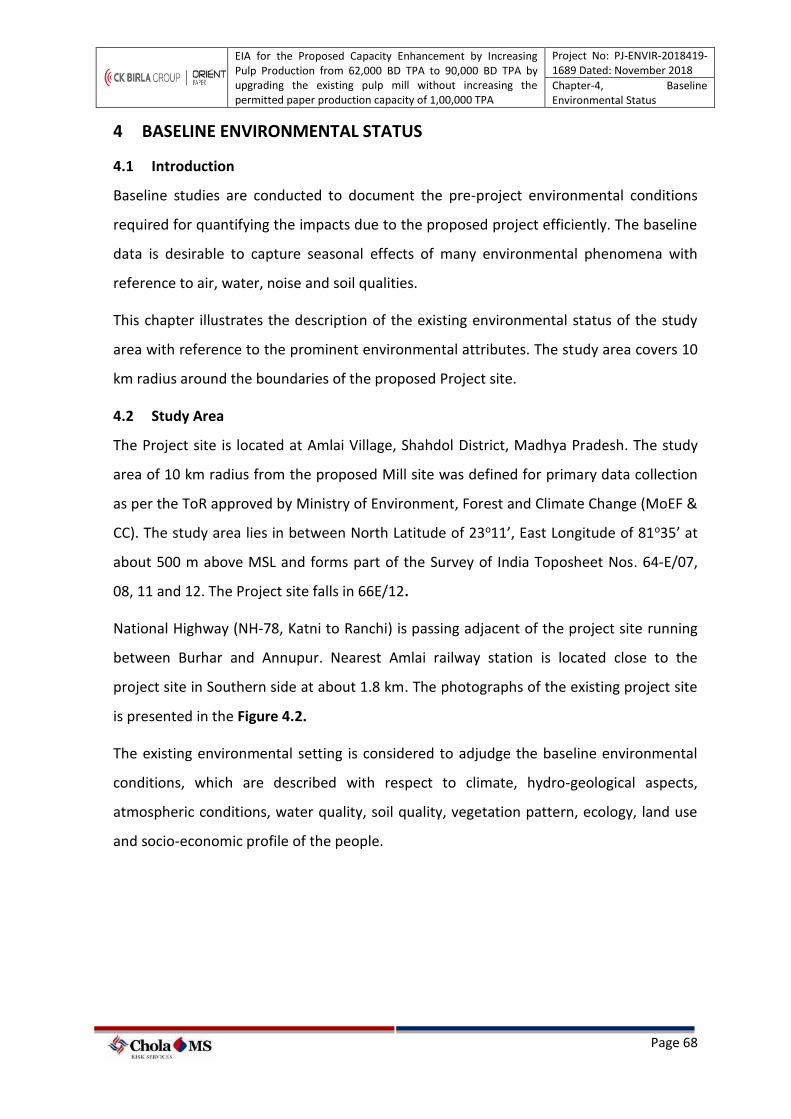
EIA for the Proposed Capacity Enhancement by Increasing Pulp Production from 62,000 BD TPA to 90,000 BD TPA by upgrading the existing pulp mill without increasing the permitted paper production capacity of 1,00,000 TPA
Project No: PJ-ENVIR-2018419-1689 Dated: November 2018
Chapter-4, Baseline Environmental Status
Page 68
4 BASELINE ENVIRONMENTAL STATUS
4.1 Introduction
Baseline studies are conducted to document the pre-project environmental conditions
required for quantifying the impacts due to the proposed project efficiently. The baseline
data is desirable to capture seasonal effects of many environmental phenomena with
reference to air, water, noise and soil qualities.
This chapter illustrates the description of the existing environmental status of the study
area with reference to the prominent environmental attributes. The study area covers 10
km radius around the boundaries of the proposed Project site.
4.2 Study Area
The Project site is located at Amlai Village, Shahdol District, Madhya Pradesh. The study
area of 10 km radius from the proposed Mill site was defined for primary data collection
as per the ToR approved by Ministry of Environment, Forest and Climate Change (MoEF &
CC). The study area lies in between North Latitude of 23o11’, East Longitude of 81o35’ at
about 500 m above MSL and forms part of the Survey of India Toposheet Nos. 64-E/07,
08, 11 and 12. The Project site falls in 66E/12.
National Highway (NH-78, Katni to Ranchi) is passing adjacent of the project site running
between Burhar and Annupur. Nearest Amlai railway station is located close to the
project site in Southern side at about 1.8 km. The photographs of the existing project site
is presented in the Figure 4.2.
The existing environmental setting is considered to adjudge the baseline environmental
conditions, which are described with respect to climate, hydro-geological aspects,
atmospheric conditions, water quality, soil quality, vegetation pattern, ecology, land use
and socio-economic profile of the people.
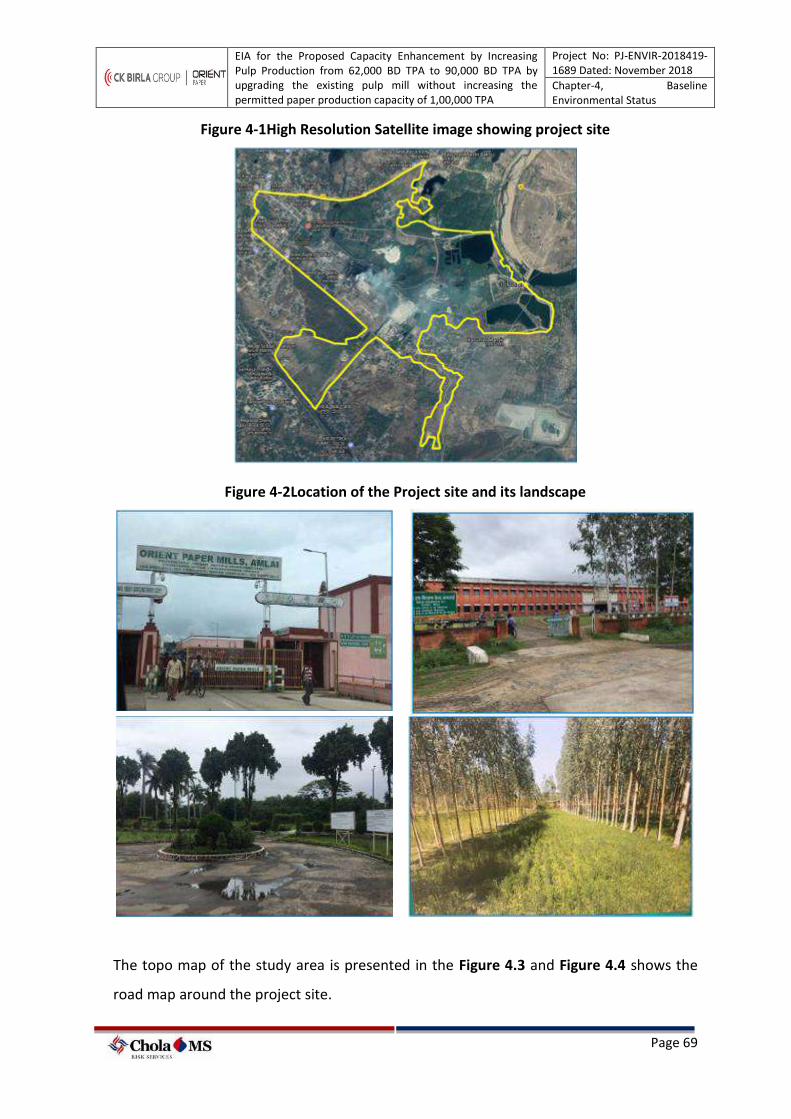
EIA for the Proposed Capacity Enhancement by Increasing Pulp Production from 62,000 BD TPA to 90,000 BD TPA by upgrading the existing pulp mill without increasing the permitted paper production capacity of 1,00,000 TPA
Project No: PJ-ENVIR-2018419-1689 Dated: November 2018
Chapter-4, Baseline Environmental Status
Page 69
Figure 4-1High Resolution Satellite image showing project site
Figure 4-2Location of the Project site and its landscape
The topo map of the study area is presented in the Figure 4.3 and Figure 4.4 shows the
road map around the project site.
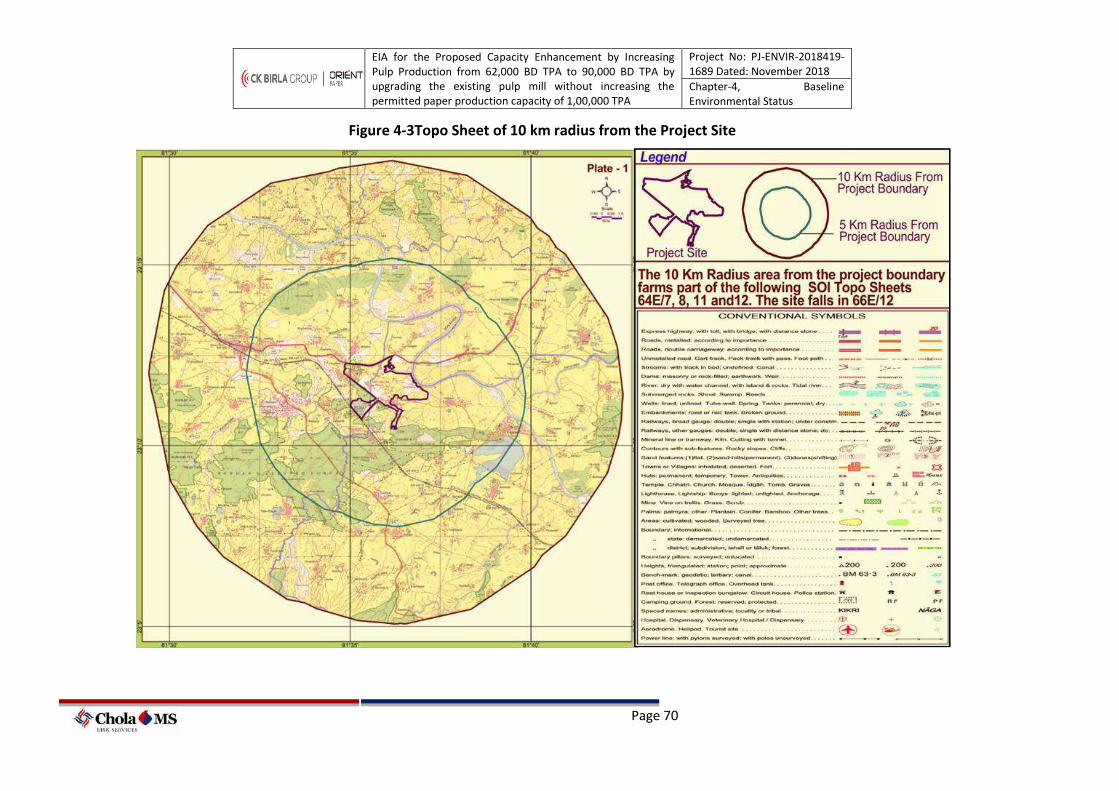
EIA for the Proposed Capacity Enhancement by Increasing Pulp Production from 62,000 BD TPA to 90,000 BD TPA by upgrading the existing pulp mill without increasing the permitted paper production capacity of 1,00,000 TPA
Project No: PJ-ENVIR-2018419-1689 Dated: November 2018
Chapter-4, Baseline Environmental Status
Page 70
Figure 4-3Topo Sheet of 10 km radius from the Project Site
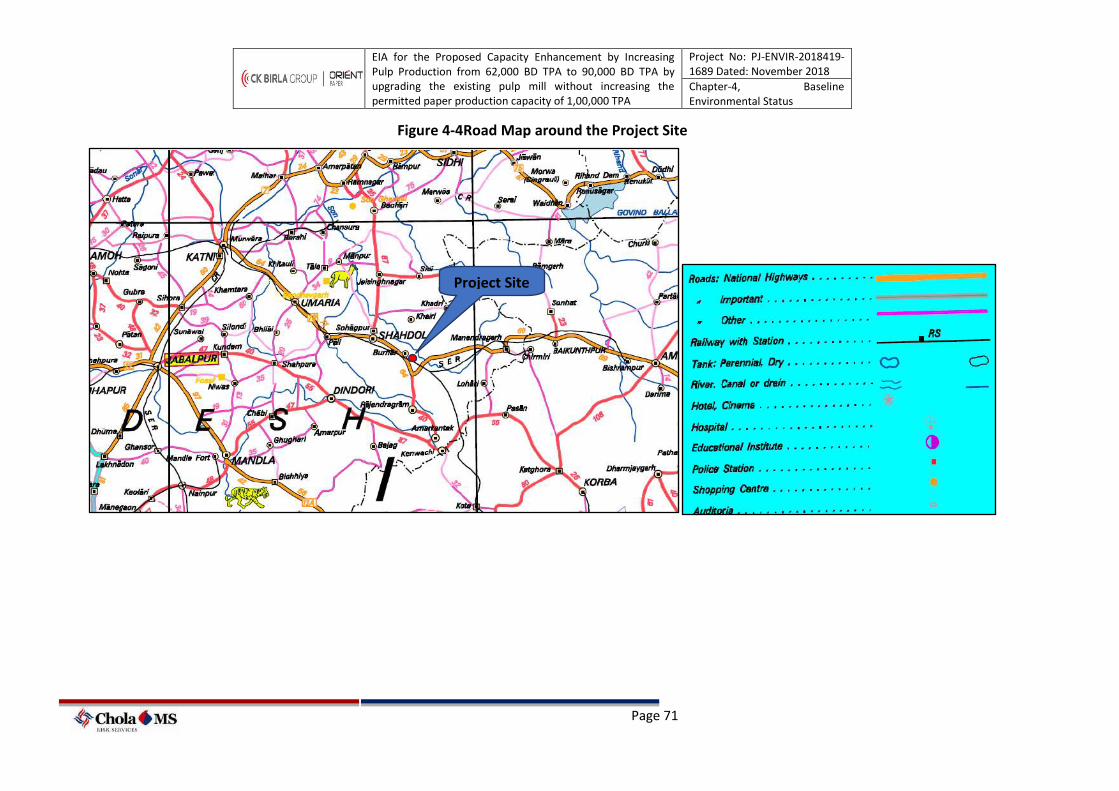
EIA for the Proposed Capacity Enhancement by Increasing Pulp Production from 62,000 BD TPA to 90,000 BD TPA by upgrading the existing pulp mill without increasing the permitted paper production capacity of 1,00,000 TPA
Project No: PJ-ENVIR-2018419-1689 Dated: November 2018
Chapter-4, Baseline Environmental Status
Page 71
Figure 4-4Road Map around the Project Site
Project Site
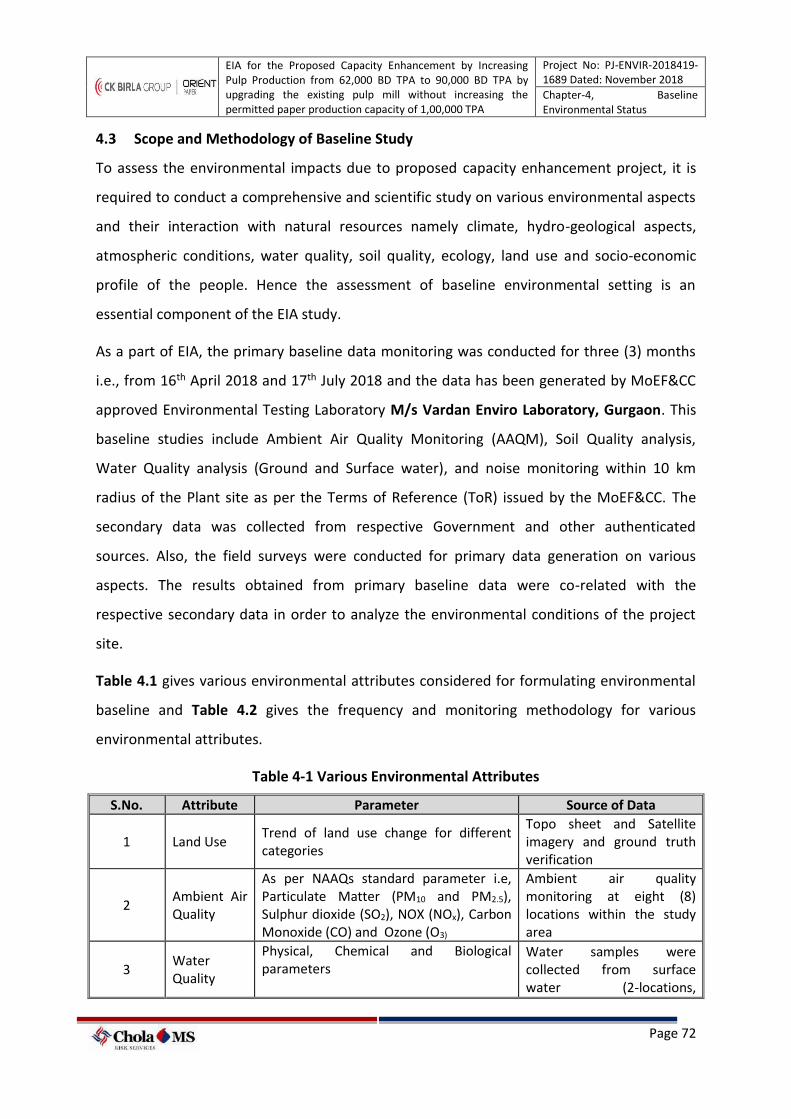
EIA for the Proposed Capacity Enhancement by Increasing Pulp Production from 62,000 BD TPA to 90,000 BD TPA by upgrading the existing pulp mill without increasing the permitted paper production capacity of 1,00,000 TPA
Project No: PJ-ENVIR-2018419-1689 Dated: November 2018
Chapter-4, Baseline Environmental Status
Page 72
4.3 Scope and Methodology of Baseline Study
To assess the environmental impacts due to proposed capacity enhancement project, it is
required to conduct a comprehensive and scientific study on various environmental aspects
and their interaction with natural resources namely climate, hydro-geological aspects,
atmospheric conditions, water quality, soil quality, ecology, land use and socio-economic
profile of the people. Hence the assessment of baseline environmental setting is an
essential component of the EIA study.
As a part of EIA, the primary baseline data monitoring was conducted for three (3) months
i.e., from 16th April 2018 and 17th July 2018 and the data has been generated by MoEF&CC
approved Environmental Testing Laboratory M/s Vardan Enviro Laboratory, Gurgaon. This
baseline studies include Ambient Air Quality Monitoring (AAQM), Soil Quality analysis,
Water Quality analysis (Ground and Surface water), and noise monitoring within 10 km
radius of the Plant site as per the Terms of Reference (ToR) issued by the MoEF&CC. The
secondary data was collected from respective Government and other authenticated
sources. Also, the field surveys were conducted for primary data generation on various
aspects. The results obtained from primary baseline data were co-related with the
respective secondary data in order to analyze the environmental conditions of the project
site.
Table 4.1 gives various environmental attributes considered for formulating environmental
baseline and Table 4.2 gives the frequency and monitoring methodology for various
environmental attributes.
Table 4-1 Various Environmental Attributes
S.No. Attribute Parameter Source of Data
1 Land Use Trend of land use change for different categories
Topo sheet and Satellite imagery and ground truth verification
2 Ambient Air Quality
As per NAAQs standard parameter i.e, Particulate Matter (PM10 and PM2.5), Sulphur dioxide (SO2), NOX (NOx), Carbon Monoxide (CO) and Ozone (O3)
Ambient air quality monitoring at eight (8) locations within the study area
3 Water Quality
Physical, Chemical and Biological parameters
Water samples were collected from surface water (2-locations,
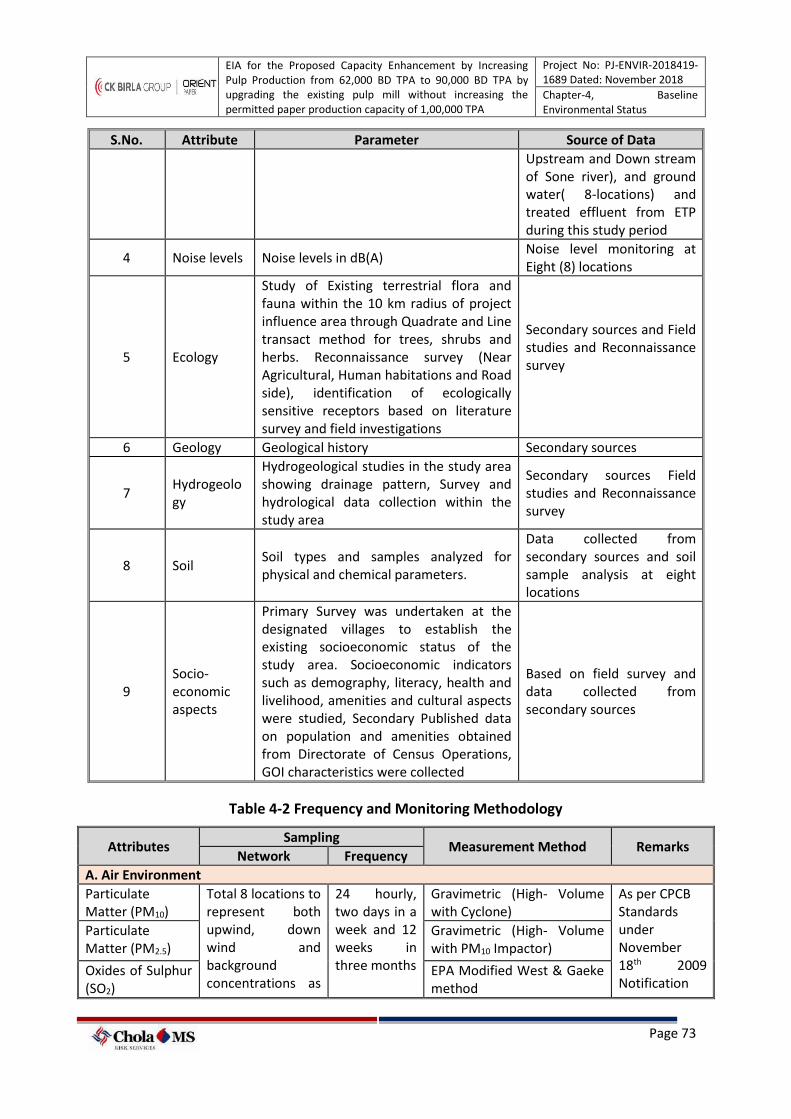
EIA for the Proposed Capacity Enhancement by Increasing Pulp Production from 62,000 BD TPA to 90,000 BD TPA by upgrading the existing pulp mill without increasing the permitted paper production capacity of 1,00,000 TPA
Project No: PJ-ENVIR-2018419-1689 Dated: November 2018
Chapter-4, Baseline Environmental Status
Page 73
S.No. Attribute Parameter Source of Data Upstream and Down stream of Sone river), and ground water( 8-locations) and treated effluent from ETP during this study period
4 Noise levels Noise levels in dB(A) Noise level monitoring at Eight (8) locations
5 Ecology
Study of Existing terrestrial flora and fauna within the 10 km radius of project influence area through Quadrate and Line transact method for trees, shrubs and herbs. Reconnaissance survey (Near Agricultural, Human habitations and Road side), identification of ecologically sensitive receptors based on literature survey and field investigations
Secondary sources and Field studies and Reconnaissance survey
6 Geology Geological history Secondary sources
7 Hydrogeology
Hydrogeological studies in the study area showing drainage pattern, Survey and hydrological data collection within the study area
Secondary sources Field studies and Reconnaissance survey
8 Soil Soil types and samples analyzed for physical and chemical parameters.
Data collected from secondary sources and soil sample analysis at eight locations
9 Socio-economic aspects
Primary Survey was undertaken at the designated villages to establish the existing socioeconomic status of the study area. Socioeconomic indicators such as demography, literacy, health and livelihood, amenities and cultural aspects were studied, Secondary Published data on population and amenities obtained from Directorate of Census Operations, GOI characteristics were collected
Based on field survey and data collected from secondary sources
Table 4-2 Frequency and Monitoring Methodology
Attributes Sampling
Measurement Method Remarks Network Frequency
A. Air Environment Particulate Matter (PM10)
Total 8 locations to represent both upwind, down wind and background concentrations as
24 hourly, two days in a week and 12 weeks in three months
Gravimetric (High- Volume with Cyclone)
As per CPCB Standards under November 18th 2009 Notification
Particulate Matter (PM2.5)
Gravimetric (High- Volume with PM10 Impactor)
Oxides of Sulphur (SO2)
EPA Modified West & Gaeke method
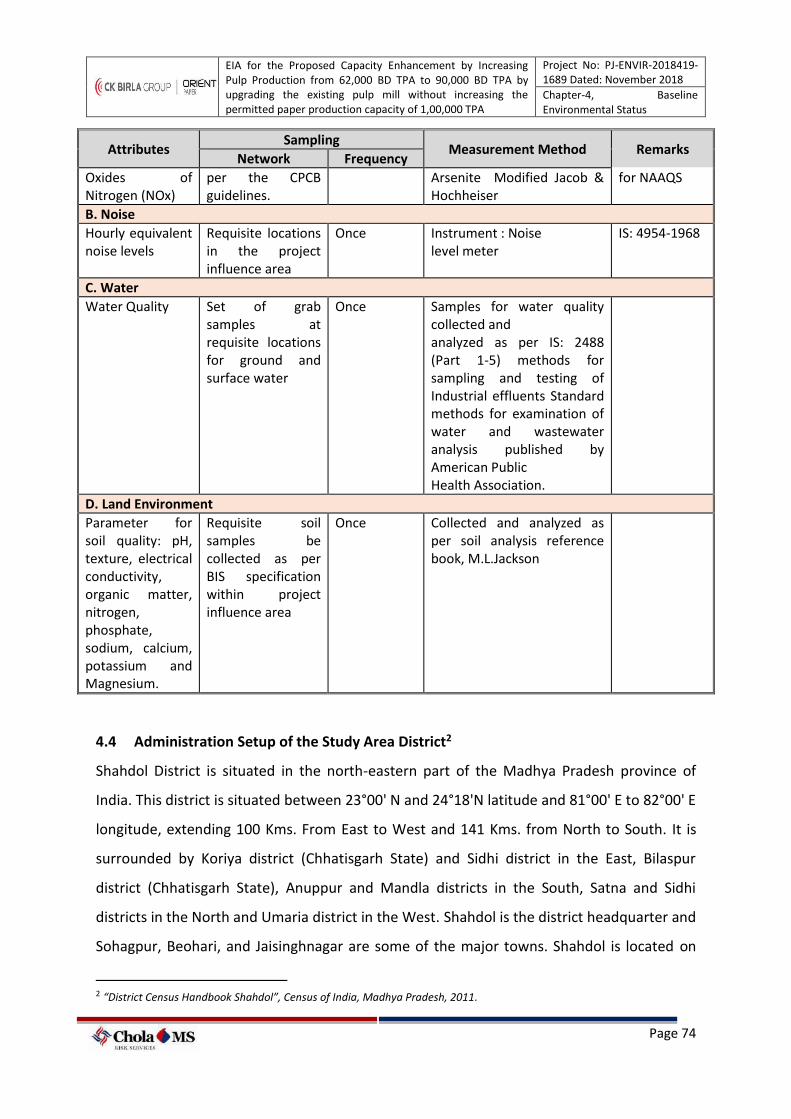
EIA for the Proposed Capacity Enhancement by Increasing Pulp Production from 62,000 BD TPA to 90,000 BD TPA by upgrading the existing pulp mill without increasing the permitted paper production capacity of 1,00,000 TPA
Project No: PJ-ENVIR-2018419-1689 Dated: November 2018
Chapter-4, Baseline Environmental Status
Page 74
Attributes Sampling
Measurement Method Remarks Network Frequency
Oxides of Nitrogen (NOx)
per the CPCB guidelines.
Arsenite Modified Jacob & Hochheiser
for NAAQS
B. Noise Hourly equivalent noise levels
Requisite locations in the project influence area
Once
Instrument : Noise level meter
IS: 4954-1968
C. Water Water Quality Set of grab
samples at requisite locations for ground and surface water
Once
Samples for water quality collected and analyzed as per IS: 2488 (Part 1-5) methods for sampling and testing of Industrial effluents Standard methods for examination of water and wastewater analysis published by American Public Health Association.
D. Land Environment Parameter for soil quality: pH, texture, electrical conductivity, organic matter, nitrogen, phosphate, sodium, calcium, potassium and Magnesium.
Requisite soil samples be collected as per BIS specification within project influence area
Once
Collected and analyzed as per soil analysis reference book, M.L.Jackson
4.4 Administration Setup of the Study Area District2
Shahdol District is situated in the north-eastern part of the Madhya Pradesh province of
India. This district is situated between 23°00' N and 24°18'N latitude and 81°00' E to 82°00' E
longitude, extending 100 Kms. From East to West and 141 Kms. from North to South. It is
surrounded by Koriya district (Chhatisgarh State) and Sidhi district in the East, Bilaspur
district (Chhatisgarh State), Anuppur and Mandla districts in the South, Satna and Sidhi
districts in the North and Umaria district in the West. Shahdol is the district headquarter and
Sohagpur, Beohari, and Jaisinghnagar are some of the major towns. Shahdol is located on
2 “District Census Handbook Shahdol”, Census of India, Madhya Pradesh, 2011.
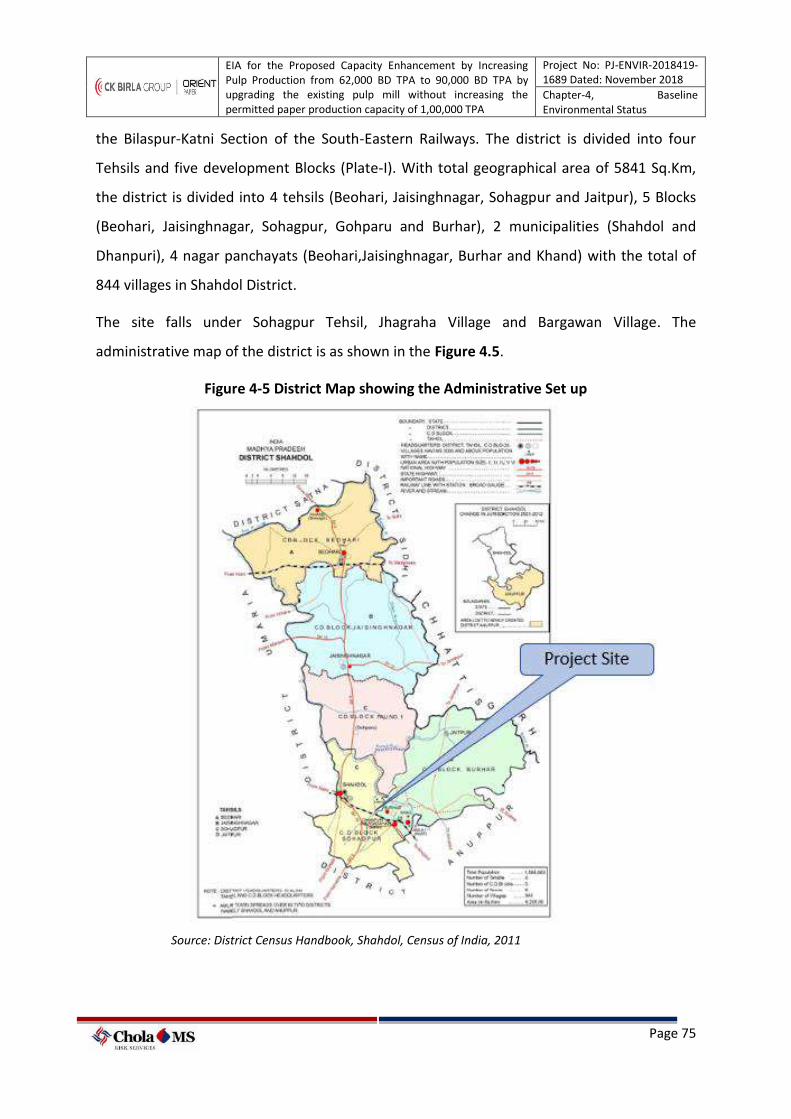
EIA for the Proposed Capacity Enhancement by Increasing Pulp Production from 62,000 BD TPA to 90,000 BD TPA by upgrading the existing pulp mill without increasing the permitted paper production capacity of 1,00,000 TPA
Project No: PJ-ENVIR-2018419-1689 Dated: November 2018
Chapter-4, Baseline Environmental Status
Page 75
the Bilaspur-Katni Section of the South-Eastern Railways. The district is divided into four
Tehsils and five development Blocks (Plate-I). With total geographical area of 5841 Sq.Km,
the district is divided into 4 tehsils (Beohari, Jaisinghnagar, Sohagpur and Jaitpur), 5 Blocks
(Beohari, Jaisinghnagar, Sohagpur, Gohparu and Burhar), 2 municipalities (Shahdol and
Dhanpuri), 4 nagar panchayats (Beohari,Jaisinghnagar, Burhar and Khand) with the total of
844 villages in Shahdol District.
The site falls under Sohagpur Tehsil, Jhagraha Village and Bargawan Village. The
administrative map of the district is as shown in the Figure 4.5.
Figure 4-5 District Map showing the Administrative Set up
Source: District Census Handbook, Shahdol, Census of India, 2011
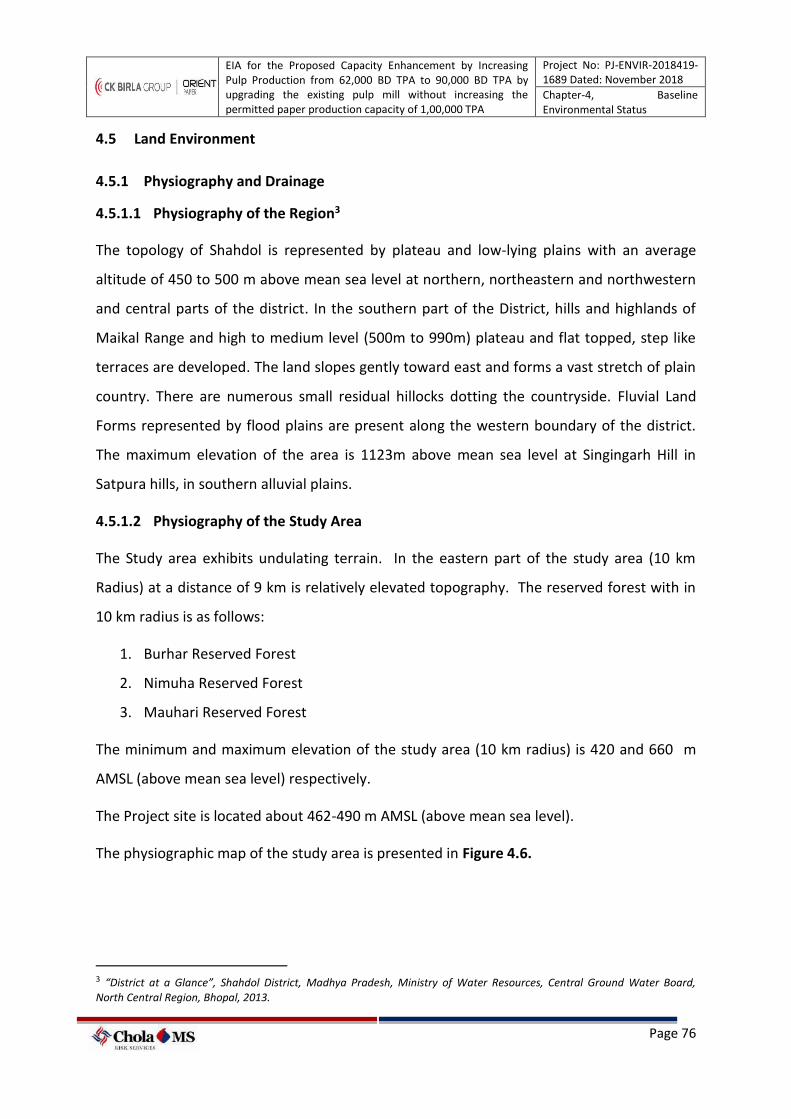
EIA for the Proposed Capacity Enhancement by Increasing Pulp Production from 62,000 BD TPA to 90,000 BD TPA by upgrading the existing pulp mill without increasing the permitted paper production capacity of 1,00,000 TPA
Project No: PJ-ENVIR-2018419-1689 Dated: November 2018
Chapter-4, Baseline Environmental Status
Page 76
4.5 Land Environment
4.5.1 Physiography and Drainage
4.5.1.1 Physiography of the Region3
The topology of Shahdol is represented by plateau and low-lying plains with an average
altitude of 450 to 500 m above mean sea level at northern, northeastern and northwestern
and central parts of the district. In the southern part of the District, hills and highlands of
Maikal Range and high to medium level (500m to 990m) plateau and flat topped, step like
terraces are developed. The land slopes gently toward east and forms a vast stretch of plain
country. There are numerous small residual hillocks dotting the countryside. Fluvial Land
Forms represented by flood plains are present along the western boundary of the district.
The maximum elevation of the area is 1123m above mean sea level at Singingarh Hill in
Satpura hills, in southern alluvial plains.
4.5.1.2 Physiography of the Study Area
The Study area exhibits undulating terrain. In the eastern part of the study area (10 km
Radius) at a distance of 9 km is relatively elevated topography. The reserved forest with in
10 km radius is as follows:
1. Burhar Reserved Forest
2. Nimuha Reserved Forest
3. Mauhari Reserved Forest
The minimum and maximum elevation of the study area (10 km radius) is 420 and 660 m
AMSL (above mean sea level) respectively.
The Project site is located about 462-490 m AMSL (above mean sea level).
The physiographic map of the study area is presented in Figure 4.6.
3 “District at a Glance”, Shahdol District, Madhya Pradesh, Ministry of Water Resources, Central Ground Water Board, North Central Region, Bhopal, 2013.
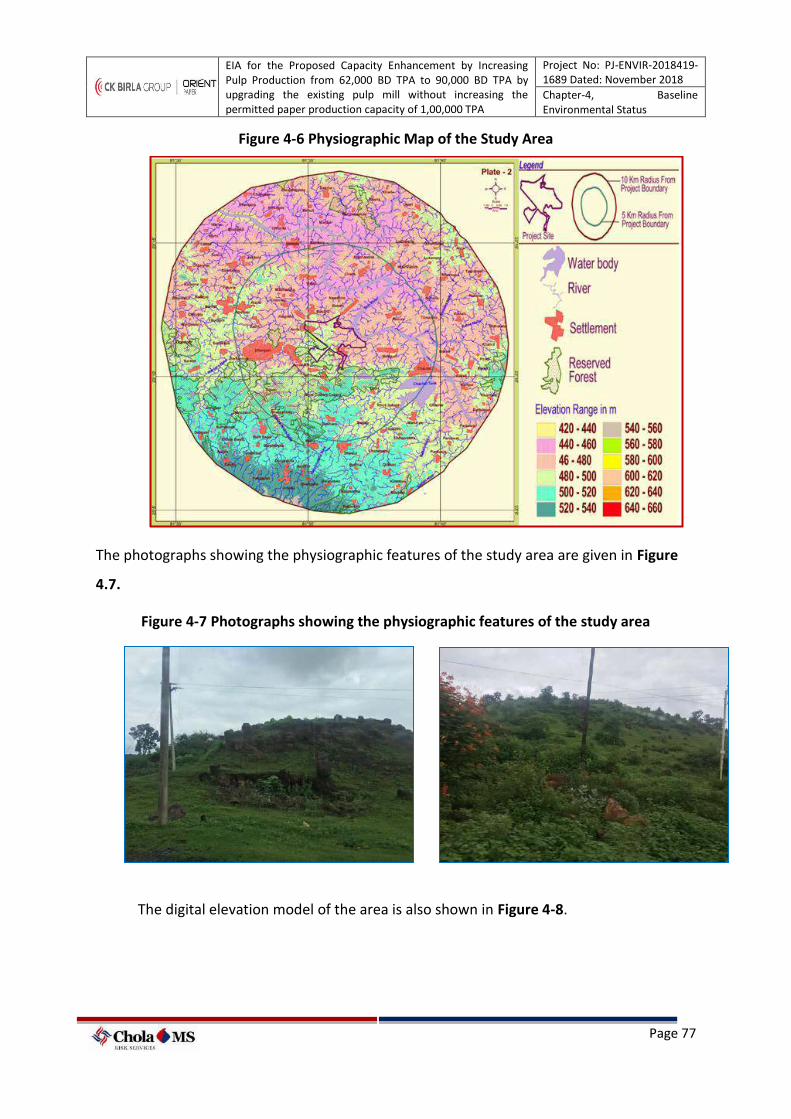
EIA for the Proposed Capacity Enhancement by Increasing Pulp Production from 62,000 BD TPA to 90,000 BD TPA by upgrading the existing pulp mill without increasing the permitted paper production capacity of 1,00,000 TPA
Project No: PJ-ENVIR-2018419-1689 Dated: November 2018
Chapter-4, Baseline Environmental Status
Page 77
Figure 4-6 Physiographic Map of the Study Area
The photographs showing the physiographic features of the study area are given in Figure
4.7.
Figure 4-7 Photographs showing the physiographic features of the study area
The digital elevation model of the area is also shown in Figure 4-8.
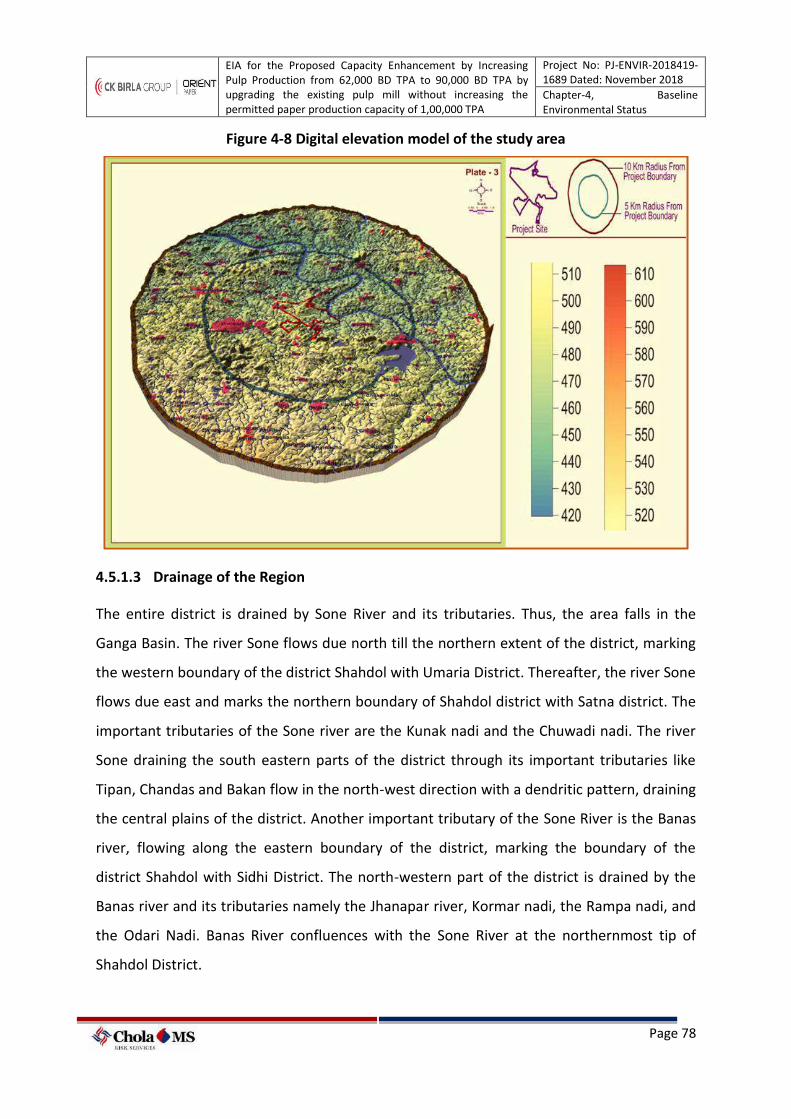
EIA for the Proposed Capacity Enhancement by Increasing Pulp Production from 62,000 BD TPA to 90,000 BD TPA by upgrading the existing pulp mill without increasing the permitted paper production capacity of 1,00,000 TPA
Project No: PJ-ENVIR-2018419-1689 Dated: November 2018
Chapter-4, Baseline Environmental Status
Page 78
Figure 4-8 Digital elevation model of the study area
4.5.1.3 Drainage of the Region
The entire district is drained by Sone River and its tributaries. Thus, the area falls in the
Ganga Basin. The river Sone flows due north till the northern extent of the district, marking
the western boundary of the district Shahdol with Umaria District. Thereafter, the river Sone
flows due east and marks the northern boundary of Shahdol district with Satna district. The
important tributaries of the Sone river are the Kunak nadi and the Chuwadi nadi. The river
Sone draining the south eastern parts of the district through its important tributaries like
Tipan, Chandas and Bakan flow in the north-west direction with a dendritic pattern, draining
the central plains of the district. Another important tributary of the Sone River is the Banas
river, flowing along the eastern boundary of the district, marking the boundary of the
district Shahdol with Sidhi District. The north-western part of the district is drained by the
Banas river and its tributaries namely the Jhanapar river, Kormar nadi, the Rampa nadi, and
the Odari Nadi. Banas River confluences with the Sone River at the northernmost tip of
Shahdol District.
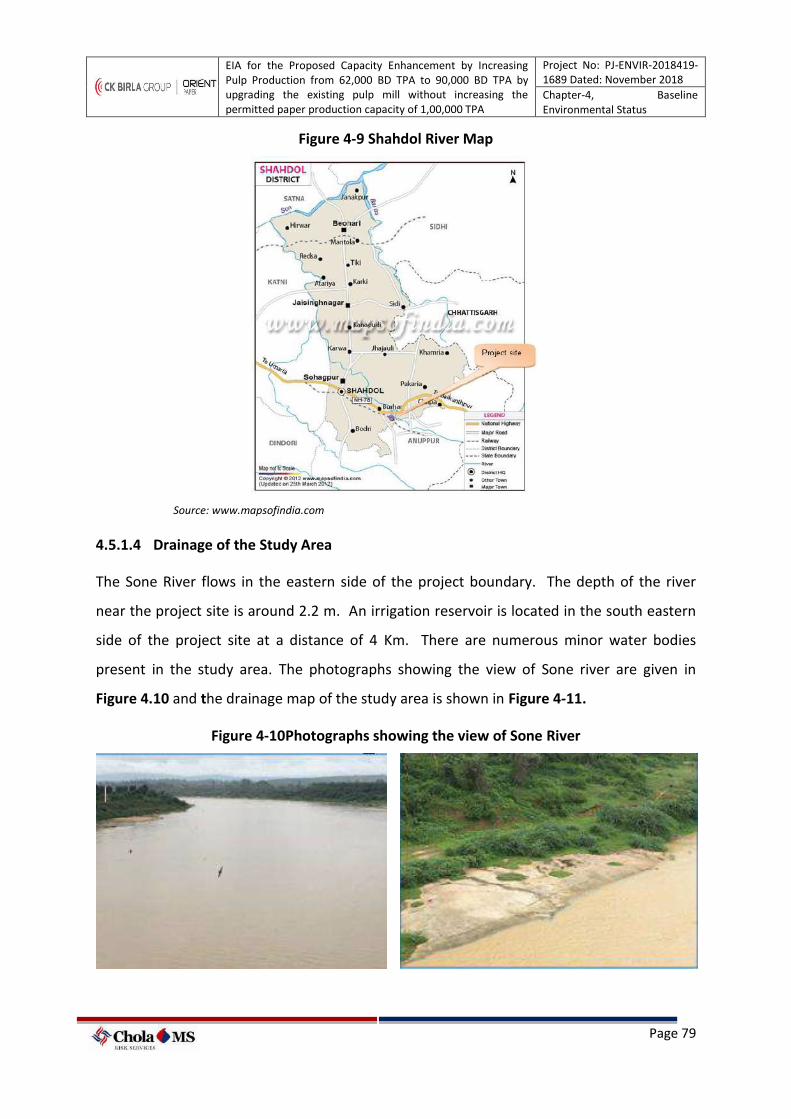
EIA for the Proposed Capacity Enhancement by Increasing Pulp Production from 62,000 BD TPA to 90,000 BD TPA by upgrading the existing pulp mill without increasing the permitted paper production capacity of 1,00,000 TPA
Project No: PJ-ENVIR-2018419-1689 Dated: November 2018
Chapter-4, Baseline Environmental Status
Page 79
Figure 4-9 Shahdol River Map
Source: www.mapsofindia.com
4.5.1.4 Drainage of the Study Area
The Sone River flows in the eastern side of the project boundary. The depth of the river
near the project site is around 2.2 m. An irrigation reservoir is located in the south eastern
side of the project site at a distance of 4 Km. There are numerous minor water bodies
present in the study area. The photographs showing the view of Sone river are given in
Figure 4.10 and the drainage map of the study area is shown in Figure 4-11.
Figure 4-10Photographs showing the view of Sone River
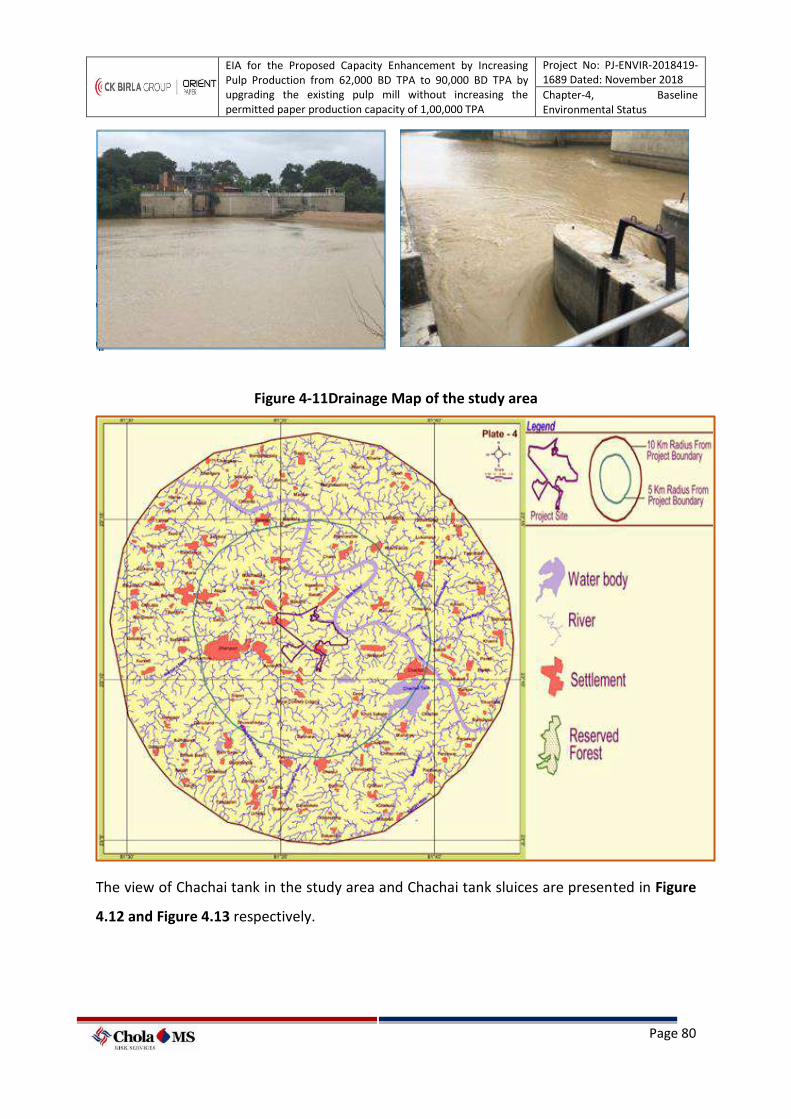
EIA for the Proposed Capacity Enhancement by Increasing Pulp Production from 62,000 BD TPA to 90,000 BD TPA by upgrading the existing pulp mill without increasing the permitted paper production capacity of 1,00,000 TPA
Project No: PJ-ENVIR-2018419-1689 Dated: November 2018
Chapter-4, Baseline Environmental Status
Page 80
Figure 4-11Drainage Map of the study area
The view of Chachai tank in the study area and Chachai tank sluices are presented in Figure
4.12 and Figure 4.13 respectively.
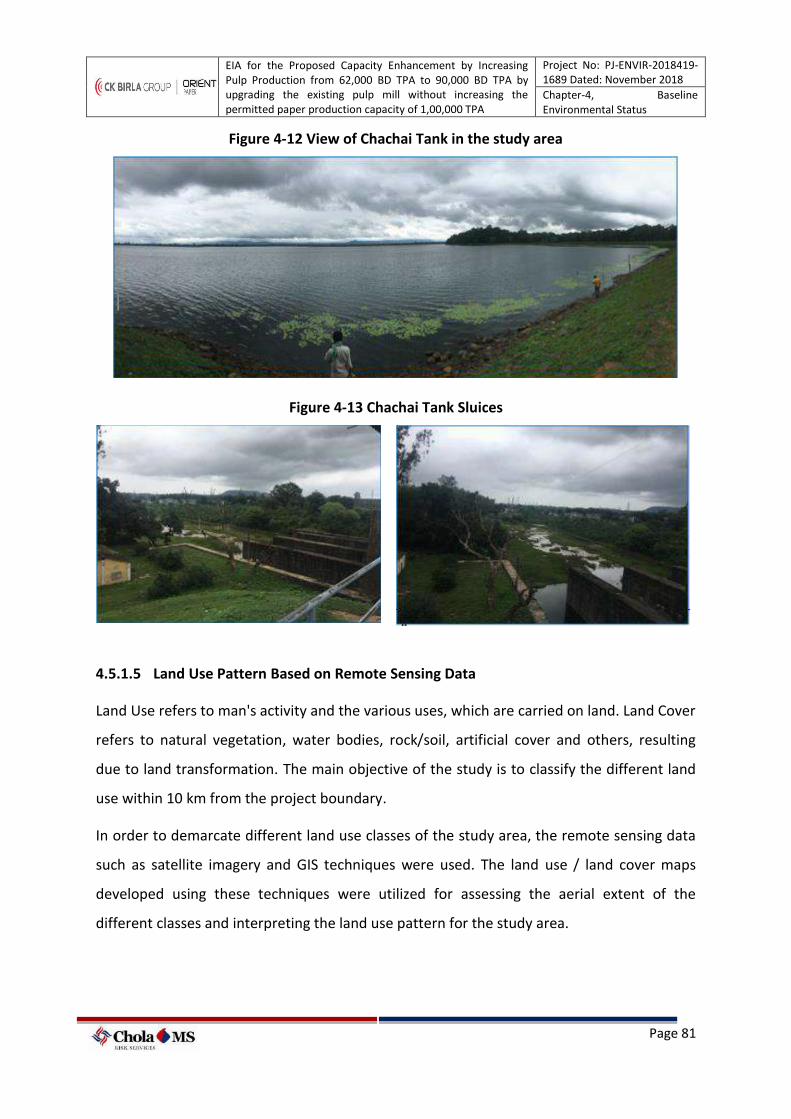
EIA for the Proposed Capacity Enhancement by Increasing Pulp Production from 62,000 BD TPA to 90,000 BD TPA by upgrading the existing pulp mill without increasing the permitted paper production capacity of 1,00,000 TPA
Project No: PJ-ENVIR-2018419-1689 Dated: November 2018
Chapter-4, Baseline Environmental Status
Page 81
Figure 4-12 View of Chachai Tank in the study area
Figure 4-13 Chachai Tank Sluices
4.5.1.5 Land Use Pattern Based on Remote Sensing Data
Land Use refers to man's activity and the various uses, which are carried on land. Land Cover
refers to natural vegetation, water bodies, rock/soil, artificial cover and others, resulting
due to land transformation. The main objective of the study is to classify the different land
use within 10 km from the project boundary.
In order to demarcate different land use classes of the study area, the remote sensing data
such as satellite imagery and GIS techniques were used. The land use / land cover maps
developed using these techniques were utilized for assessing the aerial extent of the
different classes and interpreting the land use pattern for the study area.
EIA for the Proposed Capacity Enhancement by Increasing Pulp Production from 62,000 BD TPA to 90,000 BD TPA by upgrading the existing pulp mill without increasing the permitted paper production capacity of 1,00,000 TPA
Project No: PJ-ENVIR-2018419-1689 Dated: November 2018
Chapter-4, Baseline Environmental Status
Page 82
Satellite remote sensing is used for determining different types of land use classes as it
provides a means of assessing a large area with limited time and resources. The present
study envisages different LULC around the proposed project area.
4.5.1.5.1 Satellite data
IRS Resourcesat-2 LISS-III multispectral satellite data of 04th March 2017 was utilized for the
present study. The rectification of imagery was carried out on to bring the digital data on
the earth coordinate system by means of ground control point (GCP) assignments/SOI
toposheets.
4.5.1.5.2 Scale of Mapping
Considering the user defined scale of mapping, 1:50000 IRS-P6, LISS-III data on 1:50000
Scale was used for Land use / Land cover mapping of 10 km radius for proposed site. The
description of the land use categories for 10 km radius and the statistics are given for 10 km
radius.
4.5.1.5.3 Interpretation Technique
Standard on screen visual interpretation procedure was followed. The various Land use /
Land cover classes were interpreted along with the SOI topographical maps during the initial
rapid reconnaissance of the study area. The physiognomic expressions conceived by image
elements of color, tone, texture, size, shape, pattern, shadow, location and associated
features were used to interpret the FCC imagery. Image interpretation keys were developed
for each of the LU/LC classes in terms of image elements.
March 2016 FCC imagery (Digital data) of the study area was interpreted for the relevant
land use classes. On screen visual interpretation coupled with supervised image
classification techniques used to prepare the land use classification. The methodology
included following steps;
➢ Digitisation of the study area (10 km radius from the proposed site) from the topo
maps.
EIA for the Proposed Capacity Enhancement by Increasing Pulp Production from 62,000 BD TPA to 90,000 BD TPA by upgrading the existing pulp mill without increasing the permitted paper production capacity of 1,00,000 TPA
Project No: PJ-ENVIR-2018419-1689 Dated: November 2018
Chapter-4, Baseline Environmental Status
Page 83
➢ In the present study the IRS –P6 satellite image have been procured and interpreted
using the ERDAS imaging and ARC-GIS software adopting the necessary
interpretation techniques.
➢ Satellite data interpretation and vectorisation of the resulting units
➢ Adopting the available guidelines from manual of LULC mapping using Satellite
imagery (NRSA, 1989)
➢ Field checking and ground truth validation
➢ Composition of final LULC map
4.5.1.5.4 Land Use /Land Cover Classification System
The LULC Classification has been done at three levels where level -1 being the broad
classification about the land covers that is Built-up land, agriculture land, waste land, wet
lands, and water bodies. These are followed by level –II where built-up land is divided into
towns/cities as well villages. The Agriculture land is divided into different classes such as
cropland, Fallow, Plantation, while wastelands are broadly divided into, Land with scrub and
without Scrub and Mining and Industrial wasteland. The wetlands are classified into inland
wetlands, coastal wetlands and islands. The water bodies are classified further into
River/stream, Canal, Tanks and bay. In the present study level II classification has been
undertaken. The Satellite imagery of 10 km radius from the project site is presented Figure
4.14.
4.5.1.5.5 Field Verification
Field verification involved collection, verification and recording of the different surface
features that create specific spectral signatures / image expressions on FCC. In the study
area, doubtful areas identified in course of interpretation of imagery were systematically
listed and transferred on to the corresponding SOI topographical maps for ground
verification. In addition to these, traverse routes were planned with reference to SOI
topographical maps to verify interpreted LU/LC classes in such a manner that all the
different classes are covered by at least 5 sampling areas, evenly distributed in the area.
Ground truth details involving LU/LC classes and other ancillary information about crop
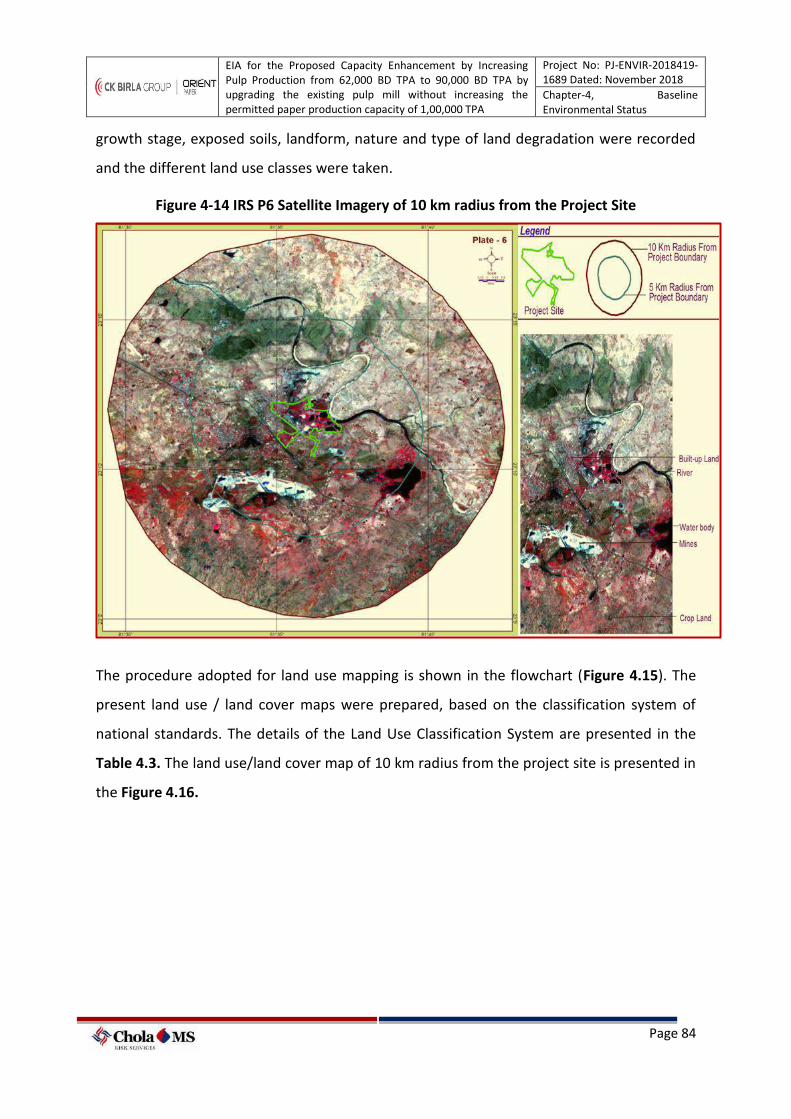
EIA for the Proposed Capacity Enhancement by Increasing Pulp Production from 62,000 BD TPA to 90,000 BD TPA by upgrading the existing pulp mill without increasing the permitted paper production capacity of 1,00,000 TPA
Project No: PJ-ENVIR-2018419-1689 Dated: November 2018
Chapter-4, Baseline Environmental Status
Page 84
growth stage, exposed soils, landform, nature and type of land degradation were recorded
and the different land use classes were taken.
Figure 4-14 IRS P6 Satellite Imagery of 10 km radius from the Project Site
The procedure adopted for land use mapping is shown in the flowchart (Figure 4.15). The
present land use / land cover maps were prepared, based on the classification system of
national standards. The details of the Land Use Classification System are presented in the
Table 4.3. The land use/land cover map of 10 km radius from the project site is presented in
the Figure 4.16.
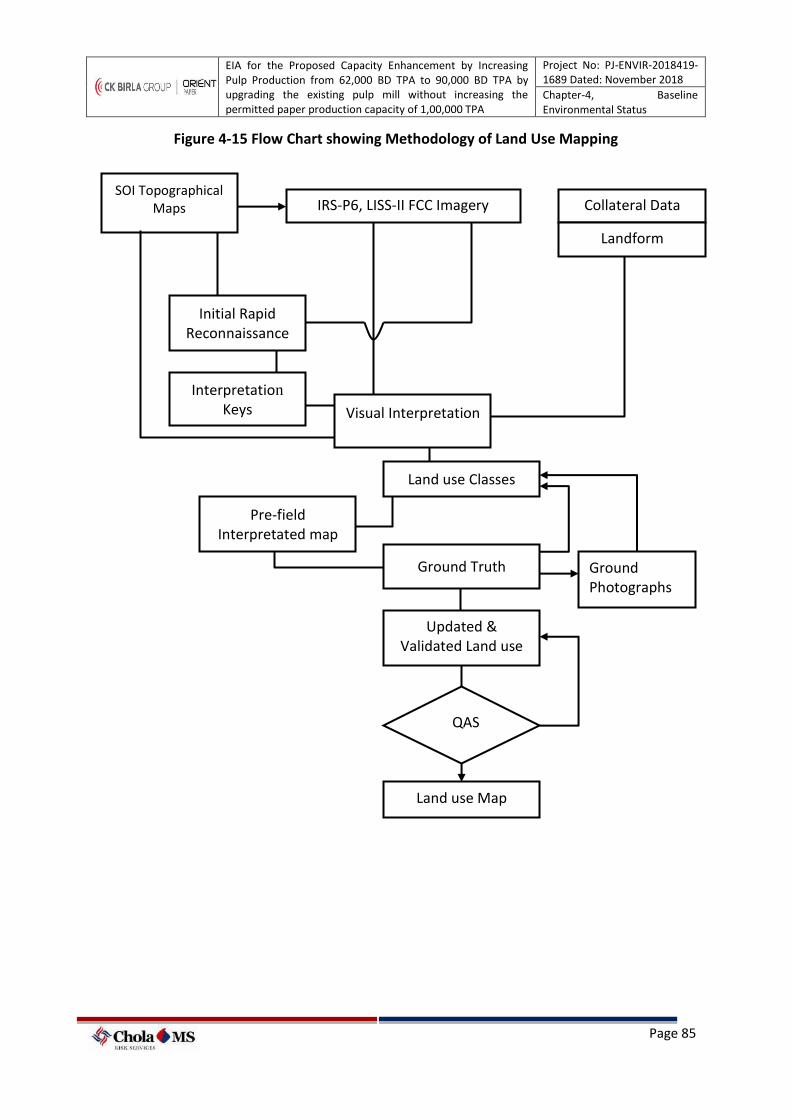
EIA for the Proposed Capacity Enhancement by Increasing Pulp Production from 62,000 BD TPA to 90,000 BD TPA by upgrading the existing pulp mill without increasing the permitted paper production capacity of 1,00,000 TPA
Project No: PJ-ENVIR-2018419-1689 Dated: November 2018
Chapter-4, Baseline Environmental Status
Page 85
Figure 4-15 Flow Chart showing Methodology of Land Use Mapping
SOI Topographical Maps IRS-P6, LISS-II FCC Imagery Collateral Data
Landform
Initial Rapid Reconnaissance
Interpretation
Keys Visual Interpretation
Land use Classes
Pre-field Interpretated map
Ground Truth
Updated & Validated Land use
Ground Photographs
Land use Map
QAS
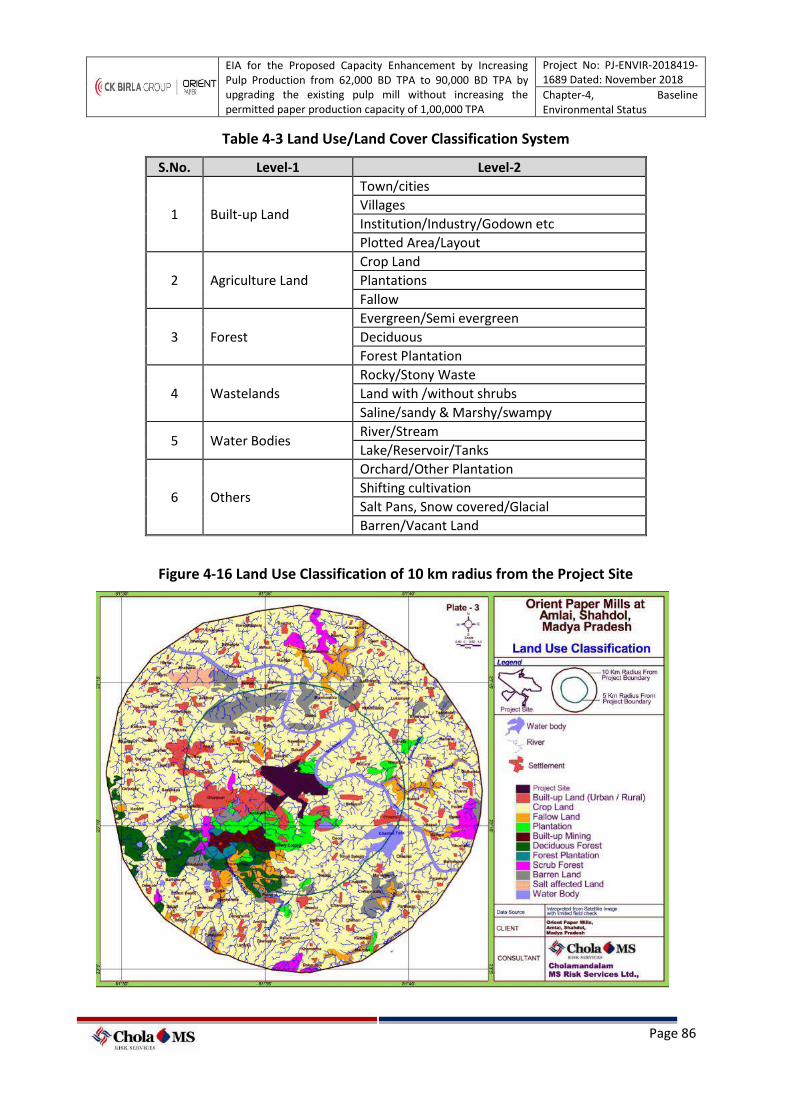
EIA for the Proposed Capacity Enhancement by Increasing Pulp Production from 62,000 BD TPA to 90,000 BD TPA by upgrading the existing pulp mill without increasing the permitted paper production capacity of 1,00,000 TPA
Project No: PJ-ENVIR-2018419-1689 Dated: November 2018
Chapter-4, Baseline Environmental Status
Page 86
Table 4-3 Land Use/Land Cover Classification System
S.No. Level-1 Level-2
1 Built-up Land
Town/cities
Villages
Institution/Industry/Godown etc
Plotted Area/Layout
2 Agriculture Land
Crop Land
Plantations
Fallow
3 Forest
Evergreen/Semi evergreen
Deciduous
Forest Plantation
4 Wastelands
Rocky/Stony Waste
Land with /without shrubs
Saline/sandy & Marshy/swampy
5 Water Bodies River/Stream
Lake/Reservoir/Tanks
6 Others
Orchard/Other Plantation
Shifting cultivation
Salt Pans, Snow covered/Glacial
Barren/Vacant Land
Figure 4-16 Land Use Classification of 10 km radius from the Project Site
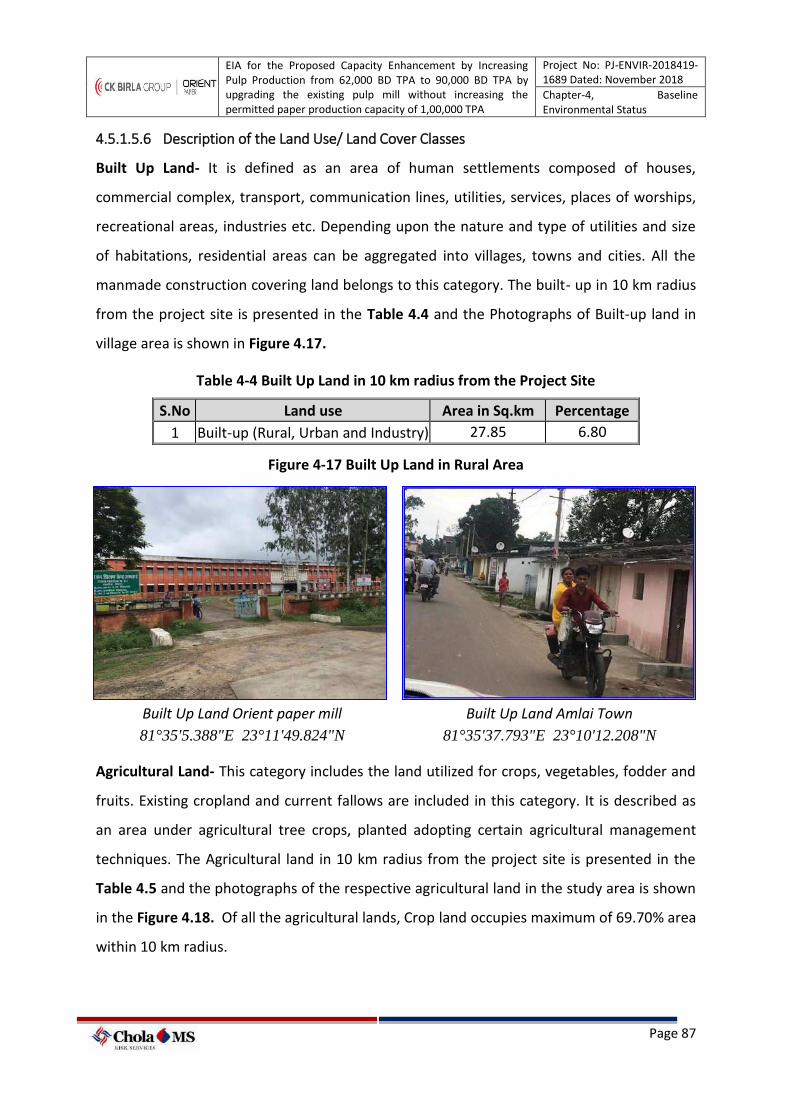
EIA for the Proposed Capacity Enhancement by Increasing Pulp Production from 62,000 BD TPA to 90,000 BD TPA by upgrading the existing pulp mill without increasing the permitted paper production capacity of 1,00,000 TPA
Project No: PJ-ENVIR-2018419-1689 Dated: November 2018
Chapter-4, Baseline Environmental Status
Page 87
4.5.1.5.6 Description of the Land Use/ Land Cover Classes
Built Up Land- It is defined as an area of human settlements composed of houses,
commercial complex, transport, communication lines, utilities, services, places of worships,
recreational areas, industries etc. Depending upon the nature and type of utilities and size
of habitations, residential areas can be aggregated into villages, towns and cities. All the
manmade construction covering land belongs to this category. The built- up in 10 km radius
from the project site is presented in the Table 4.4 and the Photographs of Built-up land in
village area is shown in Figure 4.17.
Table 4-4 Built Up Land in 10 km radius from the Project Site
S.No Land use Area in Sq.km Percentage
1 Built-up (Rural, Urban and Industry) 27.85 6.80
Figure 4-17 Built Up Land in Rural Area
Built Up Land Orient paper mill
81°35'5.388"E 23°11'49.824"N
Built Up Land Amlai Town
81°35'37.793"E 23°10'12.208"N
Agricultural Land- This category includes the land utilized for crops, vegetables, fodder and
fruits. Existing cropland and current fallows are included in this category. It is described as
an area under agricultural tree crops, planted adopting certain agricultural management
techniques. The Agricultural land in 10 km radius from the project site is presented in the
Table 4.5 and the photographs of the respective agricultural land in the study area is shown
in the Figure 4.18. Of all the agricultural lands, Crop land occupies maximum of 69.70% area
within 10 km radius.
EIA for the Proposed Capacity Enhancement by Increasing Pulp Production from 62,000 BD TPA to 90,000 BD TPA by upgrading the existing pulp mill without increasing the permitted paper production capacity of 1,00,000 TPA
Project No: PJ-ENVIR-2018419-1689 Dated: November 2018
Chapter-4, Baseline Environmental Status
Page 88
Table 4-5 Agricultural Land in 10 km radius from the Project Site
S.No Land use Area in Sq.Km Percentage
1 Crop Land 285.28 69.70
2 Plantation 16.42 4.01
3 Fallow Land 13.97 3.41
Figure 4-18 Agricultural Land in Rural Area
Crop Land Near Amradandi
81°35'37.817"E 23°10'11.644"N
Crop Land Near Kelhauri
81°37'34.573"E 23°11'1.993"N
Forest Land- These are the areas bearing an association predominantly of trees and other
vegetation types (within the notified forest boundaries) capable of producing timber and
other forest produce. The study area of 10 km buffer comprise of Forest plantation, forest
blanks and Scrub Forest. The forest land in 10 km radius from the project site is presented in
the Table 4.6.
Table 4-6 Forest Land in 10 km radius from the Project Site
S.No Land use Area in Sq.Km Percentage
1 Deciduous Forest 14.54 3.55
2 Forest Plantation 1.50 0.37
3 Scrub Forest 8.38 2.05
EIA for the Proposed Capacity Enhancement by Increasing Pulp Production from 62,000 BD TPA to 90,000 BD TPA by upgrading the existing pulp mill without increasing the permitted paper production capacity of 1,00,000 TPA
Project No: PJ-ENVIR-2018419-1689 Dated: November 2018
Chapter-4, Baseline Environmental Status
Page 89
Figure 4-19 Forest Land in Rural Area
Scrub Forest – Near Amradandi 81°36'46.064"E 23°9'51.07"N
Forest Plantation south of orient paper 81°35'14.02"E 23°11'40.39"N
Wasteland-Wastelands are the degraded or underutilized lands most of which could be
brought under productive use with proper soil and water management practices. Wasteland
results from various environmental and human factors.
Land with or without Scrub- The land, which is outside the forest boundary and not utilized
for cultivation. Land with or without scrub usually associated with shallow, stony, rocky
otherwise non-arable lands. The Wasteland in 10 km radius from the proposed project site
is as below in Table 4.7 and the photographs representing the same in the study area is
presented in the Figure 4.20.
Table 4-7 Wasteland in 10 km radius from the proposed project site
Sl.No Land use Area in Sq.Km Percentage
1 Built-up Land Mining 4.67 1.14
2 Barren Land 19.31 4.72
3 Salt affected Land 2.59 0.63
EIA for the Proposed Capacity Enhancement by Increasing Pulp Production from 62,000 BD TPA to 90,000 BD TPA by upgrading the existing pulp mill without increasing the permitted paper production capacity of 1,00,000 TPA
Project No: PJ-ENVIR-2018419-1689 Dated: November 2018
Chapter-4, Baseline Environmental Status
Page 90
Figure 4-20 Photographs showing the wasteland/ land with or without scrub in the Study area
Mines Near Silpan
81°34'27.73"E 23°9'34.175"N Barren land Near Deohara
81°36'13.75"E 23°9'8.9"N
Water Bodies- The category comprises area of surface water, either impounded in the form
of ponds, reservoirs or flowing as streams, rivers and canals. River cater channel is inland
waterways used for irrigation and for flood control. The water bodies in 10 km radius from
the project site is presented in the Table 4.8.
Table 4-8 Water Bodies in 10 km radius from the Project Site
S.No Land use Area in Sq.Km Percentage
1 Water Bodies – Tank, River, Canal 14.78 3.61
4.5.1.5.7 Final Output
The study reveals that the following major land use in the study area of 10 km radius from
the project boundary
➢ In the agricultural land (Crop Land- 69.70 %) occupies majority of the area.
➢ About 6.80 % of the built up land.
The overall summary of the statistics of LU/LC in the study area is presented in the Table 4.9
and Figure 4.21.
EIA for the Proposed Capacity Enhancement by Increasing Pulp Production from 62,000 BD TPA to 90,000 BD TPA by upgrading the existing pulp mill without increasing the permitted paper production capacity of 1,00,000 TPA
Project No: PJ-ENVIR-2018419-1689 Dated: November 2018
Chapter-4, Baseline Environmental Status
Page 91
Table 4-9 Overall Summary of the Statistics of LU/LC in the study Area
SL.No. Land Use Percentage Area in Sq. Km
1 Built-up Land (Urban / Rural) 6.80 27.85
2 Crop Land 69.70 285.28
3 Fallow Land 4.01 16.42
4 Plantation 3.41 13.97
5 Built-up Mining 1.14 4.67
6 Deciduous Forest 3.55 14.54
7 Forest Plantation 0.37 1.50
8 Scrub Forest 2.05 8.38
9 Barren Land 4.72 19.31
10 Salt affected Land 0.63 2.59
11 Water Body 3.61 14.78
Total 100.000
Figure 4-21 Land use classes around 10 km radius from the project site
4.5.2 List of Industries
The industries in and around the Project site
➢ Orient Paper Mills – Caustic Soda Unit,
➢ Amarkantak Thermal Power Station
➢ Moser Baer Thermal Power plant
➢ Reliance Industries Limited
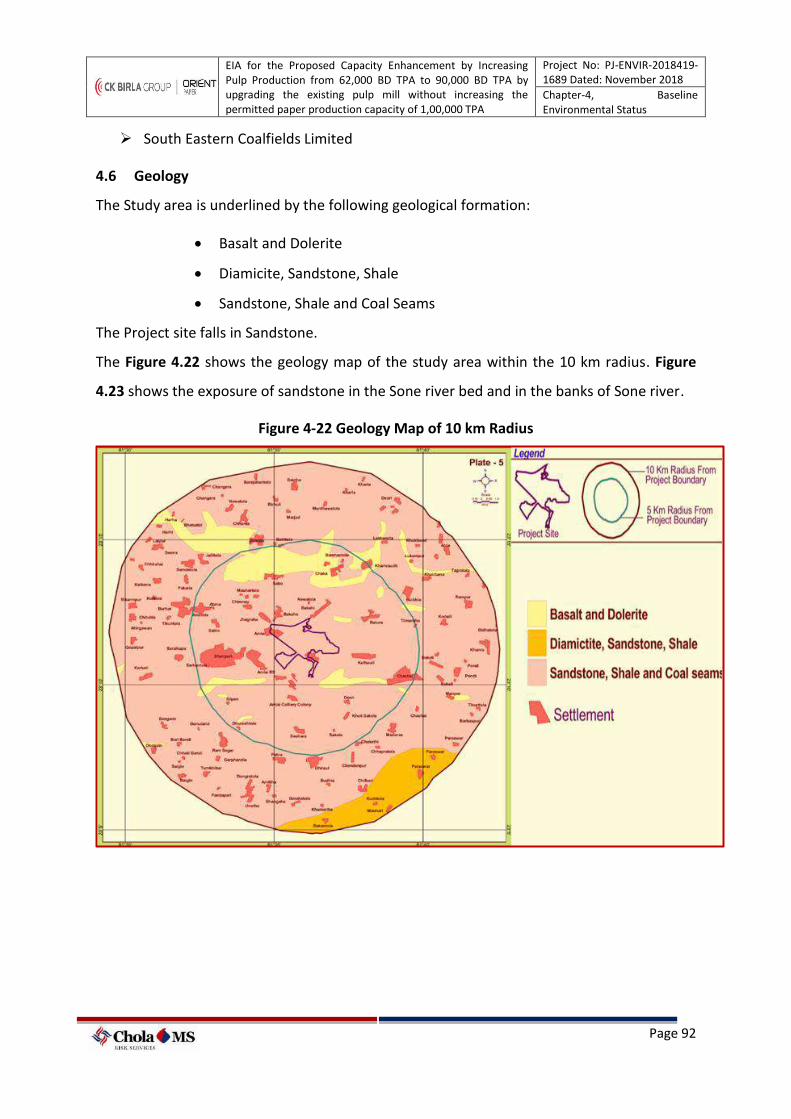
EIA for the Proposed Capacity Enhancement by Increasing Pulp Production from 62,000 BD TPA to 90,000 BD TPA by upgrading the existing pulp mill without increasing the permitted paper production capacity of 1,00,000 TPA
Project No: PJ-ENVIR-2018419-1689 Dated: November 2018
Chapter-4, Baseline Environmental Status
Page 92
➢ South Eastern Coalfields Limited
4.6 Geology
The Study area is underlined by the following geological formation:
• Basalt and Dolerite
• Diamicite, Sandstone, Shale
• Sandstone, Shale and Coal Seams
The Project site falls in Sandstone.
The Figure 4.22 shows the geology map of the study area within the 10 km radius. Figure
4.23 shows the exposure of sandstone in the Sone river bed and in the banks of Sone river.
Figure 4-22 Geology Map of 10 km Radius
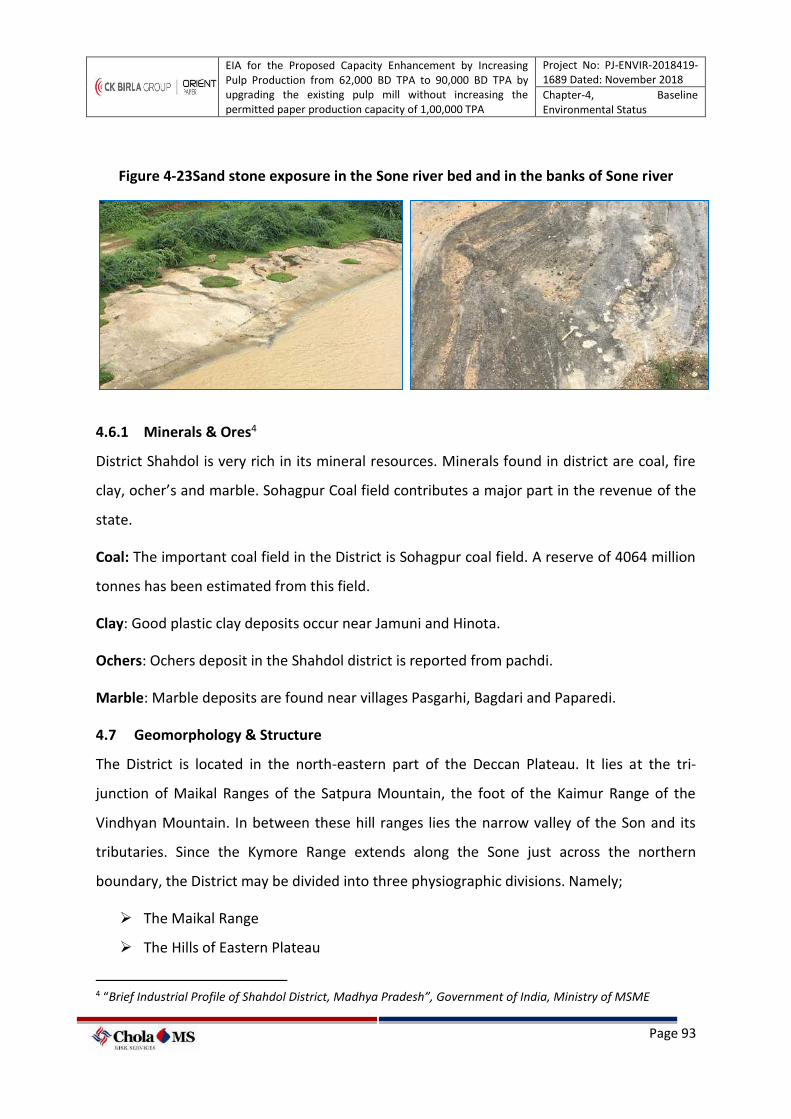
EIA for the Proposed Capacity Enhancement by Increasing Pulp Production from 62,000 BD TPA to 90,000 BD TPA by upgrading the existing pulp mill without increasing the permitted paper production capacity of 1,00,000 TPA
Project No: PJ-ENVIR-2018419-1689 Dated: November 2018
Chapter-4, Baseline Environmental Status
Page 93
Figure 4-23Sand stone exposure in the Sone river bed and in the banks of Sone river
4.6.1 Minerals & Ores4
District Shahdol is very rich in its mineral resources. Minerals found in district are coal, fire
clay, ocher’s and marble. Sohagpur Coal field contributes a major part in the revenue of the
state.
Coal: The important coal field in the District is Sohagpur coal field. A reserve of 4064 million
tonnes has been estimated from this field.
Clay: Good plastic clay deposits occur near Jamuni and Hinota.
Ochers: Ochers deposit in the Shahdol district is reported from pachdi.
Marble: Marble deposits are found near villages Pasgarhi, Bagdari and Paparedi.
4.7 Geomorphology & Structure
The District is located in the north-eastern part of the Deccan Plateau. It lies at the tri-
junction of Maikal Ranges of the Satpura Mountain, the foot of the Kaimur Range of the
Vindhyan Mountain. In between these hill ranges lies the narrow valley of the Son and its
tributaries. Since the Kymore Range extends along the Sone just across the northern
boundary, the District may be divided into three physiographic divisions. Namely;
➢ The Maikal Range
➢ The Hills of Eastern Plateau
4 “Brief Industrial Profile of Shahdol District, Madhya Pradesh”, Government of India, Ministry of MSME
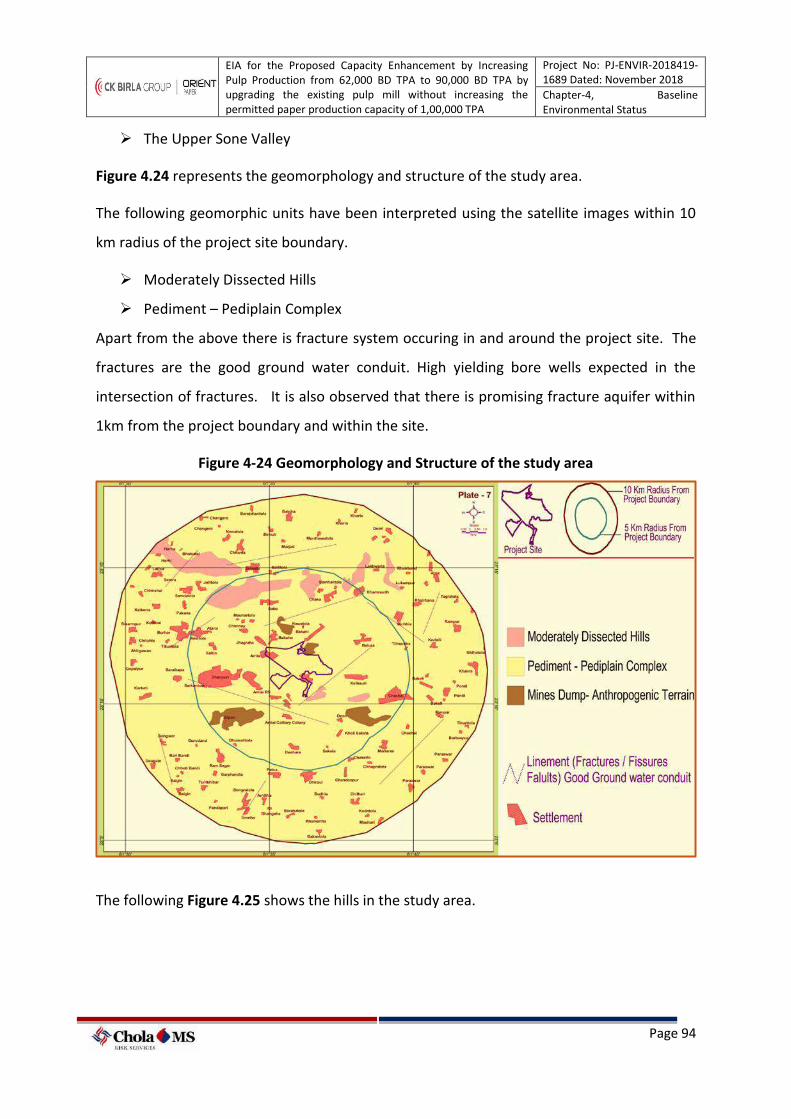
EIA for the Proposed Capacity Enhancement by Increasing Pulp Production from 62,000 BD TPA to 90,000 BD TPA by upgrading the existing pulp mill without increasing the permitted paper production capacity of 1,00,000 TPA
Project No: PJ-ENVIR-2018419-1689 Dated: November 2018
Chapter-4, Baseline Environmental Status
Page 94
➢ The Upper Sone Valley
Figure 4.24 represents the geomorphology and structure of the study area.
The following geomorphic units have been interpreted using the satellite images within 10
km radius of the project site boundary.
➢ Moderately Dissected Hills
➢ Pediment – Pediplain Complex
Apart from the above there is fracture system occuring in and around the project site. The
fractures are the good ground water conduit. High yielding bore wells expected in the
intersection of fractures. It is also observed that there is promising fracture aquifer within
1km from the project boundary and within the site.
Figure 4-24 Geomorphology and Structure of the study area
The following Figure 4.25 shows the hills in the study area.
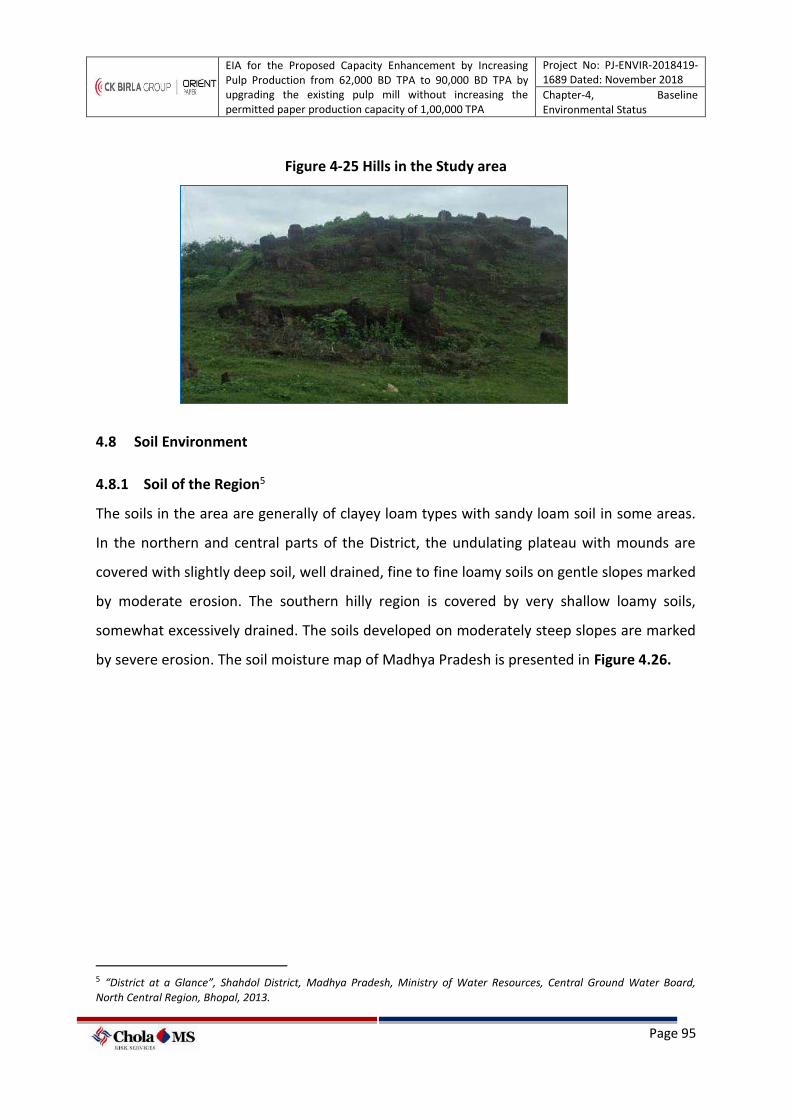
EIA for the Proposed Capacity Enhancement by Increasing Pulp Production from 62,000 BD TPA to 90,000 BD TPA by upgrading the existing pulp mill without increasing the permitted paper production capacity of 1,00,000 TPA
Project No: PJ-ENVIR-2018419-1689 Dated: November 2018
Chapter-4, Baseline Environmental Status
Page 95
Figure 4-25 Hills in the Study area
4.8 Soil Environment
4.8.1 Soil of the Region5
The soils in the area are generally of clayey loam types with sandy loam soil in some areas.
In the northern and central parts of the District, the undulating plateau with mounds are
covered with slightly deep soil, well drained, fine to fine loamy soils on gentle slopes marked
by moderate erosion. The southern hilly region is covered by very shallow loamy soils,
somewhat excessively drained. The soils developed on moderately steep slopes are marked
by severe erosion. The soil moisture map of Madhya Pradesh is presented in Figure 4.26.
5 “District at a Glance”, Shahdol District, Madhya Pradesh, Ministry of Water Resources, Central Ground Water Board, North Central Region, Bhopal, 2013.
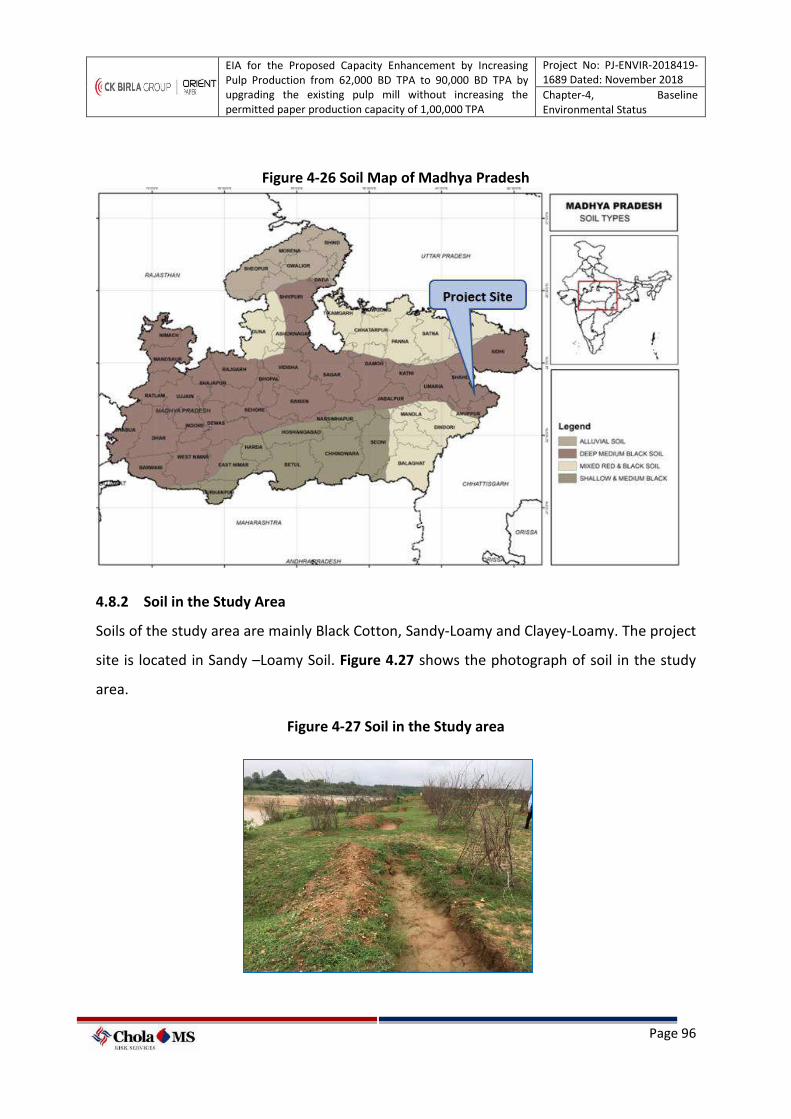
EIA for the Proposed Capacity Enhancement by Increasing Pulp Production from 62,000 BD TPA to 90,000 BD TPA by upgrading the existing pulp mill without increasing the permitted paper production capacity of 1,00,000 TPA
Project No: PJ-ENVIR-2018419-1689 Dated: November 2018
Chapter-4, Baseline Environmental Status
Page 96
Figure 4-26 Soil Map of Madhya Pradesh
4.8.2 Soil in the Study Area
Soils of the study area are mainly Black Cotton, Sandy-Loamy and Clayey-Loamy. The project
site is located in Sandy –Loamy Soil. Figure 4.27 shows the photograph of soil in the study
area.
Figure 4-27 Soil in the Study area
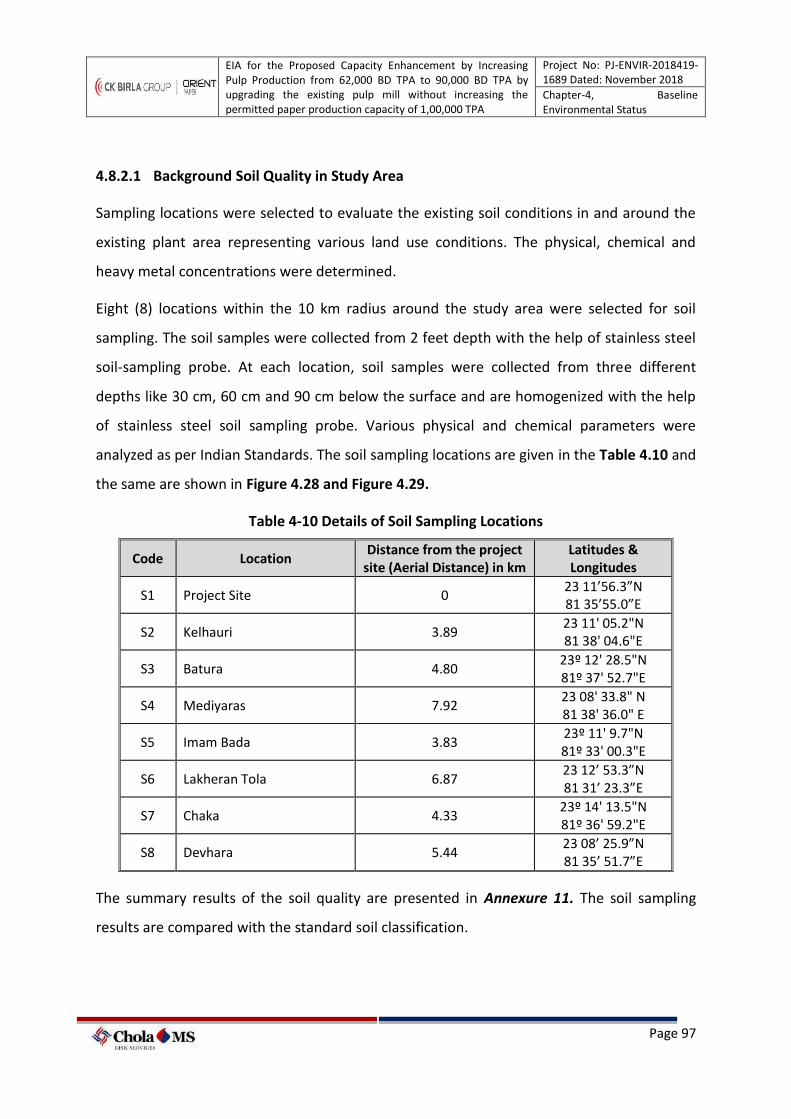
EIA for the Proposed Capacity Enhancement by Increasing Pulp Production from 62,000 BD TPA to 90,000 BD TPA by upgrading the existing pulp mill without increasing the permitted paper production capacity of 1,00,000 TPA
Project No: PJ-ENVIR-2018419-1689 Dated: November 2018
Chapter-4, Baseline Environmental Status
Page 97
4.8.2.1 Background Soil Quality in Study Area
Sampling locations were selected to evaluate the existing soil conditions in and around the
existing plant area representing various land use conditions. The physical, chemical and
heavy metal concentrations were determined.
Eight (8) locations within the 10 km radius around the study area were selected for soil
sampling. The soil samples were collected from 2 feet depth with the help of stainless steel
soil-sampling probe. At each location, soil samples were collected from three different
depths like 30 cm, 60 cm and 90 cm below the surface and are homogenized with the help
of stainless steel soil sampling probe. Various physical and chemical parameters were
analyzed as per Indian Standards. The soil sampling locations are given in the Table 4.10 and
the same are shown in Figure 4.28 and Figure 4.29.
Table 4-10 Details of Soil Sampling Locations
Code Location Distance from the project
site (Aerial Distance) in km Latitudes & Longitudes
S1 Project Site 0 23 11’56.3”N 81 35’55.0”E
S2 Kelhauri 3.89 23 11' 05.2"N 81 38' 04.6"E
S3 Batura 4.80 23º 12' 28.5"N 81º 37' 52.7"E
S4 Mediyaras 7.92 23 08' 33.8" N 81 38' 36.0" E
S5 Imam Bada 3.83 23º 11' 9.7"N 81º 33' 00.3"E
S6 Lakheran Tola 6.87 23 12’ 53.3”N 81 31’ 23.3”E
S7 Chaka 4.33 23º 14' 13.5"N 81º 36' 59.2"E
S8 Devhara 5.44 23 08’ 25.9”N 81 35’ 51.7”E
The summary results of the soil quality are presented in Annexure 11. The soil sampling
results are compared with the standard soil classification.
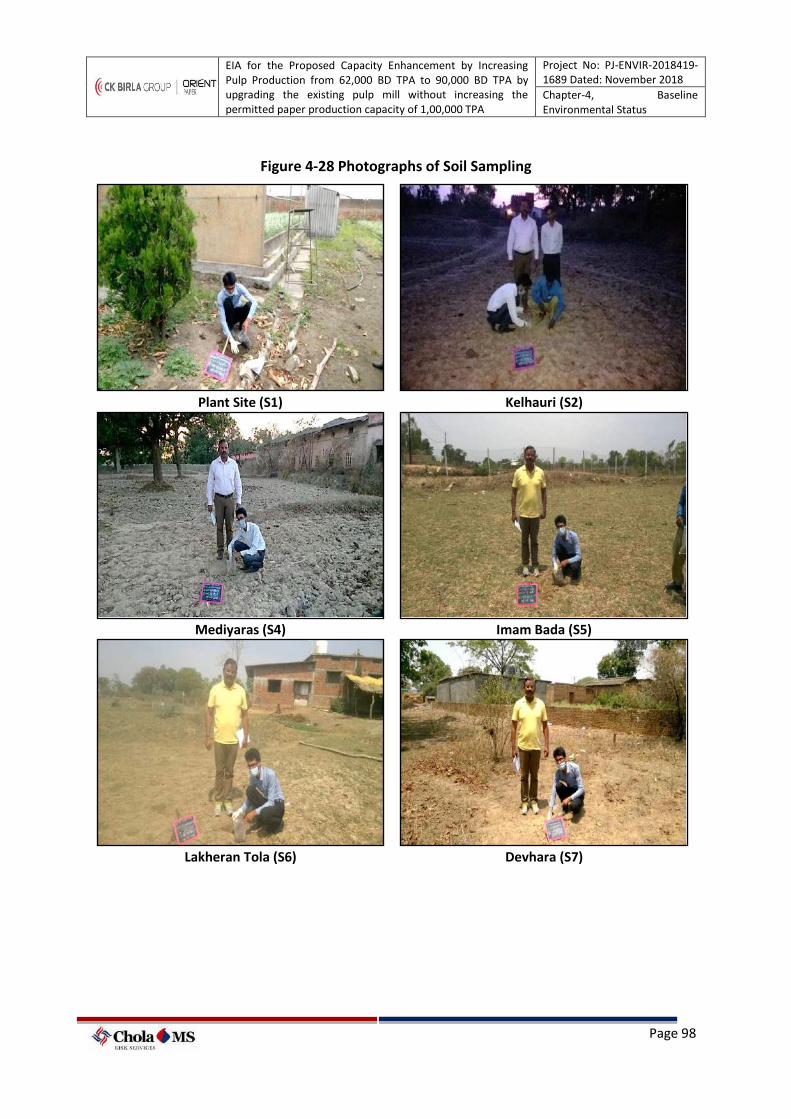
EIA for the Proposed Capacity Enhancement by Increasing Pulp Production from 62,000 BD TPA to 90,000 BD TPA by upgrading the existing pulp mill without increasing the permitted paper production capacity of 1,00,000 TPA
Project No: PJ-ENVIR-2018419-1689 Dated: November 2018
Chapter-4, Baseline Environmental Status
Page 98
Figure 4-28 Photographs of Soil Sampling
Plant Site (S1) Kelhauri (S2)
Mediyaras (S4) Imam Bada (S5)
Lakheran Tola (S6) Devhara (S7)
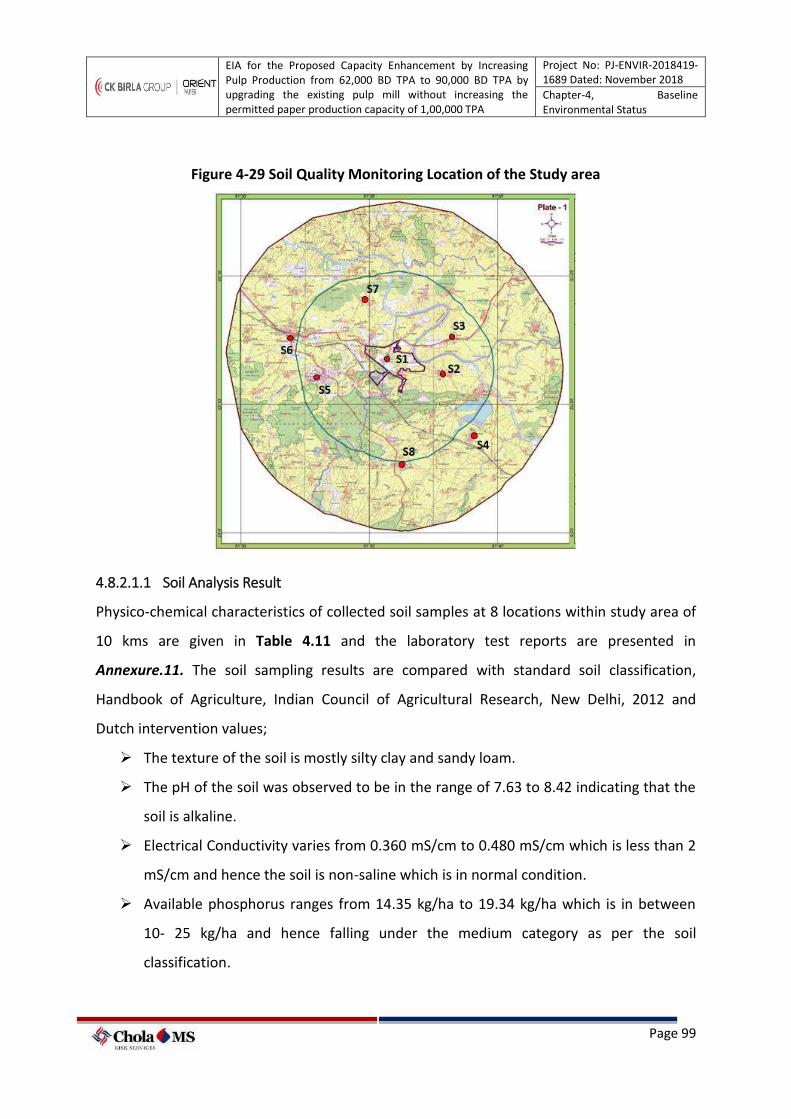
EIA for the Proposed Capacity Enhancement by Increasing Pulp Production from 62,000 BD TPA to 90,000 BD TPA by upgrading the existing pulp mill without increasing the permitted paper production capacity of 1,00,000 TPA
Project No: PJ-ENVIR-2018419-1689 Dated: November 2018
Chapter-4, Baseline Environmental Status
Page 99
Figure 4-29 Soil Quality Monitoring Location of the Study area
4.8.2.1.1 Soil Analysis Result
Physico-chemical characteristics of collected soil samples at 8 locations within study area of
10 kms are given in Table 4.11 and the laboratory test reports are presented in
Annexure.11. The soil sampling results are compared with standard soil classification,
Handbook of Agriculture, Indian Council of Agricultural Research, New Delhi, 2012 and
Dutch intervention values;
➢ The texture of the soil is mostly silty clay and sandy loam.
➢ The pH of the soil was observed to be in the range of 7.63 to 8.42 indicating that the
soil is alkaline.
➢ Electrical Conductivity varies from 0.360 mS/cm to 0.480 mS/cm which is less than 2
mS/cm and hence the soil is non-saline which is in normal condition.
➢ Available phosphorus ranges from 14.35 kg/ha to 19.34 kg/ha which is in between
10- 25 kg/ha and hence falling under the medium category as per the soil
classification.
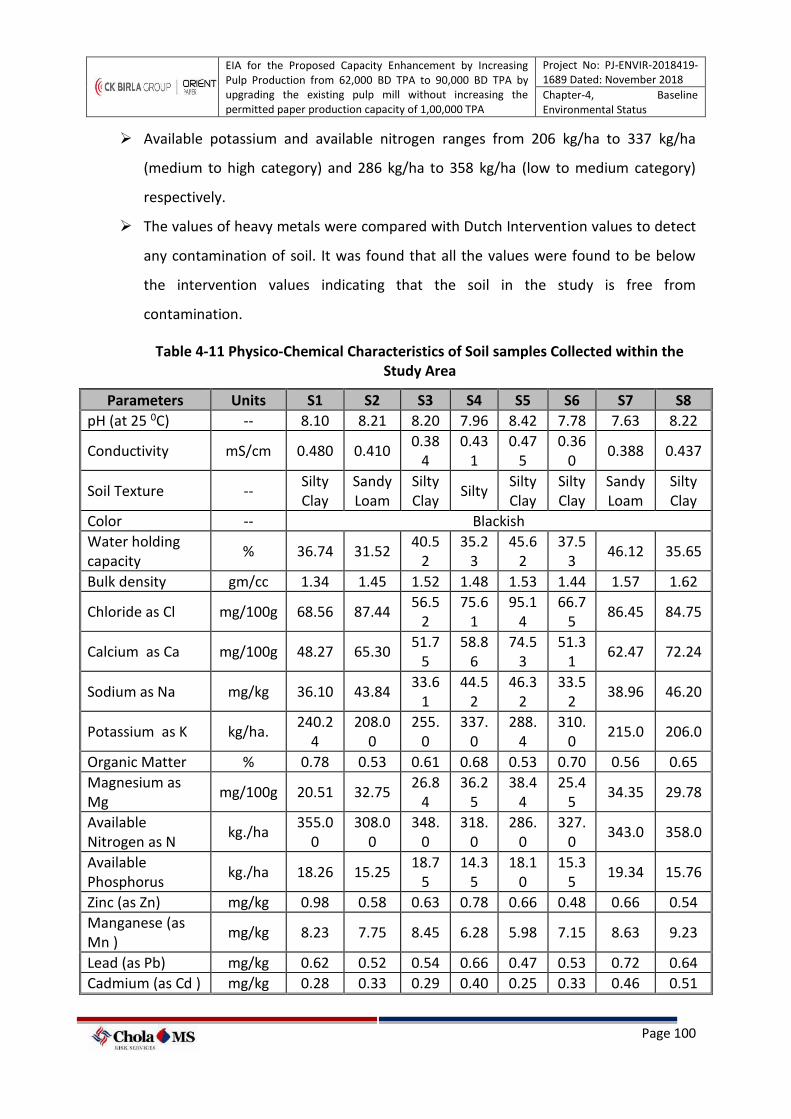
EIA for the Proposed Capacity Enhancement by Increasing Pulp Production from 62,000 BD TPA to 90,000 BD TPA by upgrading the existing pulp mill without increasing the permitted paper production capacity of 1,00,000 TPA
Project No: PJ-ENVIR-2018419-1689 Dated: November 2018
Chapter-4, Baseline Environmental Status
Page 100
➢ Available potassium and available nitrogen ranges from 206 kg/ha to 337 kg/ha
(medium to high category) and 286 kg/ha to 358 kg/ha (low to medium category)
respectively.
➢ The values of heavy metals were compared with Dutch Intervention values to detect
any contamination of soil. It was found that all the values were found to be below
the intervention values indicating that the soil in the study is free from
contamination.
Table 4-11 Physico-Chemical Characteristics of Soil samples Collected within the Study Area
Parameters Units S1 S2 S3 S4 S5 S6 S7 S8
pH (at 25 0C) -- 8.10 8.21 8.20 7.96 8.42 7.78 7.63 8.22
Conductivity mS/cm 0.480 0.410 0.38
4 0.43
1 0.47
5 0.36
0 0.388 0.437
Soil Texture -- Silty Clay
Sandy Loam
Silty Clay
Silty Silty Clay
Silty Clay
Sandy Loam
Silty Clay
Color -- Blackish
Water holding capacity
% 36.74 31.52 40.5
2 35.2
3 45.6
2 37.5
3 46.12 35.65
Bulk density gm/cc 1.34 1.45 1.52 1.48 1.53 1.44 1.57 1.62
Chloride as Cl mg/100g 68.56 87.44 56.5
2 75.6
1 95.1
4 66.7
5 86.45 84.75
Calcium as Ca mg/100g 48.27 65.30 51.7
5 58.8
6 74.5
3 51.3
1 62.47 72.24
Sodium as Na mg/kg 36.10 43.84 33.6
1 44.5
2 46.3
2 33.5
2 38.96 46.20
Potassium as K kg/ha. 240.2
4 208.0
0 255.
0 337.
0 288.
4 310.
0 215.0 206.0
Organic Matter % 0.78 0.53 0.61 0.68 0.53 0.70 0.56 0.65
Magnesium as Mg
mg/100g 20.51 32.75 26.8
4 36.2
5 38.4
4 25.4
5 34.35 29.78
Available Nitrogen as N
kg./ha 355.0
0 308.0
0 348.
0 318.
0 286.
0 327.
0 343.0 358.0
Available Phosphorus
kg./ha 18.26 15.25 18.7
5 14.3
5 18.1
0 15.3
5 19.34 15.76
Zinc (as Zn) mg/kg 0.98 0.58 0.63 0.78 0.66 0.48 0.66 0.54
Manganese (as Mn )
mg/kg 8.23 7.75 8.45 6.28 5.98 7.15 8.63 9.23
Lead (as Pb) mg/kg 0.62 0.52 0.54 0.66 0.47 0.53 0.72 0.64
Cadmium (as Cd ) mg/kg 0.28 0.33 0.29 0.40 0.25 0.33 0.46 0.51
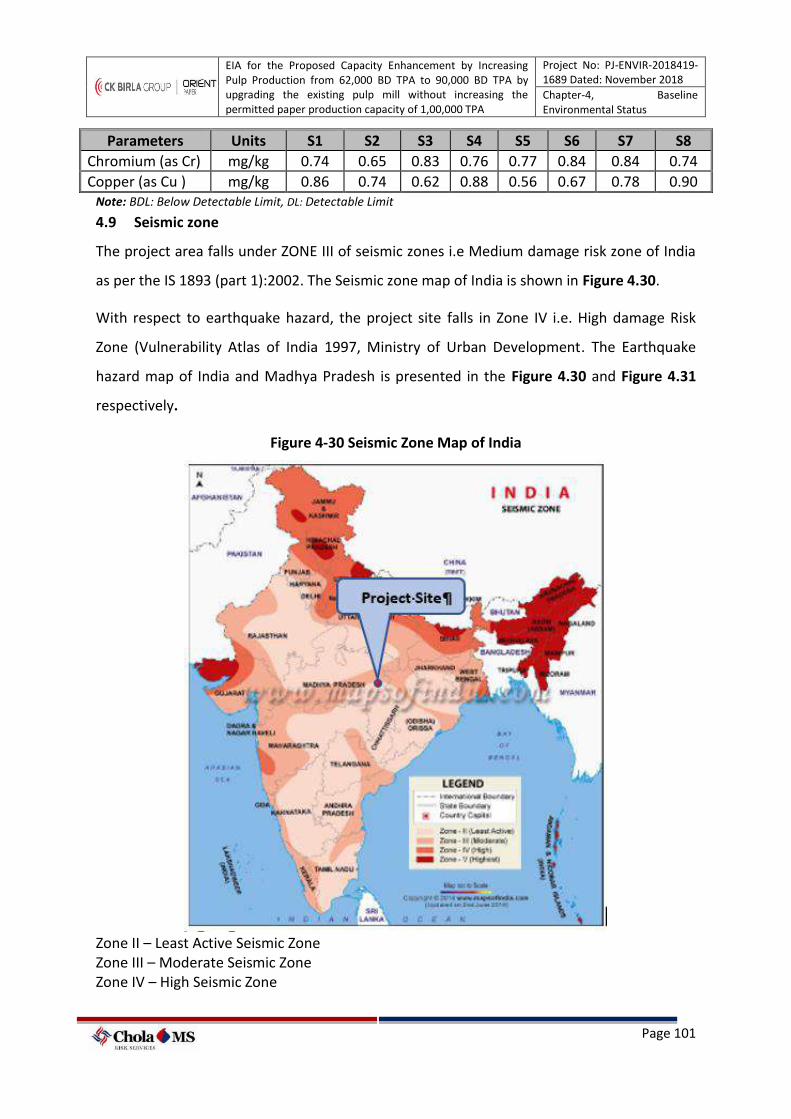
EIA for the Proposed Capacity Enhancement by Increasing Pulp Production from 62,000 BD TPA to 90,000 BD TPA by upgrading the existing pulp mill without increasing the permitted paper production capacity of 1,00,000 TPA
Project No: PJ-ENVIR-2018419-1689 Dated: November 2018
Chapter-4, Baseline Environmental Status
Page 101
Parameters Units S1 S2 S3 S4 S5 S6 S7 S8
Chromium (as Cr) mg/kg 0.74 0.65 0.83 0.76 0.77 0.84 0.84 0.74
Copper (as Cu ) mg/kg 0.86 0.74 0.62 0.88 0.56 0.67 0.78 0.90 Note: BDL: Below Detectable Limit, DL: Detectable Limit
4.9 Seismic zone
The project area falls under ZONE III of seismic zones i.e Medium damage risk zone of India
as per the IS 1893 (part 1):2002. The Seismic zone map of India is shown in Figure 4.30.
With respect to earthquake hazard, the project site falls in Zone IV i.e. High damage Risk
Zone (Vulnerability Atlas of India 1997, Ministry of Urban Development. The Earthquake
hazard map of India and Madhya Pradesh is presented in the Figure 4.30 and Figure 4.31
respectively.
Figure 4-30 Seismic Zone Map of India
Zone II – Least Active Seismic Zone Zone III – Moderate Seismic Zone Zone IV – High Seismic Zone
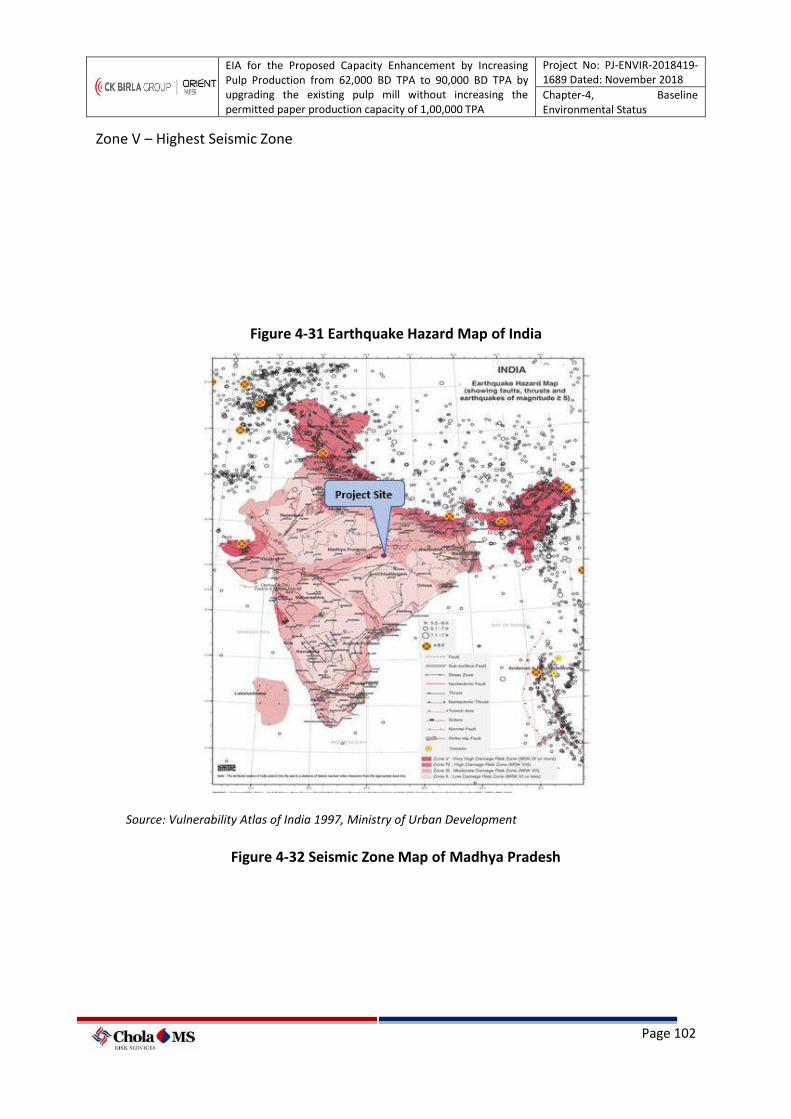
EIA for the Proposed Capacity Enhancement by Increasing Pulp Production from 62,000 BD TPA to 90,000 BD TPA by upgrading the existing pulp mill without increasing the permitted paper production capacity of 1,00,000 TPA
Project No: PJ-ENVIR-2018419-1689 Dated: November 2018
Chapter-4, Baseline Environmental Status
Page 102
Zone V – Highest Seismic Zone
Figure 4-31 Earthquake Hazard Map of India
Source: Vulnerability Atlas of India 1997, Ministry of Urban Development
Figure 4-32 Seismic Zone Map of Madhya Pradesh
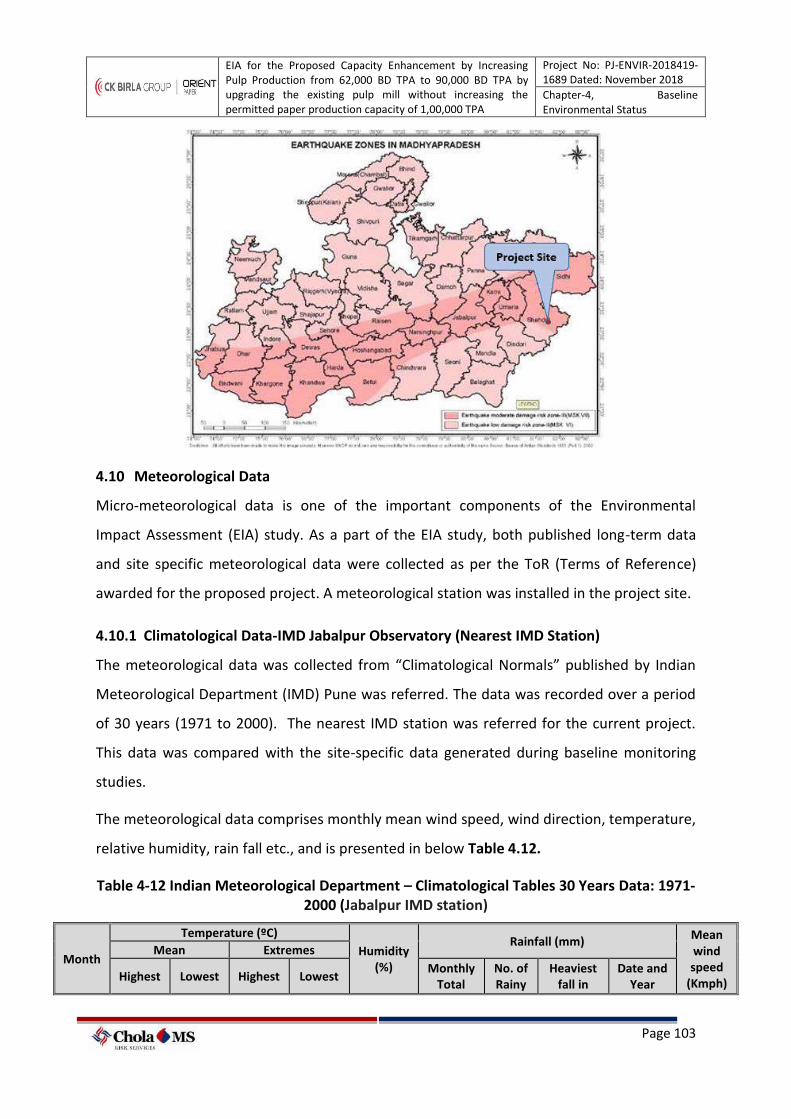
EIA for the Proposed Capacity Enhancement by Increasing Pulp Production from 62,000 BD TPA to 90,000 BD TPA by upgrading the existing pulp mill without increasing the permitted paper production capacity of 1,00,000 TPA
Project No: PJ-ENVIR-2018419-1689 Dated: November 2018
Chapter-4, Baseline Environmental Status
Page 103
4.10 Meteorological Data
Micro-meteorological data is one of the important components of the Environmental
Impact Assessment (EIA) study. As a part of the EIA study, both published long-term data
and site specific meteorological data were collected as per the ToR (Terms of Reference)
awarded for the proposed project. A meteorological station was installed in the project site.
4.10.1 Climatological Data-IMD Jabalpur Observatory (Nearest IMD Station)
The meteorological data was collected from “Climatological Normals” published by Indian
Meteorological Department (IMD) Pune was referred. The data was recorded over a period
of 30 years (1971 to 2000). The nearest IMD station was referred for the current project.
This data was compared with the site-specific data generated during baseline monitoring
studies.
The meteorological data comprises monthly mean wind speed, wind direction, temperature,
relative humidity, rain fall etc., and is presented in below Table 4.12.
Table 4-12 Indian Meteorological Department – Climatological Tables 30 Years Data: 1971-2000 (Jabalpur IMD station)
Month
Temperature (ºC)
Humidity (%)
Rainfall (mm) Mean wind speed
(Kmph)
Mean Extremes
Highest Lowest Highest Lowest Monthly
Total No. of Rainy
Heaviest fall in
Date and Year
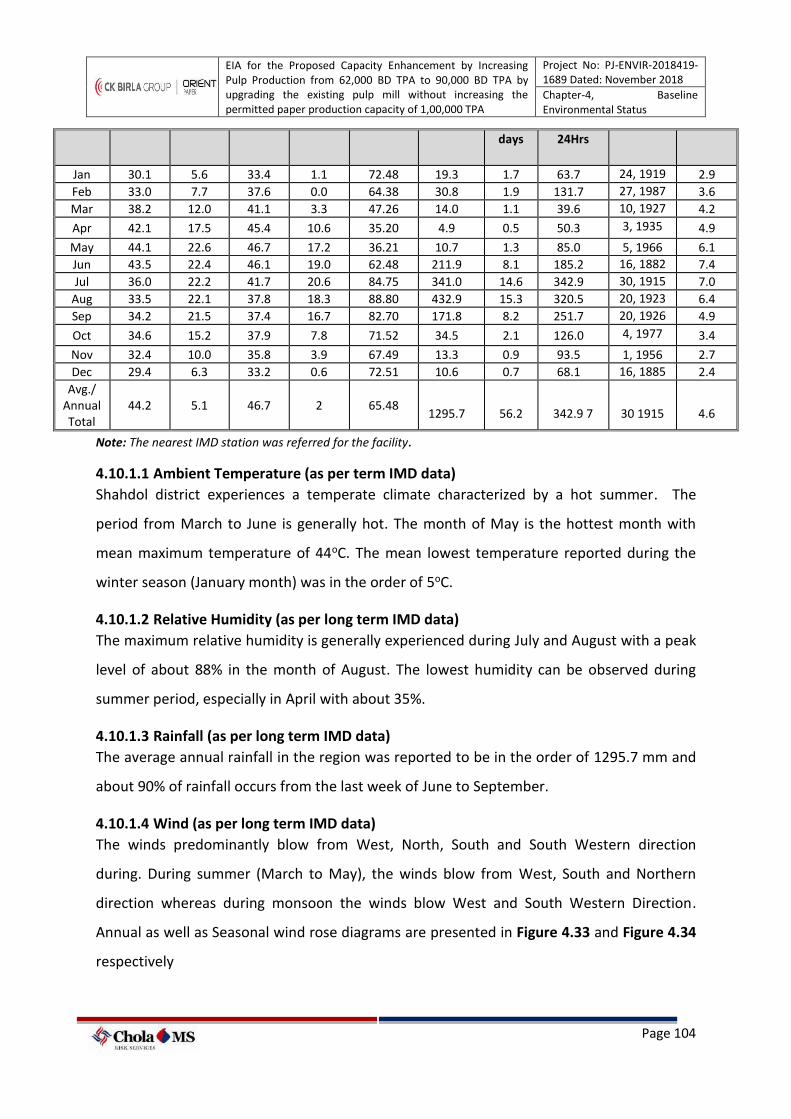
EIA for the Proposed Capacity Enhancement by Increasing Pulp Production from 62,000 BD TPA to 90,000 BD TPA by upgrading the existing pulp mill without increasing the permitted paper production capacity of 1,00,000 TPA
Project No: PJ-ENVIR-2018419-1689 Dated: November 2018
Chapter-4, Baseline Environmental Status
Page 104
days 24Hrs
Jan 30.1 5.6 33.4 1.1 72.48 19.3 1.7 63.7 24, 1919 2.9
Feb 33.0 7.7 37.6 0.0 64.38 30.8 1.9 131.7 27, 1987 3.6
Mar 38.2 12.0 41.1 3.3 47.26 14.0 1.1 39.6 10, 1927 4.2
Apr 42.1 17.5 45.4 10.6 35.20 4.9 0.5 50.3 3, 1935 4.9
May 44.1 22.6 46.7 17.2 36.21 10.7 1.3 85.0 5, 1966 6.1
Jun 43.5 22.4 46.1 19.0 62.48 211.9 8.1 185.2 16, 1882 7.4
Jul 36.0 22.2 41.7 20.6 84.75 341.0 14.6 342.9 30, 1915 7.0
Aug 33.5 22.1 37.8 18.3 88.80 432.9 15.3 320.5 20, 1923 6.4
Sep 34.2 21.5 37.4 16.7 82.70 171.8 8.2 251.7 20, 1926 4.9
Oct 34.6 15.2 37.9 7.8 71.52 34.5 2.1 126.0 4, 1977 3.4
Nov 32.4 10.0 35.8 3.9 67.49 13.3 0.9 93.5 1, 1956 2.7
Dec 29.4 6.3 33.2 0.6 72.51 10.6 0.7 68.1 16, 1885 2.4
Avg./ Annual Total
44.2 5.1 46.7 2 65.48
1295.7
56.2
342.9 7
30 1915
4.6
Note: The nearest IMD station was referred for the facility.
4.10.1.1 Ambient Temperature (as per term IMD data)
Shahdol district experiences a temperate climate characterized by a hot summer. The
period from March to June is generally hot. The month of May is the hottest month with
mean maximum temperature of 44oC. The mean lowest temperature reported during the
winter season (January month) was in the order of 5oC.
4.10.1.2 Relative Humidity (as per long term IMD data)
The maximum relative humidity is generally experienced during July and August with a peak
level of about 88% in the month of August. The lowest humidity can be observed during
summer period, especially in April with about 35%.
4.10.1.3 Rainfall (as per long term IMD data)
The average annual rainfall in the region was reported to be in the order of 1295.7 mm and
about 90% of rainfall occurs from the last week of June to September.
4.10.1.4 Wind (as per long term IMD data)
The winds predominantly blow from West, North, South and South Western direction
during. During summer (March to May), the winds blow from West, South and Northern
direction whereas during monsoon the winds blow West and South Western Direction.
Annual as well as Seasonal wind rose diagrams are presented in Figure 4.33 and Figure 4.34
respectively
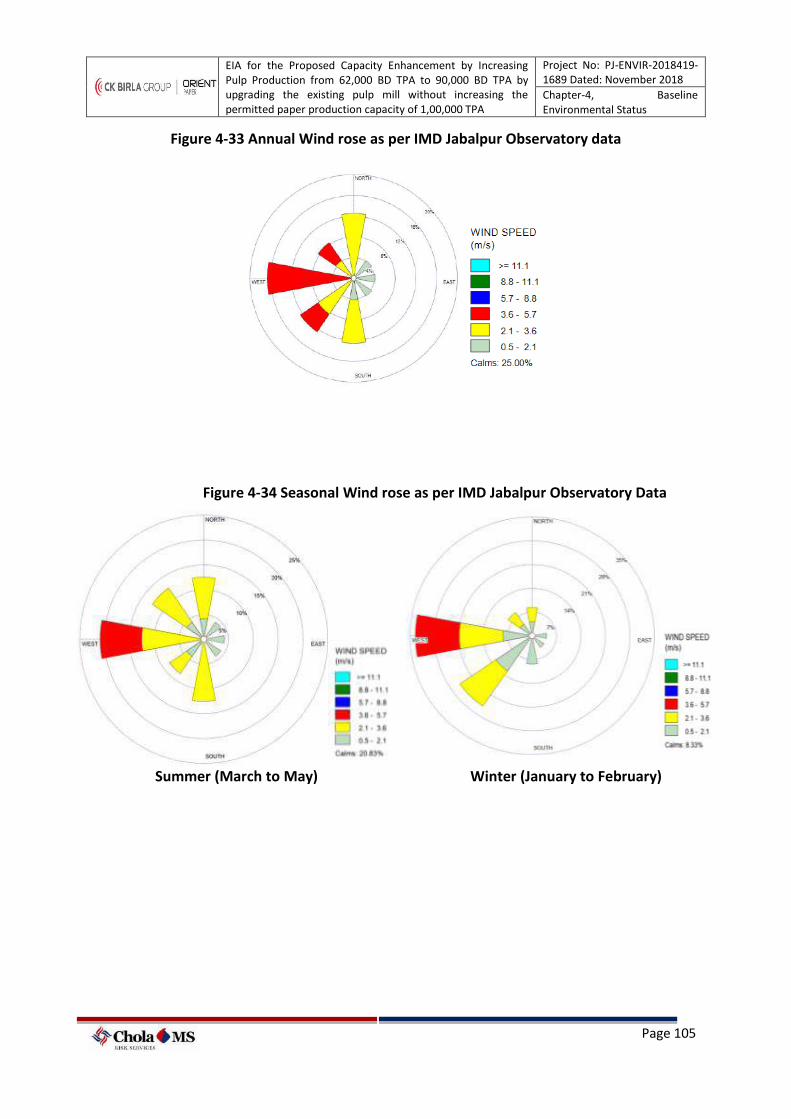
EIA for the Proposed Capacity Enhancement by Increasing Pulp Production from 62,000 BD TPA to 90,000 BD TPA by upgrading the existing pulp mill without increasing the permitted paper production capacity of 1,00,000 TPA
Project No: PJ-ENVIR-2018419-1689 Dated: November 2018
Chapter-4, Baseline Environmental Status
Page 105
Figure 4-33 Annual Wind rose as per IMD Jabalpur Observatory data
Figure 4-34 Seasonal Wind rose as per IMD Jabalpur Observatory Data
Summer (March to May) Winter (January to February)
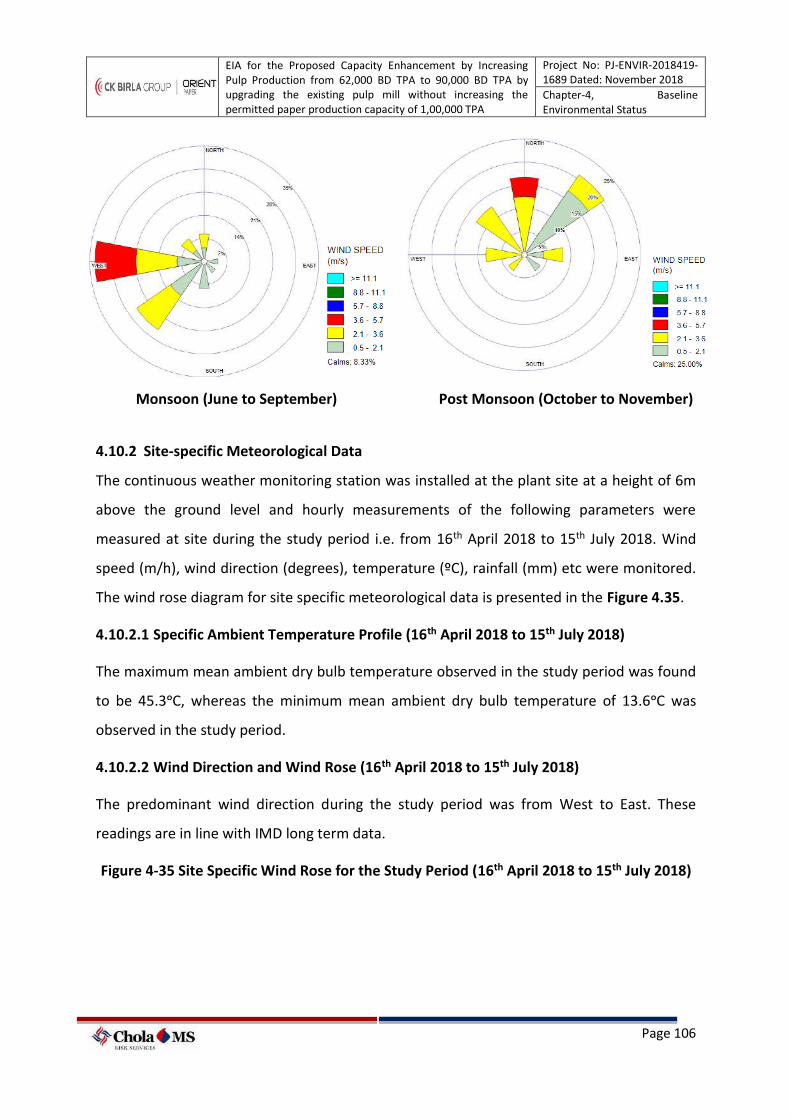
EIA for the Proposed Capacity Enhancement by Increasing Pulp Production from 62,000 BD TPA to 90,000 BD TPA by upgrading the existing pulp mill without increasing the permitted paper production capacity of 1,00,000 TPA
Project No: PJ-ENVIR-2018419-1689 Dated: November 2018
Chapter-4, Baseline Environmental Status
Page 106
Monsoon (June to September) Post Monsoon (October to November)
4.10.2 Site-specific Meteorological Data
The continuous weather monitoring station was installed at the plant site at a height of 6m
above the ground level and hourly measurements of the following parameters were
measured at site during the study period i.e. from 16th April 2018 to 15th July 2018. Wind
speed (m/h), wind direction (degrees), temperature (ºC), rainfall (mm) etc were monitored.
The wind rose diagram for site specific meteorological data is presented in the Figure 4.35.
4.10.2.1 Specific Ambient Temperature Profile (16th April 2018 to 15th July 2018)
The maximum mean ambient dry bulb temperature observed in the study period was found
to be 45.3ᵒC, whereas the minimum mean ambient dry bulb temperature of 13.6ᵒC was
observed in the study period.
4.10.2.2 Wind Direction and Wind Rose (16th April 2018 to 15th July 2018)
The predominant wind direction during the study period was from West to East. These
readings are in line with IMD long term data.
Figure 4-35 Site Specific Wind Rose for the Study Period (16th April 2018 to 15th July 2018)
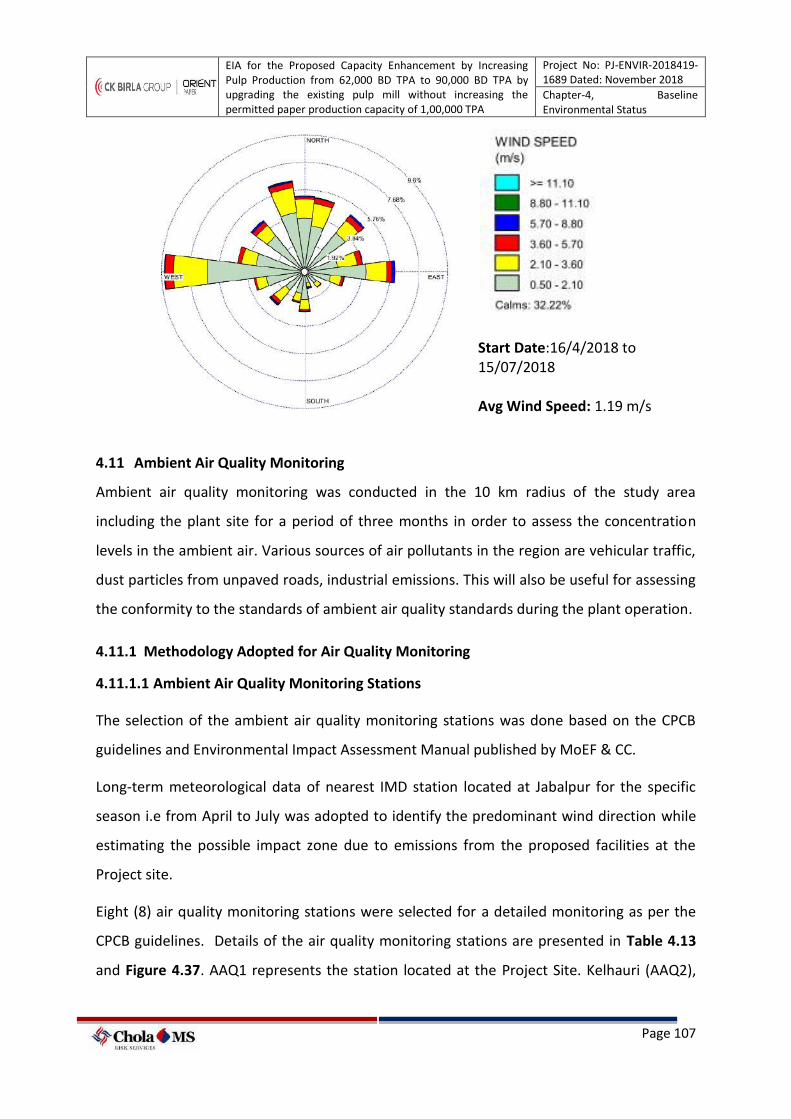
EIA for the Proposed Capacity Enhancement by Increasing Pulp Production from 62,000 BD TPA to 90,000 BD TPA by upgrading the existing pulp mill without increasing the permitted paper production capacity of 1,00,000 TPA
Project No: PJ-ENVIR-2018419-1689 Dated: November 2018
Chapter-4, Baseline Environmental Status
Page 107
Start Date:16/4/2018 to 15/07/2018 Avg Wind Speed: 1.19 m/s
4.11 Ambient Air Quality Monitoring
Ambient air quality monitoring was conducted in the 10 km radius of the study area
including the plant site for a period of three months in order to assess the concentration
levels in the ambient air. Various sources of air pollutants in the region are vehicular traffic,
dust particles from unpaved roads, industrial emissions. This will also be useful for assessing
the conformity to the standards of ambient air quality standards during the plant operation.
4.11.1 Methodology Adopted for Air Quality Monitoring
4.11.1.1 Ambient Air Quality Monitoring Stations
The selection of the ambient air quality monitoring stations was done based on the CPCB
guidelines and Environmental Impact Assessment Manual published by MoEF & CC.
Long-term meteorological data of nearest IMD station located at Jabalpur for the specific
season i.e from April to July was adopted to identify the predominant wind direction while
estimating the possible impact zone due to emissions from the proposed facilities at the
Project site.
Eight (8) air quality monitoring stations were selected for a detailed monitoring as per the
CPCB guidelines. Details of the air quality monitoring stations are presented in Table 4.13
and Figure 4.37. AAQ1 represents the station located at the Project Site. Kelhauri (AAQ2),
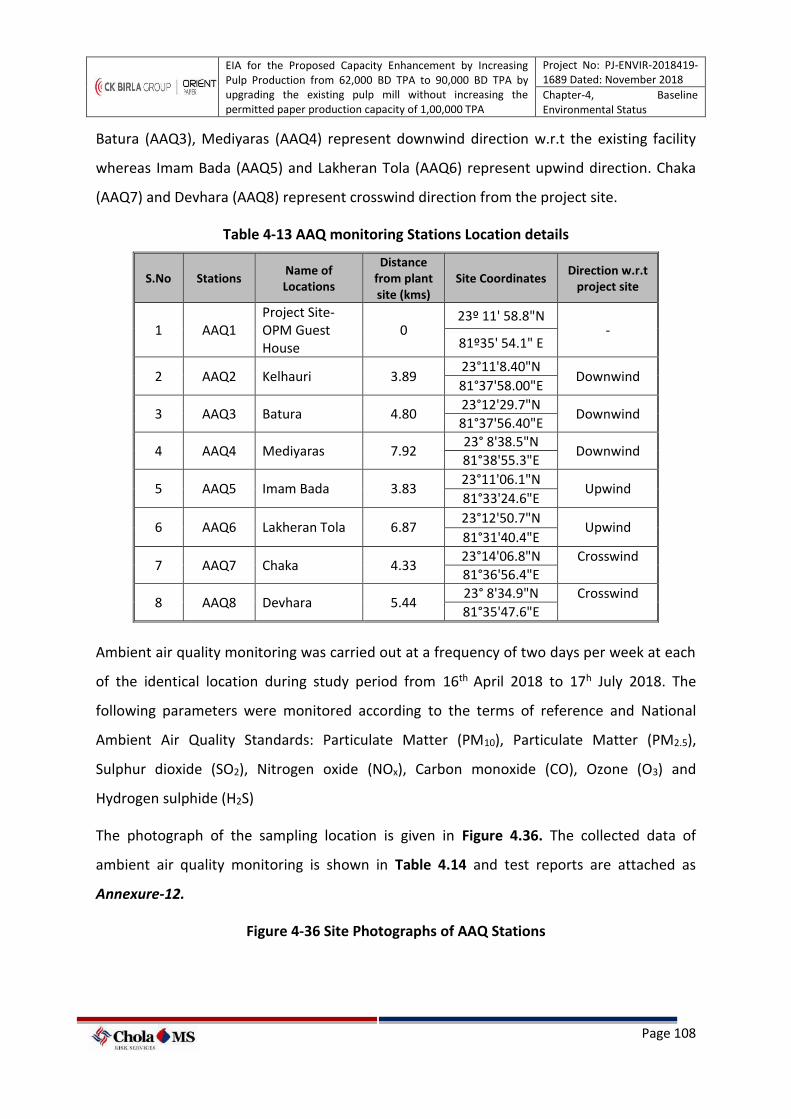
EIA for the Proposed Capacity Enhancement by Increasing Pulp Production from 62,000 BD TPA to 90,000 BD TPA by upgrading the existing pulp mill without increasing the permitted paper production capacity of 1,00,000 TPA
Project No: PJ-ENVIR-2018419-1689 Dated: November 2018
Chapter-4, Baseline Environmental Status
Page 108
Batura (AAQ3), Mediyaras (AAQ4) represent downwind direction w.r.t the existing facility
whereas Imam Bada (AAQ5) and Lakheran Tola (AAQ6) represent upwind direction. Chaka
(AAQ7) and Devhara (AAQ8) represent crosswind direction from the project site.
Table 4-13 AAQ monitoring Stations Location details
S.No Stations Name of Locations
Distance from plant site (kms)
Site Coordinates Direction w.r.t
project site
1 AAQ1 Project Site- OPM Guest House
0 23º 11' 58.8"N
- 81º35' 54.1" E
2 AAQ2 Kelhauri 3.89 23°11'8.40"N
Downwind 81°37'58.00"E
3 AAQ3 Batura 4.80 23°12'29.7"N
Downwind 81°37'56.40"E
4 AAQ4 Mediyaras 7.92 23° 8'38.5"N
Downwind 81°38'55.3"E
5 AAQ5 Imam Bada 3.83 23°11'06.1"N
Upwind 81°33'24.6"E
6 AAQ6 Lakheran Tola 6.87 23°12'50.7"N
Upwind 81°31'40.4"E
7 AAQ7 Chaka 4.33 23°14'06.8"N Crosswind
81°36'56.4"E
8 AAQ8 Devhara 5.44 23° 8'34.9"N Crosswind
81°35'47.6"E
Ambient air quality monitoring was carried out at a frequency of two days per week at each
of the identical location during study period from 16th April 2018 to 17h July 2018. The
following parameters were monitored according to the terms of reference and National
Ambient Air Quality Standards: Particulate Matter (PM10), Particulate Matter (PM2.5),
Sulphur dioxide (SO2), Nitrogen oxide (NOx), Carbon monoxide (CO), Ozone (O3) and
Hydrogen sulphide (H2S)
The photograph of the sampling location is given in Figure 4.36. The collected data of
ambient air quality monitoring is shown in Table 4.14 and test reports are attached as
Annexure-12.
Figure 4-36 Site Photographs of AAQ Stations
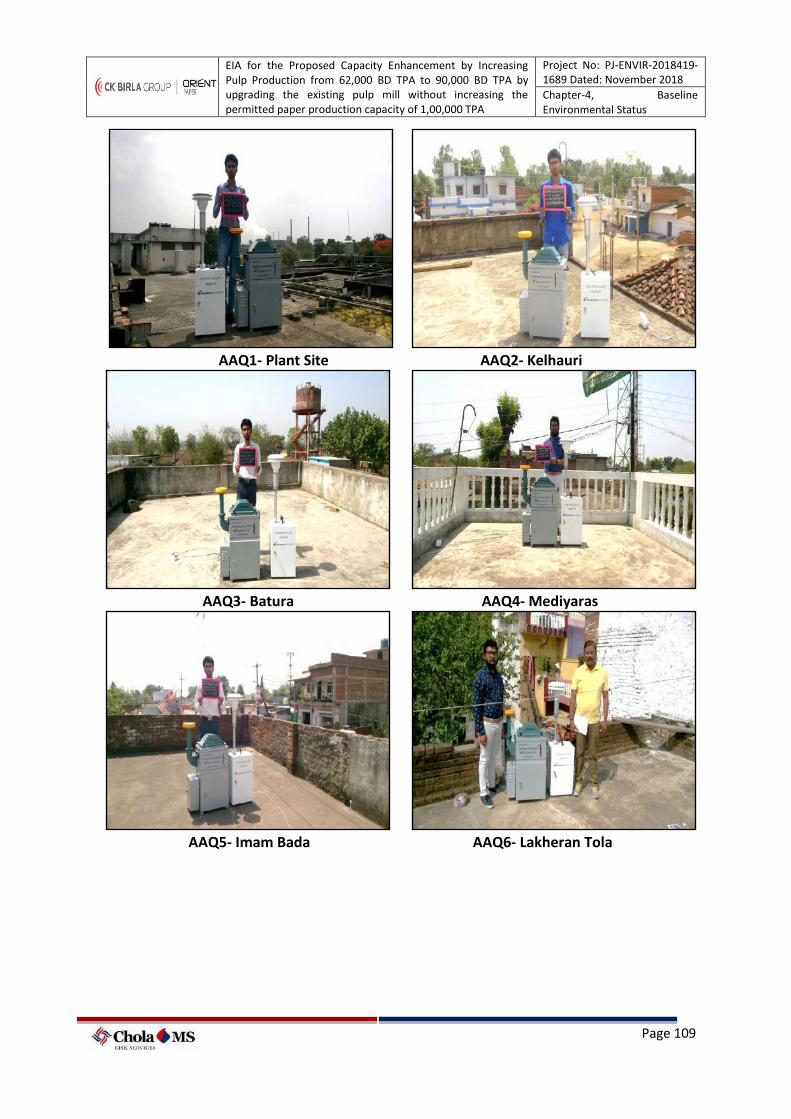
EIA for the Proposed Capacity Enhancement by Increasing Pulp Production from 62,000 BD TPA to 90,000 BD TPA by upgrading the existing pulp mill without increasing the permitted paper production capacity of 1,00,000 TPA
Project No: PJ-ENVIR-2018419-1689 Dated: November 2018
Chapter-4, Baseline Environmental Status
Page 109
AAQ1- Plant Site AAQ2- Kelhauri
AAQ3- Batura AAQ4- Mediyaras
AAQ5- Imam Bada AAQ6- Lakheran Tola
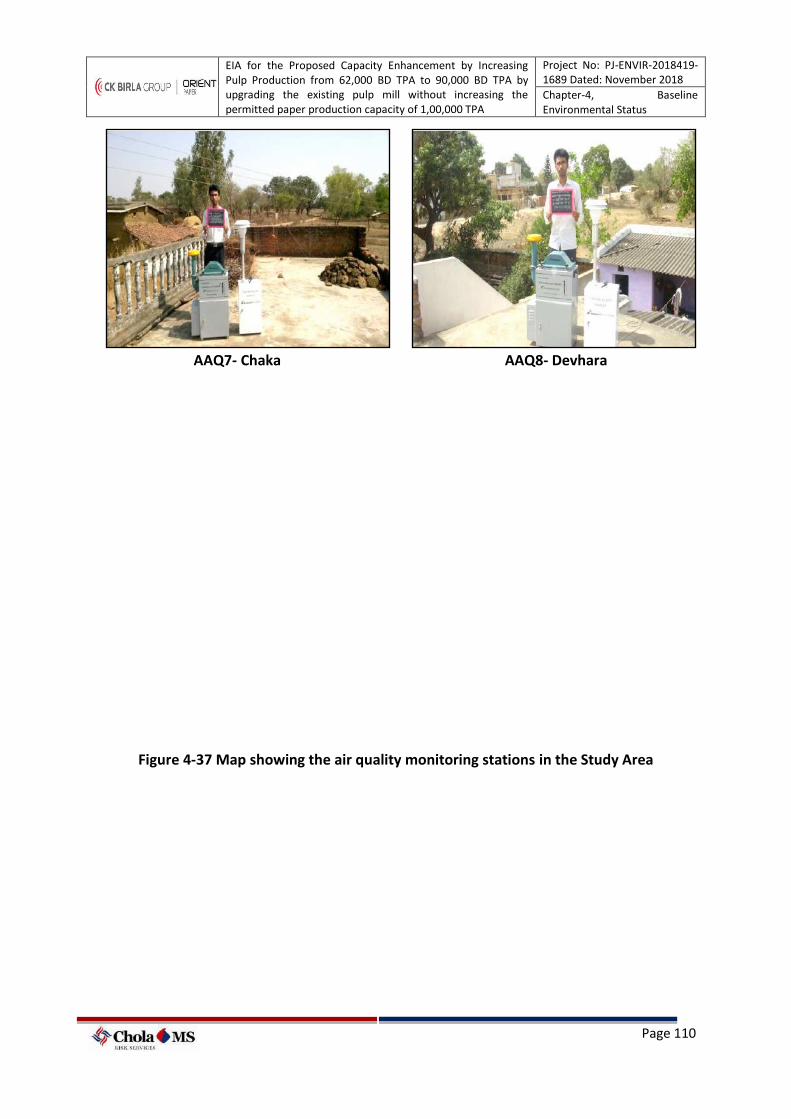
EIA for the Proposed Capacity Enhancement by Increasing Pulp Production from 62,000 BD TPA to 90,000 BD TPA by upgrading the existing pulp mill without increasing the permitted paper production capacity of 1,00,000 TPA
Project No: PJ-ENVIR-2018419-1689 Dated: November 2018
Chapter-4, Baseline Environmental Status
Page 110
AAQ7- Chaka AAQ8- Devhara
Figure 4-37 Map showing the air quality monitoring stations in the Study Area
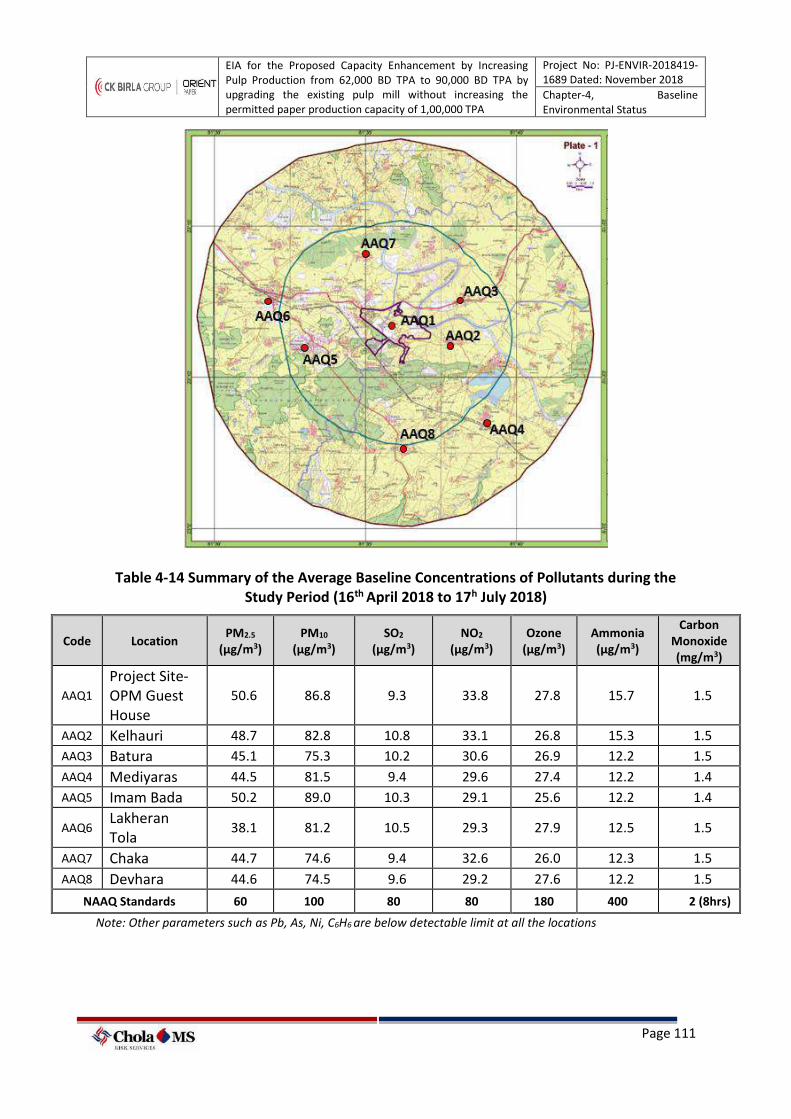
EIA for the Proposed Capacity Enhancement by Increasing Pulp Production from 62,000 BD TPA to 90,000 BD TPA by upgrading the existing pulp mill without increasing the permitted paper production capacity of 1,00,000 TPA
Project No: PJ-ENVIR-2018419-1689 Dated: November 2018
Chapter-4, Baseline Environmental Status
Page 111
Table 4-14 Summary of the Average Baseline Concentrations of Pollutants during the Study Period (16th April 2018 to 17h July 2018)
Code Location PM2.5
(µg/m3) PM10
(µg/m3) SO2
(µg/m3) NO2
(µg/m3) Ozone
(µg/m3) Ammonia (µg/m3)
Carbon Monoxide (mg/m3)
AAQ1
Project Site- OPM Guest House
50.6 86.8 9.3 33.8 27.8 15.7 1.5
AAQ2 Kelhauri 48.7 82.8 10.8 33.1 26.8 15.3 1.5
AAQ3 Batura 45.1 75.3 10.2 30.6 26.9 12.2 1.5
AAQ4 Mediyaras 44.5 81.5 9.4 29.6 27.4 12.2 1.4
AAQ5 Imam Bada 50.2 89.0 10.3 29.1 25.6 12.2 1.4
AAQ6 Lakheran Tola
38.1 81.2 10.5 29.3 27.9 12.5 1.5
AAQ7 Chaka 44.7 74.6 9.4 32.6 26.0 12.3 1.5
AAQ8 Devhara 44.6 74.5 9.6 29.2 27.6 12.2 1.5
NAAQ Standards 60 100 80 80 180 400 2 (8hrs)
Note: Other parameters such as Pb, As, Ni, C6H6 are below detectable limit at all the locations
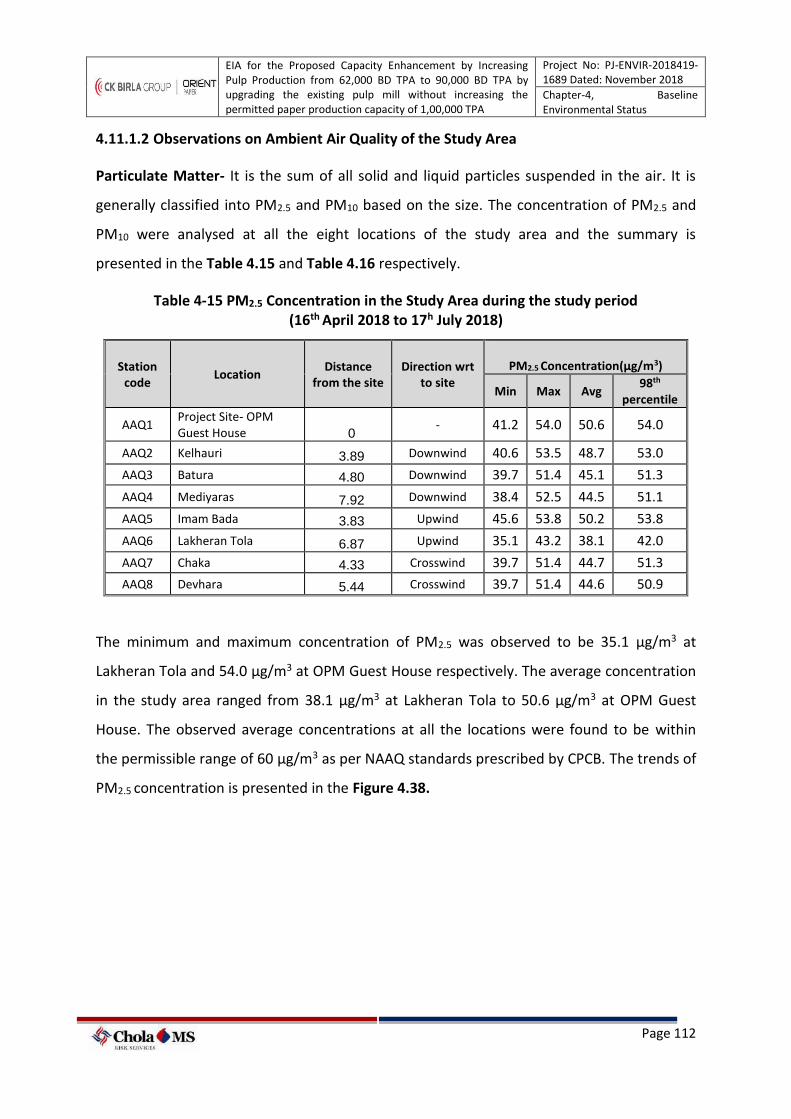
EIA for the Proposed Capacity Enhancement by Increasing Pulp Production from 62,000 BD TPA to 90,000 BD TPA by upgrading the existing pulp mill without increasing the permitted paper production capacity of 1,00,000 TPA
Project No: PJ-ENVIR-2018419-1689 Dated: November 2018
Chapter-4, Baseline Environmental Status
Page 112
4.11.1.2 Observations on Ambient Air Quality of the Study Area
Particulate Matter- It is the sum of all solid and liquid particles suspended in the air. It is
generally classified into PM2.5 and PM10 based on the size. The concentration of PM2.5 and
PM10 were analysed at all the eight locations of the study area and the summary is
presented in the Table 4.15 and Table 4.16 respectively.
Table 4-15 PM2.5 Concentration in the Study Area during the study period (16th April 2018 to 17h July 2018)
Station code
Location Distance
from the site Direction wrt
to site
PM2.5 Concentration(µg/m3)
Min Max Avg 98th
percentile
AAQ1 Project Site- OPM Guest House 0
- 41.2 54.0 50.6 54.0
AAQ2 Kelhauri 3.89 Downwind 40.6 53.5 48.7 53.0
AAQ3 Batura 4.80 Downwind 39.7 51.4 45.1 51.3
AAQ4 Mediyaras 7.92 Downwind 38.4 52.5 44.5 51.1
AAQ5 Imam Bada 3.83 Upwind 45.6 53.8 50.2 53.8
AAQ6 Lakheran Tola 6.87 Upwind 35.1 43.2 38.1 42.0
AAQ7 Chaka 4.33 Crosswind 39.7 51.4 44.7 51.3
AAQ8 Devhara 5.44 Crosswind 39.7 51.4 44.6 50.9
The minimum and maximum concentration of PM2.5 was observed to be 35.1 µg/m3 at
Lakheran Tola and 54.0 µg/m3 at OPM Guest House respectively. The average concentration
in the study area ranged from 38.1 µg/m3 at Lakheran Tola to 50.6 µg/m3 at OPM Guest
House. The observed average concentrations at all the locations were found to be within
the permissible range of 60 µg/m3 as per NAAQ standards prescribed by CPCB. The trends of
PM2.5 concentration is presented in the Figure 4.38.
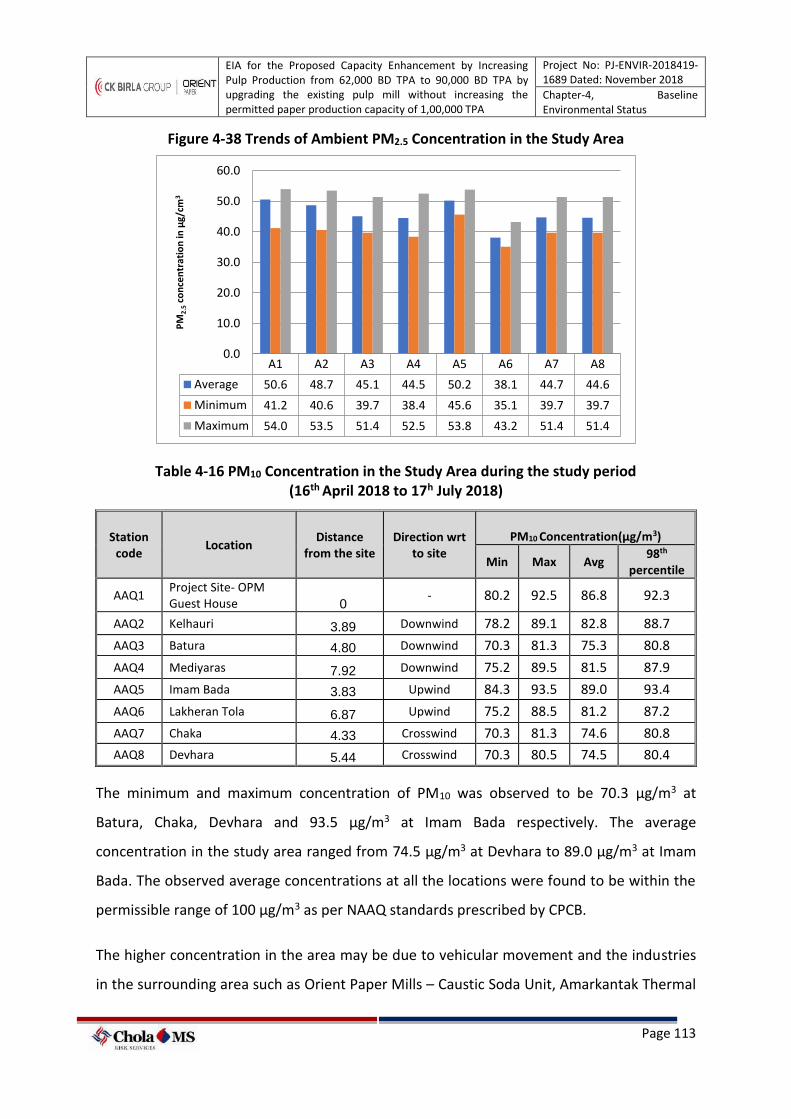
EIA for the Proposed Capacity Enhancement by Increasing Pulp Production from 62,000 BD TPA to 90,000 BD TPA by upgrading the existing pulp mill without increasing the permitted paper production capacity of 1,00,000 TPA
Project No: PJ-ENVIR-2018419-1689 Dated: November 2018
Chapter-4, Baseline Environmental Status
Page 113
Figure 4-38 Trends of Ambient PM2.5 Concentration in the Study Area
Table 4-16 PM10 Concentration in the Study Area during the study period (16th April 2018 to 17h July 2018)
Station code
Location Distance
from the site Direction wrt
to site
PM10 Concentration(µg/m3)
Min Max Avg 98th
percentile
AAQ1 Project Site- OPM Guest House 0
- 80.2 92.5 86.8 92.3
AAQ2 Kelhauri 3.89 Downwind 78.2 89.1 82.8 88.7
AAQ3 Batura 4.80 Downwind 70.3 81.3 75.3 80.8
AAQ4 Mediyaras 7.92 Downwind 75.2 89.5 81.5 87.9
AAQ5 Imam Bada 3.83 Upwind 84.3 93.5 89.0 93.4
AAQ6 Lakheran Tola 6.87 Upwind 75.2 88.5 81.2 87.2
AAQ7 Chaka 4.33 Crosswind 70.3 81.3 74.6 80.8
AAQ8 Devhara 5.44 Crosswind 70.3 80.5 74.5 80.4
The minimum and maximum concentration of PM10 was observed to be 70.3 µg/m3 at
Batura, Chaka, Devhara and 93.5 µg/m3 at Imam Bada respectively. The average
concentration in the study area ranged from 74.5 µg/m3 at Devhara to 89.0 µg/m3 at Imam
Bada. The observed average concentrations at all the locations were found to be within the
permissible range of 100 µg/m3 as per NAAQ standards prescribed by CPCB.
The higher concentration in the area may be due to vehicular movement and the industries
in the surrounding area such as Orient Paper Mills – Caustic Soda Unit, Amarkantak Thermal
A1 A2 A3 A4 A5 A6 A7 A8
Average 50.6 48.7 45.1 44.5 50.2 38.1 44.7 44.6
Minimum 41.2 40.6 39.7 38.4 45.6 35.1 39.7 39.7
Maximum 54.0 53.5 51.4 52.5 53.8 43.2 51.4 51.4
0.0
10.0
20.0
30.0
40.0
50.0
60.0P
M2.
5co
nce
ntr
atio
n in
µg/
cm3
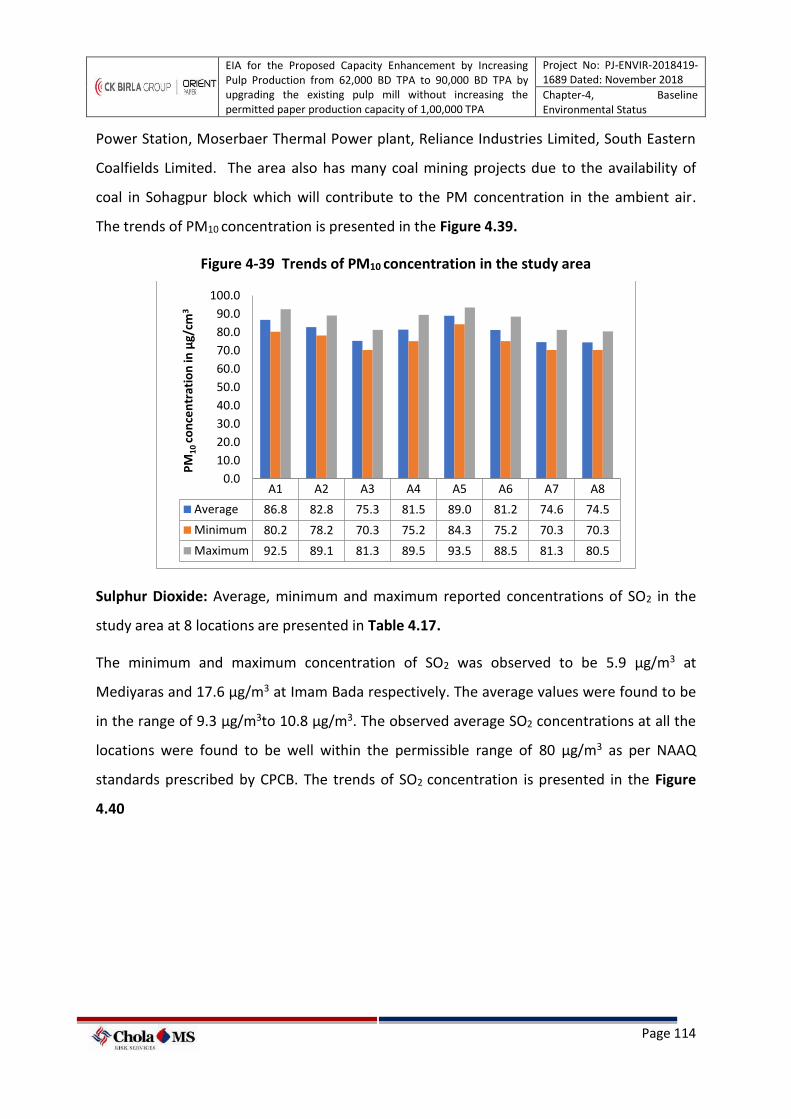
EIA for the Proposed Capacity Enhancement by Increasing Pulp Production from 62,000 BD TPA to 90,000 BD TPA by upgrading the existing pulp mill without increasing the permitted paper production capacity of 1,00,000 TPA
Project No: PJ-ENVIR-2018419-1689 Dated: November 2018
Chapter-4, Baseline Environmental Status
Page 114
Power Station, Moserbaer Thermal Power plant, Reliance Industries Limited, South Eastern
Coalfields Limited. The area also has many coal mining projects due to the availability of
coal in Sohagpur block which will contribute to the PM concentration in the ambient air.
The trends of PM10 concentration is presented in the Figure 4.39.
Figure 4-39 Trends of PM10 concentration in the study area
Sulphur Dioxide: Average, minimum and maximum reported concentrations of SO2 in the
study area at 8 locations are presented in Table 4.17.
The minimum and maximum concentration of SO2 was observed to be 5.9 µg/m3 at
Mediyaras and 17.6 µg/m3 at Imam Bada respectively. The average values were found to be
in the range of 9.3 µg/m3to 10.8 µg/m3. The observed average SO2 concentrations at all the
locations were found to be well within the permissible range of 80 µg/m3 as per NAAQ
standards prescribed by CPCB. The trends of SO2 concentration is presented in the Figure
4.40
A1 A2 A3 A4 A5 A6 A7 A8
Average 86.8 82.8 75.3 81.5 89.0 81.2 74.6 74.5
Minimum 80.2 78.2 70.3 75.2 84.3 75.2 70.3 70.3
Maximum 92.5 89.1 81.3 89.5 93.5 88.5 81.3 80.5
0.0
10.0
20.0
30.0
40.0
50.0
60.0
70.0
80.0
90.0
100.0
PM
10
co
nce
ntr
atio
n in
µg/
cm3

EIA for the Proposed Capacity Enhancement by Increasing Pulp Production from 62,000 BD TPA to 90,000 BD TPA by upgrading the existing pulp mill without increasing the permitted paper production capacity of 1,00,000 TPA
Project No: PJ-ENVIR-2018419-1689 Dated: November 2018
Chapter-4, Baseline Environmental Status
Page 115
Table 4-17 SO2 Concentration in the Study Area during the study period
(16th April 2018 to 17h July 2018)
Station code
Location Distance
from the site Direction wrt
to site
SO2 Concentration(µg/m3)
Min Max Avg 98th
percentile
AAQ1 Project Site- OPM Guest House
0 - 6.3 14.5 9.3 13.5
AAQ2 Kelhauri 3.89 Downwind 6.9 16.4 10.8 16.3
AAQ3 Batura 4.80 Downwind 6.5 15.2 10.2 14.9
AAQ4 Mediyaras 7.92 Downwind 5.9 13.4 9.4 13.4
AAQ5 Imam Bada 3.83 Upwind 6.1 17.6 10.3 15.9
AAQ6 Lakheran Tola 6.87 Upwind 6.3 15.3 10.5 14.9
AAQ7 Chaka 4.33 Crosswind 6.1 15.4 9.4 14.4
AAQ8 Devhara 5.44 Crosswind 6.3 14.5 9.6 14.0
Figure 4-40 Trends of Ambient SO2 Concentration in the Study Area
Nitrogen Dioxide: Average, minimum and maximum reported concentrations of NOx in the
study area at 8 locations are presented in Table 4.18.
The minimum and maximum concentration of NOx was observed to be 19.6 µg/m3 at
Devhara and 47.3 µg/m3 at Chaka respectively. The average NOx concentrations in the study
area were observed to be in the range of 29.1 µg/m3 to 33.8 µg/m3. Thus the observed
average NOx concentrations at all the locations were found to be well within the permissible
A1 A2 A3 A4 A5 A6 A7 A8
Average 9.3 10.8 10.2 9.4 10.3 10.5 9.4 9.6
Minimum 6.3 6.9 6.5 5.9 6.1 6.3 6.1 6.3
Maximum 14.5 16.4 15.2 13.4 17.6 15.3 15.4 14.5
0.0
2.0
4.0
6.0
8.0
10.0
12.0
14.0
16.0
18.0
20.0
SO2
con
cen
trat
ion
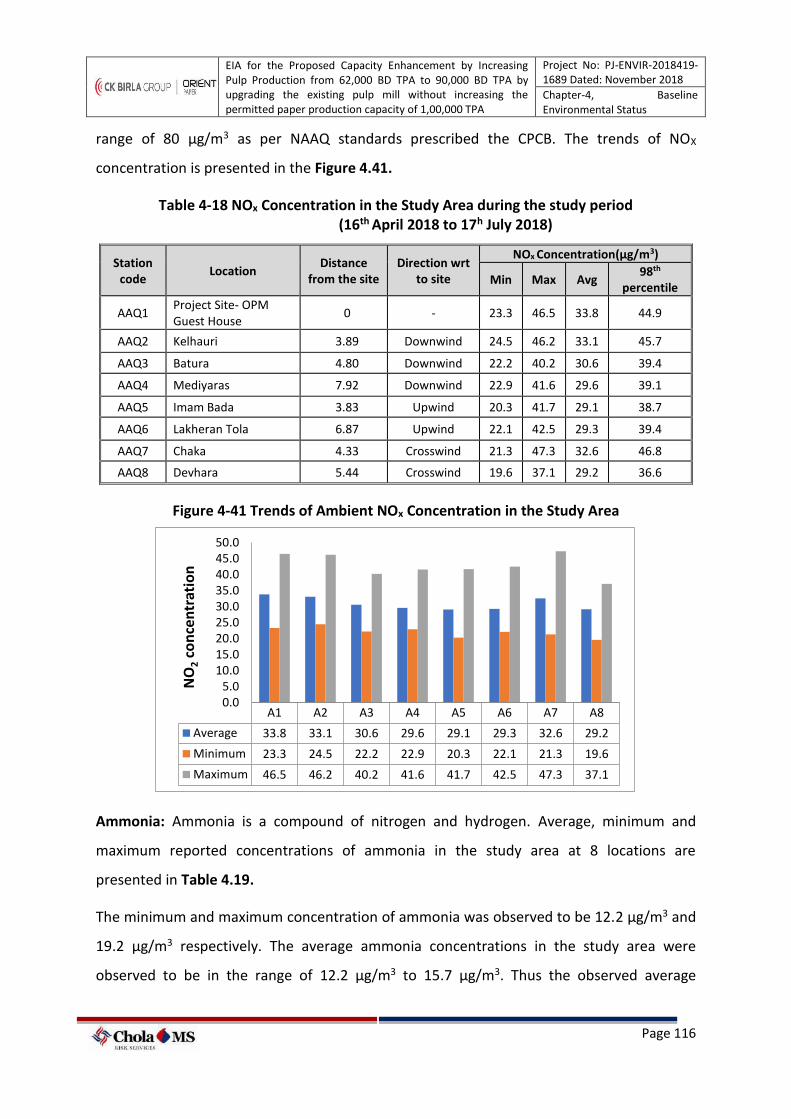
EIA for the Proposed Capacity Enhancement by Increasing Pulp Production from 62,000 BD TPA to 90,000 BD TPA by upgrading the existing pulp mill without increasing the permitted paper production capacity of 1,00,000 TPA
Project No: PJ-ENVIR-2018419-1689 Dated: November 2018
Chapter-4, Baseline Environmental Status
Page 116
range of 80 µg/m3 as per NAAQ standards prescribed the CPCB. The trends of NOX
concentration is presented in the Figure 4.41.
Table 4-18 NOx Concentration in the Study Area during the study period (16th April 2018 to 17h July 2018)
Station code
Location Distance
from the site Direction wrt
to site
NOx Concentration(µg/m3)
Min Max Avg 98th
percentile
AAQ1 Project Site- OPM Guest House
0 - 23.3 46.5 33.8 44.9
AAQ2 Kelhauri 3.89 Downwind 24.5 46.2 33.1 45.7
AAQ3 Batura 4.80 Downwind 22.2 40.2 30.6 39.4
AAQ4 Mediyaras 7.92 Downwind 22.9 41.6 29.6 39.1
AAQ5 Imam Bada 3.83 Upwind 20.3 41.7 29.1 38.7
AAQ6 Lakheran Tola 6.87 Upwind 22.1 42.5 29.3 39.4
AAQ7 Chaka 4.33 Crosswind 21.3 47.3 32.6 46.8
AAQ8 Devhara 5.44 Crosswind 19.6 37.1 29.2 36.6
Figure 4-41 Trends of Ambient NOx Concentration in the Study Area
Ammonia: Ammonia is a compound of nitrogen and hydrogen. Average, minimum and
maximum reported concentrations of ammonia in the study area at 8 locations are
presented in Table 4.19.
The minimum and maximum concentration of ammonia was observed to be 12.2 µg/m3 and
19.2 µg/m3 respectively. The average ammonia concentrations in the study area were
observed to be in the range of 12.2 µg/m3 to 15.7 µg/m3. Thus the observed average
A1 A2 A3 A4 A5 A6 A7 A8
Average 33.8 33.1 30.6 29.6 29.1 29.3 32.6 29.2
Minimum 23.3 24.5 22.2 22.9 20.3 22.1 21.3 19.6
Maximum 46.5 46.2 40.2 41.6 41.7 42.5 47.3 37.1
0.05.0
10.015.020.025.030.035.040.045.050.0
NO
2co
nce
ntr
atio
n
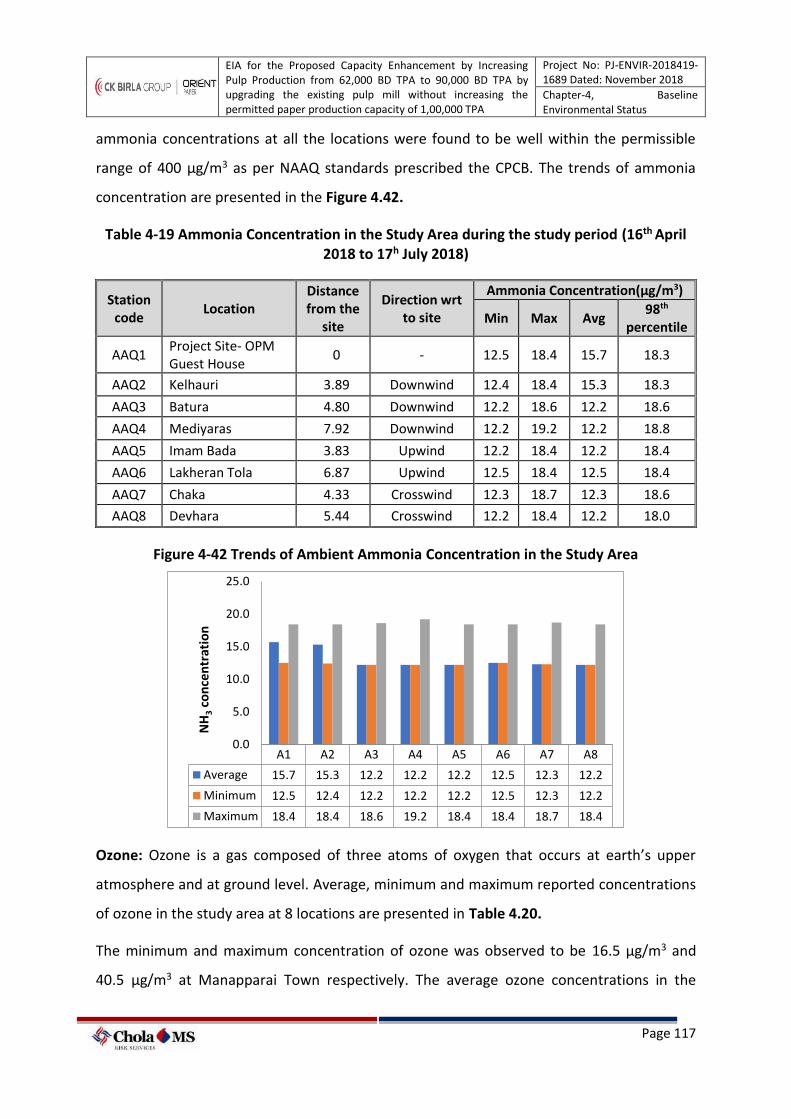
EIA for the Proposed Capacity Enhancement by Increasing Pulp Production from 62,000 BD TPA to 90,000 BD TPA by upgrading the existing pulp mill without increasing the permitted paper production capacity of 1,00,000 TPA
Project No: PJ-ENVIR-2018419-1689 Dated: November 2018
Chapter-4, Baseline Environmental Status
Page 117
ammonia concentrations at all the locations were found to be well within the permissible
range of 400 µg/m3 as per NAAQ standards prescribed the CPCB. The trends of ammonia
concentration are presented in the Figure 4.42.
Table 4-19 Ammonia Concentration in the Study Area during the study period (16th April 2018 to 17h July 2018)
Station code
Location Distance from the
site
Direction wrt to site
Ammonia Concentration(µg/m3)
Min Max Avg 98th
percentile
AAQ1 Project Site- OPM Guest House
0 - 12.5 18.4 15.7 18.3
AAQ2 Kelhauri 3.89 Downwind 12.4 18.4 15.3 18.3
AAQ3 Batura 4.80 Downwind 12.2 18.6 12.2 18.6
AAQ4 Mediyaras 7.92 Downwind 12.2 19.2 12.2 18.8
AAQ5 Imam Bada 3.83 Upwind 12.2 18.4 12.2 18.4
AAQ6 Lakheran Tola 6.87 Upwind 12.5 18.4 12.5 18.4
AAQ7 Chaka 4.33 Crosswind 12.3 18.7 12.3 18.6
AAQ8 Devhara 5.44 Crosswind 12.2 18.4 12.2 18.0
Figure 4-42 Trends of Ambient Ammonia Concentration in the Study Area
Ozone: Ozone is a gas composed of three atoms of oxygen that occurs at earth’s upper
atmosphere and at ground level. Average, minimum and maximum reported concentrations
of ozone in the study area at 8 locations are presented in Table 4.20.
The minimum and maximum concentration of ozone was observed to be 16.5 µg/m3 and
40.5 µg/m3 at Manapparai Town respectively. The average ozone concentrations in the
A1 A2 A3 A4 A5 A6 A7 A8
Average 15.7 15.3 12.2 12.2 12.2 12.5 12.3 12.2
Minimum 12.5 12.4 12.2 12.2 12.2 12.5 12.3 12.2
Maximum 18.4 18.4 18.6 19.2 18.4 18.4 18.7 18.4
0.0
5.0
10.0
15.0
20.0
25.0
NH
3co
nce
ntr
atio
n
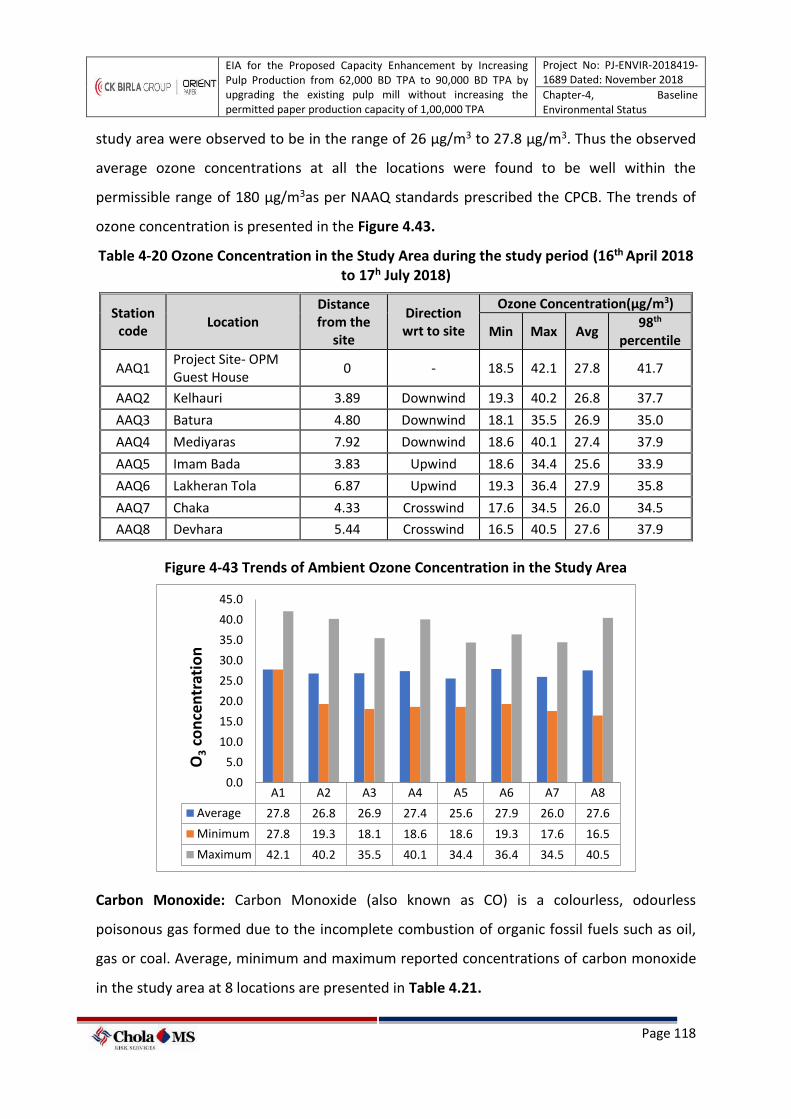
EIA for the Proposed Capacity Enhancement by Increasing Pulp Production from 62,000 BD TPA to 90,000 BD TPA by upgrading the existing pulp mill without increasing the permitted paper production capacity of 1,00,000 TPA
Project No: PJ-ENVIR-2018419-1689 Dated: November 2018
Chapter-4, Baseline Environmental Status
Page 118
study area were observed to be in the range of 26 µg/m3 to 27.8 µg/m3. Thus the observed
average ozone concentrations at all the locations were found to be well within the
permissible range of 180 µg/m3as per NAAQ standards prescribed the CPCB. The trends of
ozone concentration is presented in the Figure 4.43.
Table 4-20 Ozone Concentration in the Study Area during the study period (16th April 2018 to 17h July 2018)
Station code
Location Distance from the
site
Direction wrt to site
Ozone Concentration(µg/m3)
Min Max Avg 98th
percentile
AAQ1 Project Site- OPM Guest House
0 - 18.5 42.1 27.8 41.7
AAQ2 Kelhauri 3.89 Downwind 19.3 40.2 26.8 37.7
AAQ3 Batura 4.80 Downwind 18.1 35.5 26.9 35.0
AAQ4 Mediyaras 7.92 Downwind 18.6 40.1 27.4 37.9
AAQ5 Imam Bada 3.83 Upwind 18.6 34.4 25.6 33.9
AAQ6 Lakheran Tola 6.87 Upwind 19.3 36.4 27.9 35.8
AAQ7 Chaka 4.33 Crosswind 17.6 34.5 26.0 34.5
AAQ8 Devhara 5.44 Crosswind 16.5 40.5 27.6 37.9
Figure 4-43 Trends of Ambient Ozone Concentration in the Study Area
Carbon Monoxide: Carbon Monoxide (also known as CO) is a colourless, odourless
poisonous gas formed due to the incomplete combustion of organic fossil fuels such as oil,
gas or coal. Average, minimum and maximum reported concentrations of carbon monoxide
in the study area at 8 locations are presented in Table 4.21.
A1 A2 A3 A4 A5 A6 A7 A8
Average 27.8 26.8 26.9 27.4 25.6 27.9 26.0 27.6
Minimum 27.8 19.3 18.1 18.6 18.6 19.3 17.6 16.5
Maximum 42.1 40.2 35.5 40.1 34.4 36.4 34.5 40.5
0.0
5.0
10.0
15.0
20.0
25.0
30.0
35.0
40.0
45.0
O3
con
cen
trat
ion
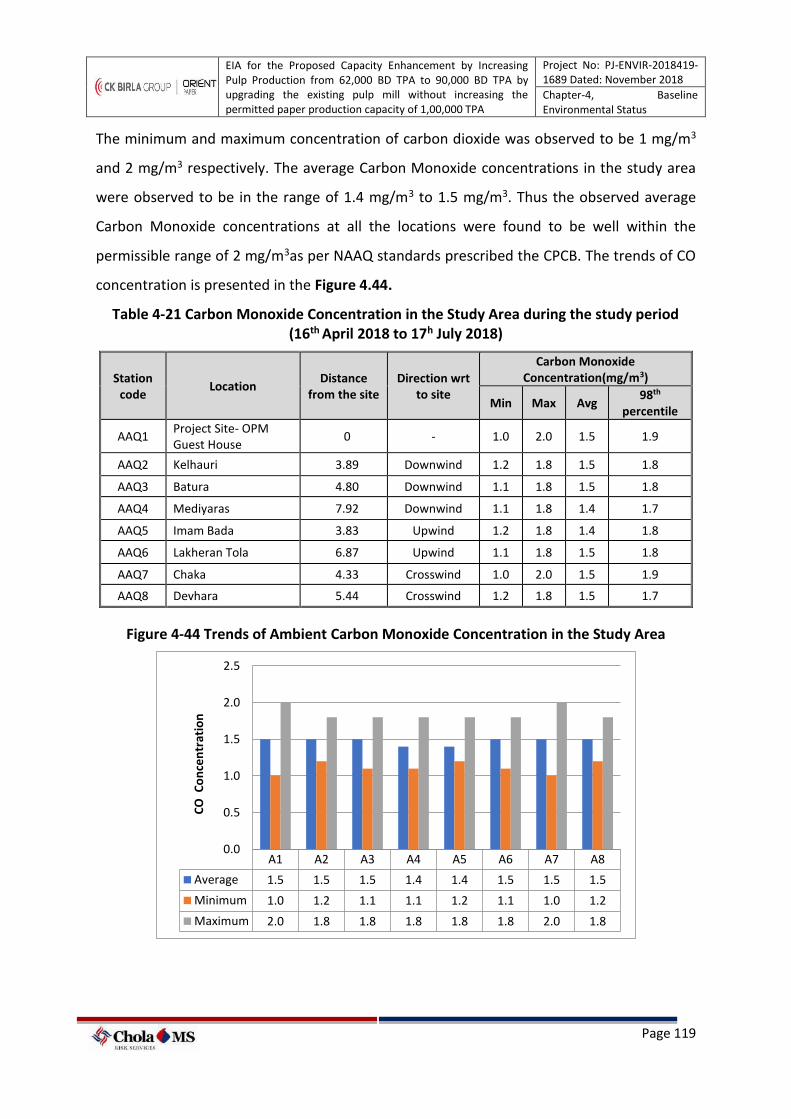
EIA for the Proposed Capacity Enhancement by Increasing Pulp Production from 62,000 BD TPA to 90,000 BD TPA by upgrading the existing pulp mill without increasing the permitted paper production capacity of 1,00,000 TPA
Project No: PJ-ENVIR-2018419-1689 Dated: November 2018
Chapter-4, Baseline Environmental Status
Page 119
The minimum and maximum concentration of carbon dioxide was observed to be 1 mg/m3
and 2 mg/m3 respectively. The average Carbon Monoxide concentrations in the study area
were observed to be in the range of 1.4 mg/m3 to 1.5 mg/m3. Thus the observed average
Carbon Monoxide concentrations at all the locations were found to be well within the
permissible range of 2 mg/m3as per NAAQ standards prescribed the CPCB. The trends of CO
concentration is presented in the Figure 4.44.
Table 4-21 Carbon Monoxide Concentration in the Study Area during the study period (16th April 2018 to 17h July 2018)
Station code
Location Distance
from the site Direction wrt
to site
Carbon Monoxide Concentration(mg/m3)
Min Max Avg 98th
percentile
AAQ1 Project Site- OPM Guest House
0 - 1.0 2.0 1.5 1.9
AAQ2 Kelhauri 3.89 Downwind 1.2 1.8 1.5 1.8
AAQ3 Batura 4.80 Downwind 1.1 1.8 1.5 1.8
AAQ4 Mediyaras 7.92 Downwind 1.1 1.8 1.4 1.7
AAQ5 Imam Bada 3.83 Upwind 1.2 1.8 1.4 1.8
AAQ6 Lakheran Tola 6.87 Upwind 1.1 1.8 1.5 1.8
AAQ7 Chaka 4.33 Crosswind 1.0 2.0 1.5 1.9
AAQ8 Devhara 5.44 Crosswind 1.2 1.8 1.5 1.7
Figure 4-44 Trends of Ambient Carbon Monoxide Concentration in the Study Area
A1 A2 A3 A4 A5 A6 A7 A8
Average 1.5 1.5 1.5 1.4 1.4 1.5 1.5 1.5
Minimum 1.0 1.2 1.1 1.1 1.2 1.1 1.0 1.2
Maximum 2.0 1.8 1.8 1.8 1.8 1.8 2.0 1.8
0.0
0.5
1.0
1.5
2.0
2.5
CO
Co
nce
ntr
atio
n
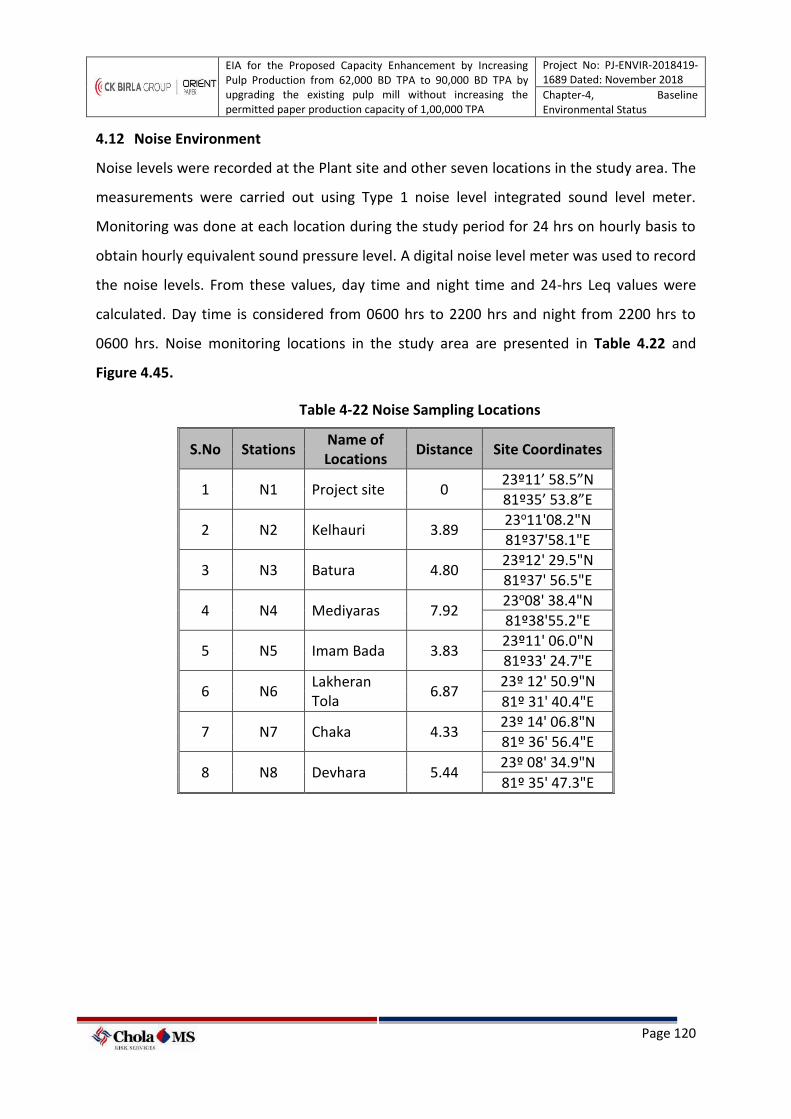
EIA for the Proposed Capacity Enhancement by Increasing Pulp Production from 62,000 BD TPA to 90,000 BD TPA by upgrading the existing pulp mill without increasing the permitted paper production capacity of 1,00,000 TPA
Project No: PJ-ENVIR-2018419-1689 Dated: November 2018
Chapter-4, Baseline Environmental Status
Page 120
4.12 Noise Environment
Noise levels were recorded at the Plant site and other seven locations in the study area. The
measurements were carried out using Type 1 noise level integrated sound level meter.
Monitoring was done at each location during the study period for 24 hrs on hourly basis to
obtain hourly equivalent sound pressure level. A digital noise level meter was used to record
the noise levels. From these values, day time and night time and 24-hrs Leq values were
calculated. Day time is considered from 0600 hrs to 2200 hrs and night from 2200 hrs to
0600 hrs. Noise monitoring locations in the study area are presented in Table 4.22 and
Figure 4.45.
Table 4-22 Noise Sampling Locations
S.No Stations Name of Locations
Distance Site Coordinates
1 N1 Project site 0 23º11’ 58.5”N
81º35’ 53.8”E
2 N2 Kelhauri 3.89 23o11'08.2"N
81º37'58.1"E
3 N3 Batura 4.80 23º12' 29.5"N
81º37' 56.5"E
4 N4 Mediyaras 7.92 23o08' 38.4"N
81º38'55.2"E
5 N5 Imam Bada 3.83 23º11' 06.0"N
81º33' 24.7"E
6 N6 Lakheran Tola
6.87 23º 12' 50.9"N
81º 31' 40.4"E
7 N7 Chaka 4.33 23º 14' 06.8"N
81º 36' 56.4"E
8 N8 Devhara 5.44 23º 08' 34.9"N
81º 35' 47.3"E
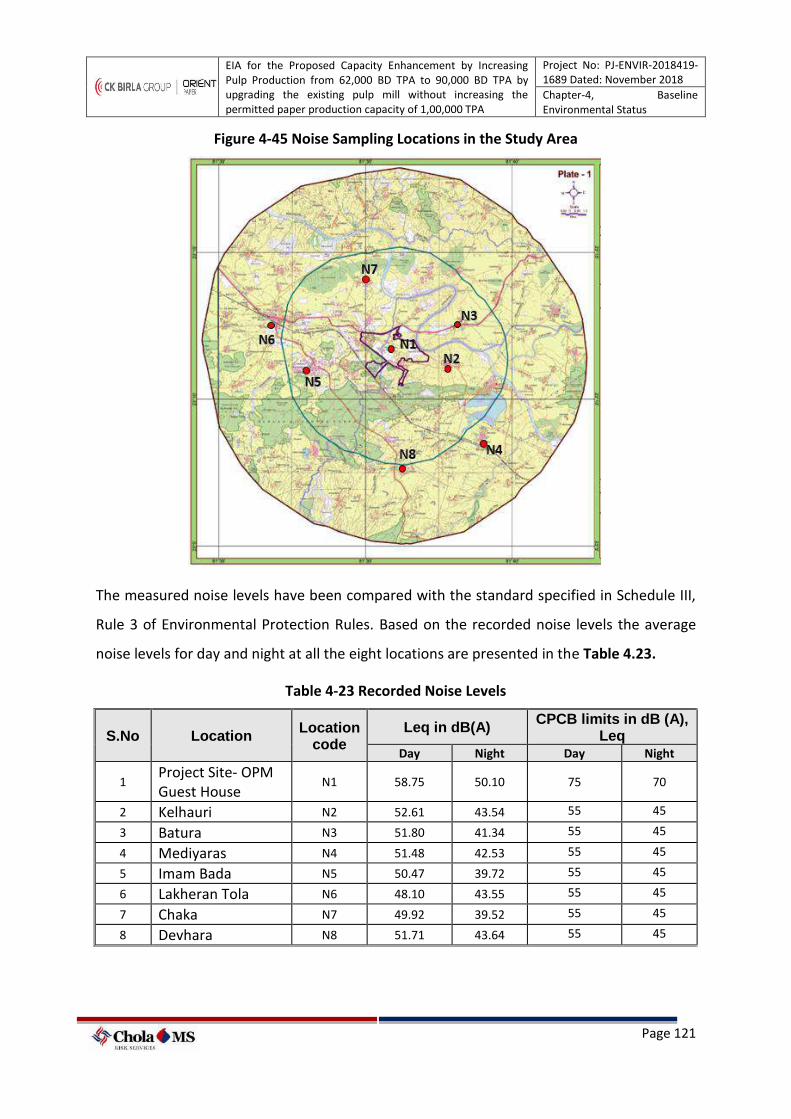
EIA for the Proposed Capacity Enhancement by Increasing Pulp Production from 62,000 BD TPA to 90,000 BD TPA by upgrading the existing pulp mill without increasing the permitted paper production capacity of 1,00,000 TPA
Project No: PJ-ENVIR-2018419-1689 Dated: November 2018
Chapter-4, Baseline Environmental Status
Page 121
Figure 4-45 Noise Sampling Locations in the Study Area
The measured noise levels have been compared with the standard specified in Schedule III,
Rule 3 of Environmental Protection Rules. Based on the recorded noise levels the average
noise levels for day and night at all the eight locations are presented in the Table 4.23.
Table 4-23 Recorded Noise Levels
S.No Location Location
code Leq in dB(A)
CPCB limits in dB (A), Leq
Day Night Day Night
1 Project Site- OPM Guest House
N1 58.75 50.10 75 70
2 Kelhauri N2 52.61 43.54 55 45
3 Batura N3 51.80 41.34 55 45
4 Mediyaras N4 51.48 42.53 55 45
5 Imam Bada N5 50.47 39.72 55 45
6 Lakheran Tola N6 48.10 43.55 55 45
7 Chaka N7 49.92 39.52 55 45
8 Devhara N8 51.71 43.64 55 45

EIA for the Proposed Capacity Enhancement by Increasing Pulp Production from 62,000 BD TPA to 90,000 BD TPA by upgrading the existing pulp mill without increasing the permitted paper production capacity of 1,00,000 TPA
Project No: PJ-ENVIR-2018419-1689 Dated: November 2018
Chapter-4, Baseline Environmental Status
Page 122
Observations: Average day time and night time noise levels at Village areas in the study
area was found to be varying from 48.10 to 52.61 dB(A) and 39.52 dB(A) to 43.64 dB(A)
respectively. At the existing plant site the average noise level was found to be 58.75 dB (A)
for day time and 50.10 dB (A) for night time. As per NAAQS w.r.t. noise prescribed by CPCB,
the day time and night time noise levels in a residential area shall not exceed 55 and 45
dB(A) Leq respectively, Industrial area shall not exceed 75 dB (A) for day time and 70 dB (A)
for night time. The observed values are complying with the standards of Residential and
Industrial area. The hourly noise level monitoring data is enclosed in Annexure-13.
4.13 Water Environment
Water resources constitute mainly surface and groundwater. The major River located near
the project is River Sone which is the second largest tributary under Ganga watershed.
Both water resources and water quality have been studied within the 10 km radius of the
Project site under this EIA study.
4.13.1 Surface Water Resources in the Study Area
River Sone is located at about 2.3 km (E) of the project site. The Sone River is an important
right bank tributary of the Ganga River. The river originates at an elevation of 600 m at
Sonbhadra in the Maikala range of hills in Madhya Pradesh. The total catchment area of the
basin is 71,259 sq. km. The important tributaries of the Sone River are Rihand, Kanhar,
Ghaghar, and Koel. The Rihand dam has been constructed on the Rihand River. The total
length of the river is 784 km, out of which about 500 km lies in Madhya Pradesh, 82 km in
Uttar Pradesh and the remaining 202 km in Bihar. The river meets the Ganga River about 16
km upstream of Dinapur in the Patna district of Bihar.
The river system is surrounded by the Vindhachal range in the North, the Punpun river
system and the Chotanagpur plateau on the East, the Baghelkhand plateau and the
Mahadeva hills on the South and the forest clad Maikal and Bhamver ranges on the West.
After meeting with river Kanhar at the boundary between Jharkhand and Madhya Pradesh,
the river Son enters into Jharkhand and gets joined by the river North Koel on its right bank.
The river, thereafter, takes a sharp North-East turn and finally joins the river Ganga.
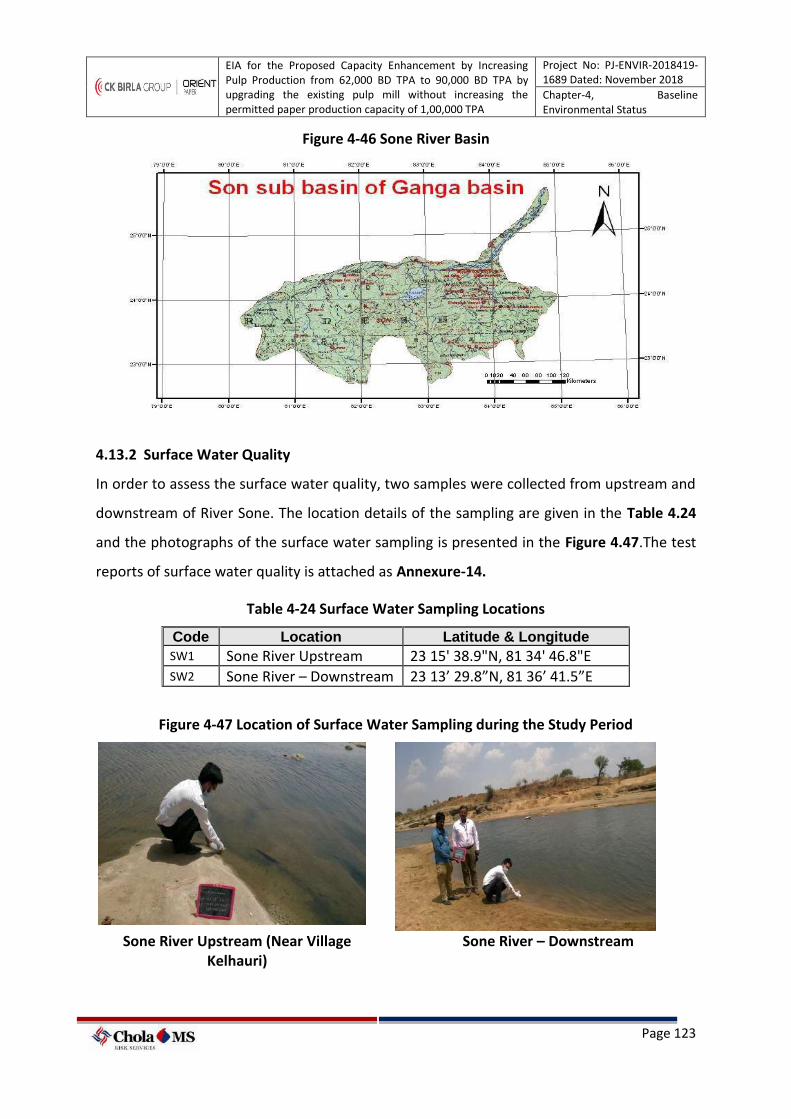
EIA for the Proposed Capacity Enhancement by Increasing Pulp Production from 62,000 BD TPA to 90,000 BD TPA by upgrading the existing pulp mill without increasing the permitted paper production capacity of 1,00,000 TPA
Project No: PJ-ENVIR-2018419-1689 Dated: November 2018
Chapter-4, Baseline Environmental Status
Page 123
Figure 4-46 Sone River Basin
4.13.2 Surface Water Quality
In order to assess the surface water quality, two samples were collected from upstream and
downstream of River Sone. The location details of the sampling are given in the Table 4.24
and the photographs of the surface water sampling is presented in the Figure 4.47.The test
reports of surface water quality is attached as Annexure-14.
Table 4-24 Surface Water Sampling Locations
Code Location Latitude & Longitude
SW1 Sone River Upstream 23 15' 38.9"N, 81 34' 46.8"E SW2 Sone River – Downstream 23 13’ 29.8”N, 81 36’ 41.5”E
Figure 4-47 Location of Surface Water Sampling during the Study Period
Sone River Upstream (Near Village
Kelhauri) Sone River – Downstream
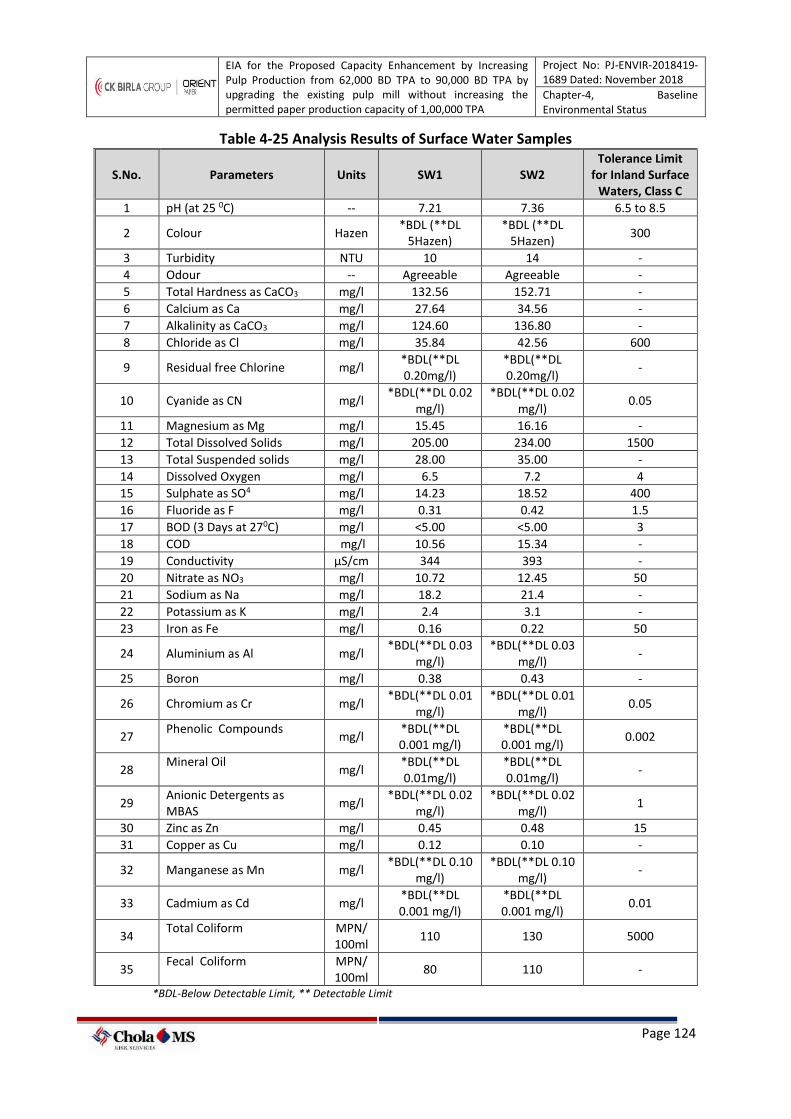
EIA for the Proposed Capacity Enhancement by Increasing Pulp Production from 62,000 BD TPA to 90,000 BD TPA by upgrading the existing pulp mill without increasing the permitted paper production capacity of 1,00,000 TPA
Project No: PJ-ENVIR-2018419-1689 Dated: November 2018
Chapter-4, Baseline Environmental Status
Page 124
Table 4-25 Analysis Results of Surface Water Samples
S.No. Parameters Units SW1 SW2 Tolerance Limit
for Inland Surface Waters, Class C
1 pH (at 25 0C) -- 7.21 7.36 6.5 to 8.5
2 Colour Hazen *BDL (**DL
5Hazen) *BDL (**DL
5Hazen) 300
3 Turbidity NTU 10 14 -
4 Odour -- Agreeable Agreeable -
5 Total Hardness as CaCO3 mg/l 132.56 152.71 -
6 Calcium as Ca mg/l 27.64 34.56 -
7 Alkalinity as CaCO3 mg/l 124.60 136.80 -
8 Chloride as Cl mg/l 35.84 42.56 600
9 Residual free Chlorine mg/l *BDL(**DL 0.20mg/l)
*BDL(**DL 0.20mg/l)
-
10 Cyanide as CN mg/l *BDL(**DL 0.02
mg/l) *BDL(**DL 0.02
mg/l) 0.05
11 Magnesium as Mg mg/l 15.45 16.16 -
12 Total Dissolved Solids mg/l 205.00 234.00 1500
13 Total Suspended solids mg/l 28.00 35.00 -
14 Dissolved Oxygen mg/l 6.5 7.2 4
15 Sulphate as SO4 mg/l 14.23 18.52 400
16 Fluoride as F mg/l 0.31 0.42 1.5
17 BOD (3 Days at 270C) mg/l <5.00 <5.00 3
18 COD mg/l 10.56 15.34 -
19 Conductivity µS/cm 344 393 -
20 Nitrate as NO3 mg/l 10.72 12.45 50
21 Sodium as Na mg/l 18.2 21.4 -
22 Potassium as K mg/l 2.4 3.1 -
23 Iron as Fe mg/l 0.16 0.22 50
24 Aluminium as Al mg/l *BDL(**DL 0.03
mg/l) *BDL(**DL 0.03
mg/l) -
25 Boron mg/l 0.38 0.43 -
26 Chromium as Cr mg/l *BDL(**DL 0.01
mg/l) *BDL(**DL 0.01
mg/l) 0.05
27 Phenolic Compounds
mg/l *BDL(**DL 0.001 mg/l)
*BDL(**DL 0.001 mg/l)
0.002
28 Mineral Oil
mg/l *BDL(**DL 0.01mg/l)
*BDL(**DL 0.01mg/l)
-
29 Anionic Detergents as MBAS
mg/l *BDL(**DL 0.02
mg/l) *BDL(**DL 0.02
mg/l) 1
30 Zinc as Zn mg/l 0.45 0.48 15
31 Copper as Cu mg/l 0.12 0.10 -
32 Manganese as Mn mg/l *BDL(**DL 0.10
mg/l) *BDL(**DL 0.10
mg/l) -
33 Cadmium as Cd mg/l *BDL(**DL 0.001 mg/l)
*BDL(**DL 0.001 mg/l)
0.01
34 Total Coliform MPN/
100ml 110 130 5000
35 Fecal Coliform MPN/
100ml 80 110 -
*BDL-Below Detectable Limit, ** Detectable Limit
EIA for the Proposed Capacity Enhancement by Increasing Pulp Production from 62,000 BD TPA to 90,000 BD TPA by upgrading the existing pulp mill without increasing the permitted paper production capacity of 1,00,000 TPA
Project No: PJ-ENVIR-2018419-1689 Dated: November 2018
Chapter-4, Baseline Environmental Status
Page 125
Observations:
As per the analysis results as shown in the Table 4.25 it can observed that pH of surface
water around the project site is in the range of 7.2 mg/l to 7.36 mg/l which is neutral. The
TDS levels in the surface water of the upstream and downstream was found to be 205 mg/L
to 234 mg/L. The Total Hardness of the surface water was found to be 132 mg/l at upstream
and 152 mg/l at downstream. The Fluoride concentration was found to be 0.31 mg/l at
upstream and 0.42 mg/l at downstream. The microbiological content as total coliform was
found to be 110 MPN/100 ml and 130 MPN/100 ml. Heavy metal concentrations are below
detectable limit however traces of copper and zinc were found.
4.13.2.1 Treated Wastewater Quality
Treated Wastewater has been analyzed for physico-chemical properties. The results of
treated wastewater are compared with MPPCB prescribed discharge standards as per the
consent to operate of the existing facility.
The analysis results indicate that the pH was found to be 7.64. The TSS, COD and BOD were
observed to be 38 mg/l, 56.20 mg/l and 18.50 mg/l respectively. All the values were
observed to be well within the prescribed discharge norms. The reports are attached as
Annexure-14.
4.13.3 Ground Water Resources6
4.13.3.1 Occurrence of Groundwater
The groundwater resources of the District are under-developed and under-utilised. 513 tube
wells and 2470 dug wells facilitate to irrigate an area of 50.98 sq.km. of agricultural land as
against 2714.12 sq.km cultivable area and 2313 sq.km of net sown area in the district. The
net groundwater availability of the district is 639.09 MCM while gross annual groundwater
draft in the district is only 43.43 MCM. The stage of ground water development of the
district is only 6%. Shahdol comes under safe category from ground water development
point of view.
6 “District at a Glance”, Shahdol District, Madhya Pradesh, Ministry of Water Resources, Central Ground Water Board, North Central Region, Bhopal, 2013.
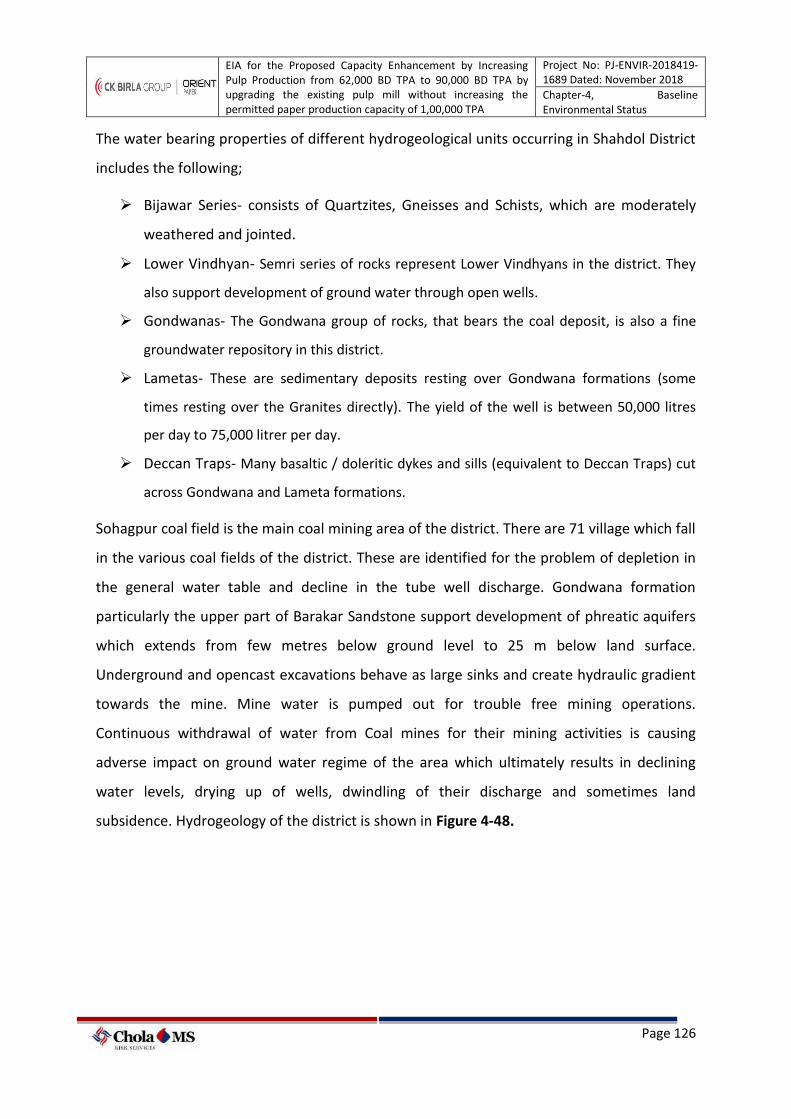
EIA for the Proposed Capacity Enhancement by Increasing Pulp Production from 62,000 BD TPA to 90,000 BD TPA by upgrading the existing pulp mill without increasing the permitted paper production capacity of 1,00,000 TPA
Project No: PJ-ENVIR-2018419-1689 Dated: November 2018
Chapter-4, Baseline Environmental Status
Page 126
The water bearing properties of different hydrogeological units occurring in Shahdol District
includes the following;
➢ Bijawar Series- consists of Quartzites, Gneisses and Schists, which are moderately
weathered and jointed.
➢ Lower Vindhyan- Semri series of rocks represent Lower Vindhyans in the district. They
also support development of ground water through open wells.
➢ Gondwanas- The Gondwana group of rocks, that bears the coal deposit, is also a fine
groundwater repository in this district.
➢ Lametas- These are sedimentary deposits resting over Gondwana formations (some
times resting over the Granites directly). The yield of the well is between 50,000 litres
per day to 75,000 litrer per day.
➢ Deccan Traps- Many basaltic / doleritic dykes and sills (equivalent to Deccan Traps) cut
across Gondwana and Lameta formations.
Sohagpur coal field is the main coal mining area of the district. There are 71 village which fall
in the various coal fields of the district. These are identified for the problem of depletion in
the general water table and decline in the tube well discharge. Gondwana formation
particularly the upper part of Barakar Sandstone support development of phreatic aquifers
which extends from few metres below ground level to 25 m below land surface.
Underground and opencast excavations behave as large sinks and create hydraulic gradient
towards the mine. Mine water is pumped out for trouble free mining operations.
Continuous withdrawal of water from Coal mines for their mining activities is causing
adverse impact on ground water regime of the area which ultimately results in declining
water levels, drying up of wells, dwindling of their discharge and sometimes land
subsidence. Hydrogeology of the district is shown in Figure 4-48.

EIA for the Proposed Capacity Enhancement by Increasing Pulp Production from 62,000 BD TPA to 90,000 BD TPA by upgrading the existing pulp mill without increasing the permitted paper production capacity of 1,00,000 TPA
Project No: PJ-ENVIR-2018419-1689 Dated: November 2018
Chapter-4, Baseline Environmental Status
Page 127
Figure 4-48 Hydrogeology of Shahdol District
Source: CGWB District Profile, Shahdol, Madhya Pradesh
4.13.3.2 Groundwater Levels in Shahdol District
Ground water levels form a very important parameter of the ground water system.
Pre-Monsoon Depth to Water Level- In general depth to water level in the area ranges from
3.03 to 13.75 m below ground level. Depth to water level between 8to 12 m bgl. is occurring in
northern &western part of the district. Depth to water level >12 m. bgl. is recorded in isolated
patches in north-western part of the district.
Post-Monsoon Depth to water level- In general, during post-monsoon period, depth of water
levels in the district ranges between 1.66 and 17.86 m below ground level. Depth to water level
between 5 to 10m bgl. is observed in northern & south- westrern part of the district. Depth to
water level between 10-15 m. bgl. is recorded in isolated patches in north-eastern& southern
part of the district.
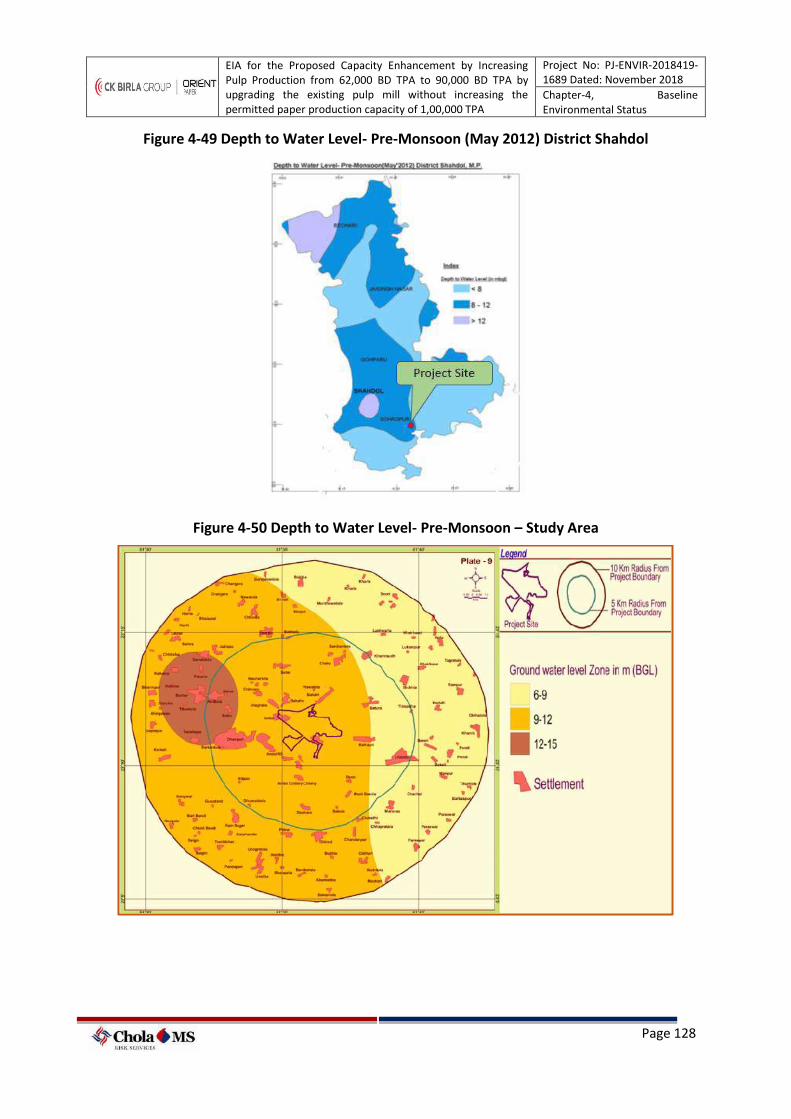
EIA for the Proposed Capacity Enhancement by Increasing Pulp Production from 62,000 BD TPA to 90,000 BD TPA by upgrading the existing pulp mill without increasing the permitted paper production capacity of 1,00,000 TPA
Project No: PJ-ENVIR-2018419-1689 Dated: November 2018
Chapter-4, Baseline Environmental Status
Page 128
Figure 4-49 Depth to Water Level- Pre-Monsoon (May 2012) District Shahdol
Figure 4-50 Depth to Water Level- Pre-Monsoon – Study Area
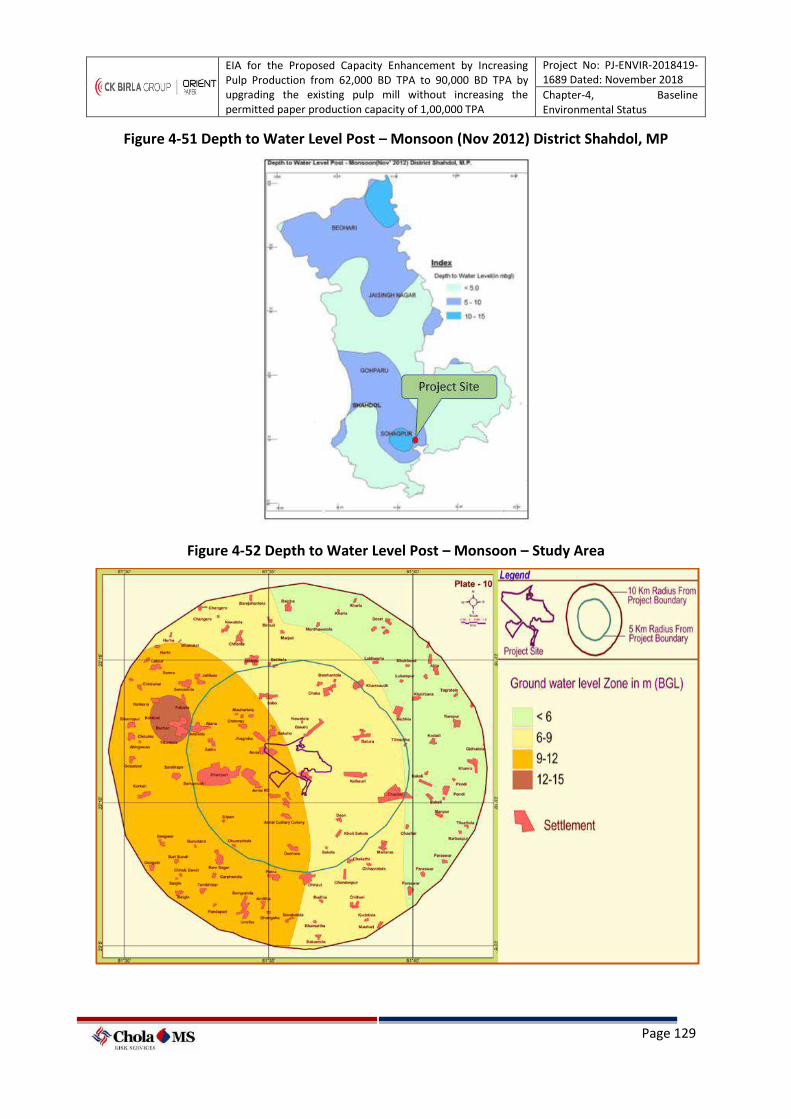
EIA for the Proposed Capacity Enhancement by Increasing Pulp Production from 62,000 BD TPA to 90,000 BD TPA by upgrading the existing pulp mill without increasing the permitted paper production capacity of 1,00,000 TPA
Project No: PJ-ENVIR-2018419-1689 Dated: November 2018
Chapter-4, Baseline Environmental Status
Page 129
Figure 4-51 Depth to Water Level Post – Monsoon (Nov 2012) District Shahdol, MP
Figure 4-52 Depth to Water Level Post – Monsoon – Study Area
EIA for the Proposed Capacity Enhancement by Increasing Pulp Production from 62,000 BD TPA to 90,000 BD TPA by upgrading the existing pulp mill without increasing the permitted paper production capacity of 1,00,000 TPA
Project No: PJ-ENVIR-2018419-1689 Dated: November 2018
Chapter-4, Baseline Environmental Status
Page 130
4.13.3.3 Ground Water Availability and Use Pattern of the Sohagpur Block
The proposed Project site falls under Sohagpur Block according to ground water
management survey by CGWB. Stage of groundwater development of Sohagpur block as per
CGWB is given below in Table 4.26.
Table 4-26 Stage of Groundwater Development of Sohagpur Block, Shahdol District, Madhya Pradesh
Block
Net Ground water
Availability in ham
Existing Gross
Draft for Irriga-tion in Ham
Existing Gross
Draft for Domestic
and industrial
water supply in
ham
Existing Gross
Draft for all uses in ham
Allocation for
Domestic and
Industrial Requirement supply up to next 25 years
(till 2029) in ham
Net ground water
availability for future Irrigation Develop-ment in
ham
Stage of Ground water
Development in
ham
Sohagpur 8038 377 529 906 895 6766 11
Source: District Ground water Brochure, Shahdol District, Madhya Pradesh, CGWB, SECR, Chennai, 2008
4.13.3.4 Groundwater Table and Yield in the Study Area
Ground water level data for a monitoring well collected from CGWB located in Deohara
observation well indicates that the deepest water level is 13.0 m bgl during May 2016 and
shallowest water level is 2.0 m bgl during August 2012. The season wise ground water level
data collected for Deohara monitoring well is given in below.
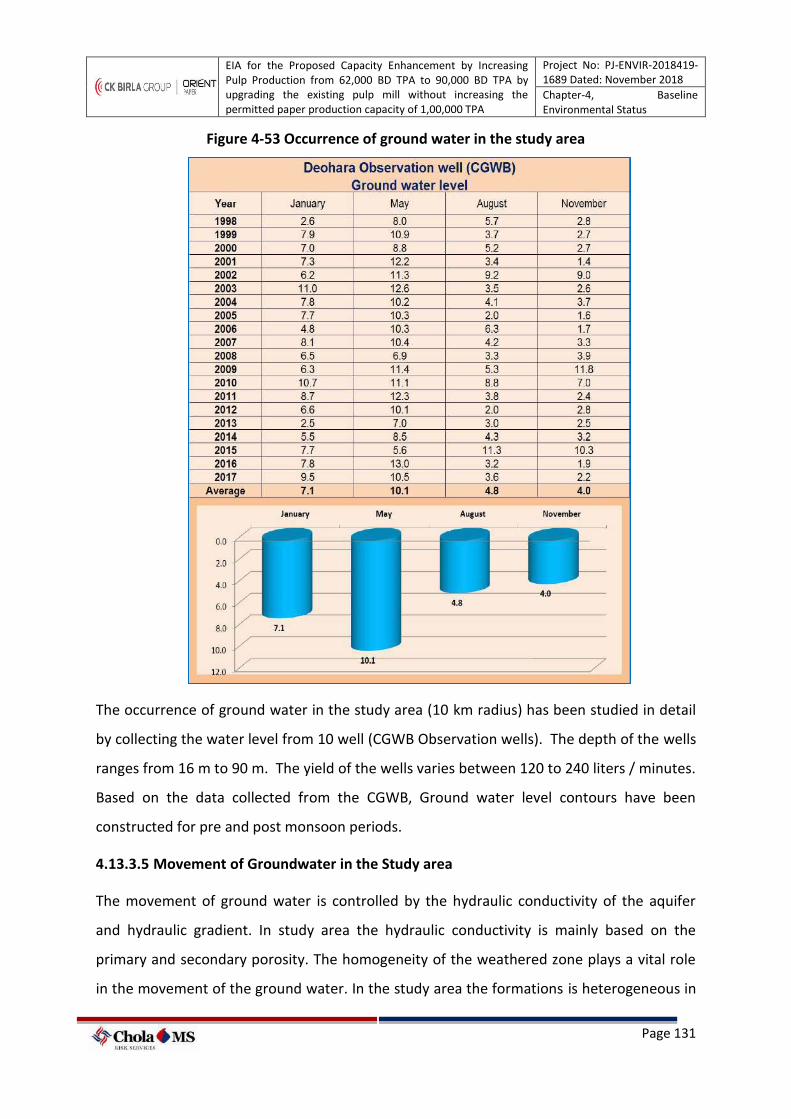
EIA for the Proposed Capacity Enhancement by Increasing Pulp Production from 62,000 BD TPA to 90,000 BD TPA by upgrading the existing pulp mill without increasing the permitted paper production capacity of 1,00,000 TPA
Project No: PJ-ENVIR-2018419-1689 Dated: November 2018
Chapter-4, Baseline Environmental Status
Page 131
Figure 4-53 Occurrence of ground water in the study area
The occurrence of ground water in the study area (10 km radius) has been studied in detail
by collecting the water level from 10 well (CGWB Observation wells). The depth of the wells
ranges from 16 m to 90 m. The yield of the wells varies between 120 to 240 liters / minutes.
Based on the data collected from the CGWB, Ground water level contours have been
constructed for pre and post monsoon periods.
4.13.3.5 Movement of Groundwater in the Study area
The movement of ground water is controlled by the hydraulic conductivity of the aquifer
and hydraulic gradient. In study area the hydraulic conductivity is mainly based on the
primary and secondary porosity. The homogeneity of the weathered zone plays a vital role
in the movement of the ground water. In the study area the formations is heterogeneous in
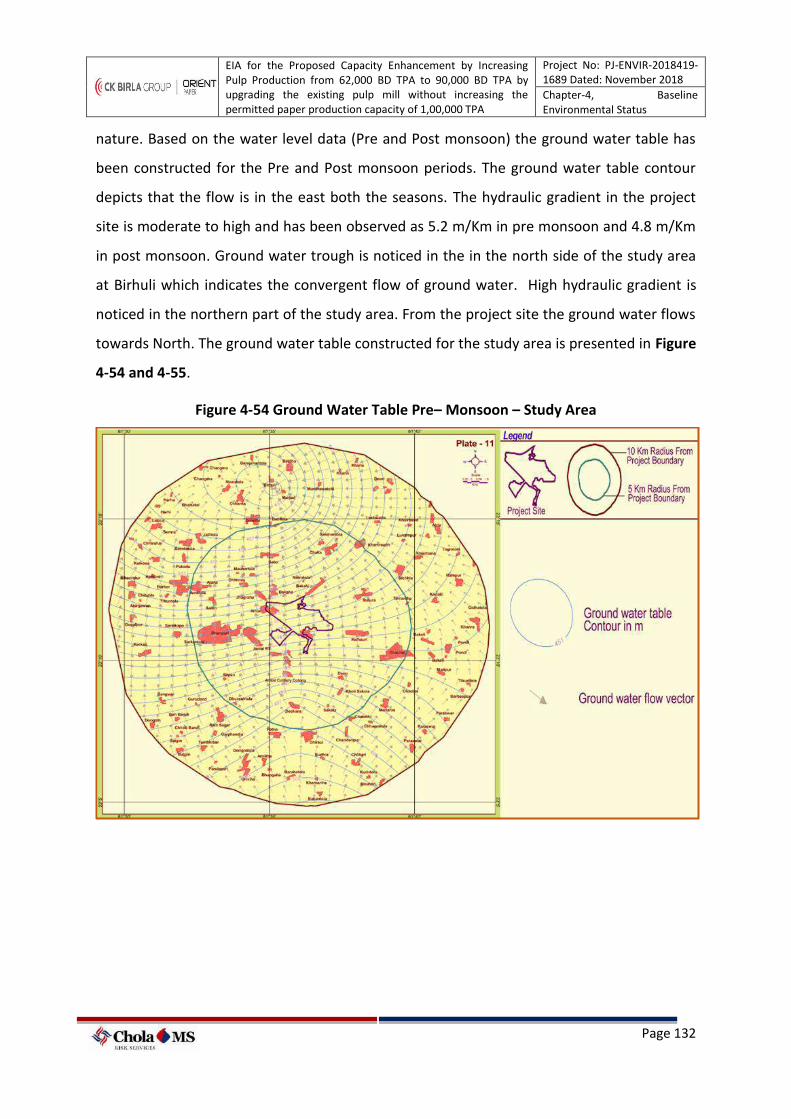
EIA for the Proposed Capacity Enhancement by Increasing Pulp Production from 62,000 BD TPA to 90,000 BD TPA by upgrading the existing pulp mill without increasing the permitted paper production capacity of 1,00,000 TPA
Project No: PJ-ENVIR-2018419-1689 Dated: November 2018
Chapter-4, Baseline Environmental Status
Page 132
nature. Based on the water level data (Pre and Post monsoon) the ground water table has
been constructed for the Pre and Post monsoon periods. The ground water table contour
depicts that the flow is in the east both the seasons. The hydraulic gradient in the project
site is moderate to high and has been observed as 5.2 m/Km in pre monsoon and 4.8 m/Km
in post monsoon. Ground water trough is noticed in the in the north side of the study area
at Birhuli which indicates the convergent flow of ground water. High hydraulic gradient is
noticed in the northern part of the study area. From the project site the ground water flows
towards North. The ground water table constructed for the study area is presented in Figure
4-54 and 4-55.
Figure 4-54 Ground Water Table Pre– Monsoon – Study Area
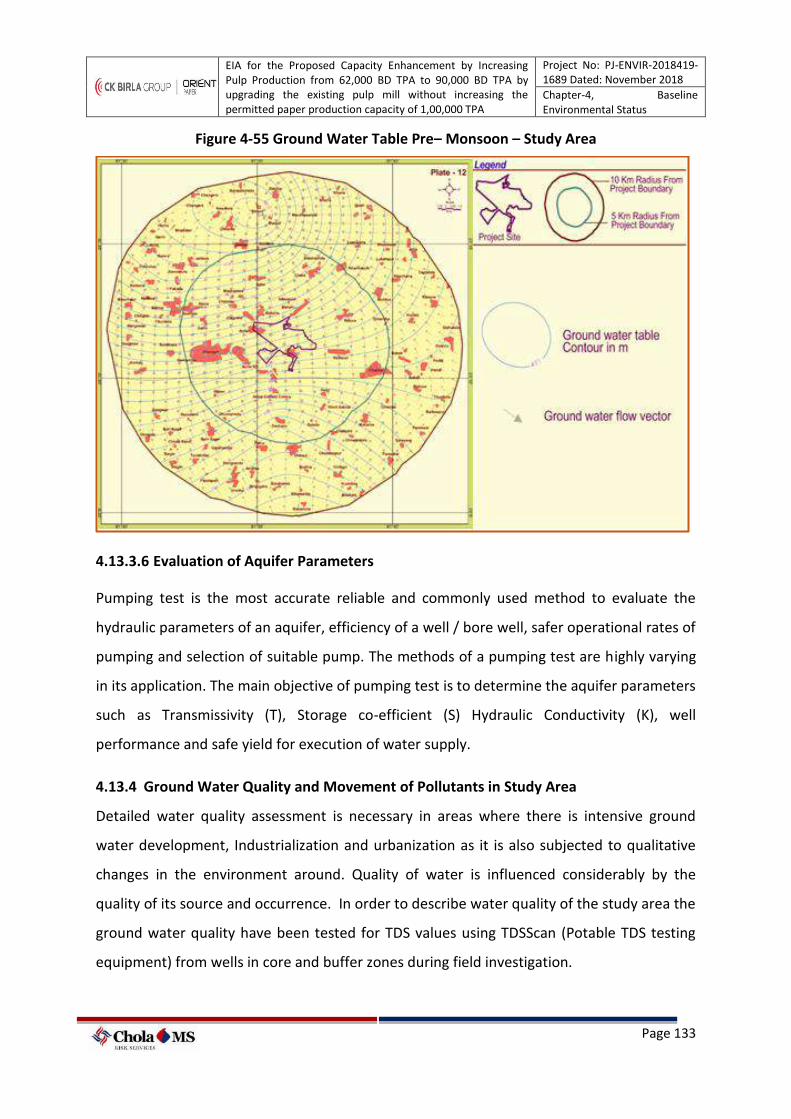
EIA for the Proposed Capacity Enhancement by Increasing Pulp Production from 62,000 BD TPA to 90,000 BD TPA by upgrading the existing pulp mill without increasing the permitted paper production capacity of 1,00,000 TPA
Project No: PJ-ENVIR-2018419-1689 Dated: November 2018
Chapter-4, Baseline Environmental Status
Page 133
Figure 4-55 Ground Water Table Pre– Monsoon – Study Area
4.13.3.6 Evaluation of Aquifer Parameters
Pumping test is the most accurate reliable and commonly used method to evaluate the
hydraulic parameters of an aquifer, efficiency of a well / bore well, safer operational rates of
pumping and selection of suitable pump. The methods of a pumping test are highly varying
in its application. The main objective of pumping test is to determine the aquifer parameters
such as Transmissivity (T), Storage co-efficient (S) Hydraulic Conductivity (K), well
performance and safe yield for execution of water supply.
4.13.4 Ground Water Quality and Movement of Pollutants in Study Area
Detailed water quality assessment is necessary in areas where there is intensive ground
water development, Industrialization and urbanization as it is also subjected to qualitative
changes in the environment around. Quality of water is influenced considerably by the
quality of its source and occurrence. In order to describe water quality of the study area the
ground water quality have been tested for TDS values using TDSScan (Potable TDS testing
equipment) from wells in core and buffer zones during field investigation.
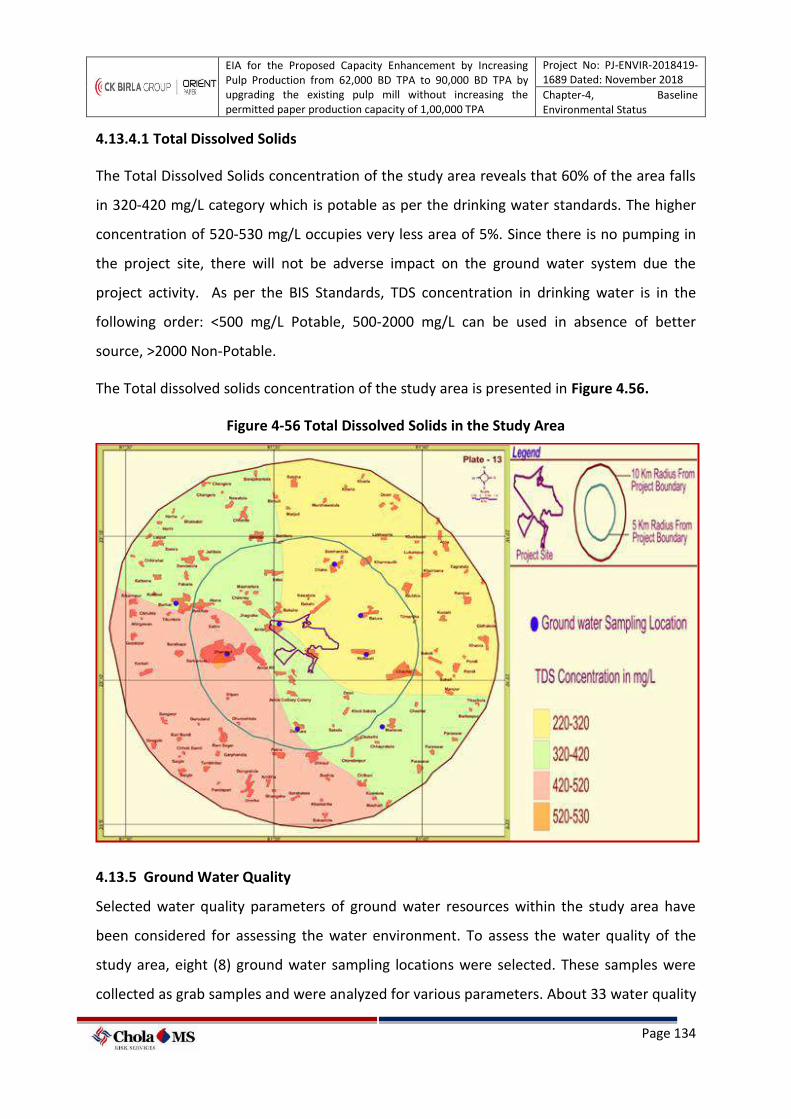
EIA for the Proposed Capacity Enhancement by Increasing Pulp Production from 62,000 BD TPA to 90,000 BD TPA by upgrading the existing pulp mill without increasing the permitted paper production capacity of 1,00,000 TPA
Project No: PJ-ENVIR-2018419-1689 Dated: November 2018
Chapter-4, Baseline Environmental Status
Page 134
4.13.4.1 Total Dissolved Solids
The Total Dissolved Solids concentration of the study area reveals that 60% of the area falls
in 320-420 mg/L category which is potable as per the drinking water standards. The higher
concentration of 520-530 mg/L occupies very less area of 5%. Since there is no pumping in
the project site, there will not be adverse impact on the ground water system due the
project activity. As per the BIS Standards, TDS concentration in drinking water is in the
following order: <500 mg/L Potable, 500-2000 mg/L can be used in absence of better
source, >2000 Non-Potable.
The Total dissolved solids concentration of the study area is presented in Figure 4.56.
Figure 4-56 Total Dissolved Solids in the Study Area
4.13.5 Ground Water Quality
Selected water quality parameters of ground water resources within the study area have
been considered for assessing the water environment. To assess the water quality of the
study area, eight (8) ground water sampling locations were selected. These samples were
collected as grab samples and were analyzed for various parameters. About 33 water quality
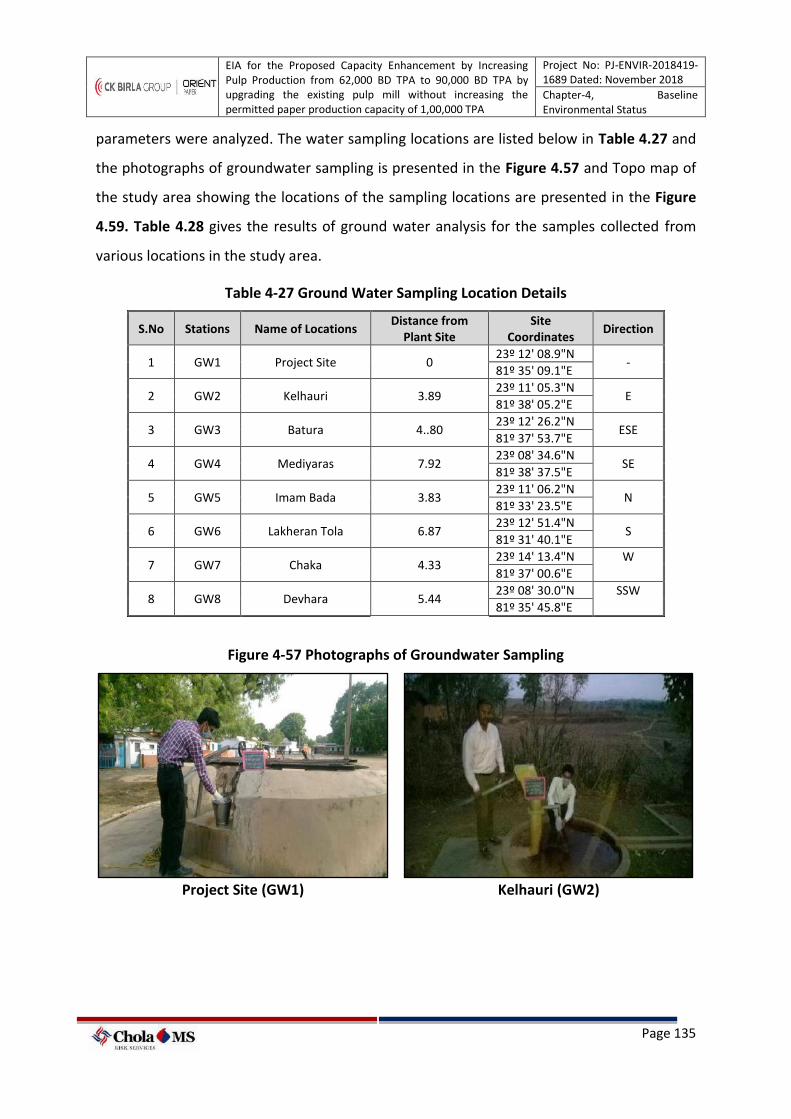
EIA for the Proposed Capacity Enhancement by Increasing Pulp Production from 62,000 BD TPA to 90,000 BD TPA by upgrading the existing pulp mill without increasing the permitted paper production capacity of 1,00,000 TPA
Project No: PJ-ENVIR-2018419-1689 Dated: November 2018
Chapter-4, Baseline Environmental Status
Page 135
parameters were analyzed. The water sampling locations are listed below in Table 4.27 and
the photographs of groundwater sampling is presented in the Figure 4.57 and Topo map of
the study area showing the locations of the sampling locations are presented in the Figure
4.59. Table 4.28 gives the results of ground water analysis for the samples collected from
various locations in the study area.
Table 4-27 Ground Water Sampling Location Details
S.No Stations Name of Locations Distance from
Plant Site Site
Coordinates Direction
1 GW1 Project Site 0 23º 12' 08.9"N
- 81º 35' 09.1"E
2 GW2 Kelhauri 3.89 23º 11' 05.3"N
E 81º 38' 05.2"E
3 GW3 Batura 4..80 23º 12' 26.2"N
ESE 81º 37' 53.7"E
4 GW4 Mediyaras 7.92 23º 08' 34.6"N
SE 81º 38' 37.5"E
5 GW5 Imam Bada 3.83 23º 11' 06.2"N
N 81º 33' 23.5"E
6 GW6 Lakheran Tola 6.87 23º 12' 51.4"N
S 81º 31' 40.1"E
7 GW7 Chaka 4.33 23º 14' 13.4"N W
81º 37' 00.6"E
8 GW8 Devhara 5.44 23º 08' 30.0"N SSW
81º 35' 45.8"E
Figure 4-57 Photographs of Groundwater Sampling
Project Site (GW1) Kelhauri (GW2)
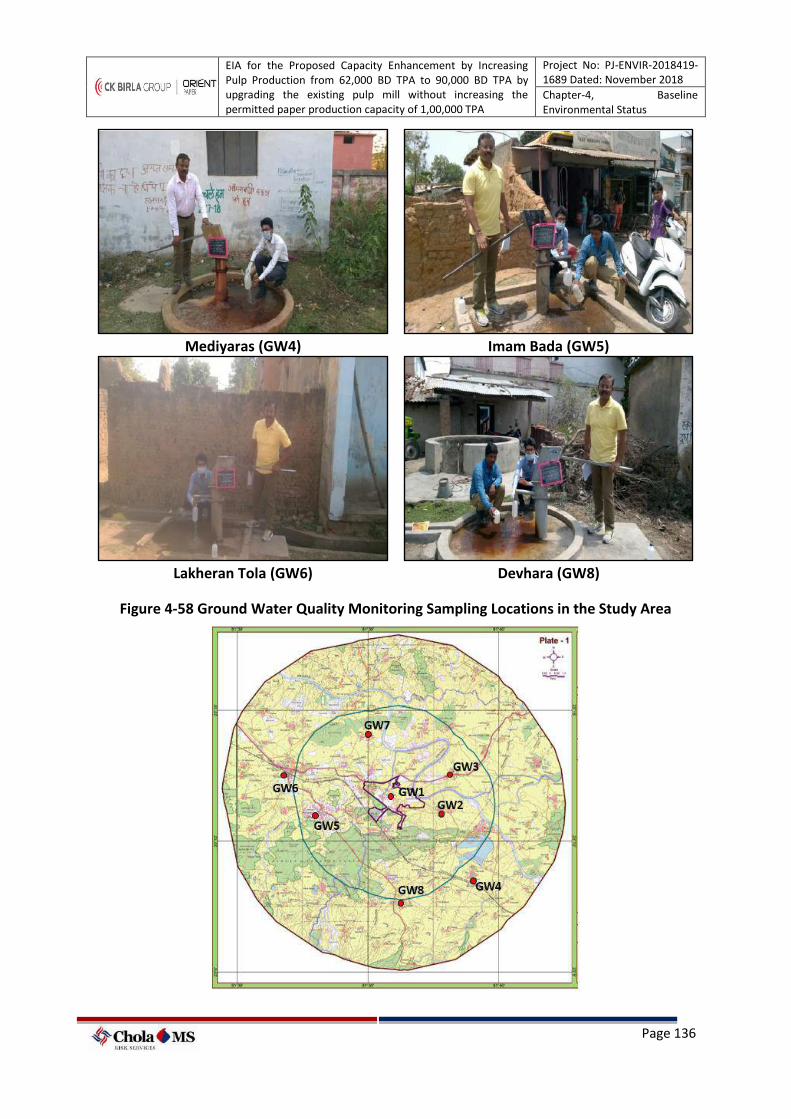
EIA for the Proposed Capacity Enhancement by Increasing Pulp Production from 62,000 BD TPA to 90,000 BD TPA by upgrading the existing pulp mill without increasing the permitted paper production capacity of 1,00,000 TPA
Project No: PJ-ENVIR-2018419-1689 Dated: November 2018
Chapter-4, Baseline Environmental Status
Page 136
Mediyaras (GW4) Imam Bada (GW5)
Lakheran Tola (GW6) Devhara (GW8)
Figure 4-58 Ground Water Quality Monitoring Sampling Locations in the Study Area
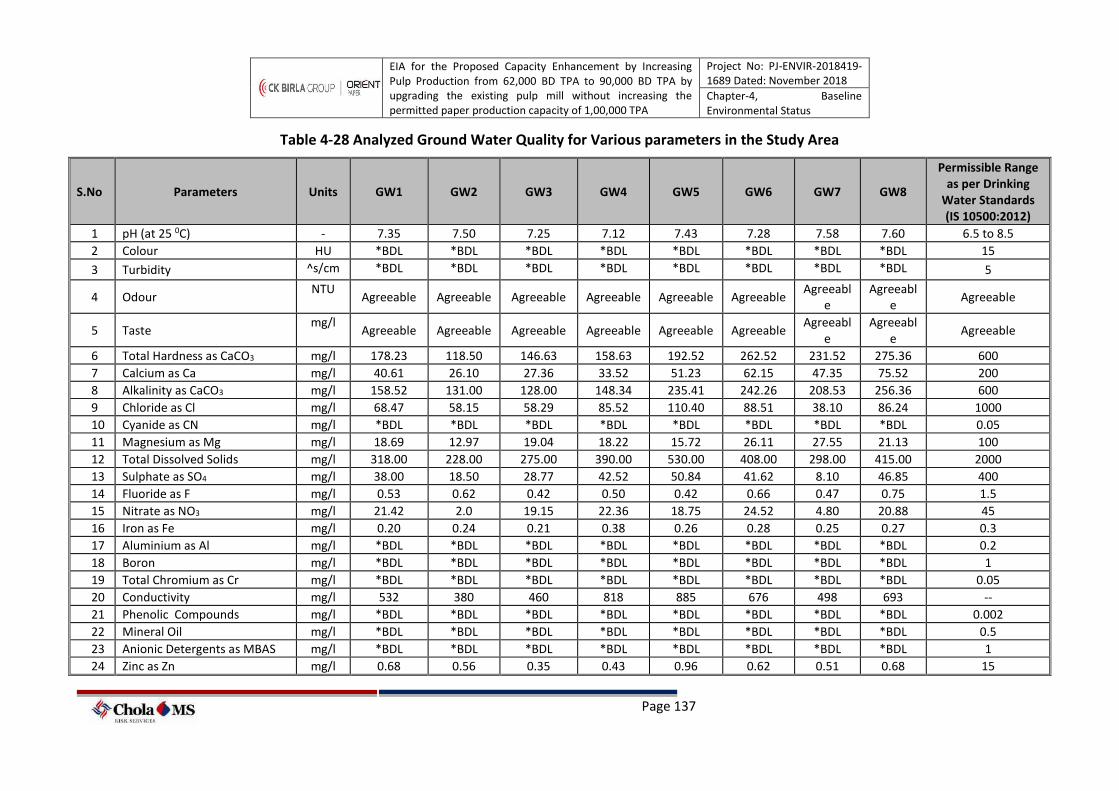
EIA for the Proposed Capacity Enhancement by Increasing Pulp Production from 62,000 BD TPA to 90,000 BD TPA by upgrading the existing pulp mill without increasing the permitted paper production capacity of 1,00,000 TPA
Project No: PJ-ENVIR-2018419-1689 Dated: November 2018
Chapter-4, Baseline Environmental Status
Page 137
Table 4-28 Analyzed Ground Water Quality for Various parameters in the Study Area
S.No Parameters Units GW1 GW2 GW3 GW4 GW5 GW6 GW7 GW8
Permissible Range as per Drinking
Water Standards (IS 10500:2012)
1 pH (at 25 0C) - 7.35 7.50 7.25 7.12 7.43 7.28 7.58 7.60 6.5 to 8.5
2 Colour HU *BDL *BDL *BDL *BDL *BDL *BDL *BDL *BDL 15
3 Turbidity ^s/cm *BDL *BDL *BDL *BDL *BDL *BDL *BDL *BDL 5
4 Odour NTU
Agreeable Agreeable Agreeable Agreeable Agreeable Agreeable Agreeabl
e Agreeabl
e Agreeable
5 Taste mg/l
Agreeable Agreeable Agreeable Agreeable Agreeable Agreeable Agreeabl
e Agreeabl
e Agreeable
6 Total Hardness as CaCO3 mg/l 178.23 118.50 146.63 158.63 192.52 262.52 231.52 275.36 600
7 Calcium as Ca mg/l 40.61 26.10 27.36 33.52 51.23 62.15 47.35 75.52 200
8 Alkalinity as CaCO3 mg/l 158.52 131.00 128.00 148.34 235.41 242.26 208.53 256.36 600
9 Chloride as Cl mg/l 68.47 58.15 58.29 85.52 110.40 88.51 38.10 86.24 1000
10 Cyanide as CN mg/l *BDL *BDL *BDL *BDL *BDL *BDL *BDL *BDL 0.05
11 Magnesium as Mg mg/l 18.69 12.97 19.04 18.22 15.72 26.11 27.55 21.13 100
12 Total Dissolved Solids mg/l 318.00 228.00 275.00 390.00 530.00 408.00 298.00 415.00 2000
13 Sulphate as SO4 mg/l 38.00 18.50 28.77 42.52 50.84 41.62 8.10 46.85 400
14 Fluoride as F mg/l 0.53 0.62 0.42 0.50 0.42 0.66 0.47 0.75 1.5
15 Nitrate as NO3 mg/l 21.42 2.0 19.15 22.36 18.75 24.52 4.80 20.88 45
16 Iron as Fe mg/l 0.20 0.24 0.21 0.38 0.26 0.28 0.25 0.27 0.3
17 Aluminium as Al mg/l *BDL *BDL *BDL *BDL *BDL *BDL *BDL *BDL 0.2
18 Boron mg/l *BDL *BDL *BDL *BDL *BDL *BDL *BDL *BDL 1
19 Total Chromium as Cr mg/l *BDL *BDL *BDL *BDL *BDL *BDL *BDL *BDL 0.05
20 Conductivity mg/l 532 380 460 818 885 676 498 693 --
21 Phenolic Compounds mg/l *BDL *BDL *BDL *BDL *BDL *BDL *BDL *BDL 0.002
22 Mineral Oil mg/l *BDL *BDL *BDL *BDL *BDL *BDL *BDL *BDL 0.5
23 Anionic Detergents as MBAS mg/l *BDL *BDL *BDL *BDL *BDL *BDL *BDL *BDL 1
24 Zinc as Zn mg/l 0.68 0.56 0.35 0.43 0.96 0.62 0.51 0.68 15
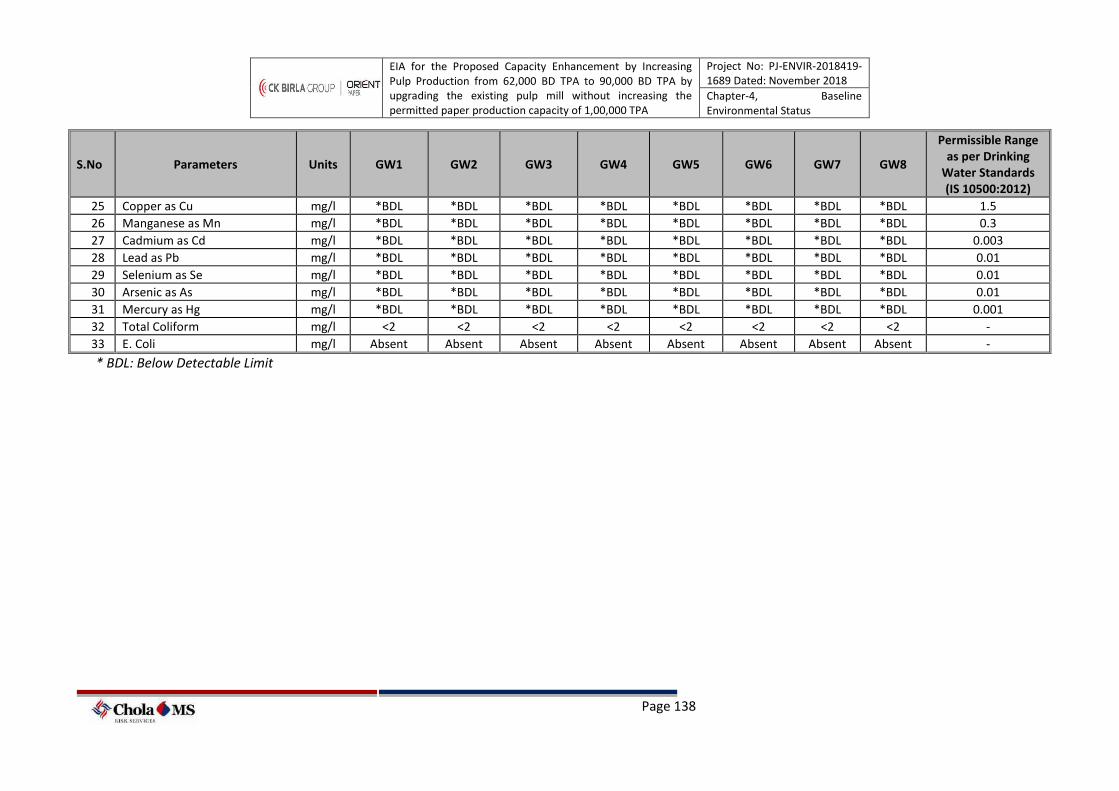
EIA for the Proposed Capacity Enhancement by Increasing Pulp Production from 62,000 BD TPA to 90,000 BD TPA by upgrading the existing pulp mill without increasing the permitted paper production capacity of 1,00,000 TPA
Project No: PJ-ENVIR-2018419-1689 Dated: November 2018
Chapter-4, Baseline Environmental Status
Page 138
S.No Parameters Units GW1 GW2 GW3 GW4 GW5 GW6 GW7 GW8
Permissible Range as per Drinking
Water Standards (IS 10500:2012)
25 Copper as Cu mg/l *BDL *BDL *BDL *BDL *BDL *BDL *BDL *BDL 1.5
26 Manganese as Mn mg/l *BDL *BDL *BDL *BDL *BDL *BDL *BDL *BDL 0.3
27 Cadmium as Cd mg/l *BDL *BDL *BDL *BDL *BDL *BDL *BDL *BDL 0.003
28 Lead as Pb mg/l *BDL *BDL *BDL *BDL *BDL *BDL *BDL *BDL 0.01
29 Selenium as Se mg/l *BDL *BDL *BDL *BDL *BDL *BDL *BDL *BDL 0.01
30 Arsenic as As mg/l *BDL *BDL *BDL *BDL *BDL *BDL *BDL *BDL 0.01
31 Mercury as Hg mg/l *BDL *BDL *BDL *BDL *BDL *BDL *BDL *BDL 0.001
32 Total Coliform mg/l <2 <2 <2 <2 <2 <2 <2 <2 -
33 E. Coli mg/l Absent Absent Absent Absent Absent Absent Absent Absent -
* BDL: Below Detectable Limit
EIA for the Proposed Capacity Enhancement by Increasing Pulp Production from 62,000 BD TPA to 90,000 BD TPA by upgrading the existing pulp mill without increasing the permitted paper production capacity of 1,00,000 TPA
Project No: PJ-ENVIR-2018419-1689 Dated: November 2018
Chapter-4, Baseline Environmental Status
Page 139
Observations: The pH of the ground water at eight locations varied from 7.12 to 7.60
indicating that the water is alkaline and within the permissible range of 6.5 to 8.5 as per the
drinking water standards (Indian Standards, IS 10500:2012). The Total Dissolved Solids (TDS)
was found to vary from 228 mg/L to 530 mg/L. The hardness value was found to vary from
118 mg/L to 275 mg/L. Calcium and Magnesium values were found to vary from 26.10 mg/L
to 75.52 mg/L and 12.97 mg/L to 27.55 mg/L. All the parameters were found to be well
within the permissible range of drinking water standards (Indian Standards, IS 10500:2012)
and heavy metals were observed to be below detectable limit and the analysis report is
enclosed as Annexure14.
4.14 Ecological Environment
Ecology is the study of relationships between living organisms, including humans, and their
physical environment; it seeks to understand the vital connections between plants and
animals and the world around them. Ecology also provides information about the benefits of
ecosystems and how we can use Earth's resources in ways that leave the environment
healthy for future generations. Living things are organized in to natural communities with
mutual dependencies among their members, and they show various responses and
sensitivities to the outside influences.
Ecological evaluation aims at developing and applying methodologies to assess the
relevance of an area for nature conservation. As such, it is to support the assessment of the
impact of a proposed development by providing guidance on how to describe the ecological
features within the area affected, how to value them, and how to predict the value losses
caused by the development. However, limited efforts have been made in the last decade to
improve the frameworks for ecological evaluation and to adapt them specifically to the
evolving procedure of EIA. As a result, the assessment of the ecological component within
EISs (Environment Impact Statements) tends to be flawed, and to provide conclusions
poorly supported by evidences and by clear rationales.
The weakness of the analysis of ecological impacts, such as the loss and the fragmentation
of natural ecosystems, limits the influence of these issues on the decision-making process.
Ecological consequences are bound to play a minor role in the authorization of a
development because their relevance is not sufficiently stressed and justified in the EIS. This
EIA for the Proposed Capacity Enhancement by Increasing Pulp Production from 62,000 BD TPA to 90,000 BD TPA by upgrading the existing pulp mill without increasing the permitted paper production capacity of 1,00,000 TPA
Project No: PJ-ENVIR-2018419-1689 Dated: November 2018
Chapter-4, Baseline Environmental Status
Page 140
is particularly evident for developments affecting urban or man dominated landscapes, i.e.,
areas usually devoid of features with a striking ecological significance. The lack of a
framework to support a sound ecological evaluation causes such areas to be simply
overlooked, opening the way to uncontrolled impacting activities.
The challenge for ecological research is to improve the guidance provided to impact
analyses so as to encourage good practice within EISs, and to eventually strengthen the
consideration of ecological issues in the decision-making concerning new projects. To this
end, the application of ecological evaluation to EIA has been chosen as the subject of this
research. The evaluation of the ecological significance of an area can be undertaken from
different perspectives, and consequently with different objectives. One of such perspectives
focuses on the conservation of the biological diversity, or biodiversity. This has recently
emerged as a key environmental issue to be accounted for in land-use planning:
“Biodiversity is now a major driving force behind efforts to reform land management and
development practices worldwide and to establish a more harmonious relationship between
people and nature”. Projects represent artificial elements that cut through the landscape
and interfere with the natural habitat conditions. This in turn influences the abundance and
distribution of plant and animal species, i.e., the biodiversity of the areas impacted.
4.14.1 Necessity of the Ecology Management Plan
Monitoring the influence of anthropogenic activities on flagship species is an important part
of conserving biodiversity, because the information gained is crucial for the development
and adaptation of conservation management plans. Ecological monitoring provides
feedback about the actual environmental impacts of a project. Monitoring results help judge
the success of mitigation measures in protecting the environment. They are also used to
ensure compliance with environmental standards, and to facilitate any needed project
design or operational changes.
Regulatory bodies worldwide are increasingly recognizing the fact that human activities are
causing environmental and ecological damage. To effectively deal with this environmental
crisis, it is important to understand its dimensions and dynamics. What specifically are the
damages, how are they changing over time, and the best means of prevention or mitigation.
To develop precise ecology management plan, longer-term programs of monitoring and
EIA for the Proposed Capacity Enhancement by Increasing Pulp Production from 62,000 BD TPA to 90,000 BD TPA by upgrading the existing pulp mill without increasing the permitted paper production capacity of 1,00,000 TPA
Project No: PJ-ENVIR-2018419-1689 Dated: November 2018
Chapter-4, Baseline Environmental Status
Page 141
research must be designed and implemented. Such programs are capable of detecting
environmental and ecological change over large areas, and of developing an understanding
of the causes and consequences of those changes.
4.14.2 Objectives of Ecological Monitoring
➢ To evaluate the prevailing ecological status of the habitats adjacent to the existing
plant
➢ To evaluate positive impacts of greenbelt developed by OPM
➢ To assess the impact of proposed expansion on flora, avifauna and mammals
➢ To ascertain the migratory routes of fauna, presence of breeding grounds and
sensitive habitats in the study area, if any;
➢ To recommend suitable environment management plan to minimize any adverse
impact on adjacent area due to the proposed developments.
➢ To understand the ecology of the water bodies;
➢ To assess the presence of protected areas in the study area;
➢ Impact prediction based on primary and secondary data sources to formulate
mitigation measures.
4.14.3 Location and Geographical Area
The project location falls within the limit of Shahdol District.
From Geographical point of view, the District consists of a series of mountain ranges and
rivers. It can be divided in to three geographical divisions. 1. High lands of mountain ranges.
2. The Central plateau. 3. Low lands of rivers: - A number of rivers Including Sone, Johila,
Narmada, Tipan, Bakan, Chandas and Kewai flow in the district, Maikal mountain range is
extended from southern part of the district to the eastern part.
4.14.4 Topography
The district’s topography consists of a series of rivers and mountain ranges. The whole
region can be divided into three geographical divisions. These are the highlands of mountain
ranges, the lowlands of the rivers and the central plateau. The first division is primarily
governed by the Maikal mountain range which extends from the southern part of the
district to the eastern part. The rivers on the other hand are represented by the Narmada
EIA for the Proposed Capacity Enhancement by Increasing Pulp Production from 62,000 BD TPA to 90,000 BD TPA by upgrading the existing pulp mill without increasing the permitted paper production capacity of 1,00,000 TPA
Project No: PJ-ENVIR-2018419-1689 Dated: November 2018
Chapter-4, Baseline Environmental Status
Page 142
River, Sone and Johilla, which all originate from the Maikal hills. A third of the district is
composed of dense forests, and is generally regarded as a hilly area. Climate-wise, Shahdol
has a marked temperate climate, with the monsoon season lasting from June to October.
The temperature ranges from a maximum of 46 degrees to 2.6 degrees Celsius.
4.14.5 Forest Blocks in Study Area
The forests represent peninsular Sal region mostly dry deciduous type of forest, mixed
deciduous vegetation structure. The composition of forest block mainly consist of trees
species such as Shorea robusta, Buchnania lanzan, Madhuca indica, Caria arborea,
Terminalia chebula, Diospyros melanoxylon. There are three reserved forests in the study
area Burhar, Maikal, Mauhari reserve forest belongs to Anuppur forest range of Anuppur
subdivision.
4.14.6 General Ecology of the Study Area
According to Champion and Seth (1968), four types of forests are present in the study area
viz; I) Moist Peninsular High Level Sal (I/3C/C 2e) and Moist Peninsular Low Level Sal
(I/3C/C 2e) II) West Gangetic Moist Mixed Deciduous Forests (I/3C/C 3a) III) Riparian
Fringe Forests (I/4E/RS1). IV) Southern Dry Mixed Deciduous Forests (II/5A/C 3) and
Northern Dry Mixed Deciduous Forests (II/5B/C 3) V) Dry peninsular Sal (II/5B/C 1C). As per
forest composition given in the working plan, 29.96% area consists of open forest, 25.23%
dense mixed forest, 8.67% are blanks and 5.08% are encroachments. Teak and bamboo
plantation is 3.52% due to adequate rainfall coupled with the restricted runoff thus there is
no acute shortage of water. The area falls in the catchment of various perennial rivers such
as Son and Bakan. Along with this there are small reservoirs and nallahs such as Chachai
nallah, Suthana nallah and Ram sagar reservoir which have water in pools even during
summer.
The most dominant species is Sal and Teak. Sal forests of Madhya Pradesh are ecologically
very important as they mark the termination of the great Sal zone of the Central Indian
Peninsula. Sal forests are located in the eastern part of the state while teak forests are
localized in the western part. In between, there is a transition belt of mixed miscellaneous
forests. There are also areas where Teak and Sal both species occur naturally mixed
EIA for the Proposed Capacity Enhancement by Increasing Pulp Production from 62,000 BD TPA to 90,000 BD TPA by upgrading the existing pulp mill without increasing the permitted paper production capacity of 1,00,000 TPA
Project No: PJ-ENVIR-2018419-1689 Dated: November 2018
Chapter-4, Baseline Environmental Status
Page 143
together forming unique ecosystem. Sal forests occupy an area of 7244 km², which is about
7.6% of the total forest area of the state.
The maximum forest cover in the state is that of mixed forests, which includes Teak
(Tectona grandis), Sal (Shorea robusta) mixed with other species like saja (Terminalia
tomentosa), lendia (Lagerstroemia parviflora), haldu (Adina cardifolia), dhaora (Anogeissus
latifolia), aonla (Emblica officinalis), amaltas (Cassia fistula) and gamhar (Gmelina
arborea) etc. The ground is covered with maze of grasses, shrubs, bushes, lianas,
climbers and saplings.
4.14.7 Survey Methodology
4.14.7.1 Flora Survey
All accessible sites will be identified within the study area of 10km such that the ecosystems
and land-use types are represented accordingly. The prediction of impacts on flora and
fauna depends on understanding of the proposed project activities, its magnitude/extent,
scale and ecological conditions in the surrounding area. Collection of rapid baseline
information on flora and fauna is therefore a prerequisite for assessment of impacts of the
development activities. All the accessible and identified sites will be divided into four zones
with respect to their distance from the project site: Zone I - sites which fall in the project site
i.e. core zone, Zone II mention the boundary of core zone to 5KM and Zone III indicate 5 KM
to 10KM. All the three Zones of lands would be mapped for their biological diversity.
Diversity assessment for different plant species and the analysis of Rare –Endemic –
Endangered and Threatened flora was carried out. At each site, a study of floral diversity
was carried out in the following manner. A quadrant of approximately 20 m x 20 m was
marked. The species of trees, shrubs and large climbers, as well as the number of individuals
of each species, falling within this area were noted. A quadrant of approximately 5 m x 5 m
was marked within this larger quadrate. The species of herbs, both grasses and forbs, and
the number of individuals of each species, falling within this area were noted. Smaller
quadrate of 1m x 1 m for the more prolifically-growing larger herbs, and 10 cm x 10 cm, for
prolifically-growing minute herbs, were employed when required. During the survey, a
random observation based on the topo map and also Google map is made for village side,
road side, hillocks (RFs) and near the agriculture. The sampling points are selected to gather
EIA for the Proposed Capacity Enhancement by Increasing Pulp Production from 62,000 BD TPA to 90,000 BD TPA by upgrading the existing pulp mill without increasing the permitted paper production capacity of 1,00,000 TPA
Project No: PJ-ENVIR-2018419-1689 Dated: November 2018
Chapter-4, Baseline Environmental Status
Page 144
maximum primary information. General Interviews were made with the local people about
the native animals and medicinal plants that are used frequently. A thorough review is
made about each sampling point and spent about 10 to 20 minutes at each sampling point
and documented the flora and fauna in the prescribed formats.
Pre-site Work Plan
Details of the project was collected from the EIA coordinator before starting the field
trip and discussed the probable impact on the local flora and fauna though the present
activity and the extension of the project. Secondary data collected from published papers
(see references) on Flora and fauna components of the study area. A thorough revision on
ecological and biodiversity aspects of the region was also gathered through web sites.
Published working plan data containing the list of flora and fauna, area specific
details, related to road, rail network, drainage pattern, contour, forest type, forest cover,
land use and land cover of the proposed capacity of expansion unit area are collected
Equipment / Instruments deployed:
o Quadrates/Measuring Tape
o Measuring tapes
o Maps
o GPS
o Camera
o Binocular and
o Plankton net
4.14.7.2 Faunal Assessment
A detailed study has been carried out to cross check the list taken from secondary source
and local villagers. In case of vertebrate species, no sampling could be done. Depending on
as and when sighted, the species will be recorded if found within the delimited project and
buffer areas, the animal species are listed on secondary data and circumstances evidence
besides direct observations. These techniques are accepted in EIA studies as per the EIA
Notification of 2006. Observations made on direct and indirect evidences for mammalian,
avifauna and reptilian fauna within the study area. Analyses of Scheduled species identify
Habitat/microhabitat diversity in the project site and surrounding areas within 10Km range
from the site. Flora and fauna studies were carried out during 16th July – 18th July 2018 to
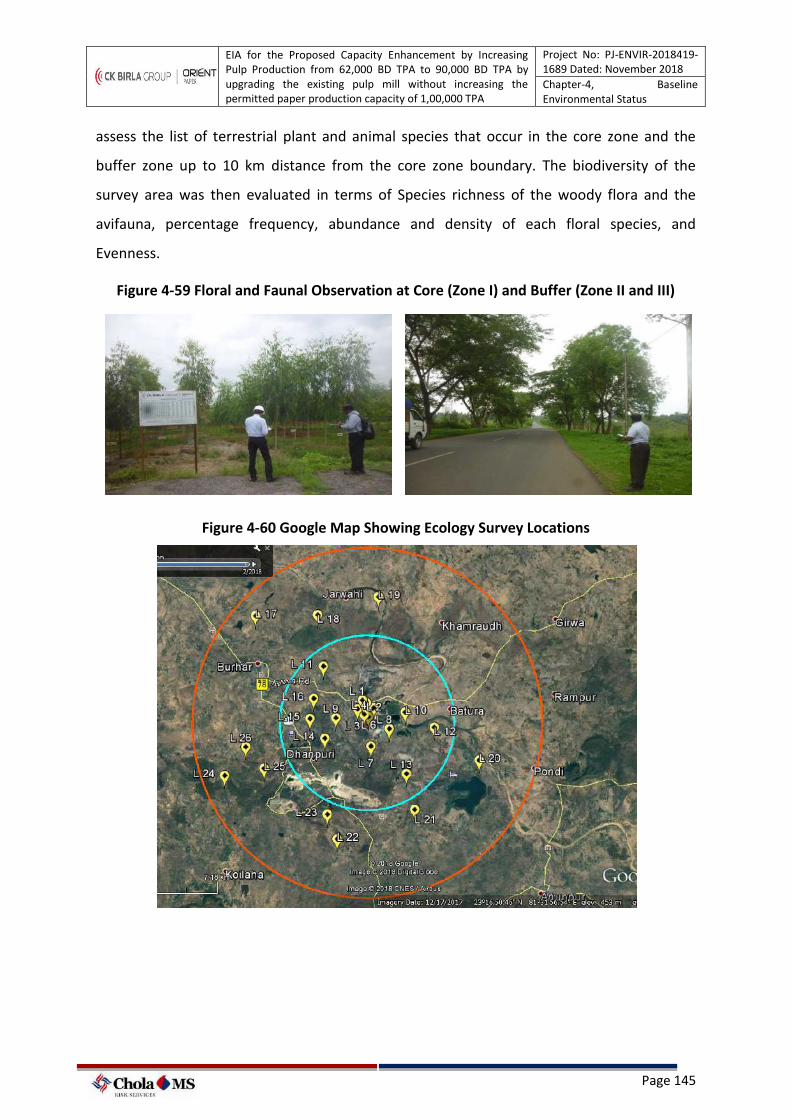
EIA for the Proposed Capacity Enhancement by Increasing Pulp Production from 62,000 BD TPA to 90,000 BD TPA by upgrading the existing pulp mill without increasing the permitted paper production capacity of 1,00,000 TPA
Project No: PJ-ENVIR-2018419-1689 Dated: November 2018
Chapter-4, Baseline Environmental Status
Page 145
assess the list of terrestrial plant and animal species that occur in the core zone and the
buffer zone up to 10 km distance from the core zone boundary. The biodiversity of the
survey area was then evaluated in terms of Species richness of the woody flora and the
avifauna, percentage frequency, abundance and density of each floral species, and
Evenness.
Figure 4-59 Floral and Faunal Observation at Core (Zone I) and Buffer (Zone II and III)
Figure 4-60 Google Map Showing Ecology Survey Locations
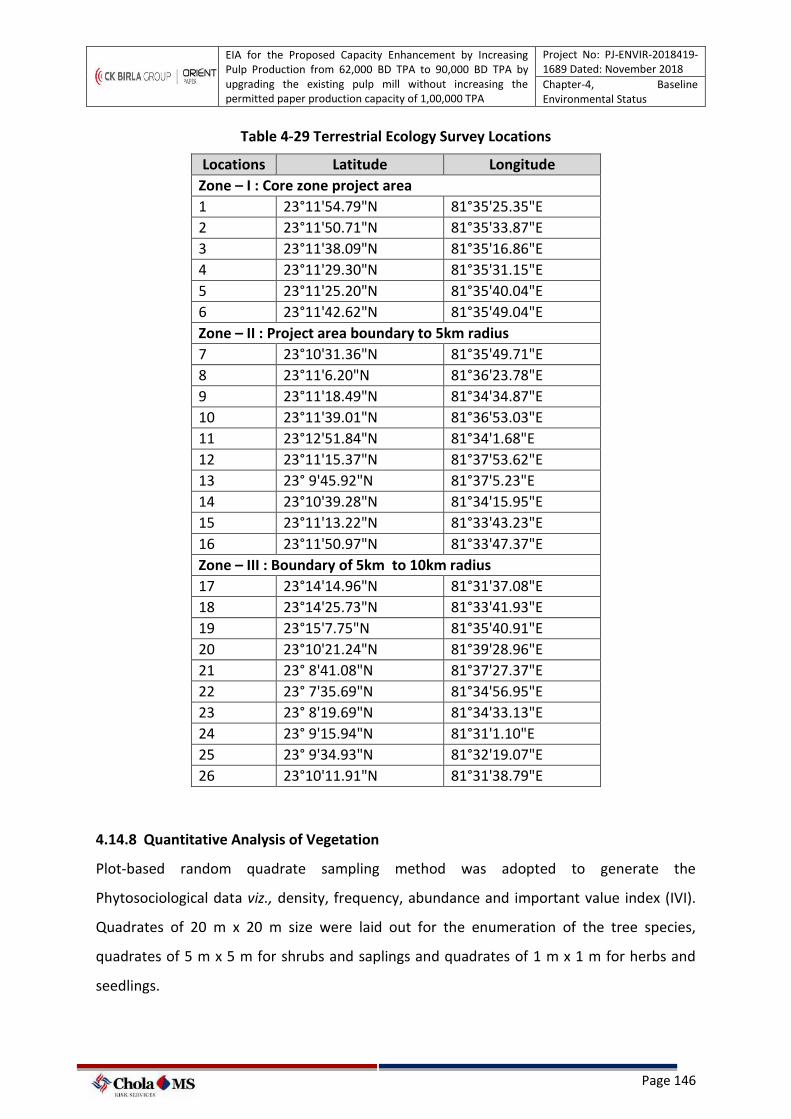
EIA for the Proposed Capacity Enhancement by Increasing Pulp Production from 62,000 BD TPA to 90,000 BD TPA by upgrading the existing pulp mill without increasing the permitted paper production capacity of 1,00,000 TPA
Project No: PJ-ENVIR-2018419-1689 Dated: November 2018
Chapter-4, Baseline Environmental Status
Page 146
Table 4-29 Terrestrial Ecology Survey Locations
Locations
Latitude Longitude
Zone – I : Core zone project area
1 23°11'54.79"N 81°35'25.35"E
2 23°11'50.71"N 81°35'33.87"E
3 23°11'38.09"N 81°35'16.86"E
4 23°11'29.30"N 81°35'31.15"E
5 23°11'25.20"N 81°35'40.04"E
6 23°11'42.62"N 81°35'49.04"E
Zone – II : Project area boundary to 5km radius
7 23°10'31.36"N 81°35'49.71"E
8 23°11'6.20"N 81°36'23.78"E
9 23°11'18.49"N 81°34'34.87"E
10 23°11'39.01"N 81°36'53.03"E
11 23°12'51.84"N 81°34'1.68"E
12 23°11'15.37"N 81°37'53.62"E
13 23° 9'45.92"N 81°37'5.23"E
14 23°10'39.28"N 81°34'15.95"E
15 23°11'13.22"N 81°33'43.23"E
16 23°11'50.97"N 81°33'47.37"E
Zone – III : Boundary of 5km to 10km radius
17 23°14'14.96"N 81°31'37.08"E
18 23°14'25.73"N 81°33'41.93"E
19 23°15'7.75"N 81°35'40.91"E
20 23°10'21.24"N 81°39'28.96"E
21 23° 8'41.08"N 81°37'27.37"E
22 23° 7'35.69"N 81°34'56.95"E
23 23° 8'19.69"N 81°34'33.13"E
24 23° 9'15.94"N 81°31'1.10"E
25 23° 9'34.93"N 81°32'19.07"E
26 23°10'11.91"N 81°31'38.79"E
4.14.8 Quantitative Analysis of Vegetation
Plot-based random quadrate sampling method was adopted to generate the
Phytosociological data viz., density, frequency, abundance and important value index (IVI).
Quadrates of 20 m x 20 m size were laid out for the enumeration of the tree species,
quadrates of 5 m x 5 m for shrubs and saplings and quadrates of 1 m x 1 m for herbs and
seedlings.
EIA for the Proposed Capacity Enhancement by Increasing Pulp Production from 62,000 BD TPA to 90,000 BD TPA by upgrading the existing pulp mill without increasing the permitted paper production capacity of 1,00,000 TPA
Project No: PJ-ENVIR-2018419-1689 Dated: November 2018
Chapter-4, Baseline Environmental Status
Page 147
Diameter at breast height (DBH) of 130 cm was consistently used during the present study.
In no case, the thicker part near branching position was considered. Instead diameter of the
tree having a branch at about 130 cm was measured either below 30 cm from the branch or
in case of all the stems above 30 cm from the branch and averaged.
All individuals above 10 cm of girth at breast height (GBH) were considered as trees and all
individuals below 10 cm of GBH or 2 m of height as shrubs and saplings. In each unit,
presence or absence of the species, number of individuals of each species, GBH (only for
tree species) to estimate basal area of the tree species were recorded.
Other ecological parameters viz., abundance, density, frequency, IVI, Shannon-Wiener
diversity index, Simpson’s dominance index, Abundance/Frequency (A/F) ratio for
distribution pattern of species and Similarity Index were derived from the above basic data.
Frequency, density, abundance and basal area were calculated following Misra (1968).
Number of sampling units in which a species occurs
Frequency: ______________________________________________________________________________ X 100
Total number of sampling units studied
The frequency of individual species is the number of times the species occurs in the
sampling quadrant.
Total number of individuals in all sampling units
Density:_______________________________________________________________________
Total number of sampling units studied
Density is the measure of dense in the distribution of an individual species within a given
area.
Total number of individuals in all sampling units
Abundance: ________________________________________________________________________
Total number of sampling units of occurrence
Total basal area or crown
Dominance = ----------------------------------- X 100
Total area sampled
It reflects the species basal area covered by a species within the sampling area.
EIA for the Proposed Capacity Enhancement by Increasing Pulp Production from 62,000 BD TPA to 90,000 BD TPA by upgrading the existing pulp mill without increasing the permitted paper production capacity of 1,00,000 TPA
Project No: PJ-ENVIR-2018419-1689 Dated: November 2018
Chapter-4, Baseline Environmental Status
Page 148
Relative Density and Dominance
The relative density and dominance values of different species found in the study are shows
that the dominant plants of various sites have a high percentage value of density and
dominance. These values are incorporated in calculating the Importance value Index.
Number of individuals of a species
Relative density: __________________________________________________________________ X 100
Total number of individuals of all species
Number of occurrences of a species
Relative frequency: ______ X 100
Total number of occurrences of all species
Total basal area of individual species
Relative basal area: ________________________________________________________ X 100
Total basal areas of all species
4.14.9 Aquatic Environment
The phytoplankton and zooplankton reflect the productivity of a water column at the
primary and secondary levels, respectively.
4.14.9.1 Plankton
The plankton samples were collected from Sone River and Chachai reservoir with a Hand net
(having 0.10 m2 mouth area and 300 µm mesh size). All the samples were preserved in 5%
neutralized formaldehyde solution. Different plankton taxa were sorted, identified and
enumerated under stereoscopic zoom binocular microscope. The number were calculated
for the whole samples and given for 100 m3 of water.
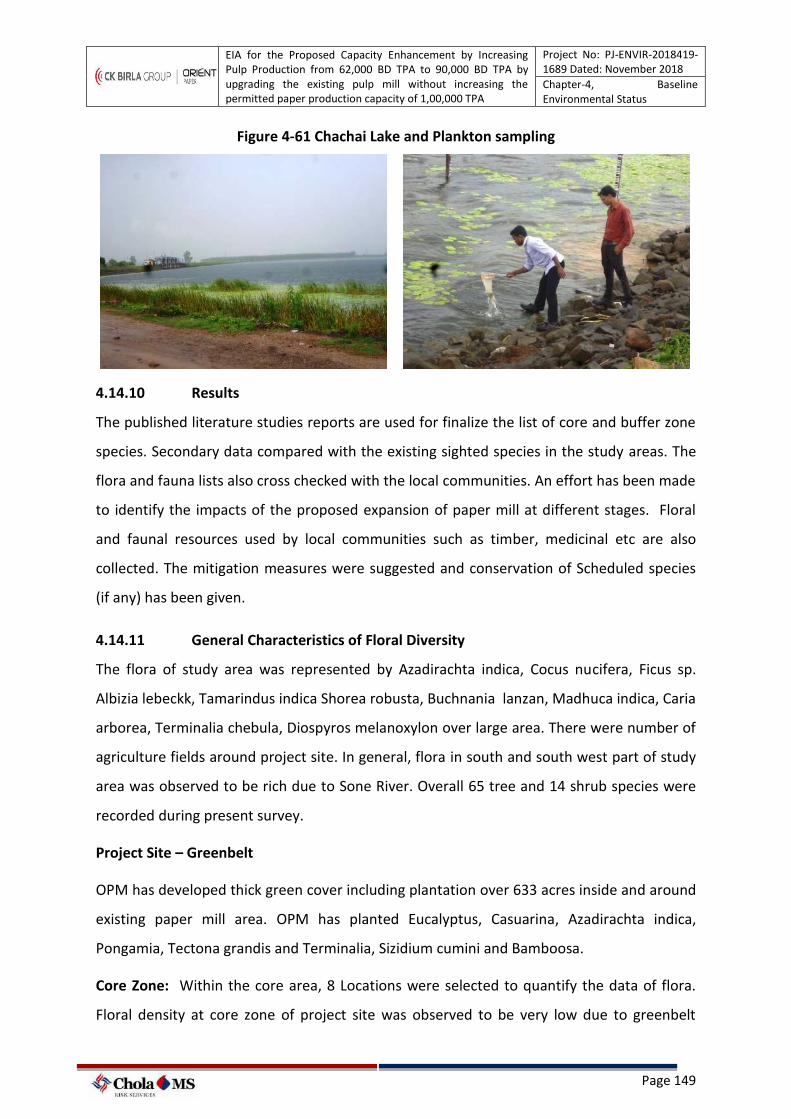
EIA for the Proposed Capacity Enhancement by Increasing Pulp Production from 62,000 BD TPA to 90,000 BD TPA by upgrading the existing pulp mill without increasing the permitted paper production capacity of 1,00,000 TPA
Project No: PJ-ENVIR-2018419-1689 Dated: November 2018
Chapter-4, Baseline Environmental Status
Page 149
Figure 4-61 Chachai Lake and Plankton sampling
4.14.10 Results
The published literature studies reports are used for finalize the list of core and buffer zone
species. Secondary data compared with the existing sighted species in the study areas. The
flora and fauna lists also cross checked with the local communities. An effort has been made
to identify the impacts of the proposed expansion of paper mill at different stages. Floral
and faunal resources used by local communities such as timber, medicinal etc are also
collected. The mitigation measures were suggested and conservation of Scheduled species
(if any) has been given.
4.14.11 General Characteristics of Floral Diversity
The flora of study area was represented by Azadirachta indica, Cocus nucifera, Ficus sp.
Albizia lebeckk, Tamarindus indica Shorea robusta, Buchnania lanzan, Madhuca indica, Caria
arborea, Terminalia chebula, Diospyros melanoxylon over large area. There were number of
agriculture fields around project site. In general, flora in south and south west part of study
area was observed to be rich due to Sone River. Overall 65 tree and 14 shrub species were
recorded during present survey.
Project Site – Greenbelt
OPM has developed thick green cover including plantation over 633 acres inside and around
existing paper mill area. OPM has planted Eucalyptus, Casuarina, Azadirachta indica,
Pongamia, Tectona grandis and Terminalia, Sizidium cumini and Bamboosa.
Core Zone: Within the core area, 8 Locations were selected to quantify the data of flora.
Floral density at core zone of project site was observed to be very low due to greenbelt
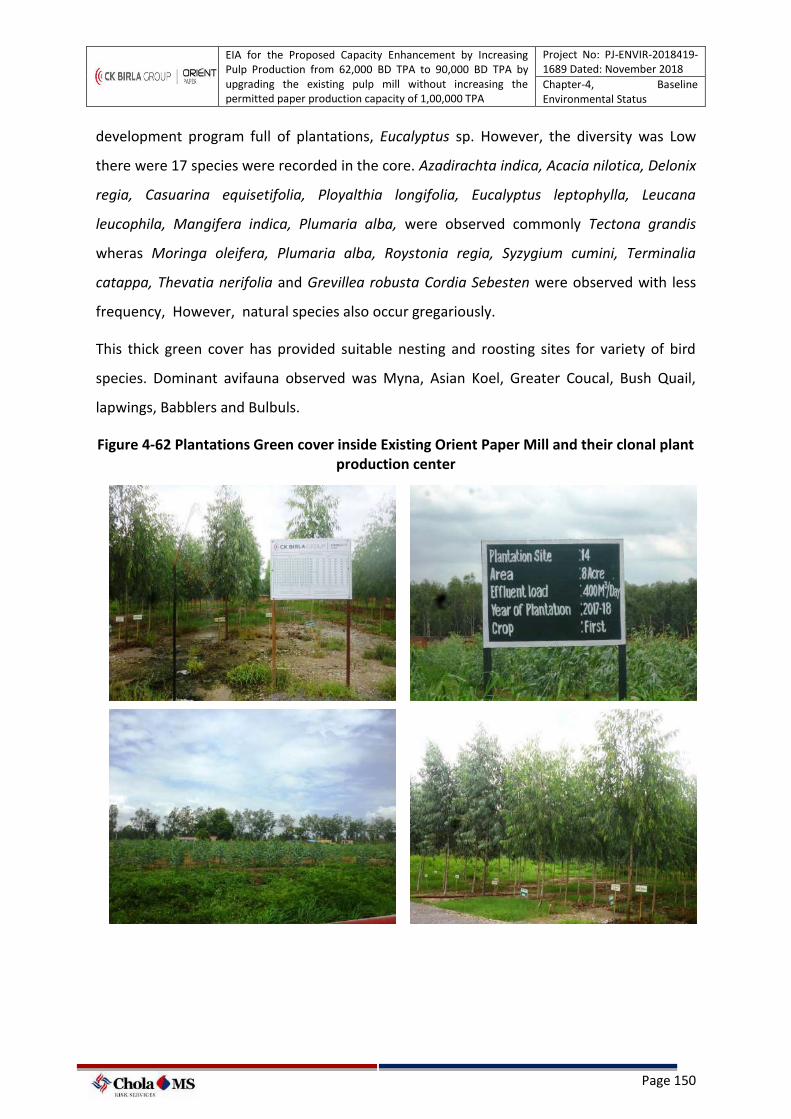
EIA for the Proposed Capacity Enhancement by Increasing Pulp Production from 62,000 BD TPA to 90,000 BD TPA by upgrading the existing pulp mill without increasing the permitted paper production capacity of 1,00,000 TPA
Project No: PJ-ENVIR-2018419-1689 Dated: November 2018
Chapter-4, Baseline Environmental Status
Page 150
development program full of plantations, Eucalyptus sp. However, the diversity was Low
there were 17 species were recorded in the core. Azadirachta indica, Acacia nilotica, Delonix
regia, Casuarina equisetifolia, Ployalthia longifolia, Eucalyptus leptophylla, Leucana
leucophila, Mangifera indica, Plumaria alba, were observed commonly Tectona grandis
wheras Moringa oleifera, Plumaria alba, Roystonia regia, Syzygium cumini, Terminalia
catappa, Thevatia nerifolia and Grevillea robusta Cordia Sebesten were observed with less
frequency, However, natural species also occur gregariously.
This thick green cover has provided suitable nesting and roosting sites for variety of bird
species. Dominant avifauna observed was Myna, Asian Koel, Greater Coucal, Bush Quail,
lapwings, Babblers and Bulbuls.
Figure 4-62 Plantations Green cover inside Existing Orient Paper Mill and their clonal plant production center
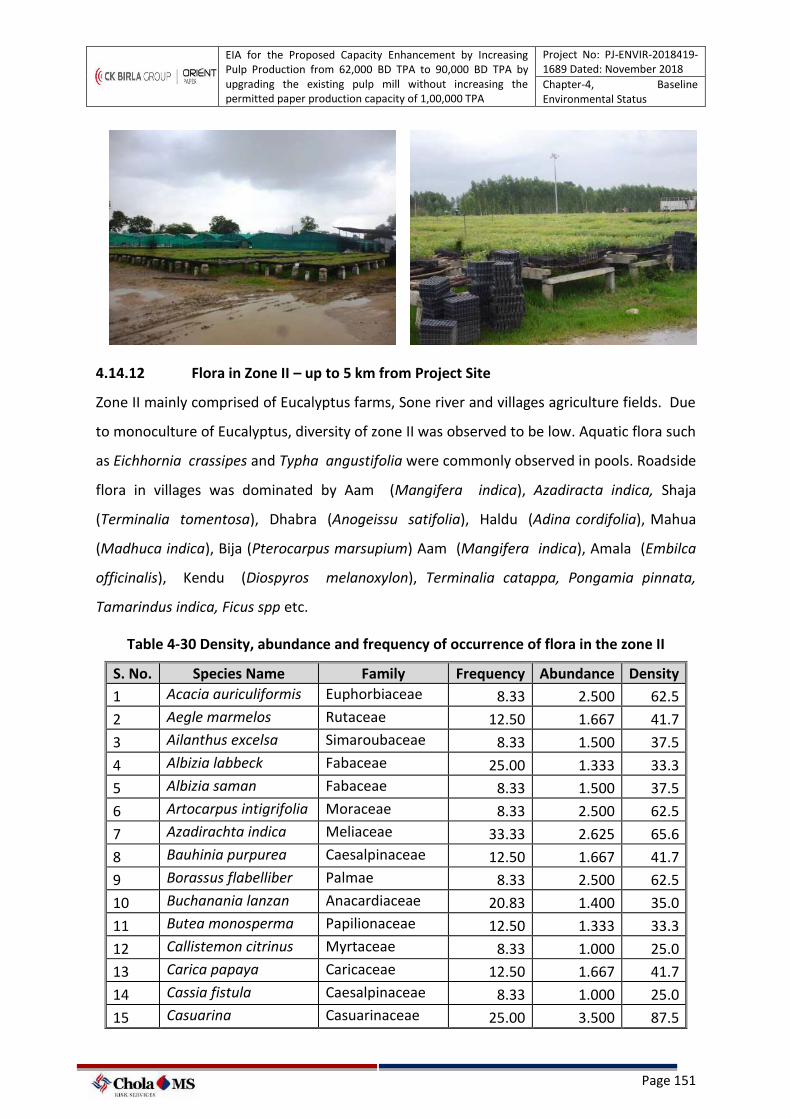
EIA for the Proposed Capacity Enhancement by Increasing Pulp Production from 62,000 BD TPA to 90,000 BD TPA by upgrading the existing pulp mill without increasing the permitted paper production capacity of 1,00,000 TPA
Project No: PJ-ENVIR-2018419-1689 Dated: November 2018
Chapter-4, Baseline Environmental Status
Page 151
4.14.12 Flora in Zone II – up to 5 km from Project Site
Zone II mainly comprised of Eucalyptus farms, Sone river and villages agriculture fields. Due
to monoculture of Eucalyptus, diversity of zone II was observed to be low. Aquatic flora such
as Eichhornia crassipes and Typha angustifolia were commonly observed in pools. Roadside
flora in villages was dominated by Aam (Mangifera indica), Azadiracta indica, Shaja
(Terminalia tomentosa), Dhabra (Anogeissu satifolia), Haldu (Adina cordifolia), Mahua
(Madhuca indica), Bija (Pterocarpus marsupium) Aam (Mangifera indica), Amala (Embilca
officinalis), Kendu (Diospyros melanoxylon), Terminalia catappa, Pongamia pinnata,
Tamarindus indica, Ficus spp etc.
Table 4-30 Density, abundance and frequency of occurrence of flora in the zone II
S. No. Species Name Family Frequency Abundance Density
1 Acacia auriculiformis Euphorbiaceae 8.33 2.500 62.5
2 Aegle marmelos Rutaceae 12.50 1.667 41.7
3 Ailanthus excelsa Simaroubaceae 8.33 1.500 37.5
4 Albizia labbeck Fabaceae 25.00 1.333 33.3
5 Albizia saman Fabaceae 8.33 1.500 37.5
6 Artocarpus intigrifolia Moraceae 8.33 2.500 62.5
7 Azadirachta indica Meliaceae 33.33 2.625 65.6
8 Bauhinia purpurea Caesalpinaceae 12.50 1.667 41.7
9 Borassus flabelliber Palmae 8.33 2.500 62.5
10 Buchanania lanzan Anacardiaceae 20.83 1.400 35.0
11 Butea monosperma Papilionaceae 12.50 1.333 33.3
12 Callistemon citrinus Myrtaceae 8.33 1.000 25.0
13 Carica papaya Caricaceae 12.50 1.667 41.7
14 Cassia fistula Caesalpinaceae 8.33 1.000 25.0
15 Casuarina Casuarinaceae 25.00 3.500 87.5
EIA for the Proposed Capacity Enhancement by Increasing Pulp Production from 62,000 BD TPA to 90,000 BD TPA by upgrading the existing pulp mill without increasing the permitted paper production capacity of 1,00,000 TPA
Project No: PJ-ENVIR-2018419-1689 Dated: November 2018
Chapter-4, Baseline Environmental Status
Page 152
S. No. Species Name Family Frequency Abundance Density
equisetifolium
16 Cassia siamia Caesalpinaceae 8.33 1.000 25.0
17 Ceiba pendandra Bombacaceae 8.33 1.000 25.0
18 Citrus aurantifolia Rutaceae 16.67 1.250 31.3
19 Cocus nucifera Arecaceae 25.00 1.000 25.0
20 Dalbergia sissoo Fabaceae 12.50 5.000 125.0
21 Delonix regia Fabaceae 16.67 1.000 25.0
22 Eucalyptus sp. Myrtaceae 41.67 5.600 140.0
23 Erythrina indica Fabaceae 16.67 1.500 37.5
24 Ficus benghalensis Moraceae 37.50 1.778 44.4
25 Ficus religiosa Moraceae 20.83 1.200 30.0
26 Laucana leucocephala Fabaceae 12.50 3.000 25.0
27 Madhuca indica Sapotaceae 8.33 1.000 25.0
28 Mangifera indica Anacardiaceae 16.67 1.250 31.3
29 Millingtonia hortensis Bignoniaceae 16.67 1.250 31.3
30 Mitragyna parviflora Rubiaceae 25.00 1.500 37.5
31 Moringa oleifera Moringaceae 8.33 2.500 62.5
32 Musa paradisiaca Musaceae 33.33 1.500 37.5
33 Peltophorum pterocarpum
Fabaceae 16.67 1.750 43.8
34 Phyllanthus emblica Euphorbiaceae 8.33 1.000 25.0
35 Psidium guyava Myrtaceae 25.00 1.167 29.2
36 Plumaria acutifolia Apocyanaceae 12.50 1.000 25.0
37 Polyalthia longifolia Annonaceae 8.33 1.500 37.5
38 Pongamia pinnata Fabaceae 8.33 1.500 37.5
39 Semecarpus anacardium
Anacardiaceae 20.83 1.600 40.0
40 Shorea robusta Dipterocarpaceae 12.50 1.333 33.3
41 Syzigium cummuni Myrtaceae 33.33 1.000 25.0
42 Tamarindus indica Fabaceae 4.17 1.000 25.0
43 Tectona grandis Lamiaceae 12.50 1.667 41.7
44 Terminalia bellerica Combretaceae 37.50 1.333 33.3
45 Terminalia chebula Combretaceae 12.50 1.333 33.3
46 Terminalia tomentosa Combretaceae 33.33 1.625 40.6
47 Thespesia grandiflora Malvaceae 25.00 1.167 29.2
48 Thespesia populnea Malvaceae 8.33 1.500 37.5
EIA for the Proposed Capacity Enhancement by Increasing Pulp Production from 62,000 BD TPA to 90,000 BD TPA by upgrading the existing pulp mill without increasing the permitted paper production capacity of 1,00,000 TPA
Project No: PJ-ENVIR-2018419-1689 Dated: November 2018
Chapter-4, Baseline Environmental Status
Page 153
4.14.13 Flora of Zone III – 5 to 10 km from Project Site
Flora of Zone III was observed to be the plant species dominated this zone were mainly
Sal (Shorea robusta), Kadhi (Dalbergia lanceolata), Bahera (Terminalia belerica), Safed
siris (Albizia procera), Shisham (Dalbergia latifolia), Shaja (Terminalia tomentosa), Dhabra
(Anogeissu satifolia), Haldu (Adina cordifolia), Mahua (Madhuca indica), Bija (Pterocarpus
marsupium) Aam (Mangifera indica), Amala (Embilca officinalis), Kendu (Diospyros
melanoxylon), Gunja (Lannea grandis), Kahua (Terminalia arjuna) and Kullu (Sterculia
urens).
Table 4-31 Density, abundance and frequency of occurrence of flora in the zone III
Sl No Scientific Name Family Frequency Abundance Density
1 Acacia auriculiformis Euphorbiaceae 25.00 1.833 45.8
2 Aegle marmelos Rutaceae 16.67 1.000 25.0
3 Ailanthus excelsa Simaroubaceae 8.33 1.000 25.0
4 Albizia labbeck Fabaceae 16.67 1.250 31.3
5 Albizia saman Fabaceae 12.50 1.000 25.0
6 Anacardium occidentale Anacardiaceae 4.17 3.000 75.0
7 Artocarpus intigrifolia Moraceae 20.83 1.200 30.0
8 Azadirachta indica Meliaceae 29.17 1.571 39.3
9 Bambusa vulgaris Poaceae 16.67 1.000 25.0
10 Bauhinia purpurea Caesalpinaceae 12.50 1.333 33.3
11 Borassus flabelliber Palmae 8.33 2.500 62.5
12 Buchanania lanzan Anacardiaceae 16.67 1.000 25.0
13 Butea monosperma Papilionaceae 8.33 1.500 37.5
14 Callistemon citrinus Myrtaceae 12.50 1.000 25.0
15 Carica papaya Caricaceae 25.00 1.000 25.0
16 Cassia fistula Caesalpinaceae 8.33 1.000 25.0
17 Casuarina equisetifoliuma
Casuarinaceae 16.67 1.250 31.3
18 Cassia siamia Caesalpinaceae 16.67 1.250 31.3
19 Ceiba pendandra Bombacaceae 16.67 1.500 37.5
20 Citrus aurantifolia Rutaceae 16.67 3.750 93.8
21 Citrus medica Rutaceae 20.83 0.800 20.0
22 Cocus nucifera Arecaceae 16.67 1.500 37.5
23 Dalbergia sissoo Fabaceae 12.50 1.333 33.3
24 Delonix regia Fabaceae 29.17 2.286 57.1
25 Eucalyptus sp. Myrtaceae 33.33 5.750 143.8
26 Erythrina indica Fabaceae 12.50 3.000 25.0
EIA for the Proposed Capacity Enhancement by Increasing Pulp Production from 62,000 BD TPA to 90,000 BD TPA by upgrading the existing pulp mill without increasing the permitted paper production capacity of 1,00,000 TPA
Project No: PJ-ENVIR-2018419-1689 Dated: November 2018
Chapter-4, Baseline Environmental Status
Page 154
Sl No Scientific Name Family Frequency Abundance Density
27 Ficus benghalensis Moraceae 20.83 1.000 25.0
28 Ficus religiosa Moraceae 16.67 1.250 31.3
29 Kigelia africana Bignoniaceae 8.33 1.500 37.5
30 Laucana leucocephala Fabaceae 29.17 1.143 28.6
31 Madhuca indica Sapotaceae 29.17 1.000 25.0
32 Mangifera indica Anacardiaceae 37.50 1.444 36.1
33 Millingtonia hortensis Bignoniaceae 12.50 1.000 25.0
34 Mitragyna parviflora Rubiaceae 8.33 1.000 25.0
35 Moringa oleifera Moringaceae 16.67 1.000 25.0
36 Murraya koenichii Rutaceae 8.33 1.000 25.0
37 Musa paradisiaca Musaceae 4.17 2.000 50.0
38 Peltophorum pterocarpum
Fabaceae 25.00 1.000 25.0
39 Phoenix sylvestrix Arecaceae 8.33 1.000 25.0
40 Pithecellobium dulce Fabaceae 16.67 1.000 25.0
41 Phyllanthus emblica Euphorbiaceae 16.67 1.000 25.0
42 Psidium guyava Myrtaceae 8.33 1.000 25.0
43 Plumaria acutifolia Apocyanaceae 16.67 1.000 25.0
44 Polyalthia longifolia Annonaceae 8.33 1.500 37.5
45 Pongamia pinnata Fabaceae 16.67 1.000 25.0
46 Semecarpus anacardium Anacardiaceae 8.33 1.500 37.5
47 Shorea robusta Dipterocarpaceae 33.33 1.000 25.0
48 Syzigium cummuni Myrtaceae 8.33 1.500 37.5
49 Tamarindus indica Fabaceae 12.50 1.000 25.0
50 Tectona grandis Lamiaceae 25.00 1.000 25.0
51 Terminalia bellerica Combretaceae 16.67 1.000 25.0
52 Terminalia chebula Combretaceae 4.17 1.000 25.0
53 Terminalia tomentosa Combretaceae 8.33 1.000 25.0
54 Thespesia grandiflora Malvaceae 8.33 1.000 25.0
55 Thespesia populnea Malvaceae 8.33 1.000 25.0
4.14.13.1 Herbs / Grasses (Under Storey)
Common grasses found were Dub (Cynodon dectylon), Phulli (Apludavaria), Bharvel
(Dicanthium annulatum), Bhurbhusi (Iregrastis tenella). Some bamboo species are also
found in this area which is called bans (Dendrocalamus strictus).

EIA for the Proposed Capacity Enhancement by Increasing Pulp Production from 62,000 BD TPA to 90,000 BD TPA by upgrading the existing pulp mill without increasing the permitted paper production capacity of 1,00,000 TPA
Project No: PJ-ENVIR-2018419-1689 Dated: November 2018
Chapter-4, Baseline Environmental Status
Page 155
The under storey mainly consists of Dhawai (Woodfordia floribunda), Seharu
(Nyctanthus arbortristis), Karaunda (Caris saopaca), Ber (Zigyphus jujuba), Ainthi
(Helicteres isora), Chakoda (Cassia tora), Bantulsi (Daedalcanthus purpurescen),
Gajarghas (Parthenium spp.), etc.
4.14.13.2 Climbers
The climbers reported were Mahul (Bauhinia vahlii), Barari (Zizyphus oenoplea), Gugunchi
(Arbus precatorius), Ramdaton (Smilax macrophyla), Dudhbe (Mersdenia tenakisima),
Baichandi (Dioscoria hispida) and Bhendo (Butea parviflora) etc.
The mixed forest forms habitat for a larger variety of fauna, as it provides a greater
diversity in flora, thereby a variety of food & shelter for different animals.
4.14.13.3 Shrubs (Middle storey)
Middle storey shrubs of this region consists of Bheri (Casearia tomentosa), Dudhi
(Holarrhena antidysentrica), Hilma (Semecarpus anacardium), Jamrasi (Eleodendron
glaucum), Bhadkur (Hymenodyctyon excelsum), Amaltas (Cassia fistula), Kari
(Saccopetalum tomentosum), Datranga (Ehretia laevis), Khair (Acaia catechu), Hadua
(Erythrina suberosa), Kekad (Garuga pinnata), Dahigan (Cordia macleodii) and Bamboo
(Dandrocalamus strictus).
4.14.13.4 Trees (Top Storey)
Top canopy of the mixed forest type trees consists mainly Sal (Shorea robusta), Kadhi
(Dalbergia lanceolata), Bahera (Terminalia belerica), Safed siris (Albizia procera),
Shisham (Dalbergia latifolia), Shaja (Terminalia tomentosa), Dhabra (Anogeissu satifolia),
Haldu (Adina cordifolia), Mahua (Madhuca indica), Bija (Pterocarpus marsupium) Aam
(Mangifera indica), Amala (Embilca officinalis), Kendu (Diospyros melanoxylon), Gunja
(Lannea grandis), Kahua (Terminalia arjuna) and Kullu (Sterculia urens).
Table 4-32 List of ground level storey herbaceous species observed in the study area
Sl No Scientific Name Family Common/Local
Name
HERBS
1 Abutilon indicum Malvaceae Khangi
2 Acalypha indica Euphorbiaceae Kuppi
EIA for the Proposed Capacity Enhancement by Increasing Pulp Production from 62,000 BD TPA to 90,000 BD TPA by upgrading the existing pulp mill without increasing the permitted paper production capacity of 1,00,000 TPA
Project No: PJ-ENVIR-2018419-1689 Dated: November 2018
Chapter-4, Baseline Environmental Status
Page 156
Sl No Scientific Name Family Common/Local
Name
3 Achyranthes aspera Amaranthaceae Chirchita
4 Agave americana Agavaceae Sisal
5 Argemone mexicana Papaveraceae Satyanashi
6 Aristida setacea Poaceae ---
7 Atylosia scarabaeodes Fabaceae ---
8 Barleria caspidata Acanthaceae ---
9 Cassia occidentalis Fabaceae Kasunda
10 Catharamthus roseus Apocyanaceae Sadabahar
11 Cleome viscosa Capparaceae Bahra
12 Cleome gynandra Capparaceae Safed bahro
13 Cyanodon dactylon Poaceae Duba
14 Cyperus rotundus Cyperaceae Bara nagar
15 Datura metel Solanaceae Safed Dhatura
16 Dolichus biflorus Fabaceae Horse gram
17 Eragratis viscose Poaceae ---
18 Euphorbia hirta Euphorbiaceae Bara Dudhi
19 Hygrophila auriculata Acanthaceae Bhankari
20 Mimosa pedica Mimosaceae Lajakuli
21 Mirabilis jalapa Nyctaginaceae Gulabbas
22 Ocimum sanctum Lamiaceae Tulsi
23 Ocimum tenuiflorum Lamiaceae Tulsi
24 Panicum humile Poaceae ---
25 Parthenium hysterophorus Asteraceae Gajar ghas
26 Pedilanthus tithymaloides Euphorbiaceae ----
27 Phyllanthus niruri Euphorbiaceae Bhui aonla
28 Sida cardifolia Malvaceae ---
29 Sida rhomboids Malvaceae Biskhabari
30 Tribulus terrestris Zygophyllaceae Gokharu
31 Tridox procumbans Asteraceae Khal muriya
32 Urginea indica Asparagaceae Ban piaz
Table 4-33 List of Shrub species observed in the study area
Sl No
Scientific Name Family Common/Local Name
Shrubs
1 Annona squomosa Annonaceae Sitaphal
2 Bouhainvillea glabra Nyctaginaceae Bouhainvillea
3 Calotropis gigantica Asclepiadaceae Arakh
4 Calotropis procera Asclepiadaceae Arakh
5 Euphorbia tirucalli Euphorbiaceae Niwarang
6 Hibiscus rosasinensis Malvaceae Jasum
7 Ipomea reptans Convolvulaceae Amari
EIA for the Proposed Capacity Enhancement by Increasing Pulp Production from 62,000 BD TPA to 90,000 BD TPA by upgrading the existing pulp mill without increasing the permitted paper production capacity of 1,00,000 TPA
Project No: PJ-ENVIR-2018419-1689 Dated: November 2018
Chapter-4, Baseline Environmental Status
Page 157
Sl No
Scientific Name Family Common/Local Name
8 Ixora coccinea Rubiaceae Lokhandi
9 Jatropha gossipifolia Euphorbiaceae Rabjada
10 Jatropha curcas Euphorbiaceae Rabjada
11 Justicia adhatoda Acanthaceae --
12 Morinda tinctoria Rubiaceae Aal
13 Lantana camera Asteraceae Raimunia
14 Nerium oleander Apocyanaceae Kaner
15 Punica granatum Punicaceae Pomegranate
16 Ricinus communis Euphorbiaceae Erandi
17 Tecoma gaudichaudi Bignoniaceae --
18 Thevetia nurifolia Apocynaceae Pila Kaner
19 Vitex nigundo Verbinaceae Nirgundi
20 Woodfordia fruticosa Lythraceae Dhatki, Dhutuk
21 Zizipus xylopyra Rhamnaceae Kantei
Table 4-34 List of Trees species observed in the study area (Buffer zone)
Sl No
Scientific Name Family Common/Local
Name
TREES
1 Acacia auriculiformis Euphorbiaceae Akasia / Glass tree
2 Aegle marmelos Rutaceae Bel
3 Ailanthus excelsa Simaroubaceae Mundayigatch
4 Albizia labbeck Fabaceae Saras
5 Albizia saman Fabaceae Vilaiti Saras
6 Anacardium occidentale Anacardiaceae Kaju
7 Artocarpus intigrifolia Moraceae Jack fruit
8 Azadirachta indica Meliaceae Nimba/Neem
9 Bambusa vulgaris Poaceae Bans
10 Bauhinia purpurea Caesalpinaceae Borda, Kuliari
11 Borassus flabelliber Palmae Tadd/Tal
12 Buchanania lanzan Anacardiaceae Char
13 Butea monosperma Papilionaceae Phalsa, Palas
14 Callistemon citrinus Myrtaceae Bottle brush
15 Carica papaya Caricaceae Papeetaa
16 Cassia fistula Caesalpinaceae Amaltas
17 Casuarina equisetifoliuma Casuarinaceae Jungli Saru
18 Cassia siamia Caesalpinaceae Kassod
19 Ceiba pendandra Bombacaceae Safed Semal
20 Citrus aurantifolia Rutaceae Kaghzi Nimbu
21 Citrus medica Rutaceae Galgal
22 Cocus nucifera Arecaceae Nariyal
EIA for the Proposed Capacity Enhancement by Increasing Pulp Production from 62,000 BD TPA to 90,000 BD TPA by upgrading the existing pulp mill without increasing the permitted paper production capacity of 1,00,000 TPA
Project No: PJ-ENVIR-2018419-1689 Dated: November 2018
Chapter-4, Baseline Environmental Status
Page 158
Sl No
Scientific Name Family Common/Local
Name
23 Dalbergia sissoo Fabaceae Sissoo
24 Delonix regia Fabaceae Gulmohar
25 Eucalyptus sp. Myrtaceae Nilgiri
26 Erythrina indica Fabaceae Panjara
27 Ficus benghalensis Moraceae Bar
28 Ficus religiosa Moraceae Pipal
29 Kigelia Africana Bignoniaceae Sausage
30 Laucana leucocephala Fabaceae Safed babool
31 Madhuca indica Sapotaceae Mahua/Butter tree
32 Mangifera indica Anacardiaceae Amba/Mango
33 Millingtonia hortensis Bignoniaceae Neem Chameli
34 Mitragyna parviflora Rubiaceae Mundi, Muid
35 Moringa oleifera Moringaceae Munga
36 Murraya koenichii Rutaceae Karry patta
37 Musa paradisiaca Musaceae Kelaa
38 Peltophorum pterocarpum Fabaceae Copper pod
39 Phoenix sylvestrix Arecaceae Khajur
40 Pithecellobium dulce Fabaceae Ganga imli
41 Phyllanthus emblica Euphorbiaceae Amlaa
42 Psidium guyava Myrtaceae Amrood
43 Plumaria acutifolia Apocyanaceae Pakoda tree
44 Polyalthia longifolia Annonaceae Ashok
45 Pongamia pinnata Fabaceae Karanj
46 Prosobis juliflora Fabaceae Babul[
47 Semecarpus anacardium Anacardiaceae Bhalia, Bheluan
48 Shorea robusta Dipterocarpaceae Sal
49 Syzigium cummuni Myrtaceae Jamu
50 Tamarindus indica Fabaceae Imli
51 Tectona grandis Lamiaceae Teak
52 Terminalia bellerica Combretaceae Bahada
53 Terminalia chebula Combretaceae Harida
54 Terminalia tomentosa Combretaceae Asan, Sahaj
55 Thespesia grandiflora Malvaceae ---
56 Thespesia populnea Malvaceae Paras pipal
4.14.14 Agriculture in the study Area
Study area has fertile soils in most of the regions. The network of the irrigation canals from
Chachai reservoir and Sone River overcomes deficiency of water to a certain extent. The
cropping pattern of the study area is characterized by diversified cropping patterns exist and
no single crop claims a large share of the gross cropped area. In canal fed areas Paddy
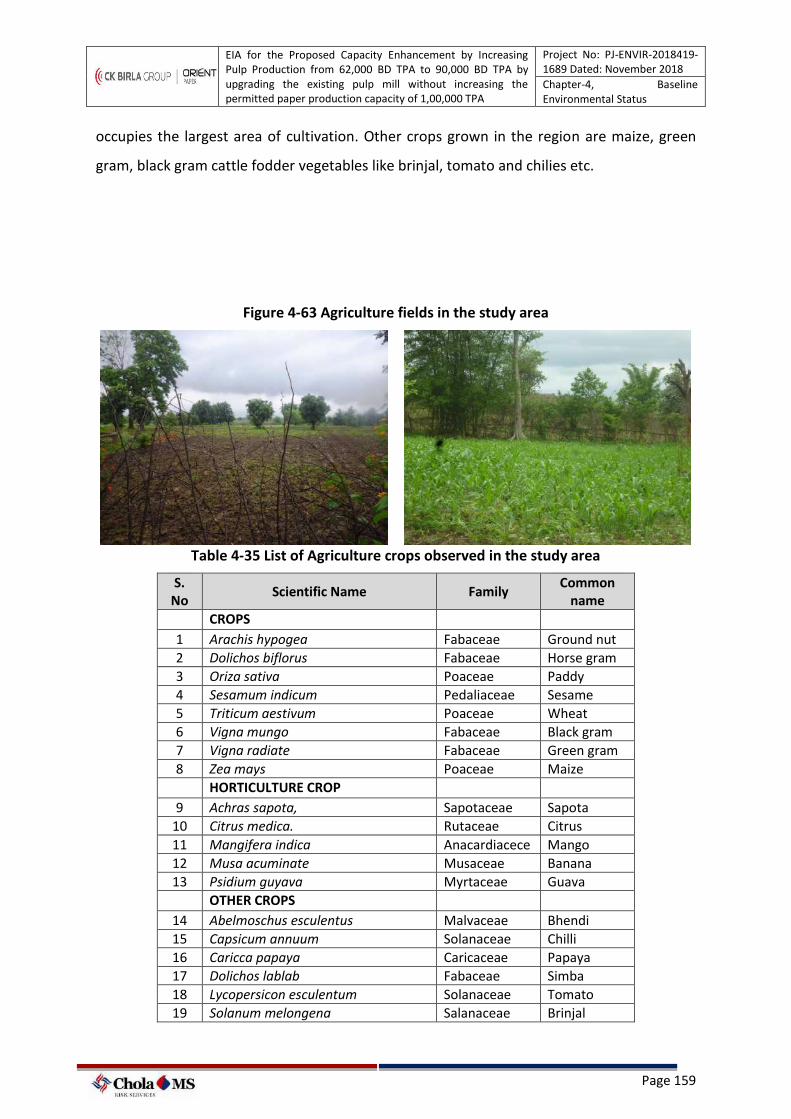
EIA for the Proposed Capacity Enhancement by Increasing Pulp Production from 62,000 BD TPA to 90,000 BD TPA by upgrading the existing pulp mill without increasing the permitted paper production capacity of 1,00,000 TPA
Project No: PJ-ENVIR-2018419-1689 Dated: November 2018
Chapter-4, Baseline Environmental Status
Page 159
occupies the largest area of cultivation. Other crops grown in the region are maize, green
gram, black gram cattle fodder vegetables like brinjal, tomato and chilies etc.
Figure 4-63 Agriculture fields in the study area
Table 4-35 List of Agriculture crops observed in the study area
S. No
Scientific Name Family Common
name CROPS
1 Arachis hypogea Fabaceae Ground nut 2 Dolichos biflorus Fabaceae Horse gram 3 Oriza sativa Poaceae Paddy 4 Sesamum indicum Pedaliaceae Sesame 5 Triticum aestivum Poaceae Wheat 6 Vigna mungo Fabaceae Black gram 7 Vigna radiate Fabaceae Green gram 8 Zea mays Poaceae Maize HORTICULTURE CROP
9 Achras sapota, Sapotaceae Sapota 10 Citrus medica. Rutaceae Citrus 11 Mangifera indica Anacardiacece Mango 12 Musa acuminate Musaceae Banana 13 Psidium guyava Myrtaceae Guava
OTHER CROPS 14 Abelmoschus esculentus Malvaceae Bhendi 15 Capsicum annuum Solanaceae Chilli 16 Caricca papaya Caricaceae Papaya 17 Dolichos lablab Fabaceae Simba 18 Lycopersicon esculentum Solanaceae Tomato 19 Solanum melongena Salanaceae Brinjal
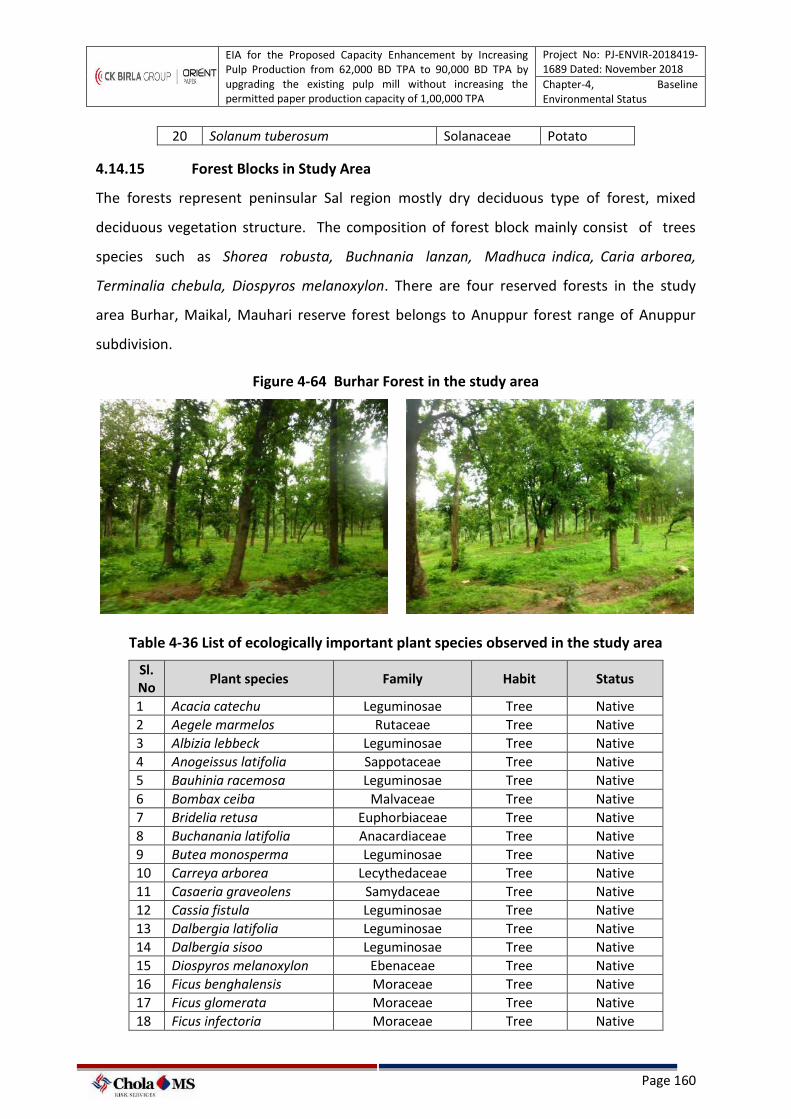
EIA for the Proposed Capacity Enhancement by Increasing Pulp Production from 62,000 BD TPA to 90,000 BD TPA by upgrading the existing pulp mill without increasing the permitted paper production capacity of 1,00,000 TPA
Project No: PJ-ENVIR-2018419-1689 Dated: November 2018
Chapter-4, Baseline Environmental Status
Page 160
20 Solanum tuberosum Solanaceae Potato
4.14.15 Forest Blocks in Study Area
The forests represent peninsular Sal region mostly dry deciduous type of forest, mixed
deciduous vegetation structure. The composition of forest block mainly consist of trees
species such as Shorea robusta, Buchnania lanzan, Madhuca indica, Caria arborea,
Terminalia chebula, Diospyros melanoxylon. There are four reserved forests in the study
area Burhar, Maikal, Mauhari reserve forest belongs to Anuppur forest range of Anuppur
subdivision.
Figure 4-64 Burhar Forest in the study area
Table 4-36 List of ecologically important plant species observed in the study area
Sl. No
Plant species Family Habit Status
1 Acacia catechu Leguminosae Tree Native 2 Aegele marmelos Rutaceae Tree Native 3 Albizia lebbeck Leguminosae Tree Native 4 Anogeissus latifolia Sappotaceae Tree Native 5 Bauhinia racemosa Leguminosae Tree Native 6 Bombax ceiba Malvaceae Tree Native 7 Bridelia retusa Euphorbiaceae Tree Native 8 Buchanania latifolia Anacardiaceae Tree Native 9 Butea monosperma Leguminosae Tree Native 10 Carreya arborea Lecythedaceae Tree Native 11 Casaeria graveolens Samydaceae Tree Native 12 Cassia fistula Leguminosae Tree Native 13 Dalbergia latifolia Leguminosae Tree Native 14 Dalbergia sisoo Leguminosae Tree Native 15 Diospyros melanoxylon Ebenaceae Tree Native 16 Ficus benghalensis Moraceae Tree Native 17 Ficus glomerata Moraceae Tree Native 18 Ficus infectoria Moraceae Tree Native
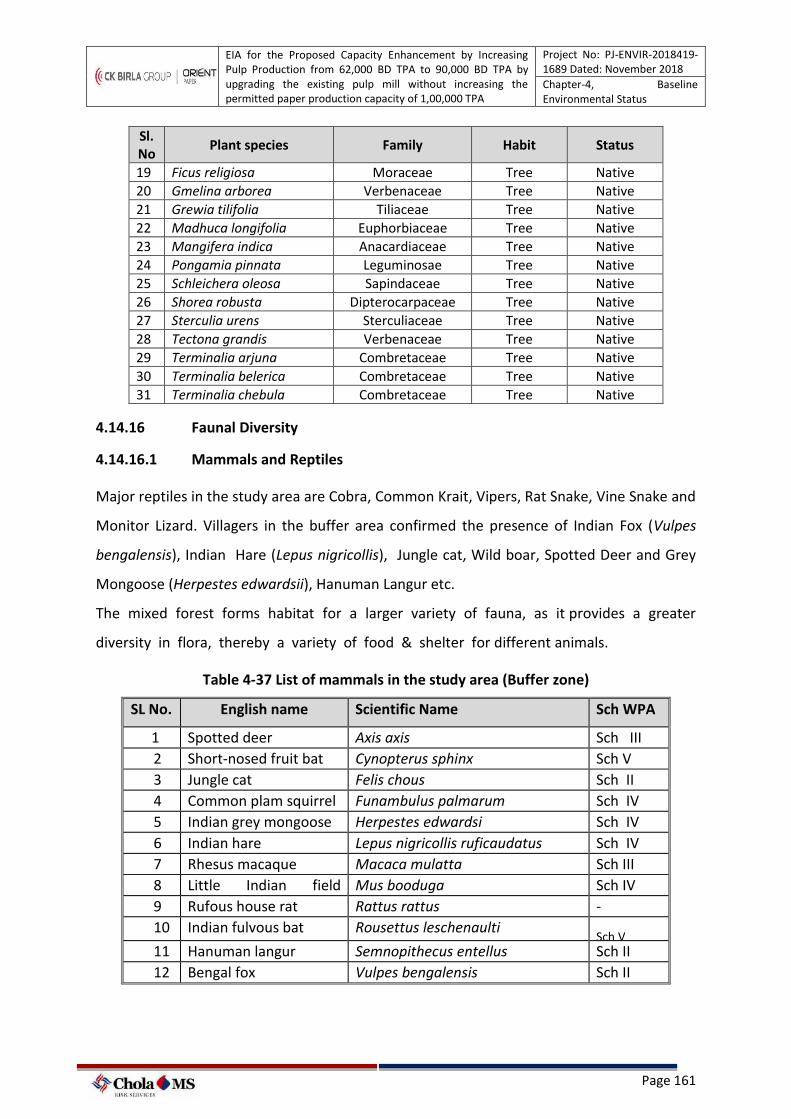
EIA for the Proposed Capacity Enhancement by Increasing Pulp Production from 62,000 BD TPA to 90,000 BD TPA by upgrading the existing pulp mill without increasing the permitted paper production capacity of 1,00,000 TPA
Project No: PJ-ENVIR-2018419-1689 Dated: November 2018
Chapter-4, Baseline Environmental Status
Page 161
Sl. No
Plant species Family Habit Status
19 Ficus religiosa Moraceae Tree Native 20 Gmelina arborea Verbenaceae Tree Native 21 Grewia tilifolia Tiliaceae Tree Native 22 Madhuca longifolia Euphorbiaceae Tree Native 23 Mangifera indica Anacardiaceae Tree Native 24 Pongamia pinnata Leguminosae Tree Native 25 Schleichera oleosa Sapindaceae Tree Native 26 Shorea robusta Dipterocarpaceae Tree Native 27 Sterculia urens Sterculiaceae Tree Native 28 Tectona grandis Verbenaceae Tree Native 29 Terminalia arjuna Combretaceae Tree Native 30 Terminalia belerica Combretaceae Tree Native 31 Terminalia chebula Combretaceae Tree Native
4.14.16 Faunal Diversity
4.14.16.1 Mammals and Reptiles
Major reptiles in the study area are Cobra, Common Krait, Vipers, Rat Snake, Vine Snake and
Monitor Lizard. Villagers in the buffer area confirmed the presence of Indian Fox (Vulpes
bengalensis), Indian Hare (Lepus nigricollis), Jungle cat, Wild boar, Spotted Deer and Grey
Mongoose (Herpestes edwardsii), Hanuman Langur etc.
The mixed forest forms habitat for a larger variety of fauna, as it provides a greater
diversity in flora, thereby a variety of food & shelter for different animals.
Table 4-37 List of mammals in the study area (Buffer zone)
SL No. English name Scientific Name Sch WPA
1 Spotted deer Axis axis Sch III
2 Short-nosed fruit bat Cynopterus sphinx Sch V
3 Jungle cat Felis chous Sch II
4 Common plam squirrel Funambulus palmarum Sch IV
5 Indian grey mongoose Herpestes edwardsi Sch IV
6 Indian hare Lepus nigricollis ruficaudatus Sch IV
7 Rhesus macaque Macaca mulatta Sch III
8 Little Indian field
mouse
Mus booduga Sch IV
9 Rufous house rat Rattus rattus -
10 Indian fulvous bat Rousettus leschenaulti Sch V
11 Hanuman langur Semnopithecus entellus Sch II
12 Bengal fox Vulpes bengalensis Sch II
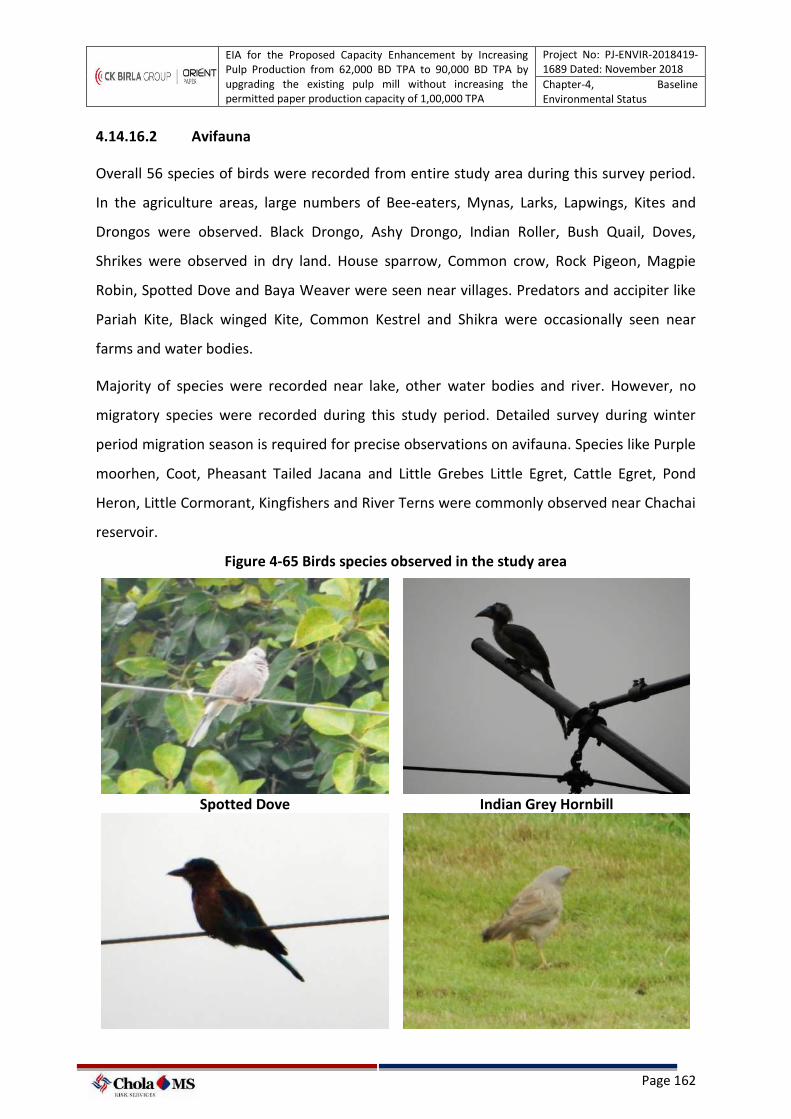
EIA for the Proposed Capacity Enhancement by Increasing Pulp Production from 62,000 BD TPA to 90,000 BD TPA by upgrading the existing pulp mill without increasing the permitted paper production capacity of 1,00,000 TPA
Project No: PJ-ENVIR-2018419-1689 Dated: November 2018
Chapter-4, Baseline Environmental Status
Page 162
4.14.16.2 Avifauna
Overall 56 species of birds were recorded from entire study area during this survey period.
In the agriculture areas, large numbers of Bee-eaters, Mynas, Larks, Lapwings, Kites and
Drongos were observed. Black Drongo, Ashy Drongo, Indian Roller, Bush Quail, Doves,
Shrikes were observed in dry land. House sparrow, Common crow, Rock Pigeon, Magpie
Robin, Spotted Dove and Baya Weaver were seen near villages. Predators and accipiter like
Pariah Kite, Black winged Kite, Common Kestrel and Shikra were occasionally seen near
farms and water bodies.
Majority of species were recorded near lake, other water bodies and river. However, no
migratory species were recorded during this study period. Detailed survey during winter
period migration season is required for precise observations on avifauna. Species like Purple
moorhen, Coot, Pheasant Tailed Jacana and Little Grebes Little Egret, Cattle Egret, Pond
Heron, Little Cormorant, Kingfishers and River Terns were commonly observed near Chachai
reservoir.
Figure 4-65 Birds species observed in the study area
Spotted Dove Indian Grey Hornbill
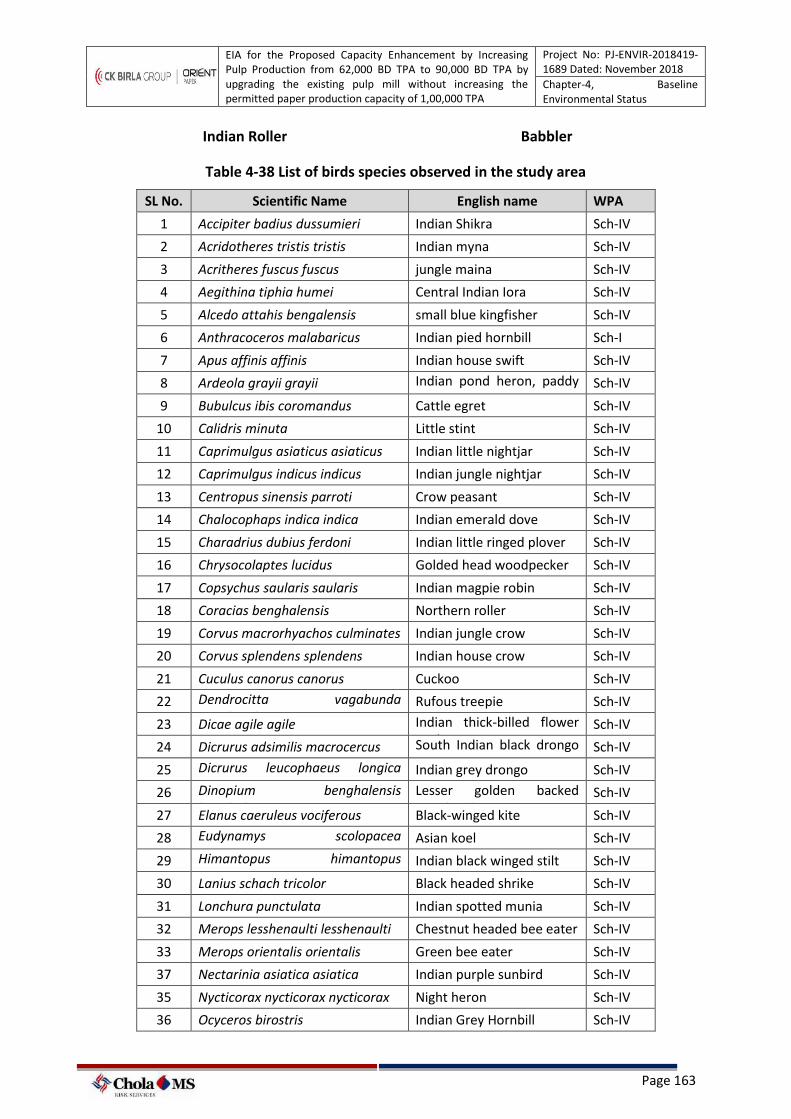
EIA for the Proposed Capacity Enhancement by Increasing Pulp Production from 62,000 BD TPA to 90,000 BD TPA by upgrading the existing pulp mill without increasing the permitted paper production capacity of 1,00,000 TPA
Project No: PJ-ENVIR-2018419-1689 Dated: November 2018
Chapter-4, Baseline Environmental Status
Page 163
Indian Roller Babbler
Table 4-38 List of birds species observed in the study area
SL No. Scientific Name English name WPA
1 Accipiter badius dussumieri Indian Shikra Sch-IV
2 Acridotheres tristis tristis Indian myna Sch-IV
3 Acritheres fuscus fuscus jungle maina Sch-IV
4 Aegithina tiphia humei Central Indian Iora Sch-IV
5 Alcedo attahis bengalensis small blue kingfisher Sch-IV
6 Anthracoceros malabaricus Indian pied hornbill Sch-I
7 Apus affinis affinis Indian house swift Sch-IV
8 Ardeola grayii grayii Indian pond heron, paddy bird
Sch-IV
9 Bubulcus ibis coromandus Cattle egret Sch-IV
10 Calidris minuta Little stint Sch-IV
11 Caprimulgus asiaticus asiaticus Indian little nightjar Sch-IV
12 Caprimulgus indicus indicus Indian jungle nightjar Sch-IV
13 Centropus sinensis parroti Crow peasant Sch-IV
14 Chalocophaps indica indica Indian emerald dove Sch-IV
15 Charadrius dubius ferdoni Indian little ringed plover Sch-IV
16 Chrysocolaptes lucidus Golded head woodpecker Sch-IV
17 Copsychus saularis saularis Indian magpie robin Sch-IV
18 Coracias benghalensis Northern roller Sch-IV
19 Corvus macrorhyachos culminates Indian jungle crow Sch-IV
20 Corvus splendens splendens Indian house crow Sch-IV
21 Cuculus canorus canorus Cuckoo Sch-IV
22 Dendrocitta vagabunda vagabunda
Rufous treepie Sch-IV
23 Dicae agile agile Indian thick-billed flower pecker
Sch-IV
24 Dicrurus adsimilis macrocercus South Indian black drongo or king crow
Sch-IV
25 Dicrurus leucophaeus longica udatus
Indian grey drongo Sch-IV
26 Dinopium benghalensis benghalensis
Lesser golden backed woodpecker
Sch-IV
27 Elanus caeruleus vociferous Black-winged kite Sch-IV
28 Eudynamys scolopacea scolopacea
Asian koel Sch-IV
29 Himantopus himantopus himantopus
Indian black winged stilt Sch-IV
30 Lanius schach tricolor Black headed shrike Sch-IV
31 Lonchura punctulata Indian spotted munia Sch-IV
32 Merops lesshenaulti lesshenaulti Chestnut headed bee eater Sch-IV
33 Merops orientalis orientalis Green bee eater Sch-IV
37 Nectarinia asiatica asiatica Indian purple sunbird Sch-IV
35 Nycticorax nycticorax nycticorax Night heron Sch-IV
36 Ocyceros birostris Indian Grey Hornbill Sch-IV
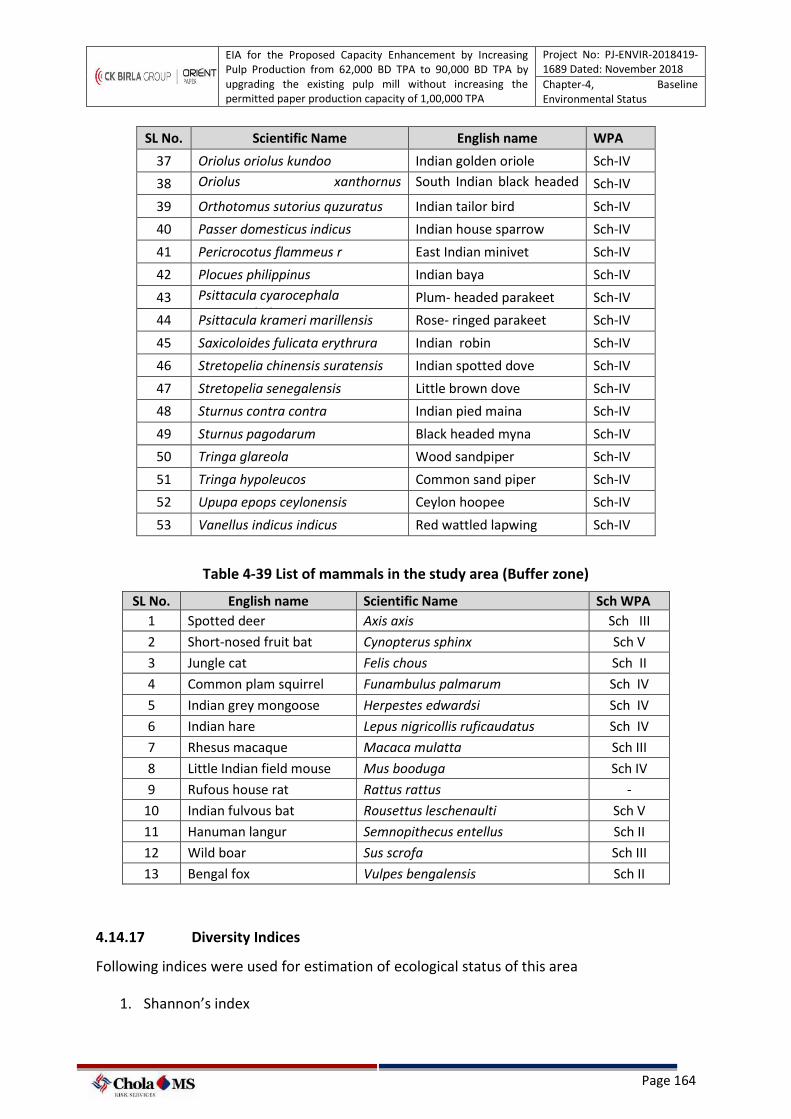
EIA for the Proposed Capacity Enhancement by Increasing Pulp Production from 62,000 BD TPA to 90,000 BD TPA by upgrading the existing pulp mill without increasing the permitted paper production capacity of 1,00,000 TPA
Project No: PJ-ENVIR-2018419-1689 Dated: November 2018
Chapter-4, Baseline Environmental Status
Page 164
SL No. Scientific Name English name WPA
37 Oriolus oriolus kundoo Indian golden oriole Sch-IV
38 Oriolus xanthornus maderaspatanus
South Indian black headed oriole
Sch-IV
39 Orthotomus sutorius quzuratus Indian tailor bird Sch-IV
40 Passer domesticus indicus Indian house sparrow Sch-IV
41 Pericrocotus flammeus r East Indian minivet Sch-IV
42 Plocues philippinus Indian baya Sch-IV
43 Psittacula cyarocephala Cyarocephala
Plum- headed parakeet Sch-IV
44 Psittacula krameri marillensis Rose- ringed parakeet Sch-IV
45 Saxicoloides fulicata erythrura Indian robin Sch-IV
46 Stretopelia chinensis suratensis Indian spotted dove Sch-IV
47 Stretopelia senegalensis Little brown dove Sch-IV
48 Sturnus contra contra Indian pied maina Sch-IV
49 Sturnus pagodarum Black headed myna Sch-IV
50 Tringa glareola Wood sandpiper Sch-IV
51 Tringa hypoleucos Common sand piper Sch-IV
52 Upupa epops ceylonensis Ceylon hoopee Sch-IV
53 Vanellus indicus indicus Red wattled lapwing Sch-IV
Table 4-39 List of mammals in the study area (Buffer zone)
SL No. English name Scientific Name Sch WPA 1 Spotted deer Axis axis Sch III
2 Short-nosed fruit bat Cynopterus sphinx Sch V
3 Jungle cat Felis chous Sch II
4 Common plam squirrel Funambulus palmarum Sch IV
5 Indian grey mongoose Herpestes edwardsi Sch IV
6 Indian hare Lepus nigricollis ruficaudatus Sch IV
7 Rhesus macaque Macaca mulatta Sch III
8 Little Indian field mouse Mus booduga Sch IV
9 Rufous house rat Rattus rattus -
10 Indian fulvous bat Rousettus leschenaulti Sch V
11 Hanuman langur Semnopithecus entellus Sch II
12 Wild boar Sus scrofa Sch III
13 Bengal fox Vulpes bengalensis Sch II
4.14.17 Diversity Indices
Following indices were used for estimation of ecological status of this area
1. Shannon’s index
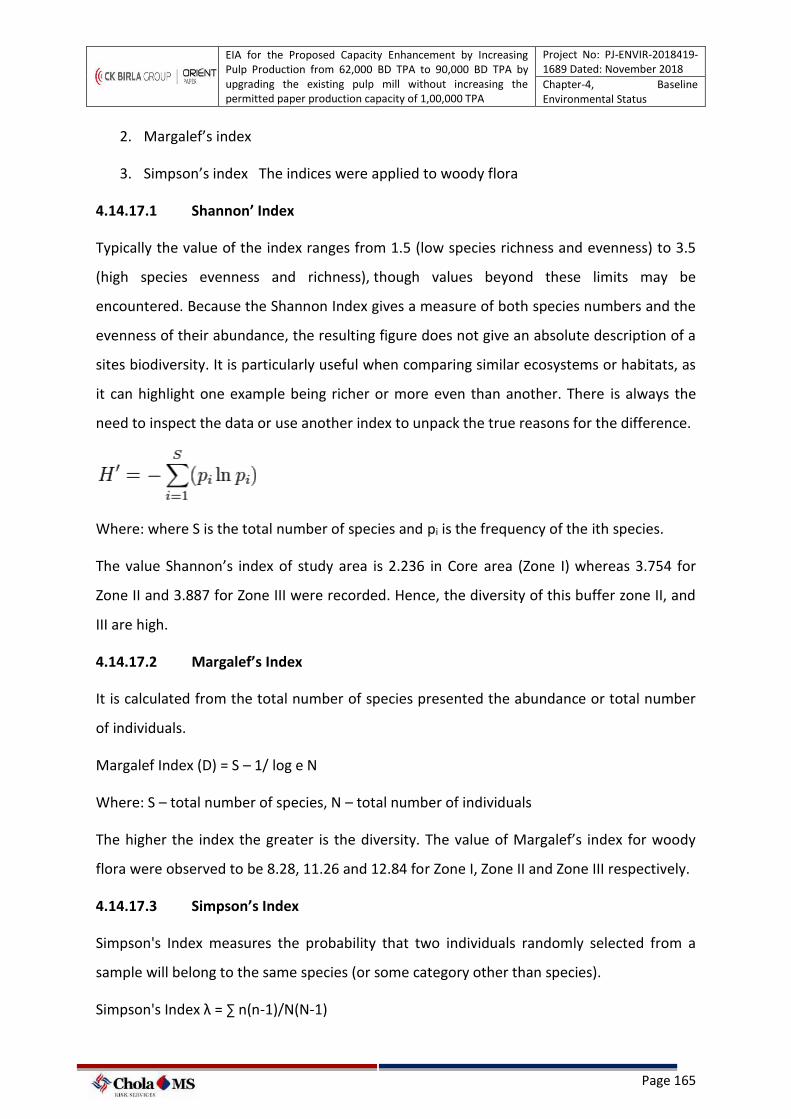
EIA for the Proposed Capacity Enhancement by Increasing Pulp Production from 62,000 BD TPA to 90,000 BD TPA by upgrading the existing pulp mill without increasing the permitted paper production capacity of 1,00,000 TPA
Project No: PJ-ENVIR-2018419-1689 Dated: November 2018
Chapter-4, Baseline Environmental Status
Page 165
2. Margalef’s index
3. Simpson’s index The indices were applied to woody flora
4.14.17.1 Shannon’ Index
Typically the value of the index ranges from 1.5 (low species richness and evenness) to 3.5
(high species evenness and richness), though values beyond these limits may be
encountered. Because the Shannon Index gives a measure of both species numbers and the
evenness of their abundance, the resulting figure does not give an absolute description of a
sites biodiversity. It is particularly useful when comparing similar ecosystems or habitats, as
it can highlight one example being richer or more even than another. There is always the
need to inspect the data or use another index to unpack the true reasons for the difference.
Where: where S is the total number of species and pi is the frequency of the ith species.
The value Shannon’s index of study area is 2.236 in Core area (Zone I) whereas 3.754 for
Zone II and 3.887 for Zone III were recorded. Hence, the diversity of this buffer zone II, and
III are high.
4.14.17.2 Margalef’s Index
It is calculated from the total number of species presented the abundance or total number
of individuals.
Margalef Index (D) = S – 1/ log e N
Where: S – total number of species, N – total number of individuals
The higher the index the greater is the diversity. The value of Margalef’s index for woody
flora were observed to be 8.28, 11.26 and 12.84 for Zone I, Zone II and Zone III respectively.
4.14.17.3 Simpson’s Index
Simpson's Index measures the probability that two individuals randomly selected from a
sample will belong to the same species (or some category other than species).
Simpson's Index λ = ∑ n(n-1)/N(N-1)
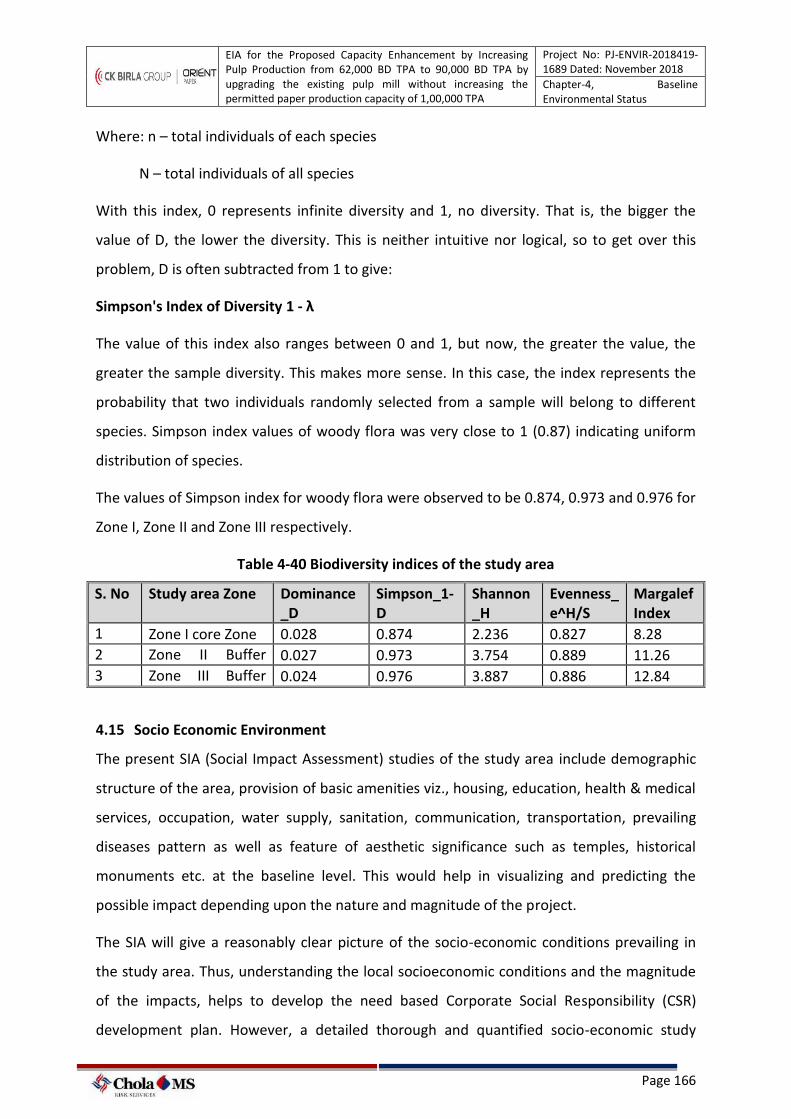
EIA for the Proposed Capacity Enhancement by Increasing Pulp Production from 62,000 BD TPA to 90,000 BD TPA by upgrading the existing pulp mill without increasing the permitted paper production capacity of 1,00,000 TPA
Project No: PJ-ENVIR-2018419-1689 Dated: November 2018
Chapter-4, Baseline Environmental Status
Page 166
Where: n – total individuals of each species
N – total individuals of all species
With this index, 0 represents infinite diversity and 1, no diversity. That is, the bigger the
value of D, the lower the diversity. This is neither intuitive nor logical, so to get over this
problem, D is often subtracted from 1 to give:
Simpson's Index of Diversity 1 - λ
The value of this index also ranges between 0 and 1, but now, the greater the value, the
greater the sample diversity. This makes more sense. In this case, the index represents the
probability that two individuals randomly selected from a sample will belong to different
species. Simpson index values of woody flora was very close to 1 (0.87) indicating uniform
distribution of species.
The values of Simpson index for woody flora were observed to be 0.874, 0.973 and 0.976 for
Zone I, Zone II and Zone III respectively.
Table 4-40 Biodiversity indices of the study area
S. No Study area Zone
Dominance_D
Simpson_1-D
Shannon_H
Evenness_e^H/S
Margalef Index
1 Zone I core Zone 0.028 0.874 2.236 0.827 8.28
2 Zone II Buffer zone
0.027 0.973 3.754 0.889 11.26
3 Zone III Buffer zone
0.024 0.976 3.887 0.886 12.84
4.15 Socio Economic Environment
The present SIA (Social Impact Assessment) studies of the study area include demographic
structure of the area, provision of basic amenities viz., housing, education, health & medical
services, occupation, water supply, sanitation, communication, transportation, prevailing
diseases pattern as well as feature of aesthetic significance such as temples, historical
monuments etc. at the baseline level. This would help in visualizing and predicting the
possible impact depending upon the nature and magnitude of the project.
The SIA will give a reasonably clear picture of the socio-economic conditions prevailing in
the study area. Thus, understanding the local socioeconomic conditions and the magnitude
of the impacts, helps to develop the need based Corporate Social Responsibility (CSR)
development plan. However, a detailed thorough and quantified socio-economic study
EIA for the Proposed Capacity Enhancement by Increasing Pulp Production from 62,000 BD TPA to 90,000 BD TPA by upgrading the existing pulp mill without increasing the permitted paper production capacity of 1,00,000 TPA
Project No: PJ-ENVIR-2018419-1689 Dated: November 2018
Chapter-4, Baseline Environmental Status
Page 167
requires longer time and resources and is, therefore, beyond the scope of the present EIA
study.
4.15.1 Methodology of the Study
For socioeconomic study, both qualitative and quantitative methods were adopted. Data
regarding the field area were collected through secondary sources (published data and
website of directorate of census 2011 for Madhya Pradesh State, and Shahdol district).
Primary sources include data collected through direct field sampling, observations based on
schedules, questionnaires etc. The relevant information was collected through
questionnaires and form filled from the local persons, senior citizen, government officials of
district and official of villages, panchayats etc.
To know the perception of local people on socio-economic impact of paper mill in the area,
a field survey was conducted during summer season of May 2018. The target groups of
villages were selected in 10 km radius of the Orient Paper Mill, village Bargawan, Sub District
Sohagpur, Dist Shahdol (M.P).
Participatory Rural Appraisal (PRA) techniques were used in the field along with household
level interviews undertaken with family members to study the socio-economic profile. For
individual farmers and community members, qualitative interviews were done to have in-
depth investigation. It also allows people to speak for themselves without their answers
being biased by predetermined hypothesis-based questions. The questionnaire was basically
focused to gather respondent’s views from the study areas on the impacts of paper mill
industry.
Study Area
The project area is defined as 10 km radius of the periphery of the Orient Paper Mill
boundary. About 24 villages and a town area covering under this project area. The socio-
economic parameters i.e. population growth, density, literacy etc. plays important role in
determining the existing socioeconomic status and impact of the proposed activity directly
or indirectly on the human population. These impacts may be beneficial or detrimental. The
project area falls in Sohagpur Tehsil of Shahdol district in Madhya Pradesh State. Table 4.41-
shows the administrative structure of the project area.
EIA for the Proposed Capacity Enhancement by Increasing Pulp Production from 62,000 BD TPA to 90,000 BD TPA by upgrading the existing pulp mill without increasing the permitted paper production capacity of 1,00,000 TPA
Project No: PJ-ENVIR-2018419-1689 Dated: November 2018
Chapter-4, Baseline Environmental Status
Page 168
Table 4-41 Administrative Status of Project Area Villages/Towns
S.No State District Taluk No of Villages Town Total
1 Madhya Pradesh
Shahdol Sohagpur 24 1 25
Total 24 1 25 Source: Census 2011
Figure 4-66 Google Earth Image of the Project Site showing villages in the 10 km radius
4.15.2 Socio Economic Survey
For the purpose of this study, socioeconomic indicators such as demography, literacy,
health, livelihood, amenities and cultural aspects were collected from the secondary data
such as population and amenities obtained from Directorate of Census Operations, Planning
EIA for the Proposed Capacity Enhancement by Increasing Pulp Production from 62,000 BD TPA to 90,000 BD TPA by upgrading the existing pulp mill without increasing the permitted paper production capacity of 1,00,000 TPA
Project No: PJ-ENVIR-2018419-1689 Dated: November 2018
Chapter-4, Baseline Environmental Status
Page 169
Commission, Institutional Birth rate from district level survey report 2015-16 etc.
Households under Poverty line and Households availing safe sanitation details are collected.
4.15.3 Primary Survey
Primary Survey was conducted from 03rd to 08th May 2018. During this survey, primary data
for geographical features, settlements, roads and amenities in the respective villages were
observed. In addition to the site observations, focused group discussion along with primary
survey was conducted in the villages falling within 10 km radius of the project site. The
discussion was mainly focused on mapping the existing amenities in the respective villages,
felt basic needs, problems if any due to the existing project operation. The discussion was
carried out with the village representatives, farmers, etc who have good knowledge about
the village and happenings.
Figure 4-67 Socio Economic Survey Photographs interacting with villagers /panchyat member, Aaganwadi center
Discussion with villagers at Karkati village Discussion with villagers at Jarwahi village
Discussion with Villagers at Jarwahi village
EIA for the Proposed Capacity Enhancement by Increasing Pulp Production from 62,000 BD TPA to 90,000 BD TPA by upgrading the existing pulp mill without increasing the permitted paper production capacity of 1,00,000 TPA
Project No: PJ-ENVIR-2018419-1689 Dated: November 2018
Chapter-4, Baseline Environmental Status
Page 170
Discussion at Chaka Village Discussion at Kelmaniya Village
Discussion at Dhanpuri Village Discussion with villagers at Madiyaras village
Discussion with women at Batura village Discussion with villagers at Deori village
EIA for the Proposed Capacity Enhancement by Increasing Pulp Production from 62,000 BD TPA to 90,000 BD TPA by upgrading the existing pulp mill without increasing the permitted paper production capacity of 1,00,000 TPA
Project No: PJ-ENVIR-2018419-1689 Dated: November 2018
Chapter-4, Baseline Environmental Status
Page 171
Discussion with villagers at Samda village Discussion with villagers at Bargawan village
Discussion with villagers at Devhara village Interaction with villagers at Chachai villages
Discussion at Devhara village Interaction with villagers at Mediyaras village
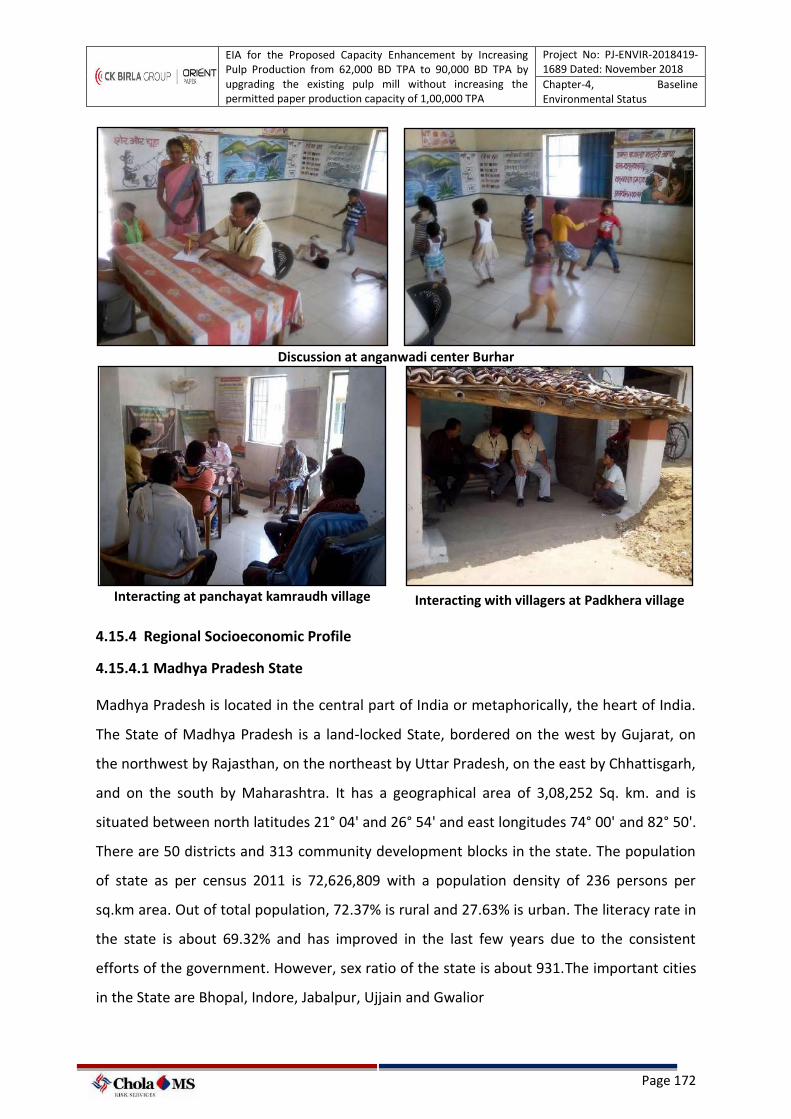
EIA for the Proposed Capacity Enhancement by Increasing Pulp Production from 62,000 BD TPA to 90,000 BD TPA by upgrading the existing pulp mill without increasing the permitted paper production capacity of 1,00,000 TPA
Project No: PJ-ENVIR-2018419-1689 Dated: November 2018
Chapter-4, Baseline Environmental Status
Page 172
Discussion at anganwadi center Burhar
Interacting at panchayat kamraudh village Interacting with villagers at Padkhera village
4.15.4 Regional Socioeconomic Profile
4.15.4.1 Madhya Pradesh State
Madhya Pradesh is located in the central part of India or metaphorically, the heart of India.
The State of Madhya Pradesh is a land-locked State, bordered on the west by Gujarat, on
the northwest by Rajasthan, on the northeast by Uttar Pradesh, on the east by Chhattisgarh,
and on the south by Maharashtra. It has a geographical area of 3,08,252 Sq. km. and is
situated between north latitudes 21° 04' and 26° 54' and east longitudes 74° 00' and 82° 50'.
There are 50 districts and 313 community development blocks in the state. The population
of state as per census 2011 is 72,626,809 with a population density of 236 persons per
sq.km area. Out of total population, 72.37% is rural and 27.63% is urban. The literacy rate in
the state is about 69.32% and has improved in the last few years due to the consistent
efforts of the government. However, sex ratio of the state is about 931.The important cities
in the State are Bhopal, Indore, Jabalpur, Ujjain and Gwalior
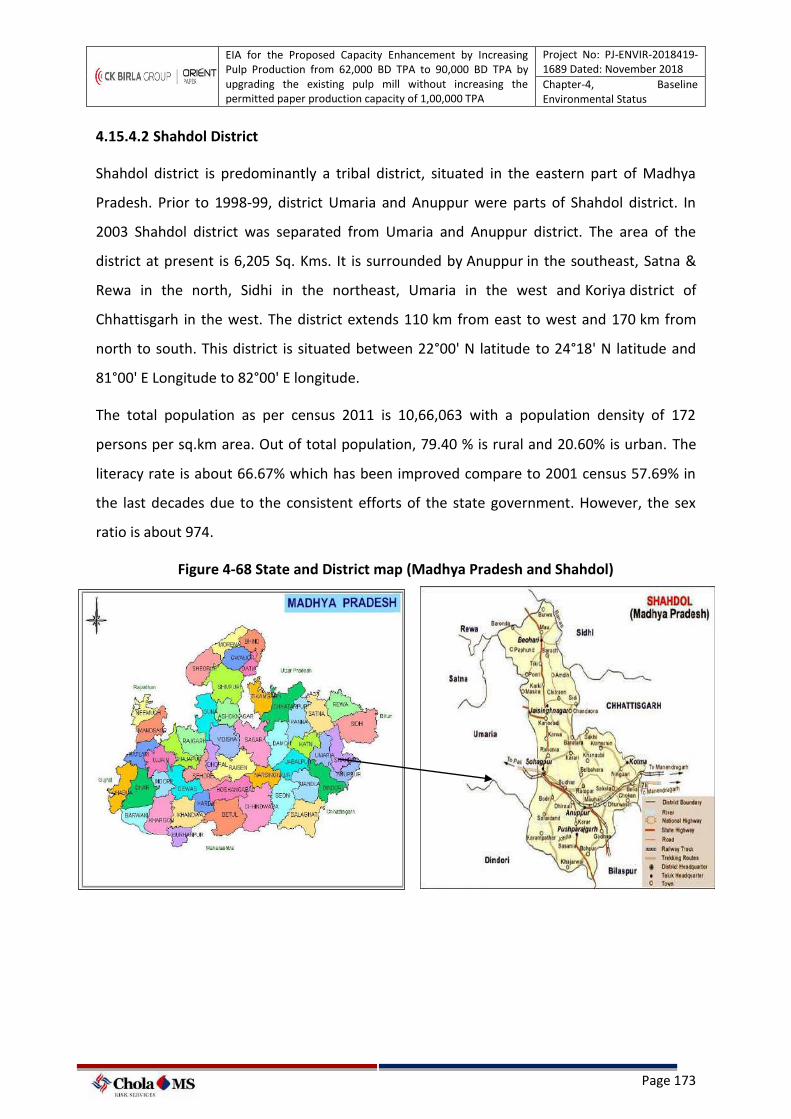
EIA for the Proposed Capacity Enhancement by Increasing Pulp Production from 62,000 BD TPA to 90,000 BD TPA by upgrading the existing pulp mill without increasing the permitted paper production capacity of 1,00,000 TPA
Project No: PJ-ENVIR-2018419-1689 Dated: November 2018
Chapter-4, Baseline Environmental Status
Page 173
4.15.4.2 Shahdol District
Shahdol district is predominantly a tribal district, situated in the eastern part of Madhya
Pradesh. Prior to 1998-99, district Umaria and Anuppur were parts of Shahdol district. In
2003 Shahdol district was separated from Umaria and Anuppur district. The area of the
district at present is 6,205 Sq. Kms. It is surrounded by Anuppur in the southeast, Satna &
Rewa in the north, Sidhi in the northeast, Umaria in the west and Koriya district of
Chhattisgarh in the west. The district extends 110 km from east to west and 170 km from
north to south. This district is situated between 22°00' N latitude to 24°18' N latitude and
81°00' E Longitude to 82°00' E longitude.
The total population as per census 2011 is 10,66,063 with a population density of 172
persons per sq.km area. Out of total population, 79.40 % is rural and 20.60% is urban. The
literacy rate is about 66.67% which has been improved compare to 2001 census 57.69% in
the last decades due to the consistent efforts of the state government. However, the sex
ratio is about 974.
Figure 4-68 State and District map (Madhya Pradesh and Shahdol)
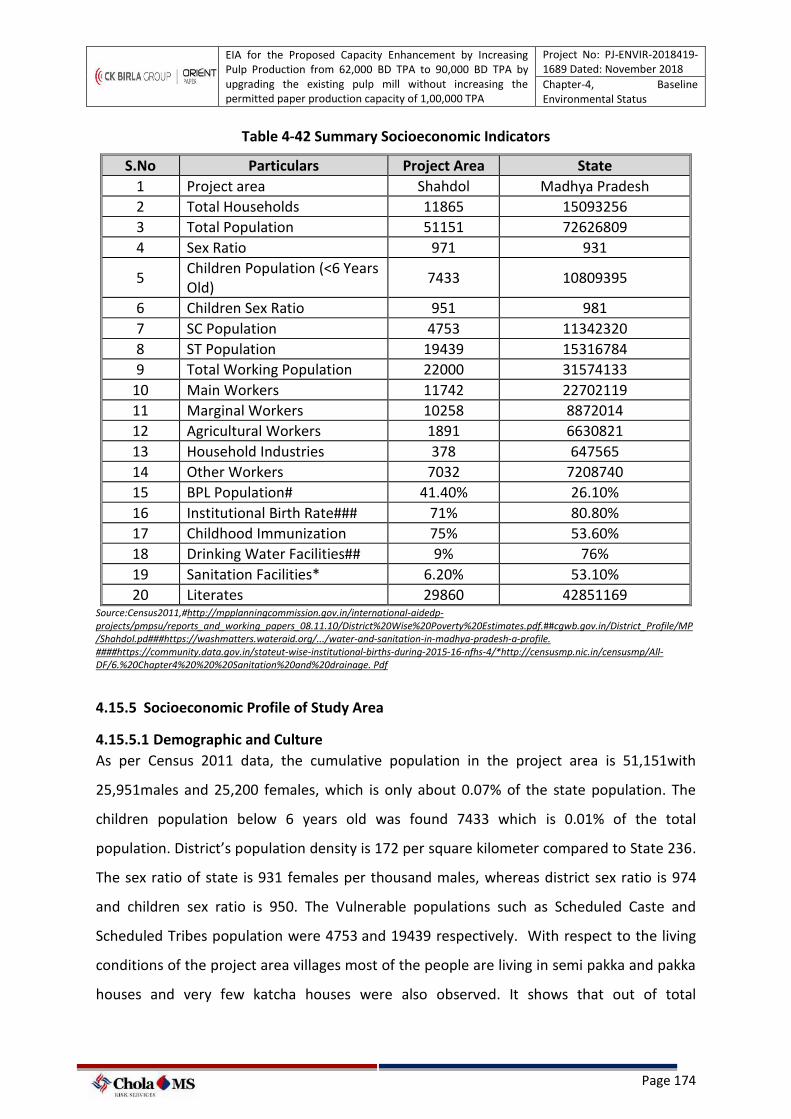
EIA for the Proposed Capacity Enhancement by Increasing Pulp Production from 62,000 BD TPA to 90,000 BD TPA by upgrading the existing pulp mill without increasing the permitted paper production capacity of 1,00,000 TPA
Project No: PJ-ENVIR-2018419-1689 Dated: November 2018
Chapter-4, Baseline Environmental Status
Page 174
Table 4-42 Summary Socioeconomic Indicators
S.No Particulars Project Area State
1 Project area Shahdol Madhya Pradesh
2 Total Households 11865 15093256
3 Total Population 51151 72626809
4 Sex Ratio 971 931
5 Children Population (<6 Years Old)
7433 10809395
6 Children Sex Ratio 951 981
7 SC Population 4753 11342320
8 ST Population 19439 15316784
9 Total Working Population 22000 31574133
10 Main Workers 11742 22702119
11 Marginal Workers 10258 8872014
12 Agricultural Workers 1891 6630821
13 Household Industries 378 647565
14 Other Workers 7032 7208740
15 BPL Population# 41.40% 26.10%
16 Institutional Birth Rate### 71% 80.80%
17 Childhood Immunization 75% 53.60%
18 Drinking Water Facilities## 9% 76%
19 Sanitation Facilities* 6.20% 53.10%
20 Literates 29860 42851169 Source:Census2011,#http://mpplanningcommission.gov.in/international-aidedp-projects/pmpsu/reports_and_working_papers_08.11.10/District%20Wise%20Poverty%20Estimates.pdf.##cgwb.gov.in/District_Profile/MP/Shahdol.pd###https://washmatters.wateraid.org/.../water-and-sanitation-in-madhya-pradesh-a-profile. ####https://community.data.gov.in/stateut-wise-institutional-births-during-2015-16-nfhs-4/*http://censusmp.nic.in/censusmp/All-DF/6.%20Chapter4%20%20%20Sanitation%20and%20drainage. Pdf
4.15.5 Socioeconomic Profile of Study Area
4.15.5.1 Demographic and Culture
As per Census 2011 data, the cumulative population in the project area is 51,151with
25,951males and 25,200 females, which is only about 0.07% of the state population. The
children population below 6 years old was found 7433 which is 0.01% of the total
population. District’s population density is 172 per square kilometer compared to State 236.
The sex ratio of state is 931 females per thousand males, whereas district sex ratio is 974
and children sex ratio is 950. The Vulnerable populations such as Scheduled Caste and
Scheduled Tribes population were 4753 and 19439 respectively. With respect to the living
conditions of the project area villages most of the people are living in semi pakka and pakka
houses and very few katcha houses were also observed. It shows that out of total
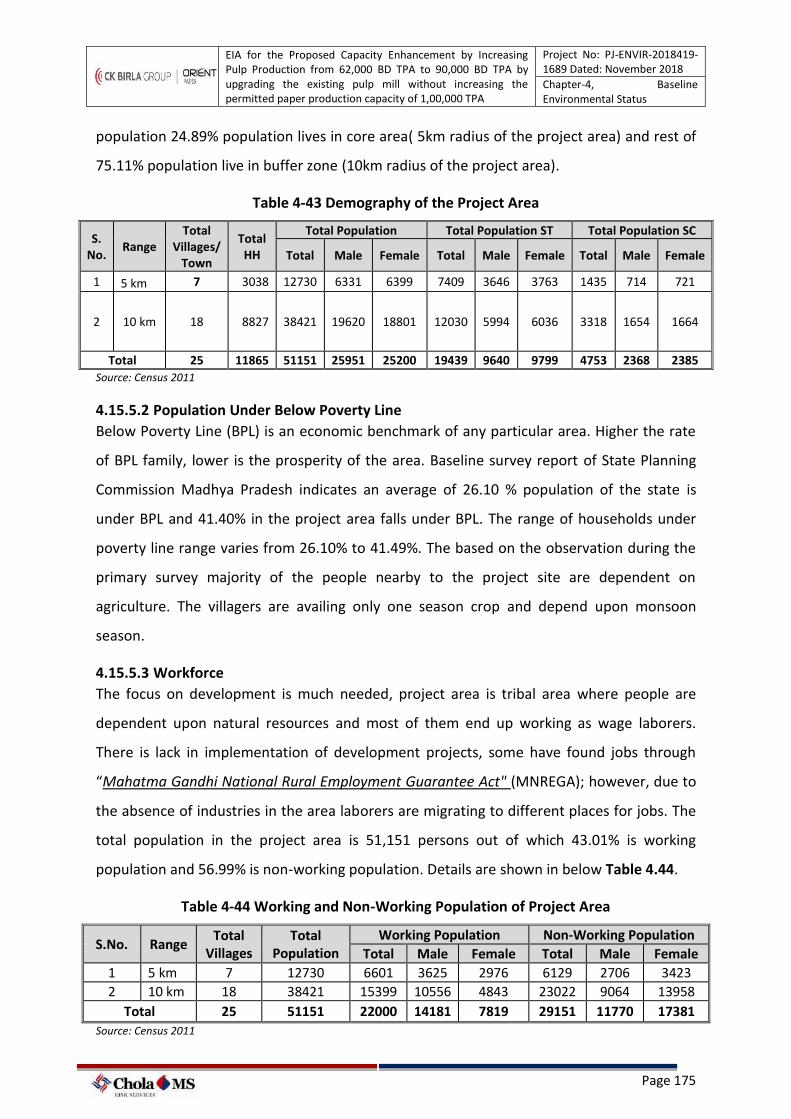
EIA for the Proposed Capacity Enhancement by Increasing Pulp Production from 62,000 BD TPA to 90,000 BD TPA by upgrading the existing pulp mill without increasing the permitted paper production capacity of 1,00,000 TPA
Project No: PJ-ENVIR-2018419-1689 Dated: November 2018
Chapter-4, Baseline Environmental Status
Page 175
population 24.89% population lives in core area( 5km radius of the project area) and rest of
75.11% population live in buffer zone (10km radius of the project area).
Table 4-43 Demography of the Project Area
S. No.
Range Total
Villages/ Town
Total HH
Total Population Total Population ST Total Population SC
Total Male Female Total Male Female Total Male Female
1 5 km 7 3038 12730 6331 6399 7409 3646 3763 1435 714 721
2 10 km 18 8827 38421 19620 18801 12030 5994 6036 3318 1654 1664
Total 25 11865 51151 25951 25200 19439 9640 9799 4753 2368 2385
Source: Census 2011
4.15.5.2 Population Under Below Poverty Line
Below Poverty Line (BPL) is an economic benchmark of any particular area. Higher the rate
of BPL family, lower is the prosperity of the area. Baseline survey report of State Planning
Commission Madhya Pradesh indicates an average of 26.10 % population of the state is
under BPL and 41.40% in the project area falls under BPL. The range of households under
poverty line range varies from 26.10% to 41.49%. The based on the observation during the
primary survey majority of the people nearby to the project site are dependent on
agriculture. The villagers are availing only one season crop and depend upon monsoon
season.
4.15.5.3 Workforce
The focus on development is much needed, project area is tribal area where people are
dependent upon natural resources and most of them end up working as wage laborers.
There is lack in implementation of development projects, some have found jobs through
“Mahatma Gandhi National Rural Employment Guarantee Act" (MNREGA); however, due to
the absence of industries in the area laborers are migrating to different places for jobs. The
total population in the project area is 51,151 persons out of which 43.01% is working
population and 56.99% is non-working population. Details are shown in below Table 4.44.
Table 4-44 Working and Non-Working Population of Project Area
S.No. Range Total
Villages Total
Population Working Population Non-Working Population
Total Male Female Total Male Female 1 5 km 7 12730 6601 3625 2976 6129 2706 3423 2 10 km 18 38421 15399 10556 4843 23022 9064 13958
Total 25 51151 22000 14181 7819 29151 11770 17381 Source: Census 2011

EIA for the Proposed Capacity Enhancement by Increasing Pulp Production from 62,000 BD TPA to 90,000 BD TPA by upgrading the existing pulp mill without increasing the permitted paper production capacity of 1,00,000 TPA
Project No: PJ-ENVIR-2018419-1689 Dated: November 2018
Chapter-4, Baseline Environmental Status
Page 176
4.15.5.4 Occupational Structure
Occupational structure shows the nature and status of employment activities in the area.
The area around the project site is a tribal belt and very backward in the field of agriculture.
Farmers prefer the cultivation in the old and traditional method. The sizes of the fields are
very small. The yearly yield of the products from the field is mostly used for self-
consumption. During the non-harvesting period, farmers work on daily wages. Other source
of income for tribal area people are mahua fruit, wood & seeds. For their livelihood they
trade in agricultural and forest produce also. The climate varies with temperature of 26oC
and 46oC.The farmers are able to obtain only one season crop dependent upon monsoon.
Out of the total population, 26% population is working which is further grouped in eight-fold
classification and the main occupation of people in this area is categorized as service
provider. Out of which 3% are cultivators, 2% are marginal cultivators and 12% are engaged
as agriculture labor.
Table 4-45 Occupational Structure in Project Area
S.No. Range No. of
Villages POP WP MC MA MH MO MGC MGA MGH MGO
1 5 km 7 12730 6405 725 439 26 531 590 3158 40 896
2 10 km 18 38421 14915 1716 772 352 6501 542 3706 116 1210
Total 25 51151 22000 2441 1211 378 7032 1132 6864 156 2106
Source: Census 2011 WP – Working Population, MC- Main Cultivator, MA- Main Agriculture Labor, MH- Main Household Workers, MO- Main Other Workers, MGC- Marginal Cultivator, MGA- Marginal Agriculture Labor, MGH- Marginal Household workers, MGO- Marginal Other Workers.
Figure 4-69 Occupational Structure of the Project Area
Source: Census 2011- WP – Working Population, MC- Main Cultivator, MA- Main Agriculture Labor, MH- Main Household Workers, MO- Main Other Workers, MGC- Marginal Cultivator, MGA- Marginal Agriculture Labor, MGH- Marginal Household workers, MGO- Marginal Other Workers.
WP MC MA MH MO MGC MGA MGH MGO
50%
11%7%
0%
8% 9%
49%
1%
14%
39%
12%
5%2%
44%
4%
25%
1%
8%
5 km 10 km
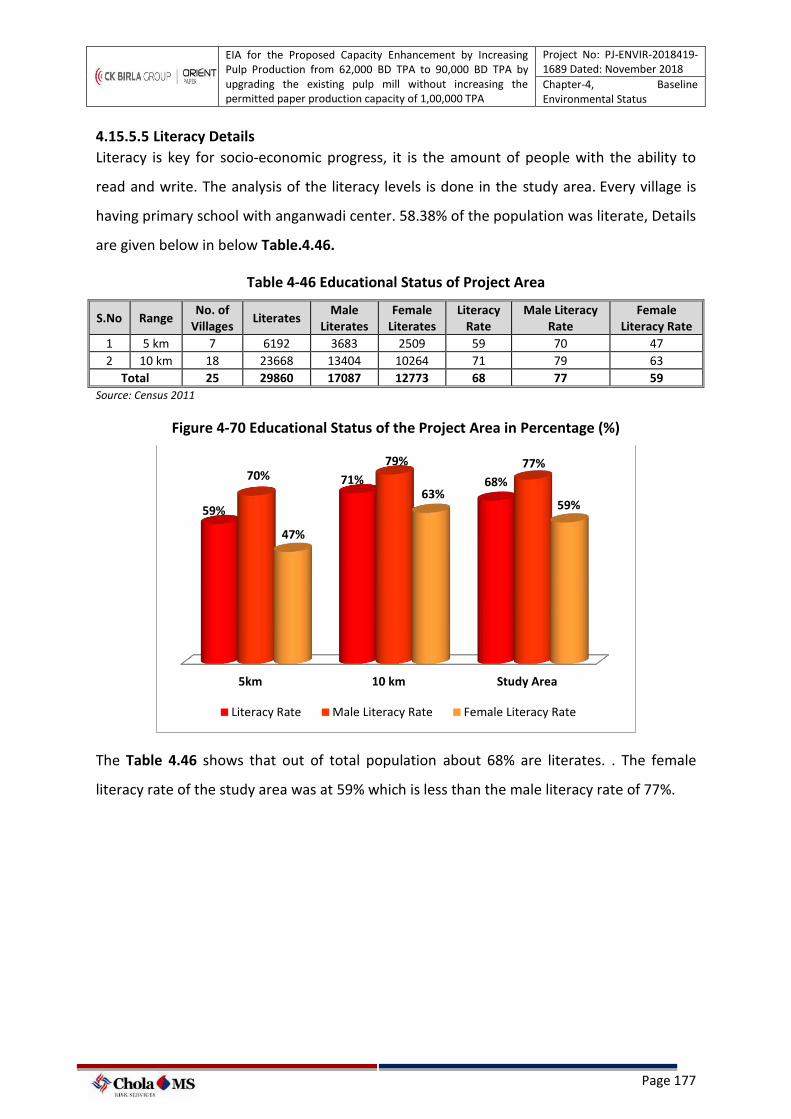
EIA for the Proposed Capacity Enhancement by Increasing Pulp Production from 62,000 BD TPA to 90,000 BD TPA by upgrading the existing pulp mill without increasing the permitted paper production capacity of 1,00,000 TPA
Project No: PJ-ENVIR-2018419-1689 Dated: November 2018
Chapter-4, Baseline Environmental Status
Page 177
4.15.5.5 Literacy Details
Literacy is key for socio-economic progress, it is the amount of people with the ability to
read and write. The analysis of the literacy levels is done in the study area. Every village is
having primary school with anganwadi center. 58.38% of the population was literate, Details
are given below in below Table.4.46.
Table 4-46 Educational Status of Project Area
S.No Range No. of
Villages Literates
Male Literates
Female Literates
Literacy Rate
Male Literacy Rate
Female Literacy Rate
1 5 km 7 6192 3683 2509 59 70 47
2 10 km 18 23668 13404 10264 71 79 63
Total 25 29860 17087 12773 68 77 59
Source: Census 2011
Figure 4-70 Educational Status of the Project Area in Percentage (%)
The Table 4.46 shows that out of total population about 68% are literates. . The female
literacy rate of the study area was at 59% which is less than the male literacy rate of 77%.
5km 10 km Study Area
59%
71% 68%70%79% 77%
47%
63%59%
Literacy Rate Male Literacy Rate Female Literacy Rate
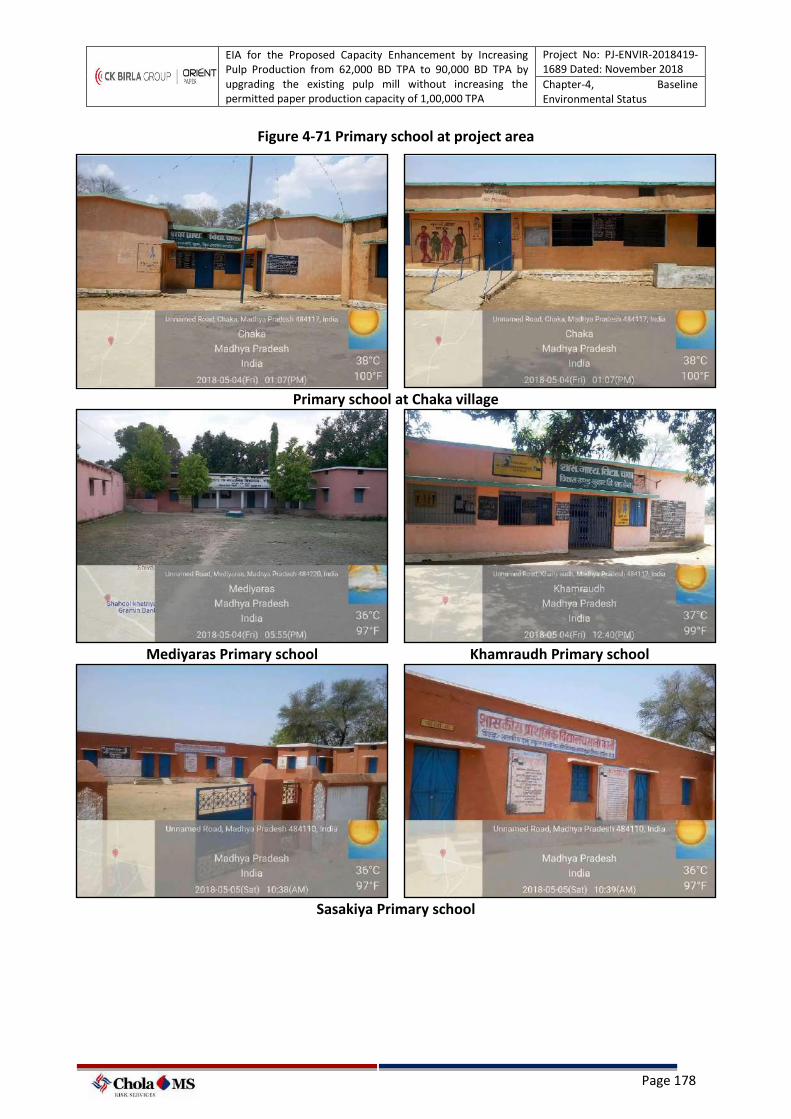
EIA for the Proposed Capacity Enhancement by Increasing Pulp Production from 62,000 BD TPA to 90,000 BD TPA by upgrading the existing pulp mill without increasing the permitted paper production capacity of 1,00,000 TPA
Project No: PJ-ENVIR-2018419-1689 Dated: November 2018
Chapter-4, Baseline Environmental Status
Page 178
Figure 4-71 Primary school at project area
Primary school at Chaka village
Mediyaras Primary school Khamraudh Primary school
Sasakiya Primary school
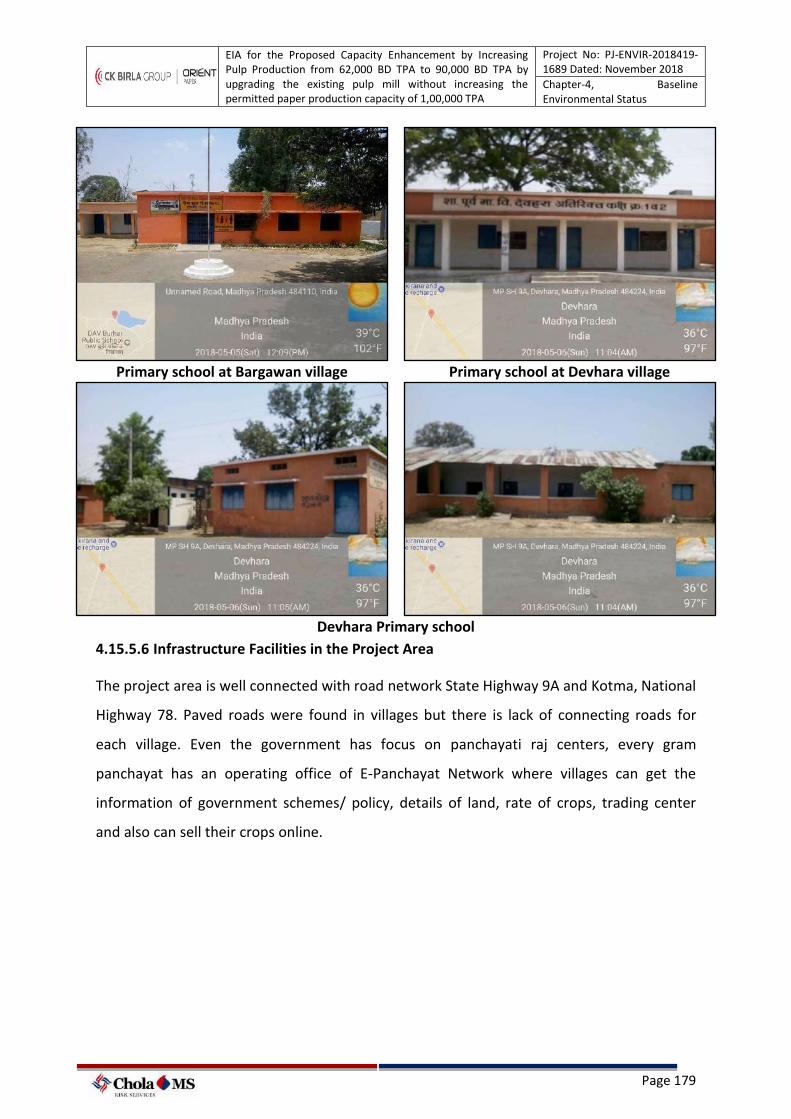
EIA for the Proposed Capacity Enhancement by Increasing Pulp Production from 62,000 BD TPA to 90,000 BD TPA by upgrading the existing pulp mill without increasing the permitted paper production capacity of 1,00,000 TPA
Project No: PJ-ENVIR-2018419-1689 Dated: November 2018
Chapter-4, Baseline Environmental Status
Page 179
Primary school at Bargawan village Primary school at Devhara village
Devhara Primary school
4.15.5.6 Infrastructure Facilities in the Project Area
The project area is well connected with road network State Highway 9A and Kotma, National
Highway 78. Paved roads were found in villages but there is lack of connecting roads for
each village. Even the government has focus on panchayati raj centers, every gram
panchayat has an operating office of E-Panchayat Network where villages can get the
information of government schemes/ policy, details of land, rate of crops, trading center
and also can sell their crops online.
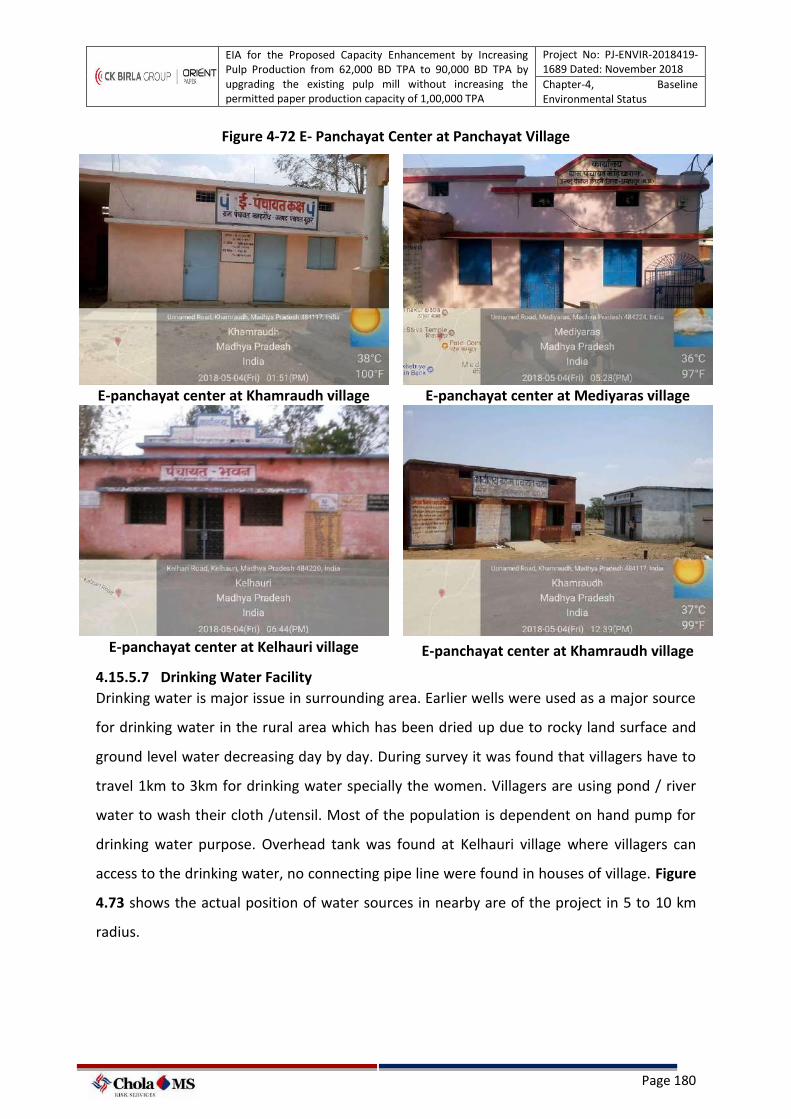
EIA for the Proposed Capacity Enhancement by Increasing Pulp Production from 62,000 BD TPA to 90,000 BD TPA by upgrading the existing pulp mill without increasing the permitted paper production capacity of 1,00,000 TPA
Project No: PJ-ENVIR-2018419-1689 Dated: November 2018
Chapter-4, Baseline Environmental Status
Page 180
Figure 4-72 E- Panchayat Center at Panchayat Village
E-panchayat center at Khamraudh village E-panchayat center at Mediyaras village
E-panchayat center at Kelhauri village E-panchayat center at Khamraudh village
4.15.5.7 Drinking Water Facility
Drinking water is major issue in surrounding area. Earlier wells were used as a major source
for drinking water in the rural area which has been dried up due to rocky land surface and
ground level water decreasing day by day. During survey it was found that villagers have to
travel 1km to 3km for drinking water specially the women. Villagers are using pond / river
water to wash their cloth /utensil. Most of the population is dependent on hand pump for
drinking water purpose. Overhead tank was found at Kelhauri village where villagers can
access to the drinking water, no connecting pipe line were found in houses of village. Figure
4.73 shows the actual position of water sources in nearby are of the project in 5 to 10 km
radius.
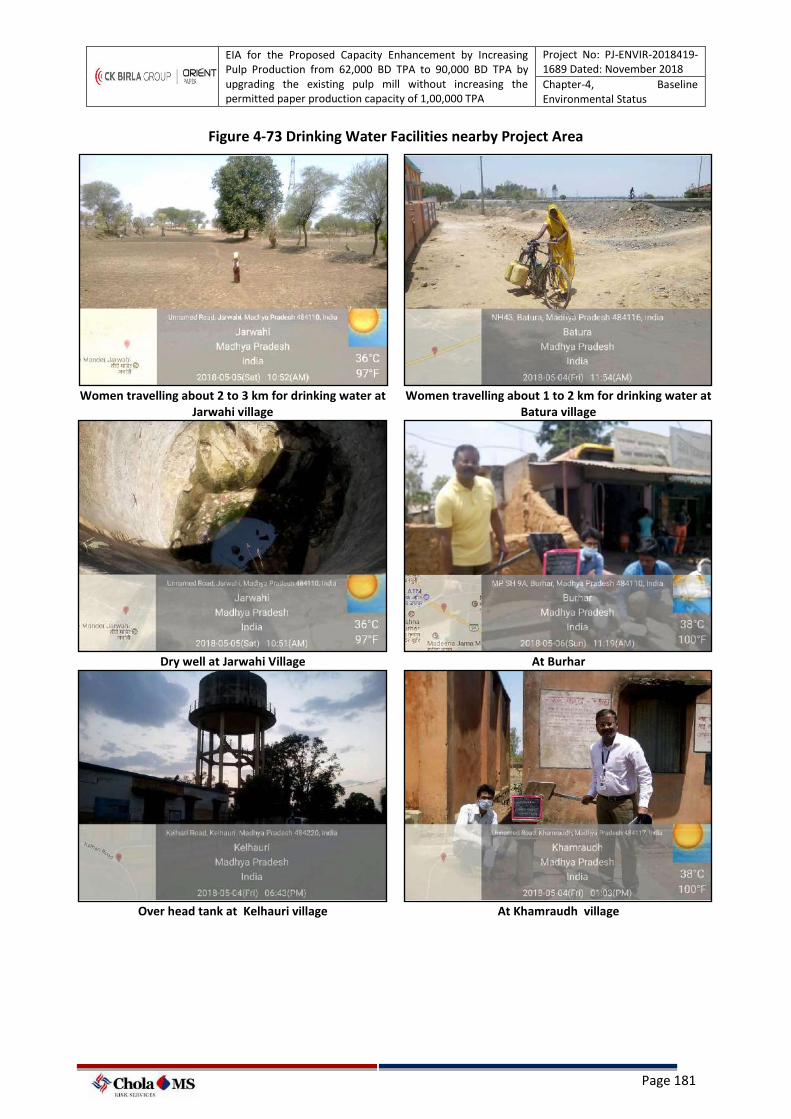
EIA for the Proposed Capacity Enhancement by Increasing Pulp Production from 62,000 BD TPA to 90,000 BD TPA by upgrading the existing pulp mill without increasing the permitted paper production capacity of 1,00,000 TPA
Project No: PJ-ENVIR-2018419-1689 Dated: November 2018
Chapter-4, Baseline Environmental Status
Page 181
Figure 4-73 Drinking Water Facilities nearby Project Area
Women travelling about 2 to 3 km for drinking water at
Jarwahi village Women travelling about 1 to 2 km for drinking water at
Batura village
Dry well at Jarwahi Village At Burhar
Over head tank at Kelhauri village At Khamraudh village
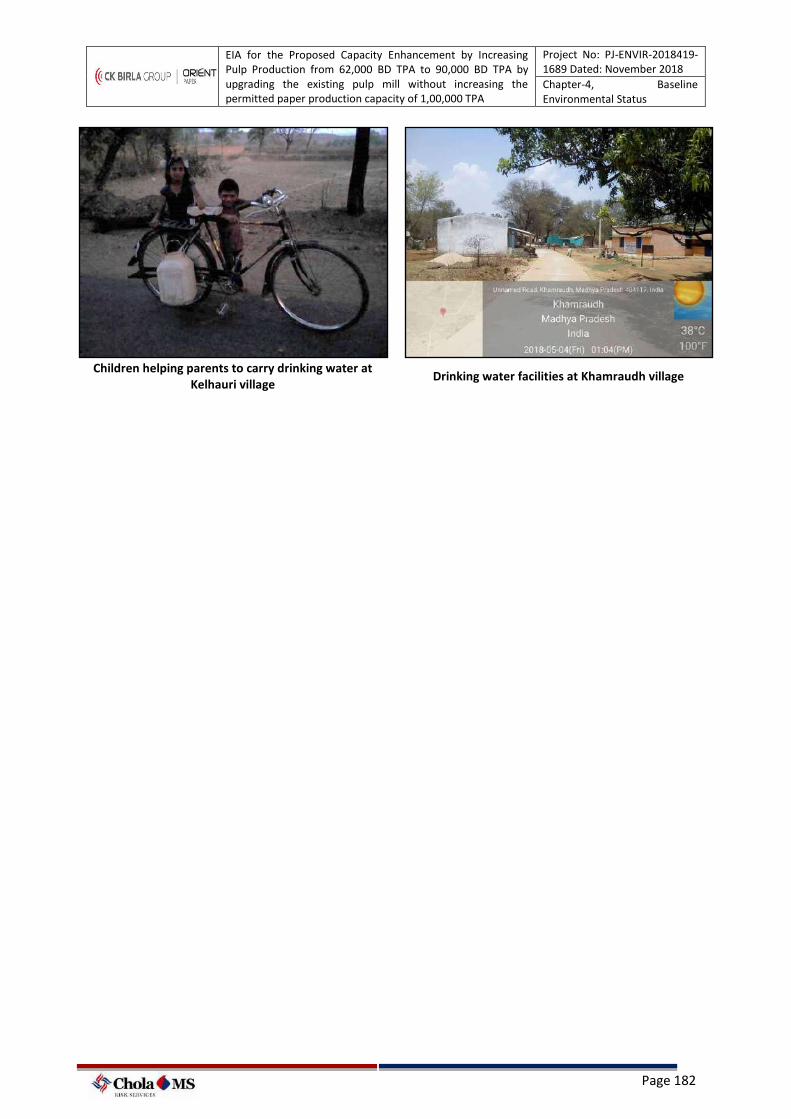
EIA for the Proposed Capacity Enhancement by Increasing Pulp Production from 62,000 BD TPA to 90,000 BD TPA by upgrading the existing pulp mill without increasing the permitted paper production capacity of 1,00,000 TPA
Project No: PJ-ENVIR-2018419-1689 Dated: November 2018
Chapter-4, Baseline Environmental Status
Page 182
Children helping parents to carry drinking water at
Kelhauri village Drinking water facilities at Khamraudh village
EIA for the Proposed Capacity Enhancement by Increasing Pulp Production from 62,000 BD TPA to 90,000 BD TPA by upgrading the existing pulp mill without increasing the permitted paper production capacity of 1,00,000 TPA
PJ-ENVIR-2017830-1366 Dated: November 2018
Chapter-5 Assessment of Impacts and Mitigation Measures
Page 183
5 Assessment of Impacts and Mitigation Measures
5.1 General
As indicated in Chapter-3 of the EIA report, the proposed project involves capacity
enhancement of pulp production by replacing the existing elemental chlorine-based
bleaching with ECF (Elemental Chlorine Free) bleaching without increasing the total
consented paper production.
In this section, the impacts (positive and negative) of the proposed project on the
environment and the respective mitigation measures are explained.
The detailed effects on environment and its mitigation measures during construction and
operation phase of the proposed project are presented in this chapter.
5.2 Impacts and Mitigation Measures during Construction Stage
No additional units such re-causticizing plant, co-generation plant is being envisaged to
install for increasing the pulp production throughput as the existing facilities are adequate
for the proposed additional pulp production. Black liquor Evaporation capacity will be
increased accordingly. The chemical recovery boiler will be retrofitted. No demolition works
will be undertaken.
The existing bleaching sequence will be replaced with ECF bleaching sequence and hence
requires very minimal construction activities for a shorter duration of time. The facility will
comply with the Construction and Demolition Waste Management Rules, 2016 as notified
by the Ministry of Environment, Forests and Climate Change (MoEF&CC) which states that
every waste generator shall segregate construction and deposit at collection centre or
handover it to the authorized processing facilities and shall ensure that there is no littering
or deposition so as to prevent obstruction to the traffic or the public or drains.
5.2.1 Land Use
No additional land is required as the proposed project includes only up-gradation of existing
pulp mill and enhancement of in-house pulp production. No adverse impact on the land use
is envisaged due to the proposed project. As the construction activities for the capacity
enhancement will not necessitate any land acquisition, Rehabilitation and Resettlement
(R&R) issues are not applicable.
EIA for the Proposed Capacity Enhancement by Increasing Pulp Production from 62,000 BD TPA to 90,000 BD TPA by upgrading the existing pulp mill without increasing the permitted paper production capacity of 1,00,000 TPA
PJ-ENVIR-2017830-1366 Dated: November 2018
Chapter-5 Assessment of Impacts and Mitigation Measures
Page 184
5.2.2 Air Quality
The sources of emissions during the construction period are mainly from the movement of
equipment at the construction site and dust emissions from erection which are likely to be
affected only for a shorter period of time. The proposed capacity enhancement project
includes very minimal construction activities as the existing pulp mill is already adequate for
additional pulp production except some addition of Black liquor Evaporation capacity
(balancing equipment). No demolition works will be undertaken. Therefore, impact on air
quality due to the constructional activities of the proposed project will be insignificant.
5.2.3 Noise Levels
No major noise generating sources will be envisaged during the construction phase of the
proposed capacity enhancement project as there are no major construction activities
associated. However, as per best practice, all the noise generating activities (if any) shall be
undertaken during day hours and enclosure shall be provided wherever applicable to further
minimize noise pollution. Also, OPM has developed massive green belt/plantation
constituting to about 43% of the total land area, which will help to attenuate any noise
levels generated at the facility during any construction. Overall, the impact of noise due to
construction on the environment is likely to be insignificant, reversible, localized in nature
and mainly confined to the day hours.
5.2.4 Water Quality
Water requirement for construction activities will be minimal as no major construction
activities are envisaged due to the proposed capacity enhancement project. About 100 no of
temporary contract workers are expected to be involved in construction phase. All the
workers will be made available from the nearby areas and hence no labour camps will be
established. Existing sanitation arrangements are adequate. No sewage/wastewater will be
discharged outside the mill premises. Any additional wastewater generated during the
construction phase, will be treated in the existing effluent treatment plant.
5.2.5 Terrestrial Ecology
The construction phase of the proposed project does not involve major changes in the
terrain. Impacts on flora during construction period are envisaged only in close vicinity of
EIA for the Proposed Capacity Enhancement by Increasing Pulp Production from 62,000 BD TPA to 90,000 BD TPA by upgrading the existing pulp mill without increasing the permitted paper production capacity of 1,00,000 TPA
PJ-ENVIR-2017830-1366 Dated: November 2018
Chapter-5 Assessment of Impacts and Mitigation Measures
Page 185
proposed development due to vehicular movements. However, OPM has developed green
cover around the periphery of the plant which will act as buffer zone and will help in
mitigating impacts on ecology in vicinity.
5.2.6 Socio-Economic
Rehabilitation and resettlement activities are not applicable for the proposed project site
since the capacity enhancement will be in the existing plant premises. During construction
phase of the project (addition of balancing equipment), this project will provide
employment to contract workers of about 100 people.
5.3 Impacts and Mitigation Measures during Operation Phase
5.3.1 Overview
The plant is already having adequate pulp mill capacity to increase the pulp production
throughput from 62,000 BD TPA to 90,000 BD TPA. However, the existing pulp mill will be
upgraded by adopting Elemental Chlorine Free (ECF) Bleaching Technology with addition of
balancing equipment.
The positive and negative impacts due to the proposed capacity enhancement project is
summarized in this section w.r.t various environmental attributes.
The following environmental aspects have been addressed under this section;
• Emissions due to additional solids firing in the chemical recovery boiler and lime kiln.
• Release of NCG gases from the proposed additional pulp production
• Reduction in freshwater consumption, wastewater generation and COD load on the
ETP.
• Additional vehicular traffic volumes on the road (if any) and adequacy of the public
roads
• Additional solid and hazardous waste generation (if any) and impacts due to safe
disposal
• Impact on ecological and biological environment, if any
• Socio-economic aspects
EIA for the Proposed Capacity Enhancement by Increasing Pulp Production from 62,000 BD TPA to 90,000 BD TPA by upgrading the existing pulp mill without increasing the permitted paper production capacity of 1,00,000 TPA
PJ-ENVIR-2017830-1366 Dated: November 2018
Chapter-5 Assessment of Impacts and Mitigation Measures
Page 186
5.3.2 Impact on Land Use
The proposed project will be undertaken within the plant premises, hence, there will not be
any change in the land use pattern in the study area. Since the proposed project involves
only increase in the pulp production throughput of the existing pulp mill, no additional land
will be utilized. The facility has already developed extensive green belt and plantation area
of about 633 acres (43% of the total existing land area) around the plant. Hence no negative
impact on land use is envisaged for the proposed capacity enhancement project.
5.3.3 Impact on Air Quality
No additional coal consumption is envisaged beyond the existing consumption and hence no
additional emissions from the Captive Power Plant are envisaged. The additional steam
required for increased pulp production will be generated by firing of additional solids (Black
liquor) generated from the pulp mill. Also, additional solids will be processed in the lime kiln
due to the increase in the production of lime sludge during the post project scenario.
Hence there is marginal increase in emissions of Particulate Matter (PM), Sulphur Dioxide
(SO2) and Oxides of Nitrogen (NOx) due to the firing of additional solids in chemical recovery
boiler and lime kiln. The existing stacks and ESPs are adequate. However, the ESP of
Chemical Recovery boiler will be upgraded during the post project scenario as per the
requirement. The existing pollution control systems and monitoring plan will be continued
during the post project scenario.
Although the impact on air environment due to the proposed project is minimal, an attempt
has been made to quantify the rate of additional emissions. The emission rates have been
estimated for the increased solids firing in chemical recovery boiler and lime kiln based on
the pro-rata basis considering the existing emission scenario. The details of the emission
estimations are presented in the Table 5.1 and Table 5.2.
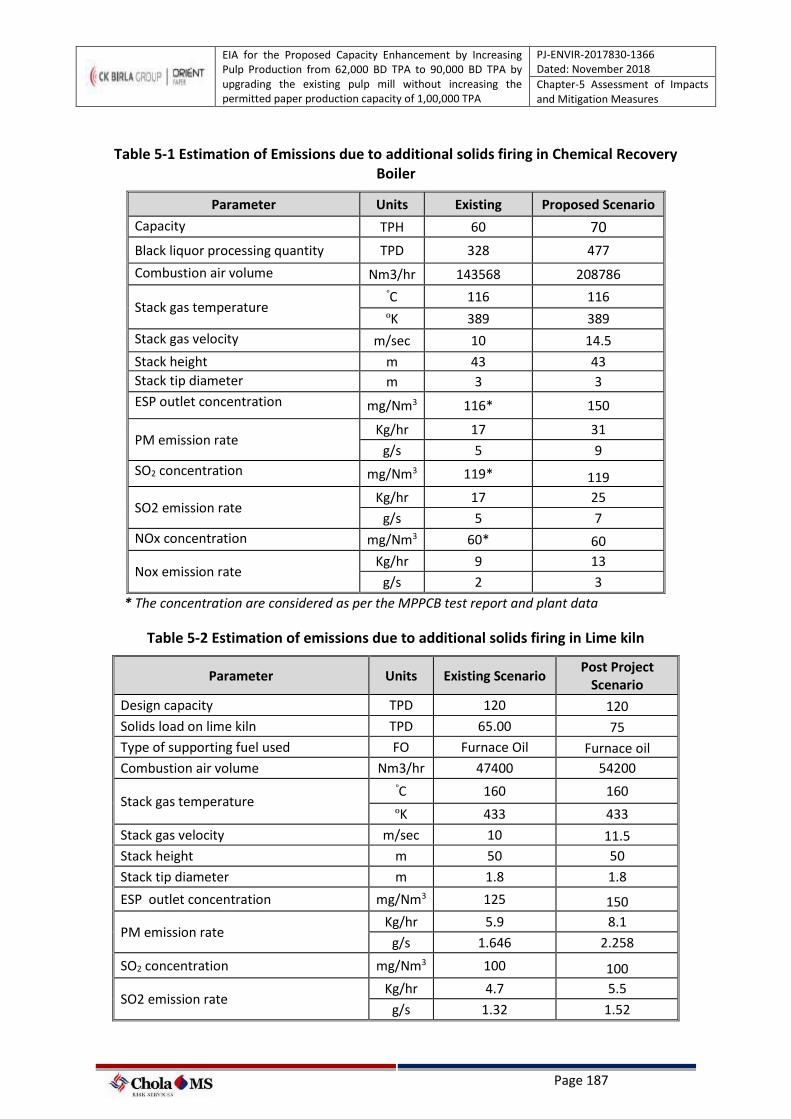
EIA for the Proposed Capacity Enhancement by Increasing Pulp Production from 62,000 BD TPA to 90,000 BD TPA by upgrading the existing pulp mill without increasing the permitted paper production capacity of 1,00,000 TPA
PJ-ENVIR-2017830-1366 Dated: November 2018
Chapter-5 Assessment of Impacts and Mitigation Measures
Page 187
Table 5-1 Estimation of Emissions due to additional solids firing in Chemical Recovery Boiler
Parameter Units Existing Proposed Scenario
Capacity TPH 60 70
Black liquor processing quantity TPD 328 477
Combustion air volume Nm3/hr 143568 208786
Stack gas temperature ºC 116 116
ºK 389 389
Stack gas velocity m/sec 10 14.5
Stack height m 43 43 Stack tip diameter m 3 3 ESP outlet concentration mg/Nm3 116* 150
PM emission rate Kg/hr 17 31
g/s 5 9 SO2 concentration mg/Nm3 119* 119
SO2 emission rate Kg/hr 17 25
g/s 5 7 NOx concentration mg/Nm3 60* 60
Nox emission rate Kg/hr 9 13
g/s 2 3
* The concentration are considered as per the MPPCB test report and plant data
Table 5-2 Estimation of emissions due to additional solids firing in Lime kiln
Parameter Units Existing Scenario Post Project
Scenario
Design capacity TPD 120 120 Solids load on lime kiln TPD 65.00 75 Type of supporting fuel used FO Furnace Oil Furnace oil
Combustion air volume Nm3/hr 47400 54200
Stack gas temperature ºC 160 160
ºK 433 433
Stack gas velocity m/sec 10 11.5 Stack height m 50 50
Stack tip diameter m 1.8 1.8
ESP outlet concentration mg/Nm3 125 150
PM emission rate Kg/hr 5.9 8.1
g/s 1.646 2.258
SO2 concentration mg/Nm3 100 100
SO2 emission rate Kg/hr 4.7 5.5
g/s 1.32 1.52
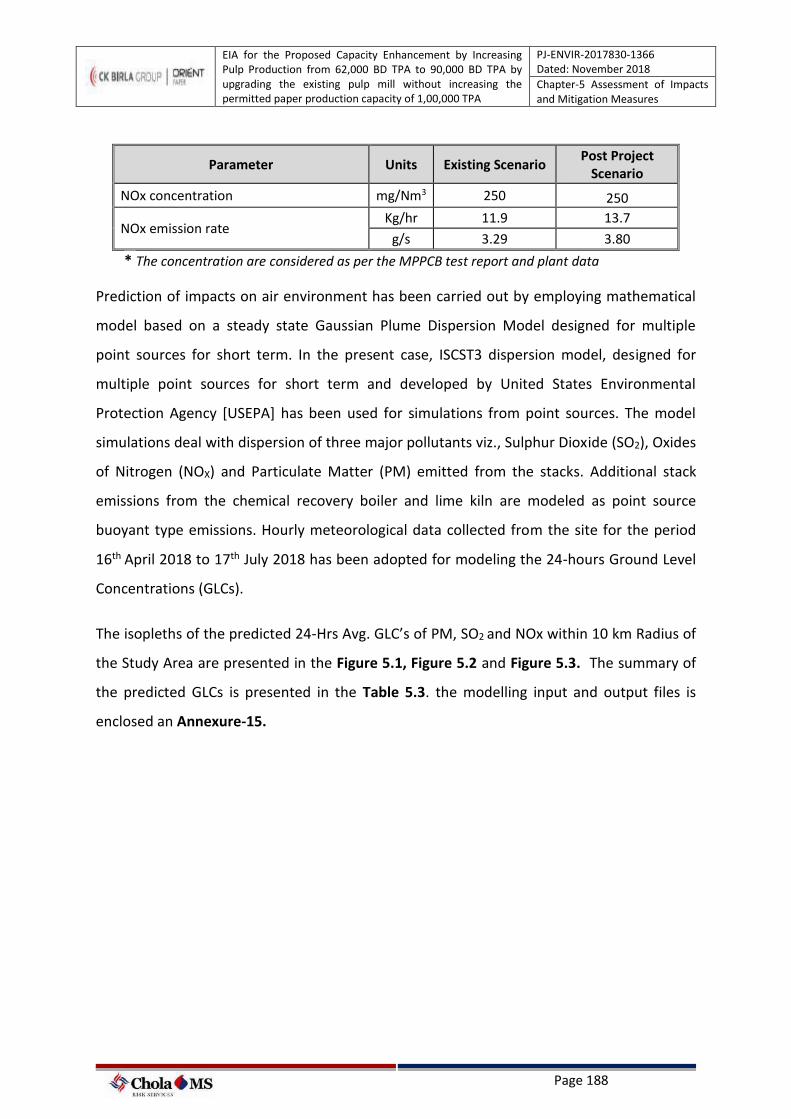
EIA for the Proposed Capacity Enhancement by Increasing Pulp Production from 62,000 BD TPA to 90,000 BD TPA by upgrading the existing pulp mill without increasing the permitted paper production capacity of 1,00,000 TPA
PJ-ENVIR-2017830-1366 Dated: November 2018
Chapter-5 Assessment of Impacts and Mitigation Measures
Page 188
Parameter Units Existing Scenario Post Project
Scenario
NOx concentration mg/Nm3 250 250
NOx emission rate Kg/hr 11.9 13.7
g/s 3.29 3.80
* The concentration are considered as per the MPPCB test report and plant data
Prediction of impacts on air environment has been carried out by employing mathematical
model based on a steady state Gaussian Plume Dispersion Model designed for multiple
point sources for short term. In the present case, ISCST3 dispersion model, designed for
multiple point sources for short term and developed by United States Environmental
Protection Agency [USEPA] has been used for simulations from point sources. The model
simulations deal with dispersion of three major pollutants viz., Sulphur Dioxide (SO2), Oxides
of Nitrogen (NOX) and Particulate Matter (PM) emitted from the stacks. Additional stack
emissions from the chemical recovery boiler and lime kiln are modeled as point source
buoyant type emissions. Hourly meteorological data collected from the site for the period
16th April 2018 to 17th July 2018 has been adopted for modeling the 24-hours Ground Level
Concentrations (GLCs).
The isopleths of the predicted 24-Hrs Avg. GLC’s of PM, SO2 and NOx within 10 km Radius of
the Study Area are presented in the Figure 5.1, Figure 5.2 and Figure 5.3. The summary of
the predicted GLCs is presented in the Table 5.3. the modelling input and output files is
enclosed an Annexure-15.
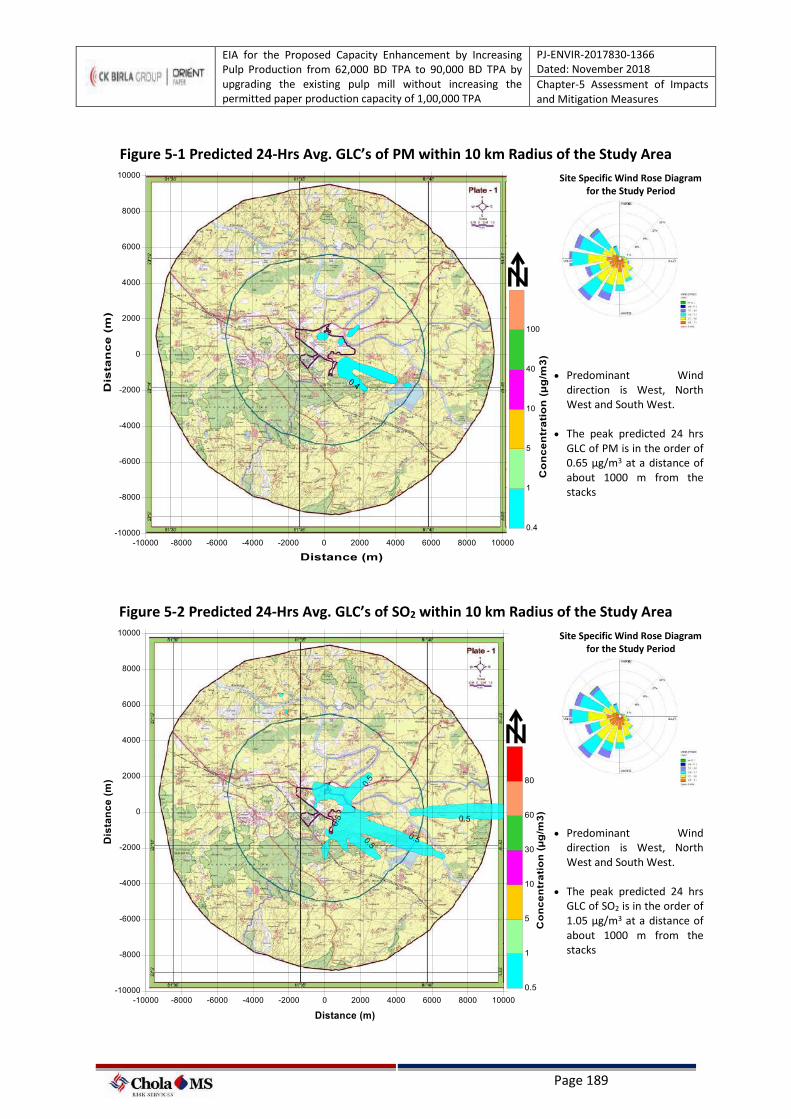
EIA for the Proposed Capacity Enhancement by Increasing Pulp Production from 62,000 BD TPA to 90,000 BD TPA by upgrading the existing pulp mill without increasing the permitted paper production capacity of 1,00,000 TPA
PJ-ENVIR-2017830-1366 Dated: November 2018
Chapter-5 Assessment of Impacts and Mitigation Measures
Page 189
Figure 5-1 Predicted 24-Hrs Avg. GLC’s of PM within 10 km Radius of the Study Area
Site Specific Wind Rose Diagram for the Study Period
• Predominant Wind direction is West, North West and South West.
• The peak predicted 24 hrs GLC of PM is in the order of 0.65 μg/m3 at a distance of about 1000 m from the stacks
Figure 5-2 Predicted 24-Hrs Avg. GLC’s of SO2 within 10 km Radius of the Study Area
Site Specific Wind Rose Diagram for the Study Period
• Predominant Wind direction is West, North West and South West.
• The peak predicted 24 hrs GLC of SO2 is in the order of 1.05 μg/m3 at a distance of about 1000 m from the stacks
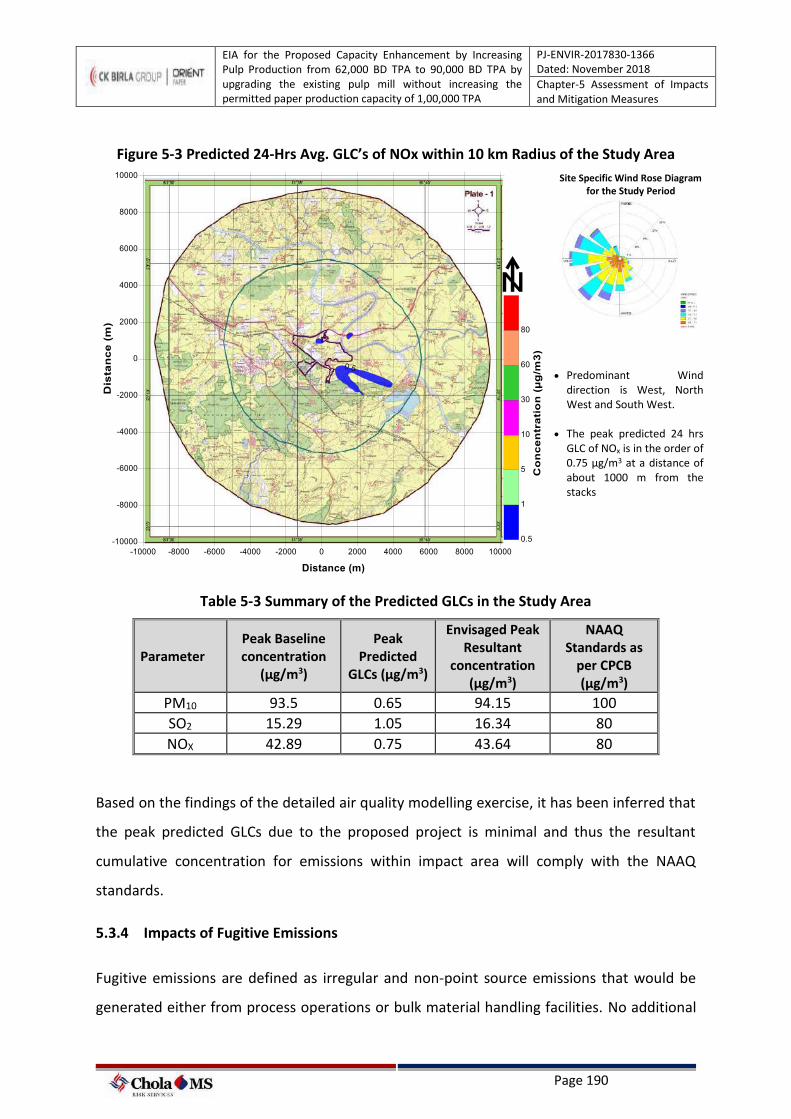
EIA for the Proposed Capacity Enhancement by Increasing Pulp Production from 62,000 BD TPA to 90,000 BD TPA by upgrading the existing pulp mill without increasing the permitted paper production capacity of 1,00,000 TPA
PJ-ENVIR-2017830-1366 Dated: November 2018
Chapter-5 Assessment of Impacts and Mitigation Measures
Page 190
Figure 5-3 Predicted 24-Hrs Avg. GLC’s of NOx within 10 km Radius of the Study Area
Site Specific Wind Rose Diagram for the Study Period
• Predominant Wind direction is West, North West and South West.
• The peak predicted 24 hrs GLC of NOx is in the order of 0.75 μg/m3 at a distance of about 1000 m from the stacks
Table 5-3 Summary of the Predicted GLCs in the Study Area
Parameter Peak Baseline concentration
(µg/m3)
Peak Predicted
GLCs (µg/m3)
Envisaged Peak Resultant
concentration (µg/m3)
NAAQ Standards as
per CPCB (µg/m3)
PM10 93.5 0.65 94.15 100
SO2 15.29 1.05 16.34 80
NOX 42.89 0.75 43.64 80
Based on the findings of the detailed air quality modelling exercise, it has been inferred that
the peak predicted GLCs due to the proposed project is minimal and thus the resultant
cumulative concentration for emissions within impact area will comply with the NAAQ
standards.
5.3.4 Impacts of Fugitive Emissions
Fugitive emissions are defined as irregular and non-point source emissions that would be
generated either from process operations or bulk material handling facilities. No additional
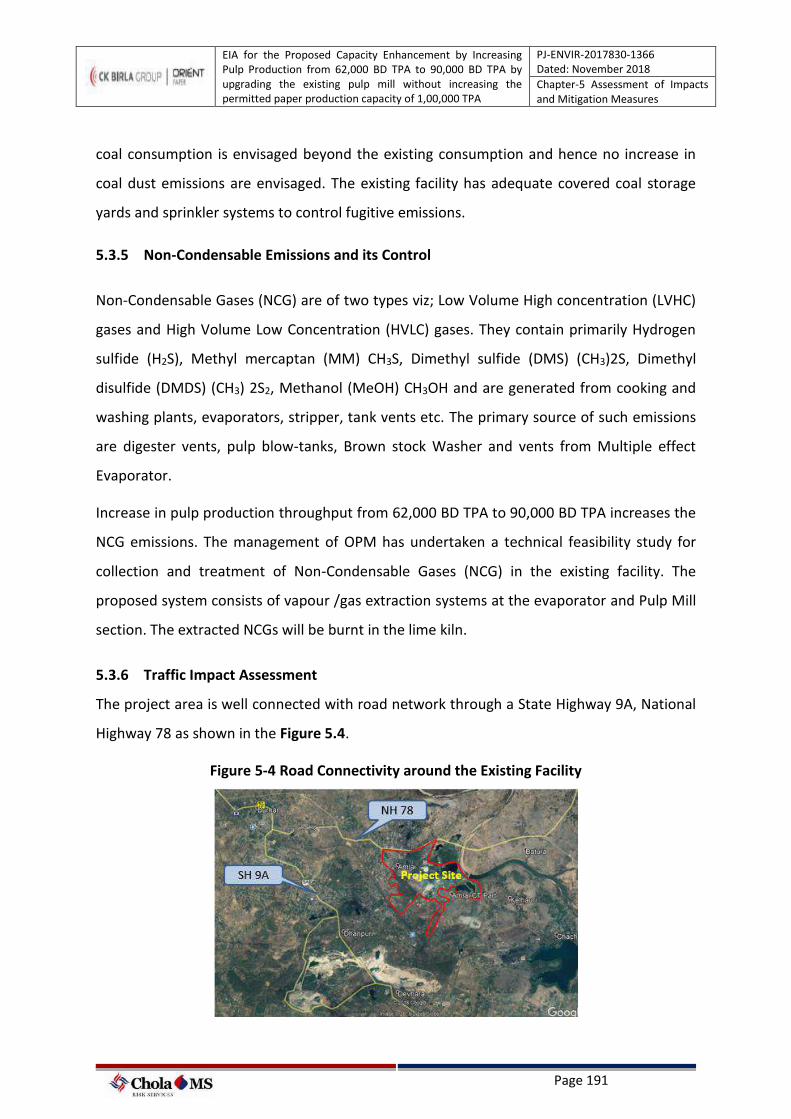
EIA for the Proposed Capacity Enhancement by Increasing Pulp Production from 62,000 BD TPA to 90,000 BD TPA by upgrading the existing pulp mill without increasing the permitted paper production capacity of 1,00,000 TPA
PJ-ENVIR-2017830-1366 Dated: November 2018
Chapter-5 Assessment of Impacts and Mitigation Measures
Page 191
coal consumption is envisaged beyond the existing consumption and hence no increase in
coal dust emissions are envisaged. The existing facility has adequate covered coal storage
yards and sprinkler systems to control fugitive emissions.
5.3.5 Non-Condensable Emissions and its Control
Non-Condensable Gases (NCG) are of two types viz; Low Volume High concentration (LVHC)
gases and High Volume Low Concentration (HVLC) gases. They contain primarily Hydrogen
sulfide (H2S), Methyl mercaptan (MM) CH3S, Dimethyl sulfide (DMS) (CH3)2S, Dimethyl
disulfide (DMDS) (CH3) 2S2, Methanol (MeOH) CH3OH and are generated from cooking and
washing plants, evaporators, stripper, tank vents etc. The primary source of such emissions
are digester vents, pulp blow-tanks, Brown stock Washer and vents from Multiple effect
Evaporator.
Increase in pulp production throughput from 62,000 BD TPA to 90,000 BD TPA increases the
NCG emissions. The management of OPM has undertaken a technical feasibility study for
collection and treatment of Non-Condensable Gases (NCG) in the existing facility. The
proposed system consists of vapour /gas extraction systems at the evaporator and Pulp Mill
section. The extracted NCGs will be burnt in the lime kiln.
5.3.6 Traffic Impact Assessment
The project area is well connected with road network through a State Highway 9A, National
Highway 78 as shown in the Figure 5.4.
Figure 5-4 Road Connectivity around the Existing Facility
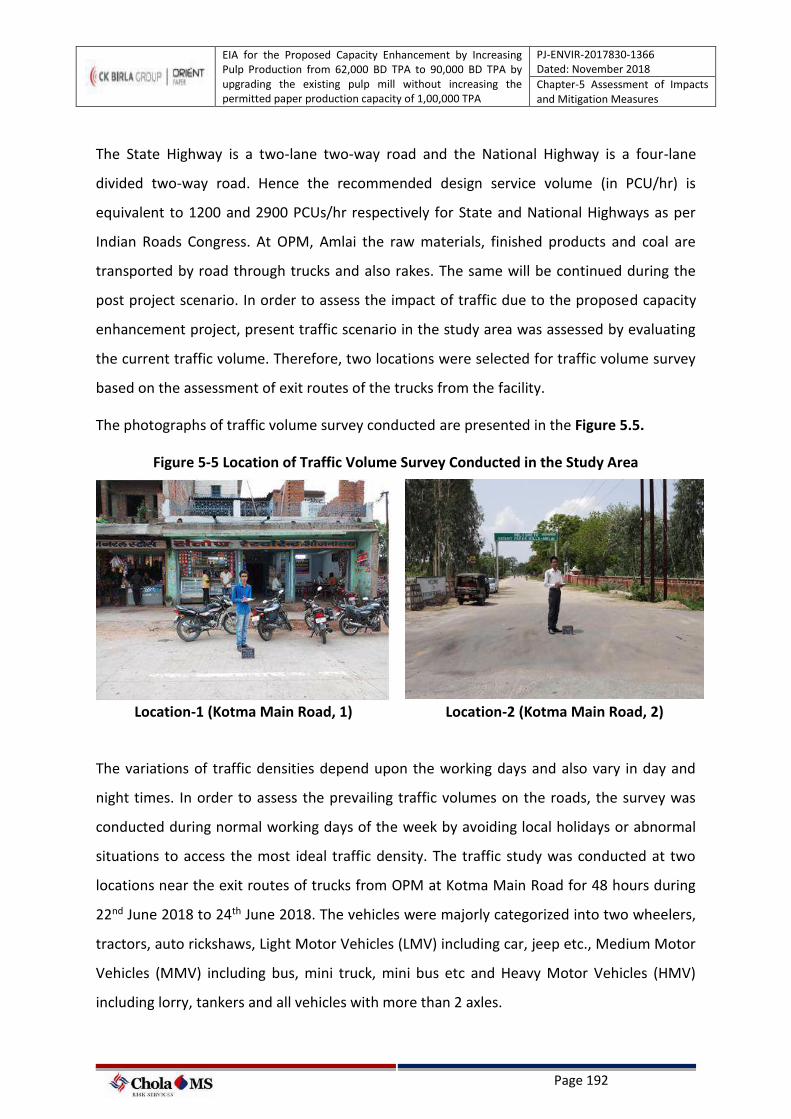
EIA for the Proposed Capacity Enhancement by Increasing Pulp Production from 62,000 BD TPA to 90,000 BD TPA by upgrading the existing pulp mill without increasing the permitted paper production capacity of 1,00,000 TPA
PJ-ENVIR-2017830-1366 Dated: November 2018
Chapter-5 Assessment of Impacts and Mitigation Measures
Page 192
The State Highway is a two-lane two-way road and the National Highway is a four-lane
divided two-way road. Hence the recommended design service volume (in PCU/hr) is
equivalent to 1200 and 2900 PCUs/hr respectively for State and National Highways as per
Indian Roads Congress. At OPM, Amlai the raw materials, finished products and coal are
transported by road through trucks and also rakes. The same will be continued during the
post project scenario. In order to assess the impact of traffic due to the proposed capacity
enhancement project, present traffic scenario in the study area was assessed by evaluating
the current traffic volume. Therefore, two locations were selected for traffic volume survey
based on the assessment of exit routes of the trucks from the facility.
The photographs of traffic volume survey conducted are presented in the Figure 5.5.
Figure 5-5 Location of Traffic Volume Survey Conducted in the Study Area
Location-1 (Kotma Main Road, 1) Location-2 (Kotma Main Road, 2)
The variations of traffic densities depend upon the working days and also vary in day and
night times. In order to assess the prevailing traffic volumes on the roads, the survey was
conducted during normal working days of the week by avoiding local holidays or abnormal
situations to access the most ideal traffic density. The traffic study was conducted at two
locations near the exit routes of trucks from OPM at Kotma Main Road for 48 hours during
22nd June 2018 to 24th June 2018. The vehicles were majorly categorized into two wheelers,
tractors, auto rickshaws, Light Motor Vehicles (LMV) including car, jeep etc., Medium Motor
Vehicles (MMV) including bus, mini truck, mini bus etc and Heavy Motor Vehicles (HMV)
including lorry, tankers and all vehicles with more than 2 axles.
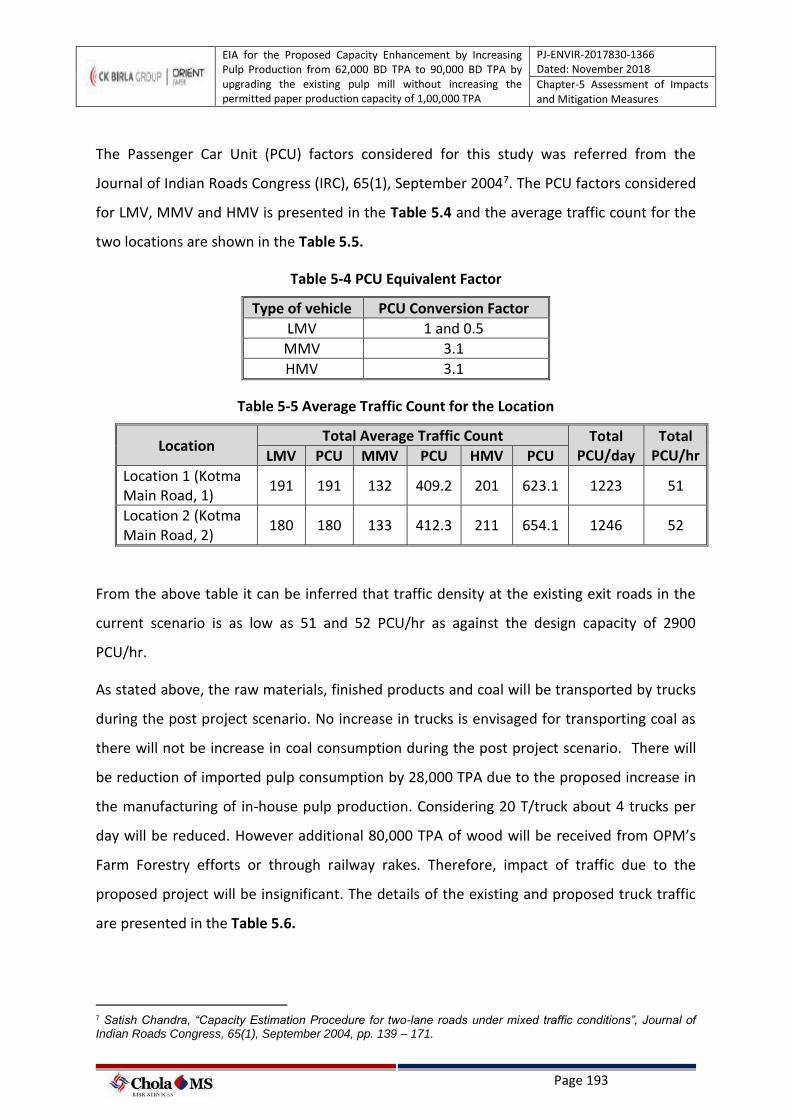
EIA for the Proposed Capacity Enhancement by Increasing Pulp Production from 62,000 BD TPA to 90,000 BD TPA by upgrading the existing pulp mill without increasing the permitted paper production capacity of 1,00,000 TPA
PJ-ENVIR-2017830-1366 Dated: November 2018
Chapter-5 Assessment of Impacts and Mitigation Measures
Page 193
The Passenger Car Unit (PCU) factors considered for this study was referred from the
Journal of Indian Roads Congress (IRC), 65(1), September 20047. The PCU factors considered
for LMV, MMV and HMV is presented in the Table 5.4 and the average traffic count for the
two locations are shown in the Table 5.5.
Table 5-4 PCU Equivalent Factor
Type of vehicle PCU Conversion Factor
LMV 1 and 0.5
MMV 3.1
HMV 3.1
Table 5-5 Average Traffic Count for the Location
Location Total Average Traffic Count Total
PCU/day Total
PCU/hr LMV PCU MMV PCU HMV PCU
Location 1 (Kotma Main Road, 1)
191 191 132 409.2 201 623.1 1223 51
Location 2 (Kotma Main Road, 2)
180 180 133 412.3 211 654.1 1246 52
From the above table it can be inferred that traffic density at the existing exit roads in the
current scenario is as low as 51 and 52 PCU/hr as against the design capacity of 2900
PCU/hr.
As stated above, the raw materials, finished products and coal will be transported by trucks
during the post project scenario. No increase in trucks is envisaged for transporting coal as
there will not be increase in coal consumption during the post project scenario. There will
be reduction of imported pulp consumption by 28,000 TPA due to the proposed increase in
the manufacturing of in-house pulp production. Considering 20 T/truck about 4 trucks per
day will be reduced. However additional 80,000 TPA of wood will be received from OPM’s
Farm Forestry efforts or through railway rakes. Therefore, impact of traffic due to the
proposed project will be insignificant. The details of the existing and proposed truck traffic
are presented in the Table 5.6.
7 Satish Chandra, “Capacity Estimation Procedure for two-lane roads under mixed traffic conditions”, Journal of Indian Roads Congress, 65(1), September 2004, pp. 139 – 171.
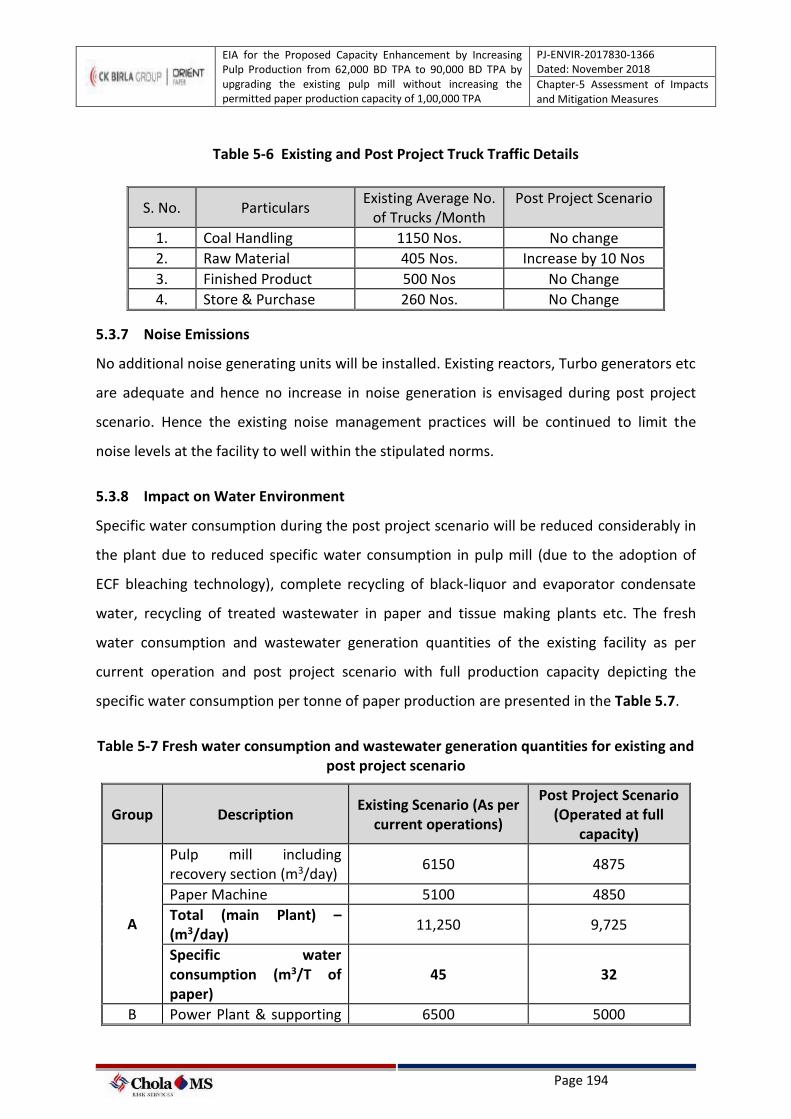
EIA for the Proposed Capacity Enhancement by Increasing Pulp Production from 62,000 BD TPA to 90,000 BD TPA by upgrading the existing pulp mill without increasing the permitted paper production capacity of 1,00,000 TPA
PJ-ENVIR-2017830-1366 Dated: November 2018
Chapter-5 Assessment of Impacts and Mitigation Measures
Page 194
Table 5-6 Existing and Post Project Truck Traffic Details
5.3.7 Noise Emissions
No additional noise generating units will be installed. Existing reactors, Turbo generators etc
are adequate and hence no increase in noise generation is envisaged during post project
scenario. Hence the existing noise management practices will be continued to limit the
noise levels at the facility to well within the stipulated norms.
5.3.8 Impact on Water Environment
Specific water consumption during the post project scenario will be reduced considerably in
the plant due to reduced specific water consumption in pulp mill (due to the adoption of
ECF bleaching technology), complete recycling of black-liquor and evaporator condensate
water, recycling of treated wastewater in paper and tissue making plants etc. The fresh
water consumption and wastewater generation quantities of the existing facility as per
current operation and post project scenario with full production capacity depicting the
specific water consumption per tonne of paper production are presented in the Table 5.7.
Table 5-7 Fresh water consumption and wastewater generation quantities for existing and post project scenario
Group Description Existing Scenario (As per
current operations)
Post Project Scenario (Operated at full
capacity)
A
Pulp mill including recovery section (m3/day)
6150 4875
Paper Machine 5100 4850
Total (main Plant) – (m3/day)
11,250 9,725
Specific water consumption (m3/T of paper)
45 32
B Power Plant & supporting 6500 5000
S. No. Particulars Existing Average No.
of Trucks /Month Post Project Scenario
1. Coal Handling 1150 Nos. No change
2. Raw Material 405 Nos. Increase by 10 Nos
3. Finished Product 500 Nos No Change
4. Store & Purchase 260 Nos. No Change
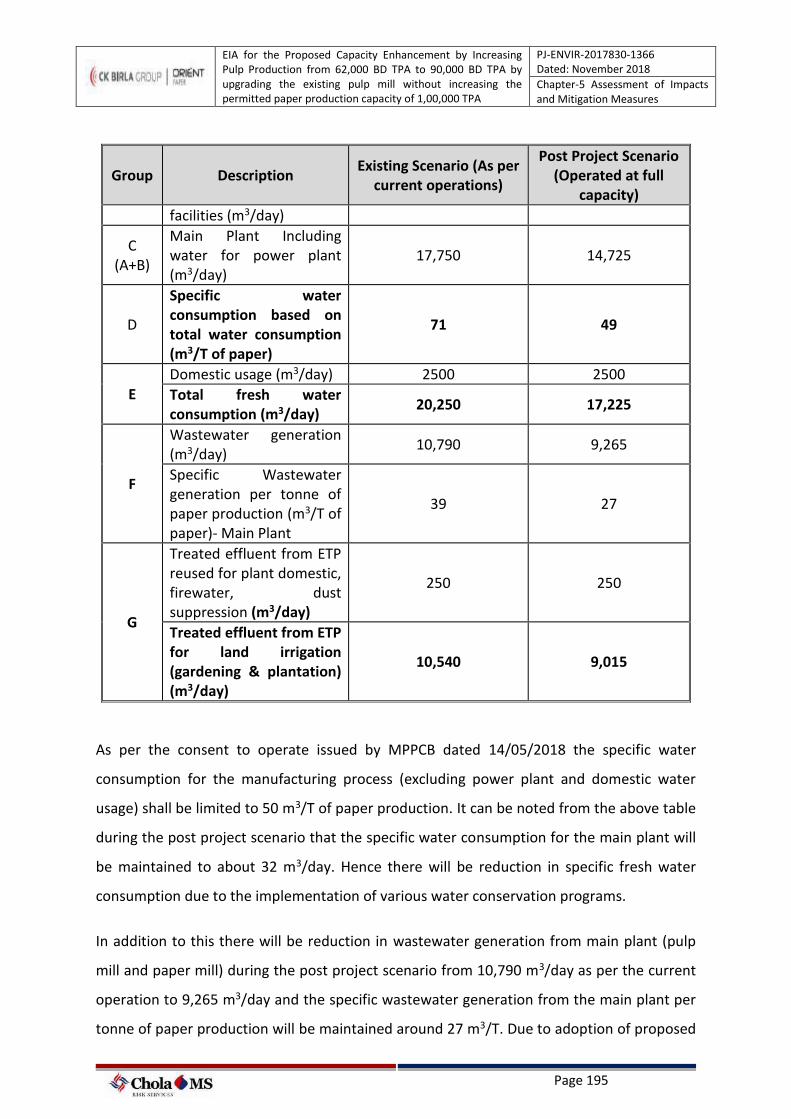
EIA for the Proposed Capacity Enhancement by Increasing Pulp Production from 62,000 BD TPA to 90,000 BD TPA by upgrading the existing pulp mill without increasing the permitted paper production capacity of 1,00,000 TPA
PJ-ENVIR-2017830-1366 Dated: November 2018
Chapter-5 Assessment of Impacts and Mitigation Measures
Page 195
Group Description Existing Scenario (As per
current operations)
Post Project Scenario (Operated at full
capacity)
facilities (m3/day)
C (A+B)
Main Plant Including water for power plant (m3/day)
17,750 14,725
D
Specific water consumption based on total water consumption (m3/T of paper)
71 49
E Domestic usage (m3/day) 2500 2500
Total fresh water consumption (m3/day)
20,250 17,225
F
Wastewater generation (m3/day)
10,790 9,265
Specific Wastewater generation per tonne of paper production (m3/T of paper)- Main Plant
39 27
G
Treated effluent from ETP reused for plant domestic, firewater, dust suppression (m3/day)
250 250
Treated effluent from ETP for land irrigation (gardening & plantation) (m3/day)
10,540 9,015
As per the consent to operate issued by MPPCB dated 14/05/2018 the specific water
consumption for the manufacturing process (excluding power plant and domestic water
usage) shall be limited to 50 m3/T of paper production. It can be noted from the above table
during the post project scenario that the specific water consumption for the main plant will
be maintained to about 32 m3/day. Hence there will be reduction in specific fresh water
consumption due to the implementation of various water conservation programs.
In addition to this there will be reduction in wastewater generation from main plant (pulp
mill and paper mill) during the post project scenario from 10,790 m3/day as per the current
operation to 9,265 m3/day and the specific wastewater generation from the main plant per
tonne of paper production will be maintained around 27 m3/T. Due to adoption of proposed
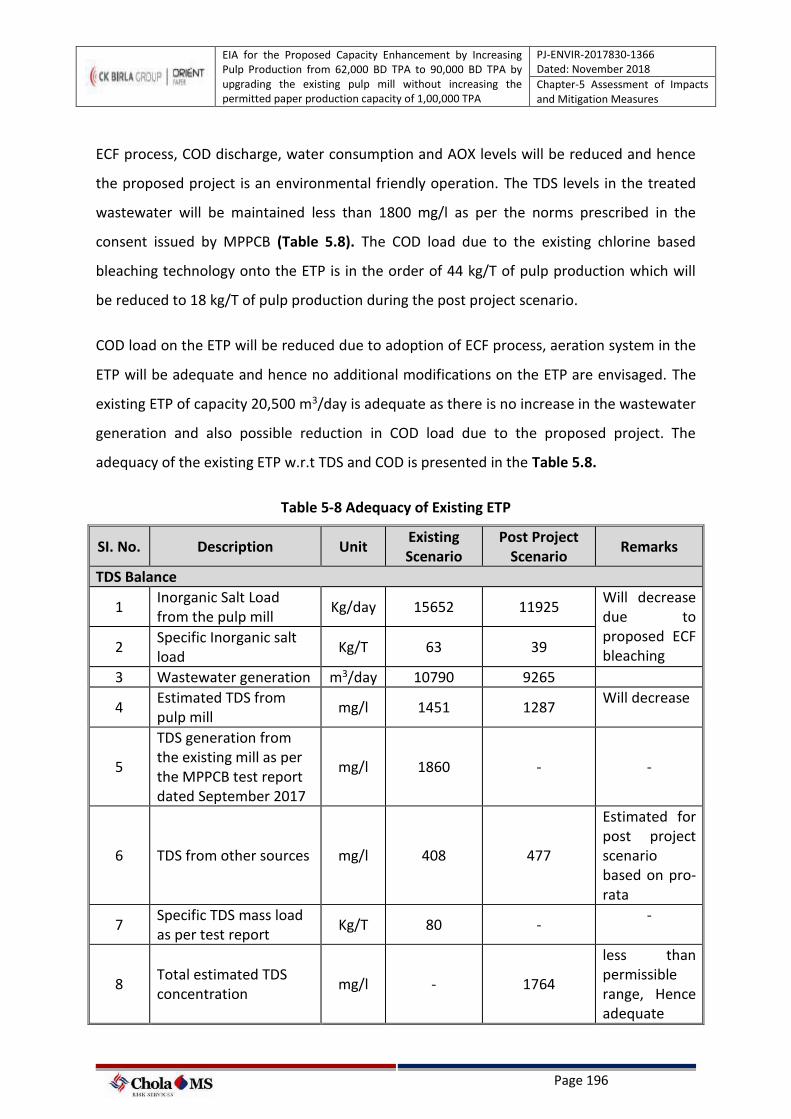
EIA for the Proposed Capacity Enhancement by Increasing Pulp Production from 62,000 BD TPA to 90,000 BD TPA by upgrading the existing pulp mill without increasing the permitted paper production capacity of 1,00,000 TPA
PJ-ENVIR-2017830-1366 Dated: November 2018
Chapter-5 Assessment of Impacts and Mitigation Measures
Page 196
ECF process, COD discharge, water consumption and AOX levels will be reduced and hence
the proposed project is an environmental friendly operation. The TDS levels in the treated
wastewater will be maintained less than 1800 mg/l as per the norms prescribed in the
consent issued by MPPCB (Table 5.8). The COD load due to the existing chlorine based
bleaching technology onto the ETP is in the order of 44 kg/T of pulp production which will
be reduced to 18 kg/T of pulp production during the post project scenario.
COD load on the ETP will be reduced due to adoption of ECF process, aeration system in the
ETP will be adequate and hence no additional modifications on the ETP are envisaged. The
existing ETP of capacity 20,500 m3/day is adequate as there is no increase in the wastewater
generation and also possible reduction in COD load due to the proposed project. The
adequacy of the existing ETP w.r.t TDS and COD is presented in the Table 5.8.
Table 5-8 Adequacy of Existing ETP
SI. No. Description Unit Existing Scenario
Post Project Scenario
Remarks
TDS Balance
1 Inorganic Salt Load from the pulp mill
Kg/day 15652 11925 Will decrease due to proposed ECF bleaching
2 Specific Inorganic salt load
Kg/T 63 39
3 Wastewater generation m3/day 10790 9265
4 Estimated TDS from pulp mill
mg/l 1451 1287 Will decrease
5
TDS generation from the existing mill as per the MPPCB test report dated September 2017
mg/l 1860 - -
6 TDS from other sources mg/l 408 477
Estimated for post project scenario based on pro-rata
7 Specific TDS mass load as per test report
Kg/T 80 - -
8 Total estimated TDS concentration
mg/l - 1764
less than permissible range, Hence adequate
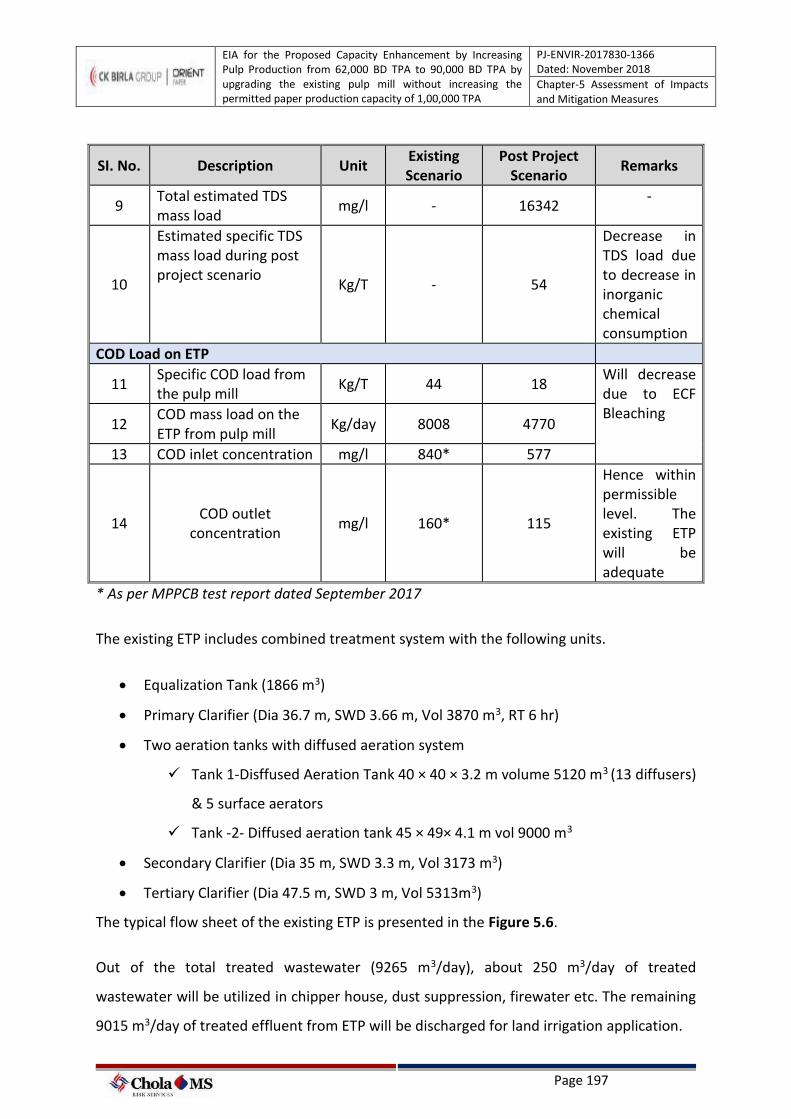
EIA for the Proposed Capacity Enhancement by Increasing Pulp Production from 62,000 BD TPA to 90,000 BD TPA by upgrading the existing pulp mill without increasing the permitted paper production capacity of 1,00,000 TPA
PJ-ENVIR-2017830-1366 Dated: November 2018
Chapter-5 Assessment of Impacts and Mitigation Measures
Page 197
SI. No. Description Unit Existing Scenario
Post Project Scenario
Remarks
9 Total estimated TDS mass load
mg/l - 16342 -
10
Estimated specific TDS mass load during post project scenario
Kg/T - 54
Decrease in TDS load due to decrease in inorganic chemical consumption
COD Load on ETP
11 Specific COD load from the pulp mill
Kg/T 44 18 Will decrease due to ECF Bleaching
12 COD mass load on the ETP from pulp mill
Kg/day 8008 4770
13 COD inlet concentration mg/l 840* 577
14 COD outlet
concentration mg/l 160* 115
Hence within permissible level. The existing ETP will be adequate
* As per MPPCB test report dated September 2017
The existing ETP includes combined treatment system with the following units.
• Equalization Tank (1866 m3)
• Primary Clarifier (Dia 36.7 m, SWD 3.66 m, Vol 3870 m3, RT 6 hr)
• Two aeration tanks with diffused aeration system
✓ Tank 1-Disffused Aeration Tank 40 × 40 × 3.2 m volume 5120 m3 (13 diffusers)
& 5 surface aerators
✓ Tank -2- Diffused aeration tank 45 × 49× 4.1 m vol 9000 m3
• Secondary Clarifier (Dia 35 m, SWD 3.3 m, Vol 3173 m3)
• Tertiary Clarifier (Dia 47.5 m, SWD 3 m, Vol 5313m3)
The typical flow sheet of the existing ETP is presented in the Figure 5.6.
Out of the total treated wastewater (9265 m3/day), about 250 m3/day of treated
wastewater will be utilized in chipper house, dust suppression, firewater etc. The remaining
9015 m3/day of treated effluent from ETP will be discharged for land irrigation application.
EIA for the Proposed Capacity Enhancement by Increasing Pulp Production from 62,000 BD TPA to 90,000 BD TPA by upgrading the existing pulp mill without increasing the permitted paper production capacity of 1,00,000 TPA
PJ-ENVIR-2017830-1366 Dated: November 2018
Chapter-5 Assessment of Impacts and Mitigation Measures
Page 198
From the baseline studies it was observed that soil type in the study area of the project site
is mostly silty loam and sandy loam. The daily water application rate is considered as 60
m3/ha/day for the calculation of requirement of land for irrigation as per the
recommendations from NEERI based on a detailed soil study in the region. Therefore, total
area requirement of land for irrigation using total treated wastewater after proposed
project of 9015 m3/day will be 382 acres.
The facility already has developed 633 acres of green belt/plantation and hence adequate
land is already available for complete utilization of treated effluent. The land irrigation
application of treated wastewater will be carried out through HRTS (High Rate Transpiration
System) design as per the existing practice. By utilizing the treated wastewater for
gardening and plantation applications, no treated wastewater will be discharged into River
to achieve Zero Liquid Discharge to River as per the existing practice.
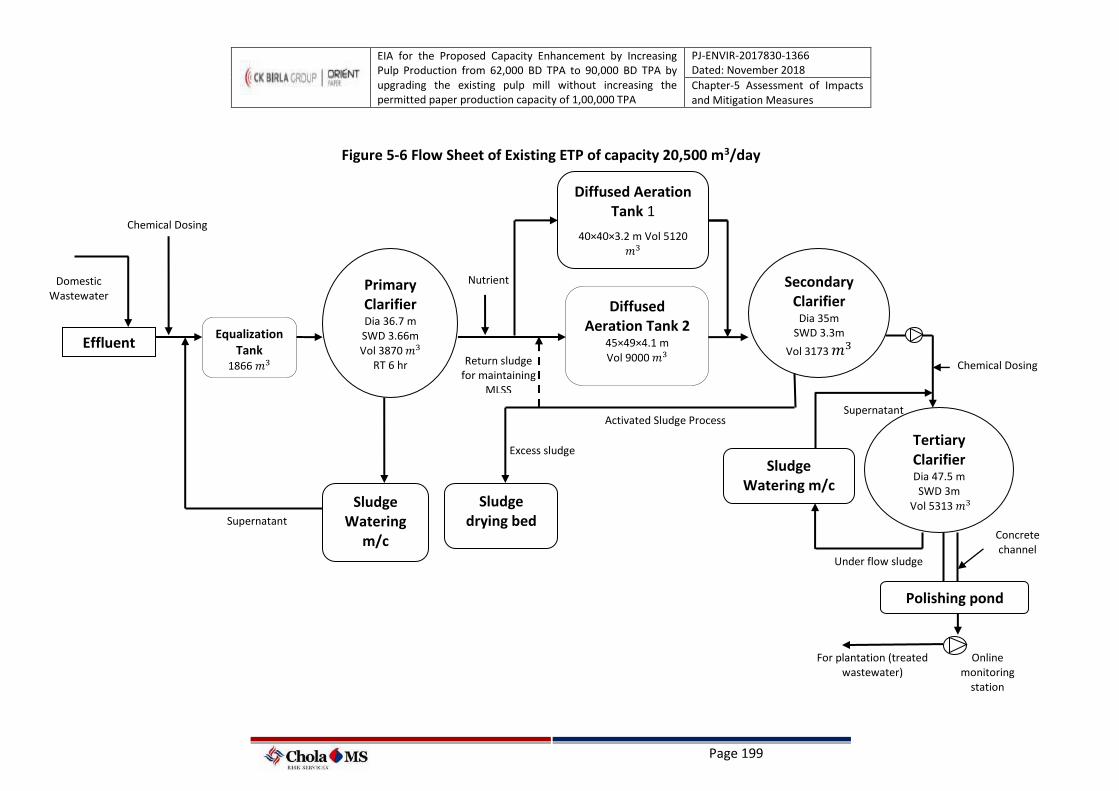
EIA for the Proposed Capacity Enhancement by Increasing Pulp Production from 62,000 BD TPA to 90,000 BD TPA by upgrading the existing pulp mill without increasing the permitted paper production capacity of 1,00,000 TPA
PJ-ENVIR-2017830-1366 Dated: November 2018
Chapter-5 Assessment of Impacts and Mitigation Measures
Page 199
Figure 5-6 Flow Sheet of Existing ETP of capacity 20,500 m3/day
Effluent Equalization
Tank 1866 𝑚3
Diffused Aeration Tank 1
40×40×3.2 m Vol 5120 𝑚3
Diffused Aeration Tank 2
45×49×4.1 m Vol 9000 𝑚3
Sludge Watering
m/c
Sludge drying bed
Sludge Watering m/c
Polishing pond
Domestic Wastewater
Chemical Dosing
Supernatant
Primary Clarifier Dia 36.7 m SWD 3.66m Vol 3870 𝑚3
RT 6 hr
Secondary Clarifier
Dia 35m SWD 3.3m
Vol 3173 𝑚3
Tertiary Clarifier Dia 47.5 m SWD 3m
Vol 5313 𝑚3
Chemical Dosing
Concrete channel
Nutrient
Under flow sludge
Activated Sludge Process
Excess sludge
Return sludge for maintaining
MLSS
For plantation (treated wastewater)
Online monitoring
station
Supernatant
EIA for the Proposed Capacity Enhancement by Increasing Pulp Production from 62,000 BD TPA to 90,000 BD TPA by upgrading the existing pulp mill without increasing the permitted paper production capacity of 1,00,000 TPA
PJ-ENVIR-2017830-1366 Dated: November 2018
Chapter-5 Assessment of Impacts and Mitigation Measures
Page 200
5.3.9 AOX Levels in the treated effluent
The Adsorbable Organic Halides are adsorbable compounds containing chlorine, bromine or
iodine. The formation of these compounds is traceable to the use of chlorine and
chlorinated compounds in the various industrial processes including the bleaching process in
the pulp and paper industries. The proposed pulp mill capacity enhancement project
involves replacement of existing chlorine based bleaching technology with Elemental
Chlorine Free (ECF) bleaching technology. Due to the reduction of chlorinated organic
compounds, the AOX in the final treated wastewater will be maintained less than 8 mg/l as
prescribed by MPPCB in the consent order.
5.3.10 Soil and Groundwater Quality Related Impacts
There will be reduction in total wastewater generation from 10,790 m3/day to 9,265
m3/day. Therefore, the treated effluent discharge for land irrigation will reduce by about
1525 m3/day during the post project scenario. About 9015 m3/day with TDS less than 1800
mg/L and COD less than 250 mg/L will be discharged for green belt development/irrigation
in an area of 633 acres of land.
Although the TDS load on to the ETP will reduce from 80 kg/T of paper production to 54
kg/T of paper production during the post project scenario due to the reduced inorganic
chemical consumption, Ground water quality modelling has been undertaken for the worst-
case scenario considering 1800 mg/l of TDS from the treated wastewater to evaluate the
impact of TDS from the treated wastewater on the groundwater.
The soil type at the project site is Sandy –Loamy Soil. The soil sample collected from the
project site during the study period also indicates that the porosity of the soil is 45% which
indicates moderate permeability. As per the ground water quality monitoring studies
conducted in the study area as part of baseline environmental studies, the maximum TDS of
530 mg/L was observed and the same value was considered for modelling studies to
evaluate the impact for worst case scenario.
The Hydraulic Gradient is estimated from the water table contour. The estimated pre-
monsoon hydraulic gradient of 5.2 m/km is considered with ground water level of 9.0 m.
The effective porosity of the formation is considered as 45 %. The transmissivity of the
EIA for the Proposed Capacity Enhancement by Increasing Pulp Production from 62,000 BD TPA to 90,000 BD TPA by upgrading the existing pulp mill without increasing the permitted paper production capacity of 1,00,000 TPA
PJ-ENVIR-2017830-1366 Dated: November 2018
Chapter-5 Assessment of Impacts and Mitigation Measures
Page 201
shallow aquifer is around 24 sq.m/day. The hydraulic conductivity is estimated as 0.912
m/day. The velocity of the ground water is computed as 0.01502 m/day.
Based on the aquifer parameters, the model is computed for 10-year period and as per the
output of the model, the highest predicted value of TDS in the ground water in the study
area of the project site is 650 mg/L. Therefore, there is a change in the TDS concentration of
the groundwater from 530 mg/L to 650 mg/L. However, it can be observed that the value
will be well within the permissible range of 2000 mg/L as per Drinking Water Standards (IS
10500:2012). The above indicates that there would be no adverse impact on ground water
during the post project scenario.
In addition, considering the return seepage of 40 % for the total treated wastewater
discharge of 9015 m3/day, about 3606 m3/day is estimated as return seepage water which
will further increase the ground water level in the irrigated area.
5.3.11 Solid Waste Generation and Disposal
Since there is no increase in wastewater generation and due to adoption of ECF bleaching
technology there is reduction in COD load onto the ETP. Therefore, increase in ETP sludge
due to the proposed project is not envisaged. The expected solid waste generation from the
proposed project includes marginal increase in lime mud due to the additional lime sludge
firing in lime kiln and saw dust due to increase in wood consumption.
The existing facility has obtained valid hazardous waste authorization letter from MPPCB
which is attached as Annexure 10. The existing disposal practices of solid and hazardous
waste will be adopted during the post project scenario. The details of the quantity of solid &
hazardous waste generation and its disposal are provided in the Table 5.9.
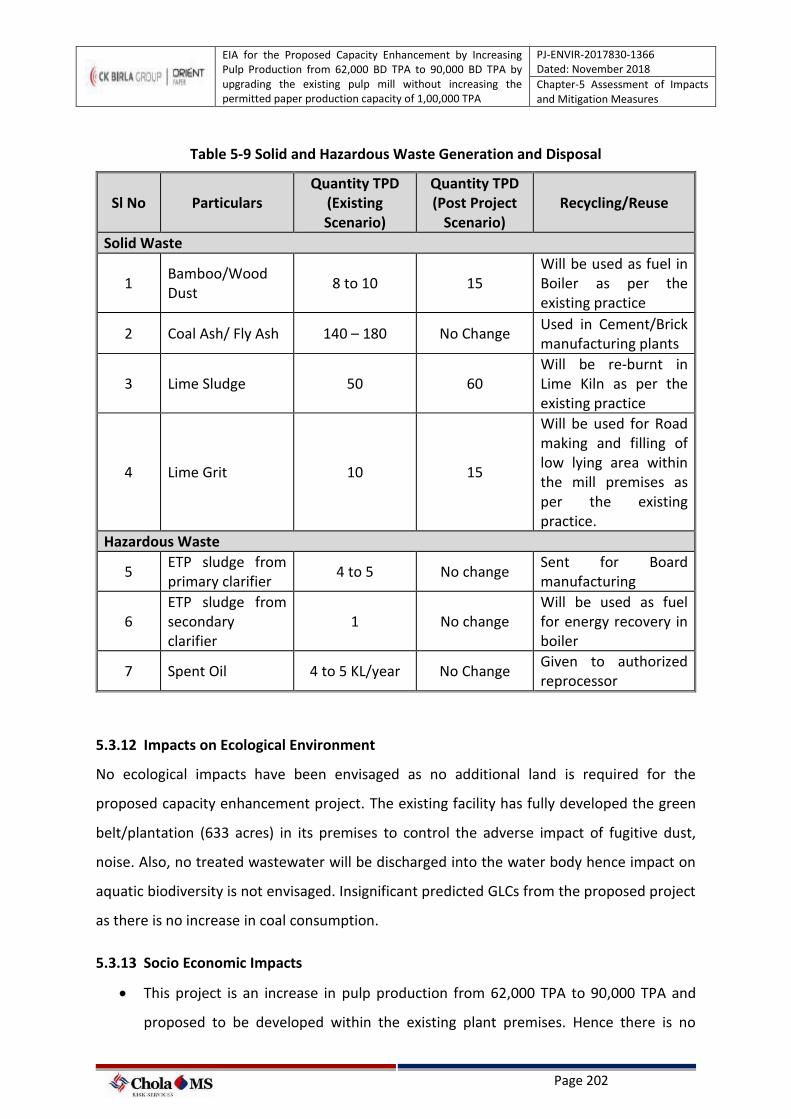
EIA for the Proposed Capacity Enhancement by Increasing Pulp Production from 62,000 BD TPA to 90,000 BD TPA by upgrading the existing pulp mill without increasing the permitted paper production capacity of 1,00,000 TPA
PJ-ENVIR-2017830-1366 Dated: November 2018
Chapter-5 Assessment of Impacts and Mitigation Measures
Page 202
Table 5-9 Solid and Hazardous Waste Generation and Disposal
Sl No Particulars Quantity TPD
(Existing Scenario)
Quantity TPD (Post Project
Scenario) Recycling/Reuse
Solid Waste
1 Bamboo/Wood Dust
8 to 10 15 Will be used as fuel in Boiler as per the existing practice
2 Coal Ash/ Fly Ash 140 – 180 No Change Used in Cement/Brick manufacturing plants
3 Lime Sludge 50 60 Will be re-burnt in Lime Kiln as per the existing practice
4 Lime Grit 10 15
Will be used for Road making and filling of low lying area within the mill premises as per the existing practice.
Hazardous Waste
5 ETP sludge from primary clarifier
4 to 5 No change Sent for Board manufacturing
6 ETP sludge from secondary clarifier
1 No change Will be used as fuel for energy recovery in boiler
7 Spent Oil 4 to 5 KL/year No Change Given to authorized reprocessor
5.3.12 Impacts on Ecological Environment
No ecological impacts have been envisaged as no additional land is required for the
proposed capacity enhancement project. The existing facility has fully developed the green
belt/plantation (633 acres) in its premises to control the adverse impact of fugitive dust,
noise. Also, no treated wastewater will be discharged into the water body hence impact on
aquatic biodiversity is not envisaged. Insignificant predicted GLCs from the proposed project
as there is no increase in coal consumption.
5.3.13 Socio Economic Impacts
• This project is an increase in pulp production from 62,000 TPA to 90,000 TPA and
proposed to be developed within the existing plant premises. Hence there is no
EIA for the Proposed Capacity Enhancement by Increasing Pulp Production from 62,000 BD TPA to 90,000 BD TPA by upgrading the existing pulp mill without increasing the permitted paper production capacity of 1,00,000 TPA
PJ-ENVIR-2017830-1366 Dated: November 2018
Chapter-5 Assessment of Impacts and Mitigation Measures
Page 203
additional land requirement is envisaged under the project. In this context, the
proposal will not attract Right to Fair Compensation and Transparency in Land
Acquisition, Rehabilitation and Resettlement Act, 2013 (RFCTLARR ACT 2013).
• No disturbance to the community due to acquisition of land/ approach roads
• No health impacts due to emissions are envisaged as predicted GLCs are very low
and well within the prescribed norms.
• No ground water will be extracted for the project. Hence there is no impact on local
aquifer due to the operation of plant.
• No treated wastewater will be discharged to River Sone due to the proposed project.
Hence no impact on community is envisaged that is utilizing the River water.
• No health impacts due to dust emissions are envisaged
• Solid wastes generated from the facility will be reused/recycled as per the existing
practice.
The nearby community is benefitted by various CSR programs implemented by OPM such as
drinking water supply to the nearby villages, extending health care facilities and providing
need-based infrastructure to the schools etc. CSR initiatives will be undertaken as per the
need based CSR assessment and the respective budget will be allocated as per the Office
Memorandum on Corporate Environment Responsibility (CER) dated 1st May 2018 by
MoEF&CC.
EIA for the Proposed Capacity Enhancement by Increasing Pulp Production from 62,000 BD TPA to 90,000 BD TPA by upgrading the existing pulp mill without increasing the permitted paper production capacity of 1,00,000 TPA
PJ-ENVIR-2017830-1366 Dated: November 2018
Chapter-6 Analysis of Alternatives
Page 204
6 ANALYSIS OF ALTERNATIVES
6.1 Introduction
The process of analysis involves identifying the constraints, avoiding activities causing
adverse impact and maintaining the economic feasibility. The environmentally sound
technologies proposed under the capacity enhancement project are discussed under this
section.
6.2 Site Alternative
The proposed project is enhancement of the existing pulp mill production level which
includes installation of balancing equipment and adoption of the EFC bleaching technology.
As the existing facility already has adequate capacity of pulp mill to increase the production
level, no additional land is required.
6.3 Technology Alternative
The technology selected in the proposed expansion project is the improved version of
existing technologies currently being used by Orient paper.
Elemental Chlorine Free (ECF) chemical wood pulp mill proposed under the capacity
enhancement based on chlorine dioxide is the superior choice for pulp and paper
manufacturing. The technology is proven in terms of pollution prevention of dioxins and
dioxin like compounds etc resource conservation and product quality with a strong market
demand. ECF pulp provides strong paper products and the technology places a lower strain
on forest resources.
One of the key benefits of kraft process compared with other alternatives is the capability to
recover the cooking chemicals and to generate the energy need in the process from the
black liquor in a very efficient way. Recovery Island will consist of falling film evaporator,
high efficiency recovery boiler, causticizer plant having CD and LM filters for better
efficiency and modern lime kiln, etc.
EIA for the Proposed Capacity Enhancement by Increasing Pulp Production from 62,000 BD TPA to 90,000 BD TPA by upgrading the existing pulp mill without increasing the permitted paper production capacity of 1,00,000 TPA
PJ-ENVIR-2017830-1366 Dated: November 2018
Chapter-7 Environment Monitoring Program
Page 205
7 ENVIRONMENT MONITORING PROGRAM
7.1. Introduction
Environmental monitoring is essential to ensure that environmental impacts are prevented
and mitigated by following the Environmental Management Plan that is formulated based
on the baseline data collected on various environmental parameters and the prediction of
impacts. An Environmental Monitoring Plan provides feedback about the difference
between actual environmental scenario and the impacts of the project on the environment
and helps to judge the adequacy of the mitigation measures in protecting the environment.
Regular monitoring of environmental parameters is of immense importance to assess the
status of environment during plant operation. With the knowledge of baseline conditions,
the monitoring program will serve as an indicator for any deterioration in environmental
conditions due to operation of the project, to enable taking up suitable mitigative steps in
time to safeguard the environment. Monitoring is as important as that of control of
pollution since the efficiency of control measures can be determined only by efficient
monitoring.
7.2. Objectives of Environmental Monitoring Plan
The key issues associated with the life cycle of a project are the monitoring of
environmental parameters. Following three types of Environmental Monitoring are
associated with the project, which includes
a) Baseline Monitoring
b) Effects / Impacts Monitoring and
c) Compliance Monitoring
a) Baseline Monitoring- Baseline monitoring deals with the measurement of environmental
variables during pre project period to determine existing conditions ranges of variation and
process of change.
External laboratory of Orient paper mill and MPPCB periodically monitors the quality of
environmental parameters. Besides, Orient Paper Mills has installed two ambient air quality
monitoring stations (AAQMS) and balance two stations are under commissioning stage.
EIA for the Proposed Capacity Enhancement by Increasing Pulp Production from 62,000 BD TPA to 90,000 BD TPA by upgrading the existing pulp mill without increasing the permitted paper production capacity of 1,00,000 TPA
PJ-ENVIR-2017830-1366 Dated: November 2018
Chapter-7 Environment Monitoring Program
Page 206
Selection of monitoring stations for Environmental Monitoring- Under the Environment
Monitoring Plan of Orient paper mill, the sampling stations for Ambient Air Quality is
selected based on the wind directions at the time of sampling.
b) Effects/Impact Monitoring- It involves measurement of environmental variables during
construction and operation phase of the project to assess the impact that may have been
caused by the project.
c) Compliance Monitoring- It takes the form of periodic sampling and continuous
measurement of level of pollutant emissions in the air, waste discharge on land or water,
level of noise to ensure that prescribed standards are met.
The basic objective of Environment Monitoring Program is:
• To develop a database against which the short term and long term environmental
impacts of the project can be determined
• To ensure implementation of mitigation measures during project implementation
• To evaluate the effectiveness of the mitigation measures implemented through
periodic monitoring
• To evaluate and ensure the statutory compliance of the project with respect to
various environmental parameters.
• To define the responsibilities of the project proponents and environmental monitors
and to ensure effective communication of environmental issues amongst them.
• To provide feedback to the decision makers about the effectiveness of their actions
• To determine the project’s actual environmental impacts so that modifications can
be made to mitigate the impacts
• To identify the need for enforcement action before irreversible environmental
damage occurs
• To provide scientific information about the response of an ecosystem to a given set
of human activities and mitigation measures
EIA for the Proposed Capacity Enhancement by Increasing Pulp Production from 62,000 BD TPA to 90,000 BD TPA by upgrading the existing pulp mill without increasing the permitted paper production capacity of 1,00,000 TPA
PJ-ENVIR-2017830-1366 Dated: November 2018
Chapter-7 Environment Monitoring Program
Page 207
7.3. Environmental Monitoring and Reporting Procedure
Monitoring shall ensure that commitments are being met. This may take the form of direct
measurement and recording of quantitative information, such as amounts and
concentrations of discharges, emissions and wastes, for measurement against corporate or
statutory standards, consent limits or targets. It may also require measurement of ambient
environmental quality in the vicinity of a site using ecological/biological, physical and
chemical indicators. Monitoring may include socio-economic interaction, through local
liaison activities or even assessment of complaints.
7.4. Environmental Monitoring Program
Orient paper mill is committed for environmental protection and thus the facility has
implemented robust environmental monitoring programs to achieve the regulatory
compliance and beyond in the existing facility.
The existing monitoring programs implemented in the facility are as follows;
• OPM has installed two Ambient Air Quality Monitoring Stations and the balance two
stations will be installed within a year.
• The stack emissions and ambient air quality at the facility are periodically being
monitored by plant, external lab and MPPCB.
• Monitoring of Stacks for various air pollutants generated during various
manufacturing activities which are being surveyed by MPPCB and MOEF approved
labs periodically
• In addition to this, OPM has installed electronic display board depicting the critical
pollutant levels at the main entrance of the unit in the public domain.
• Monthly monitoring of fugitive emissions near coal storage, waste paper storage &
handling area, ash handling plant and chemical additive plant by an external lab
(NABL accredited and MoEF&CC approved laboratory)
• Monthly monitoring of noise emissions at various locations in the existing plant area
by external lab and by MPPCB.
• Online flow and suspended solids meters are installed in channels of Board machine,
Wastepaper plant and Inlet to ETP. The data display is made in Board machine DCS.
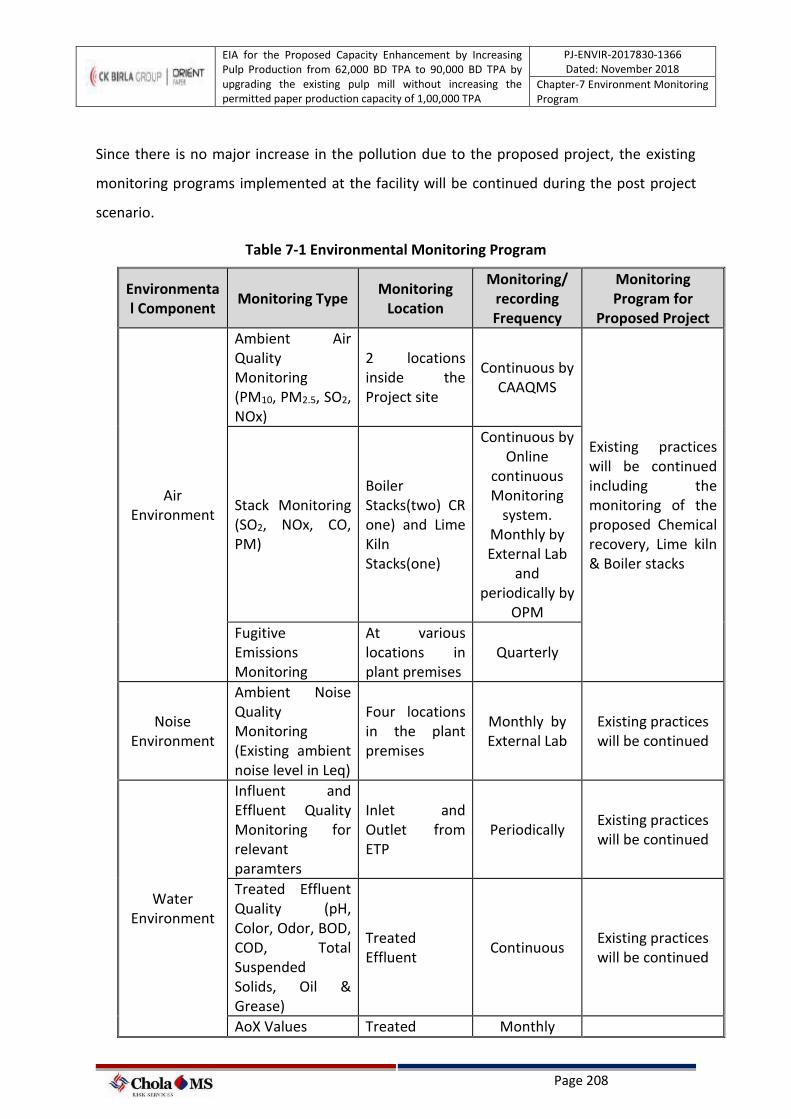
EIA for the Proposed Capacity Enhancement by Increasing Pulp Production from 62,000 BD TPA to 90,000 BD TPA by upgrading the existing pulp mill without increasing the permitted paper production capacity of 1,00,000 TPA
PJ-ENVIR-2017830-1366 Dated: November 2018
Chapter-7 Environment Monitoring Program
Page 208
Since there is no major increase in the pollution due to the proposed project, the existing
monitoring programs implemented at the facility will be continued during the post project
scenario.
Table 7-1 Environmental Monitoring Program
Environmental Component
Monitoring Type Monitoring
Location
Monitoring/ recording Frequency
Monitoring Program for
Proposed Project
Air Environment
Ambient Air Quality Monitoring (PM10, PM2.5, SO2, NOx)
2 locations inside the Project site
Continuous by CAAQMS
Existing practices will be continued including the monitoring of the proposed Chemical recovery, Lime kiln & Boiler stacks
Stack Monitoring (SO2, NOx, CO, PM)
Boiler Stacks(two) CR one) and Lime Kiln Stacks(one)
Continuous by Online
continuous Monitoring
system. Monthly by External Lab
and periodically by
OPM
Fugitive Emissions Monitoring
At various locations in plant premises
Quarterly
Noise Environment
Ambient Noise Quality Monitoring (Existing ambient noise level in Leq)
Four locations in the plant premises
Monthly by External Lab
Existing practices will be continued
Water Environment
Influent and Effluent Quality Monitoring for relevant paramters
Inlet and Outlet from ETP
Periodically Existing practices will be continued
Treated Effluent Quality (pH, Color, Odor, BOD, COD, Total Suspended Solids, Oil & Grease)
Treated Effluent
Continuous Existing practices will be continued
AoX Values Treated Monthly
EIA for the Proposed Capacity Enhancement by Increasing Pulp Production from 62,000 BD TPA to 90,000 BD TPA by upgrading the existing pulp mill without increasing the permitted paper production capacity of 1,00,000 TPA
PJ-ENVIR-2017830-1366 Dated: November 2018
Chapter-7 Environment Monitoring Program
Page 209
Environmental Component
Monitoring Type Monitoring
Location
Monitoring/ recording Frequency
Monitoring Program for
Proposed Project
Effluent
Piezometric Analysis
16 piezometric points in Green Belt Area and Irrigation Area
Monthly Existing practices will be continued
Soil Environment
Soil Quality Monitoring (pH, Texture, Electrical Conductivity, Organic Matter, Nitrogen, Phosphate, Sodium, Calcium, Potassium and Magnesium
Green Belt Area and Irrigation Area
Half yearly Existing practices will be continued
7.5. Data Analysis
The monitored data will be analyzed and compared with the baseline levels as established in
the EIA study and the regulatory standards specified by different government agencies. The
standards against which the different environment components will be compared are as per
Table 7.2.
Table 7-2 Recommended Environmental Monitoring Plan
S.No Component Applicable Standards
1 Ambient Air Quality
National Ambient Air Quality Standards (NAAQS), Central Pollution Control Board, Madhya Pradesh Pollution Control Board (MPPCB)
2 Noise Quality Ambient Air Quality Standards with respect to Noise, CPCB
3 Surface Water Quality
IS:2296: Class ‘C’ Water, CPCB
4 Groundwater Quality IS: 10500 Standards, BIS
5 Soil Quality --
6 Treated wastewater IS 3306(1974) – Discharge on land Madhya Pradesh Pollution Control Board (MPPCB)
EIA for the Proposed Capacity Enhancement by Increasing Pulp Production from 62,000 BD TPA to 90,000 BD TPA by upgrading the existing pulp mill without increasing the permitted paper production capacity of 1,00,000 TPA
PJ-ENVIR-2017830-1366 Dated: November 2018
Chapter-7 Environment Monitoring Program
Page 210
7.6. Reporting Schedule
The monitoring results of the different environmental components will be analyzed and
compiled report will be sent to Regional office MoEF&CC and concerned authorities on six
monthly basis. PM10, PM2.5, Sox, NOx BOD, COD, TSS, TDS and other relevant paramters will
be monitored online and logged on to MPPCB / CPCB web portals. The report will also list
the project activities along with the environmental mitigation measures and will evaluate
the efficacy of the Environmental Management Plan.
EIA for the Proposed Capacity Enhancement by Increasing Pulp Production from 62,000 BD TPA to 90,000 BD TPA by upgrading the existing pulp mill without increasing the permitted paper production capacity of 1,00,000 TPA
PJ-ENVIR-2017830-1366 Dated: November 2018
Chapter-8 Additional Studies
Page 211
8 ADDITIONAL STUDIES
This chapter includes details of Public Consultation, Risk Assessment with Mitigation
measures etc.
8.1 Public Consultation
M/s Orient Paper Mill Industries Ltd., Amlai filed an application in the office of Ministry of
Environment, Forest and Climate Change (MoEF&CC), Government of India, New Delhi for
getting Environmental Clearance under EIA notification no. 1533 (E) dated 14.09.2006 for
the enhancing the pulp manufacturing capacity from 62,000 TPA to 90,000 TPA by
upgrading the existing pulp mill without increasing the permitted paper production capacity
of 1,00,000 TPA.
The draft Environmental Impact Assessment Study Report along with Executive Summary,
both in English and vernacular language (Hindi) was submitted to Madhya Pradesh Pollution
Control Board requesting for conduct of Public Hearing for the proposed project.
In compliance to provision of the EIA notification dated 14.09.2006, the board issued public
notice of 30 days in two daily newspapers on 21st and 22nd September 2018 namely, ‘The
Times of India’ (English Daily) and ‘Dainik Bhaskar, Dainik Raj Express’ for getting reponses
from public and intimating time, date and venue of the public hearing fixed for 23.10.2018
at the project site. In addition, announcements were made on nearby places on
loudspeakers and banners were pasted at various locations. The advertisement is presented
in the Figure 8.1. Thereafter, public hearing for the said project was conducted on
23.10.2018, which was attended by 202 persons.
EIA for the Proposed Capacity Enhancement by Increasing Pulp Production from 62,000 BD TPA to 90,000 BD TPA by upgrading the existing pulp mill without increasing the permitted paper production capacity of 1,00,000 TPA
PJ-ENVIR-2017830-1366 Dated: November 2018
Chapter-8 Additional Studies
Page 212
Figure 8-1 Advertisement of Public Hearing Published in Local News Paper
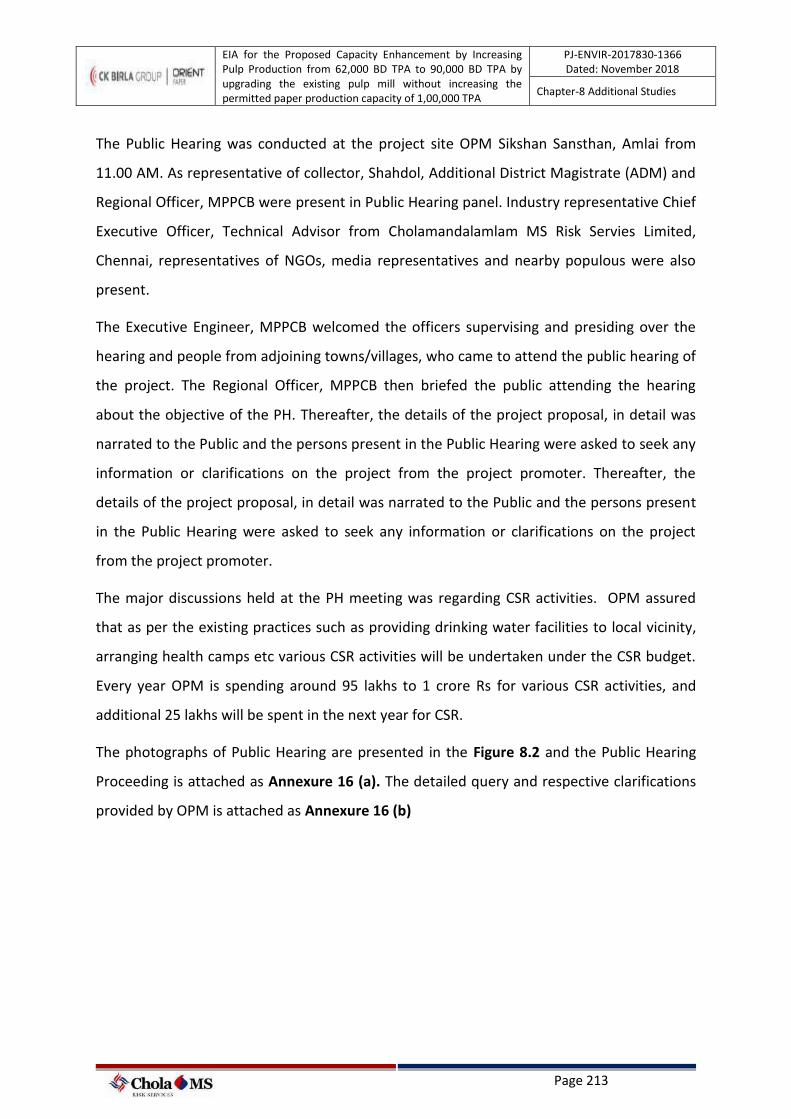
EIA for the Proposed Capacity Enhancement by Increasing Pulp Production from 62,000 BD TPA to 90,000 BD TPA by upgrading the existing pulp mill without increasing the permitted paper production capacity of 1,00,000 TPA
PJ-ENVIR-2017830-1366 Dated: November 2018
Chapter-8 Additional Studies
Page 213
The Public Hearing was conducted at the project site OPM Sikshan Sansthan, Amlai from
11.00 AM. As representative of collector, Shahdol, Additional District Magistrate (ADM) and
Regional Officer, MPPCB were present in Public Hearing panel. Industry representative Chief
Executive Officer, Technical Advisor from Cholamandalamlam MS Risk Servies Limited,
Chennai, representatives of NGOs, media representatives and nearby populous were also
present.
The Executive Engineer, MPPCB welcomed the officers supervising and presiding over the
hearing and people from adjoining towns/villages, who came to attend the public hearing of
the project. The Regional Officer, MPPCB then briefed the public attending the hearing
about the objective of the PH. Thereafter, the details of the project proposal, in detail was
narrated to the Public and the persons present in the Public Hearing were asked to seek any
information or clarifications on the project from the project promoter. Thereafter, the
details of the project proposal, in detail was narrated to the Public and the persons present
in the Public Hearing were asked to seek any information or clarifications on the project
from the project promoter.
The major discussions held at the PH meeting was regarding CSR activities. OPM assured
that as per the existing practices such as providing drinking water facilities to local vicinity,
arranging health camps etc various CSR activities will be undertaken under the CSR budget.
Every year OPM is spending around 95 lakhs to 1 crore Rs for various CSR activities, and
additional 25 lakhs will be spent in the next year for CSR.
The photographs of Public Hearing are presented in the Figure 8.2 and the Public Hearing
Proceeding is attached as Annexure 16 (a). The detailed query and respective clarifications
provided by OPM is attached as Annexure 16 (b)
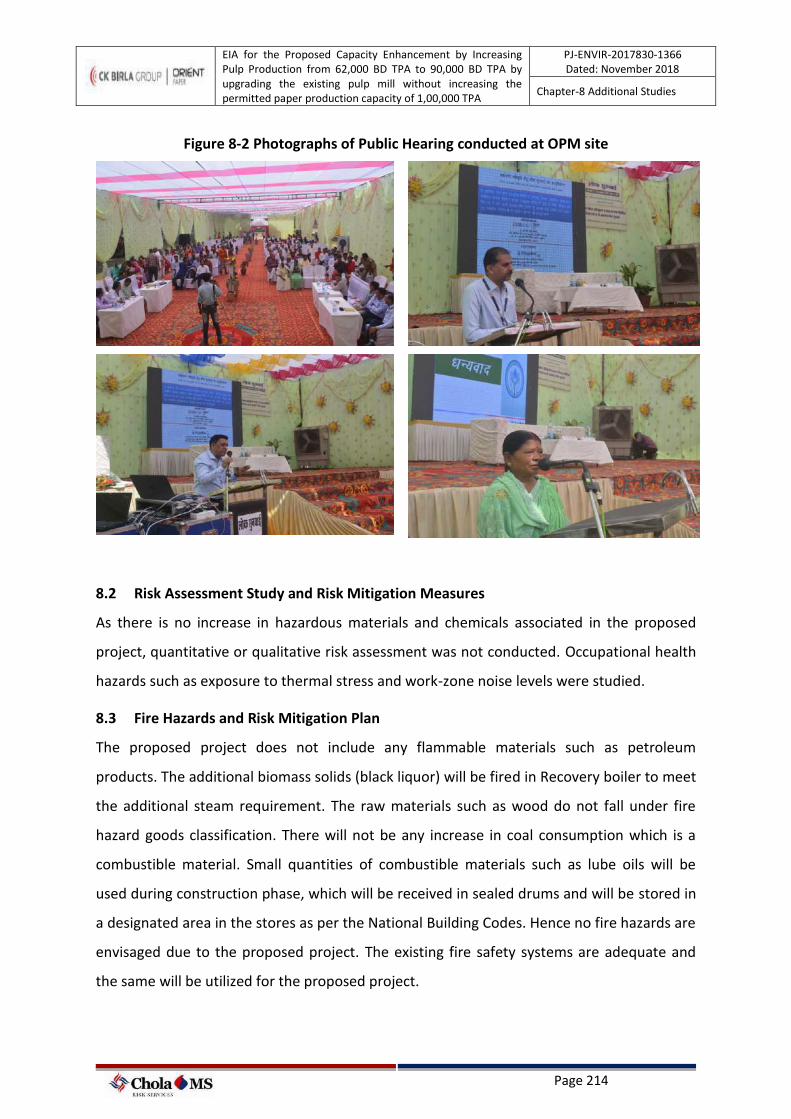
EIA for the Proposed Capacity Enhancement by Increasing Pulp Production from 62,000 BD TPA to 90,000 BD TPA by upgrading the existing pulp mill without increasing the permitted paper production capacity of 1,00,000 TPA
PJ-ENVIR-2017830-1366 Dated: November 2018
Chapter-8 Additional Studies
Page 214
Figure 8-2 Photographs of Public Hearing conducted at OPM site
8.2 Risk Assessment Study and Risk Mitigation Measures
As there is no increase in hazardous materials and chemicals associated in the proposed
project, quantitative or qualitative risk assessment was not conducted. Occupational health
hazards such as exposure to thermal stress and work-zone noise levels were studied.
8.3 Fire Hazards and Risk Mitigation Plan
The proposed project does not include any flammable materials such as petroleum
products. The additional biomass solids (black liquor) will be fired in Recovery boiler to meet
the additional steam requirement. The raw materials such as wood do not fall under fire
hazard goods classification. There will not be any increase in coal consumption which is a
combustible material. Small quantities of combustible materials such as lube oils will be
used during construction phase, which will be received in sealed drums and will be stored in
a designated area in the stores as per the National Building Codes. Hence no fire hazards are
envisaged due to the proposed project. The existing fire safety systems are adequate and
the same will be utilized for the proposed project.
EIA for the Proposed Capacity Enhancement by Increasing Pulp Production from 62,000 BD TPA to 90,000 BD TPA by upgrading the existing pulp mill without increasing the permitted paper production capacity of 1,00,000 TPA
PJ-ENVIR-2017830-1366 Dated: November 2018
Chapter-8 Additional Studies
Page 215
8.4 Occupational Health and Noise Management Plan
Based on the noise details presented in Chapter 5 of this report, no major noise generating
sources are associated with the proposed capacity enhancement project as OPM will be
procuring/ augmenting the equipment with guaranteed noise levels less than 85 dBA at one
(1) metre distance from the respective machines/equipment. Hence, the noise levels from
the proposed project are insignificant and well within the standards prescribed by the CPCB.
However, the following occupational noise management plan shall be adopted for the mill
operations:
1. If noise level is above 85 dB(A) then the following procedures shall be adopted:
• Employees will be informed about the noise environment and appropriate measures
shall be taken to reduce exposure.
• Appropriate PPE for ear protection will be made available with proper training
• Hearing checks must be made available to employees exposed to noise levels in
excess of 85 dB(A) over an 8-hour period
• Although ear-plugs and ear-muff will be provided to the persons working in the Mill
area, as a part of the good management practices, work rotation scheme will be
adopted for the persons working in the high noise generating areas.
2. If noise levels near the machinery exceed 90 dB(A), then the following corrective
procedure shall be adopted:
• Identify reasons for the excess noise and preventive measures shall be taken up
• Identify and clearly designate hearing conservation zones
• Using ear protection is mandatory and shall be supervised
8.5 Occupational Safety Management and Surveillance Programme
The Ministry of Labour and Employment, Government of India has a nodal organisation, viz.
Directorate General Factory Advice Service and Labour Institutes (DGFASLI), in dealing with
Occupational Safety and Health issues in Industries. The DGFASLI is the technical arm of the
Ministry on matters connected with Occupational Health in the manufacturing and port
sectors.
EIA for the Proposed Capacity Enhancement by Increasing Pulp Production from 62,000 BD TPA to 90,000 BD TPA by upgrading the existing pulp mill without increasing the permitted paper production capacity of 1,00,000 TPA
PJ-ENVIR-2017830-1366 Dated: November 2018
Chapter-8 Additional Studies
Page 216
The Factories Act, 1948, provides for appointment of qualified Medical Practitioners and
Certified Surgeons to examine young persons engaged in dangerous manufacturing
processes and to ensure medical supervision in case of illness due to the nature of
manufacturing processes. The Factories Act, 1948, also provides for notification of certain
occupational diseases as listed in the Third Schedule of the Act. As per Section 90 of the
Factories Act, 1948, the State Government is vested with the powers to appoint a
Competent Person to conduct inquiry into the causes of any accident or notifiable diseases.
As discussed in Chapter 2, OPM has a full-fledged Occupational Health Centre within the mill
premises. OHC is manned by two qualified doctors supported with paramedical staffs. The
facilities available at OPM OHC are given below.
➢ OPD Facility, Indoor & round the Clock emergency care
➢ Total No. of Beds – 12 (Twelve)
➢ Male Medical Ward- 07 Nos
➢ Female Medical Ward -04 Nos
➢ Labour Room
➢ ICU Unit- 01 No
➢ Pathology Lab for all types of routine tests
➢ Pharmacy Section with all types of medicine for employees & Villagers
➢ Immunization Facility
➢ ECG Machine
➢ X – ray Machine
➢ Ambulance Facility round the clock
The medical tests undertaken as part of the occupational health surveillance program are
presented in Chapter 2. As part of the routine and annual medical examinations on the
persons working in the high noise generating areas, stress areas and dust exposure areas, a
comprehensive surveillance programme may be adopted. Some of the good management
practices are suggested in Tables 8.1 and 8.2.
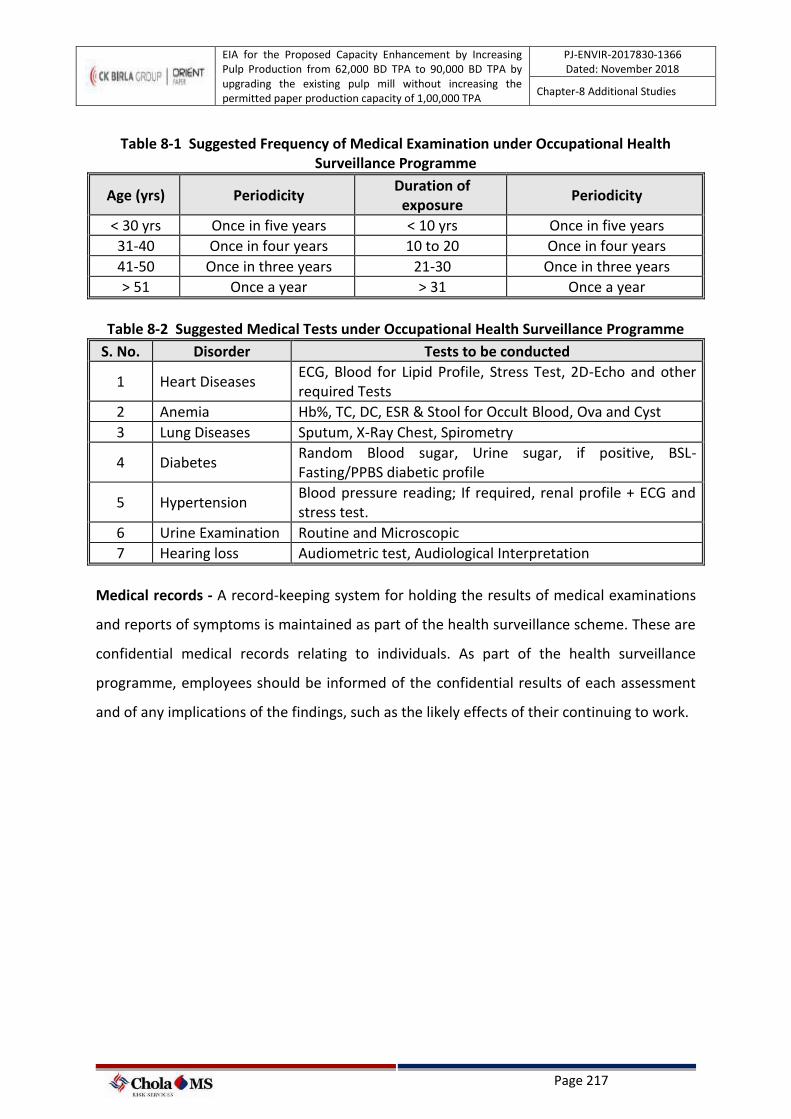
EIA for the Proposed Capacity Enhancement by Increasing Pulp Production from 62,000 BD TPA to 90,000 BD TPA by upgrading the existing pulp mill without increasing the permitted paper production capacity of 1,00,000 TPA
PJ-ENVIR-2017830-1366 Dated: November 2018
Chapter-8 Additional Studies
Page 217
Table 8-1 Suggested Frequency of Medical Examination under Occupational Health Surveillance Programme
Age (yrs) Periodicity Duration of
exposure Periodicity
< 30 yrs Once in five years < 10 yrs Once in five years
31-40 Once in four years 10 to 20 Once in four years
41-50 Once in three years 21-30 Once in three years
> 51 Once a year > 31 Once a year
Table 8-2 Suggested Medical Tests under Occupational Health Surveillance Programme
S. No. Disorder Tests to be conducted
1 Heart Diseases ECG, Blood for Lipid Profile, Stress Test, 2D-Echo and other required Tests
2 Anemia Hb%, TC, DC, ESR & Stool for Occult Blood, Ova and Cyst
3 Lung Diseases Sputum, X-Ray Chest, Spirometry
4 Diabetes Random Blood sugar, Urine sugar, if positive, BSL-Fasting/PPBS diabetic profile
5 Hypertension Blood pressure reading; If required, renal profile + ECG and stress test.
6 Urine Examination Routine and Microscopic
7 Hearing loss Audiometric test, Audiological Interpretation
Medical records - A record-keeping system for holding the results of medical examinations
and reports of symptoms is maintained as part of the health surveillance scheme. These are
confidential medical records relating to individuals. As part of the health surveillance
programme, employees should be informed of the confidential results of each assessment
and of any implications of the findings, such as the likely effects of their continuing to work.
EIA for the Proposed Capacity Enhancement by Increasing Pulp Production from 62,000 BD TPA to 90,000 BD TPA by upgrading the existing pulp mill without increasing the permitted paper production capacity of 1,00,000 TPA
PJ-ENVIR-2017830-1366 Dated: November 2018
Chapter-9 Project Benefits
Page 218
9 PROJECT BENEFITS
The proposed project is only a capacity enhancement of pulp mill. Enhanced in-house pulp
production will help reduce the foreign exchange outgo on account of reduction in quantity
of Imported Pulp. The facility will be providing employment to around 100 contract labours
during the construction phase.
9.1 Corporate Environment Responsibility
The capital CER budget is arrived based on the office memorandum Corporate Environment
Responsibility (CER) issued by MoEF&CC dated 1st May 2018. The cost of CER is to be in
addition to the cost envisaged for the implementation of the EIA/EMP which includes
measures for the pollution control, environment protection and conservation.
A need-based CSR assessment has been carried out and accordingly the budget allocated
will be spent for various community development programs.
EIA for the Proposed Capacity Enhancement by Increasing Pulp Production from 62,000 BD TPA to 90,000 BD TPA by upgrading the existing pulp mill without increasing the permitted paper production capacity of 1,00,000 TPA
PJ-ENVIR-2017830-1366 Dated: November 2018
Chapter-10 Environmental Management Plan
Page 219
10 ENVIRONMENTAL MANAGEMENT PLAN
10.1 General
Based on detailed analysis on the possible residual environmental risks associated with the
project, a comprehensive environmental management plan has been developed and
presented in this section.
10.2 Administrative Aspects
The key benefits of EMP are that it provides the organization, the means of managing and
improving its environmental performance thereby allowing it to contribute to better
environmental quality. The other benefits include cost control and improved relations with
the stakeholders. EMP includes four major elements;
• Commitment & Policy
• Planning
• Implementation
• Measurement & Evaluation
10.2.1 Commitment and Policy
OPM has adopted a structured approach for managing environmental and regulatory
responsibilities to improve overall environmental performance, including areas that are not
subjected to regulation such as unregulated risk, resource conservation, energy efficiency
etc.
The paper mill has been awarded with certifications namely ISO 9001:2015, ISO 14001:2015,
BS OSHAS 18001:2007, 50001:2011 and are presented in Figure 10.1.
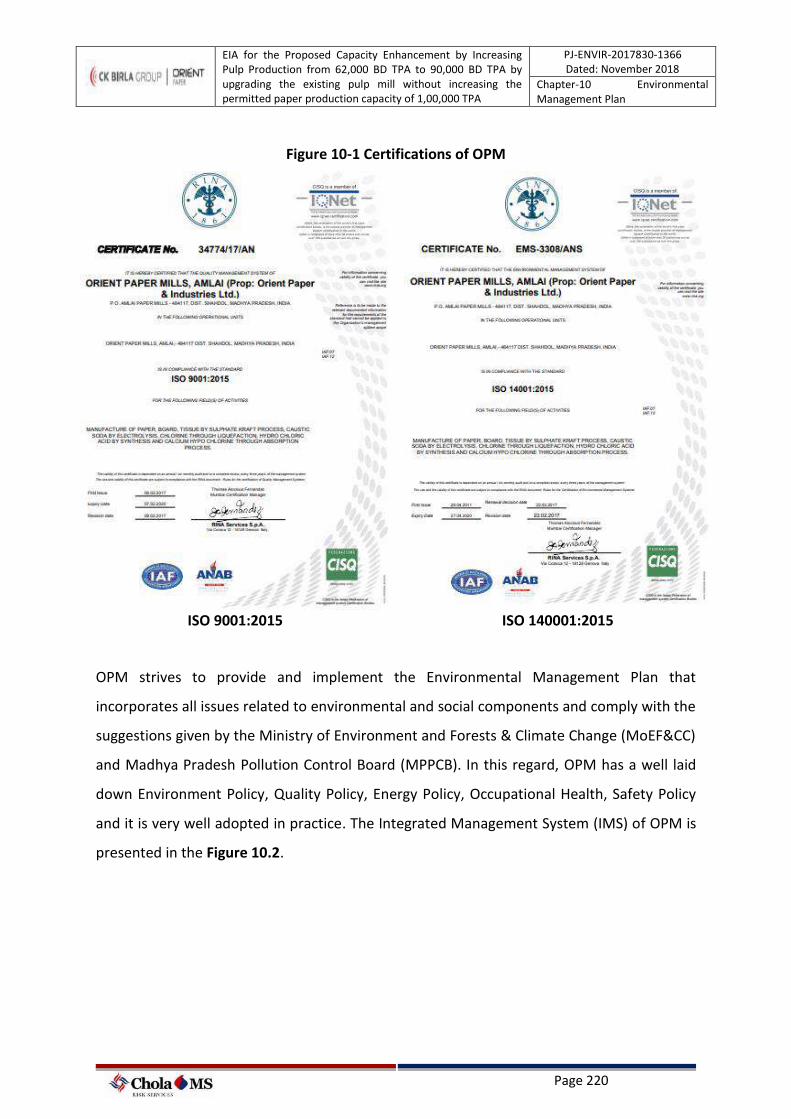
EIA for the Proposed Capacity Enhancement by Increasing Pulp Production from 62,000 BD TPA to 90,000 BD TPA by upgrading the existing pulp mill without increasing the permitted paper production capacity of 1,00,000 TPA
PJ-ENVIR-2017830-1366 Dated: November 2018
Chapter-10 Environmental Management Plan
Page 220
Figure 10-1 Certifications of OPM
ISO 9001:2015 ISO 140001:2015
OPM strives to provide and implement the Environmental Management Plan that
incorporates all issues related to environmental and social components and comply with the
suggestions given by the Ministry of Environment and Forests & Climate Change (MoEF&CC)
and Madhya Pradesh Pollution Control Board (MPPCB). In this regard, OPM has a well laid
down Environment Policy, Quality Policy, Energy Policy, Occupational Health, Safety Policy
and it is very well adopted in practice. The Integrated Management System (IMS) of OPM is
presented in the Figure 10.2.
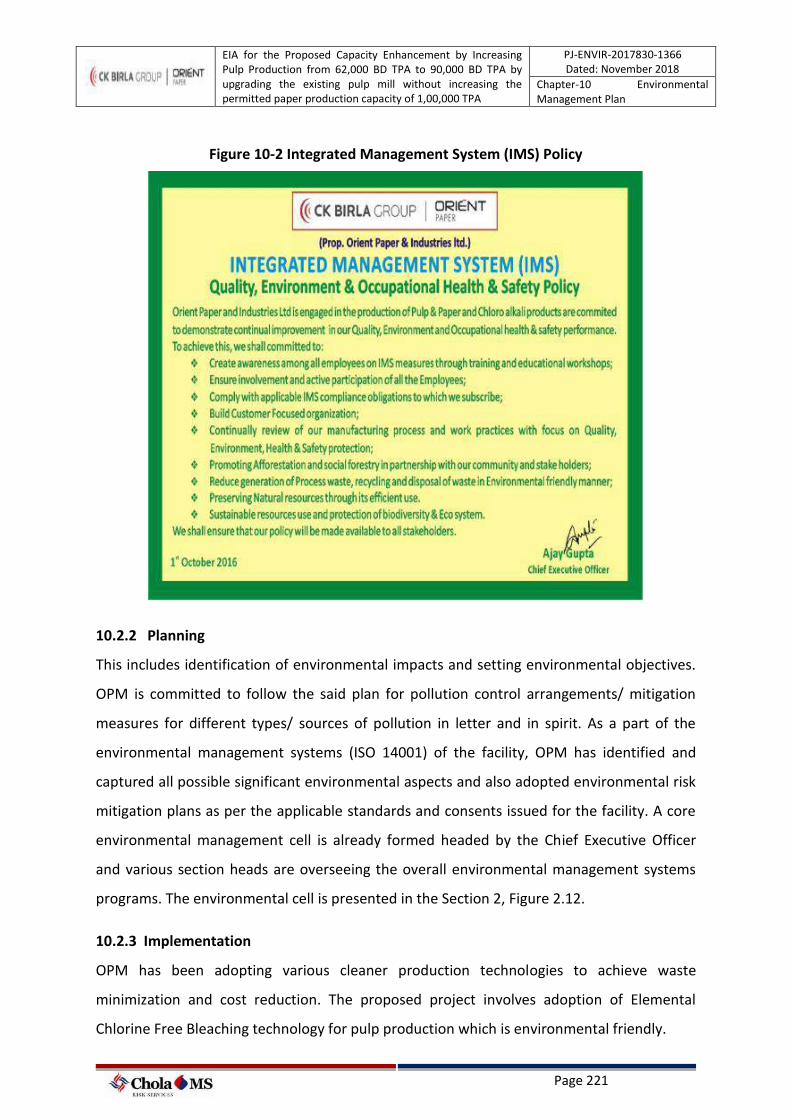
EIA for the Proposed Capacity Enhancement by Increasing Pulp Production from 62,000 BD TPA to 90,000 BD TPA by upgrading the existing pulp mill without increasing the permitted paper production capacity of 1,00,000 TPA
PJ-ENVIR-2017830-1366 Dated: November 2018
Chapter-10 Environmental Management Plan
Page 221
Figure 10-2 Integrated Management System (IMS) Policy
10.2.2 Planning
This includes identification of environmental impacts and setting environmental objectives.
OPM is committed to follow the said plan for pollution control arrangements/ mitigation
measures for different types/ sources of pollution in letter and in spirit. As a part of the
environmental management systems (ISO 14001) of the facility, OPM has identified and
captured all possible significant environmental aspects and also adopted environmental risk
mitigation plans as per the applicable standards and consents issued for the facility. A core
environmental management cell is already formed headed by the Chief Executive Officer
and various section heads are overseeing the overall environmental management systems
programs. The environmental cell is presented in the Section 2, Figure 2.12.
10.2.3 Implementation
OPM has been adopting various cleaner production technologies to achieve waste
minimization and cost reduction. The proposed project involves adoption of Elemental
Chlorine Free Bleaching technology for pulp production which is environmental friendly.
EIA for the Proposed Capacity Enhancement by Increasing Pulp Production from 62,000 BD TPA to 90,000 BD TPA by upgrading the existing pulp mill without increasing the permitted paper production capacity of 1,00,000 TPA
PJ-ENVIR-2017830-1366 Dated: November 2018
Chapter-10 Environmental Management Plan
Page 222
OPM has undertaken several measures for protecting the environment in line with its
commitment for sustainable development. Thus, the same measures will be continued
during the post project scenario. OPM has also been ensuring that trained manpower is
available for operating, maintaining and documenting the effective environmental
operations.
10.2.4 Measurement and Evaluation
This includes monitoring and implementation of the identified mitigation measures,
corrective actions and record keeping. Wherever required, appropriate mitigation measures
have been recommended to minimize the impact on the environmental and social
parameters.
The existing facility has been adopting various environmental monitoring programs as per
the consent to establish and consent to operate issued by state pollution control board and
the environmental monitoring data is submitted to state pollution control board regularly.
Online emission monitoring and wastewater quality monitoring are being adopted on
designated and mandated emissions and discharges as per the state pollution control board
guidelines. The same will be continued during the post project scenario.
10.3 Environmental Management during Construction Phase
The impacts during the construction phase on the environment would be basically transient
in nature and are expected to reduce gradually to localised phenomena. However, the
proposed project does not include any major constructional activities. No additional units
such as recovery boiler, re-causticizing plant, co-generation plant is being envisaged as the
existing facilities are adequate except the addition of Black liquor Evaporation capacity for
additional pulp production. Also, the existing recovery boiler will be retrofitted to fire the
additional black liquor solids generated from the pulp mill.
• No additional land is required for the proposed project. Therefore, impact on
environment due to the proposed project during construction phase is insignificant.
• OPM will follow the MoEF&CC notification on Construction and Demolition Waste
Management Rules, 2016 published on March 29, 2016 for proper collection,
transportation & disposal/ recycling of the construction waste.
EIA for the Proposed Capacity Enhancement by Increasing Pulp Production from 62,000 BD TPA to 90,000 BD TPA by upgrading the existing pulp mill without increasing the permitted paper production capacity of 1,00,000 TPA
PJ-ENVIR-2017830-1366 Dated: November 2018
Chapter-10 Environmental Management Plan
Page 223
• Existing Dust suppression system (water sprinkling) will be utilized while loading/
unloading of construction materials;
• High noise generating systems such as generators will not be operated
• High noise and vibration causing construction activities such as blasting and drilling
etc are not envisaged
• The work-force will be sourced from the local areas and hence onsite construction
workers camps are not envisaged.
10.4 Environmental Management Plan during Operation Phase
The Environmental Management Plan for the proposed project aims at minimizing the
pollution the source. Operational phase environmental management plan includes the
following;
➢ Air quality Management Plan
➢ Noise Management Plan
➢ Water and Wastewater Management
➢ Solid and Hazardous Waste Disposal Management
➢ Storm Water Management Plan
➢ Ecological/ Biodiversity Improvement Plan
➢ Community Development Plan
10.4.1 Air Quality Management Plan
The impacts on air quality due to the proposed project have been discussed in Chapter 5 of
the EIA report.
• No additional emissions from power boilers are envisaged as there is no increase in coal
consumption. The existing air pollution control measures are explained in detail in the
Chapter-2 of the report.
• No additional fugitive emissions are envisaged due to the proposed project. OPM has
already implemented various fugitive emissions control plan in the existing facility and
are presented hereunder;
➢ Adequate covered coal shed already in place
➢ All coal transfer points are provided with dust extraction and collection systems
EIA for the Proposed Capacity Enhancement by Increasing Pulp Production from 62,000 BD TPA to 90,000 BD TPA by upgrading the existing pulp mill without increasing the permitted paper production capacity of 1,00,000 TPA
PJ-ENVIR-2017830-1366 Dated: November 2018
Chapter-10 Environmental Management Plan
Page 224
➢ Adequate water sprinklers are in place
• The additional emissions envisaged from the proposed project is mainly from the
additional solids firing in the chemical recovery boiler and lime kiln which was found to
be very low. However, the existing ESP of chemical recovery boiler will be upgraded as
per the requirement to meet the prescribed limits of MPPCB. The existing stacks and
ESP attached to the lime kiln are adequate and hence the existing pollution control
systems and monitoring plan will be continued during the post project scenario.
• OPM has proposed to install NCG incineration system. The NCGs and Mercaptans
formed at the pulp mill section digesters, blow tank systems and evaporators will be
collected and burnt in Rotary Lime Kilns. H2S emission testing will be carried out in the
limekiln stack on quarter yearly basis and similar practices will be continued during post
project scenario.
10.4.2 Noise Management Plan
No impact due to the noise is envisaged for the proposed capacity enhancement project.
Hence the existing noise management practices will be continued to limit the noise levels at
the facility to well within the stipulated norms.
• Ear plugs are being provided to workmen working near high noise generating
sources and the same shall be continued during post project scenario.
• The ambient noise levels at the facility are being monitored at 4 locations
periodically by MPPCB and the same shall be continued during post project scenario.
• The existing greenbelt around the plant shall be well maintained which will further
attenuate noise levels
10.4.3 Water and Wastewater Management
10.4.3.1 Water Conservation
• Although the proposed project includes increasing pulp production levels, no
additional water requirement is envisaged due to the adoption of ECF bleaching
technology and increased water conservation measures.
• There will be reduction in the freshwater consumption from the existing water
consumption level of 20,250 m3/day to 17,225 m3/day.
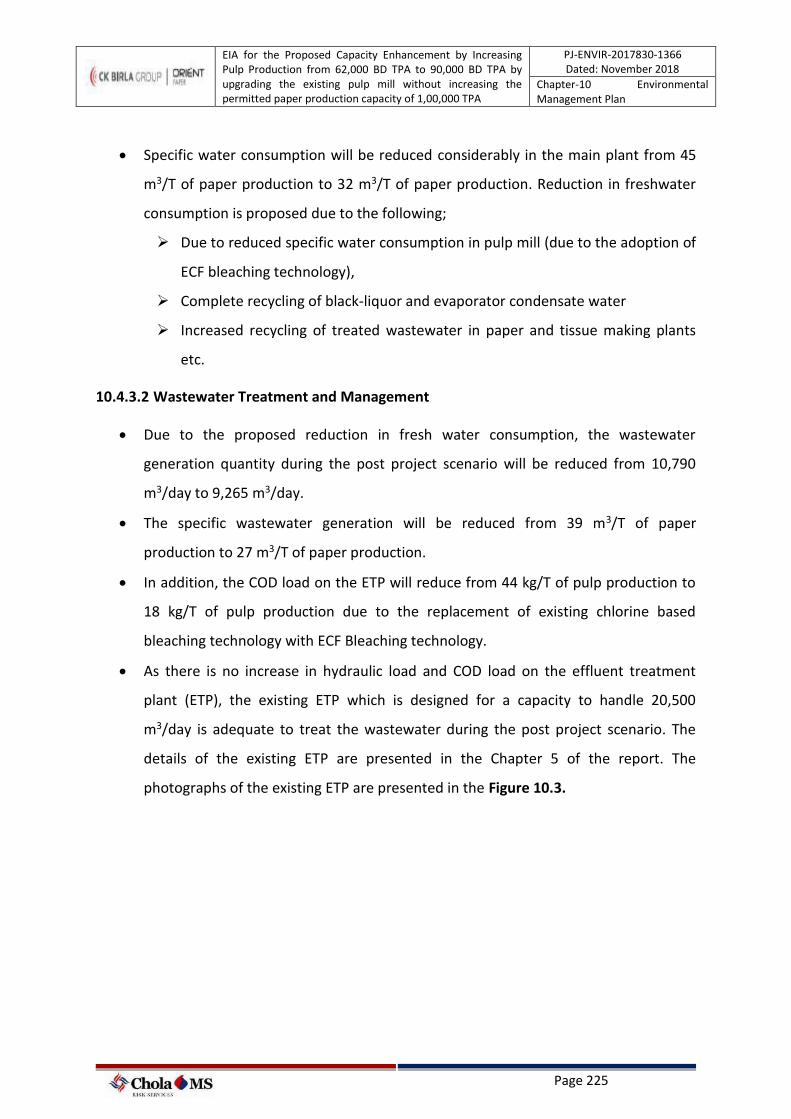
EIA for the Proposed Capacity Enhancement by Increasing Pulp Production from 62,000 BD TPA to 90,000 BD TPA by upgrading the existing pulp mill without increasing the permitted paper production capacity of 1,00,000 TPA
PJ-ENVIR-2017830-1366 Dated: November 2018
Chapter-10 Environmental Management Plan
Page 225
• Specific water consumption will be reduced considerably in the main plant from 45
m3/T of paper production to 32 m3/T of paper production. Reduction in freshwater
consumption is proposed due to the following;
➢ Due to reduced specific water consumption in pulp mill (due to the adoption of
ECF bleaching technology),
➢ Complete recycling of black-liquor and evaporator condensate water
➢ Increased recycling of treated wastewater in paper and tissue making plants
etc.
10.4.3.2 Wastewater Treatment and Management
• Due to the proposed reduction in fresh water consumption, the wastewater
generation quantity during the post project scenario will be reduced from 10,790
m3/day to 9,265 m3/day.
• The specific wastewater generation will be reduced from 39 m3/T of paper
production to 27 m3/T of paper production.
• In addition, the COD load on the ETP will reduce from 44 kg/T of pulp production to
18 kg/T of pulp production due to the replacement of existing chlorine based
bleaching technology with ECF Bleaching technology.
• As there is no increase in hydraulic load and COD load on the effluent treatment
plant (ETP), the existing ETP which is designed for a capacity to handle 20,500
m3/day is adequate to treat the wastewater during the post project scenario. The
details of the existing ETP are presented in the Chapter 5 of the report. The
photographs of the existing ETP are presented in the Figure 10.3.
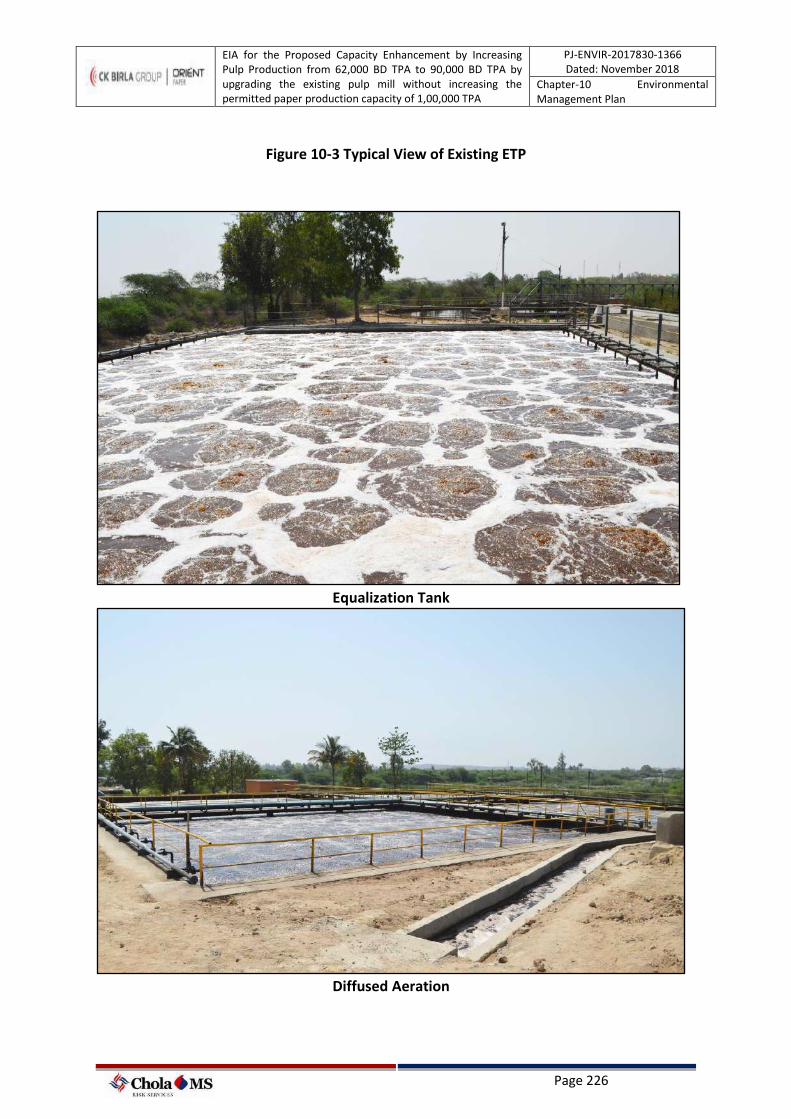
EIA for the Proposed Capacity Enhancement by Increasing Pulp Production from 62,000 BD TPA to 90,000 BD TPA by upgrading the existing pulp mill without increasing the permitted paper production capacity of 1,00,000 TPA
PJ-ENVIR-2017830-1366 Dated: November 2018
Chapter-10 Environmental Management Plan
Page 226
Figure 10-3 Typical View of Existing ETP
Equalization Tank
Diffused Aeration
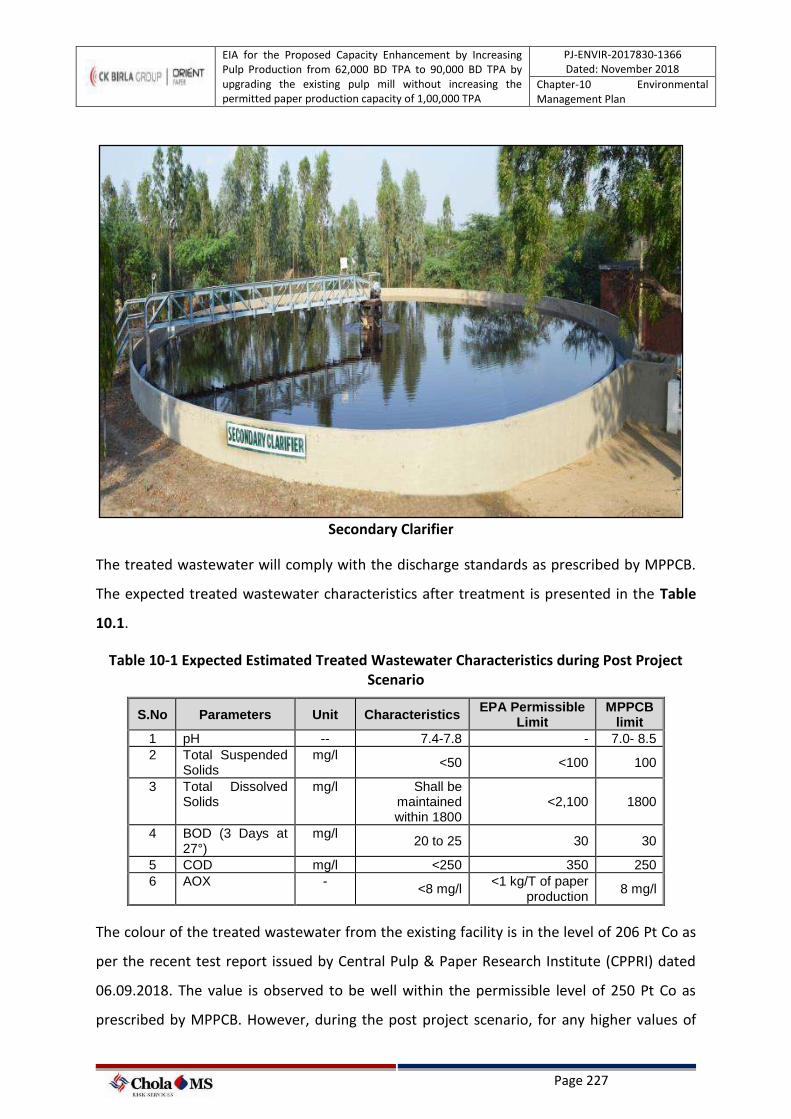
EIA for the Proposed Capacity Enhancement by Increasing Pulp Production from 62,000 BD TPA to 90,000 BD TPA by upgrading the existing pulp mill without increasing the permitted paper production capacity of 1,00,000 TPA
PJ-ENVIR-2017830-1366 Dated: November 2018
Chapter-10 Environmental Management Plan
Page 227
Secondary Clarifier
The treated wastewater will comply with the discharge standards as prescribed by MPPCB.
The expected treated wastewater characteristics after treatment is presented in the Table
10.1.
Table 10-1 Expected Estimated Treated Wastewater Characteristics during Post Project Scenario
S.No Parameters Unit Characteristics EPA Permissible
Limit MPPCB
limit
1 pH -- 7.4-7.8 - 7.0- 8.5
2 Total Suspended Solids
mg/l <50 <100 100
3 Total Dissolved Solids
mg/l Shall be maintained within 1800
<2,100 1800
4 BOD (3 Days at 27°)
mg/l 20 to 25 30 30
5 COD mg/l <250 350 250
6 AOX - <8 mg/l
<1 kg/T of paper production
8 mg/l
The colour of the treated wastewater from the existing facility is in the level of 206 Pt Co as
per the recent test report issued by Central Pulp & Paper Research Institute (CPPRI) dated
06.09.2018. The value is observed to be well within the permissible level of 250 Pt Co as
prescribed by MPPCB. However, during the post project scenario, for any higher values of

EIA for the Proposed Capacity Enhancement by Increasing Pulp Production from 62,000 BD TPA to 90,000 BD TPA by upgrading the existing pulp mill without increasing the permitted paper production capacity of 1,00,000 TPA
PJ-ENVIR-2017830-1366 Dated: November 2018
Chapter-10 Environmental Management Plan
Page 228
colour if observed, it is recommended to add Poly Aluminium Chloride (PACl) at the existing
tertiary clarifier to reduce the colour of the treated wastewater.
Online continuous treated wastewater monitoring system is set up at the existing facility
which is connected to CPCB server to monitor the treated wastewater quality. The same
shall be continued during the post project scenario. The photographs of the online
continuous effluent monitoring system are presented in the Figure 10.4.
Figure 10-4 Online Continuous Treated Wastewater Monitoring System
10.4.3.3 Treated Wastewater Management
No treated wastewater will be discharged into the River Sone. Out of the total treated
wastewater (9265 m3/day), about 250 m3/day of treated wastewater will be utilized for dust
suppression, firewater, reuse for plant domestic etc.
The remaining 9015 m3/day of treated effluent from ETP will discharged for land irrigation
application carried out through HRTS (High Rate Transpiration System) design as per the
existing practice. The total land area available for utilization of treated wastewater is about
633 acres including green belt and plantation. The facility has developed 17 plantation sites
in 400 acres of land for the utilization of treated effluent. Some of the photographs of the
plantation sites are presented in the Figure 10.5.
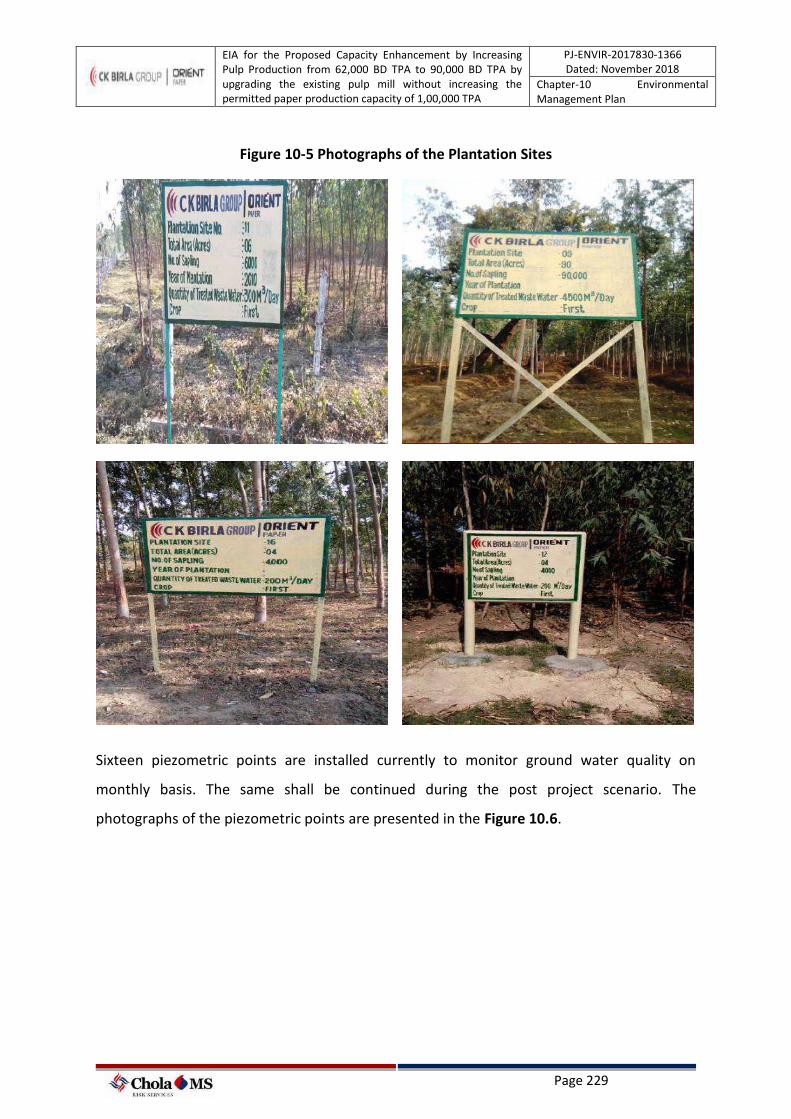
EIA for the Proposed Capacity Enhancement by Increasing Pulp Production from 62,000 BD TPA to 90,000 BD TPA by upgrading the existing pulp mill without increasing the permitted paper production capacity of 1,00,000 TPA
PJ-ENVIR-2017830-1366 Dated: November 2018
Chapter-10 Environmental Management Plan
Page 229
Figure 10-5 Photographs of the Plantation Sites
Sixteen piezometric points are installed currently to monitor ground water quality on
monthly basis. The same shall be continued during the post project scenario. The
photographs of the piezometric points are presented in the Figure 10.6.
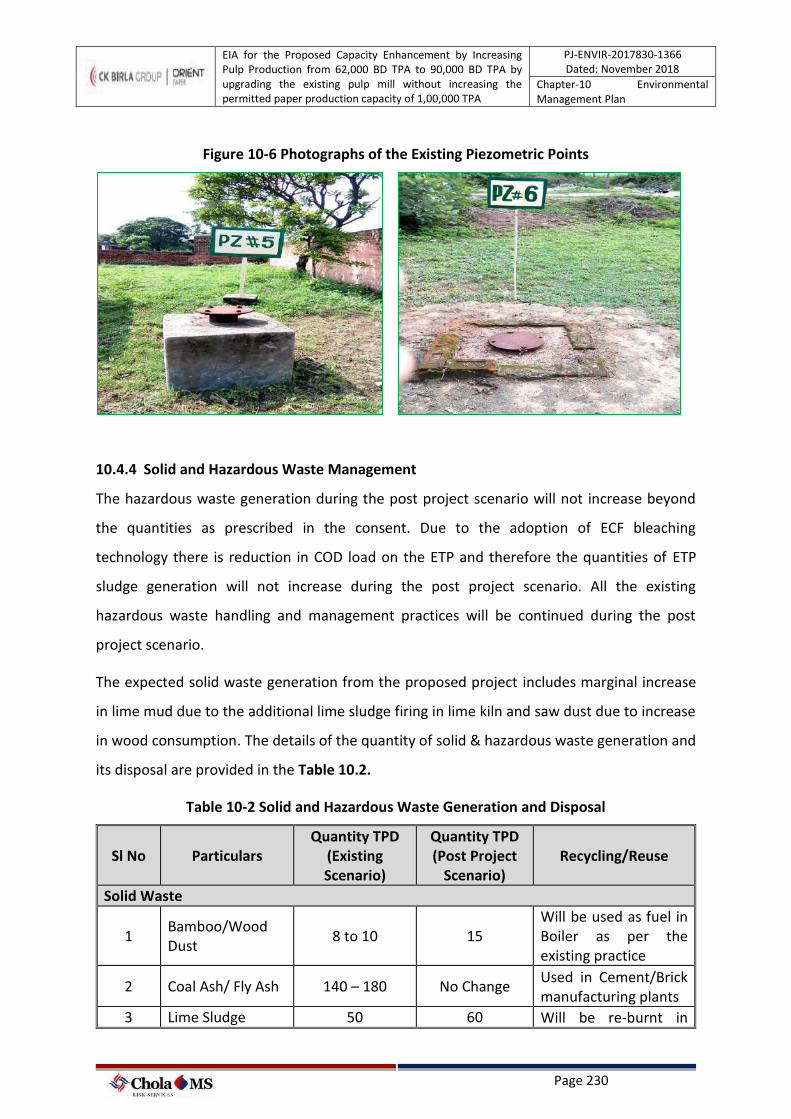
EIA for the Proposed Capacity Enhancement by Increasing Pulp Production from 62,000 BD TPA to 90,000 BD TPA by upgrading the existing pulp mill without increasing the permitted paper production capacity of 1,00,000 TPA
PJ-ENVIR-2017830-1366 Dated: November 2018
Chapter-10 Environmental Management Plan
Page 230
Figure 10-6 Photographs of the Existing Piezometric Points
10.4.4 Solid and Hazardous Waste Management
The hazardous waste generation during the post project scenario will not increase beyond
the quantities as prescribed in the consent. Due to the adoption of ECF bleaching
technology there is reduction in COD load on the ETP and therefore the quantities of ETP
sludge generation will not increase during the post project scenario. All the existing
hazardous waste handling and management practices will be continued during the post
project scenario.
The expected solid waste generation from the proposed project includes marginal increase
in lime mud due to the additional lime sludge firing in lime kiln and saw dust due to increase
in wood consumption. The details of the quantity of solid & hazardous waste generation and
its disposal are provided in the Table 10.2.
Table 10-2 Solid and Hazardous Waste Generation and Disposal
Sl No Particulars Quantity TPD
(Existing Scenario)
Quantity TPD (Post Project
Scenario) Recycling/Reuse
Solid Waste
1 Bamboo/Wood Dust
8 to 10 15 Will be used as fuel in Boiler as per the existing practice
2 Coal Ash/ Fly Ash 140 – 180 No Change Used in Cement/Brick manufacturing plants
3 Lime Sludge 50 60 Will be re-burnt in
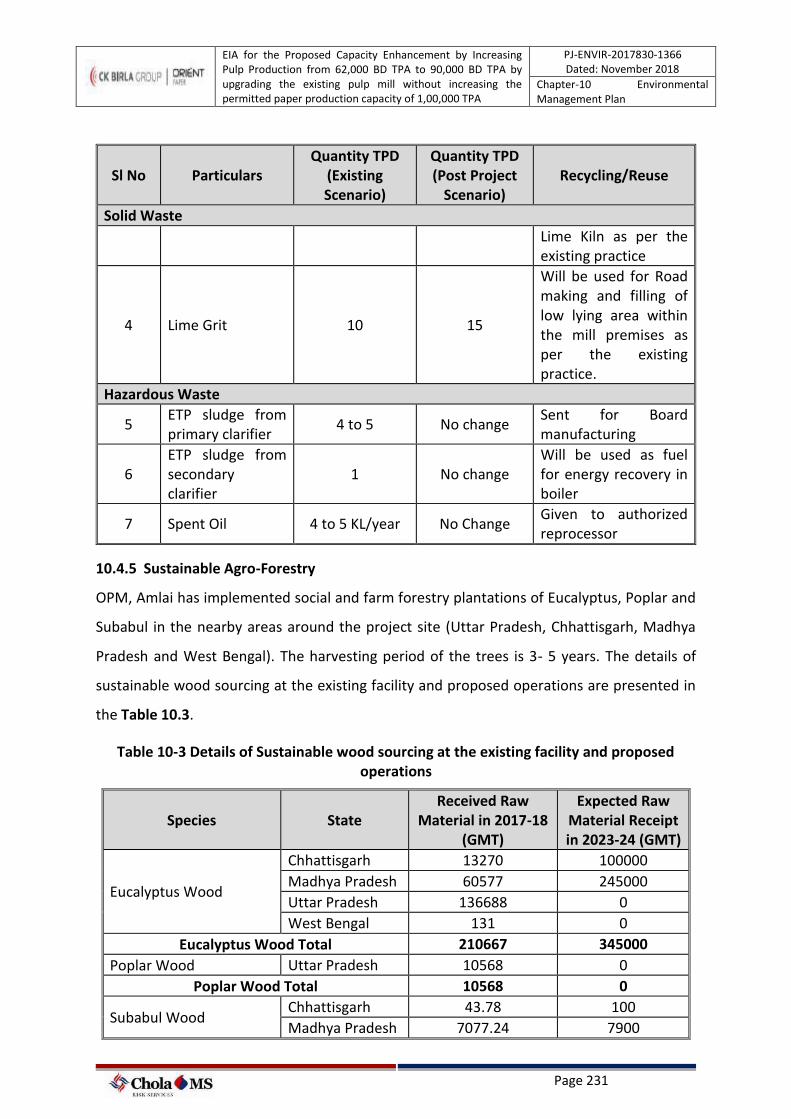
EIA for the Proposed Capacity Enhancement by Increasing Pulp Production from 62,000 BD TPA to 90,000 BD TPA by upgrading the existing pulp mill without increasing the permitted paper production capacity of 1,00,000 TPA
PJ-ENVIR-2017830-1366 Dated: November 2018
Chapter-10 Environmental Management Plan
Page 231
Sl No Particulars Quantity TPD
(Existing Scenario)
Quantity TPD (Post Project
Scenario) Recycling/Reuse
Solid Waste
Lime Kiln as per the existing practice
4 Lime Grit 10 15
Will be used for Road making and filling of low lying area within the mill premises as per the existing practice.
Hazardous Waste
5 ETP sludge from primary clarifier
4 to 5 No change Sent for Board manufacturing
6 ETP sludge from secondary clarifier
1 No change Will be used as fuel for energy recovery in boiler
7 Spent Oil 4 to 5 KL/year No Change Given to authorized reprocessor
10.4.5 Sustainable Agro-Forestry
OPM, Amlai has implemented social and farm forestry plantations of Eucalyptus, Poplar and
Subabul in the nearby areas around the project site (Uttar Pradesh, Chhattisgarh, Madhya
Pradesh and West Bengal). The harvesting period of the trees is 3- 5 years. The details of
sustainable wood sourcing at the existing facility and proposed operations are presented in
the Table 10.3.
Table 10-3 Details of Sustainable wood sourcing at the existing facility and proposed operations
Species State Received Raw
Material in 2017-18 (GMT)
Expected Raw Material Receipt in 2023-24 (GMT)
Eucalyptus Wood
Chhattisgarh 13270 100000
Madhya Pradesh 60577 245000
Uttar Pradesh 136688 0
West Bengal 131 0
Eucalyptus Wood Total 210667 345000
Poplar Wood Uttar Pradesh 10568 0
Poplar Wood Total 10568 0
Subabul Wood Chhattisgarh 43.78 100
Madhya Pradesh 7077.24 7900
EIA for the Proposed Capacity Enhancement by Increasing Pulp Production from 62,000 BD TPA to 90,000 BD TPA by upgrading the existing pulp mill without increasing the permitted paper production capacity of 1,00,000 TPA
PJ-ENVIR-2017830-1366 Dated: November 2018
Chapter-10 Environmental Management Plan
Page 232
Species State Received Raw
Material in 2017-18 (GMT)
Expected Raw Material Receipt in 2023-24 (GMT)
Subabul Wood Total 7121.02 8000
Grand Total 228357.72 353000
In order to support the farmers, Government of Madhya Pradesh has approved a novel
scheme in 2017 “Krushi Vaniki se Krushak Samrudhi Yojana”. Under this scheme, OPM has
provided the Forest Department, 25 lakh clonal saplings which are planted in Shahdol,
Anuppur & Umaria District on Farmers land under a tripartite agreement between Farmers,
Forest Department. & OPM. OPM assures buy back of crop on maturity at the prevailing
pulpwood purchase price.
Chhattisgarh government has also started “Hariyali Prasar Yojna” for the farmers to support
the agro-forestry activities to improve the livelihood of the farmers and protect the
environment. In the year 2017 OPM has provided 22 lakh saplings to Chhattisgarh Forest
Department under “Hariyali Prasar Yojna” and in the year 2018 OPM has received an order
to supply 55 lakh saplings to Chhattisgarh Forest Department under the same scheme.
Considering the above points, the action plan for sustainable agro-forestry during the
proposed project is listed as below;
• To cover the plantation of about 5000 ha area every year under plantation in the
catchment area of existing facility.
• Special focus on the villages located closer to the mill by extensive marketing and
conducting farmers meeting.
• To educate and train the farmers about correct practices to improve their yield.
• To open stock points in the different villages to cater small and marginal farmers
• To enhance the capacity of clonal production to meet the growing demand of
eucalyptus clones.
10.4.6 Rainwater Harvesting
To evaluate the feasibility of rainwater harvesting within the project site, 5 years monthly
normal rainfall has been considered. The potential runoff from the project site is estimated
based on Rational method. The co-efficient used to estimate the runoff from the different
EIA for the Proposed Capacity Enhancement by Increasing Pulp Production from 62,000 BD TPA to 90,000 BD TPA by upgrading the existing pulp mill without increasing the permitted paper production capacity of 1,00,000 TPA
PJ-ENVIR-2017830-1366 Dated: November 2018
Chapter-10 Environmental Management Plan
Page 233
surfaces is as follows. The co-efficient are considered are as per the MoEF&CC and CGWA
Guidelines.
• Roof Area - 0.95
• Asphalt and Paved Area - 0.85
• Green Belt Area - 0.20
• Open and Vacant Area - 0.30
Volume of rainwater that can be collected from the project site has been estimated for the
monthly normal rainfall. Vacant & Green belt area, Roof top area and paved area of the
project site have been separated for the run off estimation and conservation measures have
been suggested. The details of various areas are as follows;
Description Total area in Sq.m
Roof Area 1768478
Asphalt / Paved area 1655166
Green belt, Lawn 2562310
Total Area 5985954
10.4.6.1 Run off Estimation
Rational method has been used to estimate the runoff for the project site. As the site is an
undisturbed land the volume of water that is being generated after natural recharge is
about 1885395 m3/Year. The losses such as, Percolation, evaporation and other unforeseen
loses has been considered. The estimation of run off is presented in the Table 10.4.
Table 10-4 Run off Estimations
Month Rainfall in
(mm) Runoff Roof
area (m3) Runoff Asphalt
/Paved area (m3)
Runoff Green belt area
(m3)
Total Monthly
Runoff (m3) January 8.5 14280 11959 4356 44875 February 34.4 57794 48397 17629 181614 March 19.7 33097 27716 10096 104006 April 11.2 18817 15757 5740 59131 May 1.4 2352 1970 717 7391 June 147.5 247808 207516 75588 778720 July 272.2 457311 382956 139492 1437070 August 316.1 531065 444718 161989 1668837 September 162.5 273009 228620 83275 857913
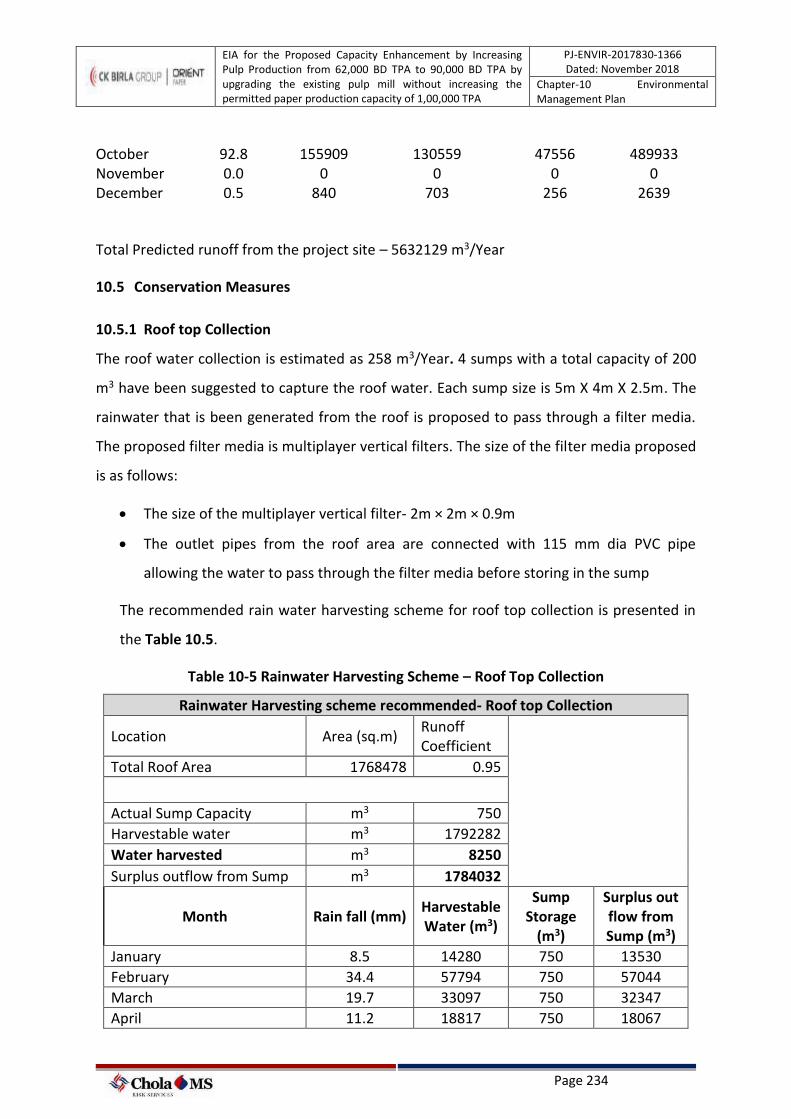
EIA for the Proposed Capacity Enhancement by Increasing Pulp Production from 62,000 BD TPA to 90,000 BD TPA by upgrading the existing pulp mill without increasing the permitted paper production capacity of 1,00,000 TPA
PJ-ENVIR-2017830-1366 Dated: November 2018
Chapter-10 Environmental Management Plan
Page 234
October 92.8 155909 130559 47556 489933 November 0.0 0 0 0 0 December 0.5 840 703 256 2639
Total Predicted runoff from the project site – 5632129 m3/Year
10.5 Conservation Measures
10.5.1 Roof top Collection
The roof water collection is estimated as 258 m3/Year. 4 sumps with a total capacity of 200
m3 have been suggested to capture the roof water. Each sump size is 5m X 4m X 2.5m. The
rainwater that is been generated from the roof is proposed to pass through a filter media.
The proposed filter media is multiplayer vertical filters. The size of the filter media proposed
is as follows:
• The size of the multiplayer vertical filter- 2m × 2m × 0.9m
• The outlet pipes from the roof area are connected with 115 mm dia PVC pipe
allowing the water to pass through the filter media before storing in the sump
The recommended rain water harvesting scheme for roof top collection is presented in
the Table 10.5.
Table 10-5 Rainwater Harvesting Scheme – Roof Top Collection
Rainwater Harvesting scheme recommended- Roof top Collection
Location Area (sq.m) Runoff Coefficient
Total Roof Area 1768478 0.95
Actual Sump Capacity m3 750
Harvestable water m3 1792282
Water harvested m3 8250
Surplus outflow from Sump m3 1784032
Month Rain fall (mm) Harvestable Water (m3)
Sump Storage
(m3)
Surplus out flow from Sump (m3)
January 8.5 14280 750 13530
February 34.4 57794 750 57044
March 19.7 33097 750 32347
April 11.2 18817 750 18067
EIA for the Proposed Capacity Enhancement by Increasing Pulp Production from 62,000 BD TPA to 90,000 BD TPA by upgrading the existing pulp mill without increasing the permitted paper production capacity of 1,00,000 TPA
PJ-ENVIR-2017830-1366 Dated: November 2018
Chapter-10 Environmental Management Plan
Page 235
Rainwater Harvesting scheme recommended- Roof top Collection
May 1.4 2352 750 1602
June 147.5 247808 750 247058
July 272.2 457311 750 456561
August 316.1 531065 750 530315
September 162.5 273009 750 272259
October 92.8 155909 750 155159
November 0.0 0 0 0
December 0.5 840 750 90
Total 1066.8 1792282 8250 1784032
The surplus runoff after roof top collection and from the green belt, asphalt area has been
estimated for Plant area
• Surplus runoff after roof top collection – 1784032 m3/Year
• Runoff from Asphalt area - 1500871 m3/Year
• Runoff from Green belt area - 546694 m3/Year
• Total runoff - 3831597 m3/Year
Rainwater harvesting can be enhanced by way of providing recharge shaft with bore well in
the storm water drain. 25 numbers of recharge shaft with bore well in the storm water drain
have been recommended.
Recharge shaft with bore well to a depth of 15 m is recommended in the Storm water drain.
The size of the recharge shaft may 3m length × 3width and 3m depth. In the center of the
recharge shaft a bore well with a dia of 6 inches may be drilled and perforated pipes may be
inserted to facilitate the vertical and horizontal movement of ground water. The Recharge
shaft with bore well not only recharges the shallow water table aquifer but also the deepens
the fractured aquifer.
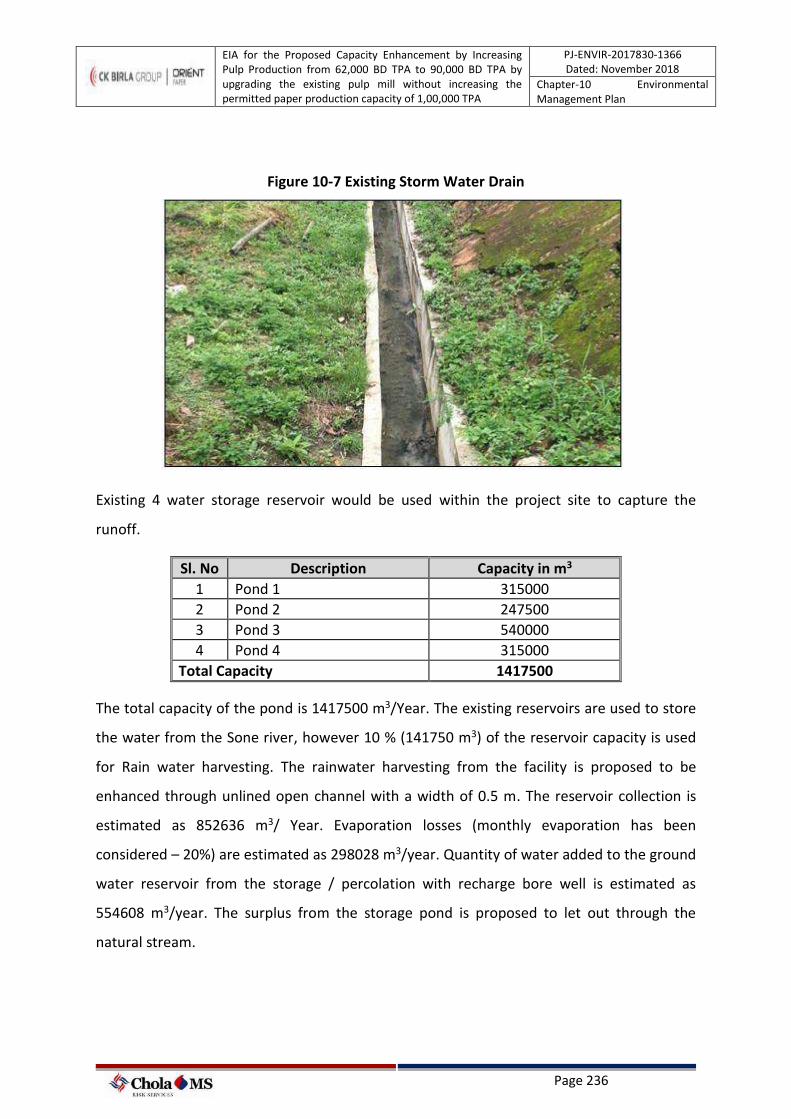
EIA for the Proposed Capacity Enhancement by Increasing Pulp Production from 62,000 BD TPA to 90,000 BD TPA by upgrading the existing pulp mill without increasing the permitted paper production capacity of 1,00,000 TPA
PJ-ENVIR-2017830-1366 Dated: November 2018
Chapter-10 Environmental Management Plan
Page 236
Figure 10-7 Existing Storm Water Drain
Existing 4 water storage reservoir would be used within the project site to capture the
runoff.
Sl. No Description Capacity in m3
1 Pond 1 315000
2 Pond 2 247500
3 Pond 3 540000
4 Pond 4 315000
Total Capacity 1417500
The total capacity of the pond is 1417500 m3/Year. The existing reservoirs are used to store
the water from the Sone river, however 10 % (141750 m3) of the reservoir capacity is used
for Rain water harvesting. The rainwater harvesting from the facility is proposed to be
enhanced through unlined open channel with a width of 0.5 m. The reservoir collection is
estimated as 852636 m3/ Year. Evaporation losses (monthly evaporation has been
considered – 20%) are estimated as 298028 m3/year. Quantity of water added to the ground
water reservoir from the storage / percolation with recharge bore well is estimated as
554608 m3/year. The surplus from the storage pond is proposed to let out through the
natural stream.
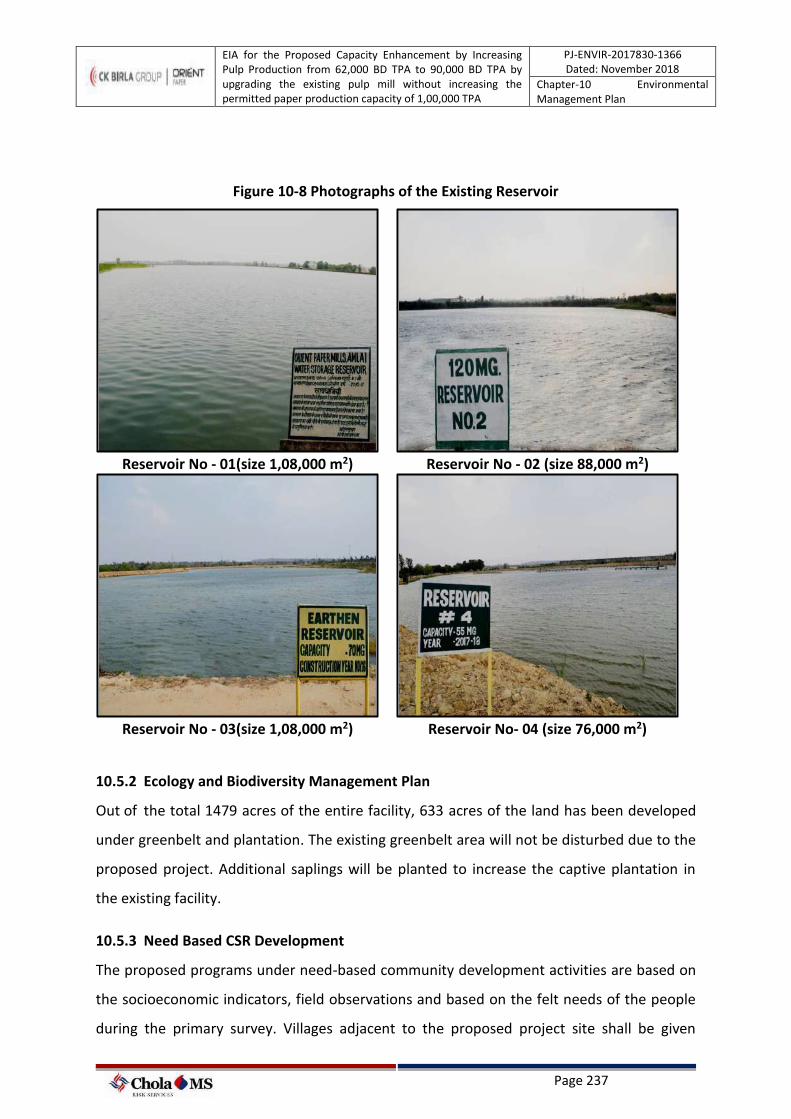
EIA for the Proposed Capacity Enhancement by Increasing Pulp Production from 62,000 BD TPA to 90,000 BD TPA by upgrading the existing pulp mill without increasing the permitted paper production capacity of 1,00,000 TPA
PJ-ENVIR-2017830-1366 Dated: November 2018
Chapter-10 Environmental Management Plan
Page 237
Figure 10-8 Photographs of the Existing Reservoir
Reservoir No - 01(size 1,08,000 m2) Reservoir No - 02 (size 88,000 m2)
Reservoir No - 03(size 1,08,000 m2) Reservoir No- 04 (size 76,000 m2)
10.5.2 Ecology and Biodiversity Management Plan
Out of the total 1479 acres of the entire facility, 633 acres of the land has been developed
under greenbelt and plantation. The existing greenbelt area will not be disturbed due to the
proposed project. Additional saplings will be planted to increase the captive plantation in
the existing facility.
10.5.3 Need Based CSR Development
The proposed programs under need-based community development activities are based on
the socioeconomic indicators, field observations and based on the felt needs of the people
during the primary survey. Villages adjacent to the proposed project site shall be given
EIA for the Proposed Capacity Enhancement by Increasing Pulp Production from 62,000 BD TPA to 90,000 BD TPA by upgrading the existing pulp mill without increasing the permitted paper production capacity of 1,00,000 TPA
PJ-ENVIR-2017830-1366 Dated: November 2018
Chapter-10 Environmental Management Plan
Page 238
preference for implementing the need-based Community development programs. Some of
the key observations on people’s basic needs are presented below.
• Education Promotion: Providing access to safe sanitation facilities, Drinking water
provisions (RO Systems), furniture, ensuring adequate stationary supplies, support to
Mid day meal scheme, Health camps, Poor child Scholarship programs for higher
studies, computer literacy, etc .
• Skill Development Programs: OPM can partner with the National Skill Development
Corporation (NSDC), Ministry of Skill Development and Entrepreneurship under the
‘Industry Partnership & CSR Program’ to develop the skill development programs in
the study area. Under the ‘Industry Partnership & CSR Program’ the following
models can be adopted
➢ Partnership Models: Directly contributing funds to the ‘The National Skill
Development Fund’ (NSDF) under CSR, Sponsoring Candidates for Skill
Development Training, offering the industry owned existing facilities or
machineries for on-the-job training.
➢ Corporate Skill Excellence Centre: Setting up or upgrading the Skill
Development facility under NSDC in the area of strategic importance.
➢ Multi Skill Training Centre: Setting up of multi-sector skill training centers
either operated by the OPM or affiliated NSDC / SSC training partner. Under
these training centers CSR funds can be utilized in developing the local skill or
can dovetail with the government schemes like Pradhan Mantri Kaushal Vikas
Yojana for sponsorships of the candidates.
➢ Trade Specific Labs or Centers: Labs/ training centers can be developed by
the OPM to fulfill the needs of the skilled workforce at trade level and the
training centers or labs with needs of upgrade can be selected for upgrade
➢ Donate Land, Building and Machinery: Providing access to the facility for the
skill development centre and by supporting the existing programs through
basic setup cost and equipment donation.
• Health: OPM conducts regular Health camps and blood donation camps every year.
These health camps will be continued in the villages adjacent to the project site
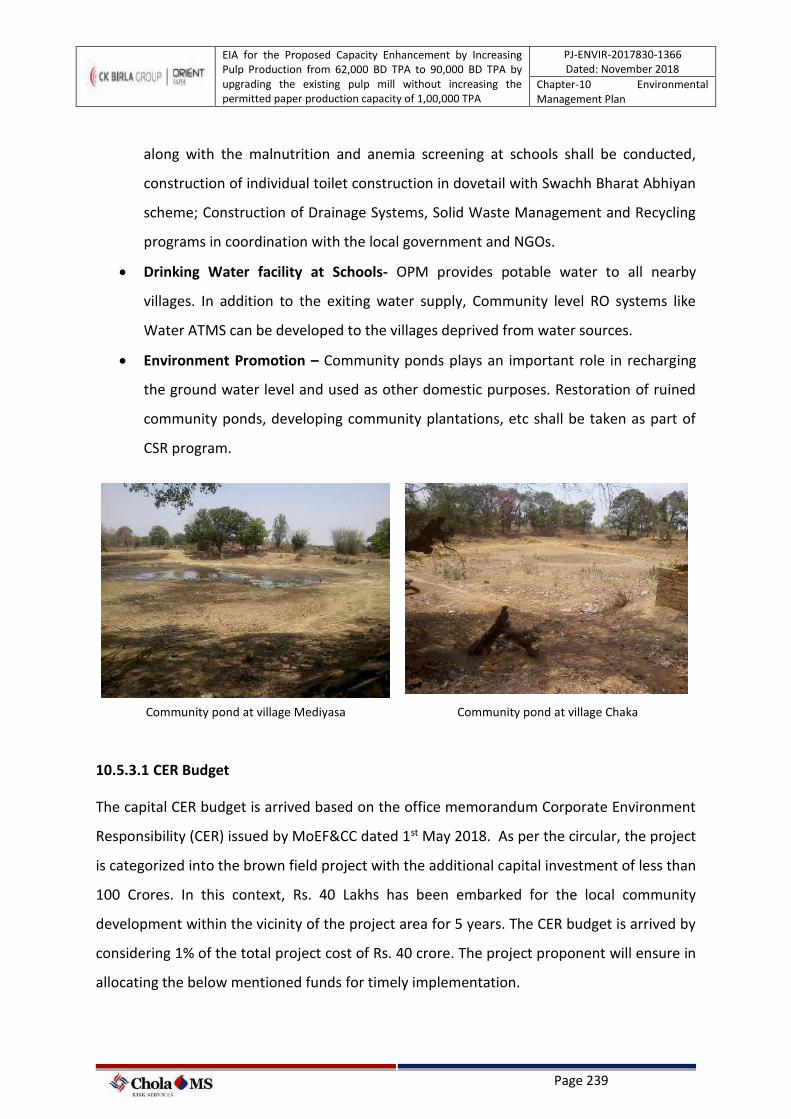
EIA for the Proposed Capacity Enhancement by Increasing Pulp Production from 62,000 BD TPA to 90,000 BD TPA by upgrading the existing pulp mill without increasing the permitted paper production capacity of 1,00,000 TPA
PJ-ENVIR-2017830-1366 Dated: November 2018
Chapter-10 Environmental Management Plan
Page 239
along with the malnutrition and anemia screening at schools shall be conducted,
construction of individual toilet construction in dovetail with Swachh Bharat Abhiyan
scheme; Construction of Drainage Systems, Solid Waste Management and Recycling
programs in coordination with the local government and NGOs.
• Drinking Water facility at Schools- OPM provides potable water to all nearby
villages. In addition to the exiting water supply, Community level RO systems like
Water ATMS can be developed to the villages deprived from water sources.
• Environment Promotion – Community ponds plays an important role in recharging
the ground water level and used as other domestic purposes. Restoration of ruined
community ponds, developing community plantations, etc shall be taken as part of
CSR program.
Community pond at village Mediyasa Community pond at village Chaka
10.5.3.1 CER Budget
The capital CER budget is arrived based on the office memorandum Corporate Environment
Responsibility (CER) issued by MoEF&CC dated 1st May 2018. As per the circular, the project
is categorized into the brown field project with the additional capital investment of less than
100 Crores. In this context, Rs. 40 Lakhs has been embarked for the local community
development within the vicinity of the project area for 5 years. The CER budget is arrived by
considering 1% of the total project cost of Rs. 40 crore. The project proponent will ensure in
allocating the below mentioned funds for timely implementation.
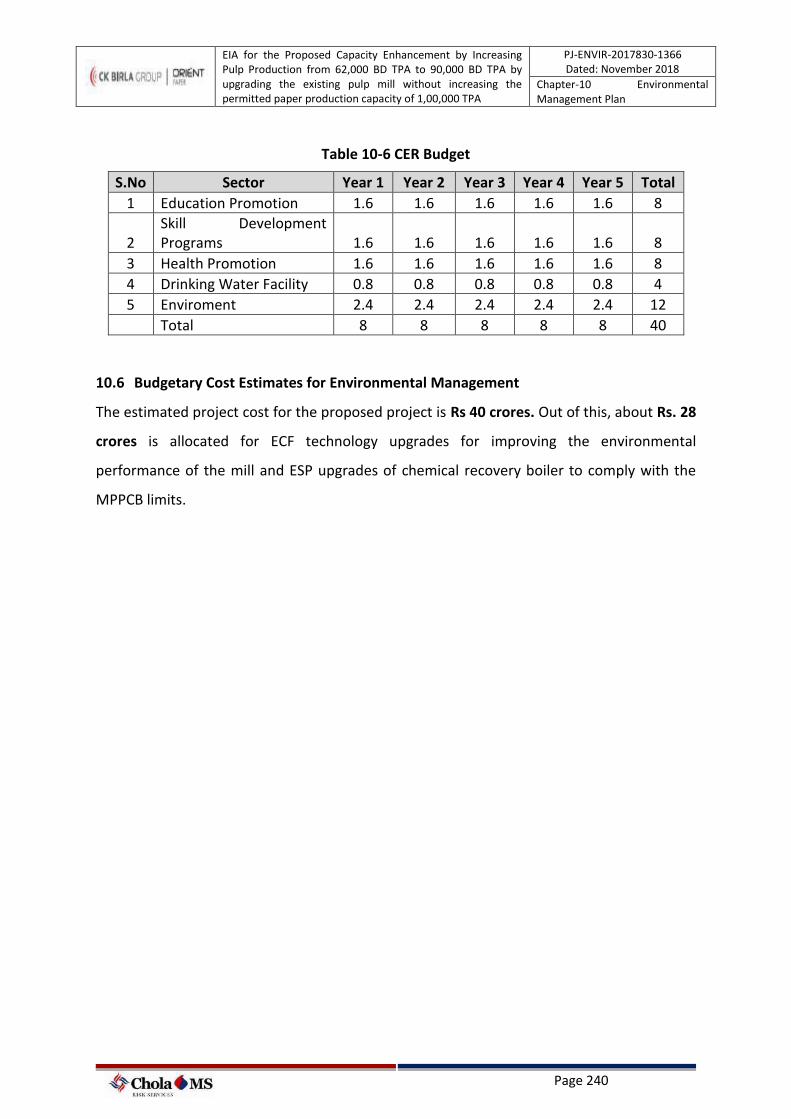
EIA for the Proposed Capacity Enhancement by Increasing Pulp Production from 62,000 BD TPA to 90,000 BD TPA by upgrading the existing pulp mill without increasing the permitted paper production capacity of 1,00,000 TPA
PJ-ENVIR-2017830-1366 Dated: November 2018
Chapter-10 Environmental Management Plan
Page 240
Table 10-6 CER Budget
S.No Sector Year 1 Year 2 Year 3 Year 4 Year 5 Total
1 Education Promotion 1.6 1.6 1.6 1.6 1.6 8
2 Skill Development Programs 1.6 1.6 1.6 1.6 1.6 8
3 Health Promotion 1.6 1.6 1.6 1.6 1.6 8
4 Drinking Water Facility 0.8 0.8 0.8 0.8 0.8 4
5 Enviroment 2.4 2.4 2.4 2.4 2.4 12
Total 8 8 8 8 8 40
10.6 Budgetary Cost Estimates for Environmental Management
The estimated project cost for the proposed project is Rs 40 crores. Out of this, about Rs. 28
crores is allocated for ECF technology upgrades for improving the environmental
performance of the mill and ESP upgrades of chemical recovery boiler to comply with the
MPPCB limits.
EIA for the Proposed Capacity Enhancement by Increasing Pulp Production from 62,000 BD TPA to 90,000 BD TPA by upgrading the existing pulp mill without increasing the permitted paper production capacity of 1,00,000 TPA
PJ-ENVIR-2017830-1366 Dated: November 2018
Chapter-11 Conclusions
Page 241
11 Conclusions
Although the unit has the capacity to produce 275 BD TPD of pulp with all the required
pulping system, the production is limited to 62,000 BDTPA (182 BD TPD) based on the EC
granted by MOEF dated 17th Oct’16. In view of upgrading existing pulp mill by addition of
balancing equipment and by adopting Elemental Chlorine Free (ECF) bleaching operations
and also due to availability of adequate installed capacity of pulping system along with
utilities such as water, power and raw materials, the management of OPM has proposed to
enhance the in-house pulp production throughput to 90,000 BD TPA (265 BD TPD) without
increasing the total consented paper production capacity of 1,00,000 TPA. Enhanced in-
house pulp production will help reduce the foreign exchange outgo on account of reduction
in quantity of Imported Pulp.
The following are the summary points of the proposed project and EIA study
➢ No increase in the total consented paper production of 1,00,000 TPA.
➢ The existing wood chipper and pulp mill have adequate capacities to produce 90,000
TPA and hence no additional units will be installed (except for addition of balancing
equipment and adopting Elemental Chlorine Free (ECF) bleaching operations.)
➢ The existing chemical recovery boiler will be retrofitted with ESP upgrades
➢ No additional land is required as the proposed project includes only up-gradation of
existing pulp mill and enhancement of the production of in-house pulp.
➢ ECF Chlorine Bleaching technology will be adopted, which will be environmental
friendly option to help reduce the specific water consumption and pollution load.
➢ No increase in freshwater consumption during the post project scenario and no
increase in wastewater generation and treated wastewater discharge quantities.
➢ No treated wastewater will be discharged into the water body. 100 % utilization of
treated wastewater for land irrigation.
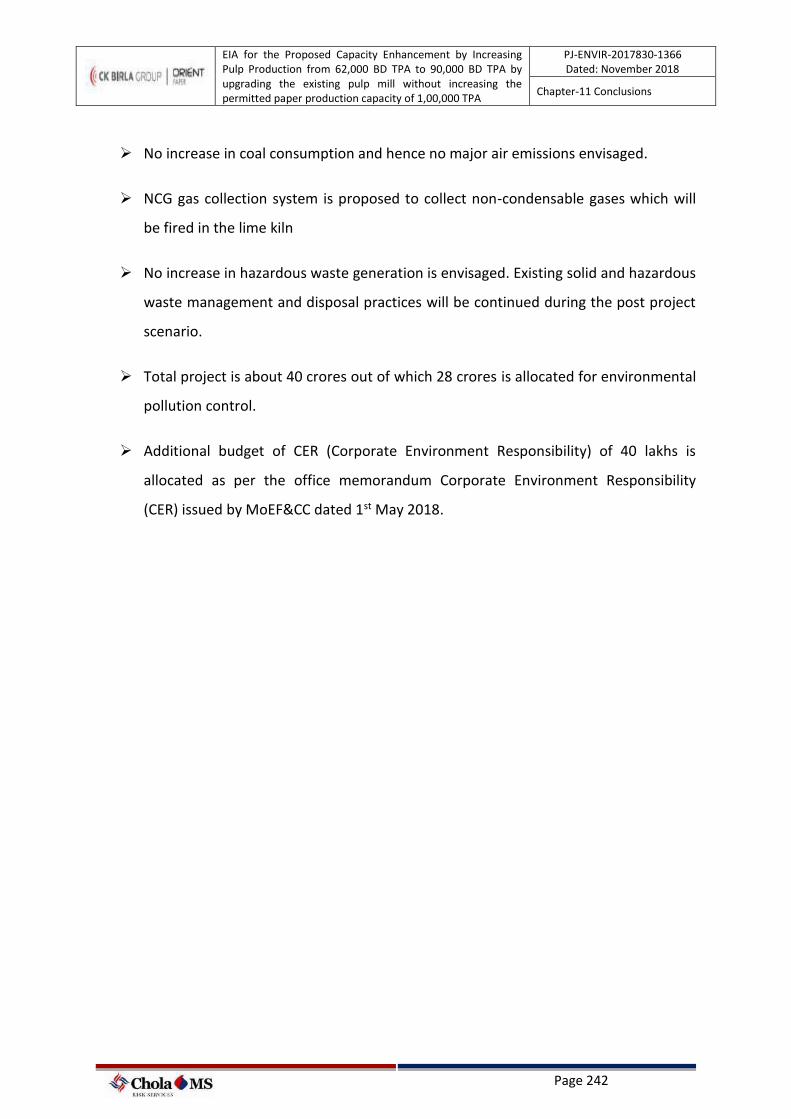
EIA for the Proposed Capacity Enhancement by Increasing Pulp Production from 62,000 BD TPA to 90,000 BD TPA by upgrading the existing pulp mill without increasing the permitted paper production capacity of 1,00,000 TPA
PJ-ENVIR-2017830-1366 Dated: November 2018
Chapter-11 Conclusions
Page 242
➢ No increase in coal consumption and hence no major air emissions envisaged.
➢ NCG gas collection system is proposed to collect non-condensable gases which will
be fired in the lime kiln
➢ No increase in hazardous waste generation is envisaged. Existing solid and hazardous
waste management and disposal practices will be continued during the post project
scenario.
➢ Total project is about 40 crores out of which 28 crores is allocated for environmental
pollution control.
➢ Additional budget of CER (Corporate Environment Responsibility) of 40 lakhs is
allocated as per the office memorandum Corporate Environment Responsibility
(CER) issued by MoEF&CC dated 1st May 2018.

EIA for the Proposed Capacity Enhancement by Increasing Pulp Production from 62,000 BD TPA to 90,000 BD TPA by upgrading the existing pulp mill without increasing the permitted paper production capacity of 1,00,000 TPA
PJ-ENVIR-2017830-1366 Dated: November 2018
Chapter-12 Disclosure of Consultants
Page 243
12 Disclosure of Consultants
12.1.1 Introduction
The Environmental Impact Assessment (EIA) and Environment Management Plan (EMP)
report has been prepared by carrying out various scientific studies. The studies have been
carried out by M/s. Cholamandalam MS Risk Services Limited, Chennai, India. The profiles
of the Consultants are given below,
12.1.2 Cholamandalam MS Risk Services Limited – EIA Consultant
M/s. Cholamandalam MS Risk Services Ltd (CMSRSL) is a joint venture between the
Murugappa group, India and Mitsui Sumitomo Insurance Group, Japan. CMSRSL is an ISO
9001:2008 certified company. CMSRSL offers safety and environmental consulting services
across India, Middle East and East Asian countries. CMSRSL consists of six consulting
domains such as environmental engineering and management, process safety, fire safety,
electrical safety, construction safety and logistics risk assessment. CMSRSL is a NABET
accredited EIA consulting organization for undertaking EIA studies in the following sectors:
paper and pulp, thermal power plants, petroleum refineries, petrochemical complex,
chemical fertilizers, synthetic organic chemical industries, ports and harbours and area
development projects. CMSRSL has offered environmental and safety related consulting
services for more than 5000 clients during last decade.
12.1.3 Details of Experts/Consultants Engaged for this EIA Study
Details of Experts/Consultants Engaged for this EIA Study
S. No. Name Role in the EIA Study 1 Mr V S Bhaskar EIA Coordinator – Pulp & paper industry and Thermal
Power Plants. Functional Area Expert(FAE) - Meteorology, Air Quality Modelling and Prediction Functional Area Expert (FAE) - Water Pollution Prevention, Control & Prediction of Impacts Functional Area Expert (FAE) - Noise / Vibration Functional Area Expert (FAE) – Risk & Hazards Management
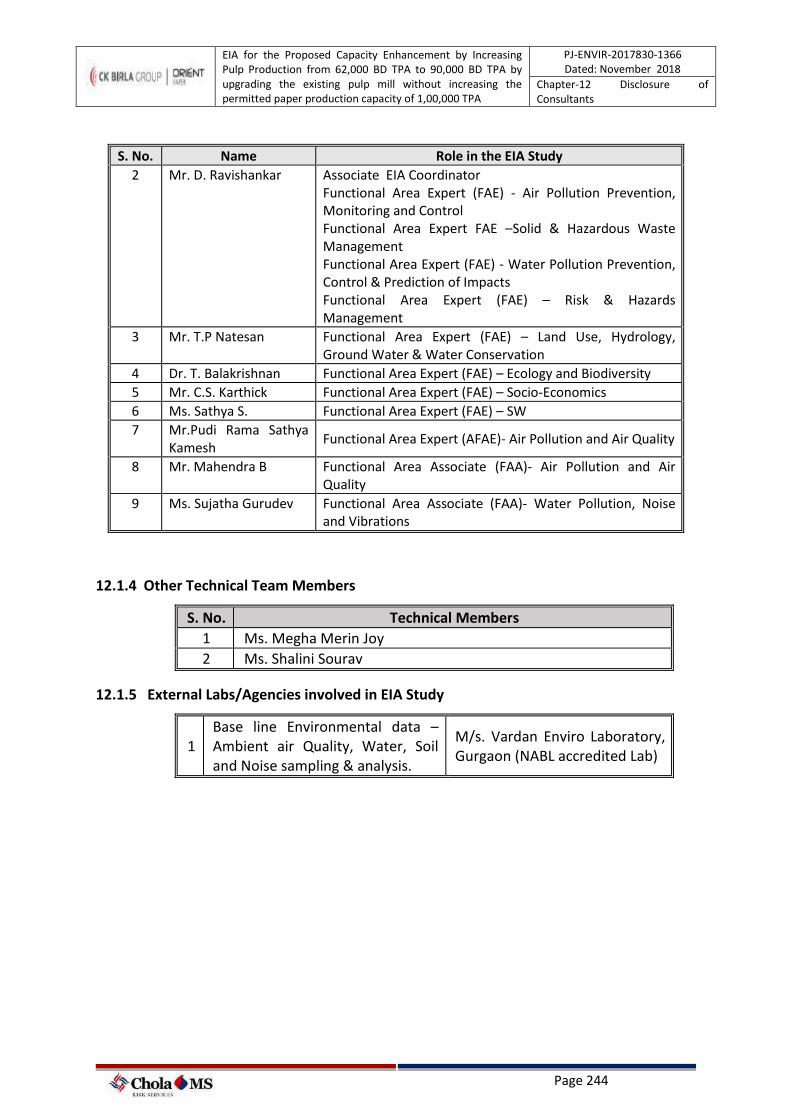
EIA for the Proposed Capacity Enhancement by Increasing Pulp Production from 62,000 BD TPA to 90,000 BD TPA by upgrading the existing pulp mill without increasing the permitted paper production capacity of 1,00,000 TPA
PJ-ENVIR-2017830-1366 Dated: November 2018
Chapter-12 Disclosure of Consultants
Page 244
S. No. Name Role in the EIA Study 2 Mr. D. Ravishankar Associate EIA Coordinator
Functional Area Expert (FAE) - Air Pollution Prevention, Monitoring and Control Functional Area Expert FAE –Solid & Hazardous Waste Management Functional Area Expert (FAE) - Water Pollution Prevention, Control & Prediction of Impacts Functional Area Expert (FAE) – Risk & Hazards Management
3 Mr. T.P Natesan Functional Area Expert (FAE) – Land Use, Hydrology, Ground Water & Water Conservation
4 Dr. T. Balakrishnan Functional Area Expert (FAE) – Ecology and Biodiversity 5 Mr. C.S. Karthick Functional Area Expert (FAE) – Socio-Economics 6 Ms. Sathya S. Functional Area Expert (FAE) – SW 7 Mr.Pudi Rama Sathya
Kamesh Functional Area Expert (AFAE)- Air Pollution and Air Quality
8 Mr. Mahendra B Functional Area Associate (FAA)- Air Pollution and Air Quality
9 Ms. Sujatha Gurudev Functional Area Associate (FAA)- Water Pollution, Noise and Vibrations
12.1.4 Other Technical Team Members
S. No. Technical Members
1 Ms. Megha Merin Joy
2 Ms. Shalini Sourav
12.1.5 External Labs/Agencies involved in EIA Study
1 Base line Environmental data – Ambient air Quality, Water, Soil and Noise sampling & analysis.
M/s. Vardan Enviro Laboratory, Gurgaon (NABL accredited Lab)
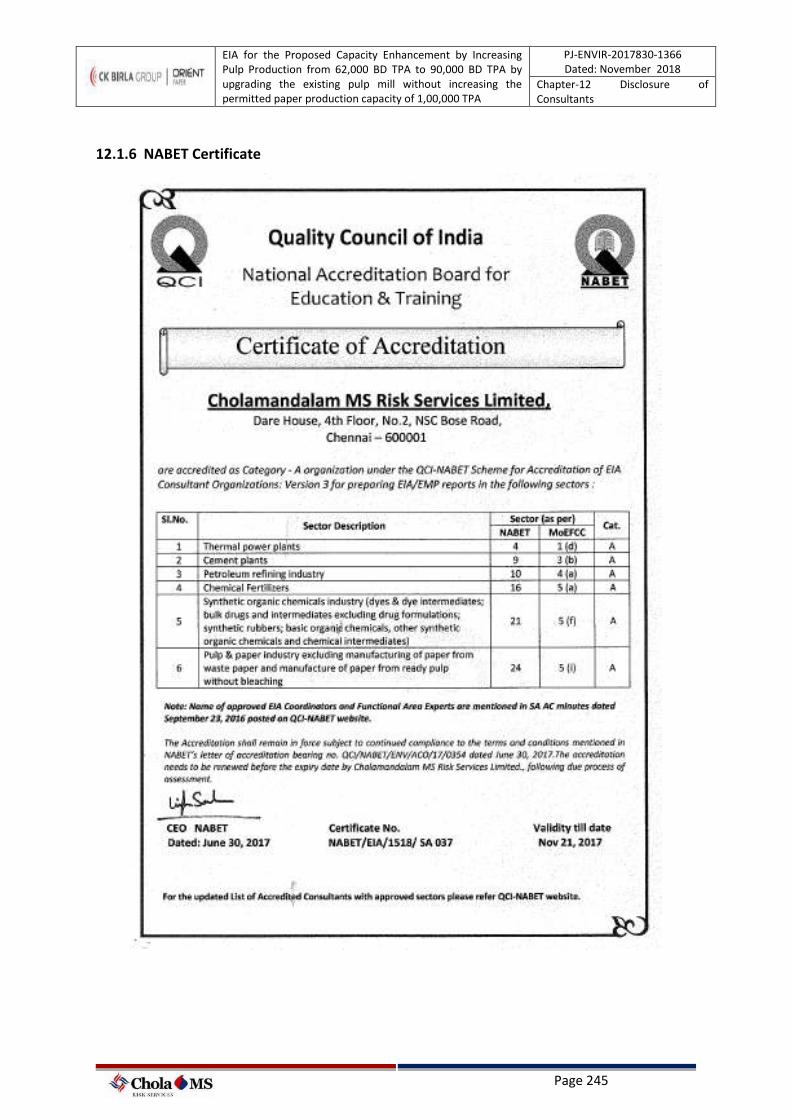
EIA for the Proposed Capacity Enhancement by Increasing Pulp Production from 62,000 BD TPA to 90,000 BD TPA by upgrading the existing pulp mill without increasing the permitted paper production capacity of 1,00,000 TPA
PJ-ENVIR-2017830-1366 Dated: November 2018
Chapter-12 Disclosure of Consultants
Page 245
12.1.6 NABET Certificate
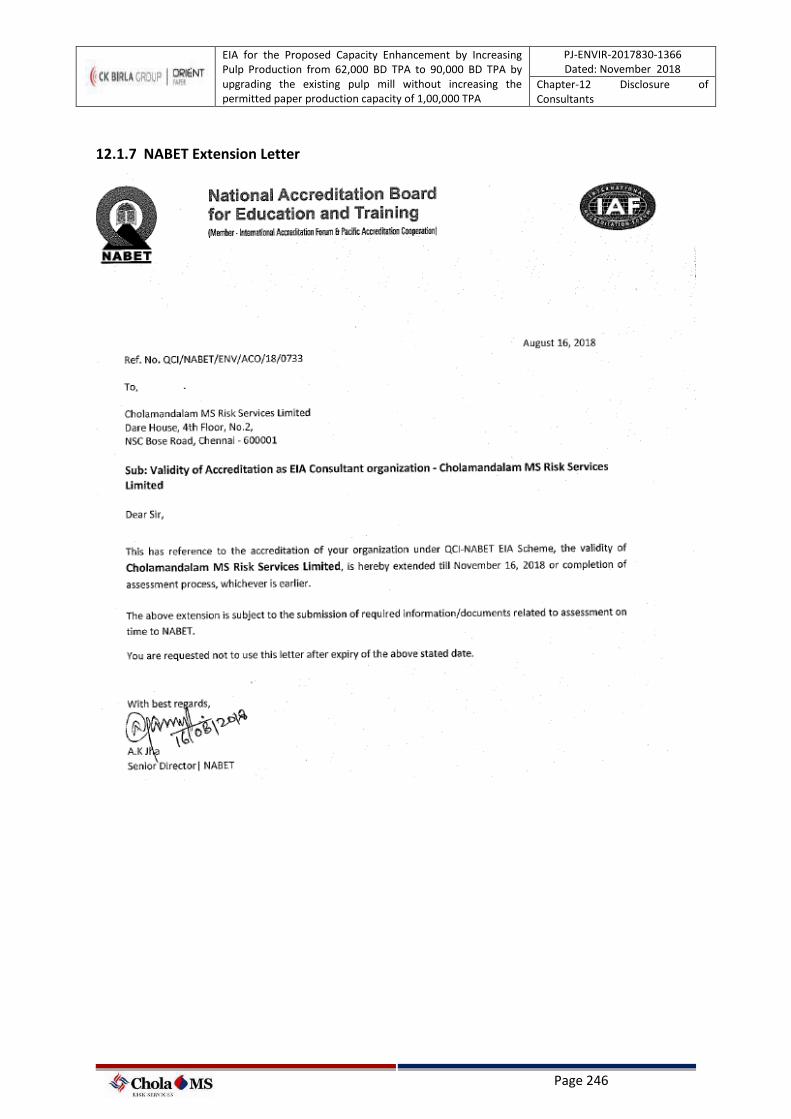
EIA for the Proposed Capacity Enhancement by Increasing Pulp Production from 62,000 BD TPA to 90,000 BD TPA by upgrading the existing pulp mill without increasing the permitted paper production capacity of 1,00,000 TPA
PJ-ENVIR-2017830-1366 Dated: November 2018
Chapter-12 Disclosure of Consultants
Page 246
12.1.7 NABET Extension Letter