Embed Size (px)
Citation preview

E i t dE i t dEnvironment and Environment and InIn--Use VehiclesUse VehiclesInIn Use Vehicles Use Vehicles
byby::Dr.Dr.-- Ing. Gunadi SindhuwinataIng. Gunadi SindhuwinataDr.Dr. Ing. Gunadi Sindhuwinata Ing. Gunadi Sindhuwinata Executive President, SAE Executive President, SAE -- IndonesiaIndonesia
JARI I d i R dt bl 2008JARI I d i R dt bl 2008JARI Indonesia Roundtable 2008JARI Indonesia Roundtable 2008“Efforts for Air Pollution Reduction”“Efforts for Air Pollution Reduction”
Borobudur HotelBorobudur HotelJ k t F b 14J k t F b 14thth 20082008
JARI/IATO/GA/0208 1
Jakarta, February 14Jakarta, February 14thth 20082008

ContentsContentsContentsContentsContentsContentsContentsContents
1. Macro Economy Condition and Increasing Number of Automotive VehicularVehicular
2. Fuel Properties, Consumption and E i t C ditiEnvironment Condition
3. Reducing Pollution in Indonesia4. Conclusion
2JARI/IATO/GA/0208

1. Macro Economy Condition and Increasing Number of Automotive VehicularNumber of Automotive Vehicular
3JARI/IATO/GA/0208

Increasing Number of Automotive VehicularIncreasing Number of Automotive VehicularIncreasing Number of Automotive VehicularIncreasing Number of Automotive Vehicular
Automobiles & Motorcycles play significant role in the economic development of the country, besidesfreedom of mobility for every single citizen must be guaranted.
The number of automotive vehiculars is The number of automotive vehiculars is increasing along with the income growth of the people, on the othergrowth of the people, on the other hand, it also creates a lot of environmental issues.
4
environmental issues.
JARI/IATO/GA/0208

Income/Capita, Population and Automobile Market V l f ASEAN C t i Y 2007
Income/Capita, Population and Automobile Market V l f ASEAN C t i Y 2007Volume of ASEAN Countries Year 2007Volume of ASEAN Countries Year 2007
Country GDP/Capita Population Motorcycle AutomobileCountry GDP/Capita Population Motorcycle Automobile
(US$) (million) (unit) (unit)
Indonesia 1,376 234,0 4,713,895 433,341
Malaysia 3,092 22.4 449,669 487,176Malaysia 3,092 22.4 449,669 487,176
Thailand 1,850 61.0 1,598,613 631,251
Philippines 907 73.9 549,112 117,903
5JARI/IATO/GA/0208

ASEAN Automobile Sales Volume Y 1996 2007
ASEAN Automobile Sales Volume Y 1996 2007Year 1996 ~ 2007Year 1996 ~ 2007
800 000 ASEAN Sales 2007 Unit
700,000
800,000
Indonesia
S Sa es 00Total : 1,669,671 units
500,000
600,000IndonesiaMalaysiaPhilipinesThailand
300 000
400,000
Thailand
200,000
300,000
0
100,000
6
1996 1998 2000 2002 2004 2006
YearSourcer : ASEAN Automotive FederationJARI/IATO/GA/0208

ASEAN Motorcycle Sales Volume Y 1996 2007
ASEAN Motorcycle Sales Volume Y 1996 2007Year 1996 ~ 2007Year 1996 ~ 2007
6,000,000
ASEAN Sales 2007 Total : 7,311,289 units
Units
5,000,000
4,000,000 IndonesiaMalaysia
3,000,000 PhilipinesThailand
1 000 000
2,000,000
0
1,000,000
1996 1998 2000 2002 200 2006
7Sourcer : ASEAN Automotive FederationJARI/IATO/GA/0208
Tahun1996 1998 2000 2002 2004 2006
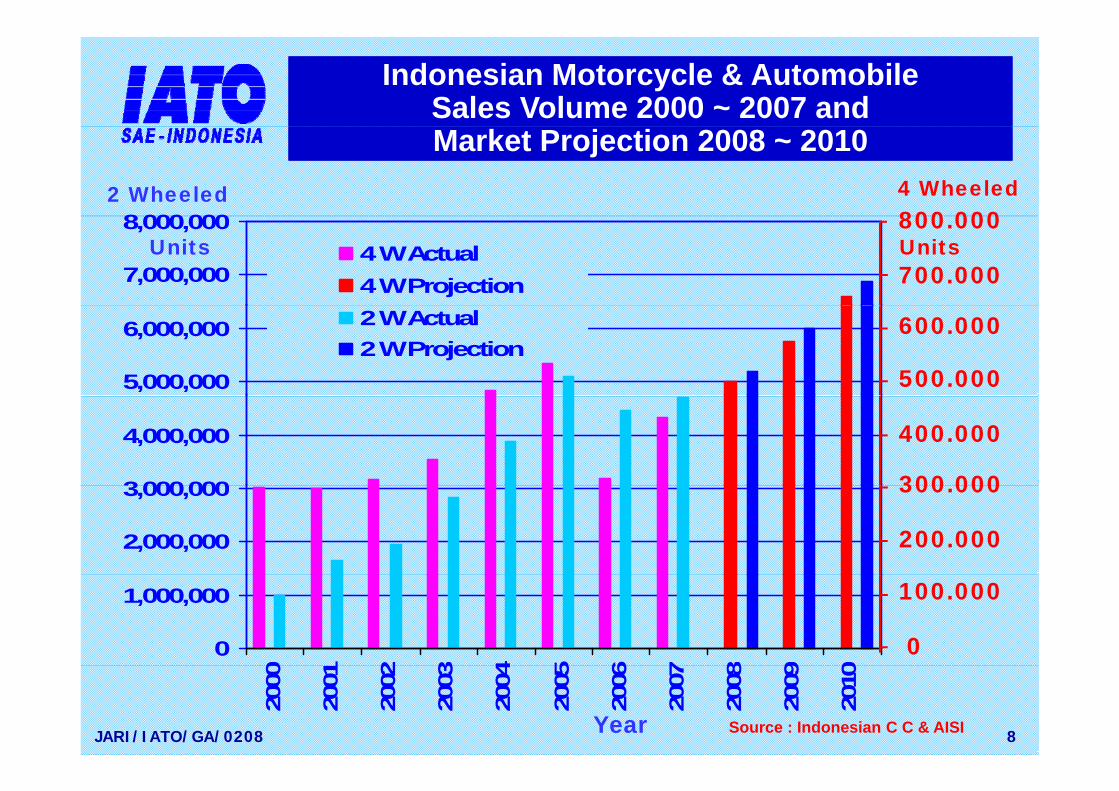
Indonesian Motorcycle & Automobile Sales Volume 2000 ~ 2007 and
Indonesian Motorcycle & Automobile Sales Volume 2000 ~ 2007 and
8000000 800 0004 Wheeled2 Wheeled
Market Projection 2008 ~ 2010Market Projection 2008 ~ 2010
7,000,000
8,000,0004 W Actual4 W Projection
800.000
700.000UnitsUnits
5,000,000
6,000,000 2 W Actual2 W Projection
500.000
600.000
3000000
4,000,000 400.000
300 000
2,000,000
3,000,000 300.000
200.000
0
1,000,000
0 2 3 4 5 6 7 8 9 0
100.000
0
8JARI/IATO/GA/0208
2000
2001
2002
2003
2004
2005
2006
2007
2008
2009
2010
Year Source : Indonesian C C & AISI

2. Fuel Properties, Consumption and Environment ConditionEnvironment Condition
9JARI/IATO/GA/0208

Environmental Problem and Fuel ConsumptionEnvironmental Problem and Fuel ConsumptionEnvironmental Problem and Fuel ConsumptionEnvironmental Problem and Fuel Consumption
1. Environmental problem occures because automotive products are operated with fossil -automotive products are operated with fossilbased fuel which emits polluting gasses.
2 It i bl i i f th d f it2. It is unrenewable, increasing of the used of it would harm the human health and it could also damage the environment.
3. Existency of fossil-based fuel resources is 3 s e cy o oss ased ue esou ces suncertain and limited, while meassures for fuel efficiency are eminent.
10JARI/IATO/GA/0208
efficiency are eminent.

Factors Influencing Factors Influencing bi i Q libi i Q li
Factors Influencing Factors Influencing bi i Q libi i Q liAmbient Air QualityAmbient Air QualityAmbient Air QualityAmbient Air Quality
Ambient Air QualityAmbient Air Quality
l Emission Level Character of Engine
Fuel Property g
In – UseIn – Use Vehicles
11JARI/IATO/GA/0208

Population of InPopulation of In--Use Motor Vehicles Use Motor Vehicles b C t 1997 2004b C t 1997 2004
Population of InPopulation of In--Use Motor Vehicles Use Motor Vehicles b C t 1997 2004b C t 1997 2004by Category 1997 ~ 2004by Category 1997 ~ 2004by Category 1997 ~ 2004by Category 1997 ~ 2004
40000000
45,000,000
50,000,000MotorcyclePassenger Car Bus
Units
30000000
35,000,000
40,000,000 BusTruckTotal
20,000,000
25,000,000
30,000,000
10,000,000
15,000,000
20,000,000
0
5,000,000
97 98 99 00 01 02 03 04 05
12JARI/IATO/GA/0208
1997
1998
1999
2000
2001
2002
2003
2004
2005
Year Source : Indonesian Nationall Police

Ten Important Provinces of A t bil d M t l M k t
Ten Important Provinces of A t bil d M t l M k tAutomobile and Motorcycle MarketAutomobile and Motorcycle Market
RankingAutomobile Motorcycle
Province % Province %
1 DKI - Jakarta 30.9 DKI - Jakarta 15.92
2 Jawa Barat 19.1 Jawa Timur 14.28
3 Jawa Timur 10 8 Jawa Barat 12 353 Jawa Timur 10.8 Jawa Barat 12.35
4 Banten 5.9 Jawa Tengah 9.94
5 Jawa Tengah 5.7 Sumatra Utara 7.41g
6 Sumatra Utara 5.6 Sulawesi Selatan 4.75
7 Bali 2.7 DI - Jogyakarta 4.05
8 Kalimantan Timur 2.4 Kalimantan Timur 3.98
9 Sulawesi Selatan 2.4 Sumatra Selatan 3.45
10 Riau 2 3 Bali 3 38
13JARI/IATO/GA/0208
10 Riau 2.3 Bali 3.38

Population of InPopulation of In--Use Motor Vehicles by Use Motor Vehicles by C t i M t lit J k t 2001 2006C t i M t lit J k t 2001 2006
Population of InPopulation of In--Use Motor Vehicles by Use Motor Vehicles by C t i M t lit J k t 2001 2006C t i M t lit J k t 2001 2006Category in Metropolitan Jakarta 2001~2006Category in Metropolitan Jakarta 2001~2006Category in Metropolitan Jakarta 2001~2006Category in Metropolitan Jakarta 2001~2006
7,000,000
8,000,000MotorcyclePassenger CarTruck
Units
5,000,000
6,000,000TruckBusTotal
3000000
4,000,000
, ,
2,000,000
3,000,000
0
1,000,000
01 02 03 04 05 06
14JARI/IATO/GA/0208
2001
2002
2003
2004
2005
2006
YearSource : Jakarta Capitol Police

Pollution Through Utilization of F il F l i S l t d Bi CitiPollution Through Utilization of
F il F l i S l t d Bi CitiFossil Fuel in Selected Big CitiesFossil Fuel in Selected Big Cities
CO NO2 PM10 O3 SOx PbBangkok 2002 A D A A C B
Manila 2002 A E C C C BKuala Lumpur 2004 -- D D C A --Jakarta 2003 E C C C D DHo Chi Minh City 2002 C E E -- E EHo Chi Minh City 2002 C E E -- E E
Beijing 2005 E E D -- C --Shanghai 2005 -- E D -- E --g
Colour WHO Standard
A < 50%
B Within range
C 200% within the range
D 300% within the range
15
E 300% above the range
Sourcer : World Bank & UNEPJARI/IATO/GA/0208

Air Pollution in some Capitol CitiesAir Pollution in some Capitol CitiesAir Pollution in some Capitol CitiesAir Pollution in some Capitol Cities
04
120
SPM
SO2
104
8990
79
100
68
7960
80 NO2
am/m
3
29
39
44 42
3330
40
60
Mik
rogr
a
29
2420
1118
30
23 22
20
0 0 0 00
Jakarta KualaLumpur
Manila Singapore Bangkok Beijing Tokyo
16Sourcer : World Bank
p
JARI/IATO/GA/0208

Consumption of Fuels by G f U 2000 2005
Consumption of Fuels by G f U 2000 2005Group of Users 2000 ~ 2005 Group of Users 2000 ~ 2005
Unit: Kls
Item 2000 2001 2002 2003 2004 2005Item 2000 2001 2002 2003 2004 2005Household 12,409,142 12,248,482 11,622,942 11,704,403 11,787,354 11,294,676
Transportation 24,943,007 26,407,462 26,766,911 27,110,259 29,520,779 29,966,073Industry 12,147,262 12,610,242 12,259,493 11,197,083 13,494,758 11,795,661
Electricity 5,008,292 5,037,918 6,494,261 7,852,355 6,796,916 9,003,123Tot a l 54507703 56304104 57143607 57864100 61599807 62059533
Source : Pertamina
T o t a l 54,507,703 56,304,104 57,143,607 57,864,100 61,599,807 62,059,533
17JARI/IATO/GA/0208

Percentage Ratio of Fuel Consumption by S t f U d b T t ti M d
Percentage Ratio of Fuel Consumption by S t f U d b T t ti M dSegment of Users and by Transportation ModesSegment of Users and by Transportation Modes
Transportaton ModesTransportaton Modes Segment of Fuel UsersSegment of Fuel Users
88%88%7%7%
48%48%1%1%
Transportaton ModesTransportaton Modes Segment of Fuel UsersSegment of Fuel Users
7%7% 1%1%
4%4% 1%1% 22%22%11%11% 19%19%
Land TransportationsRailwaysAir Transportations
Land TransportationsNon-Land TransportationsIndustriesAir Transportations
Water TransportationsIndustriesHouseholdsElectricity
18JARI/IATO/GA/0208

Knowledge Regarding Gl b l W i d Cli t Ch
Knowledge Regarding Gl b l W i d Cli t ChGlobal Warming and Climate ChangeGlobal Warming and Climate Change
Ever Heard ?Ever Heard ? Global Warming, Global Warming, A S i P bl ?A S i P bl ?
Never Heard, 72%Never Heard, 72%Very Serious, 50%Very Serious, 50%
N S i All 2%N S i All 2%
A Serious Problem?A Serious Problem?
Not Serious at All, 2%Not Serious at All, 2%
Not Serious 5%Not Serious 5%Have Ever Heard, 28%Have Ever Heard, 28%Serious, 42%Serious, 42%
Not Serious, 5%Not Serious, 5%
Motor Vehicles, 50%Motor Vehicles, 50%Do Not Know, 1%Do Not Know, 1%
Sources of Global Warming ?Sources of Global Warming ?
Natural Climate Changes 24%Natural Climate Changes 24%
19
Natural Climate Changes, 24%Natural Climate Changes, 24%Both, 25%Both, 25%Source : World Bank
JARI/IATO/GA/0208

Road Length and CategoryRoad Length and CategoryRoad Length and CategoryRoad Length and CategoryRoad Length and Category Road Length and Category Road Length and Category Road Length and Category
Item Lenght (m) Areal (sqm) Status
1 Tol/Highway 112,960.00 2,472,680.00 Tol1 Tol/Highway 112,960.00 2,472,680.00 Tol
2 Primery Artery 112,149.00 2,140,090.00 Nationall
3 Primery Collector 51,630.75 67,384.50 National
4 Secondary Artery 502,640.00 8,299,089.00 Provencial
5 Secondary Collector 823,913.91 6,970,938.77 Provencial
6 Distric Road 4 936 928 77 20 988 103 81 Distric6 Distric Road 4,936,928.77 20,988,103.81 Distric
Jumlah 6,540,221.93 41,542,286.08
20JARI/IATO/GA/0208
Sourcer: BPS

Comparison of Road Length (2002)Comparison of Road Length (2002)Comparison of Road Length (2002)Comparison of Road Length (2002)
No Country Population Length (km)K / ilNo. Country p
(mil.) Km/mil.Artery Highway1. Japan 125 1.166.340 11.520 9.4222. Malaysia 22 64.949 1.230 3.0083. Korea 46 88.775 2.600 1.9864 Chi 1 300 1 700 000 100 000 1 3844. China 1.300 1.700.000 100.000 1.3845. Indonesia 210 26.000 520 126
Sourcer: Indonesian Tol Way Association
21JARI/IATO/GA/0208
Sou ce do es a o ay ssoc at o

Geographical Comparison Between Geographical Comparison Between J d I d iJ d I d i
Geographical Comparison Between Geographical Comparison Between J d I d iJ d I d iJapan and IndonesiaJapan and IndonesiaJapan and IndonesiaJapan and Indonesia
No Item Indonesia Japan (%)No Item Indonesia Japan (%)
1. Population (mil.) 210 125 168
2. Area (sqkm) 1,919,440 377,835 5083 Costal Line (km) 56 706 29 751 1903. Costal Line (km) 56,706 29,751 1904. Tol / Highway (km) 520 11,520 ~ 55 Artery (km) 778 000 1 166 340 ~ 675. Artery (km) 778.000 1,166,340 ~ 67
22JARI/IATO/GA/0208

Average Octane Number of Gasoline Average Octane Number of Gasoline i S l d Ci i 200 200i S l d Ci i 200 200
Average Octane Number of Gasoline Average Octane Number of Gasoline i S l d Ci i 200 200i S l d Ci i 200 200
90,5091,00
2005
in Selected Cities 2005 ~ 2007in Selected Cities 2005 ~ 2007in Selected Cities 2005 ~ 2007in Selected Cities 2005 ~ 2007
RON
89 0089,5090,00 2006
2007
RON
88,0088,5089,00
St d d RON 88 00
87,0087,5088,00
Standard RON – 88.00
86,0086,50
ng sar
bek
dan
ang
aya
ado
ceh
ura
Ban
dun
Den
pas
abod
etab
e
Med
a
Sem
aran
Sura
bay
Men
ad
Ban
da A
ce
Jaya
pu
23JARI/IATO/GA/0208
Ja B

Average Sulfur Level in Diesel Fuel in Average Sulfur Level in Diesel Fuel in S l d Ci i 200 200S l d Ci i 200 200
Average Sulfur Level in Diesel Fuel in Average Sulfur Level in Diesel Fuel in S l d Ci i 200 200S l d Ci i 200 200
350000
4000.00Selected Cities 2005 ~ 2007Selected Cities 2005 ~ 2007Selected Cities 2005 ~ 2007Selected Cities 2005 ~ 2007
ppm Standa d of S lf Le el 3500 00
250000
3000.00
3500.002005
2006
ppm Standard of Sulfur Level – 3500.00
2000.00
2500.00 2007
1000.00
1500.00
0.00
500.00
ng sar
bek an ng ya do eh ura
Ban
dun
Den
pasa
abod
etab
e
Med
a
Semaran
Suraba
y
Men
ad
Ban
da A
ce
Jaya
pur
24JARI/IATO/GA/0208
Jab S
Ba

Prediction of Total Growth Emission in G t J k t 2015 i C i t 1998
Prediction of Total Growth Emission in G t J k t 2015 i C i t 1998Greater Jakarta 2015 in Comparison to 1998Greater Jakarta 2015 in Comparison to 1998
441998 2005 2015
on
3
mpa
riso
on
2
age
Com
Emis
si
1
erce
nta
of
0
Pe
25JARI/IATO/GA/0208
Nox SO2 PM CO THC

3. Reducing Pollution in Indonesia
26JARI/IATO/GA/0208

Fuel Efficiency and EnvironmentFuel Efficiency and EnvironmentFuel Efficiency and EnvironmentFuel Efficiency and EnvironmentFuel Efficiency and EnvironmentFuel Efficiency and EnvironmentFuel Efficiency and EnvironmentFuel Efficiency and Environment
1. Efforts must be done to minimise pollution by reducing fuel consumption and using suitable fuel or substituting with other alternative fuels.
2. Introducing legislation for exhaust emissions with the consideration of availability of suitable fuel and existing technology through consistant and step by step implementation.
27JARI/IATO/GA/0208
p y p p

Strategy of Pollution Control on Strategy of Pollution Control on hi lhi l
Strategy of Pollution Control on Strategy of Pollution Control on hi lhi lMotor VehiclesMotor VehiclesMotor VehiclesMotor Vehicles
Pollution ControlControl
28JARI/IATO/GA/0208

Standard of Emission for Standard of Emission for hi l i ihi l i i
Standard of Emission for Standard of Emission for hi l i ihi l i iNew Vehicles in AsiaNew Vehicles in AsiaNew Vehicles in AsiaNew Vehicles in Asia
Country 2000 2001 2002 2003 2004 2005 2006 2007 2008 2009 2010
China
India
Indonesia MOE Decree KM 141 / 2003 (23 Sept 2003)Malaysia
Philippines
( p )
pp
Singapore
ThailandThailand
29JARI/IATO/GA/0208Euro I Euro II Euro III Euro IV

Development of 2 Development of 2 –– Strokes and Strokes and S k l kS k l k
Development of 2 Development of 2 –– Strokes and Strokes and S k l kS k l k4 4 –– Strokes Motorcycle MarketStrokes Motorcycle Market4 4 –– Strokes Motorcycle MarketStrokes Motorcycle Market
.6.9.46%
989692.
88.6
85
81.5
78.8
77.2
74.9
9.3580
90100
69
60.5
52.3
54.259
.3
54.3
65.
57.6
607080
2 St k 4 St k
42.434 5
45.740.7
45.847.739.530
40
50 2-Stroke 4-Stroke
34.5 30.725.1 22.821.2 18.5
15 1.43.17.611.410
2030
11.40
30JARI/IATO/GA/0208
Year

Background of The Use of Non – Fossil FuelBackground of The Use of Non – Fossil FuelBackground of The Use of Non Fossil FuelBackground of The Use of Non Fossil Fuel
Uncontrollable Fuel Price
Increasing of Consumption ue ce
Alternative Renewable Energy
p
Limitation of Resources
Global Warming
Renewable Energy
Biodiesel & Bi th l
Resources Warming
Bioethanol
31JARI/IATO/GA/0208

Substitution of Fossil Fuel Through Bio-FuelSubstitution of Fossil Fuel Through Bio-FuelSubstitution of Fossil Fuel Through Bio FuelSubstitution of Fossil Fuel Through Bio Fuel
Bio - Fuel Fossil - Fuel Basis Material
Di l F l Bi di l Palm, Coconut, Jatropha,Diesel Fuel Biodiesel Palm, Coconut, Jatropha,Sun FlowerPlants which contain:
Gasoline Bioethanol
• Starch: Casava, Sagoo, Corn, Sweet Potato,
• Sugar: Sugar CaneGasoline • Sugar: Sugar Cane, Sorgum, Fruit Juice, Sugar Palm, g ,Date Palm
• Cellulose: Wood, Straw,
32
Banana StemJARI/IATO/GA/0208

4. Conclusion
33JARI/IATO/GA/0208

Emission ReductionEmission ReductionEmission ReductionEmission ReductionEmission Reduction Emission Reduction Emission Reduction Emission Reduction
Law & Regulation
In – UseF lVehicles
Traffic & Transportation
Green Vehicle
F u e lEmission
NoisepManagement
o se
Maintenance & Inspection
Development &Improvement
34JARI/IATO/GA/0208
Inspection Improvement

Integrated Strategy on Reduction of Integrated Strategy on Reduction of Integrated Strategy on Reduction of Integrated Strategy on Reduction of
l
Population distribution
A bi
Automotive Vehicle Pollution Automotive Vehicle Pollution Automotive Vehicle Pollution Automotive Vehicle Pollution
Meteorology
DispersionModeling
ExposureAssessment
distributionAnd activityAmbient
Concentration
Emission Management
Dose-Response
• Establish objectives Identify
ExposureEmission
Management p
DamageAssessment
objectives, Identify data gaps, studies and pilots
• Identify analyze, Options:Issues: y y ,and select management options
• Develop strategies
p• Fuels and Vehicle
technology• Traffic
• Technical• Economic• Legal
and implement action plan
• Institute monitoring and enforcement
Management• Standards• Economic
incentives and
• Policy• Social• Stakeholders
involvement
35JARI/IATO/GA/0208
and enforcement incentives and disincentives
involvement

Suggestion for Improvement of Suggestion for Improvement of E i t l C ditiE i t l C diti
Suggestion for Improvement of Suggestion for Improvement of E i t l C ditiE i t l C ditiEnvironmental Condition Environmental Condition Environmental Condition Environmental Condition
1 Creating Proper Emission Regulations1. Creating Proper Emission Regulations.2. Requiring of Clean Fuel, Comply to the Quality
Standard.3. Building Sufficient Infrastructure i.e. Roads and
other Related Physical Instruments4 D l i S i bl T i S B ild4. Developing Suitable Transportation System, Build
in the City Planning.5 Improving Traffic Management System and5. Improving Traffic Management System and
Included Discipline of Traffic Users.6. Applying Green Technology, Non-Fossil Based Fuel.pp y g gy,7. Building Awareness of Regular Maintenance and
Inspection.
36JARI/IATO/GA/0208
8. Strengthen Step by Step Limits of Emission.

Th k YTh k YTh k YTh k YThank YouThank YouThank YouThank You
37JARI/IATO/GA/0208