Embed Size (px)
Citation preview

Student: Anand Kulanthaivel – Document: EHR Metric Proposal – Course: INFO-B535 FA13 1
EHR RUBRIC-SP
(Electronic Health Record Revision and Update By Re-Iteration and with Context for
Small Practices: A method of measurable analysis for EHRs.)
By: Anand Kulanthaivel
Indiana University Indianapolis
School of Informatics & Computing
Course: INFO B535 Clinical Information Systems
Indianapolis, IN 46202

Student: Anand Kulanthaivel – Document: EHR Metric Proposal – Course: INFO-B535 FA13 2
Abstract
In this article, I propose EHR-RUBRIC-SP (Electronic Health Record Revision and
Update By Re-Iteration and with Context for Small Practices), a method to analyze EHR
(Electronic Health Record) systems (EHRSs). While EHR-RUBRIC-SP is primarily designed
for the context of evaluating EHRS deployment and usage in smaller practices, in theory, the
evaluation system could be used on a wider basis. It is of particular note that this evaluation
system is patient-centered; rather than covering financial incentives to small providers, we
empower small providers to improve patient care. However, the emphasis on meeting US
government meaningful use (MU) criteria still exists, and through meeting these criteria,
providers will be able to avoid fines. Reviewing the literature, I develop common methods of
analyzing the EHR and EHRSs based upon cost, quality, data software structure, and system
hardware capabilities. Particular attention is paid to measurable metrics of sociology in
Information Technology (IT) adoption. From the literature, I design the details of EHR-
RUBRIC-SP, which analyzes the EHRS immediately prior to deployment, six months after
EHRS deployment, and one year after EHRS deployment. The EHR-RUBRIC-SP therefore is
by nature iterative. It is hoped that adopters of EHRSs in small practices will embrace EHR-
RUBRIC-SP and that this evaluation system will allow these practices to improve their services.
Introduction, Background, & Literature Review
The literature on EHRs and EHRSs is, to say the least, copious. Topics covered range
from the obvious medical aspect of the EHR to social aspects of systems adoption to system
design itself. In between, many authors entertain advanced forms of data analysis (both from
social and system-related data) in order to improve functionality of EHRSs, record-keeping
systems in general, and even sociological networks of professionals, particularly with respect to
their adoption of IT advances.
In medical terms, the EHR is a system designed to capture data relevant to patient
diagnosis and/or treatment (Chilmark, 2013). As the E indicates, the record must be electronic.
Ideally, the EHR must be personally portable between clinicians and hospital systems for patient
convenience. At least one company has stated an equation of “EHR = EMR + PHR”, where

Student: Anand Kulanthaivel – Document: EHR Metric Proposal – Course: INFO-B535 FA13 3
EMR stands for Electronic Medical Record and PHR stands for Personal Health Record
(Chilmark, 2013).
Because EHR-RUBRIC-SP is designed to be used in smaller, private practices, it is
important to note trends of EHRS adoption in this milieu. While no consensus definition of a
small practice exists, we note that Decker, Jammoom, & Sisk (2012) place the classification of
“small practice” at a maximum of two full-time physicians. We thus choose (somewhat
arbitrarily) to extend the definition to practices of five physicians or less. Very recent research
by Xierali et al (2013) finds that small practices are the least likely to adopt EHRSs; these
authors found a 68% rate of adoption among small practices in 2011, a finding that is reinforced
by Decker, Jammoom, & Sisk’s preceding research. Thus, we may say that there is indeed a
market for EHR implementation analysis in smaller practices.
The practice’s users are more likely than not going to be averse to change, particularly
the more radical the change is (Warner & Hochberg, 2012). Thus, some sort of social evaluation
is called for: We evaluate instead through network structure and social science dogma the
potential of technology to spread. Mirriahi, Dawson, & Hoven (2012) stated that information
diffusion is best achieved through a graph of individuals through nodes (in this case, individuals)
of high betweenness centrality (BC). The calculation of BC of individuals in a social structure is
complex and beyond the scope of this article; however, there exist software packages for simple
calculation of this metric. Here, we use Sci2 (Linnemaier et al, 2009), as it is freely available.
Analysis of the technology used to keep records, including EHRs, is also extremely
important. Many technologies exist for the storage of data; these technologies have various
components, such as hardware, software, and data structuring. Should a hardware system fail or
become overloaded, it is obvious that the EHRS it supports will fail with it; an egregious
example was seen in the temporary failure of the United States’ healthcare.gov site (Bryant,
2013). Bryant (2013) also points to the possibility that this particular website’s failure was also
due to poor data structuring; this facet is addressed later on in our review.
A more famous incident of health IT downtime was the Sutter Health case in Sacramento,
California (McCann, 2013). Not only did this hospital’s EHR system implemented have a full
24-hour crash, a majority of it was also unavailable for approximately eight hours due to
scheduled maintenance. The outages proved culturally unacceptable; nurses called for a delay
(or even complete moratorium) on EHR adoption (McCann, 2013). Further literature defines the

Student: Anand Kulanthaivel – Document: EHR Metric Proposal – Course: INFO-B535 FA13 4
uptime percentage (essentially the inverse of downtime in a ratio figure with respect to total
time) as acceptable when it is ≥95.0%, with a more optimal figure of ≥99.0% (Pyles, 2005, pp.
57-59).
Software technologies and data structuring are also of importance in EHRSs. Data
matching and access times are dependent upon the software of choice, as said software will use
certain data structures. The relational database (RDB) structure, most frequently implemented
by SQL (Server Query Language), stores data in flat tables with identifiers that link the data
together; such systems are also known as Relational Database Management Systems, or
RDBMSs (Rouse, 2008).
In order to achieve meaningful use, data in an RDB must also be handled in absolute
context. RDBs feature data typing (the characteristic that each entity in a table must hold a
certain data type). In SQL, common types are character strings, integers, decimal numbers, and
Booleans. In order for data to be compared from two different tables, they must be of the same
declared type. (Donahoo & Speegle, 2005, pp. 5-8). Furthermore, in order to enhance referential
integrity (RI; a method of preventing record duplication), a common fixed ontology relies simply
upon unique identifying numbers for each entity; such an ontology has been shown beneficial for
an EHRS in the setting of primary care (de Lusignan et al, 2006). As such (ideally speaking) no
field is repeated within the RDBMS. At the very least, this type of integrity assists in preventing
accidental deletion of records within the RDB/RDBMS. (Sahgal, 2013.)
Meaningful Use principles hold that units are kept consistent between processes; the
AHRQ (Agency for Healthcare Research and Quality) agrees (2009). Kulanthaivel (2012)
furthermore emphasizes the use of unit consistency in dosimetry systems and states that dosage
for digoxin, a cardiac medication with low therapeutic index, is always stated in micrograms
(1,000 micrograms equals one milligram). In 1997, this particular medication was actually
involved in the death of a Houston, Texas infant with a cardiac disorder (Belkin, 1997) due to
non-standard dosing instructions. Therefore, we may conclude that the usage of proper units is
of prime importance in any EHRS.
Staff (i.e., anybody who works for the clinic) participation is vital in the implementation
of an EHRS. The AHRQ (2009) proposed several measures that would evaluate staff
participation in implementation of an EHRS. These measures include (but are not limited to) the
percentage figure of prescriptions that are ordered via the EHRS, and the percentage of

Student: Anand Kulanthaivel – Document: EHR Metric Proposal – Course: INFO-B535 FA13 5
discrepancies in dosages between prescription orders sent and prescription orders ordered
(AHRQ, pp. 28-29).
Finally, it is notable that scholars and corporations alike agree that the display and
information architecture (IA) of EHRSs must meet patient needs and be patient-centered in
general. Rowley (2013) states that (at least as an option), MU stage 2 criteria mandates that
providers should be able to give patients laboratory results via an electronic record (or paper
copy thereof, if the patient prefers). Indeed, the system implemented by Patients First (2011) has
as one of its own MU goal criteria that such personal patient reporting requirement be met.
Furthermore, Dalrymple (2013) claims that there exists legislation within the ACA that requires
that all results and treatments be explained thoroughly and in plain language that is
understandable to the patient. Furthermore, Dalrymple stated that such an implementation would
require analysis from the social side as well as the technical side, as a technical system must
deliver socially appropriate results.
Of course, subjective biases (amongst other issues) could pose problems in evaluating the
social appropriateness of results. In order to provide a framework for at least mathematical
consistency in the evaluation of social appropriateness, we shall default to the classical Z-
distribution (also known as a normal distribution or the bell curve). This distribution, which will
be referenced as a guideline later in this evaluation system, is commonly used in human-centered
fields as a metric of human facets to the point that it is the only probability distribution used in
some applications of error determinations (Kutner, Nachtsheim, & Neter, 2004, p. 110).
Methods and Evaluative Framework
This section deals with the proposed metrics themselves and the rationales for using
them. Note that there are different metrics to be deployed at different points in time, allowing
for iterative analysis of the suitability of the system. Furthermore, if applicable, actual numerical
results are discussed in simulations performed on the Patients First (PF) system.
Most evaluands for EHR-RUBRIC-SP were chosen based upon the literature review
conducted previously. We divide the evaluands into two categories: Social and Technical;
furthermore, each category has sub-categories for the time of data surveying (at introduction of
the EHRS, six months post-introduction, and one year post-introduction). Each evaluand is

Student: Anand Kulanthaivel – Document: EHR Metric Proposal – Course: INFO-B535 FA13 6
subject to proper statistical analysis and interpretation; guidelines for proper use are explained
with evaluand descriptions.
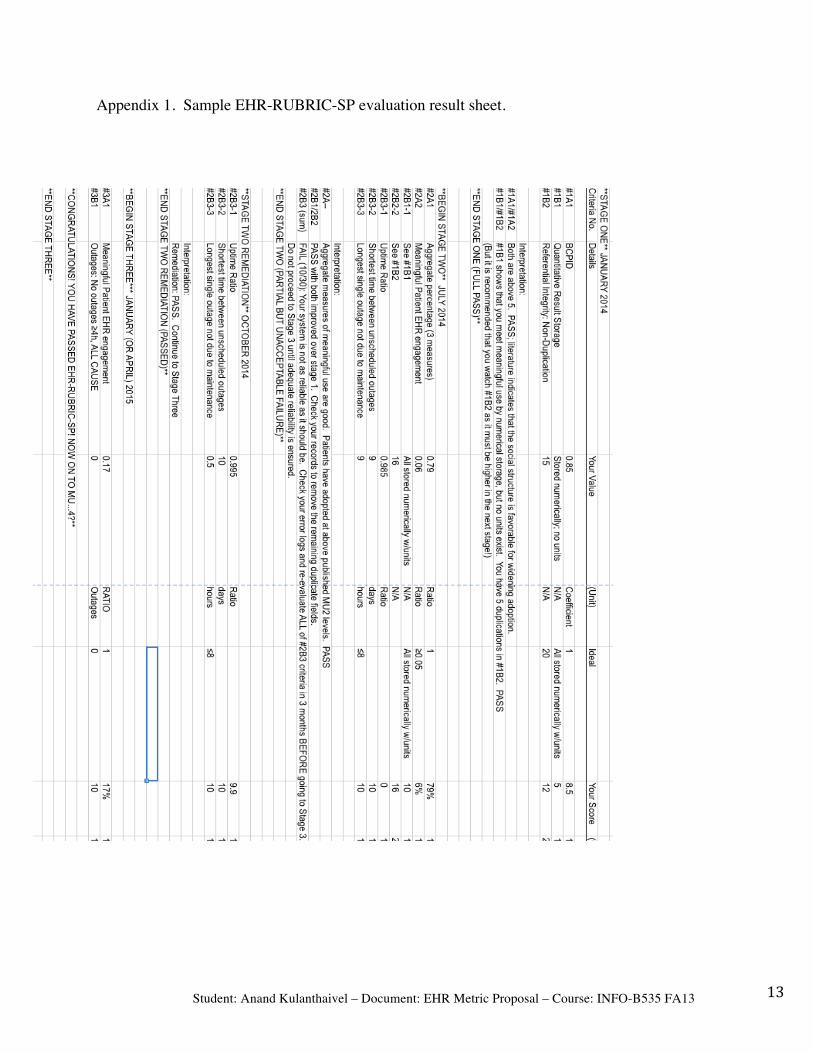
A mock grading sheet for EHR-RUBRIC-SP with sample values is available in the
Appendix, should the reader wish to facilitate his or her understanding of EHR-RUBRIC-SP.
Phase I: Timed for Pre-implementation; major focus is social
While document specifications (as supplied by instructor) indicated that phase I would be
performed at implementation time (T = 0), the author has instead chosen for Phase I to occur
prior to implementation. We thus analyze first the social structure in order to determine
information diffusion. For this end, a simple human resources chart shall suffice, with links
drawn between individuals who communicate. However, for purposes of network simulation,
individuals who do not embrace technology, intuitively, would be excluded.
I-A. Social Simulation
NOTE: While this metric system is designed to use primarily so-called hard measures of
adoption, a social analysis will require some (albeit minimal) surveying. To run this measurable
survey, one will require asking the following single question to all staff, measured with an
answer of yes or no:
“Would you embrace an electronic health record system?”
It is important to understand that while performing network modeling, individuals who
answered “no” to the above question would actually not be included in the network graph, as we
are operating on the assumption that those who are neither familiar with nor embracing of
technology will not participate in this diffusion of information. Mirriahi, Dawson, and Hoven
(2012) suggest that high-BC individuals are good places to introduce the EHRS. Introduction of
the EHRS at other points in the network reduces the score. To determine the BC-point of
introduction discrepancy (which we term a unique measure known as the BCPID), we use the
following equation:

Student: Anand Kulanthaivel – Document: EHR Metric Proposal – Course: INFO-B535 FA13 7
𝐵𝐶𝑃𝐼𝐷 =∑ 𝐵𝐶𝑠 𝑜𝑓 𝑁 𝑐𝑙𝑖𝑛𝑖𝑐𝑖𝑎𝑛𝑠 𝑡𝑜 𝑤ℎ𝑜𝑚 𝑡ℎ𝑒 𝑣𝑒𝑛𝑑𝑜𝑟 𝑖𝑛𝑡𝑟𝑜𝑑𝑢𝑐𝑒𝑑 𝑡ℎ𝑒 𝑡𝑒𝑐ℎ𝑛𝑜𝑙𝑜𝑔𝑦
∑ 𝐵𝐶𝑠 𝑜𝑓 𝑡ℎ𝑒 𝑡ℎ𝑒 𝑁 𝑐𝑙𝑖𝑛𝑖𝑐𝑖𝑎𝑛𝑠 𝑤𝑖𝑡ℎ 𝑡ℎ𝑒 ℎ𝑖𝑔ℎ𝑒𝑠𝑡 𝐵𝐶𝑠
A step-by-step guide to the calculation of BCPID in the Sci2 tool (with an example) is available in Appendix 2.
I-B. System Survey
MU recommendations (as reviewed prior) state that data must be interchangeable and have
proper unit notation. Therefore, the following criteria are suggested in Phase I of system
surveying:
• #1B1. All numerical entities in the RDB behind the EHR should be stored as decimal
(double) value format. The reason for this criteria is obvious and due to the incapability
of an RDB to compare non-numeric values (or in some cases, values of separate numeric
format).
• #1B2. There must be referential integrity. If a practice is to choose an RDBMS, no field
may be duplicated in separate tables. In other words, patient name may not be present as
a field in two different tables, as only one table is responsible for storing patient name.
Further detail about evaluating an RDBMS for referential integrity is beyond the scope
of EHR-RUBRIC-SP; interested readers are directed to Sahgal’s 2013 article (please see
references section).
Thus, we finally arrive at the following scores for the pre-implementation analysis:
#1A1 (BCPID): Scored from 0-10 by multiplying the BCPID by 10. (Maximum score is 10).
#1B1 (Storage of numbers): 10 points if stored numerically and in identical decimal format and
with units; 5 points if done so without units; 0 if stored in non-decimal format or does not exist.
#1B2: (Referential Integrity): 20 points initially; subtract 1 point for each table field found to be
redundant. Unique identifiers that are used to join tables do not count, as they serve as explicit
keys and are required; however, entities such as having fields for doctors’ notes in two separate
tables is a reason for subtraction of a point. The minimum score possible for #1B2 is zero.
Due to the iterative nature of EHR-RUBRIC-SP, there is an opportunity for decision-
making and thus iteration at this point. One may propose that for #1A1 and #1A2, both scores

Student: Anand Kulanthaivel – Document: EHR Metric Proposal – Course: INFO-B535 FA13 8
must be greater than 5 respectively in order to consider any EHR system socially acceptable;
in other words, more than half the practice’s staff must be in the largest component of the
communication network and there must be less than 50% BCPID. The organization therefore
should consider not adopting any EHR if the result from #1A1 is less than or equal to 5.0; we can only speculate that staff IT training may be required in this case. Furthermore, as
non-numerical storage of numerical values at this stage is unacceptable in achieving meaningful
use, a score of 5 is needed in #1B1 and that this criterion must be met prior to implementation.
#1B2 is a later goal of MU, and the total of all items under #1B can be considered acceptable if
they add up to 10 points.
II-A. Social Survey (6 months out)
By this point, we should assume that all criteria from the pre-flight implementation
checklist outlined in section I of this rubric have been met in a satisfactory manner. Non-
fulfillment of any of the criteria in I-B, in particular, must be rectified as per MU criteria; note
again that the “I” in EHR-RUBRIC-SP emphasizes iteration (i.e., re-design if necessary).
In conducting the second social survey itself, basic ‘yes/no’ questions should be asked of
users at many levels at this point, and are based on MU criteria. Prior graph theory studies by
Mirriahi, Dawson, & Hoven (2012) as well as more domain-specific use cases such as Patients
First (2011) indicate that IT adoption will proceed through to patients. In order to determine
disruptiveness of this technology, we actually need not ask staff anything and may instead
measure from system logs. We suggest a measure that composites (as stated in the literature
review) the AHRQ requirements (2009); in particular, we target those common in the outpatient
setting: Percentage of medication agreement (comparison of what is dispensed with what the
EHR states ought to be dispensed), percentages of prescriptions ordered directly via the online
functionality system, and percentage of laboratory test results that are available online to at least
the physician. The AHRQ specifies the first two of these criteria explicitly (pp. 28-29) as
potentially meeting meaningful use.
Thus, criteria include:
• #2A1. Average the three figures given in the previous paragraph (medication agreement,
e-prescribing, and lab test result delivery).

Student: Anand Kulanthaivel – Document: EHR Metric Proposal – Course: INFO-B535 FA13 9
• #2A2. (For patients) “Have you used this portal and gained useful knowledge about your
health from it?” (Percentage yes is calculated)
One does have the option of re-constructing a network as seen in section I-A of the proposed
metrics, or one may set an arbitrary threshold of opinion, which would be less measurable
(dependent upon #2A1’s answers). However, productivity is a hallmark of a good EHR system,
and users must have a favorable opinion of a system in order for it to be adopted in a meaningful
fashion. Therefore, if a score of more than 50% as the composite for #2A1 is not met, the
practice may wish to check their BCPID figure from #1A1. In order to determine the score out
of 10 for evaluand #2A2, we turn to Rowley (2013), who expects a rate of 5% patient-side
adoption by 2014. If 5% of patients access the portal and (as per survey text) gain knowledge,
we assign 10 points.
While the AHRQ (2009) specifies that a majority fulfillment of its criteria (in general,
around 50% for measures related to clinician activity), criteria for patient adoption are more
difficult to find. AHRQ claims that “the denominator [total patient or clinician base] is difficult
to determine” (p.28) at times. Thus, we will trust our instincts with respect to the Z-distribution
and set a boundary at the negative one standard deviation boundary of percentage patients who
have adopted, a figure that is ≥ 15%. Finally, in section #2A, 10 points are assigned for
meeting each criteria, and 10/20 points for the aggregate of #2A1and #2A2 is desired.
II-B. System Survey, 6 months out: Structure & Reliability
• #2B1-1 & 2: The protocol on this step is to repeat steps #1B1 and #1B2 above, and score
by the same 10 and 20-point scales, respectively.
Based on the outage of the critical healthcare.gov website (Barnes, 2013), it is again brought
to us that outages are simply not an option in an EHRS. We thus ask for a system metric,
directly from the system itself: A value of zero is desired for a downtime ratio, and any greater
values may warrant investigation into the reason(s) for the downtime and mitigation of these
downtime factors. The Downtime ratio could be a valid relative measure of these factors, but
given the precedent case as explained by McCann (2013) also adds the idea that any outage in

Student: Anand Kulanthaivel – Document: EHR Metric Proposal – Course: INFO-B535 FA13 10
excess of eight hours is purely unacceptable and unacceptable downtime should also be factored
in.
Therefore, we have the final system metric for this stage of evaluation:
• #2B2-1: The server log is to be observed for outages. As an EHRS would ideally be
available 24 hours a day, seven days a week, it is possible that an outage may have
occurred during business hours. Thus, we calculate the uptime ratio to see how well the
system actually did perform its duties in being available:
𝑈𝑝𝑡𝑖𝑚𝑒 𝑅𝑎𝑡𝑖𝑜 =𝐻𝑜𝑢𝑟𝑠 𝑠𝑒𝑟𝑣𝑒𝑟 𝑤𝑎𝑠 𝑢𝑝 𝑡ℎ𝑒 𝑝𝑎𝑠𝑡 𝑠𝑖𝑥 𝑚𝑜𝑛𝑡ℎ𝑠
𝐷𝑎𝑦𝑠 𝑖𝑛 𝑡ℎ𝑒 𝑝𝑎𝑠𝑡 𝑠𝑖𝑥 𝑚𝑜𝑛𝑡ℎ𝑠 ∗ 24
Note that the number 24 stands for 24 hours in a day, and that any six month interval could have
a different number of days, depending particularly on the inclusion of the month of February in
the cycle study period.
• #2B2-2: Assign 10 points if no outages due to any cause occurred with a frequency
greater than 7 days apart (this figure is based on a week’s length, obviously). A score of
0 is incurred for #2B3-2 if any unscheduled outage was observed during business hours,
since as per McCann (2013), clinician-side productivity in such an outage would be
severely reduced.
• #2B2-3: Assess reliability with respect to unacceptable downtime by looking for any
downtime that was greater than 8.0 hours. This facet receives a score of 10 if none were
found, and 0 if any were found.
The scores of the system in stage II are then analyzed. Because of the improvement
expected from Stage I, the practice’s EHRS should ideally score 10 on #2B-1 and at ≥25 on #2B-2. Furthermore, an outage score (sum of all sub-scores of #2B2) may be calculated;
more than two out of three of these disruptions (i.e., a #2B2 sub-score of under 20) can be
considered undesirable. It is at this point the responsible engineers should evaluate factors
behind any unacceptable disruptions, suggestions such as sheer traffic volume and poor data
architecture were proposed by Barnes (2013), at least in the case of healthcare.gov.
Stage III: 12 months post-implementation

Student: Anand Kulanthaivel – Document: EHR Metric Proposal – Course: INFO-B535 FA13 11
It is important to note that by reaching this particular stage, the practice should have
cleared all criteria from Stage II, including #2A2-1/2, which is a repeat of #1A2 (and thus
ensures clearance of Stage I). Otherwise, it is intuitive that the practice may end up unable to
escape from an infinite loop of testing! Otherwise, Stage III is essentially an extension of
previous stages, but with higher criteria. If satisfaction of Stage II criteria is delayed, Stage III of
evaluation also should be delayed by the same amount.
III-A: Social Analysis
• #3A1: Please see #2A1 and take the same composite score. At this point, we would like
a target higher than 50%; as we are moving in terms of Z-distribution (the normal
distribution), we have chosen to evaluate the system at the next standard deviation (SD)
past 50%. The score from #2A1 when re-calculated, therefore, must fall at ≥85%. (10/10 points). If the criterion is met halfway in terms of improvement (i.e., to
67.5%), we may assign 5/10 points for #3A1.
• #3A2: We again assess patient engagement. The next step from the previously
published (Rowley, 2013) estimate of 5% should increase to at least to the next standard
deviation. Therefore, at Stage III, ≥15% of patients should have been noted to use the patient-facing electronic portal and have gained information from it (10 points);
much as is #3A1, we can use a halfway point (i.e., 7.5% of patients having used the
system and gained information) to achieve a score of 5/10 on metric #3A2.
By this point, we want at least halfway compliance on the aggregate of the criteria; therefore, #3A1 and #3A2 should total to 10.
III-B: System Survey
• #3B1. As passing the requirements for Stage II are mandated, we shall not entertain
extensive outages. However, we may refine our metric and instead look at monthly
maintenance by itself. A precedent study (Sutter Hospital, as shown by McCann [2013])
showed a maintenance time of 8 hours for the system. As some at Sutter considered the
figure unacceptable, we halve Sutter’s maintenance outage time and ask that 4 hours or

Student: Anand Kulanthaivel – Document: EHR Metric Proposal – Course: INFO-B535 FA13 12
less have been spent each month on system maintenance. #3B must be met fully for the
systems test to pass.
Aftermath (post-Stage III)
While the discussion of evaluations post-Stage III is beyond the scope of this article,
practices that cannot meet Stage III within 12 months would be continuing their testing. Much
like the recommendation in case of failure in Stage II, we recommend that three months be given
to re-evaluate Stage III should any of its components fail testing. Further evaluation beyond
Stage III, in addition, would not occur for any practice until 2015 due to the date of this writing
and may be subject to changing governmental rules (at least in the US), and practices are
encouraged to turn to future MU criteria scales at that time
Discussion & Conclusions
We have created a thorough, three-stage plan (EHR-RUBRIC-SP) for the evaluation of
an EHRS implementation in smaller private medical practices. EHR-RUBRIC-SP is split into
three stages, to be implemented just prior to, six months after, and twelve months after
implementation. Two major dimensions are seen in each of the stages: Social-based dimensions
and technical systems-based dimensions. The plan is designed to be patient-focused, and does
not fixate upon financial revenue gain. However, the MU focus of the plan facilitates the
avoidance of financial penalties (which are beyond the scope of this discussion).
It is obvious that EHR-RUBRIC-SP is not thorough (nor is it designed to be), nor are the
evaluation’s evaluands always measurable by all practices. The AHRQ particularly cites the
“denominator” problem of determining total patient (or order) count (2009, p. 28); we consider
this issue to be inherent in any analysis. However, practices may circumvent the denominator
issue simply by counting their own patients and orders manually.
Lastly, there exists literature such as Xierali et al (2013)’s research on the paucity of
adoption of EHRSs by smaller practices. Such literature provides an onus through which smaller
practices may be encouraged to adopt and evaluate their adoption of an EHRS. Similarly, we
hope that EHR-RUBRIC-SP is actually deployed across a real EHRS in context of a
smaller practice in order to see if the evaluation is satisfactory with regards to the practice’s desires.
Student: Anand Kulanthaivel – Document: EHR Metric Proposal – Course: INFO-B535 FA13 13
Appendix 1. Sample EHR-RUBRIC-SP evaluation result sheet.

Student: Anand Kulanthaivel – Document: EHR Metric Proposal – Course: INFO-B535 FA13 14
Appendix 2: Social Network Analysis Workflow (BCPID calculation)

Student: Anand Kulanthaivel – Document: EHR Metric Proposal – Course: INFO-B535 FA13 15
References Agency for Healthcare Research and Quality (AHRQ) (2009). Write your evaluation plan.
Health Information Technology Evaluation Toolkit: 2009 Update. [As supplied by
instructor.]
Belkin, L. (1997, 15 June). How can we save the next victim? New York Times (1997 15 June).
Bryant, N. (2013). Obama addresses healthcare website glitches. BBC News 2013 October 21.
Retrieved from http://www.bbc.co.uk/news/world-us-canada-24613022
Chilmark (2013, April 2008). What might an ideal EHR look like? Retrieved from
http://www.chilmarkresearch.com/2008/04/24/what-might-an-ideal-ehr-look-like/
Dalrymple, P. (2013). “The P-Word” [Colloquium talk]. Given at Indiana University
(Indianapolis, IN) 2013 18 October.
Decker, L., Jammoom, E., & Sisk, J. (2013). Physicians in nonprimary care and small practices
and those age 55 and older lag in adopting electronic health record systems. Health Affairs
(Milwood), 2012 31(5): 1108-1114.
DeLusignan, S. et al. (2006). Routinely-collected general practice data are complex, but with
systematic processing can be used for quality improvement and research. Informatics in
Primary Care 2006;14(1): 59-66.
Donahoo, M. & Speegle, G. (2005). SQL: Practical Guide for Developers. San Francisco, CA:
Morgan Kaufmann.
Kulanthaivel, A. (2012). Normal accidents in medicine: The system is to blame. (Term Paper;
Course: Organizational Informatics, LIS-Z513). Bloomington, IN: Indiana University
Bloomington. Retrieved from http://jmiscomm.com/anandk/d.php?c=normaccidents

Student: Anand Kulanthaivel – Document: EHR Metric Proposal – Course: INFO-B535 FA13 16
Kutner, M., Nachtsheim, C., & Neter, J. (2004). Applied Linear Regression Models. New York,
NY: McGraw-Hill Irwin.
Linnemaier et al (2009). Sci2 tool (software). Bloomington, IN: Indiana University
Bloomington. Retrieved from http://sci2.cns.iu.edu/.
McCann, E. (2013). Setback for Sutter after $1B EHR crashes. Healthcare IT News. (2013
August 28). Retrieved from http://www.healthcareitnews.com/news/setback-sutter-after-1b-
ehr-system%20crashes?topic=08,17,19
Mirriahi, N., Dawson, S., & Hoven, D. (2012). Identifying key actors for technology adoption in
higher education: A social network approach. Australasian Society for Computers in
Learning in Tertiary Education 2012. (Conference Proceeding). Retrieved from
http://www.ascilite.org.au/conferences/wellington12/2012/images/custom/mirriahi,_negin_-
_identifying_key.pdf.
Patients First (2011). Viewing patients as partners: Patient portal implementation and adoption
(Case study). HealthIT.gov. Retrieved from http://www.healthit.gov/providers-
professionals/patients-first-health-care-case-study
Pyles, J. (2005). MCTS: Microsoft Office SharePoint Server 2007 Configuration Study Guide.
Indianapolis, IN: John Wiley & Sons Publishing.
Rouse, M. (2008). Relational database management system (RDBMS). Techtarget.com; 2005
November. Retrieved from http://searchsqlserver.techtarget.com/definition/relational-
database-management-system.
Rowley, R. (2013). Can patient engagement be achieved from a clinician messaging system?
RobertRowleyMD.com. Retrieved from http://robertrowleymd.com/2013/05/30/can-patient-
engagement-be-achieved-from-a-clinician-messaging-system/

Student: Anand Kulanthaivel – Document: EHR Metric Proposal – Course: INFO-B535 FA13 17
Sahgal, V. (2013). What’s referential integrity? ProgrammerInterview.com: 24 October 2013.
Retrieved from http://www.programmerinterview.com/index.php/database-sql/what-is-
referential-integrity/.
Warner, J. & Hochberg, E. (2012). Where is the EHR in oncology? J. National Coprehensive
Cancer Network 2012 May;10(5): 584-588.
Xierali, I. et al. (2013). Factors influencing family physician adoption of electronic health
records (EHRs). J Am Board of Family Med. 2013; 26(4): 388-393. Retrieved from
http://www.jabfm.org/content/26/4/388.long.