Embed Size (px)
Citation preview
ENVIRONMENTALHEALTH PERSPECTIVES
This article will be available in its final, 508-conformant form 2–4 months after Advance Publication. If you need assistance accessing this article before then, please contact [email protected]. Our staff will work with you to assess and meet your accessibility needs within 3 working days.
http://www.ehponline.org
ehpPrenatal Phthalate Exposure and Childhood Growth and
Blood Pressure: Evidence from the Spanish INMA-Sabadell Birth Cohort Study
Damaskini Valvi, Maribel Casas, Dora Romaguera, Nuria Monfort, Rosa Ventura, David Martinez, Jordi Sunyer,
and Martine Vrijheid
http://dx.doi.org/10.1289/ehp.1408887
Received: 27 June 2014Accepted: 1 April 2015
Advance Publication: 7 April 2015
1
Prenatal Phthalate Exposure and Childhood Growth and Blood
Pressure: Evidence from the Spanish INMA-Sabadell Birth Cohort
Study
Damaskini Valvi1,2,3,4, Maribel Casas1,2,3, Dora Romaguera1,5,6,7, Nuria Monfort8, Rosa
Ventura2,8, David Martinez1,2,3, Jordi Sunyer1,2,3,8, and Martine Vrijheid1,2,3
1Centre for Research in Environmental Epidemiology (CREAL), Barcelona, Spain; 2Pompeu
Fabra University, Barcelona, Spain; 3CIBER de Epidemiología y Salud Pública (CIBERESP),
Spain; 4Department of Environmental Health, Harvard T.H. Chan School of Public Health,
Boston, Massachusetts, USA; 5School of Public Health, Imperial College London, London,
United Kingdom; 6Instituto de Investigación Sanitaria de Palma (IdISPa), Palma de Mallorca,
Spain; 7CIBER Fisiopatología de la Obesidad y Nutrición (CIBEROBN), Spain; 8Hospital del
Mar Medical Research Institute (IMIM), Barcelona, Spain
Address correspondence to Damaskini Valvi, Centre for Research in Environmental
Epidemiology (CREAL), 88 Dr. Aiguader St, 08003 Barcelona, Spain. Telephone: +34
932147354. E-mail: [email protected]
Running title: Phthalates and childhood growth and blood pressure
Acknowledgments: We would particularly like to thank Dr. Xavier Basagaña for providing
statistical advice and all the cohort participants for their generous collaboration. This study was
funded by grants from the RecerCaixa (Register number: 2010ACUP00349), the “Instituto
Carlos III” (Red INMA G03/176, CB06/02/0041 and predoctoral grant PFIS 2010, Register
number: FI10/00399), the Spanish Ministry of Health (FIS-PI041436, FIS-PI081151), the

2
Generalitat de Catalunya-CIRIT (1999SGR 00241), and the Fundació Roger Torné. A full roster
of the INMA Project investigators can be found at: http://www.proyectoinma.org.
Competing financial interests: The authors have no competing financial interests to declare.
3
Abstract
Background: Human evidence on the effects of early life phthalate exposure on obesity and
cardiovascular disease risks, reported by experimental studies, is limited to a few cross-sectional
studies.
Objectives: We evaluated the associations between prenatal phthalate exposure and childhood
growth and blood pressure in a Spanish birth cohort study.
Methods: We assessed exposure using the average of two phthalate metabolite spot-urine
concentrations collected from the mothers in the first and third pregnancy trimesters (creatinine-
adjusted, n=391). Study outcomes were the difference in age- and sex- specific Z-scores for
weight between birth and 6 months of age; and repeated age- and sex-specific Z-scores for body
mass index (BMI) at 1, 4 and 7 years; waist-to-height ratio at 4 and 7 years; and age- and height-
specific Z-scores for systolic and diastolic blood pressure at 4 and 7 years.
Results: The sum of 5 high molecular weight phthalate metabolites (ΣHMWPm) was associated
with lower weight Z-score difference between birth and 6 months (β per doubling of exposure=-
0.41; 95%CI: -0.75, -0.06) and BMI Z-scores at later ages in boys (β=-0.28; 95% CI:-0.60, 0.03)
and with higher weight Z-score difference (β=0.24; 95% CI:-0.16, 0.65) and BMI Z-scores in
girls (β=0.30; 95% CI:-0.04, 0.64) (P for sex interaction=0.01 and 0.05, respectively). The sum
of 3 low molecular weight phthalates (ΣLMWPm) was not significantly associated with any of
the growth outcomes. ΣHMWPm and ΣLMWPm were associated with lower systolic blood
pressure Z-scores in girls but not in boys.
Conclusions: This study suggests that prenatal phthalate exposure may be associated with
postnatal growth and blood pressure in a sex-specific manner. Inconsistencies with previous
cross-sectional findings highlight the necessity for evaluating phthalate health effects in
prospective studies.
4
Introduction
Phthalates are a class of synthetic compounds widely used in the manufacture of many industrial
and consumer products, such as polyvinyl chloride (PVC) products including building materials,
cables and wires, clothing and food and beverage containers and non-PVC products including
adhesives, enteric-coated capsules and personal-care articles (Wittassek et al. 2011). High
molecular weight phthalates (HMWP), such as di-2-ethylhexyl phthalate (DEHP), have been
commonly used in the manufacture of polyvinyl chloride (PVC) applications while low
molecular weight phthalates (LMWP), such as di-ethyl phthalate (DEP), are commonly used in
non-PVC personal care products. Food and especially the consumption of packaged food and
beverages is considered to be the main route of human exposure to HMWP, while the use of
personal care products and indoor air may contribute importantly to LMWP exposure (Adibi et
al. 2008; Koch et al. 2013; Wittassek et al. 2011). Phthalates are non-persistent compounds that
are quickly metabolized in the human body and excreted in urine (within few hours or days after
exposure) (Wittassek et al. 2011). Studies in many countries have reported detectable levels of
phthalate metabolites in urine of almost all individuals tested (>90%), including pregnant woman
(Adibi et al. 2008; Braun et al. 2012; Casas et al. 2011; Cantonwine et al. 2014). Detectable
levels of phthalate metabolites have been also found in amniotic fluids (Jensen et al. 2012) and
cord blood (Yan et al. 2009) indicating fetal exposure.
Evidence from experimental studies suggests that phthalate exposure in early life may disrupt
developmental processes and potentially through permanent epigenetic changes may lead to
increased risk of cardiometabolic diseases later in life (Barouki et al. 2012). In vitro and in vivo
studies have shown that phthalates and phthalate metabolites are thyroid hormone and androgen
5
antagonists and may activate the peroxisome proliferator activated receptors (PPARs), a nuclear
receptor superfamily with a key role in adipogenesis, lipid accumulation and insulin resistance
(Boberg et al. 2008; Hao et al. 2012; Taxvig et al. 2012). These mechanisms suggest a potential
link to the development of obesity and diabetes. More recently a potential link between phthalate
exposure and cardiovascular disease (CVD) risk has emerged, almost exclusively based on cross
sectional data (Trasande et al. 2013b and 2014). Phthalate metabolites are shown to induce the
release of proinflammatory cytokines in vitro (Jepsen et al. 2004) and phthalate metabolite
concentrations were positively associated with urine markers of oxidative stress during
pregnancy in a cohort of Puerto Rican women (Ferguson et al. 2014). Further, in two recent
cross-sectional studies of children who participated in the National Health and Nutrition
Examination Survey (NHANES), phthalate urine concentrations were associated with higher
systolic blood pressure (BP) (Trasande et al. 2013b) and low-grade albuminuria, a marker of
vascular dysfunction associated with chronic kidney and CVD risks (Trasande et al. 2014). Thus,
we evaluated the associations between prenatal exposure to several phthalates and growth
outcomes (i.e. weight gain, body mass index [BMI], waist-to-height ratio) and systolic and
diastolic BP in the first 7 years of life using data from a prospective birth cohort study in Spain.
Because child rapid weight gain in the first months after birth has been consistently associated
with increased risk of obesity later in childhood and adulthood (Druet et al. 2012), we further
examined whether phthalate exposure is associated with weight gain in the first 6 months of life.
6
Methods
Population and data collection
The Spanish population-based birth cohort study INMA (“Infancia y Medio Ambiente”-
Environment and Childhood) recruited 657 women in the first trimester of pregnancy in the two
primary healthcare centers of Sabadell in 2004-2006 (Guxens et al. 2012). The inclusion criteria
were: age at least 16 years, intention to give birth in the reference hospital, no problems in
communication, singleton pregnancy, and no assisted conception. The mother-child pairs were
later followed in the third trimester of pregnancy, at delivery and at child ages 6 months and 1, 4
and 7 years (participation rate in last follow-up:76%). We analysed 391 mother-child pairs with
available phthalate and creatinine determinations measured in two spot-urine samples collected
in the first (mean±standard deviation [SD]= 13.4±1.7 gestational weeks) and third (mean±SD=
34.1±1.4 weeks) pregnancy trimesters.
Interview-based questionnaires collected information on parental sociodemographic
characteristics and other maternal characteristics including medical history and lifestyles habits.
In the first pregnancy trimester visit we measured maternal height and the mothers reported their
prepregnancy weight and paternal weight and height. In the first and third pregnancy trimesters
maternal diet was assessed using a 101-item food frequency questionnaire (FFQ) validated for
use in Spanish adults (Willet and Stampfer 1986) and physical activity using a previously
validated short self-administered questionnaire (Norman et al. 2001). Infant feeding practices
and child diet (using a 101-item FFQ) and sedentary activities were reported in postnatal
questionnaires.

7
All mothers signed an informed consent. This study was approved by the ethics committee of the
Hospital del Mar Medical Research Institute and conducted according to principles of the
Helsinki Declaration (World Medical Association 2013).
Phthalate metabolite urine concentrations
Maternal urine samples were collected during pregnancy in 100 mL polypropylene containers
and were afterwards aliquoted in 10 mL polyethylene tubes and stored at -20ºC until phthalate
analyses were carried out in the Bioanalysis Research Group at the Hospital del Mar Medical
Research Institute (Barcelona, Spain). We measured total urine concentrations (free plus
glucuronoconjugated species) in first and third pregnancy trimesters of MBzP (mono-benzyl
phthalate), MEHP (mono-(2-ethylhexyl) phthalate), MEHHP (mono-(2-ethyl-5-hydroxyhexyl)
phthalate), MEOHP (mono-(2-ethyl-5-oxohexyl) phthalate), MECPP (mono-(2-ethyl-5-carboxy-
pentyl) phthalate), MEP (mono-ethyl phthalate), MiBP (mono-iso-butyl) phthalate) and MnBP
(mono-n-butyl phthalate). Analytical methods involved urine sample preparation with enzymatic
hydrolysis with β-glucuronidase enzymes and solid-phase extraction, and analysis by
ultraperformance liquid chromatography coupled to tandem mass spectrometry (Waters Corp.
Milford) and have been detailed previously (Valvi et al. 2015). The limit of detection (LOD)
values were 0.5 µg/L or 1µg/L depending on the metabolite. All metabolites had quantified
concentrations in almost all samples analysed (values below LOD≤1%). Urine creatinine
concentrations were measured at the Echevarne laboratory of Barcelona (Spain) using the Jaffé
method (kinetic measurement, compensated method) with Beckman Coulter© reactive in
AU5400 (IZASAⓇ).
8
We substituted phthalate metabolite values below LOD by LOD/2. We calculated the molar
sums of individual metabolites (in µmol/L) of DEHP because they occur from the same parent
phthalate, and also of HMWP and LMWP, as they represent similar sources of exposure and they
are moderately to highly correlated (ΣDEHPm, ΣHMWPm and ΣLMWPm, hereafter) (Valvi et
al. 2015). The ΣDEHPm included the simple monoester, MEHP, and the secondary oxidized
metabolites, MEHHP, MEOHP and MECPP. The ΣHMWPm included the ΣDEHPm metabolites
and MBzP. The ΣLMWPm included MEP, MiBP and MnBP. We expressed the molar sums in
ng/mL by multiplying ΣDEHPm and ΣHMWPm with the molecular weight of MEHP, and
ΣLMWPm with the molecular weight of MEP to facilitate comparisons, similar to methods
followed in other studies (eg Wollf et al. 2010). Concentrations of individual and summed
metabolites were divided by urine creatinine levels (in µg/g creatinine) to control for urine
dilution.
All phthalate metabolite concentrations had poor reproducibility between the two pregnancy
trimester [intraclass correlation coefficients<0.25, (Valvi et al. 2015)]. Therefore we estimated
associations with the average concentration for the two trimesters, rather than single spot-urine
concentrations, to better approximate average phthalate exposure during pregnancy. Phthalate
metabolite concentrations were log2-transformed to normalise the right skewed distributions and
analysed continuously and categorically using tertile cutoffs.
Growth and BP outcomes
Repeated weight measurements from birth to 6 months of age were extracted from the medical
records. We used the 2nd-order Reed sex-specific early infancy growth models to predict the
weight of children without weight measurement available within ±14 days of their exact 6-month
9
anniversary (n=60), as described previously (Valvi et al. 2013). Weight gain was defined as the
difference in age- and sex-specific Z-scores for weight between 6 months and birth using the
World Health Organization (WHO) referent (de Onis et al. 2009). Children with a weight Z-
score difference >0.67 SD were classified as rapid growers (Monteiro and Victora 2005). Child
weight and height were measured at 1, 4 and 7 years of age using standard protocols, without
shoes and in light clothing. We calculated BMI (weight/height2) and used the WHO referent to
estimate age- and sex-specific BMI Z-scores (de Onis et al. 2007 and 2009). Overweight was
defined as a BMI Z-score ≥the 85th percentile. Waist circumference at 4 and 7 years of age was
measured in standing position at the midpoint between the lowest rib margin and the iliac crest
after a gentle expiration. We divided child waist circumference by height to calculate the waist-
to-height ratio. Central obesity was defined as a waist-to-height ratio>0.50, as this value has been
reported to predict later risk for cardiometabolic syndrome in children as in adults (Browning et
al. 2010; Graves et al. 2013).
Systolic and diastolic BP was measured by specially trained personnel of the research team at 4
years of age at the primary health center and at 7 years of age at school. A digital automatic
monitor (OMROM 705 CPII) and a special cuff adjusted to the upper right arm size of the
children at each age were used. Measurements were taken once after at least 5 minutes in resting
position. BP measurements may vary according to child age, height and sex, therefore we
calculated age- and height-specific BP Z-scores using the population mean separately in girls and
boys. For this, age was grouped in 3-month intervals and height in centimetre units. High systolic
and diastolic BP was then defined as a BP Z-score ≥the 90th percentile.
10
Statistical analyses
Generalised additive models (GAMs) assessed the linearity of the associations between the
phthalate metabolite concentrations and the outcome variables. Linearity was assumed if the P-
gain defined as the difference in normalised deviance between the GAM model and the linear
model for the same exposure and outcome (Royston and Ambler 1998) was above 0.10. We used
generalised estimating equations (GEE) with an unstructured correlation matrix and a Gaussian
or Poisson family specification (for continuous and dichotomous outcomes, respectively) to
assess the associations between phthalate metabolite concentrations and repeated growth and BP
outcome measurements. GEE models included an interaction term between the exposure variable
and child age at examination. Child age at examination was included in the interaction term
categorically (1, 4 and 7 years in the models for BMI; 4 and 7 years in the models for BP and
waist-to-height ratio). The associations with weight gain (continuous) and rapid growth
(dichotomous) in the first 6 months of life were assessed using linear regression and generalised
linear models, respectively. Because phthalate effects may be sex-specific (Boberg et al. 2008;
Feige et al. 2010; Hao et al. 2012), we evaluated effect heterogeneity by introducing in the
models interaction terms between the exposure variable and sex and by stratifying models
according to sex. Statistical significance was defined by an alpha level of 0.10 for interaction
terms and of 0.05 for all other effect estimates.
We selected the covariates retained in the final models using a combined approach of Directed
Acyclic Graphs (DAGs) and change-in-estimate procedures (Evans et al. 2012). The initial
DAGs included maternal determinants of phthalate metabolite concentrations in this population:
country of origin, education, social class (coded based on occupation using the International
11
Standard Classification of Occupations-88 system), prepregnancy BMI, smoking, frequency of
organic food consumption and use of bleach during pregnancy (Valvi et al. 2015). Other
covariates were included based on previous literature: maternal age at delivery, parity,
gestational weight gain (Casas et al. 2013a), gestational diabetes (self-reported; yes, no),
maternal physical activity (in MET hour per day), alcohol consumption (yes, no), maternal urine
BPA concentrations during pregnancy (Valvi et al. 2013), paternal BMI, birth weight, exclusive
breastfeeding duration (Guxens et al. 2011) and child’s dietary habits [i.e. fast-food
(<once/week, ≥once/week) or sugar-sweetened beverage (<once/month, 1-4 times per month, >4
times/month) consumptions and total caloric intake (kcal/day)] and time spent watching TV or
playing videogames (≤1 hour/week, >1 hour/week) at ages 4 and 7 years. Child sex and exact
age were included in all crude and adjusted statistical models. To evaluate whether the assumed
relationships and the minimum adjustment sets provided by the DAGs are supported by our data
we conducted forward and backward 10% change-in-estimate procedures departing from the
minimum adjustment sets following the methods suggested by Evans et al. (2012). The overall
DAG of the assumed or known causal relationships between covariates included in the final
models is shown in Supplemental Material (Figure S1).
Few covariates had more than 3% of missing values; only information on dietary habits at age 4
years was missing in 11-12%. To maximise the sample size we created missing categories in
potential confounders. Results of complete-case analyses with missing observations excluded
(data not shown) were similar to results using missing categories.
In sensitivity analyses we tested associations in multipollutant models simultaneously adjusted
for ΣHMWPm and ΣLMWPm. We further repeated analyses excluding: 1) preterm births (i.e.
12
<37 weeks of gestation, n ≤8 depending on the outcome model) because they may follow
different catch-up growth trajectories (Euser et al. 2008), 2) mother-child pairs with gestational
diabetes (n≤6), 3) mothers-child pairs with very diluted urine samples in pregnancy (i.e.
creatinine<0.3 g/L, n ≤30), 4) outliers of phthalate metabolite concentrations (0.5-2% of mothers
with the highest concentrations depending on metabolite). We also repeated analysis using
phthalate metabolite concentrations in ng/mL and including urine creatinine levels as a separate
covariate in the models.
DAGs were drawn using the DAGitty version 2.0 (Textor et al. 2011). Analyses were conducted
by using STATA software, version 10 (StataCorp, College Station).
Results
Description of population characteristics
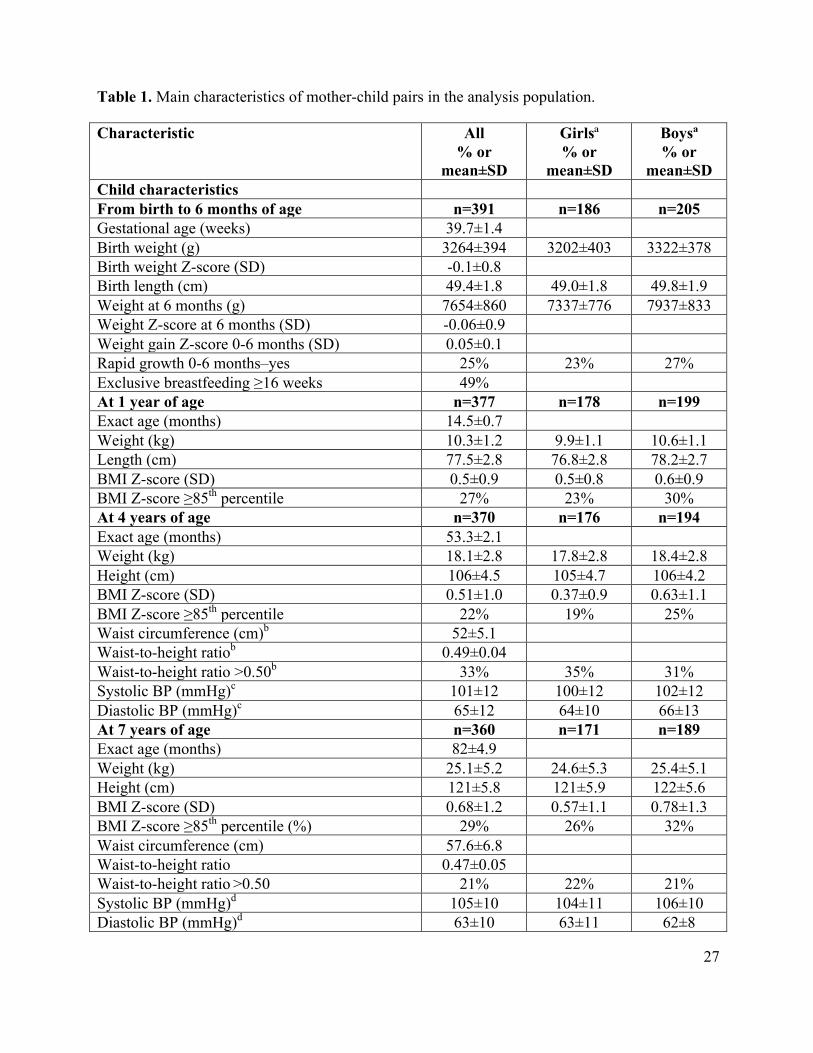
Twenty-five percent of children from birth to 6 months of age were rapid growers and 22-29%
were overweight at 1, 4 and 7 years of age (Table 1). The waist-to-height ratio was elevated in
33% and 21% of children at ages 4 and 7 years, respectively. Rapid growth and overweight were
more prevalent in boys compared to girls. Sex differences in additional maternal or child
covariates were not observed (Table 1). Children included in analysis did not differ from those
excluded (due to missing information in phthalate determinations) with respect to the study
outcome variables, but their mothers were more likely to have higher education (university: 35%
versus 19%), higher social class (professionals and managers: 24% versus 12%) and were less
likely to have smoked during pregnancy (27% versus 36%).
13
Pearson correlation coefficients between the different child ages at examination were in the
range of 0.46-0.82 for BMI Z-scores, 0.56 for waist-to-height ratio, 0.13 for systolic BP Z-scores
and no correlation was shown for diastolic BP Z-scores (Pearson coefficient=0.00) (data not
shown). Within-age correlation coefficients of the different outcome variables ranged from 0.07
to 0.67 at 4 years and from 0.21 to 0.89 at 7 years of age; at both ages correlations were lowest
between BMI and diastolic BP Z-scores and highest between BMI Z-scores and waist-to-height
ratio (data not shown).
The phthalate metabolite with the highest concentrations in maternal urine was MEP (Table 2).
The Pearson correlation coefficient between the ΣHMWPm and the ΣLMWPm was 0.18.
Phthalate metabolite concentrations (individual and sums) were linearly related to all outcome
variables (GAM P-gain>0.10), except from systolic and diastolic BP Z-scores for which non-
linear relationships (GAM P-gain<0.05) were generally observed in girls and boys for both
ΣHMWPm and ΣLMWPm (data not shown). Thus, tertile-specific effect estimates are shown
hereafter for BP Z-scores and effect estimates per doubling of phthalate metabolite
concentrations (i.e. log2 - transformed) for all other outcomes.
HMWP metabolites and growth and BP outcomes
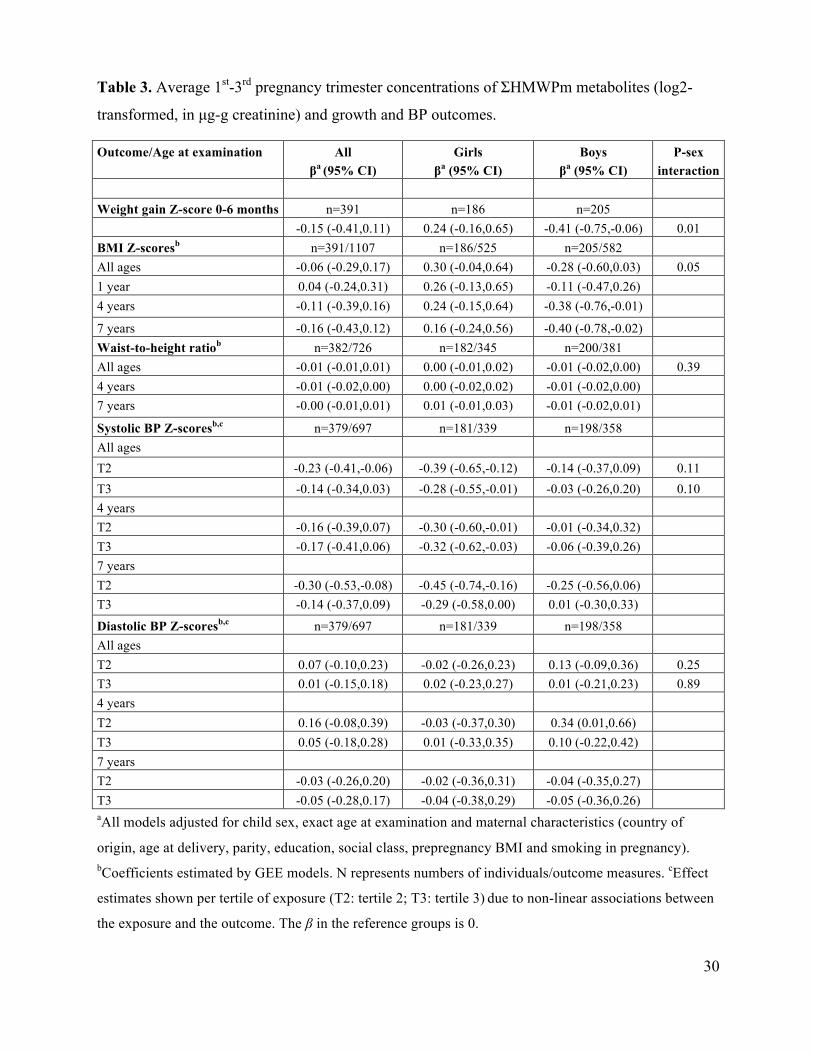
The ΣHMWPm was associated with a lower weight gain Z-score in the first 6 months of age in
boys (adjusted β=-0.41; 95% CI: -0.75, -0.06) and with somewhat higher weight gain Z-score in
girls (adjusted β=0.24; 95% CI: -0.16, 0.65) (P-sex interaction=0.01) (Table 3). The ΣHMWPm
was associated with lower BMI Z-scores in boys at any age (adjusted β=-0.28; 95% CI: -0.60,
0.03) and with higher BMI Z-scores in girls (adjusted β=0.30; 95% CI: -0.04, 0.64) (P-sex
interaction=0.05). There was some suggestion that child age may influence the associations with
14
BMI Z-scores in boys with significant negative associations observed at 4 and 7 years of age and
also a negative but non-significant association shown at 1 year of age (P-age interaction=0.10 at
4 years and 0.11 at 7 years of age). In girls, associations at each age were positive but not
statistically significant (P-age interaction=0.82 at 4 years and 0.58 at 7 years of age) (Table 3).
No association was observed with waist-to-height ratio in either boys or girls. The ΣHMWPm
was associated with significantly lower systolic BP Z-scores in girls for all ages combined
(adjusted β =-0.39; 95% CI: -0.65, -0.12 for the 2nd tertile and -0.28; -0.55, -0.01 for the 3rd
tertile of exposure) but associations were not significant in boys (P-sex interaction=0.11 and 0.10
for the 2nd and 3rd tertiles of exposure, respectively). There was no evidence of modification by
child age (P-age interaction≥0.37 in the overall and sex-specific models). Adjusting the models
for child BMI Z-scores did not change the associations between ΣHMWPm and systolic BP Z-
scores in either sex (data not shown). There was no consistent evidence of an association
between ΣHMWPm and diastolic BP Z-scores in either sex. When we analysed dichotomous
outcomes, results for rapid growth and overweight were consistent with those for weight gain
and BMI Z-scores but none of the relative risks (RRs) reached the level of statistical
significance; further, there was no association with any other of the dichotomous outcomes
studied (see Supplemental Material, Figure S2A). Analysing ΣDEHPm and MBzP separately,
both ΣDEHPm and MBzP were associated with lower weight gain Z-score in boys but not in
girls (P-sex interaction=0.03 and 0.07, respectively). The significant negative associations
between ΣHMWPm and BMI Z-scores in boys and between ΣHMWPm and systolic BP Z-scores
in girls were shown to be mainly driven by ΣDEHPm phthalates (see Supplemental Material,
Table S1).
15
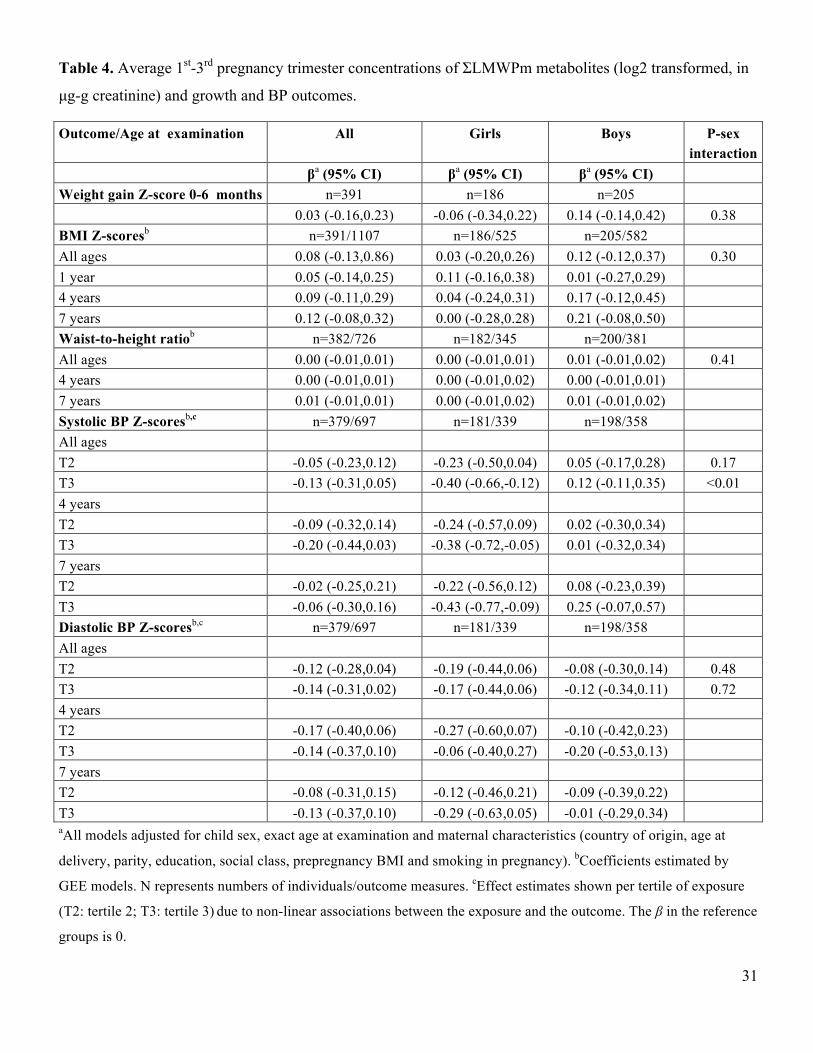
LMWP metabolites and growth and BP outcomes
The ΣLMWPm was not significantly associated with weight gain, BMI Z-scores or waist-to-
height ratio at any age (Table 4). The ΣLMWPm was associated with lower systolic BP Z-scores
in girls (adjusted β=-0.23; 95% CI: -0.50, -0.04 in 2nd tertile and -0.40; -0.66, -0.12 in 3rd tertile
of exposure) but not in boys (P-sex interaction=0.17 for the 2nd and <0.01 in the 3rd tertile of
exposure). Child age was not shown to influence these associations overall or in girls and boys
separately (P-age interaction≥0.25 at 4 and 7 years of age). Associations between the ΣLMWPm
and diastolic BP Z-scores were negative at all ages, overall and in girls or boys separately, but
none of the associations reached the level of statistical significance. When we analysed
dichotomous outcomes, there was no association with any of the growth or BP outcomes studied
overall or in boys and girls separately (see Supplemental Material, Figure S2B). From the
individual LMWP metabolites analyzed, only MEP was significantly associated with lower
systolic BP Z-scores in girls; associations for MiBP and MnBP were in the same direction but
did not reach the level of statistical significance (see Supplemental Material, Table S2).
Individual LMWP were not significantly associated with any other outcome studied.
Sensitivity analyses
The magnitude and statistical significance of the associations between ΣHMWPm and
ΣLMWPm and the growth and BP outcomes did not change in the multi-pollutant models
adjusted for both ΣHMWPm and ΣLMWPm (data not shown). The exclusions of preterm births,
mother-child pairs with gestational diabetes or with diluted urine samples in pregnancy, and few
outliers of phthalate metabolite concentrations did not change the associations of interest (data
not shown). Repeating analysis including phthalate metabolite concentrations in ng/mL and
16
creatinine as a separate covariate in the models did not change the direction or statistical
significance of the associations (data not shown).
Discussion
In this prospective study prenatal exposure to ΣHMWPm was associated with lower weight Z-
score difference in the first 6 months of life and lower BMI Z-scores in boys at 4-7 years of ages.
In girls, we found some evidence that ΣHMWPm may be associated with higher BMI Z-scores,
however associations did not reach the level of statistical significance at any age. ΣHMWPm was
not associated with waist-to-height ratio. ΣLMWPm was not significantly associated with any of
the growth outcomes in either sex. Both ΣHMWPm and ΣLMWPm were associated with lower
systolic BP Z-scores at 4-7 years of age in girls but not in boys, while no significant association
was shown with diastolic BP Z-scores.
One prospective study in a Danish population (n=61) has recently reported higher cord-blood
levels of MEOHP to be associated with reduced BMIs between birth and 11 months of age in
boys, while in girls the reverse was found (de Cock et al. 2014). Results from our study for
DEHP metabolites and growth outcomes are in agreement with this small Danish study, but our
findings are inconsistent with those from some previous cross-sectional studies. Associations
between sums of HMWP or MEHP separately and BMI in children and/or adolescents were
positive in a Chinese population (Wang et al. 2013), negative in adolescent US girls and negative
but not significant in boys (Hatch et al. 2008) and null in both sexes in three other US
populations (Buser et al. 2014; Trasande et al. 2013a; Wolff et al. 2010). Further, a cross-
sectional study in Danish school-aged children reported DEHP urine metabolites to be negatively
associated with recent weight and height gain and serum levels of free and total triodothyronine
17
(T3) and insulin-like growth factor I and the associations with hormone levels were shown to be
modified by sex (Boas et al. 2010). The cross-sectional evidence for the associations between
MEP or sums of LMWP and BMI in children and/or adolescents is similarly inconsistent with
positive (Buser et al. 2014; Trasande et al.2013b; Wang et al. 2013), not significant positive in
girls and negative in boys (Hatch et al. 2008), negative (Boas et al. 2010) or null (Wolff et al.
2010) associations reported previously. One of these studies reported positive associations in
non-Hispanic Black children but null associations in Hispanic and non-Hispanic White children,
and no effect modification by child sex (Trasande et al. 2013a) while one other reported
significant associations to be only seen in boys but not in girls (Buser et al. 2014). Our findings
cannot be directly compared to those of cross-sectional studies as the effects of prenatal
compared to postnatal phthalate exposure on child growth could differ and exposure assessment
in all previous studies was based on one single-spot urine sample increasing the likelihood of
exposure misclassification. Further, the existing evidence seems to suggest that effects, if any,
may vary according to child age and race. Reverse causation is also more likely in cross-
sectional studies as variations in behaviours linked to phthalate exposure such as the
consumption of packaged foods and beverages between obese and lean subjects could explain
the associations shown.
Although further research is needed to clarify the underlying mechanisms, experimental evidence
suggests that developmental exposure to phthalates may impair growth in a sex-specific manner.
Developmental effects of phthalate exposure on adipogenesis may be mediated though the
disruption of the steroid and/or thyroid hormone molecular pathways and the inappropriate
activation of the PPARγ (Boberg et al. 2008; Feige et al. 2010; Gray et al. 2000; Hao et al. 2012;
Ishihara et al. 2003; Lin et al. 2011; Shen et al. 2009). Exposures to benzylbutyl (BBzP), DEHP
18
and their metabolites have been shown to exhibit anti-androgenic effects in male rodents (Boberg
et al. 2008; Gray et al. 2000). Phthalates are further suggested to be thyroid receptor antagonists
(Shen et al. 2009) and to interfere with the binding of T3 to transport proteins (Ishihara et al.
2003). Perinatal MEHP exposure at relatively low levels induced adipogenesis and lipid storage
in male mice offspring via inducing the expression and activation of PPARγ receptors in the
adipose tissue while no effects were shown in females (Hao et al. 2012). Some protective effects
on weight gain linked to DEHP exposure have been also observed in mice in other studies (Feige
et al. 2010; Lin et al. 2011). We found that prenatal HMWP exposure is associated with lower
early weight gain in infancy and lower BMI Z-scores later in childhood up to 7 years of age in
boys and some suggestion that HMWP exposure may be associated with higher BMI Z-scores in
girls. Continuous follow-up will elucidate whether these associations persist at later ages.
Our findings suggest that prenatal exposure mainly to DEHP metabolites and MEP is associated
with lower systolic BP Z-scores in girls independently of child BMI, however the recent analysis
of the 2003-2008 NHANES survey suggested a +0.04 SD units increase in systolic BP Z-score
for each 3-fold (roughly) increase in DEHP metabolites in children aged 6-19 years (Trasande et
al. 2013b). In this other study associations appeared to be stronger in boys, younger children and
children who were not overweight, while no association was shown with diastolic BP or between
LMWP and either systolic or diastolic BP. Inverse associations between MEP and systolic and
diastolic BP have been further shown in elderly adults from the Prospective Investigation of the
Vasculature in Uppsala Seniors study (Olsen et al. 2012). Exposures to HMWP and LMWP have
been associated with increased levels of oxidative stress markers (eg 8-hydroxydeoxyguanosine
and 8-isoprostane) in urine of pregnant women (Ferguson et al. 2014) and increased oxidative
stress during pregnancy is thought to alter the fetal programming of cardiovascular function and
19
to increase the CVD risk in later life (Giussani et al. 2012). Thus, continuous follow-up is
required to explore whether the negative associations shown in our study between prenatal
phthalate exposure and systolic BP in girls at 4-7 years of life persist or inverse at later ages.
Individual HMWP or LMWP metabolites are moderately to highly correlated to each other
(Valvi et al. 2015), thus disentangling the effects of individual metabolites in human populations
is difficult. We found some evidence that ΣHMWPm associations may be mainly driven by
ΣDEHPm and that ΣLMWPm associations may be mainly driven by MEP. However, the effect
estimates of the other metabolites included in the sums were in the same direction. Associations
of the different individual DEHP metabolites were very similar (data not shown). Although the
magnitude of health effects can differ for the different parent and metabolite phthalates, it could
also be that the higher concentrations and the wider range of concentrations of DEHP
metabolites and MEP compared to the other metabolites has increased the ability for detecting
statistically significant associations only for these compounds.
The Z-score increases for the growth and BP outcomes we estimated were of similar magnitude
to those related to maternal smoking during pregnancy, a well-established determinant of
childhood cardiometabolic risk (Behl et al. 2013) (the β; 95%CI for children whose mothers had
smoked throughout pregnancy compared to children of non-smokers in our final adjusted models
was: 0.27; -0.01, 0.55for weight gain Z-score; 0.30; 0.01, 0.50 for BMI Z-scores and 0.31; -0.01,
0.64 for systolic BP Z-scores). This suggests that the associations shown in this study could be of
important clinical relevance and therefore worthy to be further explored in other settings. The
urinary phthalate metabolites in this population are on average comparable to those measured in
pregnant women in other Spanish regions (Casas et al. 2011) and lower compared to those
20
measured in other European pregnancy cohorts with samples collected in 2000-2006, for all
metabolites except from MEP for which lower levels are reported in a French study (Casas et al.
2013b). The prospective design is a great advantage of our study over the existing literature as it
rules out reverse causation and further, it has permitted to evaluate the associations of prenatal
phthalate exposure and repeated growth and BP outcomes at different ages. Although we
assessed phthalate exposure using the average of concentrations measured in two spot-urine
samples, misclassification is still likely due to the high within-subject variability of phthalate
metabolites shown in this and other populations (Valvi et al. 2015). However, a non-differential
error in terms of the outcomes is more likely to have biased effect estimates toward the null
(Armstrong 1998). Future studies should aim to optimize exposure assessment by using more
than two spot-urine samples. Further, we do not have measurements of phthalate exposure in the
children which would have permitted us to evaluate potential confounding by postnatal
exposures and associations at different windows of susceptibility. Limitations in our study
related to the outcome assessment are the lack of more direct measurements of fat mass (eg dual-
energy X-ray absorptiometry) than BMI and waist circumference and the lack of repeated
measurements of BP at each child age. We evaluated a wide list of potential confounders and
few covariates provided in the initial DAGs were shown to change the effect estimates by more
than 10%. Further, we found no evidence of substantial inflation in effect estimates when we
compared the crude (data not shown) to the final multivariate-adjusted estimates. However, we
cannot rule out the possibility that associations may be partially explained by residual
confounding. Further, children not included in analysis were shown to be of mothers with lower
education and social class and who were more likely to have smoked during pregnancy. Given
that these characteristics are shown to increase phthalate exposure in this population (Valvi et al.
21
2015) and that associations with weight homeostasis have been suggested to be non-monotonic
with different effects shown at high and lower levels of exposure (Hao et al. 2012), our findings
may not apply to more disadvantaged groups of the population.
Our study provides evidence that prenatal exposure to phthalates may influence postnatal growth
and blood pressure differently in boys and girls up to 7 years of age. The inconsistencies between
our findings and those previously shown in some cross-sectional studies highlight the necessity
for evaluating these associations in prospective studies.
References
Adibi JJ, Whyatt RM, Williams PL, Calafat AM, Camann D, Herrick R, et al. 2008.
Characterization of phthalate exposure among pregnant women assessed by repeat air and
urine samples. Environ Health Perspect 116:467-473.
Armstrong BG. 1998. Effect of measurement error on epidemiological studies of environmental
and occupational exposures. Occup Environ Med 55:651-656.
Barouki R, Gluckman PD, Grandjean P, Hanson M, Heindel JJ. 2012. Developmental origins of
non-communicable disease: Implications for research and public health. Environ Health
11:42.
Behl M, Rao D, Aagaard K, Davidson TL, Levin ED, Slotkin TA, et al. 2013. Evaluation of the
association between maternal smoking, childhood obesity, and metabolic disorders: a
national toxicology program workshop review. Environ Health Perspect 121(2):170-180.
Boas M, Frederiksen H, Feldt-Rasmussen U, Skakkebaek NE, Hegedus L, Hilsted L, et al. 2010.
Childhood exposure to phthalates: associations with thyroid function, insulin-like growth
factor I, and growth. Environ Health Perspect 118:1458-1464.
Boberg J, Metzdorff S, Wortziger R, Axelstad M, Brokken L, Vinggaard AM, et al. 2008. Impact
of diisobutyl phthalate and other PPAR agonists on steroidogenesis and plasma insulin and
leptin levels in fetal rats. Toxicology 250:75-81.
22
Braun JM, Smith KW, Williams PL, Calafat AM, Berry K, Ehrlich S, et al. 2012. Variability of
urinary phthalate metabolite and bisphenol A concentrations before and during pregnancy.
Environ Health Perspect 120:739-745.
Browning LM, Hsieh SD, Ashwell M. 2010. A systematic review of waist-to-height ratio as a
screening tool for the prediction of cardiovascular disease and diabetes: 0.5 could be a
suitable global boundary value. Nutr Res Rev 23:247-269.
Buser MC, Murray HE, Scinicariello F. 2014. Age and sex differences in childhood and
adulthood obesity association with phthalates: Analyses of NHANES 2007-2010. Int J Hyg
Environ Health 217(6):687-694.
Cantonwine DE, Cordero JF, Rivera-Gonzalez LO, Anzalota Del Toro LV, Ferguson KK,
Mukherjee B, et al. 2014. Urinary phthalate metabolite concentrations among pregnant
women in Northern Puerto Rico: distribution, temporal variability, and predictors. Environ
Int 62:1-11.
Casas L, Fernandez MF, Llop S, Guxens M, Ballester F, Olea N, et al. 2011. Urinary
concentrations of phthalates and phenols in a population of Spanish pregnant women and
children. Environ Int 37:858-866.
Casas M, Chatzi L, Carsin AE, Amiano P, Guxens M, Kogevinas M, et al. 2013a. Maternal pre-
pregnancy overweight and obesity, and child neuropsychological development: two
Southern European birth cohort studies. Int J Epidemiol 42(2):506-517.
Casas M, Chevrier C, Hond ED, Fernandez MF, Pierik F, Philippat C, et al. 2013b. Exposure to
brominated flame retardants, perfluorinated compounds, phthalates and phenols in European
birth cohorts: ENRIECO evaluation, first human biomonitoring results, and
recommendations. Int J Hyg Environ Health 216:230-242.
de Cock M, de Boer M, Lamoree M, Legler J, van de Bor M. 2014. First year growth in relation
to prenatal exposure to endocrine disruptors – A Dutch prospective cohort study. Int J
Environ Res Public Health 11:7001-7021.
de Onis M, Onyango AW, Borghi E, Siyam A, Nishida C, Siekmann J. 2007. Development of a
WHO growth reference for school-aged children and adolescents. Bull World Health Organ
85:660-667.
23
de Onis M, Garza C, Onyango AW, Rolland-Cachera MF. 2009. WHO growth standards for
infants and young children. Arch Pediatr 16:47-53.
Druet C, Stettler N, Sharp S, Simmons RK, Cooper C, Smith GD, et al. 2012. Prediction of
childhood obesity by infancy weight gain: an individual-level meta-analysis. Paediatr
Perinat Epidemiol 26:19-26.
Euser AM, de Wit CC, Finken MJ, Rijken M, Wit JM. 2008. Growth of preterm born children.
Horm Res 70:319-328.
Evans D, Chaix B, Lobbedez T, Verger C, Flahault A. 2012. Combining directed acyclic graphs
and the change-in-estimate procedure as a novel approach to adjustment-variable selection
in epidemiology. BMC Med Res Methodol 12:156.
Feige JN, Gerber A, Casals-Casas C, Yang Q, Winkler C, Bedu E, et al. 2010. The pollutant
diethylhexyl phthalate regulates hepatic energy metabolism via species-specific PPARalpha-
dependent mechanisms. Environ Health Perspect 118:234-241.
Ferguson KK, Cantonwine DE, Rivera-González LO, Loch-Caruso R, Mukherjee B, Anzalota
Del Toro LV, et al. 2014. Urinary phthalate metabolite associations with biomarkers of
inflammation and oxidative stress across pregnancy in Puerto Rico. Environ Sci Technol
48(12):7018-7025.
Giussani DA, Camm EJ, Niu Y, Richter HG, Blanco CE, Gottschalk R et al. 2012.
Developmental programming of cardiovascular dysfunction by prenatal hypoxia and
oxidative stress. PLoS One7(2):e31017. doi: 10.1371/journal.pone.0031017.
Gray LE Jr, Ostby J, Furr J, Price M, Veeramachaneni DN, Parks L. 2000. Perinatal exposure to
the phthalates DEHP, BBP, and DINP but not DEP, DMP, or DOTP, alters differentiation of
the male rat. Toxicol Sci 58(2):350-365.
Graves L, Garnett SP, Cowell CT, Baur LA, Ness A, Sattar N, et al. 2014. Waist-to-height ratio
and cardiometabolic risk factors in adolescence: findings from a prospective birth cohort.
Pediatr Obes 9(5):327-338.
Guxens M, Ballester F, Espada M, Fernandez MF, Grimalt JO, Ibarluzea J, et al. 2012. Cohort
Profile: The INMA--INfancia y Medio Ambiente--(Environment and Childhood) Project. Int
J Epidemiol 41(4):930-940.
24
Guxens M, Mendez MA, Molto-Puigmarti C, Julvez J, Garcia-Esteban R, Forns J, et al. 2011.
Breastfeeding, long-chain polyunsaturated fatty acids in colostrum, and infant mental
development. Pediatrics 128:e880-e889.
Hao C, Cheng X, Xia H, Ma X. 2012. The endocrine disruptor mono-(2-ethylhexyl) phthalate
promotes adipocyte differentiation and induces obesity in mice. Biosci Rep 32:619-629.
Hatch EE, Nelson JW, Qureshi MM, Weinberg J, Moore LL, Singer M, et al. 2008. Association
of urinary phthalate metabolite concentrations with body mass index and waist
circumference: a cross-sectional study of NHANES data, 1999-2002. Environ Health 7:27.
Ishihara A, Nishiyama N, Sugiyama S, Yamauchi K. 2003. The effect of endocrine disrupting
chemicals on thyroid hormone binding to Japanese quail transthyretin and thyroid hormone
receptor. Gen Comp Endocrinol 134:36-43.
Jensen MS, Norgaard-Pedersen B, Toft G, Hougaard DM, Bonde JP, Cohen A, et al. 2012.
Phthalates and perfluorooctanesulfonic acid in human amniotic fluid: temporal trends and
timing of amniocentesis in pregnancy. Environ Health Perspect 120:897-903.
Jepsen KF, Abildtrup A, Larsen ST. 2004. Monophthalates promote IL-6 and IL-8 production in
the human epithelial cell line A549. Toxicol In Vitro 18:265-269.
Koch HM, Lorber M, Christensen KL, Palmke C, Koslitz S, Bruning T. 2013. Identifying
sources of phthalate exposure with human biomonitoring: results of a 48h fasting study with
urine collection and personal activity patterns. Int J Hyg Environ Health 216:672-681.
Lin Y, Wei J, Li Y, Chen J, Zhou z, Song L, et al. 2011. Developmental exposure to di(2-
ethylhexyl) phthalate impairs endocrine pancreas and leads to long-term adverse effects on
glucose homeostasis in the rat. Am J Physiol Endocrinol Metab 301:E527-E538.
Monteiro PO, Victora CG. 2005. Rapid growth in infancy and childhood and obesity in later life-
-a systematic review. Obes Rev 6:143-154.
Norman A, Bellocco R, Bergstrom A, Wolk A. 2001. Validity and reproducibility of self-
reported total physical activity--differences by relative weight. Int J Obes Relat Metab
Disord 25:682-688.
Olsen L, Lind L, Lind PM. 2012. Associations between circulating levels of bisphenol A and
phthalate metabolites and coronary risk in the elderly. Ecotoxicol Environ Safe 80:179-183.
Royston P, Ambler G. 1998 Generalized additive models. Stata Technical Bulletin 42: 38-43.
25
Shen O, Du G, Sun H, Wu W, Jiang Y, Song L, et al. 2009. Comparison of in vitro hormone
activities of selected phthalates using reporter gene assays. Toxicol Lett 191:9-14.
Taxvig C, Dreisig K, Boberg J, Nellemann C, Schelde AB, Pedersen D, et al. 2012. Differential
effects of environmental chemicals and food contaminants on adipogenesis, biomarker
release and PPARgamma activation. Mol Cell Endocrinol 361:106-115.
Textor J, Hardt J, Knuppel S. 2011. DAGitty: a graphical tool for analyzing causal diagrams.
Epidemiology 22:745.
Trasande L, Attina TM, Sathyanarayana S, Spanier AJ, Blustein J. 2013a. Race/ethnicity-specific
associations of urinary phthalates with childhood body mass in a nationally representative
sample. Environ Health Perspect 121:501-506.
Trasande L, Sathyanarayana S, Spanier AJ, Trachtman H, Attina TM, Urbina EM. 2013b.
Urinary phthalates are associated with higher blood pressure in childhood. J Pediatr
163:747-753.
Trasande L, Sathyanarayana S, Trachtman H. 2014. Dietary phthalates and low-grade
albuminuria in US children and adolescents. Clin J Am Soc Nephrol 9:100-109.
Valvi D, Casas M, Mendez MA, Ballesteros-Gomez A, Luque N, Rubio S, et al. 2013. Prenatal
bisphenol a urine concentrations and early rapid growth and overweight risk in the offspring.
Epidemiology 24:791-799.
Valvi D, Monfort N, Ventura R, Casas M, Casas L, Sunyer J, et al. 2015. Variability and
Predictors of Urinary Phthalate Metabolites in Spanish Pregnant Women. Int J Hyg Environ
Health 218(2):220-231.
Wang H, Zhou Y, Tang C, He Y, Wu J, Chen Y, et al. 2013. Urinary phthalate metabolites are
associated with body mass index and waist circumference in Chinese school children. PLoS
One 8:e56800.
Willett W, Stampfer MJ. 1986. Total energy intake: implications for epidemiologic analyses. Am
J Epidemiol 124:17-27.
Wittassek M, Koch HM, Angerer J, Bruning T. 2011. Assessing exposure to phthalates - the
human biomonitoring approach. Mol Nutr Food Res 55:7-31.
26
Wolff MS, Teitelbaum SL, Pinney SM, Windham G, Liao L, Biro F, et al. 2010. Investigation of
relationships between urinary biomarkers of phytoestrogens, phthalates, and phenols and
pubertal stages in girls. Environ Health Perspect 118:1039-1046.
World Medical Association. 2013. Declaration of Helsinki: Ethical Principles for medical
research involving human subjects. Available at:
www.wma.net/en/30publications/10policies/b3/index.html.pdf [accessed April 20, 2014].
Yan X, Calafat A, Lashley S, Smulian J, Ananth C, Barr D, et al. 2009. Phthalates Biomarker
Identification and Exposure Estimates in a Population of Pregnant Women. Hum Ecol Risk
Assess 15:565-578.
27
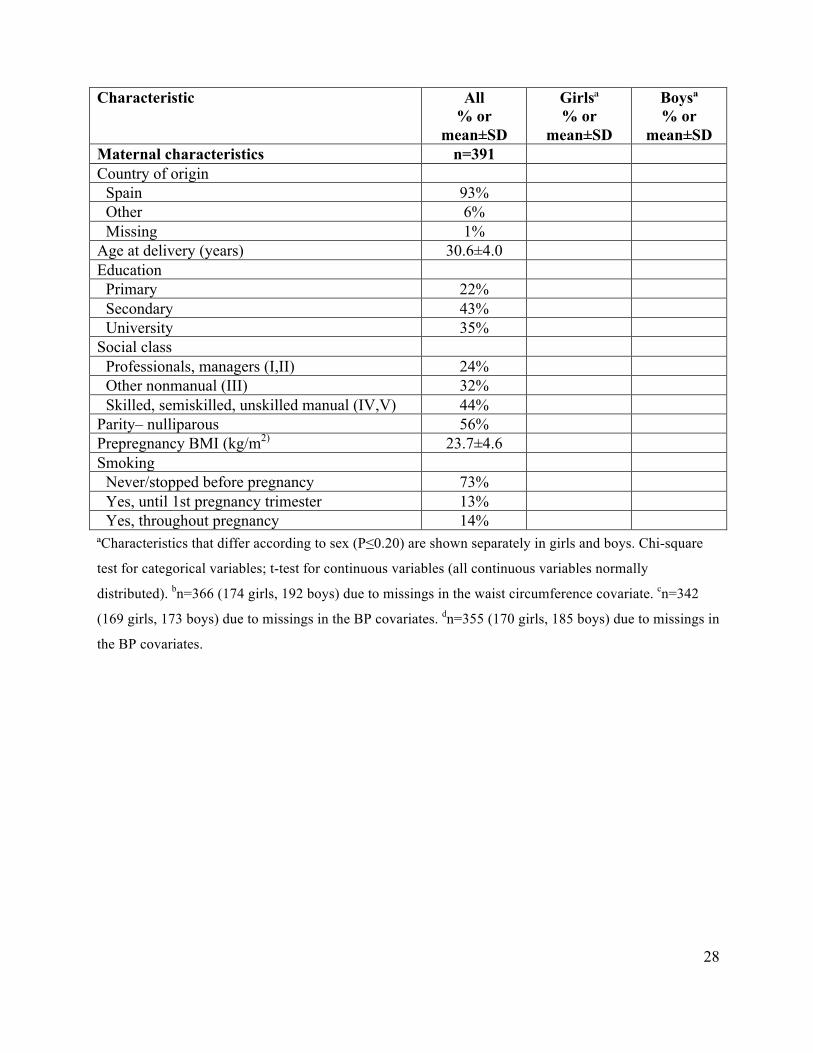
Table 1. Main characteristics of mother-child pairs in the analysis population.
Characteristic All % or
mean±SD
Girlsª % or
mean±SD
Boysª % or
mean±SD Child characteristics From birth to 6 months of age n=391 n=186 n=205 Gestational age (weeks) 39.7±1.4 Birth weight (g) 3264±394 3202±403 3322±378 Birth weight Z-score (SD) -0.1±0.8 Birth length (cm) 49.4±1.8 49.0±1.8 49.8±1.9 Weight at 6 months (g) 7654±860 7337±776 7937±833 Weight Z-score at 6 months (SD) -0.06±0.9 Weight gain Z-score 0-6 months (SD) 0.05±0.1 Rapid growth 0-6 months–yes 25% 23% 27% Exclusive breastfeeding ≥16 weeks 49% At 1 year of age n=377 n=178 n=199 Exact age (months) 14.5±0.7 Weight (kg) 10.3±1.2 9.9±1.1 10.6±1.1 Length (cm) 77.5±2.8 76.8±2.8 78.2±2.7 BMI Z-score (SD) 0.5±0.9 0.5±0.8 0.6±0.9 BMI Z-score ≥85th percentile 27% 23% 30% At 4 years of age n=370 n=176 n=194 Exact age (months) 53.3±2.1 Weight (kg) 18.1±2.8 17.8±2.8 18.4±2.8 Height (cm) 106±4.5 105±4.7 106±4.2 BMI Z-score (SD) 0.51±1.0 0.37±0.9 0.63±1.1 BMI Z-score ≥85th percentile 22% 19% 25% Waist circumference (cm)b 52±5.1 Waist-to-height ratiob 0.49±0.04 Waist-to-height ratio >0.50b 33% 35% 31% Systolic BP (mmHg)c 101±12 100±12 102±12 Diastolic BP (mmHg)c 65±12 64±10 66±13 At 7 years of age n=360 n=171 n=189 Exact age (months) 82±4.9 Weight (kg) 25.1±5.2 24.6±5.3 25.4±5.1 Height (cm) 121±5.8 121±5.9 122±5.6 BMI Z-score (SD) 0.68±1.2 0.57±1.1 0.78±1.3 BMI Z-score ≥85th percentile (%) 29% 26% 32% Waist circumference (cm) 57.6±6.8 Waist-to-height ratio 0.47±0.05 Waist-to-height ratio >0.50 21% 22% 21% Systolic BP (mmHg)d 105±10 104±11 106±10 Diastolic BP (mmHg)d 63±10 63±11 62±8
28
Characteristic All % or
mean±SD
Girlsª % or
mean±SD
Boysª % or
mean±SD Maternal characteristics n=391 Country of origin
Spain 93% Other 6% Missing 1%
Age at delivery (years) 30.6±4.0 Education
Primary 22% Secondary 43% University 35%
Social class Professionals, managers (I,II) 24% Other nonmanual (III) 32% Skilled, semiskilled, unskilled manual (IV,V) 44%
Parity– nulliparous 56% Prepregnancy BMI (kg/m2) 23.7±4.6 Smoking
Never/stopped before pregnancy 73% Yes, until 1st pregnancy trimester 13% Yes, throughout pregnancy 14%
ªCharacteristics that differ according to sex (P≤0.20) are shown separately in girls and boys. Chi-square
test for categorical variables; t-test for continuous variables (all continuous variables normally
distributed). bn=366 (174 girls, 192 boys) due to missings in the waist circumference covariate. cn=342
(169 girls, 173 boys) due to missings in the BP covariates. dn=355 (170 girls, 185 boys) due to missings in
the BP covariates.

29
Table 2. Average 1st-3rd pregnancy trimester concentrations of phthalate metabolites (µg-g
creatinine) in the INMA-Sabadell birth cohort (n=391).a
Parent Phthalate
Metabolite GM±GSDb Min Percentiles Max
25th 50th 75th DEHP MEHP 11.4±2.0 1.8 7.3 11.0 17.2 267 DEHP MEHHP 29.1±2.0 5.3 17.9 28.0 41.5 503 DEHP MEOHP 21.7±1.9 4.1 14.3 20.8 30.3 378 DEHP MECPP 41.6±1.9 14.4 31.0 42.5 61.2 1086
ΣDEHPm 99.6±1.8 24.8 64.9 95.1 139 1554 BBzP MBzP 12.6±2.2 1.5 7.1 11.9 20.1 405
ΣHMWm 118±1.8 33.4 79.7 112 159 1868 DEP MEP 389±2.6 34.0 199 405 804 9379 DiBP MiBP 33.0±1.9 5.1 21.6 31.4 48.2 334 DnBP MnBPc 32.7±2.1 5.8 19.9 30.7 47.3 836
ΣLMWm 482±2.3 62.3 258 472 851 9948 aPhthalate metabolite concentrations are shown after substituting the below LOD values by LOD/2.
Values below LOD for all phthalate metabolites were ≤1% in all the first and third pregnancy trimester
urine samples analysed (Valvi et al. 2015). bCreatinine concentrations geometric mean (GM)±geometric
standard deviation (GSD)=0.8±1.8 and 0.9±1.7 in first and third pregnancy trimester, respectively. cSmall
amounts may also be due to metabolism of BBzP.
30
Table 3. Average 1st-3rd pregnancy trimester concentrations of ΣHMWPm metabolites (log2-
transformed, in µg-g creatinine) and growth and BP outcomes.
Outcome/Age at examination All βa (95% CI)
Girls βa (95% CI)
Boys βa (95% CI)
P-sex interaction
Weight gain Z-score 0-6 months n=391 n=186 n=205 -0.15 (-0.41,0.11) 0.24 (-0.16,0.65) -0.41 (-0.75,-0.06) 0.01 BMI Z-scoresb n=391/1107 n=186/525 n=205/582 All ages -0.06 (-0.29,0.17) 0.30 (-0.04,0.64) -0.28 (-0.60,0.03) 0.05 1 year 0.04 (-0.24,0.31) 0.26 (-0.13,0.65) -0.11 (-0.47,0.26) 4 years -0.11 (-0.39,0.16) 0.24 (-0.15,0.64) -0.38 (-0.76,-0.01)
7 years -0.16 (-0.43,0.12) 0.16 (-0.24,0.56) -0.40 (-0.78,-0.02) Waist-to-height ratiob n=382/726 n=182/345 n=200/381 All ages -0.01 (-0.01,0.01) 0.00 (-0.01,0.02) -0.01 (-0.02,0.00) 0.39 4 years -0.01 (-0.02,0.00) 0.00 (-0.02,0.02) -0.01 (-0.02,0.00) 7 years -0.00 (-0.01,0.01) 0.01 (-0.01,0.03) -0.01 (-0.02,0.01)
Systolic BP Z-scoresb,c n=379/697 n=181/339 n=198/358 All ages T2 -0.23 (-0.41,-0.06) -0.39 (-0.65,-0.12) -0.14 (-0.37,0.09) 0.11 T3 -0.14 (-0.34,0.03) -0.28 (-0.55,-0.01) -0.03 (-0.26,0.20) 0.10 4 years T2 -0.16 (-0.39,0.07) -0.30 (-0.60,-0.01) -0.01 (-0.34,0.32) T3 -0.17 (-0.41,0.06) -0.32 (-0.62,-0.03) -0.06 (-0.39,0.26) 7 years T2 -0.30 (-0.53,-0.08) -0.45 (-0.74,-0.16) -0.25 (-0.56,0.06) T3 -0.14 (-0.37,0.09) -0.29 (-0.58,0.00) 0.01 (-0.30,0.33)
Diastolic BP Z-scoresb,c n=379/697 n=181/339 n=198/358 All ages T2 0.07 (-0.10,0.23) -0.02 (-0.26,0.23) 0.13 (-0.09,0.36) 0.25 T3 0.01 (-0.15,0.18) 0.02 (-0.23,0.27) 0.01 (-0.21,0.23) 0.89 4 years T2 0.16 (-0.08,0.39) -0.03 (-0.37,0.30) 0.34 (0.01,0.66) T3 0.05 (-0.18,0.28) 0.01 (-0.33,0.35) 0.10 (-0.22,0.42) 7 years T2 -0.03 (-0.26,0.20) -0.02 (-0.36,0.31) -0.04 (-0.35,0.27) T3 -0.05 (-0.28,0.17) -0.04 (-0.38,0.29) -0.05 (-0.36,0.26) aAll models adjusted for child sex, exact age at examination and maternal characteristics (country of
origin, age at delivery, parity, education, social class, prepregnancy BMI and smoking in pregnancy). bCoefficients estimated by GEE models. N represents numbers of individuals/outcome measures. cEffect
estimates shown per tertile of exposure (T2: tertile 2; T3: tertile 3) due to non-linear associations between
the exposure and the outcome. The β in the reference groups is 0.
31
Table 4. Average 1st-3rd pregnancy trimester concentrations of ΣLMWPm metabolites (log2 transformed, in
µg-g creatinine) and growth and BP outcomes.
Outcome/Age at examination All Girls Boys P-sex interaction
βa (95% CI) βa (95% CI) βa (95% CI) Weight gain Z-score 0-6 months n=391 n=186 n=205 0.03 (-0.16,0.23) -0.06 (-0.34,0.22) 0.14 (-0.14,0.42) 0.38 BMI Z-scoresb n=391/1107 n=186/525 n=205/582 All ages 0.08 (-0.13,0.86) 0.03 (-0.20,0.26) 0.12 (-0.12,0.37) 0.30 1 year 0.05 (-0.14,0.25) 0.11 (-0.16,0.38) 0.01 (-0.27,0.29) 4 years 0.09 (-0.11,0.29) 0.04 (-0.24,0.31) 0.17 (-0.12,0.45) 7 years 0.12 (-0.08,0.32) 0.00 (-0.28,0.28) 0.21 (-0.08,0.50) Waist-to-height ratiob n=382/726 n=182/345 n=200/381 All ages 0.00 (-0.01,0.01) 0.00 (-0.01,0.01) 0.01 (-0.01,0.02) 0.41 4 years 0.00 (-0.01,0.01) 0.00 (-0.01,0.02) 0.00 (-0.01,0.01) 7 years 0.01 (-0.01,0.01) 0.00 (-0.01,0.02) 0.01 (-0.01,0.02) Systolic BP Z-scoresb,c n=379/697 n=181/339 n=198/358 All ages T2 -0.05 (-0.23,0.12) -0.23 (-0.50,0.04) 0.05 (-0.17,0.28) 0.17 T3 -0.13 (-0.31,0.05) -0.40 (-0.66,-0.12) 0.12 (-0.11,0.35) <0.01 4 years T2 -0.09 (-0.32,0.14) -0.24 (-0.57,0.09) 0.02 (-0.30,0.34) T3 -0.20 (-0.44,0.03) -0.38 (-0.72,-0.05) 0.01 (-0.32,0.34) 7 years T2 -0.02 (-0.25,0.21) -0.22 (-0.56,0.12) 0.08 (-0.23,0.39) T3 -0.06 (-0.30,0.16) -0.43 (-0.77,-0.09) 0.25 (-0.07,0.57) Diastolic BP Z-scoresb,c n=379/697 n=181/339 n=198/358 All ages T2 -0.12 (-0.28,0.04) -0.19 (-0.44,0.06) -0.08 (-0.30,0.14) 0.48 T3 -0.14 (-0.31,0.02) -0.17 (-0.44,0.06) -0.12 (-0.34,0.11) 0.72 4 years T2 -0.17 (-0.40,0.06) -0.27 (-0.60,0.07) -0.10 (-0.42,0.23) T3 -0.14 (-0.37,0.10) -0.06 (-0.40,0.27) -0.20 (-0.53,0.13) 7 years T2 -0.08 (-0.31,0.15) -0.12 (-0.46,0.21) -0.09 (-0.39,0.22) T3 -0.13 (-0.37,0.10) -0.29 (-0.63,0.05) -0.01 (-0.29,0.34) aAll models adjusted for child sex, exact age at examination and maternal characteristics (country of origin, age at
delivery, parity, education, social class, prepregnancy BMI and smoking in pregnancy). bCoefficients estimated by
GEE models. N represents numbers of individuals/outcome measures. cEffect estimates shown per tertile of exposure
(T2: tertile 2; T3: tertile 3) due to non-linear associations between the exposure and the outcome. The β in the reference
groups is 0.