Embed Size (px)
Citation preview
#Corresponding author email: [email protected] Tel: +233-554-707013Received 7/5/ 2020 ; Accepted 12/6/ 2020DOI: 10.21608/agro.2020.29550.1213©2020 National Information and Documentation Center (NIDOC)
SALINITY stress significantly impacts the growth, development and yield of sorghum. Knowledge about the productivity of sorghum under salinity stress condition is lagging, due
to the marginally limited information about the physio-biochemical and molecular mechanisms underpinning salinity stress tolerance. The study aimed to investigate the physio-biochemical and molecular mechanisms associated with the differential responses under salinity stress condition in sorghum. To achieve our objectives, the physiological and biochemical salinity stress parameters, including membrane stability index, enzyme antioxidant activities, proline and chlorophyll contents, measured at the seedling stage, were elucidated to identify the salinity stress response status of the genotypes. The quantitative real-time polymerase chain reaction (qPCR) was perform to elucidate the expression pattern of different categories of genes under salinity stress in sorghum genotypes. From our results, enhanced enzyme antioxidant activities, membrane status, increased proline content and lower K+/Na+ concentration under 300mM NaCl stress identified PI 585451 to be the most salinity stress-tolerant genotype. Nevertheless, increased MDA and Na+/K+ level, lower proline, chlorophyll content and antioxidant enzyme activities in PI 585454 marked it to be sensitive to salinity stress. Besides, the transcript expression analysis of different genes, showed an upregulation in PI 585451 than in PI 585454. The results highlighted the differences in metabolic response to salinity stress that may play an important role in the provision of information, required for breeding and development of sorghum genotypes that are tolerant to salinity stress.
Keyword: Enzyme antioxidants activities, Membrane status, Osmolytes accumulation, Phytohormones, Salinity stress, Transcript expression analyses.
Impact of Salinity Stress on Membrane Status, Phytohormones, Antioxidant Defense System and Transcript Expression Pattern of Two Contrasting Sorghum GenotypesJoseph Noble Amoah#, Daniel Antwi-BerkoDepartment of Basic and Applied Biology, University of Energy and Natural Resources (UENR), P. O. Box 214, Sunyani, Bono Region, Ghana.
Egypt. J. Agron. Vol. 42, No. 2, pp. 123-136 (2020)
Egyptian Journal of Agronomy http://agro.journals.ekb.eg/
9
Introduction
Sorghum is the fifth most produced grain, having a worldwide production of > 64 million tones and providing 20% of protein and calories requirement globally (Mugalavai & Onkware, 2019; Mundia et al., 2019). Even though the sorghum genotype PI 585451 has been reported to be physiologically (leaf relative water content, membrane status, photosynthetic activity, osmolytes accumulation and enzyme antioxidant activities) superior to PI 585454 under normal and drought conditions (Amoah & Antwi-Berko, 2020), the response of these genotypes under salinity stress condition remains unelucidated.
Under salinity stress conditions, various metabolic process; such as cellular membrane status, water potential and essential nutrient uptake are greatly impaired and the expected crop output is reduced (Arzani & Ashraf, 2016; Choudhury et al., 2013). Over the years, plant breeders are faced with the challenge of how to decipher the mechanisms associated with plant’s signaling, perception, transduction, as well as the difficulty in identifying the metabolic pathways triggered in response to salt stress. Nevertheless, recent reports have provided evidence for stress-induced metabolic changes under abiotic stress (Kumar & Singh, 2016). This has necessitated interests into the physio-biochemical and
124
Egypt. J. Agron. 42, No. 2 (2020)
JOSEPH NOBLE AMOAH, DANIEL ANTWI-BERKO
molecular aspect of salinity tolerance in crops, which has an overarching aim of providing useful information for the germplasm screening towards the breeding and development of novel crop cultivars which are able to thrive well under various abiotic stress conditions (Chen et al., 2016). Furthermore, the intricate genotype (G) × environment (E) interactions of salinity affected field, makes it difficult to utilize field screening approach, as an index for screening sorghum genetic materials for tolerance against salinity stress (Singh et al., 2017). The present study evaluated the response of sorghum genotypes to salinity stress, considering certain triggered physiological, biochemical and the expression pattern of different genes under controlled conditions, in a greenhouse. This enabled the effective assessment of the impact of salinity stress on sorghum genotypes investigated.
Salinity stress stimulates the production of reactive oxygen species (ROS), which exacerbate the degradation of chlorophyll, reduces plants water contents and peroxidation of membrane lipid. As a recognized marker of lipid peroxidation of unsaturated fatty acids in a plant cell, an increase in free-radicals has been linked to the production of MDA in excess amount (Ashraf et al., 2018). Plants respond to the effect of salinity stress by accumulating an array of metabolites, which are considered as crucial indices for evaluating the salinity tolerance ability of plants. Among them, free proline, chlorophyll contents, Na+/K+, enzyme antioxidants activity and phytohormones (ABA and IAA), are the most widely used trait indices in the biology of abiotic stress. The chlorophyll content act as the main plant photosynthate and helps plants to reduce photo-oxidative damages, arising from the inhibition of photosynthesis and excess light excitation energy. Thus, chlorophyll content shows a close relationship between photosynthesis, prevention of damages associated with photo-oxidation and plant’s productivity under abiotic stress conditions. Proline acts as a compatible osmolytes, signaling and defence molecule, enabling plants to maintain osmotic balance and the protection of cellular membrane against oxidative damage (Rahneshan et al., 2018). The phytohormones, abscisic acid (ABA) and indole acetic acid (IAA) helps in plants mediated responses, responsible for the modification of processes such as the growth, development and nutrient allocation,
contributing to plants adaptation to abiotic stress conditions. Furthermore, plants suffer oxidative stress due to the direction of excess energy towards the generation of ROS, which damages cell membranes (Huang et al., 2014). Plants have developed antioxidant defence mechanism with enzymes such as; superoxide dismutase (SOD), catalase (CAT) and peroxidase (POD), which co-ordinate in suppressing ROS toxicity and plants protection against oxidative damages (Huang et al., 2014; Nxele et al., 2017). Among the enzymes, SOD constitutes the immediate line of defence against ROS by dismutating the superoxide anion to H2O2, followed by the finely regulation by CAT and POD (Ahanger & Agarwal, 2017).
The objective of the study was to investigate the response of two sorghum genotypes to salinity stress condition at the physiological, biochemical and transcript expression levels. The study provided useful insight into the mechanism of salinity stress tolerance in sorghum, as well as information required for the development of novel salinity-resistant sorghum genotype.
Materials and Methods
Plant materials and growth conditions Healthy and matured seeds of PI 585451
and PI 585454 obtained from the National Plant Germplasm System (NPGS), United States Department of Agriculture (USDA, USA) were surface sterilized and germination was carried out by following the protocol described by (Singh et al., 2020). Four days after germination, five (5) seedlings of uniform size were then transplanted and grown in a plastic pot filled with soil (sunshine mix #1, Sun Gro Horticulture, Canada), under a controlled condition with an average temperature of 26oC, 60% relative humidity, 16/8hrs day/light photoperiod and 300µmolm-2s-1 in a greenhouse.
Experimental design and salinity stress treatment The experiment was laid out in randomized
complete block design (RCBD) and 20 plants of each genotype were maintained under controlled condition, in a greenhouse. Plants from genotype were grown under similar condition by watering them sufficiently, each alternate day until the initiation of salinity stress treatment i.e. when there was fully expanded 2nd - 3rd leaf seedling growth stage (Zadok’s scale 12) (Zadoks et al., 1974). Subsequently, the pots of each genotype were divided into two sets, namely, control plants
125IMPACT OF SALINITY STRESS ON MEMBRANE STATUS, PHYTOHORMONES...
Egypt. J. Agron. 42, No. 2 (2020)
and salinity stressed plants (treatment). Each set consisted of 10 pot per genotype. The control plants were watered every alternate day while plants in the treatment set were irrigated with ½ strength Hoagland solution containing varying concentration (50 to 300mM) of NaCl. Fresh shoot tissues were sampled at 10d after treatment (DAT) from both the control and treatment group, frozen in liquid N2 and stored at -80oC until used.
Physiological and biochemical parameters under salinity stress
The LRWC, MSI, EL, malondialdehyde (MDA), proline, chlorophyll (CHL), Na+ and K+, ABA and IAA, and enzyme antioxidant (SOD, CAT and POD) activities, were the physiological and biochemical parameters evaluated.
Estimation of leaf relative water content (LRWC), membrane stability index (MSI) and electrolyte leakage (EL)
To evaluate LRWC, freshly sampled leaf tissues were weighed (FW) and incubated (soaked) in distilled water for 24hrs. The leaves were removed after 24hrs, weighed to obtain the turgid weight (TW) and heated at 105°C for 30min, followed by drying. The leaf tissues were then placed in dried paper bags and incubated at 80°C for 3 days. Three independent samples were used to determine the dry weight (DW). The LRWC was calculated as;
LRWC= (FW −DW) / (TW − DW) × 100% (1)
Leaf MSI was determined according to the method reported by Jan et al. (2017). Briefly, 100mg of sampled leaf discs were thoroughly washed under running tap water, followed by washing with double distilled water. After the leaf discs were heated in 10ml of double-distilled water at 40oC for 30min, cooled to room temperature (RT) and the initial electrical conductivity (C1) was recorded. Again, the leaf discs were boiled at 100oC for 15min, cooled to RT and their final electrical conductivity (C2) was recorded. The electrical conductivities were recorded with an electrical conductivity meter (Hana Instruments, USA). The MSI and the EL were then calculated as;
Membrane stability index (MSI)= (C1/C2)× 100% (2)
Electrolyte leakage (EL)= [1- (C1/C2)] × 100% (3)
Measurement of the Malondialdehyde (MDA), proline and chlorophyll (CHL) contents
MDA content was measured according to the thiobarbituric acid (TBA) reaction previously reported by Saadati et al. (2019). Briefly, leaf samples were homogenized in 1ml of 0.1% trichloroacetic acid (TCA) and centrifuged at 12000 × g for 10min, followed by the addition of 1ml of 20% TCA containing 0.5% TBA was added into 0.5ml of the supernatant aliquot. The reaction mixture was boiled for 1hr at 95°C, quickly cooled on ice for 20min and centrifuged at 10000 × g for 5min. The supernatant absorbance was read at 600nm (non-specific abundance) and 532nm (specific abundance), using a spectrophotometer (UV-2550, Shimadzu, Japan). The MDA content then defined using an extinction coefficient of 155mM−1 cm, after deducting the non-specific absorbance at 600nm.
Proline content was determined using the ninhydrin method described by Bates et al. (1973). A 1g leaf samples were homogenized in 1ml of 3% sulfosalicylic acid (w/v) and centrifuged at 12000 × g for 10min. A 0.5m1 of supernatant was mixed with 1ml of ninhydrin acid and the mixture was heated at 100oC for 60min and cooled on ice for 20min. Subsequently, 1ml of toluene was added for the extraction of the organic phase, followed by measuring the absorbance spectrometically at 520nm, using a spectrophotometer (UV-2550, Shimadzu, Japan). The concentration of proline was quantified based on a standard curve standard and expressed as µmol proline g-1 FW.
The photosynthetic activity under salinity stress was elucidated by measuring the total chlorophyll content, according to the procedures previously reported by Kalaji et al. (2017). A 100mg leaf samples were homogenized in 0.1ml 80% acetone and centrifuged at 12000 × g for 5min and the concertation of the pigment were calculated from the absorbance of the extract at 663 and 645nm using the equation:
Total chlorophyll [(a+b) (µmol/g FW)= [20.2× (A645)- 8.02× (A663)]× 0.5 (4)
Determination of monovalent cations The concentrations of the monovalent cations,
sodium (Na+) and potassium (K+) in the leaves were determined by the method used by Guo et al. (2018), by using an atomic absorption spectrophotometer (2655-00, Cole-Parmer Instrument Co., Vernon
126
Egypt. J. Agron. 42, No. 2 (2020)
JOSEPH NOBLE AMOAH, DANIEL ANTWI-BERKO
Hills, USA). Briefly, leaf tissue was blot dried and their fresh (FW) and dry weight (DW) were recorded. Afterwards, Na+ and K+ were extracted from the leaves in 100 mM acetic acid for 2hrs at 90◦C, followed by the analysis of the cations.
Measurement of the abscisic acid (ABA) and indole-acetic acid (IAA) contents.
Plant hormone (ABA and IAA) contents were determined by following the procedures previously described by Hu et al. (2018). A 100mg leaf samples were homogenized in 1ml of 80% methanol. The extract was incubated for 4hrs at 4oC and centrifuge for 15min at 5000 × g. The fraction of the plant hormone was eluted with 1ml of 100% (w/v) methanol, followed by 1ml of ether, after passing the supernatant through C18 Sep-Pak cartridges (Waters Corp., Milford, MA, USA). Subsequently, the samples were dissolved in 1ml of PBS comprising 0.1% (v/v) Tween 20 and 0.1% (w/v) gelatin (pH 7.5) measure free ABA and IAA using ELISA kit, after drying the eluate in pure N2 at 20oC. Following the method of Weiler et al. (1981), the calculation of ELISA was performed.
Quantification of the enzyme antioxidants activity To evaluate the activities of SOD, CAT and POD
under salinity stress, a 100mg leaf samples were ground in liquid N2 and extracted in 1ml of ice-cold 1µmol sodium phosphate buffer (pH 7.0) containing 0.2 mM EDTA and 1% polyvinylpyrrolidone (PVP) in on ice-water bath. The homogenate was centrifuged at 12 000 × g for 20min at 4◦C. The supernatant was used to quantify SOD, CAT and POD activity.
The SOD activity was quantified by measuring its ability to inhibit the photochemical reduction of nitro blue tetrazolium (NBT), as previously reported by Venkatachalam et al. (2017), with minor modifications. The reaction solution (1ml) contained 50mM phosphate buffer (pH 7.8), 0.1mM EDTA, 13mM methionine, 65µM. NBT and 1.3µM riboflavin, and 30µL SOD extract. The solution without enzyme solution was used as the control. The test tubes were irradiated under fluorescent lights of 60µmol·m−2·s−1 intensity at 25◦C for 15min. The absorbance of each solution was measured at 560nm using a spectrophotometer (UV-2550, Shimadzu, Japan), and one unit of enzyme activity was defined as the amount of enzyme that would inhibit 50% of NBT photo-reduction.
The CAT activity was measured by recording
the decomposition of hydrogen peroxide (H2O2) according to the protocol of Guo et al. (2018). Briefly, the enzyme extract was added to the 1ml of the reaction mixture comprising 100mM potassium phosphate buffer (pH 7) and 75mM H2O2. The enzyme activity was measured by recording the decrease in absorbance at 240nm using a spectrophotometer (UV-2550, Shimadzu, Japan). The CAT activity was calculated using the extinction coefficient of 39.4mM−1cm−1. A unit of CAT activity was defined as the amount of enzyme required to decay 1µmol of H2O2/min/g protein under assay conditions.
The POD activity was quantified as previously described by Venkatachalam et al. (2017), with minor modifications. The enzyme extract was added to 1ml the reaction mixture, containing 100mM potassium phosphate buffer (pH 6.1), 12mM H2O2 and 96mM guaiacol. Guaiacol oxidation was estimated by the increase in absorbance at 470nm using a spectrophotometer (UV-2550, Shimadzu, Japan). The POD activity was calculated using the extinction coefficient of 25.5mM-1cm-1 and expressed in units g-l protein). A unit of POD activity was defined as the calculated consumption of 1µmol of H2O2 per min under assay conditions.
RNA isolation, cDNA synthesis and qPCR analysisThe Plant Total RNA kit (Invitrogen, USA)
was used for the extraction of total RNA from leaf samples, according to the manufacturer’s instructions. The nanophotometer (Implen Inc., Westlake) was used to ensure the quality and quantity of RNA while the ethidium-bromide stain analyses using agarose gel electrophoresis was used to check the purity of total RNA. The Power cDNA synthesis kit (Intron Biotechnology Inc., USA) was used to reverse transcribe DNA free total RNA into cDNA.
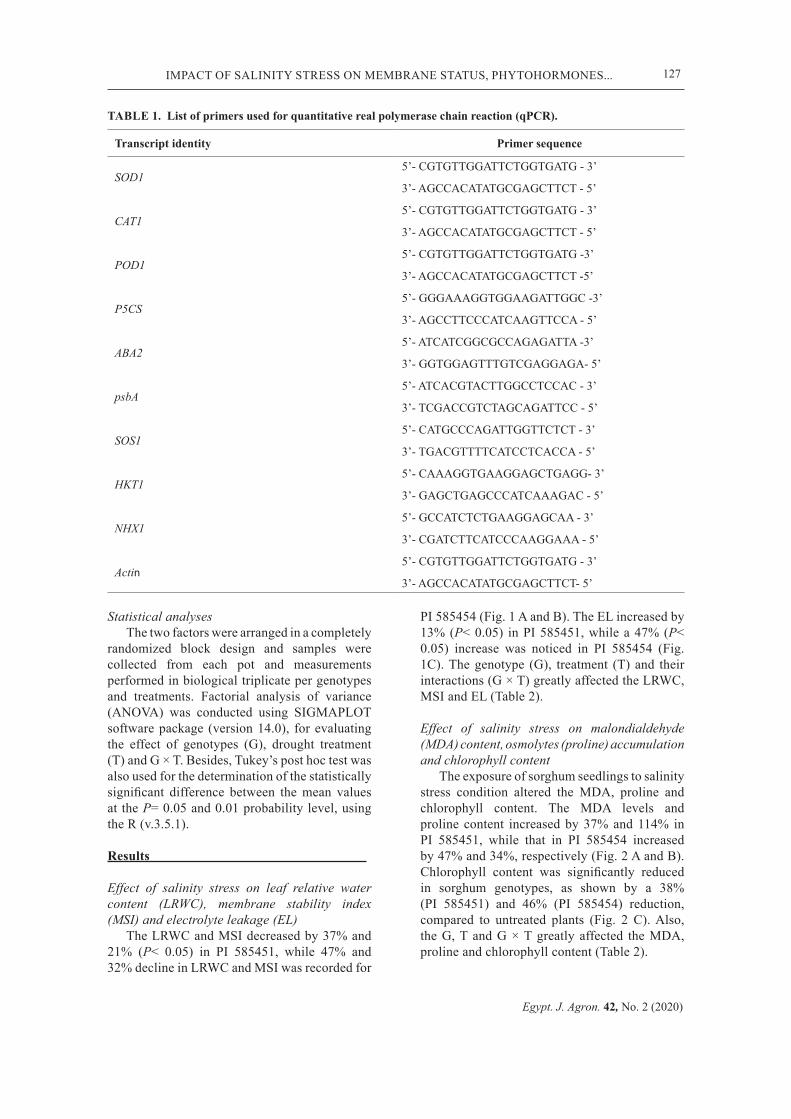
To evaluate the expression pattern of salinity stress candidate genes, antioxidant-related genes, osmolytes-biosynthesis-related, photosystem-related and ABA-related genes used in the study (Table 1), the CFX 96 Real-Time system (Bio-Rad, Richmond, CA, USA) with SYBR-green fluorescence was used and analyses of the results were done by using the ΔΔCT method. The conditions for the thermal cycle was 95°C for 5min and 40 cycles of 95°C for 15s, 55°C for 15s and 72°C for 30s. The experiment was triplicated, using the Actin as an internal control for standardizing the relative transcript levels.
127IMPACT OF SALINITY STRESS ON MEMBRANE STATUS, PHYTOHORMONES...
Egypt. J. Agron. 42, No. 2 (2020)
Statistical analyses The two factors were arranged in a completely
randomized block design and samples were collected from each pot and measurements performed in biological triplicate per genotypes and treatments. Factorial analysis of variance (ANOVA) was conducted using SIGMAPLOT software package (version 14.0), for evaluating the effect of genotypes (G), drought treatment (T) and G × T. Besides, Tukey’s post hoc test was also used for the determination of the statistically significant difference between the mean values at the P= 0.05 and 0.01 probability level, using the R (v.3.5.1).
Results
Effect of salinity stress on leaf relative water content (LRWC), membrane stability index (MSI) and electrolyte leakage (EL)
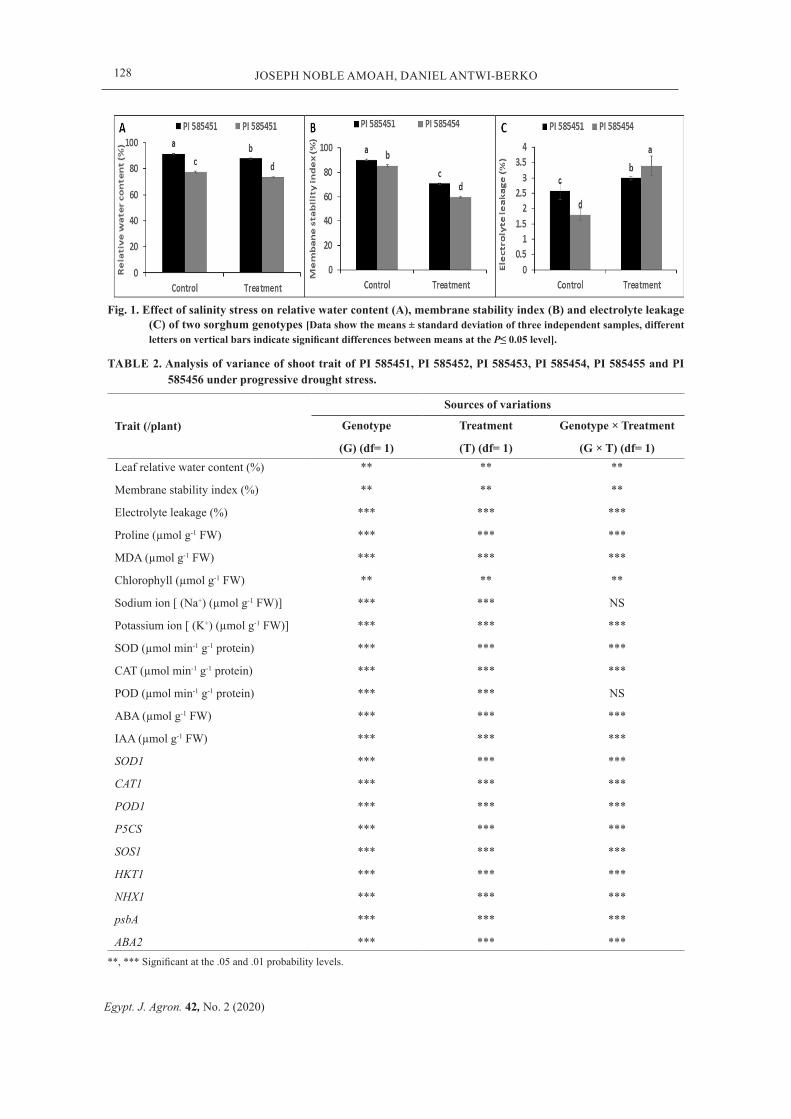
The LRWC and MSI decreased by 37% and 21% (P< 0.05) in PI 585451, while 47% and 32% decline in LRWC and MSI was recorded for
PI 585454 (Fig. 1 A and B). The EL increased by 13% (P< 0.05) in PI 585451, while a 47% (P< 0.05) increase was noticed in PI 585454 (Fig. 1C). The genotype (G), treatment (T) and their interactions (G × T) greatly affected the LRWC, MSI and EL (Table 2).
Effect of salinity stress on malondialdehyde (MDA) content, osmolytes (proline) accumulation and chlorophyll content
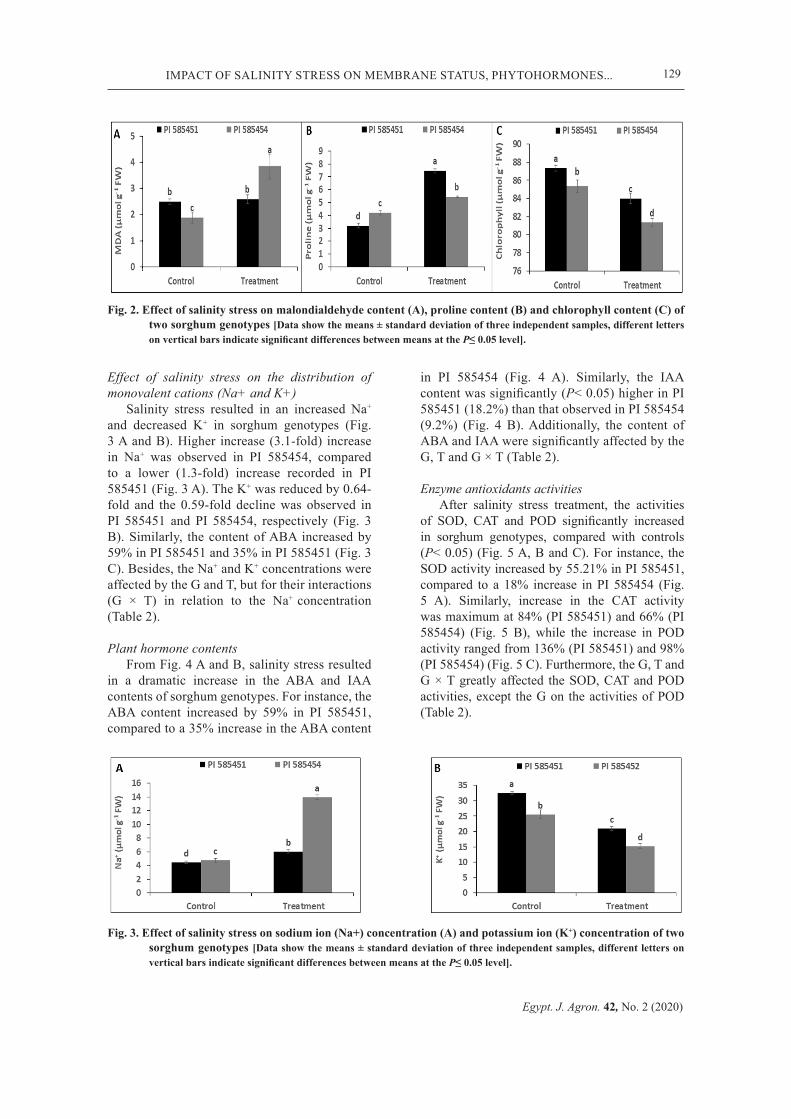
The exposure of sorghum seedlings to salinity stress condition altered the MDA, proline and chlorophyll content. The MDA levels and proline content increased by 37% and 114% in PI 585451, while that in PI 585454 increased by 47% and 34%, respectively (Fig. 2 A and B). Chlorophyll content was significantly reduced in sorghum genotypes, as shown by a 38% (PI 585451) and 46% (PI 585454) reduction, compared to untreated plants (Fig. 2 C). Also, the G, T and G × T greatly affected the MDA, proline and chlorophyll content (Table 2).
TABLE 1. List of primers used for quantitative real polymerase chain reaction (qPCR).
Transcript identity Primer sequence
SOD1
CAT1
POD1
P5CS
ABA2
psbA
SOS1
HKT1
NHX1
Actin
5’- CGTGTTGGATTCTGGTGATG - 3’
3’- AGCCACATATGCGAGCTTCT - 5’
5’- CGTGTTGGATTCTGGTGATG - 3’
3’- AGCCACATATGCGAGCTTCT - 5’
5’- CGTGTTGGATTCTGGTGATG -3’
3’- AGCCACATATGCGAGCTTCT -5’
5’- GGGAAAGGTGGAAGATTGGC -3’
3’- AGCCTTCCCATCAAGTTCCA - 5’
5’- ATCATCGGCGCCAGAGATTA -3’
3’- GGTGGAGTTTGTCGAGGAGA- 5’
5’- ATCACGTACTTGGCCTCCAC - 3’
3’- TCGACCGTCTAGCAGATTCC - 5’
5’- CATGCCCAGATTGGTTCTCT - 3’
3’- TGACGTTTTCATCCTCACCA - 5’
5’- CAAAGGTGAAGGAGCTGAGG- 3’
3’- GAGCTGAGCCCATCAAAGAC - 5’
5’- GCCATCTCTGAAGGAGCAA - 3’
3’- CGATCTTCATCCCAAGGAAA - 5’
5’- CGTGTTGGATTCTGGTGATG - 3’
3’- AGCCACATATGCGAGCTTCT- 5’
128
Egypt. J. Agron. 42, No. 2 (2020)
JOSEPH NOBLE AMOAH, DANIEL ANTWI-BERKO
TABLE 2. Analysis of variance of shoot trait of PI 585451, PI 585452, PI 585453, PI 585454, PI 585455 and PI 585456 under progressive drought stress.
Trait (/plant)
Sources of variations
Genotype
(G) (df= 1)
Treatment
(T) (df= 1)
Genotype × Treatment
(G × T) (df= 1)Leaf relative water content (%)
Membrane stability index (%)
Electrolyte leakage (%)
Proline (µmol g-1 FW)
MDA (µmol g-1 FW)
Chlorophyll (µmol g-1 FW)
Sodium ion [ (Na+) (µmol g-1 FW)]
Potassium ion [ (K+) (µmol g-1 FW)]
SOD (µmol min-1 g-1 protein)
CAT (µmol min-1 g-1 protein)
POD (µmol min-1 g-1 protein)
ABA (µmol g-1 FW)
IAA (µmol g-1 FW)
SOD1
CAT1
POD1
P5CS
SOS1
HKT1
NHX1
psbA
ABA2
**
**
***
***
***
**
***
***
***
***
***
***
***
***
***
***
***
***
***
***
***
***
**
**
***
***
***
**
***
***
***
***
***
***
***
***
***
***
***
***
***
***
***
***
**
**
***
***
***
**
NS
***
***
***
NS
***
***
***
***
***
***
***
***
***
***
*****, *** Significant at the .05 and .01 probability levels.
Fig. 1. Effect of salinity stress on relative water content (A), membrane stability index (B) and electrolyte leakage (C) of two sorghum genotypes [Data show the means ± standard deviation of three independent samples, different letters on vertical bars indicate significant differences between means at the P≤ 0.05 level].
1
Figures
Fig.1.
129IMPACT OF SALINITY STRESS ON MEMBRANE STATUS, PHYTOHORMONES...
Egypt. J. Agron. 42, No. 2 (2020)
Fig. 2. Effect of salinity stress on malondialdehyde content (A), proline content (B) and chlorophyll content (C) of two sorghum genotypes [Data show the means ± standard deviation of three independent samples, different letters on vertical bars indicate significant differences between means at the P≤ 0.05 level].
Fig. 3. Effect of salinity stress on sodium ion (Na+) concentration (A) and potassium ion (K+) concentration of two sorghum genotypes [Data show the means ± standard deviation of three independent samples, different letters on vertical bars indicate significant differences between means at the P≤ 0.05 level].
2
Fig.2. Effect of salinity stress on the distribution of monovalent cations (Na+ and K+)
Salinity stress resulted in an increased Na+ and decreased K+ in sorghum genotypes (Fig. 3 A and B). Higher increase (3.1-fold) increase in Na+ was observed in PI 585454, compared to a lower (1.3-fold) increase recorded in PI 585451 (Fig. 3 A). The K+ was reduced by 0.64-fold and the 0.59-fold decline was observed in PI 585451 and PI 585454, respectively (Fig. 3 B). Similarly, the content of ABA increased by 59% in PI 585451 and 35% in PI 585451 (Fig. 3 C). Besides, the Na+ and K+ concentrations were affected by the G and T, but for their interactions (G × T) in relation to the Na+ concentration (Table 2).
Plant hormone contents From Fig. 4 A and B, salinity stress resulted
in a dramatic increase in the ABA and IAA contents of sorghum genotypes. For instance, the ABA content increased by 59% in PI 585451, compared to a 35% increase in the ABA content
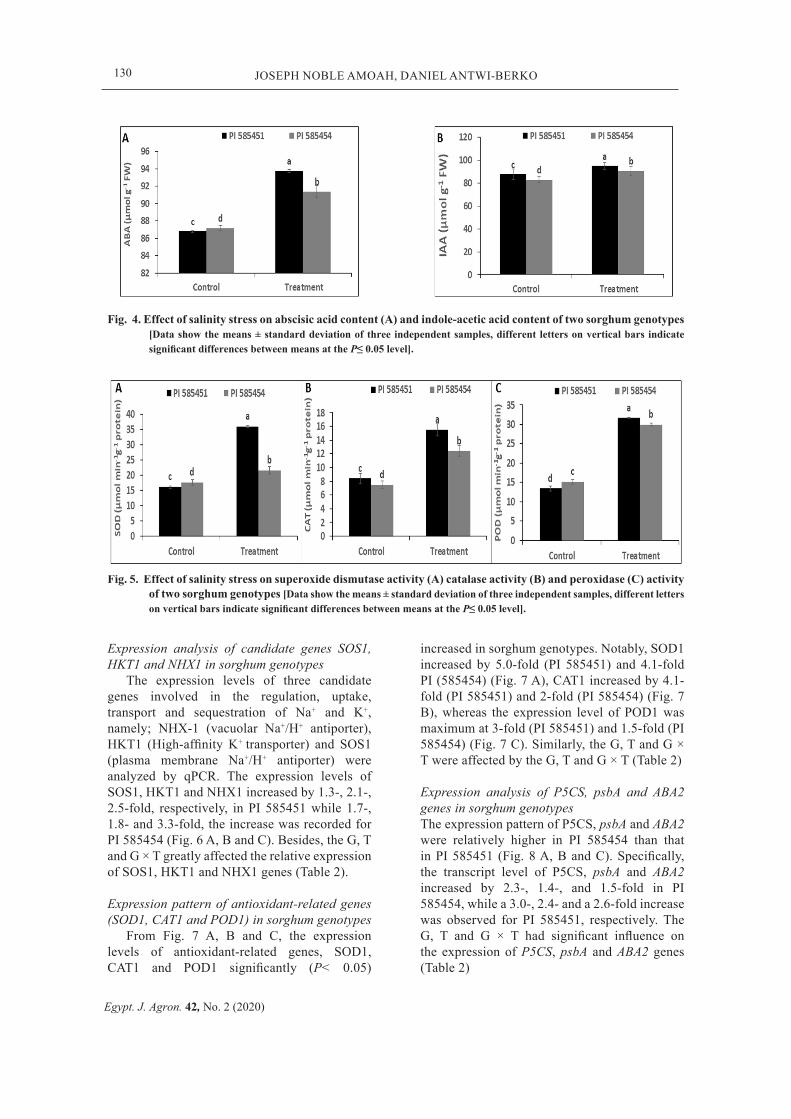
in PI 585454 (Fig. 4 A). Similarly, the IAA content was significantly (P< 0.05) higher in PI 585451 (18.2%) than that observed in PI 585454 (9.2%) (Fig. 4 B). Additionally, the content of ABA and IAA were significantly affected by the G, T and G × T (Table 2).
Enzyme antioxidants activities After salinity stress treatment, the activities
of SOD, CAT and POD significantly increased in sorghum genotypes, compared with controls (P< 0.05) (Fig. 5 A, B and C). For instance, the SOD activity increased by 55.21% in PI 585451, compared to a 18% increase in PI 585454 (Fig. 5 A). Similarly, increase in the CAT activity was maximum at 84% (PI 585451) and 66% (PI 585454) (Fig. 5 B), while the increase in POD activity ranged from 136% (PI 585451) and 98% (PI 585454) (Fig. 5 C). Furthermore, the G, T and G × T greatly affected the SOD, CAT and POD activities, except the G on the activities of POD (Table 2).
3
Fig.3.
130
Egypt. J. Agron. 42, No. 2 (2020)
JOSEPH NOBLE AMOAH, DANIEL ANTWI-BERKO
Fig. 5. Effect of salinity stress on superoxide dismutase activity (A) catalase activity (B) and peroxidase (C) activity of two sorghum genotypes [Data show the means ± standard deviation of three independent samples, different letters on vertical bars indicate significant differences between means at the P≤ 0.05 level].
4
Fig.4.
Fig. 4. Effect of salinity stress on abscisic acid content (A) and indole-acetic acid content of two sorghum genotypes [Data show the means ± standard deviation of three independent samples, different letters on vertical bars indicate significant differences between means at the P≤ 0.05 level].
5
Fig.5. Expression analysis of candidate genes SOS1, HKT1 and NHX1 in sorghum genotypes
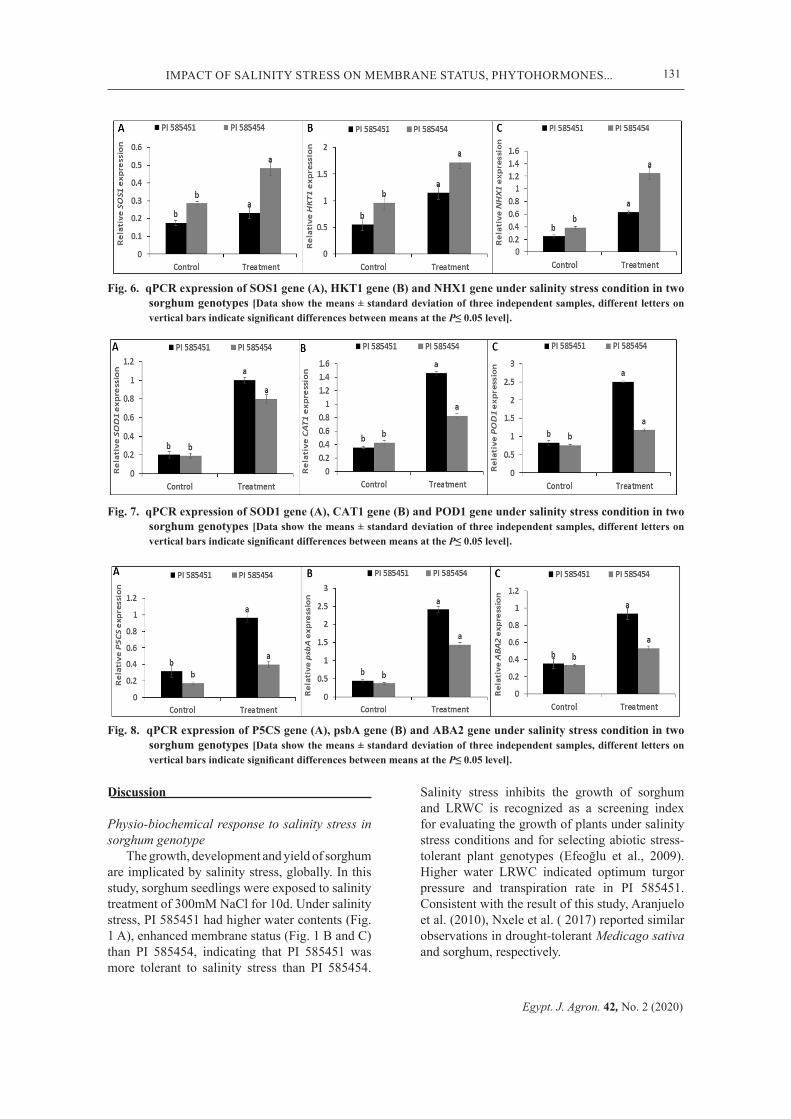
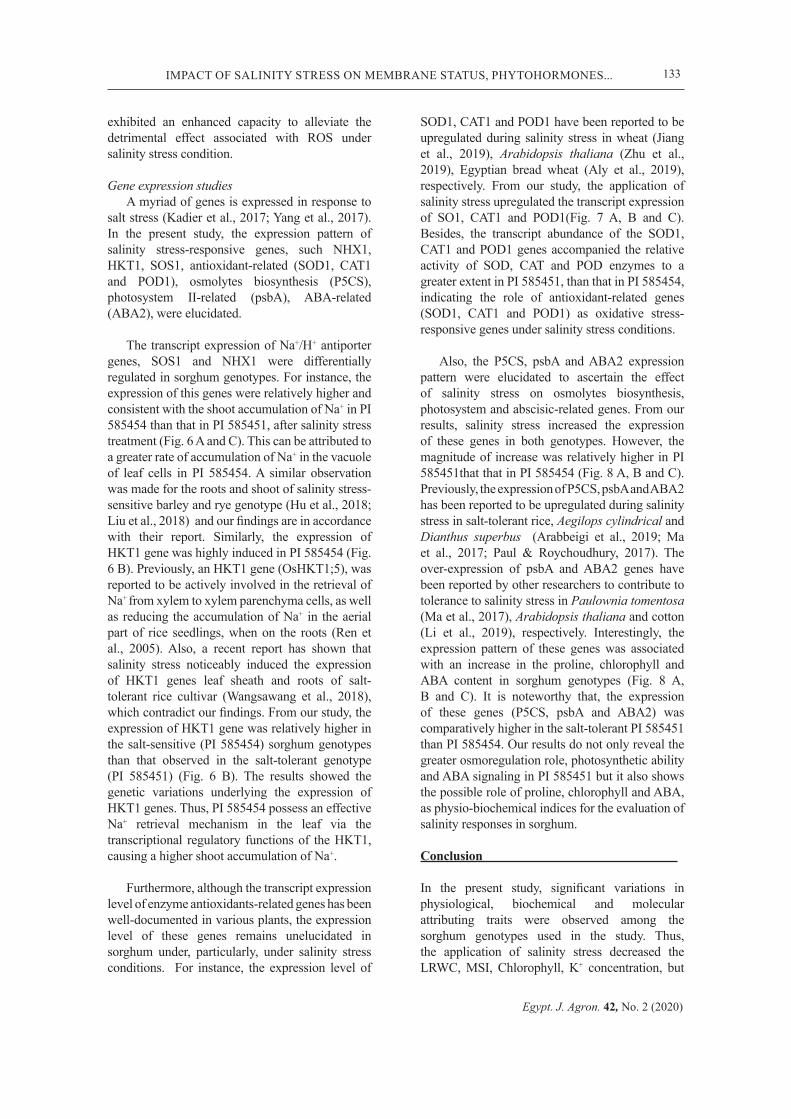
The expression levels of three candidate genes involved in the regulation, uptake, transport and sequestration of Na+ and K+, namely; NHX-1 (vacuolar Na+/H+ antiporter), HKT1 (High-affinity K+ transporter) and SOS1 (plasma membrane Na+/H+ antiporter) were analyzed by qPCR. The expression levels of SOS1, HKT1 and NHX1 increased by 1.3-, 2.1-, 2.5-fold, respectively, in PI 585451 while 1.7-, 1.8- and 3.3-fold, the increase was recorded for PI 585454 (Fig. 6 A, B and C). Besides, the G, T and G × T greatly affected the relative expression of SOS1, HKT1 and NHX1 genes (Table 2).
Expression pattern of antioxidant-related genes (SOD1, CAT1 and POD1) in sorghum genotypes
From Fig. 7 A, B and C, the expression levels of antioxidant-related genes, SOD1, CAT1 and POD1 significantly (P< 0.05)
increased in sorghum genotypes. Notably, SOD1 increased by 5.0-fold (PI 585451) and 4.1-fold PI (585454) (Fig. 7 A), CAT1 increased by 4.1-fold (PI 585451) and 2-fold (PI 585454) (Fig. 7 B), whereas the expression level of POD1 was maximum at 3-fold (PI 585451) and 1.5-fold (PI 585454) (Fig. 7 C). Similarly, the G, T and G × T were affected by the G, T and G × T (Table 2)
Expression analysis of P5CS, psbA and ABA2 genes in sorghum genotypesThe expression pattern of P5CS, psbA and ABA2 were relatively higher in PI 585454 than that in PI 585451 (Fig. 8 A, B and C). Specifically, the transcript level of P5CS, psbA and ABA2 increased by 2.3-, 1.4-, and 1.5-fold in PI 585454, while a 3.0-, 2.4- and a 2.6-fold increase was observed for PI 585451, respectively. The G, T and G × T had significant influence on the expression of P5CS, psbA and ABA2 genes (Table 2)
131IMPACT OF SALINITY STRESS ON MEMBRANE STATUS, PHYTOHORMONES...
Egypt. J. Agron. 42, No. 2 (2020)
Fig. 6. qPCR expression of SOS1 gene (A), HKT1 gene (B) and NHX1 gene under salinity stress condition in two sorghum genotypes [Data show the means ± standard deviation of three independent samples, different letters on vertical bars indicate significant differences between means at the P≤ 0.05 level].
Fig. 7. qPCR expression of SOD1 gene (A), CAT1 gene (B) and POD1 gene under salinity stress condition in two sorghum genotypes [Data show the means ± standard deviation of three independent samples, different letters on vertical bars indicate significant differences between means at the P≤ 0.05 level].
6
Fig.6.
7
Fig.7.
8
Fig.8.
Fig. 8. qPCR expression of P5CS gene (A), psbA gene (B) and ABA2 gene under salinity stress condition in two sorghum genotypes [Data show the means ± standard deviation of three independent samples, different letters on vertical bars indicate significant differences between means at the P≤ 0.05 level].
Discussion
Physio-biochemical response to salinity stress in sorghum genotype
The growth, development and yield of sorghum are implicated by salinity stress, globally. In this study, sorghum seedlings were exposed to salinity treatment of 300mM NaCl for 10d. Under salinity stress, PI 585451 had higher water contents (Fig. 1 A), enhanced membrane status (Fig. 1 B and C) than PI 585454, indicating that PI 585451 was more tolerant to salinity stress than PI 585454.
Salinity stress inhibits the growth of sorghum and LRWC is recognized as a screening index for evaluating the growth of plants under salinity stress conditions and for selecting abiotic stress-tolerant plant genotypes (Efeoğlu et al., 2009). Higher water LRWC indicated optimum turgor pressure and transpiration rate in PI 585451. Consistent with the result of this study, Aranjuelo et al. (2010), Nxele et al. ( 2017) reported similar observations in drought-tolerant Medicago sativa and sorghum, respectively.

132
Egypt. J. Agron. 42, No. 2 (2020)
JOSEPH NOBLE AMOAH, DANIEL ANTWI-BERKO
Furthermore, salinity stress was complemented with the formation of ROS, capable of damaging macromolecules, cell membrane and leakage of electrons (Choudhury et al., 2013). Besides, MSI, EL and MDA (a marker of lipid peroxidation) is often used in for evaluating the membrane integrity of plant cells and as an assessment index for discriminating against drought-tolerant wheat genotypes (Figs. 1 B-C and 2 A). Although previous research reported the effect of salinity stress on the membrane integrity of drought-tolerant wheat genotype, little is known about the effect of salinity stress on the cellular membrane activities of sorghum (Selote & Khanna-Chopra, 2010; Singh et al., 2020). In this study, the MSI in PI 585451 was relatively higher in PI 585451 (Fig. 1B), whereas the rate of EL (Fig. 1 C) and concentration of MDA (Fig. 2 A) in PI 585451 was lower than that observed in PI 585454 after salinity stress. Similar conclusions were obtained from previous researches (Ahmed et al., 2015, 2016). From our results, the lower membrane damage in PI 585451 may be due to a lower ROS production, protecting the plant from the salinity stress through enhanced ROS scavenging or prevention of plant cell membrane damages.
Osmoprotectant, such as proline, are stimulated by the salinity stress and high level of proline facilitates the maintenance of low water potential, safeguard protein from damage and enhance enzyme antioxidants activities (Hayat et al., 2012; Nxele et al., 2017; Shafi et al., 2019) and the findings of our study are in accordance with those reports. From our study, the higher proline content exhibited by PI 585451 is a true indication of a better tolerance to salinity stress than PI 585454 (Fig. 2 B).
Salinity stress exacerbates the decomposition of chlorophyll and the ability of a plant to maintain a higher chlorophyll content under salinity stress conditions contributes to salinity stress tolerance. Previous researches have reported a higher chlorophyll content in salinity stress-tolerant sorghum genotypes (Maswada et al., 2018; Mbinda & Kimtai, 2019) and consistent with our data, the higher chlorophyll content in PI 585451 indicates it’s salinity stress tolerant ability than PI 585454 and provide insight into the photosynthetic role of the pigment under salinity stress conditions (Fig. 2 C).
Differential accumulation of monovalent cations
(Na+ and K+) was observed in the leaf of sorghum genotypes investigated (Fig. 3 A and B). In relation to Na+, a greater magnitude of accumulation of this cation was observed in PI 385454 than that in PI 385451(Fig. 3 A). Thus, the lower Na+ in the leaf of PI 385451 indicated a restricted entry of Na+ into PI 385451, as a means of providing a protective mechanism for the photosynthetic machinery against the detrimental effect of high Na+. Our results are in accordance with the report by Ghodke et al. (2018). Contrast to the accumulation of Na+, salinity stress inhibited the distribution of K+ to a greater extent in PI 385454 than in PI 385451 (Fig. 3 C). Interestingly, PI 385451, effectively retained a greater concentration of K+, resulting in enhanced ion homeostasis under salinity stress condition. The effect of Na+ on K+ uptake, through the inhibition of the K+ transporters, has been reported in drought-tolerant rice and wheat (Fuchs et al., 2005; Kumar et al., 2017), which is in agreement with the results of our study. Our study provides novel insight into the Na+ on K+ distribution in sorghum under salinity stress.
Plant hormones play signal transduction and regulatory in adapting plants to salinity stress environments (Tang et al., 2015). Higher ABA helps plants to acclimate under low water condition through enhanced stomatal closure and accumulation of compatible solutes for osmotic adjustment (Zhang et al., 2009). Besides, ABA plays a modulatory role in the transport of IAA in the root apex to maintain root elongation and root hair development under water stress (Zhang et al., 2009). From our results, salinity stress increased ABA and IAA contents in PI 385451 than that in PI 385454 (Fig. 4 A and B). Our results are in accordance with previous reports by Zhang et al. (2015).
Enzyme antioxidants such as SOD, CAT and POD, plays a pivotal role in the scavenging of ROS, contributing to the minimization of oxidative damage (Wu et al., 2017). From our study, salinity stress resulted in an elevation in the activities these enzymes (Fig. 5 A, B and C). Comparatively, the activities of SOD, CAT and POD were relatively higher in PI 585451 than that in PI 585454 after salinity stress. This is consistent with previous reports by (Hu et al., 2018; Sharma et al., 2013). Thus, considering the higher enzyme antioxidants (SOD, CAT and POD) activities, enhanced membrane status and MDA contents in PI 58545 than PI 585454, it is arguable that PI 585451
133IMPACT OF SALINITY STRESS ON MEMBRANE STATUS, PHYTOHORMONES...
Egypt. J. Agron. 42, No. 2 (2020)
exhibited an enhanced capacity to alleviate the detrimental effect associated with ROS under salinity stress condition.
Gene expression studies A myriad of genes is expressed in response to
salt stress (Kadier et al., 2017; Yang et al., 2017). In the present study, the expression pattern of salinity stress-responsive genes, such NHX1, HKT1, SOS1, antioxidant-related (SOD1, CAT1 and POD1), osmolytes biosynthesis (P5CS), photosystem II-related (psbA), ABA-related (ABA2), were elucidated.
The transcript expression of Na+/H+ antiporter genes, SOS1 and NHX1 were differentially regulated in sorghum genotypes. For instance, the expression of this genes were relatively higher and consistent with the shoot accumulation of Na+ in PI 585454 than that in PI 585451, after salinity stress treatment (Fig. 6 A and C). This can be attributed to a greater rate of accumulation of Na+ in the vacuole of leaf cells in PI 585454. A similar observation was made for the roots and shoot of salinity stress-sensitive barley and rye genotype (Hu et al., 2018; Liu et al., 2018) and our findings are in accordance with their report. Similarly, the expression of HKT1 gene was highly induced in PI 585454 (Fig. 6 B). Previously, an HKT1 gene (OsHKT1;5), was reported to be actively involved in the retrieval of Na+ from xylem to xylem parenchyma cells, as well as reducing the accumulation of Na+ in the aerial part of rice seedlings, when on the roots (Ren et al., 2005). Also, a recent report has shown that salinity stress noticeably induced the expression of HKT1 genes leaf sheath and roots of salt-tolerant rice cultivar (Wangsawang et al., 2018), which contradict our findings. From our study, the expression of HKT1 gene was relatively higher in the salt-sensitive (PI 585454) sorghum genotypes than that observed in the salt-tolerant genotype (PI 585451) (Fig. 6 B). The results showed the genetic variations underlying the expression of HKT1 genes. Thus, PI 585454 possess an effective Na+ retrieval mechanism in the leaf via the transcriptional regulatory functions of the HKT1, causing a higher shoot accumulation of Na+.
Furthermore, although the transcript expression level of enzyme antioxidants-related genes has been well-documented in various plants, the expression level of these genes remains unelucidated in sorghum under, particularly, under salinity stress conditions. For instance, the expression level of
SOD1, CAT1 and POD1 have been reported to be upregulated during salinity stress in wheat (Jiang et al., 2019), Arabidopsis thaliana (Zhu et al., 2019), Egyptian bread wheat (Aly et al., 2019), respectively. From our study, the application of salinity stress upregulated the transcript expression of SO1, CAT1 and POD1(Fig. 7 A, B and C). Besides, the transcript abundance of the SOD1, CAT1 and POD1 genes accompanied the relative activity of SOD, CAT and POD enzymes to a greater extent in PI 585451, than that in PI 585454, indicating the role of antioxidant-related genes (SOD1, CAT1 and POD1) as oxidative stress-responsive genes under salinity stress conditions.
Also, the P5CS, psbA and ABA2 expression pattern were elucidated to ascertain the effect of salinity stress on osmolytes biosynthesis, photosystem and abscisic-related genes. From our results, salinity stress increased the expression of these genes in both genotypes. However, the magnitude of increase was relatively higher in PI 585451that that in PI 585454 (Fig. 8 A, B and C). Previously, the expression of P5CS, psbA and ABA2 has been reported to be upregulated during salinity stress in salt-tolerant rice, Aegilops cylindrical and Dianthus superbus (Arabbeigi et al., 2019; Ma et al., 2017; Paul & Roychoudhury, 2017). The over-expression of psbA and ABA2 genes have been reported by other researchers to contribute to tolerance to salinity stress in Paulownia tomentosa (Ma et al., 2017), Arabidopsis thaliana and cotton (Li et al., 2019), respectively. Interestingly, the expression pattern of these genes was associated with an increase in the proline, chlorophyll and ABA content in sorghum genotypes (Fig. 8 A, B and C). It is noteworthy that, the expression of these genes (P5CS, psbA and ABA2) was comparatively higher in the salt-tolerant PI 585451 than PI 585454. Our results do not only reveal the greater osmoregulation role, photosynthetic ability and ABA signaling in PI 585451 but it also shows the possible role of proline, chlorophyll and ABA, as physio-biochemical indices for the evaluation of salinity responses in sorghum.
Conclusion
In the present study, significant variations in physiological, biochemical and molecular attributing traits were observed among the sorghum genotypes used in the study. Thus, the application of salinity stress decreased the LRWC, MSI, Chlorophyll, K+ concentration, but
134
Egypt. J. Agron. 42, No. 2 (2020)
JOSEPH NOBLE AMOAH, DANIEL ANTWI-BERKO
increased EL, MDA, proline, Na+ concentration, plant hormones (ABA and IAA) concentrations and enzyme antioxidants (SOD, CAT and POD) activity, but PI 585451 showed enhanced tolerance to salinity stress. Besides, the relative expression of salinity stress-responsive genes (SOS1, HKT1 and NHX1), antioxidant-related genes (SOD1, CAT1 and POD1), P5CS, psbA and ABA2 were comparatively higher in PI 585451. Therefore, a better understanding of the functional and regulatory control of these genotypes under salinity stress conditions may provide useful information for the future development of salt-tolerant crop genotypes.
References
Ahanger, M.A., Agarwal, R. (2017) Salinity stress induced alterations in antioxidant metabolism and nitrogen assimilation in wheat (Triticum aestivum L) as influenced by potassium supplementation. Plant Physiology and Biochemistry, 115, 449-460.
Ahmed, I.M., Nadira, U.A., Bibi, N., Cao, F., He, X., Zhang, G., Wu, F. (2015) Secondary metabolism and antioxidants are involved in the tolerance to drought and salinity, separately and combined, in Tibetan wild barley. Environmental and Experimental Botany, 111, 1-12.
Ahmed, I.M., Nadira, U.A., Cao, F., He, X., Zhang, G., Wu, F. (2016) Physiological and molecular analysis on root growth associated with the tolerance to aluminum and drought individual and combined in Tibetan wild and cultivated barley. Planta, 243, 973-985.
Aly, A., Maraei, R.W., Aldrussi, I. (2019) Changes in peroxidase and polyphenol oxidase activity and transcript levels of related genes in two Egyptian bread wheat cultivars (Triticum aestivum L.) affected by gamma irradiation and salinity stress. Bangladesh Journal of Botany, 48, 177-186.
Amoah, J.N., Antwi-Berko, D. (2020) Comparative physiological, biochemical and transcript response to drought in sorghum genotypes. Biotechnology Journal International, 1-14. DOI: 10.9734/bji/2020/v24i330102
Arabbeigi, M., Arzani, A., Majidi, M.M. (2019) Expression profiles of P5CS and DREB2 genes under salt stress in Aegilops cylindrica. Russian Journal of Plant Physiology, 66, 583-590.
Aranjuelo, I., Molero, G., Erice, G., Avice, J.C., Nogués, S. (2010) Plant physiology and proteomics reveals the leaf response to drought in alfalfa (Medicago sativa L.). Journal of Experimental Botany, 62, 111-123.
Arzani, A., Ashraf, M. (2016) Smart engineering of genetic resources for enhanced salinity tolerance in crop plants. Critical Reviews in Plant Sciences, 35, 146-189.
Ashraf, M.A., Akbar, A., Parveen, A., Rasheed, R., Hussain, I., Iqbal, M. (2018) Phenological application of selenium differentially improves growth, oxidative defense and ion homeostasis in maize under salinity stress. Plant Physiology and Biochemistry, 123, 268-280.
Bates, L.S., Waldren, R.P., Teare, I. (1973) Rapid determination of free proline for water-stress studies. Plant and Soil, 39, 205-207.
Chen, D., Wang, S., Cao, B., Cao, D., Leng, G., Li, H., Yin, L., Shan, L., Deng, X. (2016) Genotypic variation in growth and physiological response to drought stress and re-watering reveals the critical role of recovery in drought adaptation in maize seedlings. Frontiers in Plant Science, 6, 1241.
Choudhury, S., Panda, P., Sahoo, L., Panda, S.K. (2013) Reactive oxygen species signaling in plants under abiotic stress. Plant Signaling & Behavior, 8, e23681.
Efeoğlu, B., Ekmekci, Y., Cicek, N. (2009) Physiological responses of three maize cultivars to drought stress and recovery. South African Journal of Botany, 75, 34-42.
Fuchs, I., Stölzle, S., Ivashikina, N., Hedrich, R. (2005) Rice K+ uptake channel OsAKT1 is sensitive to salt stress. Planta, 221, 212-221.
Ghodke, P., Andhale, P., Gijare, U., Thangasamy, A., Khade, Y., Mahajan, V., Singh, M. (2018) Physiological and biochemical responses in onion crop to drought stress. International Journal of Current Microbiology and Applied Sciences, 7, 2054-2062.
Guo, Y.Y., Yu, H.Y., Yang, M.M., Kong, D.S., Zhang, Y.J. (2018) Effect of drought stress on lipid peroxidation, osmotic adjustment and antioxidant enzyme activity of leaves and roots of Lycium ruthenicum Murr.

135IMPACT OF SALINITY STRESS ON MEMBRANE STATUS, PHYTOHORMONES...
Egypt. J. Agron. 42, No. 2 (2020)
seedling. Russian Journal of Plant Physiology, 65, 244-250.
Hayat, S., Hayat, Q., Alyemeni, M.N., Wani, A.S., Pichtel, J., Ahmad, A. (2012) Role of proline under changing environments. Plant Signaling & Behavior, 7, 1456-1466.
Hu, L., Xie, Y., Fan, S., Wang, Z., Wang, F., Zhang, B., Li, H., Song, J., Kong, L. (2018) Comparative analysis of root transcriptome profiles between drought-tolerant and susceptible wheat genotypes in response to water stress. Plant Science, 272, 276-293.
Huang, B., DaCosta, M., Jiang, Y. (2014) Research advances in mechanisms of turfgrass tolerance to abiotic stresses: from physiology to molecular biology. Critical Reviews in Plant Sciences, 33, 141-189.
Jan, A.U., Hadi, F., Midrarullah, Nawaz, M.A., Rahman, K. (2017) Potassium and zinc increase tolerance to salt stress in wheat (Triticum aestivum L.). Plant Physiology and Biochemistry, 116, 139-149.
Jiang, W., Yang, L., He, Y., Zhang, H., Li, W., Chen, H., Ma, D., Yin, J. (2019) Genome-wide identification and transcriptional expression analysis of superoxide dismutase (SOD) family in wheat (Triticum aestivum). Peer J., 7, e8062.
Kadier, Y., Zu, Y.-y., Dai, Q.-m., Song, G., Lin, S.-w., Sun, Q.-p., Pan, J.-b., Lu, M. (2017) Genome-wide identification, classification and expression analysis of NAC family of genes in sorghum [Sorghum bicolor (L.) Moench]. Plant Growth Regulation, 83, 301-312.
Kalaji, H.M., Dąbrowski, P., Cetner, M.D., Samborska, I.A., Łukasik, I., Brestic, M., Zivcak, M., Tomasz, H., Mojski, J., Kociel, H., Panchal, B.M. (2017) A comparison between different chlorophyll content meters under nutrient deficiency conditions. Journal of Plant Nutrition, 40, 1024-1034.
Kumar, S., Singh, A. (2016) Epigenetic regulation of abiotic stress tolerance in plants. Adv. Plants Agric. Res. 5, 10.15406.
Kumar, S., Beena, A., Awana, M., Singh, A. (2017) Physiological, biochemical, epigenetic and molecular analyses of wheat (Triticum aestivum L.) genotypes with contrasting salt tolerance. Frontiers in Plant Science, 8, 1151.
Li, Z., Li, L., Zhou, K., Zhang, Y., Han, X., Din, Y., Ge, X., Qin, W., Wang, P., Li, F., Ma, Z., Yang, Z. (2019) GhWRKY6 acts as a negative regulator in both transgenic Arabidopsis and cotton during drought and salt stress. Front. Genet. 10, 392. Doi: 10.3389/fgene.2019.0039210.
Liu, M., Song, X., Jiang, Y. (2018) Growth, ionic response, and gene expression of shoots and roots of perennial ryegrass under salinity stress. Acta Physiologiae Plantarum, 40, 112.
Ma, X., Zheng, J., Zhang, X., Hu, Q., Qian, R. (2017) Salicylic acid alleviates the adverse effects of salt stress on Dianthus superbus (Caryophyllaceae) by activating photosynthesis, protecting morphological structure, and enhancing the antioxidant system. Frontiers in Plant Science, 8. DOI: 10.3389/fpls.2017.00600
Maswada, H., Djanaguiraman, M., Prasad, P. (2018) Seed treatment with nano‐iron (III) oxide enhances germination, seeding growth and salinity tolerance of sorghum. Journal of Agronomy and Crop Science, 204, 577-587.
Mbinda, W., Kimtai, M. (2019) Physiological and biochemical analyses of sorghum varieties reveal differential responses to salinity stress. Bio Rxiv, 720789. Doi: https://doi.org/10.1101/720789
Mugalavai, V., Onkware, A. (2019) Exploiting the nutritional profile and consumer behavior on choice and utilization of selected sorghum varieties in Western Kenya. International Journal of Science and Research, 8, 368-372.
Mundia, C.W., Secchi, S., Akamani, K., Wang, G. (2019) A regional comparison of factors affecting global sorghum production: The case of North America, Asia and Africa’s Sahel. Sustainability, 11, 2135.
Nxele, X., Klein, A., Ndimba, B.K. (2017) Drought and salinity stress alters ROS accumulation, water retention, and osmolyte content in sorghum plants. South African Journal of Botany, 108, 261-266.
Paul, S., Roychoudhury, A. (2017) Seed priming with spermine and spermidine regulates the expression of diverse groups of abiotic stress-responsive genes during salinity stress in the seedlings of indica rice varieties. Plant Gene, 11, 124-132.
Rahneshan, Z., Nasibi, F., Moghadam, A.A. (2018)
136
Egypt. J. Agron. 42, No. 2 (2020)
JOSEPH NOBLE AMOAH, DANIEL ANTWI-BERKO
Effects of salinity stress on some growth, physiological, biochemical parameters and nutrients in two pistachio (Pistacia vera L.) rootstocks. Journal of Plant Interactions, 13, 73-82.
Ren, Z.-H., Gao, J.-P., Li, L.-G., Cai, X.-L., Huang, W., Chao, D.-Y., Zhu, M.-Z., Wang, Z.-Y., Luan, S., Lin, H.-X. (2005) A rice quantitative trait locus for salt tolerance encodes a sodium transporter. Nature Gnetics, 37, 1141-1146.
Saadati, S., Baninasab, B., Mobli, M., Gholami, M.J. (2019) Measurements of freezing tolerance and their relationship with some biochemical and physiological parameters in seven olive cultivars. Acta Physiologiae Plantarum, 41, 51.
Selote, D.S., Khanna-Chopra, R. (2010) Antioxidant response of wheat roots to drought acclimation. Protoplasma, 245, 153-163.
Shafi, A., Zahoor, I., Mushtaq, U. (2019) Proline accumulation and oxidative stress: Diverse roles and mechanism of tolerance and adaptation under salinity stress. In: “Salt Stress, Microbes, and Plant Interactions: Mechanisms and Molecular Approaches”, pp. 269-300. Springer.
Sharma, I., Ching, E., Saini, S., Bhardwaj, R., Pati, P. K. (2013) Exogenous application of brassinosteroid offers tolerance to salinity by altering stress responses in rice variety Pusa Basmati-1. Plant Physiology and Biochemistry, 69, 17-26.
Singh, D., Singh, C.K., Kumari, S., Tomar, R.S.S., Karwa, S., Singh, R., Singh, R.B., Sarkar, S.K., Pal, M. (2017) Discerning morpho-anatomical, physiological and molecular multiformity in cultivated and wild genotypes of lentil with reconciliation to salinity stress. PloS One, 12. Doi: org/10.1371/journal.pone.0177465
Singh, P., Mahajan, M.M., Singh, N.K., Kumar, D., Kumar, K. (2020) Physiological and molecular response under salinity stress in bread wheat (Triticum aestivum L.). Journal of Plant Biochemistry and Biotechnology, 29, 125-133.
Tang, X., Mu, X., Shao, H., Wang, H., Brestic, M. (2015) Global plant-responding mechanisms to salt stress: Physiological and molecular levels and implications in biotechnology. Critical Reviews in Biotechnology, 35, 425-437.
Venkatachalam, P., Priyanka, N., Manikandan, K., Ganeshbabu, I., Indiraarulselvi, P., Geetha, N., Muralikrishna, K., Bhattacharya, R.C., Tiwari, M., Sharma, N., Sahi, S.V. (2017) Enhanced plant growth promoting role of phycomolecules coated zinc oxide nanoparticles with P supplementation in cotton (Gossypium hirsutum L.). Plant Physiology and Biochemistry, 110, 118-127.
Wangsawang, T., Chuamnakthong, S., Kohnishi, E., Sripichitt, P., Sreewongchai, T., Ueda, A. (2018) A salinity‐tolerant japonica cultivar has Na+ exclusion mechanism at leaf sheaths through the function of a Na+ transporter Os HKT 1; 4 under salinity stress. Journal of Agronomy and Crop Science, 204, 274-284.
Weiler, E., Jourdan, P., Conrad, W. (1981) Levels of indole-3-acetic acid in intact and decapitated coleoptiles as determined by a specific and highly sensitive solid-phase enzyme immunoassay. Planta, 153, 561-571.
Yang, Z., Wang, Y., Wei, X., Zhao, X., Wang, B., Sui, N. (2017) Transcription profiles of genes related to hormonal regulations under salt stress in sweet sorghum. Plant Molecular Biology Reporter, 35, 586-599.
Zadoks, J.C., Chang, T.T., Konzak, C.F. (1974) A decimal code for the growth stages of cereals. Weed Research, 14, 415-421.
Zhang, X., Ervin, E., Evanylo, G., Haering, K.C. (2009) Impact of biosolids on hormone metabolism in drought-stressed tall fescue. Turfgrass Science, 49, 1893-1901.
Zhang, X., Ervin, E. H., Liu, Y., Hu, G., Shang, C., Fukao, T., Alpuerto, J. (2015) Differential responses of antioxidants, abscisic acid, and auxin to deficit irrigation in two perennial ryegrass cultivars contrasting in drought tolerance. Journal of the American Society for Horticultural Science, 140, 562-572.
Zhu, D., Hou, L., Xiao, P., Guo, Y., Deyholos, M.K., Liu, X. (2019) VvWRKY30, a grape WRKY transcription factor, plays a positive regulatory role under salinity stress. Plant Science, 280, 132-142.