Embed Size (px)
Citation preview
EGYPT: THE ROAD AHEAD February 2016
Projects - Egypt Synopsis of Oriental Petrochemicals Company
2
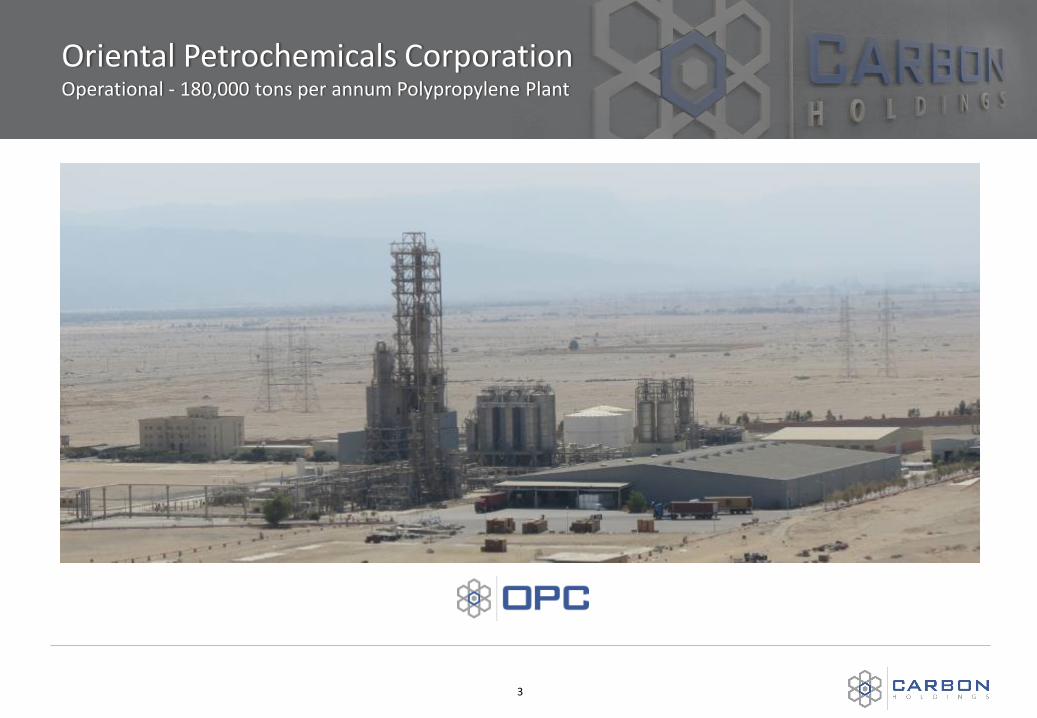
Products 180,000 MTA Polypropylene
Status Operational
Acquisition Date Q4 2012
Location Suez, Egypt
SNAPSHOT COMMERCIAL STRUCTURE
xc
3
Oriental Petrochemicals Corporation Operational - 180,000 tons per annum Polypropylene Plant
4
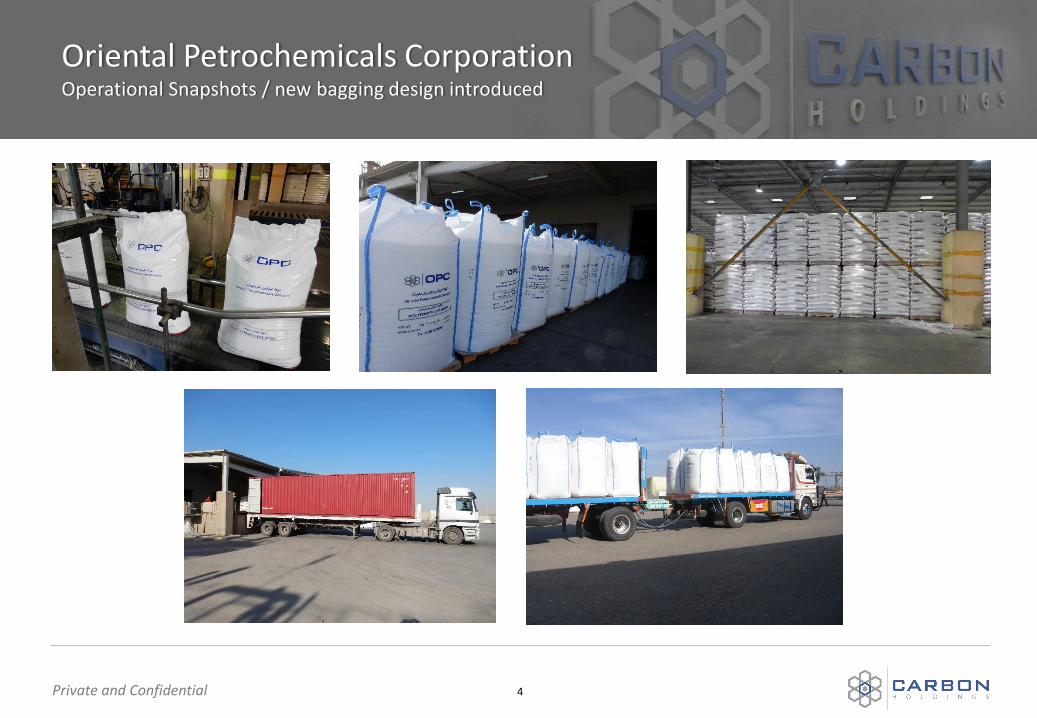
Oriental Petrochemicals Corporation Operational Snapshots / new bagging design introduced
Private and Confidential

Projects - Egypt Synopsis of Egypt Hydrocarbon Corporation
5
Products 1,060 MTPD Ammonium Nitrate 850 MTPD Nitric Acid
Status Commissioning
Start-Up Q1 2016
Project Cost (approx.)
US$ 570 million
Location Suez, Egypt
SNAPSHOT COMMERCIAL STRUCTURE
xc
In 2010, EHC won the Euromoney Project Finance award for the Deal of Year
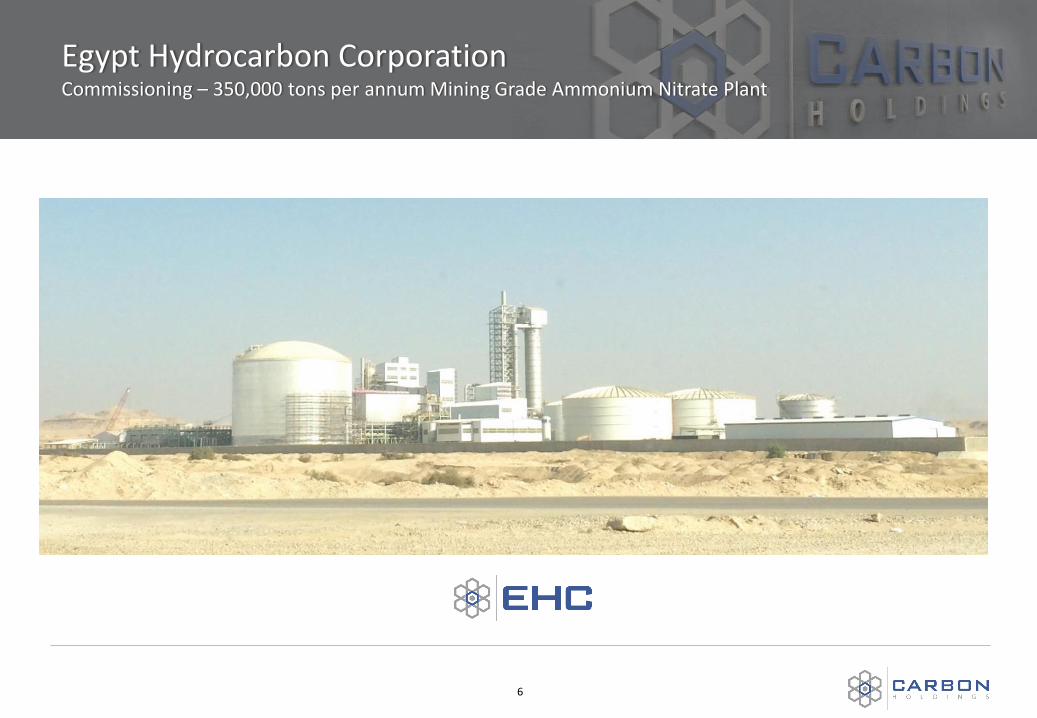
Egypt Hydrocarbon Corporation Commissioning – 350,000 tons per annum Mining Grade Ammonium Nitrate Plant
6

Macroeconomic Rationale GDP vs. Industrialization: Rationale for TPC development
2
The Lewis Curve demonstrates that Egypt is lagging as compared to its peers in economic development. This would suggest that capital-intensive investments offer significant national economic growth potential.
1000
10000
100000
0 10 20 30 40 50 60
Vietnam
Indonesia
India
Philippines
Egypt
Thailand
China
Turkey
Malaysia
South KoreaTaiwan
Brazil
Japan
Hong Kong
Singapore
PRIMARY
PRODUCTION
LABOUR INTENSIVE
MFG
CAPITAL
INTENSIVE
MFG
SERVICES
GDP/
CAPITA $
YEARS FROM BEGINNING OF INDUSTRIALISATION
THE LEWIS CURVE
Source: IMF 2010 nominal GDP/capita data, International eChem, ICIS Consulting
8
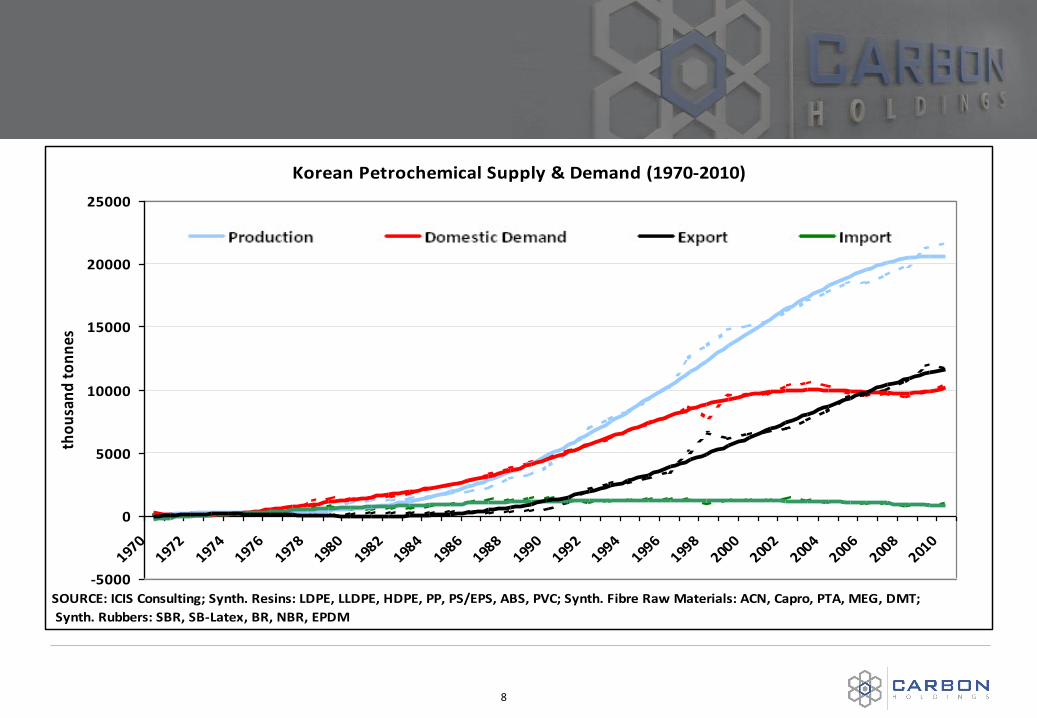
Korean Petrochemical Supply & Demand (1970-2010)
-5000
0
5000
10000
15000
20000
25000
1970
1972
1974
1976
1978
1980
1982
1984
1986
1988
1990
1992
1994
1996
1998
2000
2002
2004
2006
2008
2010
tho
usa
nd
to
nn
es
SOURCE: ICIS Consulting; Synth. Resins: LDPE, LLDPE, HDPE, PP, PS/EPS, ABS, PVC; Synth. Fibre Raw Materials: ACN, Capro, PTA, MEG, DMT;
Synth. Rubbers: SBR, SB-Latex, BR, NBR, EPDM

9
Korean Petrochemical Capacity vs Net Trade Balance
-20
-10
0
10
20
30
40
50
1977
1979
1981
1983
1985
1987
1989
1991
1993
1995
1997
1999
2001
2003
2005
2007
2009
2011N
et
Trad
e B
alan
ce (
US$
bil
lio
ns)
-10000
-5000
0
5000
10000
15000
20000
25000
Inst
alle
d r
esi
n/r
ub
be
r/fi
bre
cap
acit
y ('
00
0 t
on
ne
s)
Net trade balance (left scale)
Installed resin/rubber/fibre capacity (right scale)
SOURCE: ICIS Consulting; Synth. Resins: LDPE, LLDPE, HDPE, PP, PS/EPS, ABS, PVC; Synth. Fibre Raw Materials: ACN, Capro, PTA, MEG, DMT;
Synth. Rubbers: SBR, SB-Latex, BR, NBR, EPDM, IMF - Net trade balance.

10
Thai Petrochemical Capacity vs Net Trade Balance
-10
0
10
20
30
40
1977
1979
1981
1983
1985
1987
1989
1991
1993
1995
1997
1999
2001
2003
2005
2007
2009
2011
Ne
t Tr
ade
Bal
ance
(U
S$ b
illi
on
s)
-5000
0
5000
10000
15000
20000
Inst
alle
d r
esi
n/r
ub
be
r/fi
bre
cap
acit
y ('
00
0 t
on
ne
s)Net trade balance (left scale)
Installed resin/rubber/fibre capacity (right scale)
SOURCE: ICIS Consulting; Synth. Resins: LDPE, LLDPE, HDPE, PP, PS/EPS, ABS, PVC; Synth. Fibre Raw Materials: ACN, Capro, PTA, MEG, DMT;
Synth. Rubbers: SBR, SB-Latex, BR, NBR, EPDM, IMF - Net trade balance.
11
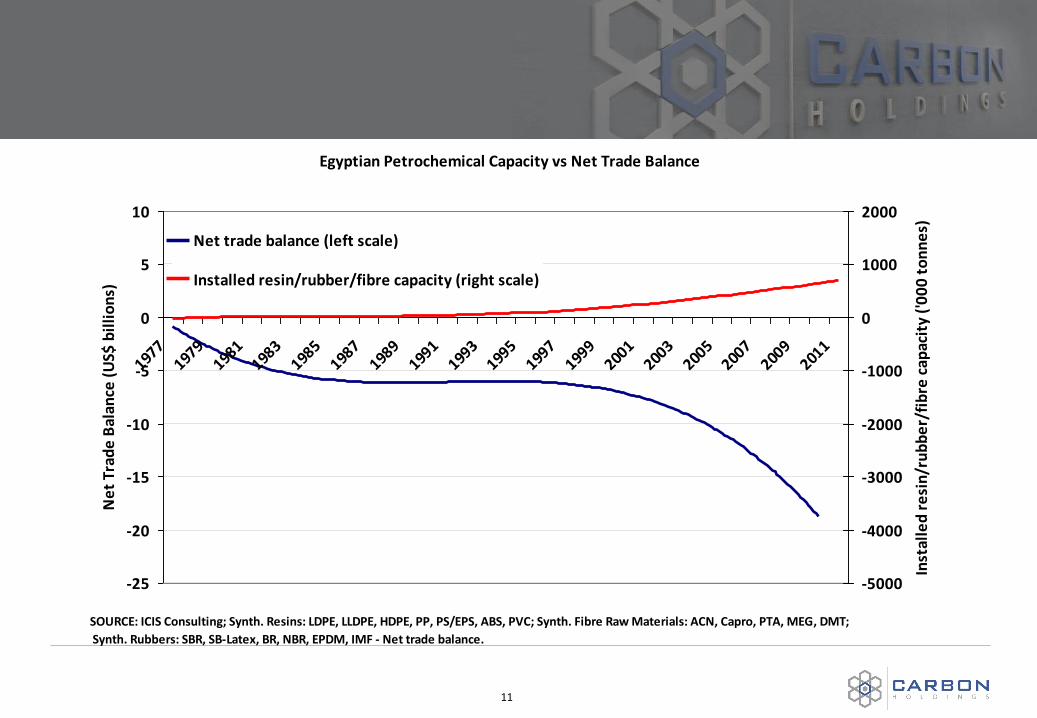
Egyptian Petrochemical Capacity vs Net Trade Balance
-25
-20
-15
-10
-5
0
5
10
1977
1979
1981
1983
1985
1987
1989
1991
1993
1995
1997
1999
2001
2003
2005
2007
2009
2011
Ne
t Tr
ade
Bal
ance
(U
S$ b
illi
on
s)
-5000
-4000
-3000
-2000
-1000
0
1000
2000
Inst
alle
d r
esi
n/r
ub
be
r/fi
bre
cap
acit
y ('
00
0 t
on
ne
s)
Net trade balance (left scale)
Installed resin/rubber/fibre capacity (right scale)
SOURCE: ICIS Consulting; Synth. Resins: LDPE, LLDPE, HDPE, PP, PS/EPS, ABS, PVC; Synth. Fibre Raw Materials: ACN, Capro, PTA, MEG, DMT;
Synth. Rubbers: SBR, SB-Latex, BR, NBR, EPDM, IMF - Net trade balance.

12
Korean Petrochemical Capacity & Growth Rate (1970-2012)
0
5000
10000
15000
20000
25000
30000
19701972
19741976
19781980
19821984
19861988
19901992
19941996
19982000
20022004
20062008
20102012
Tota
l Cap
acit
y, k
t/y
Synthetic Resins Synthetic Fibre Raw Materials Synthetic Rubber
1989-1997 (Take-off period)
Large-scale expansion; launch of
Daesan complex
1979-1988 (Growth period)
launch of Yeosu complex
Government sector-led Private sector-led
1966-1978
(Development period)
launch of Ulsan complex
ethylene capacity:
505 kt/y (two companies)
ethylene capacity:
4330 kt/y (eight companies)
ethylene capacity:
5760 kt/y (seven
companies)
ethylene capacity:
7770 kt/y (six
companies)
1998-2003
(Restructuring
period)
SOURCE: ICIS Consulting; Synth. Resins: LDPE, LLDPE, HDPE, PP, PS/EPS, ABS, PVC; Synth. Fibre Raw Materials: ACN, Capro, PTA, MEG, DMT;
Synth. Rubbers: SBR, SB-Latex, BR, NBR, EPDM
38 Producing Co's.
301 Processing Co's
>5000 Finished Goods Co's
Co-ordinated start-up of multiple-world
scale crackers & foreign investment
provided the ideal basis for more rapid
growth.
ethylene capacity:
115 kt/y (one company)
= Cracker Start-up

13
Olefins Value Chain
3
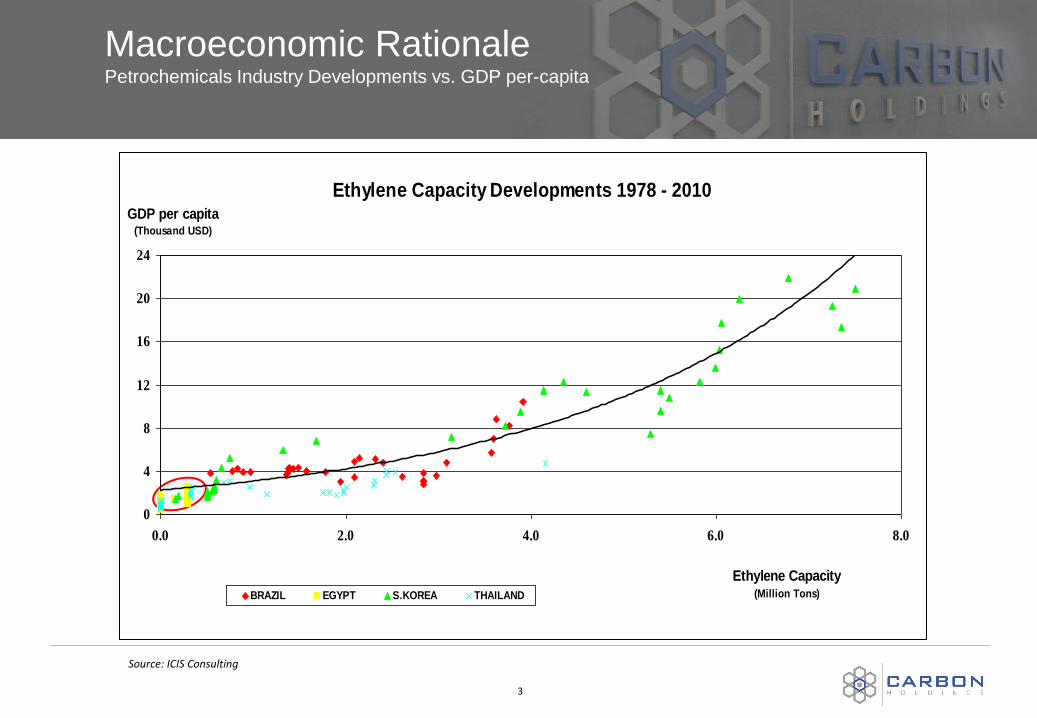
Macroeconomic Rationale Petrochemicals Industry Developments vs. GDP per-capita
Source: ICIS Consulting
Ethylene Capacity Developments 1978 - 2010
0
4
8
12
16
20
24
0.0 2.0 4.0 6.0 8.0
Ethylene Capacity(Million Tons)
GDP per capita(Thousand USD)
BRAZIL EGYPT S.KOREA THAILAND

Macroeconomic Rationale Petrochemicals Industry Developments vs. GDP per-capita
4
Petrochemical Developments 1978 - 2010(Thermoplastics, Fibres, Elastomers)
0
4
8
12
16
20
24
0 30 60 90 120 150
Petrochemical Demand(Kg per capita)
GDP per capita(Thousand USD)
BRAZIL EGYPT S.KOREA THAILAND
Source: ICIS Consulting
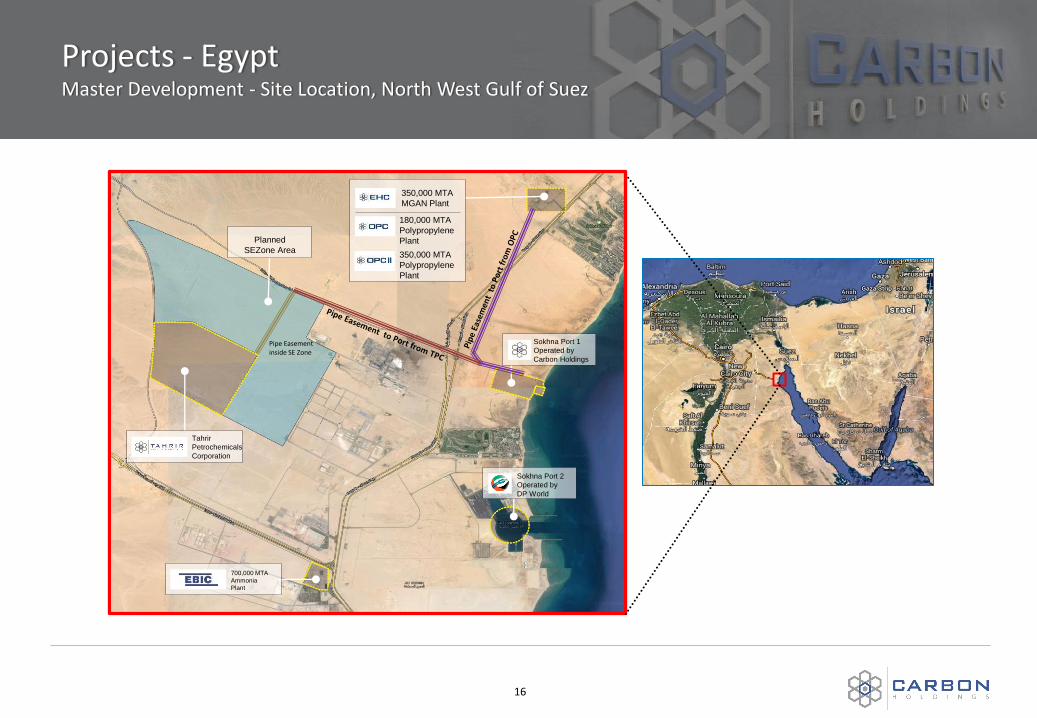
Projects - Egypt Master Development - Site Location, North West Gulf of Suez
16
Tahrir
Petrochemicals
Corporation
Sokhna Port 1
Operated by
Carbon Holdings
Sokhna Port 2
Operated by
DP World
700,000 MTA
Ammonia
Plant
350,000 MTA
MGAN Plant
180,000 MTA
Polypropylene
Plant Planned
SEZone Area
Pipe Easement inside SE Zone
350,000 MTA
Polypropylene
Plant
II

Projects - Egypt Synopsis of Tahrir Petrochemicals Corporation
17
Products
1,350,000 MTA Polyethylene 880,000 MTA Propylene 350,000 MTA Polypropylene 250,000 MTA Butadiene 350,000 MTA Benzene 150,000 MTA Gas Oil 100,000 MTA Hexene-1
Status
Loan package under negotiation with Export Credit Agencies (‘ECAs’) Board approval received for US$ 400m loan from the Overseas Petroleum Investment Corporation (‘OPIC’)
Project Cost (approx.)
US$ 7 Billion
Location Suez, Egypt
SNAPSHOT COMMERCIAL STRUCTURE
xc

The Project Configuration Inclusive of Polypropylene Integration
18
Naphtha 3,900 KTA
C5
Butadiene 250 KTA
HDPE 450 KTA
LLDPE/HDPE (Swing) 450 KTA
CRACKER UNIT
C4
Hexene-1 83 KTA
POLYOLEFINS
COMPLEX
LLDPE/HDPE (Swing) 450 KTA
Hexene** 17 KTA
Benzene 350 KTA
PFO/PGO*
Propylene 880 KTA
Ethylene 1,500 KTA
Polypropylene 180 KTA
180 KTA
(Propylene)
*Sent to OSBL as fuel for power generation **17 KTA will be utilized by the PE Facilities Products for export and local sales
STRICTLY CONFIDENTIAL
Polypropylene 350 KTA
350 KTA
(Propylene)

Tahrir Petrochemicals Corporation Economic impact
19
The Project shall have a total capitalized cost of approximately US$7 billion.
The Project will purchase approximately US$ 1.5 billion of goods and services from Egypt during the construction phase
Approximately 20,000 persons will be employed during its peak construction phase
It is anticipated that in excess of 15,000 indirect jobs will be created during the construction phase
The Project will employ approximately 3,000 engineers and technicians during its operational phase
It is anticipated that in excess of 25,000 indirect jobs will be created during the operational phase
The project shall increase total Egyptian exports by approximately 35%
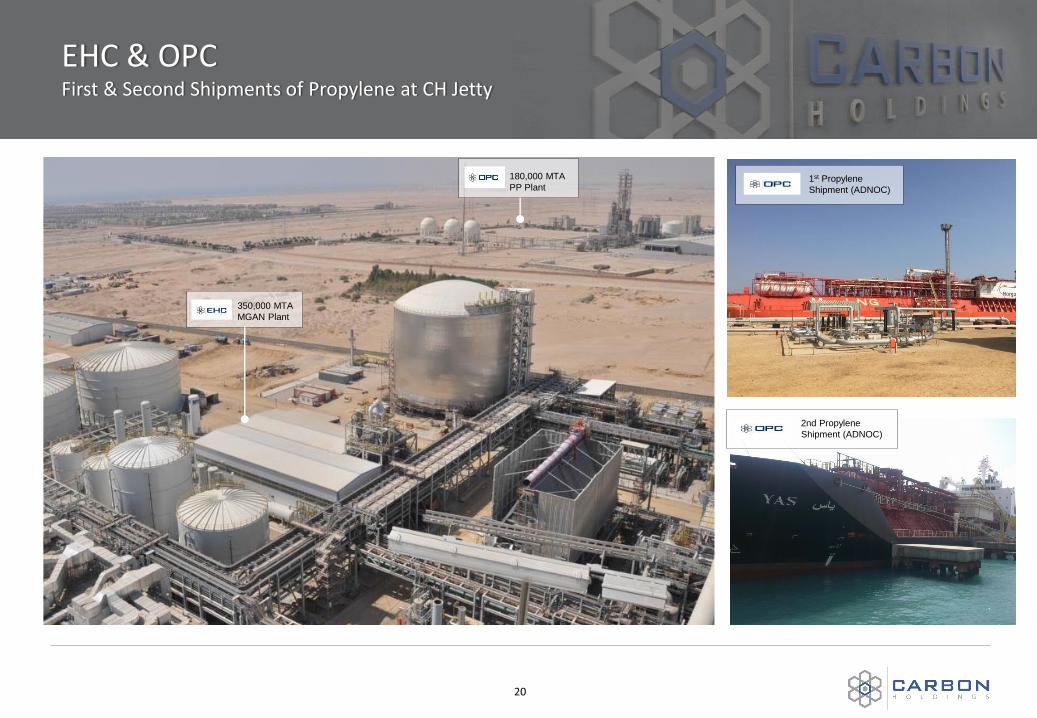
EHC & OPC First & Second Shipments of Propylene at CH Jetty
20
350,000 MTA
MGAN Plant
180,000 MTA
PP Plant 1st Propylene
Shipment (ADNOC)
2nd Propylene
Shipment (ADNOC)