Embed Size (px)
Citation preview

Free University of Brussels
Egypt in an Arab-African-Sandwich:
Are GAFTA and COMESA to be implemented?
Tamer Afifi
Conference on Middle East and North African Economies: Past Perspectives and Future Challenges
Brussels
June 2005

2
Abstract This paper deals with two debated Regional Trade Agreements (RTAs) signed by Egypt, namely, the Greater Arab Free Trade Area (GAFTA) and the Common Market for Eastern and Southern Africa (COMESA). Since Egypt was motivated by political rather than economic reasons while signing the two agreements and many argue that the implementation is behind schedule, the main objectives of the paper are to assess the economic potential of the two RTAs, to run a comparison between them and to detect the possible reasons behind weak/delayed implementation.

3
1. Introduction
Besides Egypt’s membership (1995) in the World Trade Organization (WTO), it is involved in several Regional Trade Agreements (RTAs). The eagerness to sign RTAs has manifested itself not only in various proposals for bilateral cooperation, but also -and more importantly- in efforts to join other larger trading blocs both within the region and outside it. This paper focuses on two important and highly debated RTAs that Egypt signed, namely, the Greater Arab Free Trade Area (GAFTA) and the Common Market for Eastern and Southern Africa (COMESA). While GAFTA’s aim is the creation of a Free Trade Area (FTA) among its member countries, COMESA is planning to take the form of a customs union (was originally planned for 2004) as a phase leading to an economic and monetary union by the year 2025. Since Egypt, like many countries do, signed the two agreements based on political rather than economic motivations and it is argued that the implementation seems to be behind schedule in different aspects, the main objectives of the paper are firstly, to detect the economic potential of the signed RTAs, i.e. whether they are trade creating or trade diverting, secondly, to run a comparison between both of them, thirdly, to find out the possible reasons behind the gap between implementation plans and actual implementation, and finally, to identify the proper ways that would help implement the agreements. The methodology used in the paper is based on Revealed Comparative Advantage (RCA) calculations for the member countries of both agreements and the trade creation/diversion criteria set by Salvatore (1983). Moreover, the methodology relies on interviews with government officials in the Egyptian ministries concerned with the agreements, in addition to local producers, importers and exporters in the Egyptian market. The paper does not argue that it is impossible to create a sound economic integration between Egypt and its Arab and African neighbor countries, but it sets economic and institutional conditions for achieving that purpose.
2. Gaps in implementing GAFTA and COMESA
It would be of great importance to compare the plans on the agenda of both RTAs with the real implementation, in order to focus on the shortcomings and find out the reasons behind this delay/lack of implementation. In the following, the two agreements are demonstrated separately.
2.1. The Greater Arab Free Trade Area (GAFTA) The Greater Arab Free Trade Area (GAFTA) is an outcome of the declaration made by the Heads of Arab States, in the Cairo 1996 Arab Summit, adopting the executive program of the 1981 Agreement on the Facilitation and Development of Trade with the target of launching a FTA among member Arab countries in the year 2007. The executive program was approved by the Economic and Social Council (ESC) of the Arab League in 1997. The initiation of reaching a FTA was an attempt to overcome the negative aspects of the Agreement on the Facilitation and Development of Trade which lacked precision, fixed dates and clear targets. Moreover, the positive list approach of liberalization was quite limited. Although it was planned at the beginning to reduce the tariffs with 10 percent on yearly basis to reach a FTA in 10 years (ending in 31/12/2007), the ESC decided in

4
2001 to accelerate the implementation period to reach zero-percent tariffs on 01/01/2005. This decision was based on the recommendation of the Arab Summit in Amman 2001. Out of the 22 Arab countries, 17 countries joined GAFTA; these are Bahrain, Egypt, Iraq, Jordan, Kuwait, Lebanon, Libya, Morocco, Oman, Palestine, Qatar, Saudi Arabia, Sudan, Syria, Tunisia, United Arab Emirates and Yemen. It is open for the remaining 5 countries to join as well. GAFTA is a framework solely concerned with the liberalization of trade in goods. It is supposed to cover all merchandise trade (agricultural and animal products; mineral and non-mineral ores; semi-finished goods; goods produced by Arab joint ventures; finished goods to be agreed upon in accordance with lists approved by the ESC). Other aspects of economic cooperation are being followed under different legal frameworks than GAFTA, but are also supervised by the ESC. 2.1.1. What is the implementation status of GAFTA so far? 2.1.1.1. Elimination of tariffs and negative lists Although reaching the zero-tariff status was a final target of GAFTA, member countries are allowed to draw up a list of exceptions (negative list for a specified period of a maximum of 3 years)1. In 1998 the total number of goods asked to be exempted reached 832 commodities out of a total of 6000 commodities (representing 14 percent of the total)2. Six Arab countries (Egypt– Jordan– Lebanon – Morocco – Syria – Tunisia) submitted lists of exempted goods; table (1) shows the number of products asked to be exempted by the six countries. In the year 2000, the ESC decided to eliminate those exceptions by September 2002 after an extension from February 2001. In 2003, five member countries submitted notifications of the elimination of those negative lists. As a sixth country, Egypt submitted its notification in October 2003. However, it tied its elimination of the negative list to finalizing the Protocol on Detailed Rules of Origin of GAFTA. This implies that Egypt did in fact not cancel its negative list, since the agreement on detailed rules of origin is still in a frozen status as will be seen later in this paper. The Egyptian Government’s ‘excuse’ was its need to ensure protection to strategic industries, such as textiles and automobiles, against non-Arab production. Such protection cannot take place without a proper system of rules of origin. Hence, Egypt can still keep its applied tariff rates on the imports of those goods. Therefore, Jordan and some Gulf States have threatened to reciprocate against the treatment of selected Egyptian exports due to this unilateral action, especially that the ESC decision on the elimination of exemption did not link between the implementation of the tariff reductions and reaching a conclusion on detailed rules of origin.
1�The exceptions follow certain conditions including: 1) The commodity should be produced by the country asking for
exception and should have a similar product produced in one of the other member countries. 2) The exception is granted for a specific period not exceeding 4 years. 3) The total percentage of exempted products should not exceed 15 percent of the total exports of the concerned country to other members and 4) Member countries negatively affected by the exemption have the right for a counter exemption. 2 There might be an overestimation in this figure, since common goods may be included in the lists of different countries.�

5
Table (1) Number of exempted goods within GAFTA
Country No. of Exempted tariff lines
Egypt 616 Jordan 35
Lebanon 115 Morocco 898
Syria 267 Tunisia 156
Source: Unified Arab Economic Report 2003. As for agricultural products, they were in principle subject to progressive reductions to reach full liberalization after 10 years. Nonetheless, practical experience proved the difficulty of immediate full liberalization of Arab agricultural trade as agricultural production constitutes a great share (percentage) of total production in all Arab countries. Thus member states were not able to implement such immediate full liberalization of agricultural trade. To overcome such obstacles facing the implementation of the Agreement on the Facilitation and Development of Trade, the executive program (Greater Arab Free Trade Area Agreement) applied two major principles concerning liberalization of trade in agricultural goods: • Gradual reduction of customs duties and other taxes of similar effect to be fully liberalized after
ten years. • Implementation of production season (Agricultural Products Group or the so called Farmer's
Almanac) in which a number of agricultural goods shall not be subject to reductions. These rules should have expired by the ending date of the transitional period. However, a decision by ESC in 2001 was undertaken to limit the transitional period to 35 months instead of 46 months to be in line with the new date of full implementation of the agreement in 2005 instead of 2007. 2.1.1.2. Time plan and transitional periods The elimination of tariffs was initially agreed upon to take the form of a 10 percent annual tariff cut to reach zero-tariffs on 01/01/2007. The schedule was then amended so that the last two tariff cuts will be 20 percent instead of 10 percent to accelerate the full implementation to end by the beginning of 2005. The last reduction phase was due on 01/01/2005. Apart from the negative lists and the Farmer's Almanac, all members currently applied the agreed reductions -officially-, which means that the exchanged goods -given that they are accompanied by a certificate of origin satisfying the current 40 percent national value added rule3- should enter duty free. 2.1.1.3 Non-Tariff Barriers and Trade Remedies The executive program of GAFTA calls for the application of international rules regarding subsidies, countervailing measures, safeguards, and anti-dumping measures. However, the program does not explicitly refer to the WTO agreements despite the fact that 11 GAFTA countries are already members of the organization.
3�This point will be covered in detail in an upcoming subsection.

6
2.1.1.4. Concept of originating products and Rules of Origin For enjoying the preferential treatment provided by GAFTA, a good should comply with the rules of origin determined in the Agreement on the Facilitation and Development of Trade. The general rules of origin introduced by GAFTA indicate that the value added within the boundaries of one or more member countries should be no less than 40 percent of the final ex-factory price of the goods and this percentage can be lowered to 20 percent in case of joint Arab production. The 40 percent value added rule is a general rule and is supposed to be a temporary one till detailed rules of origin are agreed upon. In fact, the negotiations on a detailed protocol on the rules of origin of GAFTA are subject to a series of difficulties and frictions; while some member countries4 try to impose flexible rules of origin, others5 endeavor more strict rules of origin to safeguard their national industries against the competition of non-Arab products. In practice, the process of approving and ratification of the certificates of origin in the importing countries’ embassies have acted as a Non-Tariff-Barrier (NTB). The ESC has issued a decision in 2002 concerning the need to set an end for this approval process. The Minister of Finance in Egypt issued Decree No. 1858 on 30/12/2004 to call off the requirement of ratifying the certificates in Egyptian embassies abroad. 2.1.1.5. Customs According to GAFTA, member countries shall hold negotiations with the aim of imposing uniform and appropriate minimum customs duties, taxes and restrictions of a similar effect on goods imported from non-Arab countries, which are competitive with or alternative to Arab goods. Nevertheless, the meetings of the Customs Union Committee are largely perceived as quite ineffective and rhetoric, since the gap in the tariff structures of Arab countries is almost impossible to bridge in the near future. For example, in addition to the Gulf Cooperation Council (GCC) Customs Union, there is another draft treaty on a Unified Customs Law under the Economic Union Council which comprises 9 Arab countries. This draft has never been adopted.
2.1.1.6. Beyond-the-border measures (trade-related domestic regulations) GAFTA does not include any specific rules on the application of measures related to Sanitary and Phytosanitary (SPS) measures, Technical Barriers to Trade (TBT), Non-Tariff-Barriers (NTBs), Labor Standards, or Environmental Standards. While there is a working party that has been established to prepare studies and reports on NTBs, the work of the former has been largely limited to the inspection of NTBs related to border measures, such as the fees of documentation and inspection. Several trade frictions and disputes have occurred among member countries and most of them have been related to SPS and/or TBT measures. The lack of such rules within GAFTA has proved to be a major loophole for proper implementation and it seems that member countries prefer to resolve those
4�These member countries are mainly those who lack a sophisticated base of manufacturing industries, such as the Gulf
Cooperation Council (GCC) members and Jordan. 5�These member countries are mainly those who have a more developed and diversified base of manufacturing
industries, such as Egypt, Syria, Morocco and Tunisia.

7
disputes through bilateral consultations or unilateral retaliations due to the lack of a proper and comprehensive dispute settlement mechanism6. 2.1.1.7. Competition Policy and Competition Law Although there is no specific article in GAFTA on competition law, the former calls for the harmonization of common competition policy. Only four GAFTA members have a competition law (Egypt, Jordan, Morocco and Tunisia). Further more, GAFTA calls for consultations among members over harmonization of trade systems, legislations and policies. However, there was no identified period for such consultations. 2.1.1.8. Intellectual Property Rights (IPR), Government Procurement, Conformity Assessment and Standardization The GAFTA agreement states that member countries shall consult over protection of intellectual property rights. It also calls the members for determining a preferential treatment for Arab goods vis-à-vis competitive or alternative non-Arab goods. One other important consultation shall be devoted to the government procurements. In practice, none of such consultations have started yet. In addition, the executive program of GAFTA states that member countries shall consult over harmonization of trade systems, legislations and policies. Furthermore, the Arab Agency for the Harmonization of Standards7 has prepared several drafts on the unification of standards and codes, but the draft has never been considered for adoption due to the objections of several members. 2.1.1.9 Dispute Settlement Due to the rising number of appeals that the ESC receives regarding the reluctance of some member countries to apply the agreed upon reductions on tariffs and regarding the problems related to the certificate of origin, the ESC has embarked in 2003 on setting a clear executive decree for the dispute settlement system. In 2004 the ESC has approved this executive decree. However, this system is still not adopted and even the list of judges is still incomplete.
2.1.1.10. GAFTA conflicting with Arab bilateral agreements The relationship between GAFTA and the Egyptian-Arab bilateral agreements is unclear and causes a number of disputes; for instance, the agricultural products group agreed upon under the auspices of GAFTA is not completely in line with the negative list adopted in some bilateral agreements. According to the ESC latest decision (September 2004), all such products listed in the agricultural products group and negative lists should have been eliminated by the beginning of 2005, which did not take place till now. In many cases, Egypt chooses between applying the rules of GAFTA and the rules of the bilateral agreements according to the ‘wish’ of the exporters. In the cases of disputes the Egyptian authorities usually prefer to be dealing with them under the auspices of bilateral agreements rather than GAFTA. The main reason is that bilateral agreements have regular committee meetings where problems can be discussed and solved, whereas in the case of GAFTA a comprehensive dispute settlement mechanism is still missing as mentioned above.
6�See subsection 2.1.1.9
7�An agency operating under the supervision of the Council of the Ministers of Industry

8
2.2. The Common Market for Eastern & Southern Africa (COMESA) The Common Market for Eastern and Southern Africa (COMESA) was established in 1994 as a strengthened successor to the Preferential Trade Area for Eastern and Southern Africa founded in 1981 and had envisaged the establishment of a Common Market and a Monetary Union in the future. Presently, COMESA includes the following 19 members: Angola – Burundi – Comoros Islands –Democratic R. Congo – Djibouti – Egypt– Eritrea –Ethiopia – Kenya– Madagascar – Malawi – Mauritius – Rwanda – Seychelles – Sudan – Swaziland – Uganda – Zambia – Zimbabwe. COMESA is supposed to cover agricultural and animal products; mineral and non-mineral ores; and manufactured goods. 2.2.1. What is the implementation status of COMESA so far? 2.2.1.1. Elimination of tariffs and negative lists The original date set by the Preferential Trade Area for Eastern and Southern Africa for attaining the FTA and completely eliminating the tariffs was the 30th of September 1992. But due to the concern about loss of government revenue, the target date for the FTA was postponed to the 31st of October 2000 by the Heads of States and Governments at their Summit held in 1992; they adopted a new program for the gradual reduction of tariffs applied to all commodities that was supposed to reach zero-tariff rates by 2000. Table (2) elaborates this schedule of tariff cuts.
Table 2: Schedule of tariff cuts under the COMESA FTA
31 October 1993
31 October 1994
31 October 1996
31 October 1998
31 October 2000
60 percent 70 percent 80 percent 90 percent 100 percent Source: Ministry of Foreign Trade, Cairo
When Egypt signed COMESA in 1998 and then the agreement entered into force in 1999, its initial tariff rate reduction was 80 percent. On the 31st of October 2000, the 100 percent tariff reduction was achieved by nine member countries. These countries are Djibouti, Egypt, Kenya, Madagascar, Malawi, Mauritius, Sudan, Zambia and Zimbabwe. This nine countries FTA has not only cancelled customs tariffs amongst its members, but has also involved the relaxation of several quantitative restrictions and other NTBs. Other members apply different levels of reductions on reciprocal basis; Burundi, Comoros Islands and Eritrea have achieved an 80 percent reduction on tariffs with expected further reductions to reach the 100 percent level. The Democratic Republic of Congo approved in its 12th cabinet meeting a tariff reduction of 70 percent, but it requested to conduct a research to assess the impact of losing customs income on the national budget. Thus it has not yet implemented the 70 percent reduction. Ethiopia currently applies a 10 percent reduction and it is assessing the possible effect of further reductions on the national economy. Swaziland is currently consulting the South African Customs Union (SACU) to comply with their obligations of tariff reductions. Rwanda applies 80 percent tariff reductions since 2001 and was assumed to achieve the agreed upon reductions in 2004. However, this reduction has not yet taken place. Seychelles undertook a decision to apply a 100 percent tariff reduction as of June 1st 2001, but has not implemented this reduction up to date. Uganda also requested that a compensatory mechanism for reduction of tariff revenue be finalized and that safeguard measures softening the impact of a sudden surge in imports be implemented.

9
In general terms, COMESA members that are in the nine countries FTA trade on a duty-free basis on all trade among themselves; members not in the FTA are granted trade preferences by the FTA member countries on the basis of the tariff reduction they have attained; and members that have not applied the minimum tariff reduction of 60 percent are neither granted any preferential rate by the FTA members nor by those that have reduced tariffs by the 60 percent tariff reduction rate. Although COMESA does not refer to any possible prior exemptions or the right of member states to include negative lists, some members apply exemptions to some tariff lines with prior notifications. Textiles and yarns are a typical example in the Egyptian case. Gradual removal of the exempted tariff lines is constantly taking place where members are annually submitting notifications of the removal of exemptions; several documents and proceedings of ministerial meetings include indications of the suspension/extension of exemptions (e.g. by Sudan, Egypt, and Kenya) concerning certain tariff lines. Apart from a few exceptions, all Egyptian exports enjoy duty free access in the nine countries of the FTA. An example where this rule is violated is the case of Sudan; the latter has a negative list of 58 items not allowed to be imported from Egypt unless the full amount of tariff duties is paid. This list has been applied since 23/5/2001. On 20/7/2003, and based on Egyptian requests, Sudan reconsidered the negative list by reducing the tariffs by 30 percent for 12 out of the 58 items.
2.2.1.2. Non-Tariff Barriers and Trade Remedies Until the end of 2001, COMESA FTA did not have proper trade remedy provisions (anti-dumping, countervailing measures, injury to industry, etc) and members were given a free hand to devise their own measures to counter what they considered to be major market disruptions. Thus, for example, when faced with the surge of imports coming from Egypt in a number of products, Mauritius and Kenya had bilateral talks with the Egyptian Authorities to ‘re-introduce’ duties on the entrance of these products. Sudan also applies unilateral exemptions of some imports from Egypt. The latter had in turn bilateral talks with Kenya to stop the surge of Kenyan tea imports. As can be seen, the conflicts and disputes that erupted so far have been resolved through bilateral consultations; although such unilateral measures imply flexibility, their abuse can frustrate trade. The Twelfth Meeting of the Council of Ministers in Lusaka, Zambia, on the 30th of November 2001, adopted Trade Remedy Regulations for invocation of safeguards, anti-dumping, subsidies and countervailing measures. Work is on-going through a Working Group of Experts to elaborate the regional safeguards and trade remedies, as is the case at the WTO, especially with regard to investigation and verification procedures.
2.2.1.3. Concept of originating products and Rules of Origin Despite the detailed Protocol on the Rules of Origin in COMESA, there have been many claims of incidents of fraud in origin certificates (particularly on the part of Egypt). The issue remains to be a constant item on the agenda of ministerial meetings. It is also worth mentioning that there is a long list of exemptions from those rules of origin where members are allowed to apply different rules of origin to some goods of economic importance (around 145 goods). On casual basis, these procedures are usually undertaken and reviewed under the ministerial meetings.
10
2.2.1.4. Trade Facilitation In order to reduce the cumbersome, time-consuming and costly procedures that are faced by the business community in the conduct of international trade, COMESA has adopted and is implementing a number of measures on the simplification and harmonization of trade documents and customs procedures. In this regard, the member countries acceded to the International Convention on the Simplification and Harmonization of Customs Procedures. The Convention provides a modern basis for customs administration. But these procedures have not yet been fully implemented by the members. 2.2.1.5. Dispute Settlement The COMESA Court of Justice was intended to establish COMESA as a rules-based institution, with rules which can be enforced through a Court of Law. The latter arbitrates on unfair trade practices and ensures that member countries uniformly implement and comply with agreed decisions. So far, most disputes have been handled through bilateral consultations and discussions of ministerial meetings while very few cases have been brought forward to the Court. No details are available on those disputes implying non-transparency.
2.2.1.6. Customs Negotiations on the modalities and the framework for application of a Customs Union (CU) with a Common External Tariff (CET) for all the member countries of COMESA are still in their early stages; it was initially planned for the CU to take place on 2004 (4 years after the FTA entry into force). Nonetheless, such a timetable has proven to be quite unrealistic, especially that not all member countries are included in the FTA formed so far. The road to the CU is a totally different one. Not only does it imply a much higher sense of discipline, but its establishment raises several important challenges for member countries. The most important of these challenges is to reach a compromise concerning CET. 2.2.1.7. Beyond-the-border measures (trade-related domestic regulations) Concerning the SPS measures, the Members of COMESA agreed on detailed provisions set in the treaty. However, none of the measures can be recognized as implemented. There is almost no information on the progress of implementing these far reaching commitments and their relevant domestic adjustments. And to date, there is no information that any of the member countries has undertaken major changes or modifications to its domestic regulations in these areas to adjust to COMESA obligations. 2.2.1.8. Competition Policy and Competition Law A quite comprehensive and clear draft for a COMESA Competition Law that establishes a common competition authority has been worked on. However, the possibility of implementing this draft is questionable, due to the discrepancy in the legal, political and economic systems existing in the member countries.

11
2.2.1.9. Intellectual Property Rights (IPR) and Government Procurement There is no article or provision in COMESA that deals with IPR and no cooperation or harmonization has occurred to date. As for the public procurement reform initiative in COMESA, its main goal is promoting good governance through transparency and accountability in public procurement. The only considerable effort in this respect -even though still in an early stage- is the initiation of an intra-COMESA online database for procurement and the establishment of a review mechanism for transparency in practices and undertakings. The implementation of both is still in early stages.
2.2.1.10. Trade in services The member countries of COMESA agreed to adopt, individually, at bilateral or regional levels the necessary measures to achieve a progressive free movement of persons, labor and services and to ensure the enjoyment of the right of establishment and residence by their citizens within the Common Market. However, no negotiations on any modalities or legal frameworks for the liberalization of trade in services took place to date. 2.3. GAFTA and COMESA on one hand As can be noticed above, both agreements lack a proper/complete implementation in different aspects, where GAFTA is the severer case. Therefore, it could be useful to compare both agreements on one hand with a third agreement that Egypt is also part of on the other, and where the implementation plans comply to a greater extent with the actual implementation. Furthermore, it could be interesting to detect the reasons behind the relative success of this agreement in opposition to the partial malfunctioning of the two others focused on in this paper. This agreement is the European-Mediterranean Agreement (also called Euro-Med agreement); after 20 years of increasingly intensive bilateral trade and development cooperation between the European Union (EU) and its Mediterranean Partners, the Conference of EU and Mediterranean Foreign Ministers in Barcelona (27-28 November 1995) marked the start into a new "partnership" phase of the relationship including bilateral and multilateral or regional cooperation (hence, called Barcelona Process or, in general, Euro-Mediterranean Partnership)8. Egypt is one of the Mediterranean countries involved in the agreement. For now, Egypt is connected with the EU in a Partnership Agreement and by the year 2010, a FTA between all the member countries of the Euro-Med agreement is supposed to take place. To make the Barcelona Process attainable, a need was seen to intensify a “South-South” co-operation within the Mediterranean partners, starting -where appropriate- on a sub regional basis. Each partner’s willingness to build good relationships with its neighbors is an important determinant of its readiness to move closer to the goal of close cooperation and integration with the EU. Based on this fact, in May 2001, an initiative was launched between four Arab Mediterranean countries that are part of the Euro-Med partnership agreement (Egypt, Jordan, Morocco and Tunisia). This initiative ended up with signing the Aghadir Agreement that is supposed to reach a FTA between the four Arab countries by the year 2006, based on a certain schedule for tariff reductions.
8�The original EU countries of Euro-Med agreement are Austria, Belgium, Denmark, Finland, France, Germany,
Greece, Ireland, Italy, Luxembourg, Netherlands, Portugal, Spain, Sweden and United Kingdom. The new EU countries after the recent enlargement are Cyprus, Czech Republic, Estonia, Hungary, Latvia, Lithuania, Malta, Poland, Slovakia and Slovenia. The Mediterranean countries of the agreement are Algeria, Egypt, Israel, Jordan, Lebanon, Morocco, Palestine, Syria, Tunisia and Turkey.

12
So far, the Partnership Agreement proved to be successful, at least, from the politicians’ point of view. They believe that the agreement is moving on the right track, is promising and carries a good potential for both sides. The tariff reductions have taken place according to schedule. As for the Aghadir agreement, it has not yet entered into force, since Jordan and Morocco have not ratified the agreement. Egypt and Tunisia did that in 2004. This implies that the Aghadir schedule of tariff reductions is irrelevant, especially that GAFTA has surpassed Aghadir and hence the zero tariff target among Agahdir members was achieved under the GAFTA before Agahdir. The logical question would be: Why is the Euro-Med case the most successful case? Could this success really be referred to a high pure economic potential of Euro-Med in comparison with GAFTA and COMESA? In order to answer this question, the argument that Salvatore (1983)9 set, based on trade creation and trade diversion of RTAs, can be considered.
3. The expected effects of forming a FTA The static effects of forming a FTA are measured in terms of trade creation and trade diversion. Trade creation takes place when part of the domestic production in a country which is a member of the FTA is replaced by lower-cost imports from a member country in the same FTA. This is supposed to increase the welfare of member countries, since it leads to greater specialization in production based on comparative advantage. A trade-creating FTA would also increase the welfare of non-member countries, as some of the increase in the real income of the FTA (as a result of greater specialization in production) can spill over into an increased volume of overall imports from the rest of the world. Trade diversion takes place when lower-cost imports from outside the FTA get replaced by higher cost imports from an FTA member. This may result due to the preferential trade treatment given to member nations of the agreement. In that case, welfare is reduced, since trade diversion shifts production from more efficient producers outside the FTA to relatively less efficient producers inside it. Hence, trade diversion negatively affects the international allocation of resources and accordingly shifts production away from comparative advantage. This could be regarded as a good example of the theory of the second best (Lipsey, 1956), which states that ‘if all the conditions required to maximize welfare cannot be satisfied, trying to satisfy as many of these conditions as possible does not necessarily (rather usually) lead to the second-best position’. Hence, forming a FTA and removing trade barriers only among the members might not always lead to the second-best situation, due to the fact that welfare could rise or fall. A FTA is more likely to lead to trade creation and increased welfare under the following conditions:
1. The more competitive -rather than complementary- the economies of the member
countries, the greater are the opportunities for specialization in production and trade creation with the formation of the FTA. Thus, the latter is more likely to increase welfare if formed by countries with similar production and export structures.
2. The greater the pre-FTA trade and economic relationship among potential members of the agreement, the greater would be the opportunities for welfare gains after forming the FTA.
9�Salvatore’s work was to a certain extent based on Viner’s arguments (1950).

13
3. The shorter the geographic distance between the member countries of one FTA, the less of an obstacle to trade creation among members would the transportation costs represent.
4. The greater the size of the FTA, i.e. the number of countries forming it, the greater would be the probability that low-cost producers are part of the agreement, leading in turn to more trade creation.
5. The higher the pre-FTA trade barriers between member countries, the greater is the probability that its formation will pay off and be rather trade-creating for the members.
6. The lower the FTA’s barriers on trade with the rest of the world, the less likely will the formation of the FTA lead to trade diversion.
For example, the reasons why the success in the case of the EU was greater than in the case of the European Free Trade Association (EFTA) could be referred to the fact that the countries forming the EU were much more competitive than complementary, closer geographically, and had greater pre-union trade than the EFTA countries. There are some other complementary static welfare effects resulting from the formation of a FTA; a trade-diverting customs union, by reducing its trade flows with the rest of the world, is likely to lead to an improvement in the collective terms of trade of the member countries. Nevertheless, the opposite is likely to occur for a trade-creating FTA, as part of the increase in real income resulting from formation of the FTA can lead to a larger demand for imports from nonmember countries. Moreover, any FTA that acts as a single unit in international trade negotiations is likely to have much more bargaining power than each member separately. In this paper, the sixth criterion concerning the barriers on trade with the rest of the world is hard to assess, since not all of the agreements have been implemented yet and it is not possible to predict the barriers that will exist in case they would be fully implemented. In the following, the five other criteria will be covered. 1. The production and export structures of the member countries In order to assess whether the production and export structures of the countries included in each agreement are similar (rather competitive economies) to the production and export structure of Egypt, the Revealed Comparative Advantage (RCA) measure is used, such that:
RCA = (Xij/Xwj) (�Xi/�Xw)
where Xij/Xwj = the ratio of country i’s exports of commodity j to the world’s exports of the same commodity, and �Xi/�Xw = the ratio of country i’s total exports to the world’s total exports. The data used are the current dollar value of imports in the year 2000, per commodity and country of origin as reported by each importing country, for 240 commodities in the Standard International Trade Classification revision 2 (SITC rev 2). Imports are expressed in most cases using the Cost, Insurance and Freight (CIF) value. These import values may differ from those concerning the same trade flow (same year, product, country of origin

14
and country of destination) as registered by the exporting country, which are often measured using the Free On Board (FOB) definition (Trade CAN 2002)10. The RCA is calculated for a list of goods in Egypt and in each separate country and a comparison is run. If RCA is greater than 1 then this means that a country has a revealed comparative advantage in producing/exporting this good (specialization). If RCA is less than 1 the country does not have a revealed comparative advantage in producing/exporting this good (revealed comparative disadvantage or under-specialization) (Richardson 1999).
Using this criterion, the goods where Egypt and all other countries of the RTAs have a comparative advantage are obtained and compared together, in order to detect the number of common goods where both Egypt and each separate country have a comparative advantage (Table A of Appendix). Then the mean and median11 of these numbers are calculated and compared with the number of common goods where each separate country and Egypt have comparative advantage. The countries where this number is greater than the mean (median) are considered relatively trade-creating with Egypt as compared to countries where this number is lower than the mean (median). As a next step, for each RTA the percentage of potentially trade-creating countries with Egypt to the total number of countries of the RTA is calculated. By comparing the latter percentage between the different RTAs it can be indicated which one of the latter can be considered trade creating relative to the other(s). The mean and the median calculated are both around 12 goods, as can be seen from the same table and the results for each separate RTA are shown in table (3). For GAFTA, in 5 out of 15 countries (around 33.3 percent of the countries), the number of goods where both Egypt and each concerned country have comparative advantage exceeds 12. For COMESA, this occurs in 5 out of 17 countries (around 29.4 percent of the countries). In Aghadir, the three countries (100 percent of the countries) fulfill this condition and finally 23 out of the 32 Euro-Med partner countries (around 71.9 percent of the countries) exceed this benchmark. Hence, Aghadir takes the first rank in relative potential trade creation with Egypt, Euro-Med the second, GAFTA the third followed by COMESA at the end.
10 Due to the lack of detailed data and information about Palestine’s and Swaziland’s disaggregated exports, the latter are excluded here. Furthermore, in the Trade CAN data of 2002, Belgium and Luxembourg are merged as one country. This makes Egypt’s available partner countries in GAFTA 15, in COMESA 17 and in Euro-Med 32 for this part of analysis. 11 The median as a benchmark is more accurate in this case, since it divides the number of countries into two equal numbers and would not be biased to higher values as the mean could be.

15
Table (3) Countries having RCA in more than 12 common goods with Egypt
GAFTA COMESA EURO-MED AGHADIR
Jordan (14)
Djibouti (14)
Austria (13) Jordan (14)
Lebanon (22)
Eritrea (15)
Belgium & Luxembourg (20)
Morocco (21)
Morocco (21)
Kenya (15)
Cyprus (15) Tunisia (15)
Syria (15)
Madagascar (18)
Czech Republic (17)
Tunisia (15) Zimbabwe (22)
Estonia (14)
France (18) Greece (26) Israel (14) Italy (20)
Jordan (14) Latvia (19)
Lebanon (22) Lithuania (24) Morocco (21)
Netherlands (19) Poland (24)
Portugal (21) Slovakia (21) Slovenia (15)
Spain (23) Syria (15)
Tunisia (15)
Countries having RCA in more than 12 common goods with Egypt (number of goods in brackets)
Turkey (26)
Percentage of these countries to the total number of countries in the agreement
33 percent
29.4 percent
71.9 percent
100 percent
Source: Author’s calculations from Trade CAN 2002
To broaden the analysis, the correlation coefficient between the RCA index (including the 240 goods) of Egypt and each separate country is obtained and compared among the four agreements. But first the RCA has to be adjusted (Symmetric RCA). Otherwise there exists no normality around the unity, since the values greater than one range between 1 and infinity while the values smaller than one range between 0 and 1. The possibility of taking the logarithm of the RCAs exists, but in the case of zero exports the results would not be identified. Therefore the formula introduced by Laursen (1998) is used. It is formulated as follows:

16
Adjusted (Symmetric) RCA: SRCA = RCA – 1 RCA + 1 The SRCA takes the values between -1 and +1, which means that it is normally distributed around the unity and does not give much weight to -and is not biased towards- values above unity. The values below one indicate that there is weak competitiveness (weak revealed comparative advantage), whereas the values above one indicate rather strong competitiveness (strong revealed comparative advantage) in a certain commodity.
Tables (4), (5), (6) and (7) show for each separate agreement the correlation coefficients between the adjusted RCA index of Egypt and that of each country of the agreement. They also demonstrate the average correlation coefficient for each agreement. The results show Aghadir taking the first rank, GAFTA the second, COMESA the third and Euro-Med the fourth.
Table (4) Correlation coefficients between the adjusted RCA index of Egypt and that of each country in
GAFTA
Country Correlation Coefficient Bahrain 0.34337711 Iraq 0.154114233 Jordan 0.364551016 Kuwait 0.2105459 Lebanon 0.416329921 Libya 0.27800894 Morocco 0.432848354 Oman 0.244151777 Qatar 0.156843151 Saudi Arabia 0.194414953 Sudan 0.310145491 Syria 0.572121952 Tunisia 0.406096085 United Arab Emirates 0.37818085 Yemen 0.2128603 Average correlation coefficient 0.311639336
Source: Author’s calculations from Trade CAN 2002

17
Table (5) Correlation coefficients between the adjusted RCA index of Egypt and that of each country in
COMESA
Source: Author’s calculations from Trade CAN 2002
Table (6) Correlation coefficients between the adjusted RCA index of Egypt and that of each country in
Aghadir
Source: Author’s calculations from Trade CAN 2002
Country Correlation Coefficient Angola 0.103257182 Burundi 0.060106733 Comoros 0.052986295 Congo (DR) -0.047581659 Djibouti 0.183636653 Eritrea 0.196278347 Ethiopia 0.248892297 Kenya 0.34848119 Madagascar 0.442442577 Malawi 0.381783395 Mauritius 0.273978033 Rwanda 0.070549843 Seychelles 0.091783655 Sudan 0.310145491 Uganda 0.145594652 Zambia 0.246734443 Zimbabwe 0.430870653 Average correlation coefficient 0.208231752
Country Correlation Coefficient Jordan 0.364551016 Morocco 0.432848354 Tunisia 0.406096085 Average correlation coefficient 0.401165152

18
Table (7) Correlation coefficients between the adjusted RCA index of Egypt and that of each country in
Euro-Med
Country Correlation Coefficient Algeria 0.206499991 Austria -0.045814554 Belgium and Luxembourg 0.084058114 Cyprus 0.337428781 Czech Republic 0.082952444 Denmark -0.009798905 Estonia 0.219323677 Finland -0.159833578 France -0.005649992 Germany -0.184305521 Greece 0.468853585 Hungary 0.103619586 Ireland -0.089240997 Israel 0.202351539 Italy 0.090069157 Jordan 0.364551016 Latvia 0.3327036 Lebanon 0.416329921 Lithuania 0.333974352 Malta 0.129329002 Morocco 0.432848354 Netherlands 0.097530226 Poland 0.22957658 Portugal 0.233538462 Slovakia 0.157544588 Slovenia 0.056521068 Spain 0.116491233 Sweden -0.192495138 Syria 0.572121952 Tunisia 0.406096085 Turkey 0.42939411 United Kingdom -0.111810139 Average correlation coefficient 0.165773706
Source: Author’s calculations from Trade CAN 2002
Again, the mean and median of the adjusted correlation coefficients of all countries in the four agreements are taken as a benchmark for potential trade creation (Table B of Appendix). For each separate agreement, we take the number of countries where the correlation coefficient of their adjusted RCA with Egypt exceeds the median12 as a percentage of the total number of countries of
12 These countries are considered rather trade-creating to Egypt.

19
the same agreement. This percentage is compared among the agreements. As can be seen in table (8), Aghadir takes the first rank for potential trade creation with Egypt. Then come GAFTA, COMESA and Euro-Med in order. We obtain the similar results when taking the mean as a bench mark.
Table (8) Countries that have a RCA correlation coefficient with Egypt exceeding the median
GAFTA
COMESA
EURO-MED
AGHADIR
Bahrain 0.343377 Ethiopia 0.248892 Algeria 0.2065 Jordan 0.364551 Jordan 0.364551 Kenya 0.348481 Cyprus 0.337429 Morocco 0.432848 Kuwait 0.210546 Madagascar 0.442443 Estonia 0.219324 Tunisia 0.406096 Lebanon 0.41633 Malawi 0.381783 Greece 0.468854 Libya 0.278009 Mauritius 0.273978 Israel 0.202352 Morocco 0.432848 Sudan 0.310145 Jordan 0.364551 Oman 0.244152 Zambia 0.246734 Latvia 0.332704 Sudan 0.310145 Zimbabwe 0.430871 Lebanon 0.41633 Syria 0.572122 Lithuania 0.333974 Tunisia 0.406096 Morocco 0.432848 UAE 0.378181 Poland 0.229577 Yemen 0.21286 Portugal 0.233538
Syria 0.572122 Tunisia 0.406096
Turkey 0.429394
Percentage of these countries to the total number of countries in the agreement
80 percent
47 percent
46 percent
100 percent Source: Author’s calculations from Trade CAN 2002
Using the same analysis after transforming the raw RCA results into dummy variables that take the value 1 if RCA is greater than unity and the value zero if RCA is less than unity, we obtain the results shown in tables (9), (10), (11) and (12); they indicate that the average correlation coefficient between the dummy RCA index of Egypt and that of other Aghadir countries is the greatest and the one of the Euro-Med agreement the least. GAFTA and COMESA take the second and third rank respectively. Once again we run the median (mean) analysis, but this time with the dummy variables (Table C of Appendix). From the results shown in table (13) we find out that the same ranks apply when using the median as a benchmark. And using the mean as a benchmark would also give us the same results.

20
Table (9) Correlation coefficients between the dummy RCA index of Egypt and that of each country in
GAFTA
Source: Author’s calculations from Trade CAN 2002
Table (10) Correlation coefficients between the dummy RCA index of Egypt and that of each country in
COMESA
Source: Author’s calculations from Trade CAN 2002
Country Correlation coefficient Bahrain 0.237766253 Iraq 0.129302698 Jordan 0.189664392 Kuwait 0.13896574 Lebanon 0.278573691 Libya 0.197030096 Morocco 0.344794454 Oman 0.09874035 Qatar 0.139099243 Saudi Arabia 0.103884776 Sudan 0.263379506 Syria 0.470743905 Tunisia 0.262932635 United Arab Emirates 0.125300422 Yemen 0.123865339 Average correlation coefficient 0.206936233
Country Correlation coefficient Angola 0.097423741 Burundi 0.042521156 Comoros 0.097321571 Congo (DR) -0.028131291 Djibouti 0.126138421 Eritrea 0.226869092 Ethiopia 0.227353287 Kenya 0.251392214 Madagascar 0.354939809 Malawi 0.277360654 Mauritius 0.237766253 Rwanda 0.039414928 Seychelles 0.171690567 Sudan 0.263379506 Uganda 0.122930377 Zambia 0.19381166 Zimbabwe 0.381359063 Average correlation coefficient 0.181384765

21
Table (11) Correlation coefficients between the dummy RCA index of Egypt and that of each country in
Euro-Med
Country Correlation coefficient Algeria 0.175146742 Austria -0.113481804 Belgium and Luxembourg 0.006752331 Cyprus 0.12731077 Czech Republic -0.005918084 Denmark -0.170114637 Estonia 0.139134302 Finland -0.129372114 France -0.056651271 Germany -0.246459502 Greece 0.257108547 Hungary 0.013535164 Ireland -0.109822472 Israel 0.139134302 Italy 0.006752331 Jordan 0.189664392 Latvia 0.324685212 Lebanon 0.278573691 Lithuania 0.294304601 Malta -0.031499899 Morocco 0.344794454 Netherlands 0.006901373 Poland 0.127706076 Portugal 0.19786956 Slovakia 0.192140819 Slovenia -0.010379652 Spain 0.070455239 Sweden -0.169479343 Syria 0.470743905 Tunisia 0.262932635 Turkey 0.297712848 United Kingdom -0.160358307 Average correlation coefficient 0.084994444
Source: Author’s calculations from Trade CAN 2002

22
Table (12) Correlation coefficients between the dummy RCA index of Egypt and that of each country in
Aghadir
Country Correlation coefficient Jordan 0.189664392 Morocco 0.344794454 Tunisia 0.262932635 Average correlation coefficient 0.26579716
Source: Author’s calculations from Trade CAN 2002
Table (13) Countries that have a dummy RCA correlation coefficient with Egypt exceeding the median
GAFTA
COMESA
EURO-MED
AGHADIR
Bahrain 0.237766 Eritrea 0.226869 Algeria 0.175147 Jordan 0.189664 Iraq 0.129303 Ethiopia 0.227353 Estonia 0.139134 Morocco 0.344794 Jordan 0.189664 Kenya 0.251392 Greece 0.257109 Tunisia 0.262933 Kuwait 0.138966 Madagascar 0.35494 Israel 0.139134 Lebanon 0.278574 Malawi 0.277361 Jordan 0.189664 Libya 0.19703 Mauritius 0.237766 Latvia 0.324685 Morocco 0.344794 Seychelles 0.171691 Lebanon 0.278574 Qatar 0.139099 Sudan 0.26338 Lithuania 0.294305 Sudan 0.26338 Zambia 0.193812 Morocco 0.344794 Syria 0.470744 Zimbabwe 0.381359 Portugal 0.19787 Tunisia 0.262933 Slovakia 0.192141
Syria 0.470744 Tunisia 0.262933 Turkey 0.297713
Percentage of these countries to the total number of countries in the agreement
73 percent
59 percent
44 percent 100 percent Source: Author’s calculations from Trade CAN 2002
Now it is clear that all the methods of analysis give us the same ranks for the four agreements, except for table (2) that is the only table giving the Euro-Med agreement the second rank in relative trade creation with Egypt. However, this high rank could be referred to the fact that many non-original EU countries and many Mediterranean countries (which are also part of GAFTA and Aghadir) are included in the Euro-Med classification; as can be seen in table (14), although 69.5 percent of the potential Euro-Med trade-creating countries are EU countries, only 34.8 percent of

23
them are original EU-countries before enlargement. More than half (56.2 percent) of the EU potential trade-creating countries are non-original EU countries. In general, non-original EU countries and Mediterranean countries represent the lion share (65.2 percent) of the potential trade-creating Euro-Med countries to Egypt. Moreover, the number of goods where the original EU countries have a high comparative advantage in general is high. Hence, the probability of having common competitive goods with Egypt is greater than this occurring between Egypt and African or Arab countries. But the correlation coefficient gives a more accurate picture about the real competitiveness among countries, since it includes the entire 240 commodities subject to the analysis. In any case, GAFTA comes always before COMESA in the ranks.
Table (14) Regional distribution of the Euro-Med potential trade-creating countries for Egypt
Percentage of EU countries to the potential trade-creating Euro-Med countries to Egypt. 69.5 percent
Percentage of original-EU countries to the potential trade-creating Euro-Med countries to Egypt. 34.78 percent
Percentage of new-EU countries to the total EU trade-creating countries to Egypt. 56.25 percent
Percentage of non-original EU countries and Mediterranean countries to the potential trade creating Euro-Med countries to Egypt.
65.2 percent
Source: Author’s calculations from Trade CAN 2002
2. The pre-FTA trade and economic relationship among member countries
The trade flows between the countries of one agreement are an important indicator for trade relations and can give a picture on how successful the FTA can be after it is formed and implemented. We take the total trade flows13 between Egypt and the countries of each agreement in the year 2003 as a measure for the economic relations and compare the results among the four agreements. We also take the average exchange in each agreement as a further indicator. It can be seen from table (15) that the Euro-Med countries are the greatest trade partners of Egypt compared to the countries of all other agreements in total terms and on average. The second rank is occupied by the GAFTA countries. On average, Egypt’s trade with the Aghadir countries is greater than countries of COMESA. But since Aghadir includes only three countries, the trade with the 18 COMESA countries is much greater in total terms. However, the latter’s trade with Egypt is still less than GAFTA and far less than Euro-Med countries.
13 With the trade flows we mean the sum of exports and imports with the partner countries of each agreement.

24
Table (15) Total and average trade flows between Egypt and the countries of the four RTAs
(Trade flows are in USD and for the year 2003)
Source: Author’s calculations from CAPMAS 2004
3. The geographic distance between the member countries Since the countries of each agreement are more or less located in one region, it is not hard to predict the results in advance. There are two kinds of distance measures: simple distances, for which only one city is necessary to calculate international distances; and weighted distances, for which we need data on the principal cities in each country. The simple distances are calculated following the great circle formula, which uses latitudes and longitudes of the most important city (in terms of population) or of the official capital. These two variables incorporate internal distances based on areas provided in the CEPII (2005). The two weighted distance measures use city-level data to assess the geographic distribution of population inside each nation. The idea is to calculate distance between two countries based on bilateral distances between the largest cities of those two countries, those inter-city distances being weighted by the share of the city in the overall country’s population. This procedure can be used in a totally consistent way for both internal and international distances14. And table (16) shows that whether we use the simple or weighted distances, the average distance between countries of GAFTA and Egypt is the least, followed by Aghadir, Euro-Med and COMESA in order. This means that -based on this criterion- GAFTA would be the most trade creating and COMESA the least.
14�The latitudes, longitudes and population data of main agglomerations of all the countries included in the analysis and
calculations of CEPII are available in www.world-gazetteer.com.
Total trade flows with
Egypt Average trade flows
with Egypt
GAFTA
1,621,203,395.22 101,325,212.20
COMESA
318,799,953.12 17,711,108.51
EURO-MED
6,365,789,288.64 187,229,096.72
AGHADIR
249,121,226.83 83,040,408.94

25
Table (16) Distance between Egypt and the countries of the four RTAs
(Distance in kilometers)
Source: Author’s calculations from CEPII 2005
4. The size of the FTAs
This criterion can be considered a complementary one, since if all other criteria are fulfilled, then the size of the FTA should not be a factor of great significance. From the number of countries included in each agreement we can easily predict the Euro-Med to be the most potentially trade-creating agreement. Then comes COMESA followed with a slight difference by GAFTA, and Aghadir comes at last. 5. The pre-FTA trade barriers between member countries The main tangible barrier of trade between countries is the tariffs applied among them. Hence, the higher the tariffs applied between the different countries of one FTA before forming the latter, the greater the potential gains and the more trade creation should be expected. The analysis here is based on firstly taking the simple average of the weighted average tariffs of the different countries of each RTA and comparing the results among the agreements; the higher this simple average, the more likely trade creation should be expected for Egypt after applying a given RTA, since this would mean that Egypt would benefit from a relatively greater access of its goods into the markets of this RTA than in the case of another RTA where the average tariffs of the countries would be low from the beginning. As a second step, this average is weighted by the volume of Egyptian exports to each separate country, since the former reflects the importance of trade relations between Egypt and other countries, particularly, the initial access of Egyptian goods to their markets. Again, the results can be compared among the four agreements. In the results shown in table (17), the Aghadir agreement comes in the first rank, followed by COMESA, GAFTA, and Euro-Med when taking the simple average of the weighted average tariffs in each separate RTA. This could be an indicator for Aghadir being the relatively most trade creating agreement and the Euro-Med the least, regarding this criterion. When weighing the average tariffs of the countries by their respective imports from Egypt and taking the average, the results do not change for the first and fourth rank (Aghadir and Euro-Med respectively). However, COMESA and GAFTA change their ranks. This can be explained by the fact that the trade volume between Egypt
Average distance
(significant cities)
Average distance (capitals)
Weighted average distance
(significant cities)
Weighted average distance (capitals)
GAFTA 1684.427494 1684.427494 1694.028619 1668.399056 COMESA 4131.784 4131.784 4149.804167 4135.768778 EURO-MED 2404.545703 2394.33835 2404.376076 2388.624638 AGHADIR 2061.332067 2061.332067 2055.722833 2045.363233

26
and GAFTA on one hand is greater than the trade volume between Egypt and COMESA on the other (see table 15).
Table (17) Average tariffs of the four agreements
(Figures are in percent and in the year 2002)
GAFTA COMESA EURO-MED AGHADIR Simple average of weighted average tariffs of the agreement 12.0625 12.64375 6.12479 22.3 Weighted average of weighted average tariffs of the agreement 12.1731 8.7717 5.27545 16.84683 Source: Author’s calculations based on data from the Index of Economic Freedom 2005.
Furthermore, the median of the weighted average tariffs of all the countries included in the four agreements in total is calculated (Table D of Appendix), in order to take it as a benchmark for trade creation. In case the weighted average tariff of one separate country is higher than the median, then it can be considered trade-creating to Egypt, relative to other countries whose weighted average tariff falls below the median. The same analysis is applied once again but by using the mean. Table (18) shows the countries of the four RTAs that can be considered rather trade-creating (taking the median as a benchmark) and demonstrates the percentage of rather trade creating countries to the total number of countries in each separate RTA, based on that criterion. Again, Aghadir takes the first rank in potential trade creation, since the percentage of rather trade creating countries to the total number of countries of the agreement is the highest. Also, the Euro-Med takes the last rank as the case before. With a very tiny difference, COMESA and GAFTA take the second and third ranks, respectively. We get similar ranks when applying the same analysis using the mean.

27
Table (18) Countries with a weighted average tariff exceeding the median
(Figures are in percent and in the year 2002)
GAFTA
COMESA
EURO-MED
AGHADIR
Bahrain 7.7 Angola 10 Algeria 15.3 Jordan 11.3 Iraq 5 Burundi 23.5 Hungary 7.5 Morocco 28.2 Jordan 11.3 Comoros 38.9 Jordan 11.3 Tunisia 27.4 Lebanon 8 Congo 15.6 Lebanon 8 Libya 15.9 Djibouti 21 Morocco 28.2 Morocco 28.2 Ethiopia 16.5 Palestine 8.5 Oman 6.7 Kenya 14.4 Slovakia 6.1 Palestine 8.5 Malawi 12.5 Syria 35 Saudi Arabia 10.5 Mauritius 15.8 Tunisia 27.4 Syria 35 Rwanda 6.6 Tunisia 27.4 Seychelles 28.3 Yemen 12.6 Uganda 6.8
Zambia 8.4
Zimbabwe 12
Percentage of these countries to the total number of countries in the agreement
75 percent
82 percent
26 percent
100 percent Source: Author’s calculations based on data from the Index of Economic Freedom 2005.
Other historical and cultural factors Common historical and cultural factors could increase the potential for trade creation among countries. Accordingly, in this section we grasp some of these factors, in order to find out the countries that have the strongest links with Egypt in that concern and to which agreements these countries belong. The detailed figures for the four agreements are presented in Tables E, F, G and H of the Appendix and the results are summarized in table (19); GAFTA occupies the first rank in all these factors. All other agreements vary from one factor to the other. And in all cases, COMESA comes after GAFTA.

28
Table (19) Historical and cultural factors
(Figures are in percent)
Source: Author’s calculations from CEPII 2005
4. What is missing in Egypt as a common country in the four agreements? Now it can be noted that -from a pure theoretical economic and even cultural point of view-, the Euro-Med agreement does not necessarily have the best potential for trade creation-at least for Egypt-, compared to COMESA and GAFTA. The only criterion where the EU proves that it is the most trade creating is the fact that the trade flows of Egypt with the EU are the greatest in total and on average. Other than that, Aghadir and GAFTA take the first ranks. Nevertheless, the implementation process of Euro-Med is working more smoothly and -most importantly- without considerable complaints from either side. And whereas Aghadir takes in most cases the first rank as a trade-creating agreement for Egypt, it has not even entered into force, although the number of countries included in it are few, a factor that should help avoid any discrepancies in points of view or complications in implementation. Furthermore, Aghadir is supposed to be an extension of Euro-Med. However, while the same four countries are working quite successfully as members of the Euro-Med agreement, they cannot agree on a date for the enforcement of their joint agreement. Therefore, it is essential to detect other possible factors making GAFTA, COMESA and Aghadir less advantageous on the implementation basis as compared to Euro-Med. For that purpose, interviews were run with Egyptian government officials in the Customs Authority, Ministry of Foreign Trade and Industry, and the federation of Egyptian Industries on one hand and Egyptian market representatives (producers, importers and exporters) on the other15. The outcomes were quite contradicting and in some cases even shocking; while the majority of the interviewed Egyptian market representatives complained about the complications, bureaucracy, red tape and other obstacles many authorities put on their way when trading inside or with other countries in general, the officials complained about the manipulation, cheat and unreliability of many Egyptian market representatives; many argued that the Egyptian exporters do not have the ability of competing with
15�In total, 30 companies were interviewed. The purpose of the interviews was not running a survey for later regression
models, but only to receive a general opinion of the market representatives about the RTAs and get some trends from them.
GAFTA COMESA EURO-
MED AGHADIR
Percentage of countries having a common border with Egypt 19 6 6 0 Percentage of countries having (a) common official language(s) with Egypt 100 17 18 100 Percentage of countries having (a) common ethnical/spoken language(s) with Egypt 100 61 30 100 Percentage of countries having (a) colonial relationship(s) with Egypt 6 6 6 0 Percentage of countries having (a) common colonizer(s) with Egypt 75 56 24 67 Percentage of countries having a common dominant religion with Egypt 100 28 24 100

29
products abroad, since they offer low quality products with relatively high prices, due to the low productivity. They also argued that many importers falsify in the documents, in order for some restricted or expired goods to cross the Egyptian borders. Many of the Egyptian market representatives did not know about the RTAs signed by Egypt; they criticized the concerned authorities for not informing them properly about the agreements and their possible benefits for them. The importers also demented any substantial reductions in tariff rates; the majority of them assumed that the government might have reduced the tariff rates but on the other hand increased other charges which would override the benefits of these tariff reductions. Many of the importers and exporters found no big difference between the countries of the four agreements. In fact, every one of them has got used to dealing with certain traders abroad since a long time, apart from which country they belong to. When the exporters were asked whether they would be interested to explore new external markets of any countries of the RTAs (especially GAFTA and COMESA, since trade with Euro-Med is considerably high relative to the two others) they pointed out that this would be accompanied by uncertainty and high risk, since the concerned authorities -according to their words- would not give them enough information about these markets and -more importantly- they would get no protection or guarantee that they would receive their money in case they send the commodities abroad in advance. On the other hand, they argued that the importing countries would refuse to pay them in advance as well, since the former would also need a guarantee that the commodities would arrive on time. Hence, the deals are largely based on personal experiences and contacts rather than a systematic action lead by the government. The exporters also highlighted the fact that they do not receive enough support from the government when exporting or even trying to promote for their goods in new markets abroad. In general, many importers and exporters complained about the problem of prolonged procedures (either for the absence of security personnel or for the relatively low number of working hours a day) in some of the Egyptian ports, besides the double counting and surcharges without clear justifications. In fact, many countries that trade with Egypt have the same complaint. As for the local producers, they all agreed on the danger they face from some other countries that are not included in the RTAs signed by Egypt, such as China, Taiwan, Thailand and other Asian countries that highly compete with the Egyptian local products; the producers call for more protection by the Egyptian government, since they are threatened by shutting down, if the imports ‘flowing’ from these countries would persist. When asked whether they would be interested in expanding their production to reach new markets abroad, they argued that they are aware of the problems facing the Egyptian exporters and would therefore rather concentrate on protecting their production from foreign competition.
5. The other side of the horizon Since the bureaucratic and institutional problems that exist in Egypt are common for implementing the four agreements, it could be useful to shed an overall light on every agreement separately. There would be no big difference between dealing with GAFTA or Aghadir, since the four countries of the latter are also part of the former. A major problem that faces GAFTA is that there are no specific details on the certificate of origin designed within the agreement; according to many importers and exporters, many customs officials in the GAFTA countries are not fully aware of the rules of origin. A number of exporters stated that an ‘amount of money’ has to be paid to some

30
officials, in order to approve the certificate of origin automatically. On the other hand, many officials argue that there has been a lot of cheating on that issue from the traders’ side, and since the dispute settlement mechanism is not in full function and detailed rules of origin are absent, the problem becomes more complex. The end effect is either entering products with a labeled Arab origin which is not the case, or delays due to the need of approving the origin, which is considered by Arab partners as NTBs. A great number of exporters complained about the complications and bureaucracy in the Arab countries they export to, to the extent that -in many cases- the Egyptian exporters have to cover the administrative costs and even the tariffs in the importing Arab countries, in order for their products to enter there16. In general, the trust between market representatives of GAFTA countries is missing to a great extent, although there are many common factors between these countries as mentioned above. Moreover, although GAFTA countries are -from a purely geographic point of view- the closest to Egypt, most of the market representatives assured that the good transportation, infrastructure and high frequency of flights between Egypt and the EU play a very important role in enhancing the Egyptian trade with the countries of Euro-Med compared to GAFTA. On a macro level, political factors should also be taken into account; Fawzy (2002) refers the lack of proper integration between Arab countries to the weakness in the political will and the low performance of regional commitment institutions.
As for COMESA, the problems are quite similar to GAFTA, but less severe. For example, the major problem that sometimes faces the customs authorities is the source of origin, which is subject to high manipulation, but to a lesser extent than GAFTA. Not only the literature raises the problem of transportation between COMESA countries17, but also most of the market representatives complain about the modest infrastructure and few air routes….etc.
As an example for current disputes Egypt is facing in COMESA, Kenya has lately undertaken safeguard measures on its imports of sugar for 4 years (the duty free quota allowed is 111 thousand tons for treated sugar and 89 thousand tons for raw sugar) which should end by 31/12/2007. Moreover, Kenya has prolonged the usage of safeguard measures on wheat for another year ending on 22/5/2005. A considerable problem is that Kenya surged the Egyptian market with tea while putting obstacles against some Egyptian exports. Egypt threatened to retaliate but took no real action.
Moving on to the Euro-Med agreement, as compared to the two other agreements, it showed -so far- more success. By the 1st of January 2004, there was a complete dismantling of customs duties and other charges having equivalent effect for Egyptian industrial products exported to Europe and all the quantitative restrictions were called off. A yearly 25 percent customs duties reduction on European raw materials and industrial equipment is planned from 01.01.2004 to 01.01.2007; the first reduction already took place at the beginning of 2004. As many exporters reported, they do not face rules of origin complications when their goods enter in the EU markets. But it should also be pointed out that many of these exporters got the ‘impression’ that the EU authorities are flexible enough to ‘voluntarily’ tolerate many cases. The reason for the relative success of the Euro-Med agreement (so far Egyptian-European Partnership) could be referred to the fact that the EU-countries are rather serious partners -at least according to the words of the Egyptian market representatives- and more experienced in RTA issues, since before the partnership, the trade barriers among the EU countries themselves were diminished gradually till the union was complete. Another reason could be the fact that when Egypt deals with GAFTA and COMESA countries, it does not deal with a completely homogeneous group in each
16�This mainly occurs in goods where Egypt has low terms of trade.
17�See for example Muuka (1998)

31
agreement; despite the similarities mentioned above, every country keeps its own characteristics. But having a look at the EU countries, they all apply the same unified tariff rates, there are no borders between these countries and they use more or less similar policies. Hence, when trading with the EU, it is like rather trading with one big country. Moreover, the institutional problems that exist in GAFTA and COMESA as a whole cannot be compared to Euro-Med18. Another focal issue is the transportation; although the Arab countries are the closest to Egypt, which also lies on one single continent with the African countries, the transportation with the EU proved to be the most successful. Also, the difference in infrastructure between Euro-Med on one hand and GAFTA and COMESA on the other is incomparable. Therefore, it is not only about the pure geographic distance but rather the quality and frequency of transportation possibilities.
6. Dynamic effects
When talking about GAFTA and COMESA, it might be too early to discuss the dynamic gains of the RTAs that Salvatore (1983) introduced. In any case, one of the most important dynamic gains -in addition to the increased competition, economies of scale and better utilization of resources- is the investment stimulus. There are three important sources of investment in Egypt. These are Europe, the United States and the Arab world, particularly the Gulf States. According to home country statistics, the United States holds the largest FDI stock in the country. Foreign investments in Egypt, Lebanon, Morocco, Syria and Tunisia are dominated by European firms (over 70 per cent). The United States is a very important investor in Algeria and Egypt, particularly in energy-related investments. A striking difference between the MENA region and other developing regions is the relatively low level of regional investment. However, in Egypt, Arab investors participate in a quarter of all approved projects. But these tend to be more in construction and in industries with somewhat passive financial commitments, and less in manufacturing or in industries with the potential to transfer technology and managerial experience (Investment Policy Review 1999). Foreign direct investment in Egypt fell to the lowest level for 25 years in 2003, just USD 240 Millions (Ahram Weekly, 2003). But this would bring us once more to the institutional problems; most of the foreign investors do not find the encouraging environment for investment in Egypt. Beside the political instability in the region, the foreign investors fear risk, uncertainty, unstable investment laws, capital repatriation problems and further institutional distortions mentioned above. If these institutional problems are solved, not only EU investments would increase, but also Arab and African investors would be motivated to establish their investments in Egypt and the Arab and African region as a whole instead of concentrating on the European and US markets. And in this case, the ‘investment creation’ by Arab and African countries would be relatively more significant, since the European investments already exist on a broader level.
18�The World Bank Governance Indicators (2002) which reflect important institutional measures, such as rule of law,
government effectiveness and control of corruption show that the countries of the EU have the highest ranks as compared to Arab and African countries.

32
7. Conclusion Economically, both GAFTA and COMESA could be promising agreements, if the concerned countries would improve the institutions deeply rooted in their economies. This does not necessarily need a miracle, as the experience of the EU proves that achieving an Economic and even Currency Union is achievable, let a lone a FTA. The question is where and how to start. An essential issue is strengthening the linkages between the different countries. These include the availability of market information and also the transportation between countries. Exporters of different countries should not only focus on the production suitable for them but suitable for the external markets they target with their production (outward orientation). In order for the member countries to specialize and diversify (which goes in line with the fist criterion of Salvatore), again, lots of information are needed about all the countries of one agreement. As for Egypt, the common country of the agreements tackled in this paper, there is a great need of a flexible system that enhances the incentives of the market representatives instead of dampening their motivations. Egypt could make a big use of the fact that it is involved in several RTAs. One experience could positively affect the other. As indicated above, Egypt’s trade size with the EU is the largest. However, this could be referred to the sound institutions existing in the EU and missing in the countries of the other agreements. If these institutions are improved, given the good economic incentives, the implementation of the other agreements could be successful and flows between Egypt on one hand and Arab and African countries on the other could boost. On the other hand, Egypt is -and will be- facing the challenge of competing with foreign production; if the local producers are concerned about the competition facing them from the Asian countries which are not part of the RTAs, then their worries should grow by knowing that the tariffs applied on products from countries involved in the RTAs will completely fade away sooner or later, due to the commitments of the RTAs. Therefore, improving the quality of production and increasing its productivity is no longer a matter of choice.
Finally, and since the core of this paper is GAFTA and COMESA, it is worth mentioning that firstly, GAFTA is lacking many details in the treaty itself, such as issues concerning the rules of origin, whereas the COMESA treaty is quite comprehensive, but not fully implemented. Secondly, in economic terms, GAFTA has a greater potential based on all the criteria dealt with in the paper. Nonetheless, COMESA proved to be slightly more progressive in implementation. This proves again that the purely economic factors are not a sufficient condition for an appropriate and prosperous implementation of the RTAs.

33
References
CAPMAS (2004) Annual Report, Central Agency for Public Mobilization and Statistics, Cairo. CEPII (2005): Centre D’Etudes Prospectives Et D’Informations Internationales: http://www.cepii.fr/anglaisgraph/cepii/cepii.htm COMESA official website: http://www.comesa.int El-Feki, Mona (2003), “Building Bridges”, Article published by Ahram Weekly, Cairo. El-Khawaga, Laila, Fawzy, S., Kheir-El-Din, H. (1999), “The Egyptian-Turkish Free Trade Area Agreement: What are the Expected Benefits?” The Egyptian Center for Economic Studies, Working Paper No. 39, Cairo. Fawzy, Samiha (2002), “The Economics and Politics of Arab Economic Integration”, The Egyptian Center For Economic Studies, Working Paper No. 66, Cairo. Fratzscher, Oliver (1996), “The Political Economy of Trade Integration”, Physica-Verlag, Germany. Galal, Ahmed (1996), “Which Institutions Constrain Economic Growth in Egypt the Most?”, The Egyptian Center For Economic Studies, Working Paper No. 1, Cairo. Galal, Ahmed and Hoeckman, B. (1997), “Regional Partners in Global Markets: Limits and Possibilities of the Euro-Med Agreements”, Center for Economic Policy Research and the Egyptian Center for Economic Studies, Cairo. Galal, Ahmed and Hoekman, B. (2003), “Arab Economic Integration: Between Hope and Reality” The Egyptian Center for Economic Studies, Bookings Institution Press, Washington D.C. German-Arab Chamber of Industry and Commerce (GACICI), Official website: http://www.ahkmena.com Hoeckman, Bernard (1995), “The World Trade Organization, the European Union, and the Arab World,” World Bank Working Paper No. 1513, Washington D.C. Hudson, Michael (1999), “Introduction: Arab Integration: An Overview” in Hudson Michael ed, The Middle East Dilemma, Center for Contemporary Arab Studies, Georgetown University.
Index of Economic Freedom (2005): http://www.heritage.org/research/features/index/country
D. Kaufmann A. Kraay, and M. Mastruzzi (2003), “Governance Matters III: Governance Indicators for 1996-2002”, World Bank Policy Research Working Paper 3106, Washington D.C.
Laursen, Keld (1998), “Revealed Comparative Advantage and the Alternatives as Measures of International Specialization”, Danish Research Unit for Industrial Dynamics (DRUID), Working Paper No. 98-30
Lipsey, R. G. and K. Lancaster (1956), “The general theory of the second best”, Review of Economic Studies.

34
MOFT ‘Ministry of Foreign Trade’, Egypt, official website: http://www.economy.gov.moft.eg/english/Overview.stm MOFT (2003), Unified Arab Economic Report, Cairo Muuka, Gerry (1998) “Impediments to Economic Integration in Africa: The Case of COMESA”, Journal of Business in Developing Nations, vol. 2, Murray State University. North, Douglass C. (1990), “Institutions, Institutional Change and Economic Performance”, Cambridge University Press. Richardson, David and Zhang, C. (1999), “Revealing Comparative Advantage: Chaotic or Coherent Patterns Across Time and Sector and U.S. Trading Partner?”, National Bureau of Economic Research, Working Paper 7212, Cambridge. Salvatore, D. (1983), “International Economics”, Prentice Hall, Inc., New Jersey. United Nations Conference on Trade and Development (1999): Investment Policy Review, Switzerland Viner, J. (1950), “The Customs Union Issue”, Carnegie Endowment for International Peace, New York.
World Bank (2002), Governance Indicators: http://info.worldbank.org/governance
World Bank (2002), Trade CAN, A Computer Program on International Competitiveness of Countries.
Zarrouk, Jamel (2003), “A Survey of Barriers to Trade and Investment in Arab Countries”, Egyptian Center for Economic Studies (ECES), Cairo.

35
APPENDIX
Table (A) Number of goods having RCA in Egypt and in the partner countries
Country Number of common
goods where Egypt and the concerned country have RCA
Bahrain 11 Iraq 1 Jordan 14 Kuwait 4 Lebanon 22 Libya 5 Morocco 21 Oman 3 Qatar 5 Saudi Arabia 4 Sudan 11 Syria 15 Tunisia 15 United Arab Emirates 10 Yemen 5 Angola 2 Burundi 4 Comoros 5 Congo (Democratic Republic of) 2 Djibouti 14 Eritrea 15 Ethiopia 12 Kenya 14 Madagascar 18 Malawi 11 Mauritius 11 Rwanda 3 Seychelles 6 Uganda 7 Zambia 11 Zimbabwe 22 Algeria 5 Austria 13 Belgium and Luxembourg 20 Cyprus 15 Czech Republic 17 Denmark 10 Estonia 14 Finland 6

36
France 18 Germany 9 Greece 26 Hungary 12 Ireland 3 Israel 14 Italy 20 Latvia 19 Lithuania 24 Malta 3 Netherlands 19 Poland 24 Portugal 21 Slovakia 21 Slovania 15 Spain 23 Sweden 6 Turkey 26 United Kingdom 9
Minimum value 1 Maximum value 26 Mean 12.328 Median 12
Source: Author’s calculations from Trade CAN 2002

37
Table (B) Correlation coefficients between the adjusted RCA index of Egypt and that of each other
country
Country Correlation coefficient between Adj. RCA index of Egypt and that of other
countries Bahrain 0.3433771 Iraq 0.1541142 Jordan 0.364551 Kuwait 0.2105459 Lebanon 0.4163299 Libya 0.2780089 Morocco 0.4328484 Oman 0.2441518 Qatar 0.1568432 Saudi Arabia 0.194415 Sudan 0.3101455 Syria 0.572122 Tunisia 0.4060961 United Arab Emirates 0.3781809 Yemen 0.2128603 Angola 0.1032572 Burundi 0.0601067 Comoros 0.0529863 Congo (DR) -0.0475817 Djibouti 0.1836367 Eritrea 0.1962783 Ethiopia 0.2488923 Kenya 0.3484812 Madagascar 0.4424426 Malawi 0.3817834 Mauritius 0.273978 Rwanda 0.0705498 Seychelles 0.0917837 Uganda 0.1455947 Zambia 0.2467344 Zimbabwe 0.4308707 Algeria 0.2065 Austria -0.0458146 Belgium and Luxembourg 0.0840581 Cyprus 0.3374288 Czech Republic 0.0829524 Denmark -0.0097989 Estonia 0.2193237 Finland -0.1598336 France -0.00565
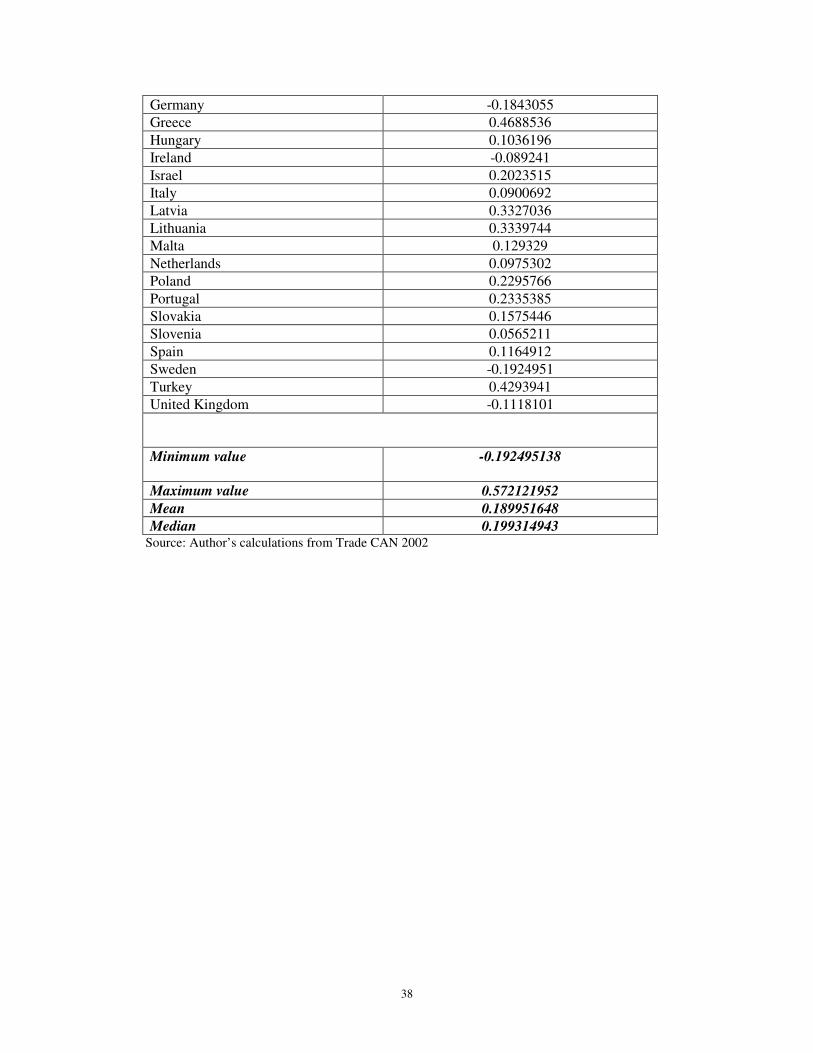
38
Germany -0.1843055 Greece 0.4688536 Hungary 0.1036196 Ireland -0.089241 Israel 0.2023515 Italy 0.0900692 Latvia 0.3327036 Lithuania 0.3339744 Malta 0.129329 Netherlands 0.0975302 Poland 0.2295766 Portugal 0.2335385 Slovakia 0.1575446 Slovenia 0.0565211 Spain 0.1164912 Sweden -0.1924951 Turkey 0.4293941 United Kingdom -0.1118101 Minimum value -0.192495138
Maximum value 0.572121952 Mean 0.189951648 Median 0.199314943
Source: Author’s calculations from Trade CAN 2002

39
Table (C)
Correlation coefficients between the dummy RCA index of Egypt and that of each other country
Country Correlation coefficient between the RCA dummy index of Egypt and that of other
countries Bahrain 0.237766 Iraq 0.129303 Jordan 0.189664 Kuwait 0.138966 Lebanon 0.278574 Libya 0.19703 Morocco 0.344794 Oman 0.09874 Qatar 0.139099 Saudi Arabia 0.103885 Sudan 0.26338 Syria 0.470744 Tunisia 0.262933 United Arab Emirates 0.1253 Yemen 0.123865 Angola 0.097424 Burundi 0.042521 Comoros 0.097322 Congo (DR) -0.028131 Djibouti 0.126138 Eritrea 0.226869 Ethiopia 0.227353 Kenya 0.251392 Madagascar 0.35494 Malawi 0.277361 Mauritius 0.237766 Rwanda 0.039415 Seychelles 0.171691 Uganda 0.12293 Zambia 0.193812 Zimbabwe 0.381359 Algeria 0.175147 Austria -0.113482 Belgium and Luxembourg 0.006752 Cyprus 0.127311 Czech Republic -0.005918 Denmark -0.170115

40
Source: Author’s calculations based on data from the Index of Economic Freedom 2005
Estonia 0.139134 Finland -0.129372 France -0.056651
Germany -0.24646 Greece 0.257109 Hungary 0.013535 Ireland -0.109822 Israel 0.139134 Italy 0.006752
Latvia 0.324685 Lithuania 0.294305
Malta -0.0315 Netherlands 0.006901
Poland 0.127706 Portugal 0.19787 Slovakia 0.192141 Slovenia -0.01038
Spain 0.070455 Sweden -0.169479 Turkey 0.297713
United Kingdom -0.160358
Minimum Value -0.24646 Maximum Value 0.470744
Mean 0.122368 Median 0.128504

41
Table (D) Weighted average tariffs of the member countries in the four agreements
(Figures are in percent and in the year 2002)
Country Weighted average
tariff Bahrain 7.7 Iraq 5 Jordan 11.3 Kuwait 3.6 Lebanon 8 Libya 15.9 Morocco 28.2 Oman 6.7 Palestine 8.5 Qatar 4.2 Saudi Arabia 10.5 Sudan 4.4 Syria 35 Tunisia 27.4 United Arab Emirates 4 Yemen 12.6 Angola 10 Burundi 23.5 Comoros 38.9 Congo 15.6 Djibouti 21 Ethiopia 16.5 Kenya 14.4 Madagascar 2.9 Malawi 12.5 Mauritius 15.8 Rwanda 6.6 Seychelles 28.3 Swaziland 3.6 Uganda 6.8 Zambia 8.4 Zimbabwe 12 Algeria 15.3

42
Austria 2.4 Belgium 2.4 Cyprus 2.4 Czech Republic 4.1 Denmark 2.4 Estonia 0.053 Finland 2.4 France 2.4 Germany 2.4 Greece 2.4 Hungary 7.5 Ireland 2.4 Israel 4 Italy 2.4 Latvia 2.5 Lithuania 0.5 Luxembourg 2.4 Malta 2.4 Netherlands 2.4 Poland 2.9 Portugal 2.4 Slovakia 6.1 Slovenia 1.59 Spain 2.4 Sweden 2.4 Turkey 4.5 United Kingdom 2.4
Minimum weighted average tariff
0.053
Maximum weighted average tariff
35
Mean 8.148186 Median 4.4
Source: Author’s calculations based on data from the Index of Economic Freedom 2005.

43
Table (E) Historical and cultural factors in GAFTA
Unity is given if there is a common factor and zero if this common factor does not exist
Common border
with Egypt
Common official
language with Egypt
Common ethical/spoken language(s) with Egypt
Colonized by or colonized
Egypt
Colonized by a
common colonizer like Egypt
Common dominant religion
Bahrain 0 1 1 0 1 1 Iraq 0 1 1 0 1 1 Jordan 0 1 1 0 1 1 Kuwait 0 1 1 0 1 1 Lebanon 0 1 1 0 0 1 Libya 1 1 1 0 1 1 Morocco 0 1 1 0 0 1 Oman 0 1 1 0 0 1 Palestine 1 1 1 0 1 1 Qatar 0 1 1 0 1 1 Saudi Arabia 0 1 1 0 0 1 Sudan 1 1 1 1 1 1 Syrian Arab Republic 0 1 1 0 1 1 Tunisia 0 1 1 0 1 1 United Arab Emirates 0 1 1 0 1 1 Yemen 0 1 1 0 1 1
Source: CEPII 2005

44
Table (F) Historical and cultural factors in COMESA
Unity is given if there is a common factor and zero if this common factor does not exist
Source: CEPII 2005
Common border with
Egypt
Common official
language with Egypt
Common ethical/spoken language(s) with Egypt
Colonized by
or colonized Egypt
Colonized by a common
colonizer like Egypt
Common dominant religion
Angola 0 0 0 0 0 0 Burundi 0 0 0 0 0 0 Comoros 0 1 0 0 0 1 Congo (D.R.) 0 0 0 0 0 0 Djibouti 0 1 1 0 0 1 Eritrea 0 0 1 0 1 1 Ethiopia 0 0 0 0 0 1 Kenya 0 0 1 0 1 0 Madagascar 0 0 0 0 0 0 Malawi 0 0 1 0 1 0 Mauritius 0 0 1 0 1 0 Rwanda 0 0 1 0 0 0 Seychelles 0 0 1 0 1 0 Sudan 1 1 1 1 1 1 Swaziland 0 0 0 0 1 0 Uganda 0 0 1 0 1 0 Zambia 0 0 1 0 1 0 Zimbabwe 0 0 1 0 1 0

45
Table (G) Historical and cultural factors in Euro-Med
Unity is given if there is a common factor and zero if this common factor does not exist
Source: CEPII 2005
Common border
with Egypt
Common official
language with Egypt
Common ethical/spoken language(s) with Egypt
Colonized by or colonized
Egypt
Colonized by a common
colonizer like Egypt
Common dominant religion
Algeria 0 1 1 0 0 1 Austria 0 0 0 0 0 0 Belgium 0 0 0 0 0 0 Cyprus 0 0 0 0 1 0 Czech Republic 0 0 0 0 0 0 Denmark 0 0 0 0 0 0 Estonia 0 0 0 0 0 0 Finland 0 0 0 0 0 0 France 0 0 0 0 0 0 Germany 0 0 0 0 0 0 Greece 0 0 0 0 1 0 Hungary 0 0 0 0 0 0 Ireland 0 0 1 0 1 0 Israel 1 0 1 0 0 0 Italy 0 0 0 0 0 0 Jordan 0 1 1 0 1 1 Lativa 0 0 0 0 0 0 Lebanon 0 1 1 0 0 1 Lithuania 0 0 0 0 0 0 Luxembourg 0 0 0 0 0 0 Malta 0 0 1 0 1 0 Morocco 0 1 1 0 0 1 Netherlands 0 0 0 0 0 0 Palestine 1 1 1 0 1 1 Poland 0 0 0 0 0 0 Portugal 0 0 0 0 0 0 Slovakia 0 0 0 0 0 0 Slovenia 0 0 0 0 0 0 Spain 0 0 0 0 0 0 Sweden 0 0 0 0 0 0 Syria 0 1 1 0 1 1 Tunisia 0 1 1 0 1 1 Turkey 0 0 0 1 0 1 United Kingdom 0 0 1 1 0 0

46
Table (H) Historical and cultural factors in Aghadir
Unity is given if there is a common factor and zero if this common factor does not exist
Common border
with Egypt
Common official
language with Egypt
Common ethical/spoken language(s) with Egypt
Colonized by or colonized
Egypt
Colonized by a
common colonizer like Egypt
Common dominant religion
Jordan 0 1 1 0 1 1 Morocco 0 1 1 0 0 1 Tunisia 0 1 1 0 1 1
Source: CEPII 2005