Embed Size (px)
Citation preview
EGYPT EDUCATION, TRAINING AND EMPLOYMENT DEVELOPMENTS 2016

The contents of this paper are the sole responsibility of the ETF and do not necessarily reflect the views of the EU institutions.
© European Training Foundation, 2017 Reproduction is authorised provided the source is acknowledged.
EGYPT 2016 | 03
KEY EDUCATION, TRAINING AND EMPLOYMENT DEVELOPMENTS
IN EGYPT
Far-reaching structural reforms are needed to transform Egypt’s economy into a dynamic system that
can reduce poverty, create productive employment opportunities, and maintain social and political
stability. Economic growth in the past three decades has been moderate and uneven, and insufficient
to reduce poverty or absorb the rapidly growing supply of labour. Poverty rates have been persistently
high, at about one-quarter of the population, concentrated in rural Upper Egypt, and unemployment
remains high, particularly for women and youth.
No major developments have taken place in the training and employment sectors in 2016. The
abolition of the Ministry of TVET in 2015 has had some spill-over effects, which have continued in
2016. The most important of these is the transfer of the Enterprise Training Partnerships institutional
hub and its relocation under the relevant Chambers of Commerce.
1. Key demographic and economic characteristics
Egypt is a lower middle-income country with a population of 91.5 million in 2015, according to the
United Nations Development Programme (UNDP). The annual population growth rate is declining at
1.6%, but demographic pressure is still high, with young people aged 15–24 accounting for 28.1%
(2015 according to UNDP data) of the 15–64 age band. This keeps pressure on the labour market,
infrastructure, social services and environment, making it even more urgent for Egypt to undertake
wide-ranging structural and policy reforms.
Although the GDP is on a path of steady growth (from 1.8% in 2011 to 4.2% in 2015), Egypt’s
economy is standing on shaky ground. Preliminary figures for the first quarter of 2016 indicate that the
economic uptick has faded somewhat, mainly due to foreign exchange shortages, which stifled
production and undermined Egypt’s competitiveness. The Central Bank of Egypt moved towards a
more flexible exchange rate management regime in mid-March 2016, partially resolving a binding
constraint on economic activity.
A drop in tourism has been impeding economic activity since late 2015. Fewer tourists and lower
revenues from the Suez Canal have caused the country’s international reserves to plunge. Acute
dollar shortages are restraining business activity and have negative repercussions on the wider
economy. Financial support from Egypt’s oil-rich regional peers weakened during the oil price slump.
Measures to curb the deficit include a 14% reduction in the state subsidy bill and implementation of
the value-added tax.
Unemployment is high (13% in 2014). In common with the other countries of the region Egypt is
characterised by a very low economic activity rate for females, which in the last five years has
remained around 15%. The unemployment rate of women is almost double that of men (24% versus
9.6% in 2014), according to Eurostat.
The following main factors influence the national economy and the demand for skills.
■ The current economic crisis has affected employment opportunities at all levels. The private sector
has reduced the offer of new jobs, particularly in the tourism sector. The public sector has
discontinued the previous policy of increasing public employment to address national
EGYPT 2016 | 04
unemployment. That policy had been very costly for the state; in 2010–2011, for example, 26% of
the total government expenditure was used to pay the wages of public employees1.
■ Demographic growth is still very strong and represents a big challenge for the labour market.
Currently around 800 000 newcomers join the labour market each year.
■ The negative conditions for new businesses (Egypt scored 110th in the Doing Business ranking in
20122, and 131st in 2016) also reduce the possibility for entrepreneurial initiatives.
2. Education and training
2.1 Trends and challenges
Egypt has the largest overall education system in the Middle East and North Africa and it has grown
rapidly since the early 1990s. Having absorbed 86.1% at secondary and 46.6% at upper secondary
level of young people in secondary education in 20143, the technical secondary education pathway
and its agricultural, industrial and commercial streams, consisting of three- and five-year programmes,
represent a large part of the Egyptian education system. With almost 1.7 million students (Central
Agency for Public Mobilization and Statistics (CAPMAS) data, 2014) and 140 000 teachers, it also
forms the bulk of the supply of technical and vocational education and training (TVET) in the country.
However, according to the 2014 Torino Process report4, TVET participation decreased in the period
reviewed, 2010–2014. In particular between 2011 and 2014, participation in TVET as a share of upper
secondary education dropped by four percentage points5. This is due to several factors, such as the
persisting challenge of attractiveness of TVET and growing demand from students for higher
education, as well as earlier policies that aimed at rebalancing the two trajectories of general and
technical education.
A number of alternative learning options to mainstream technical and vocational education exist, both
formal and non-formal. Accurate data about them are missing and various reports show different,
incomplete or non-comparable figures. While the UNDP estimated in 20106 that around 1 200
vocational training centres belonged to seven ministries, a report from the World Bank lists some
800 training centres belonging to 12 ministries7. Detailed and more recent information is not available,
but the situation has very likely remained the same since 2011. The duration of such vocational
training programmes ranges from one month to two years, and they consist mostly of technical training
and are usually centre-based. Training programmes are often duplicates and there is a need to
improve common training standards and certification requirements. The Ministry of Manpower and
Migration plays a key role with regard to identifying the levels of qualifications, setting criteria and
issuing approval for running training centres, which includes, for example, the provision of trainers,
equipment and courses.
1 Kamal A. El-Wassal, ‘Public employment dilemma in Egypt: Who pays the bill?’, World Journal of Social Sciences, Vol. 4, No 1, March 2014. 2 Doing Business, Doing Business 2012: Doing business in a more transparent world, IBRD/World Bank,
Washington, DC, 2012. www.doingbusiness.org/reports/global-reports/doing-business-2012 3 UNESCO Institute for Statistics (UIS), 2014. 4 Zelloth, H. (European Training Foundation), Torino Process 2014: Egypt, ETF, Turin, 2015.
www.etf.europa.eu/web.nsf/pages/TRP_2014_Egypt 5 ETF calculations based on UNESCO data. The latter show a share of 49% for TVET, for the first time below 50%. 6 UNDP, 2010. 7 A. El-Ashmawi, ‘TVET in Egypt’, Background paper prepared for the MENA Regional Jobs Flagship, World Bank, Washington, DC, 2011.
EGYPT 2016 | 05
Other alternative TVET learning pathways are various types of apprenticeship scheme and
experimental TVET models such as schools within enterprises or other new forms of cooperation
between TVET providers and businesses, aiming at improving labour market relevance and gaining
practical skills. Many of these remain small-scale but would have potential for expansion if appropriate
mechanisms to reinforce these models could be put in place.
Continuing vocational training traditionally remains a weak element in TVET and is not considered a
priority by the government, given the challenges it is facing with initial TVET against the backdrop of a
ceaselessly growing population of young people. However, remarkable initiatives have been launched
by the Ministry of Trade and Industry (Industrial Training Council), such as the National Programme for
Training for Employment, which targets 100 000 people to be trained annually, the Beaidak Project on
Training for Employment (supported by the United Arab Emirates) and the piloting of continuing
education centres, supported by the Aga Khan Foundation.
Monitoring of education and training data is carried out mainly through administrative sources. No data
are gathered about graduates’ employability through tracer studies. The data which are actually
collected are not easily retrievable and are not analysed with a view to increasing the effectiveness of
the TVET sector. Aiming to address these weaknesses, GIZ is supporting the Ministry of Education
and Technical Education in setting up a more effective monitoring system. The EU-funded TVET 2
programme will at the same time make a proposal for a new tracer studies system to be implemented
at national level. TVET 2 is the main international project supporting TVET reform. It is a EUR 117
million programme (EUR 50 million coming from the European Union (EU) and EUR 67 million from
the Egyptian government) aimed at systemic reform of the TVET sector.
2.2 Education and training policy and institutional setting
Egypt’s vertically segmented education system makes a basic distinction between technical and
vocational education, the latter being a relatively small sector at secondary education level, making up
around 200 000 students in 2011 and following a decreasing trend. Technical education is under the
responsibility of the Ministry of Education and Technical Education. Formal TVET is also provided in
higher education in technological colleges (Middle Technical Institutes are under this umbrella) and
Institutes of Industrial Education. Policy attention to postsecondary TVET has increased in recent
years, as evidenced by various reviews and reports (i.e. the Ministry of Higher Education’s study on
TVET at postsecondary level, the OECD ‘Skills beyond schools’ review), and plans for a practice-
oriented four-year Bachelor of Technology degree after secondary education.
The main factor influencing education and training is the political importance given since 2015 to the
TVET sector, which is seen as a powerful tool to address the greatest challenge in the country: youth
unemployment. This emphasis has led to institutional changes, some of which have not been
sustained (e.g. creation of a ministry for TVET) and the launch of several international programmes
supporting TVET reforms.
At the strategic level some progress has been made towards clearer understanding that the lack of a
unified or agreed vision for the TVET system shared by all key stakeholders constitutes a major barrier
for further TVET development. The EU-funded TVET 2 programme aims to address the sector’s
fragmentation by developing an overarching strategy supported by all relevant stakeholders.
In 2015, many policy decisions seemed to indicate a commitment by policy makers to reform of the
TVET sector. Some of these were:
■ assigning to TVET a higher priority within the education and training agenda than in the past (i.e.
introduction of a position of Deputy Minister for Technical Education);
EGYPT 2016 | 06
■ a shift in the TVET policy agenda to a more employment-oriented focus (i.e. school-to-work
transitions, career guidance) and a subtle trend towards more demand-oriented TVET (i.e. various
new partnerships between the private sector and TVET providers, provision of work-based
learning);
■ a greater opening up of technical education (in five- and three-year streams) to higher education
by changing admission criteria and planning to offer additional courses for transition to higher
education.
However, in 2016 this reform wave has slowed down. Following the institutional turmoil of early 2015,
with the creation of the Ministry for TVET and the corresponding centralisation process, everything has
gone back to the start, TVET has returned to the Ministry of Education, and the main challenges linked
to unclear overall governance of the TVET system and lack of coordination among existing
stakeholders are still unanswered. Between 2015 and 2016 UNESCO has worked with the Minister of
Education on the definition of pillars for a new multiannual strategy. These pillars should be developed
in the framework of the EU TVET 2 programme.
The main institutional change of 2016 as regards the TVET sector is the transfer of the Enterprise
Training Partnerships (ETPs) and their relocation under the management of the relevant Chambers of
Commerce. This change has not been perceived positively by the ETPs’ management and could be
reviewed in the future.
3. Labour market and employment
3.1 Trends and challenges
Egypt has traditionally had low economic activity and employment rates, mainly because of low female
participation in the labour market, and this trend has continued to deteriorate.
According to Eurostat, in 2014 the total activity rate for the 15–64 age group was 31.7%, with a male
activity rate of 47.3% and a female activity rate of 17.4%. The total employment rate (age group 15+)
in 2014 was also low at 41% for males and 17.4% for females. Since the revolution, the
unemployment rate has been slowly but constantly growing: from 9.5% in 2009 (CAPMAS) to 13% in
2014. Unemployment is a particular problem for women, as the female unemployment rate is much
higher than the male rate (24%, as against 10% in 2014).
The ‘paradox’ of unemployment (or the phenomenon of ‘educated employment’) – known already for a
decade as a typical feature of the Egyptian labour market – persists. Low-educated or non-educated
workers show very low unemployment levels, whereas unemployment increases with education step
by step for the graduates of general and TVET secondary schools (10.4% and 12.3% respectively in
2012) and then for postsecondary and university graduates (12.6% and 13.6% respectively in 2012)8.
This shows a clear need to revise curricula or to adapt the education and training offer to labour
market needs. It also implies a need to re-discuss the national economic model, which is probably not
able to generate enough high-quality jobs requiring highly qualified workers.
However, whereas education affects the employment prospects of males only slightly, it changes
women’s employment prospects drastically. The unemployment rates of females are 30% for those
with general secondary education (compared with 6% for males), 37% for TVET secondary education
graduates (5% for males), 29% for those with postsecondary education (6% for males) and 25% for
university graduates (7% for males). The increased enrolment of women in education does not
translate into job prospects, Moreover, the impact of TVET is opposite: it improves employment
8 ETF calculations, based on Egypt Labour Market Panel Survey (ELMPS) 2012.
EGYPT 2016 | 07
prospects for men and worsens those for women. TVET needs to be reconsidered in terms of real job
prospects, especially for women who, in the absence of such prospects, end up in a vicious cycle of
unemployment and then inactivity.
Based on ETF calculations from the 2014 Eurostat data, the youth unemployment rate is 26.5%, in
line with historical standards but lower than in the period 2012–2013, when it was higher than 34%.
Youth unemployment also varies greatly, again between young men and women. While young men
have an unemployment rate of 20.6%, young women suffer from 44% unemployment, according to
Eurostat data. In 2012, 77% of those unemployed were young people (15–29), over 80% of the total
number of unemployed people had at least a secondary education school diploma, and one-third had
a university degree. These figures once again show the dichotomies that characterise the national
labour market and highlight the difficulties that young people encounter when transiting from school to
work. These difficulties may be due to multiple factors, such as inappropriate general education,
inadequate technical skills, inadequate soft/life skills, lack of financial capital, job-matching problems,
lack of labour market information and shortage of labour demand. In turn, this also calls for concrete
action to enhance the effectiveness of secondary and higher education, so as to prepare young labour
market entrants better.
According to CAPMAS 2012 figures, the employment share of agriculture is still high (27%), while
industry’s share is 25% (including construction and utilities) and services are dominating employment
with a 48% share. In recent years most of the new jobs have been created by the private sector (but in
the informal sector), while public employment has been decreasing since 2005, except in some
sectors such as education, as a result of the measures applied by the successive cabinets for deficit
reduction.
Employment in the private sector continues to be dominated by small firms and informal work. In 2012,
45% of employment was in firms with one to four employees, and this has changed little over time;
17% of employment was in firms with five to nine employees9. According to the World Bank, the size
of the informal sector as a percentage of GDP is estimated to have been 36.2% before the revolution,
while the share of the labour force who do not contribute to any social security has gone up to 44.5%
among employees and 28.2% among the self-employed10.
Labour emigration remains an important issue for the country. Egypt is the 14th largest receiver of
remittances in the world and the second largest in the region. In 2010, the stock of Egyptian emigrants
abroad was 3.7 million (4.4% of the population), mainly working in the Arab countries (Saudi Arabia,
Jordan, the Gulf countries) and to a lesser extent in the USA and Europe (in particular Italy and
France). Egyptian migration is currently experiencing ‘the permanence of temporary migration’11,
whereby migration towards Arab countries is becoming less temporary.
The refugee crisis has a stronger political and humanitarian connotation, for the number of Syrian
refugees is limited compared to the total population: as of 2015, according to UNHCR figures, officially
there are 212 500 refugees, and the number has been constant since 2013. Egypt receives a lot of
support from many public and private donors to deal with the refugee situation.
9 Said, M. (European Training Foundation), ‘Egypt country note’, Draft, 2014. 10 Gatti, R. et al., ‘Striving for better jobs: The challenge of informality in the Middle East and North Africa region’, MENA Knowledge and Learning Quick Notes Series, No 49, World Bank, Washington, DC, 2011.
http://documents.worldbank.org/curated/en/936991468059653314/Striving-for-better-jobs-the-challenge-of-informality-in-the-Middle-East-and-North-Africa-region 11 Fargues, P. (Ed.), EU neighbourhood migration report 2013, European University Institute, Robert Schuman
Centre for Advanced Studies, Migration Policy Centre, 2013. http://cadmus.eui.eu/bitstream/handle/1814/27394/MPC_EU_NeighbourhoodMigrationReport2013_web.pdf?sequence=5
EGYPT 2016 | 08
Data gathering on the labour market in Egypt is mainly done through administrative sources
(employment offices) and labour force surveys managed by CAPMAS, the national statistical office.
Information on employment is sensitive and the Egyptian government manages the data cautiously.
Data is accessible only following a written request. The latest initiative to develop a labour market
information system is part of the EU TVET 2 programme.
3.2 Employment policy and institutional setting
Many actors play a role in employment, but with little coordination. The biggest role is in the hands of
the Ministry of Manpower and Migration (MoMM). It plays the role of the primary public employment
services (PES) agency: it is responsible for labour policy, managing labour supply and demand,
increasing the employability of the labour force, and monitoring labour market demand. One of
MoMM’s main responsibilities is to match jobseekers and job vacancies across a network of
300 employment offices.
MoMM manages a PES network, the operational arm in matching labour force supply and demand.
Most of the PES offices are underdeveloped, understaffed and under resourced and provide a very
limited range of employment services, merely issuing work permits and registration12. Given these
challenges, efforts have been made to upgrade and modernise employment services, mainly through
the Egyptian Labour Market Service Reform project (ELMSR), which was implemented by the Social
Fund for Development in partnership with MoMM and funded by the Canadian International
Development Agency (CIDA). However, the project evaluation found that the impact of the project was
limited. Besides labour intermediation, MoMM leads an Employment Information Programme, which
prepares labour market statistics that are published in a monthly bulletin. It also organises an
enterprise census every year, which collects information on training needs from all enterprises with
more than 10 workers.
No major legislative changes have been implemented in the context of employment during 2015/2016.
However, some future changes are expected in the implementation framework of the National
Programme for Training for Employment. An ambitious plan was defined in 2015 but its
implementation has not yet started. This plan aims to increase the rate of absorption of Egyptian
labour in both internal and external markets, and reduce the unemployment rate sufficiently to reach
global rates by conducting effective reforms that will link education and training outputs with current
and projected labour market needs. The programme has a life of five years and has identified very
detailed and ambitious objectives, such as:
■ identifying the skills required for the training and rehabilitation of 750 000 trainees annually in
300 professions and occupations according to modern training systems in order to meet the needs
of the labour market and the new projects in Egypt;
■ conducting special programmes for the training of 850 000 trainees to qualify them to work abroad
in accordance with modern standards and techniques.
The plan includes a more detailed list of mechanisms for implementation.
Regarding active labour market policies (ALMPs) there are numerous ongoing and emerging
initiatives, which are implemented by various stakeholders and in many cases supported by donors.
Non-governmental and non-profit organisations are the main implementing organisations of ALMPs:
they represent 86% of all ALMP interventions13. In general, ALMPs in Egypt reach a relatively small
12 Amer, M., ‘Active labour market policies: Mapping of existing initiatives in Egypt’, Paper presented in Cairo, October 2012. 13 Barsoum, G. et al., Interventions to improve labour market outcomes of youth: An inventory of interventions in Egypt, National report for the Youth Employment Inventory (YEI), ILO, Geneva, 2014.
EGYPT 2016 | 09
proportion of jobseekers14. Monitoring, evaluation and mainstreaming are also lacking in the system,
and women-specific programmes are absent. Some of the public works focus on labour-intensive
sectors, mostly in construction, and have led to the creation of temporary jobs only.
As part of the government’s safety net and poverty reduction strategy, public works are high on the
economic agenda. The government’s principal public works and regional development programmes
are (i) Shoroukh programmes, which aim to combat unemployment through the creation of income-
generating opportunities in rural areas; and (ii) public works programmes, which aim to supply basic
infrastructure services to impoverished rural communities and pockets of urban poverty. The World
Bank’s Emergency Labour-Intensive Project, costing a total of USD 200 million, with a contribution of
EUR 70 million from the EU, has been implemented by the Social Fund for Development. Its aim is to
provide short-term employment for unskilled and semi-skilled workers through intensive small-scale
infrastructure projects for the period 2012–2015.
In 2013, approval was given for the National Programme for Training for Employment to be
implemented by the Industrial Training Council (ITC) under the Ministry of Industry and Trade. The
programme aims at improving the skills of Egyptian industrial labour and is divided into three main
components: (i) setting up a labour market information system; (ii) training and qualifying; and
(iii) matching skills to decent jobs. The total cost of the project is estimated to be EGP 500 million
(approximately EUR 53 million), made up of limited government funding, plus contributions from the
private sector and international donors. In the pilot project, 17 000 individuals were granted a job (50%
in the ready‐made garment sector) and social and medical insurance for employees was introduced15.
There are several entrepreneurship programmes that aim to stimulate small business creation and to
provide earning opportunities and increase the incomes of poor families. For example, the Community
Development Programme provides small microcredit loans mainly to very poor families. The main
objectives of the Small Enterprise Development Organisation (SEDO) are to create new businesses
and to help existing small enterprises to grow by providing a wide range of loans. Programme
beneficiaries range widely from unemployed youth to medium-sized enterprises.
Egypt does not have a national core process to match qualifications provided by the TVET sector; only
ad hoc studies are carried out in the framework of international projects. Some individual initiatives
involve employers in the process of qualifications development in order to make new programmes
relevant to the labour market. For example, an ITC initiative – the EVCQ1 Development and
International Endorsement Programme – aims, in partnership with employers’ organisations, to
develop demand-driven and internationally endorsed vocational qualifications, according to the skills
standards required in the industry, tourism and construction sectors. To date, 350 qualifications have
been developed and endorsed.The EU TVET 2 programme aims to develop core processes which
could be applied by all key TVET stakeholders and which should become national standards. One of
these core processes focuses specifically on matching qualifications and labour market demands.
Career guidance has been a priority for Egypt, and many international actors (ETF, GIZ and others)
have worked in partnership with TVET stakeholders in order to identify the most appropriate model for
career guidance implementation in the Egyptian context. An important step in the move from project-
based initiatives to sustainable career guidance mechanisms was the establishment, by Ministerial
Decree No 283, of a School-to-Work Transition Unit in the Ministry of Education in June 2014. This
unit, headed by the technical education sector, includes a division on career guidance, the first of its
kind in the history of TVET and education in Egypt. Its function is to recommend policies, mechanisms
14 European Training Foundation, ‘Employment policies in Egypt’, Draft paper, 2014. 15 Amin, G., Egypt country report: Policies and mechanisms for integration into the workforce and job creation,
Paper presented at the ICQN/TVSD 2014 Ministerial Conference, Abidjan, 21–23 July 2014. www.adeanet.org/min_conf_youth_skills_employment/sites/default/files/u26/Egypt_Country_Report.pdf
EGYPT 2016 | 10
and standards for school-to-work-transition services and to review the impact of initiatives and pilot
projects that support students’ school-to-work transitions. The by-law of the Ministerial Decree is still
pending but regional units have been established at governorate level with career guidance,
employment and entrepreneurship functions.
Overall, as in the TVET sector, the stakeholders in charge of employment policies work in a
fragmented way. Developing a clear and agreed governance structure for the employment sector,
clarifying the specific responsibilities of each actor and establishing core processes and cooperation
mechanisms should be the priorities of policy makers. These elements should come before additional
technical developments are pursued, because without these the system will continue to be ineffective
and inefficient.
EGYPT 2016 | 11
ANNEXES
Statistical annex
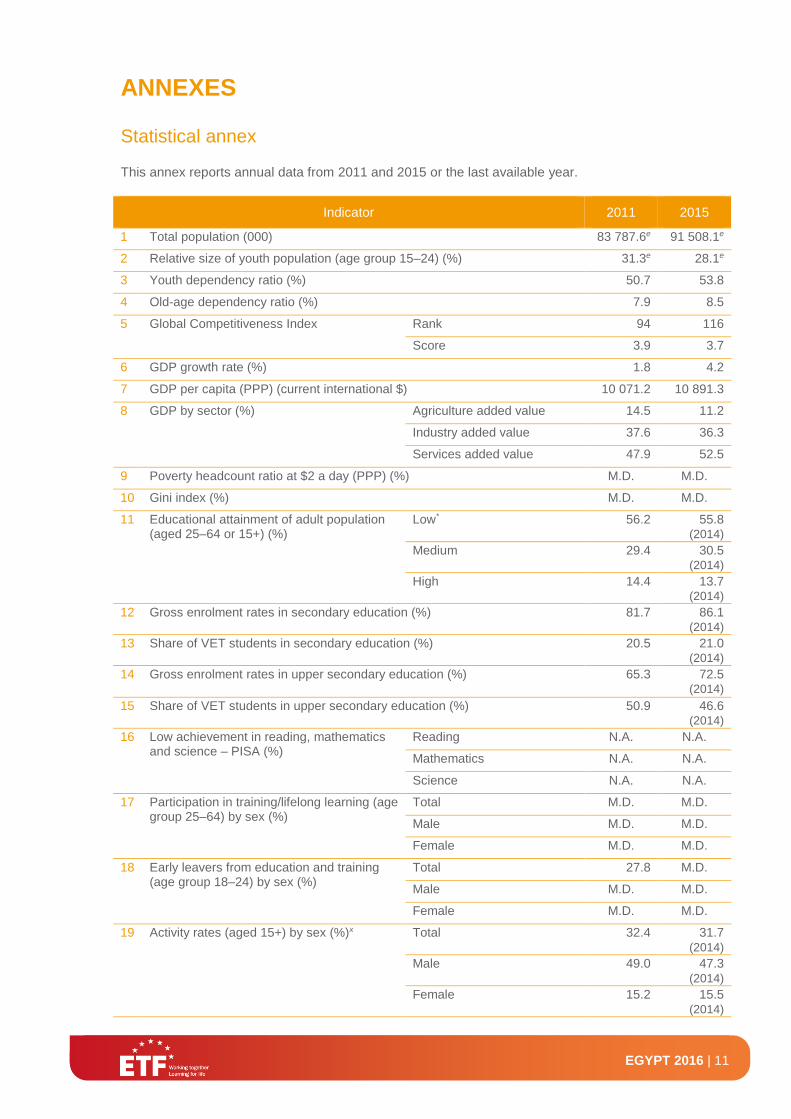
This annex reports annual data from 2011 and 2015 or the last available year.
Indicator 2011 2015
1 Total population (000) 83 787.6e 91 508.1e
2 Relative size of youth population (age group 15–24) (%) 31.3e 28.1e
3 Youth dependency ratio (%) 50.7 53.8
4 Old-age dependency ratio (%) 7.9 8.5
5 Global Competitiveness Index Rank 94 116
Score 3.9 3.7
6 GDP growth rate (%) 1.8 4.2
7 GDP per capita (PPP) (current international $) 10 071.2 10 891.3
8 GDP by sector (%) Agriculture added value 14.5 11.2
Industry added value 37.6 36.3
Services added value 47.9 52.5
9 Poverty headcount ratio at $2 a day (PPP) (%) M.D. M.D.
10 Gini index (%) M.D. M.D.
11 Educational attainment of adult population (aged 25–64 or 15+) (%)
Low* 56.2 55.8 (2014)
Medium 29.4 30.5 (2014)
High 14.4 13.7 (2014)
12 Gross enrolment rates in secondary education (%) 81.7 86.1 (2014)
13 Share of VET students in secondary education (%) 20.5 21.0 (2014)
14 Gross enrolment rates in upper secondary education (%) 65.3 72.5 (2014)
15 Share of VET students in upper secondary education (%) 50.9 46.6 (2014)
16 Low achievement in reading, mathematics and science – PISA (%)
Reading N.A. N.A.
Mathematics N.A. N.A.
Science N.A. N.A.
17 Participation in training/lifelong learning (age group 25–64) by sex (%)
Total M.D. M.D.
Male M.D. M.D.
Female M.D. M.D.
18 Early leavers from education and training (age group 18–24) by sex (%)
Total 27.8 M.D.
Male M.D. M.D.
Female M.D. M.D.
19 Activity rates (aged 15+) by sex (%)x Total 32.4 31.7 (2014)
Male 49.0 47.3 (2014)
Female 15.2 15.5 (2014)
EGYPT 2016 | 12
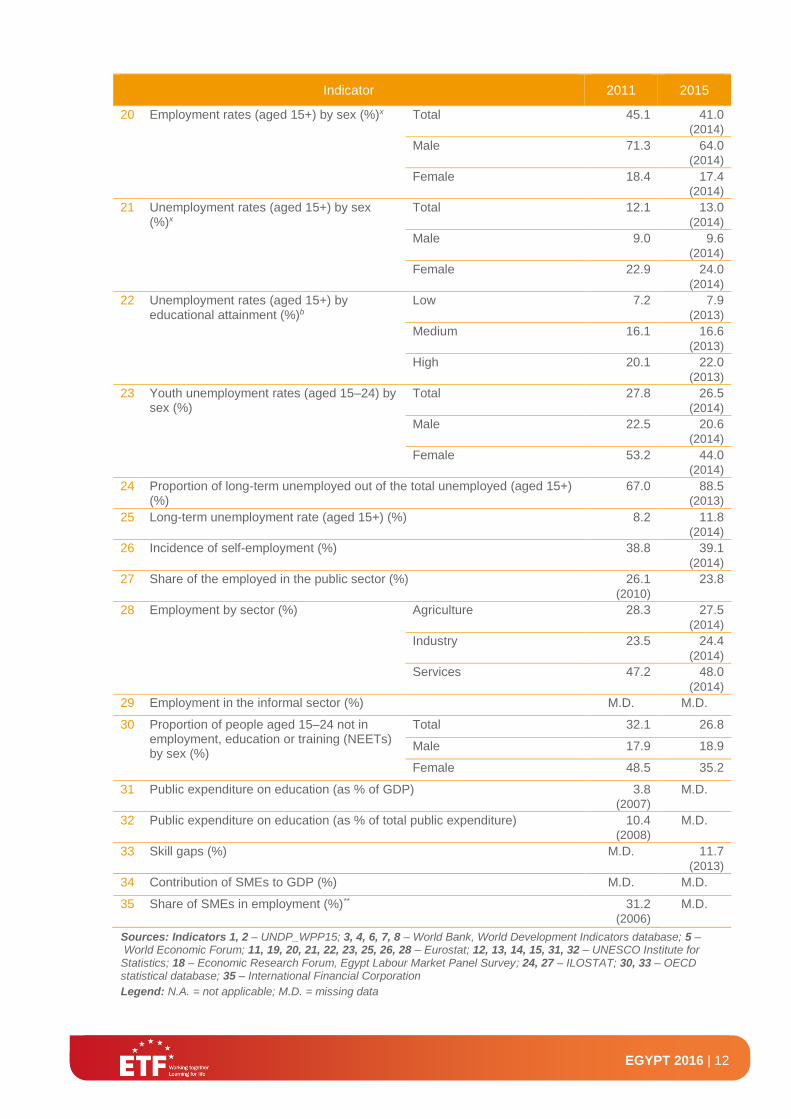
Indicator 2011 2015
20 Employment rates (aged 15+) by sex (%)x Total 45.1 41.0 (2014)
Male 71.3 64.0 (2014)
Female 18.4 17.4 (2014)
21 Unemployment rates (aged 15+) by sex (%)x
Total 12.1 13.0 (2014)
Male 9.0 9.6 (2014)
Female 22.9 24.0 (2014)
22 Unemployment rates (aged 15+) by educational attainment (%)b
Low 7.2 7.9 (2013)
Medium 16.1 16.6 (2013)
High 20.1 22.0 (2013)
23 Youth unemployment rates (aged 15–24) by sex (%)
Total 27.8 26.5 (2014)
Male 22.5 20.6 (2014)
Female 53.2 44.0 (2014)
24 Proportion of long-term unemployed out of the total unemployed (aged 15+) (%)
67.0 88.5 (2013)
25 Long-term unemployment rate (aged 15+) (%) 8.2 11.8 (2014)
26 Incidence of self-employment (%) 38.8 39.1 (2014)
27 Share of the employed in the public sector (%) 26.1 (2010)
23.8
28 Employment by sector (%) Agriculture 28.3 27.5 (2014)
Industry 23.5 24.4 (2014)
Services 47.2 48.0 (2014)
29 Employment in the informal sector (%) M.D. M.D.
30 Proportion of people aged 15–24 not in employment, education or training (NEETs) by sex (%)
Total 32.1 26.8
Male 17.9 18.9
Female 48.5 35.2
31 Public expenditure on education (as % of GDP) 3.8 (2007)
M.D.
32 Public expenditure on education (as % of total public expenditure) 10.4 (2008)
M.D.
33 Skill gaps (%) M.D. 11.7 (2013)
34 Contribution of SMEs to GDP (%) M.D. M.D.
35 Share of SMEs in employment (%)** 31.2 (2006)
M.D.
Sources: Indicators 1, 2 – UNDP_WPP15; 3, 4, 6, 7, 8 – World Bank, World Development Indicators database; 5 – World Economic Forum; 11, 19, 20, 21, 22, 23, 25, 26, 28 – Eurostat; 12, 13, 14, 15, 31, 32 – UNESCO Institute for Statistics; 18 – Economic Research Forum, Egypt Labour Market Panel Survey; 24, 27 – ILOSTAT; 30, 33 – OECD statistical database; 35 – International Financial Corporation
Legend: N.A. = not applicable; M.D. = missing data
EGYPT 2016 | 13
Notes: (e) Estimate. (b) 2014 is break in series for unemployment rate by educational attainment; 2013 was chosen to compare with 2011. (*) Includes illiterate people. (**) Up to 100 employees. (x) Age range 15–64.
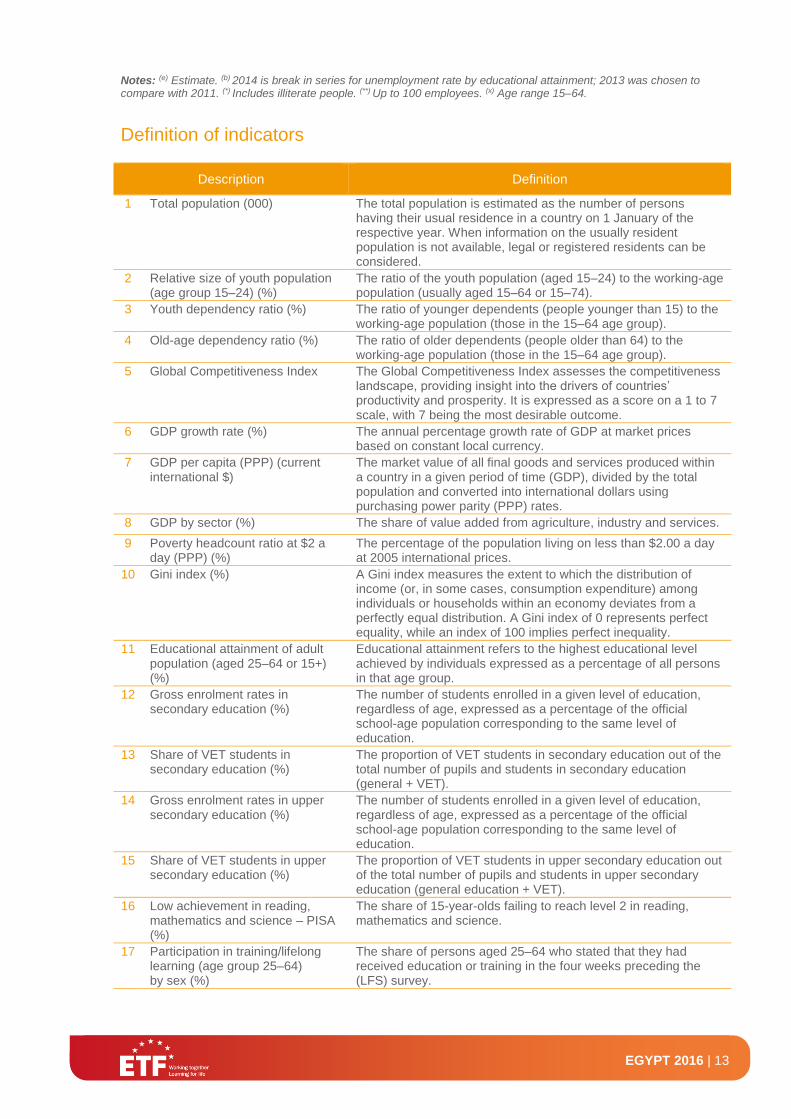
Definition of indicators
Description Definition
1 Total population (000) The total population is estimated as the number of persons having their usual residence in a country on 1 January of the respective year. When information on the usually resident population is not available, legal or registered residents can be considered.
2 Relative size of youth population (age group 15–24) (%)
The ratio of the youth population (aged 15–24) to the working-age population (usually aged 15–64 or 15–74).
3 Youth dependency ratio (%) The ratio of younger dependents (people younger than 15) to the working-age population (those in the 15–64 age group).
4 Old-age dependency ratio (%) The ratio of older dependents (people older than 64) to the working-age population (those in the 15–64 age group).
5 Global Competitiveness Index The Global Competitiveness Index assesses the competitiveness landscape, providing insight into the drivers of countries’ productivity and prosperity. It is expressed as a score on a 1 to 7 scale, with 7 being the most desirable outcome.
6 GDP growth rate (%) The annual percentage growth rate of GDP at market prices based on constant local currency.
7 GDP per capita (PPP) (current international $)
The market value of all final goods and services produced within a country in a given period of time (GDP), divided by the total population and converted into international dollars using purchasing power parity (PPP) rates.
8 GDP by sector (%) The share of value added from agriculture, industry and services.
9 Poverty headcount ratio at $2 a day (PPP) (%)
The percentage of the population living on less than $2.00 a day at 2005 international prices.
10 Gini index (%) A Gini index measures the extent to which the distribution of income (or, in some cases, consumption expenditure) among individuals or households within an economy deviates from a perfectly equal distribution. A Gini index of 0 represents perfect equality, while an index of 100 implies perfect inequality.
11 Educational attainment of adult population (aged 25–64 or 15+) (%)
Educational attainment refers to the highest educational level achieved by individuals expressed as a percentage of all persons in that age group.
12 Gross enrolment rates in secondary education (%)
The number of students enrolled in a given level of education, regardless of age, expressed as a percentage of the official school-age population corresponding to the same level of education.
13 Share of VET students in secondary education (%)
The proportion of VET students in secondary education out of the total number of pupils and students in secondary education (general + VET).
14 Gross enrolment rates in upper secondary education (%)
The number of students enrolled in a given level of education, regardless of age, expressed as a percentage of the official school-age population corresponding to the same level of education.
15 Share of VET students in upper secondary education (%)
The proportion of VET students in upper secondary education out of the total number of pupils and students in upper secondary education (general education + VET).
16 Low achievement in reading, mathematics and science – PISA (%)
The share of 15-year-olds failing to reach level 2 in reading, mathematics and science.
17 Participation in training/lifelong learning (age group 25–64) by sex (%)
The share of persons aged 25–64 who stated that they had received education or training in the four weeks preceding the (LFS) survey.
EGYPT 2016 | 14
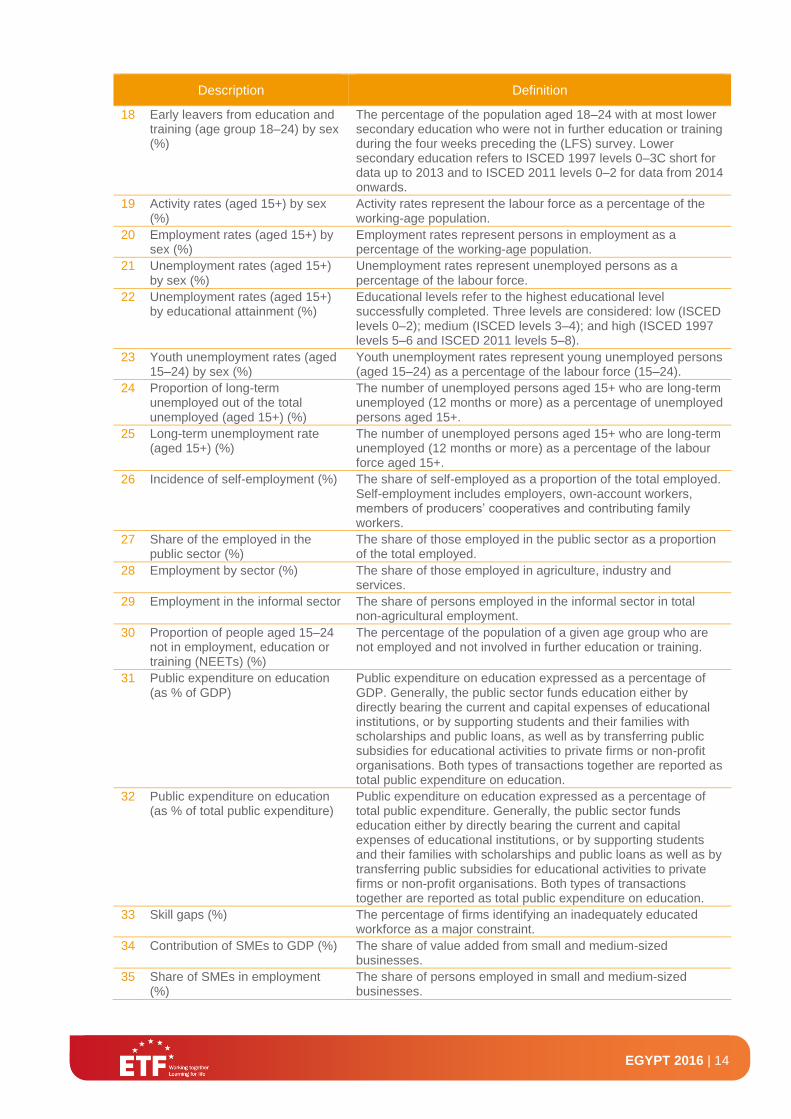
Description Definition
18 Early leavers from education and training (age group 18–24) by sex (%)
The percentage of the population aged 18–24 with at most lower secondary education who were not in further education or training during the four weeks preceding the (LFS) survey. Lower secondary education refers to ISCED 1997 levels 0–3C short for data up to 2013 and to ISCED 2011 levels 0–2 for data from 2014 onwards.
19 Activity rates (aged 15+) by sex (%)
Activity rates represent the labour force as a percentage of the working-age population.
20 Employment rates (aged 15+) by sex (%)
Employment rates represent persons in employment as a percentage of the working-age population.
21 Unemployment rates (aged 15+) by sex (%)
Unemployment rates represent unemployed persons as a percentage of the labour force.
22 Unemployment rates (aged 15+) by educational attainment (%)
Educational levels refer to the highest educational level successfully completed. Three levels are considered: low (ISCED levels 0–2); medium (ISCED levels 3–4); and high (ISCED 1997 levels 5–6 and ISCED 2011 levels 5–8).
23 Youth unemployment rates (aged 15–24) by sex (%)
Youth unemployment rates represent young unemployed persons (aged 15–24) as a percentage of the labour force (15–24).
24 Proportion of long-term unemployed out of the total unemployed (aged 15+) (%)
The number of unemployed persons aged 15+ who are long-term unemployed (12 months or more) as a percentage of unemployed persons aged 15+.
25 Long-term unemployment rate (aged 15+) (%)
The number of unemployed persons aged 15+ who are long-term unemployed (12 months or more) as a percentage of the labour force aged 15+.
26 Incidence of self-employment (%) The share of self-employed as a proportion of the total employed. Self-employment includes employers, own-account workers, members of producers’ cooperatives and contributing family workers.
27 Share of the employed in the public sector (%)
The share of those employed in the public sector as a proportion of the total employed.
28 Employment by sector (%) The share of those employed in agriculture, industry and services.
29 Employment in the informal sector The share of persons employed in the informal sector in total non-agricultural employment.
30 Proportion of people aged 15–24 not in employment, education or training (NEETs) (%)
The percentage of the population of a given age group who are not employed and not involved in further education or training.
31 Public expenditure on education (as % of GDP)
Public expenditure on education expressed as a percentage of GDP. Generally, the public sector funds education either by directly bearing the current and capital expenses of educational institutions, or by supporting students and their families with scholarships and public loans, as well as by transferring public subsidies for educational activities to private firms or non-profit organisations. Both types of transactions together are reported as total public expenditure on education.
32 Public expenditure on education (as % of total public expenditure)
Public expenditure on education expressed as a percentage of total public expenditure. Generally, the public sector funds education either by directly bearing the current and capital expenses of educational institutions, or by supporting students and their families with scholarships and public loans as well as by transferring public subsidies for educational activities to private firms or non-profit organisations. Both types of transactions together are reported as total public expenditure on education.
33 Skill gaps (%) The percentage of firms identifying an inadequately educated workforce as a major constraint.
34 Contribution of SMEs to GDP (%) The share of value added from small and medium-sized businesses.
35 Share of SMEs in employment (%)
The share of persons employed in small and medium-sized businesses.
EGYPT 2016 | 15
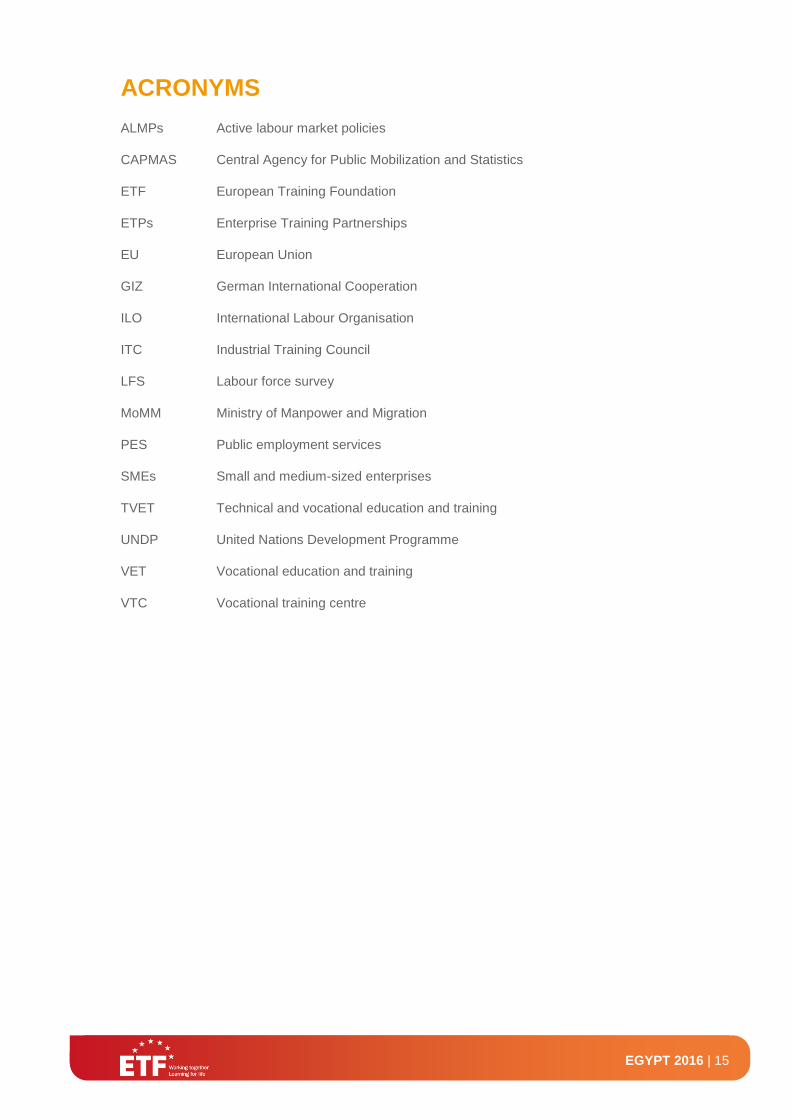
ACRONYMS
ALMPs Active labour market policies
CAPMAS Central Agency for Public Mobilization and Statistics
ETF European Training Foundation
ETPs Enterprise Training Partnerships
EU European Union
GIZ German International Cooperation
ILO International Labour Organisation
ITC Industrial Training Council
LFS Labour force survey
MoMM Ministry of Manpower and Migration
PES Public employment services
SMEs Small and medium-sized enterprises
TVET Technical and vocational education and training
UNDP United Nations Development Programme
VET Vocational education and training
VTC Vocational training centre

FOR FURTHER INFORMATION ABOUT OUR ACTIVITIES PLEASE CONTACT:
COMMUNICATION DEPARTMENT EUROPEAN TRAINING FOUNDATION VIALE SETTIMIO SEVERO 65I - 10133 TORINO
E: [email protected] T: +39 011 6302222 F: +39 011 6302200 WWW.ETF.EUROPA.EU