Embed Size (px)
Citation preview

© 2018 Imperas Software Limited www.OVPworld.org Page 1 of 43
eGui Eclipse™ User Guide
Author: Imperas Software Limited Version: 2.3.0 Filename: eGui_Eclipse_User_Guide.doc Project: Imperas Eclipse Project eGui Last Saved: Friday, 16 February 2018 Keywords:
Imperas Software LimitedImperas Buildings, North Weston,
Thame, Oxfordshire, OX9 2HA, UK [email protected]
eGui Eclipse™ User Guide
© 2018 Imperas Software Limited www.OVPworld.org Page 2 of 43 .
Copyright Notice Copyright © 2018 Imperas Software Limited All rights reserved. This software and documentation contain information that is the property of Imperas Software Limited. The software and documentation are furnished under a license agreement and may be used or copied only in accordance with the terms of the license agreement. No part of the software and documentation may be reproduced, transmitted, or translated, in any form or by any means, electronic, mechanical, manual, optical, or otherwise, without prior written permission of Imperas Software Limited, or as expressly provided by the license agreement. Right to Copy Documentation The license agreement with Imperas permits licensee to make copies of the documentation for its internal use only. Each copy shall include all copyrights, trademarks, service marks, and proprietary rights notices, if any. Destination Control Statement All technical data contained in this publication is subject to the export control laws of the United States of America. Disclosure to nationals of other countries contrary to United States law is prohibited. It is the reader’s responsibility to determine the applicable regulations and to comply with them. Disclaimer IMPERAS SOFTWARE LIMITED, AND ITS LICENSORS MAKE NO WARRANTY OF ANY KIND, EXPRESS OR IMPLIED, WITH REGARD TO THIS MATERIAL, INCLUDING, BUT NOT LIMITED TO, THE IMPLIED WARRANTIES OF MERCHANTABILITY AND FITNESS FOR A PARTICULAR PURPOSE.
eGui Eclipse™ User Guide
© 2018 Imperas Software Limited www.OVPworld.org Page 3 of 43 .
Table of Contents
1 Preface......................................................................................................................... 4 1.1 Notation............................................................................................................... 4 1.2 Related OVP Documents .................................................................................... 4 1.3 Related Imperas Documents ............................................................................... 4
2 Introduction................................................................................................................. 5 2.1 OVP Virtual Platforms........................................................................................ 5
3 Installing Imperas eGui............................................................................................... 6 3.1 Prerequisites ........................................................................................................ 6 3.2 Installing the eGui_Eclipse package................................................................... 6
4 Additional Features in eGui for Imperas MPD users.................................................. 7 4.1 Launching eGui from the simulation command line .......................................... 7 4.2 Simultaneous debug with MPD .......................................................................... 8 4.3 Multiple processor support in breakpoints.......................................................... 9 4.4 Imperas Programmers View object display ...................................................... 11 4.5 MPD Debugger Console for issuing MPD and VAP commands ..................... 13
5 Starting a debug session............................................................................................ 14 5.1 Specifying platform options.............................................................................. 14 5.2 Starting a standalone debug session.................................................................. 14
5.2.1 The eGui port file...................................................................................... 15 5.3 Starting a debug session from Eclipse .............................................................. 16
5.3.1 Starting the Imperas eGui Eclipse product ............................................... 16 5.3.1.1 The Java Runtime Environment (JRE) ................................................. 16 5.3.1.2 Selecting a workspace........................................................................... 17
5.3.2 Importing a project.................................................................................... 17 5.3.3 Eclipse launch configurations ................................................................... 19
6 A Sample Debug Session Using MPD...................................................................... 22 6.1 Prerequisites ...................................................................................................... 22 6.2 Starting the debug session................................................................................. 23 6.3 The MPD Debug View ..................................................................................... 23 6.4 Setting a breakpoint from the console view...................................................... 24 6.5 Running and stepping the simulation................................................................ 25 6.6 Terminating the simulation ............................................................................... 26 6.7 Viewing local variables in a function ............................................................... 26 6.8 Adding breakpoints from the source window................................................... 28 6.9 Examining context across the platform............................................................. 29 6.10 Eventpoints on reads/writes of peripheral registers .......................................... 31
7 A Sample Debug Session Using GDB...................................................................... 34 7.1 Prerequisites ...................................................................................................... 34 7.2 Starting the debug session................................................................................. 34 7.3 Example GDB Debug Session for Dhrystone Benchmark application ............ 37 7.4 Removing Breakpoints...................................................................................... 43

eGui Eclipse™ User Guide
© 2018 Imperas Software Limited www.OVPworld.org Page 4 of 43 .
1 Preface This document describes how to debug an application running on the OVP or Imperas Professional simulator using the Imperas eGui (based on Eclipse™) Integrated Development Environment. The Imperas eGui is based upon Eclipse Neon version 4.6.3 and provided as the installation package eGui_Eclipse. This provides a standalone version of Eclipse and also includes an Eclipse plugin archive that can be used to add the Imperas eGui feature to other compatible Eclipse installations. This package must be installed and used in conjunction with a standard OVP or Imperas product package installation. The example in this document demonstrates debugging of ARM and MIPS32 applications but the same approach is valid for applications running on processor models for any architecture supported by the OVP simulator except the OR1K, because the GDB provided with the OR1K processor is obsolete and does not support the MI interface needed to be used with Imperas eGui.
1.1 Notation TCode T Code and command extracts
1.2 Related OVP Documents The following documents are part of the OVP and Imperas installations and can be found in the directory: $IMPERAS_HOME/doc/ovp
• Imperas Installation and Getting Started Guide • OVPsim and CpuManager User Guide
1.3 Related Imperas Documents The following documents for the Imperas Professional Tools are part of the Imperas installation and can be found in the directory: $IMPERAS_HOME/doc/imperas
• Imperas Debugger User Guide

eGui Eclipse™ User Guide
© 2018 Imperas Software Limited www.OVPworld.org Page 5 of 43 .
2 Introduction This document describes how to install and use the Imperas eGui (based on Eclipse) debugger for interactive debugging of OVP virtual platforms. The Imperas eGui (based on Eclipse) debugger (hereafter referred to as eGui) is based on the popular Eclipse IDE, version 4.6.3 (Neon) with the additions of:
1. The Imperas eGui feature, which enhances Eclipse to connect to an OVP or Imperas simulation for debugging. (See the OVPsim and CpuManager User Guide for information on OVP platforms.)
2. An enhanced version of the Eclipse C Development Tools (CDT) feature which adds support for debugging multiple processors simultaneously.
eGui can be used as just a standalone debugger for connecting to the Imperas simulator or it can be used as a full Eclipse Integrated Development Environment (IDE), allowing you to manage and build projects. If you already use Eclipse as your IDE and wish to continue using your existing Eclipse version then eGui Eclipse can be easily invoked from your standard Eclipse as a separate standalone debugger using an External Tools Configuration, as explained later in this document.
2.1 OVP Virtual Platforms The eGui feature supports connecting to OVP virtual platforms to debug application software and/or peripheral model behavioral code. The platform and models require one of the OVPsim or Imperas professional simulators which provide different debugging capabilities as discussed below. The OVPsim simulator supports:
• Debug of a single processor or peripheral model in a platform using the GNU debugger (GDB).
The Imperas DEV simulator supports:
• Debug of multiple processor or peripheral models in a platform using the GNU debugger (GDB). Each GDB connection is independent and all must be in a run state for simulation to proceed.
The Imperas SDK simulator supports:
• Simultaneous debug of all processors and peripheral models in a platform using the Imperas Multi Processor Debugger (MPD).
• Programmers View of registers and other model elements provided by the processor and peripheral models.
• VAP tools which provide additional powerful debugging capabilities.

eGui Eclipse™ User Guide
© 2018 Imperas Software Limited www.OVPworld.org Page 6 of 43 .
3 Installing Imperas eGui
3.1 Prerequisites The following OVPsim and/or Imperas packages must be installed to use eGui: One of:
• OVPsim • Imperas_DEV • or Imperas_SDK
Plus:
• eGui_Eclipse The Imperas Installation and Getting Started Guide provides a step-by-step guide to obtaining and installing the OVP and Imperas packages containing the simulator, native compiler and cross compiler tools. It is strongly recommended that you follow that guide until you are able to build and simulate before attempting to debug using eGui. In particular the Imperas environment must be setup as described in the Installation guide.
3.2 Installing the eGui_Eclipse package eGui can be added to your Imperas installation by installing the eGui_Eclipse package. This package is provided in a self installing executable file available for download from the ovpworld.org or imperas.com websites (registration required). The installer is a file named: eGui_Eclipse.<version>.<arch>.exe (Note, the file name includes the .exe suffix for Linux as well as Windows for consistency.) For Linux it may be necessary to make the file executable with the command: chmod +x <fn> To install, simply execute the installer and follow the directions. See the Imperas Installation and Getting Started Guide for additional information. The eGui installation installs the following into the directory $IMPERAS_HOME/lib/$IMPERAS_ARCH/eGui.neon:
1. The Imperas eGui (based on Eclipse) standalone product. 2. A Java Runtime Executable (JRE).

eGui Eclipse™ User Guide
© 2018 Imperas Software Limited www.OVPworld.org Page 7 of 43 .
4 Additional Features in eGui for Imperas MPD users eGui is an extension of the standard Eclipse CDT IDE which adds an interface to the Imperas simulator. There are many excellent resources available that describe the Eclipse IDE in detail and we will not attempt to describe the myriad useful standard Eclipse features in this document. Instead we will describe the Imperas-specific extensions to Eclipse and a few of the basic debugging features of Eclipse needed to work through some examples. eGui provides the following additional features beyond those offered by the standard Eclipse CDT:
• Launching eGui from the simulation command line o Debug with GDB of a single processor or Peripheral o Debug with independent GDB sessions of multiple processors and
peripherals (Imperas DEV required) o Simultaneous debug of multiple processor and peripheral models (MPD
required) • Multiple processor support in breakpoints (MPD required) • Imperas Programmers View object display (MPD required) • MPD Debugger Console including command history/editing for issuing MPD and
VAP commands (MPD required) A brief description of each of these features follows. More detailed information can be found through out the rest of this document.
4.1 Launching eGui from the simulation command line This is the simplest way to start a debug session. The following simulator command line arguments are available for starting an eGui debug session connected to the simulation: --mpdegui
This will connect to eGui in MPD mode,. MPD mode supports simultaneous debug of all processors and peripherals in the platform. This require an Imperas MPD license.
--gdbegui This will connect to eGui in GDB mode. GDB mode supports debug of a single processor only. In platforms with multiple processors the --debugprocessor <platform>/<cpu> option will also be needed to specify the processor to be debugged, where <platform> and <cpu> are the respective platform and processor names.
eGui Eclipse™ User Guide
© 2018 Imperas Software Limited www.OVPworld.org Page 8 of 43 .
eGui will be started if it is not already running. If eGui is already running then a new debug session will be started in it. (You should normally terminate any running debug session before starting a new one.)
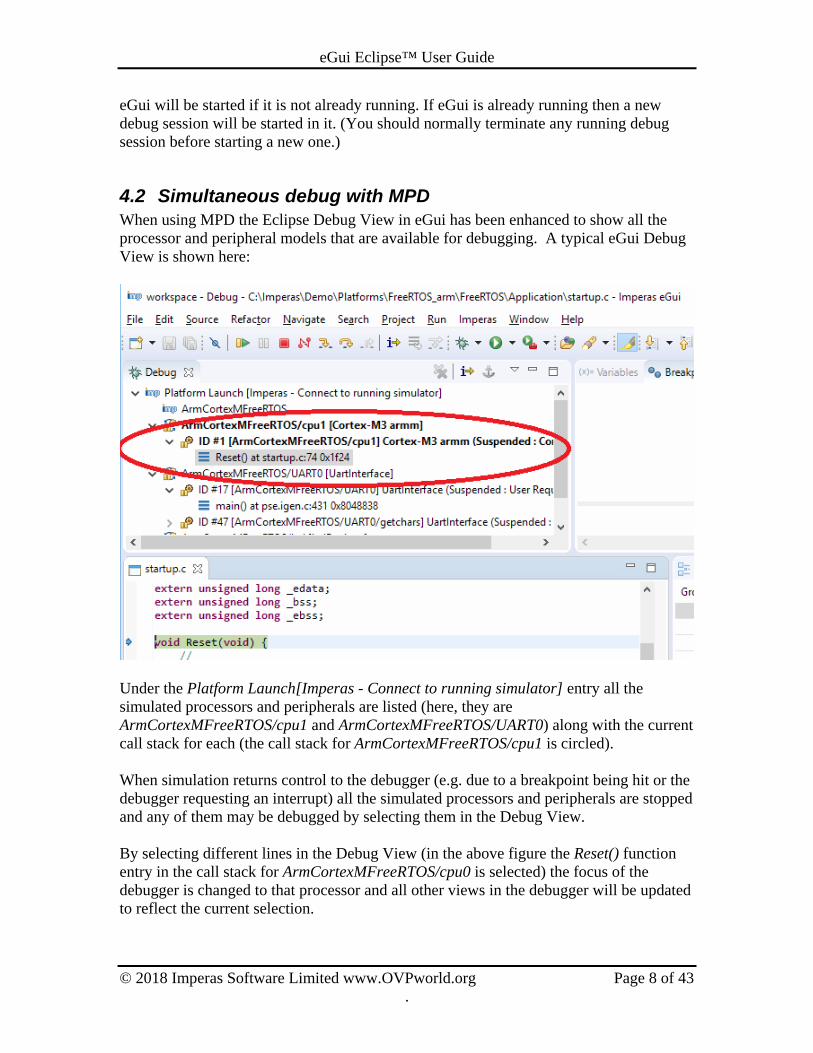
4.2 Simultaneous debug with MPD When using MPD the Eclipse Debug View in eGui has been enhanced to show all the processor and peripheral models that are available for debugging. A typical eGui Debug View is shown here:T
Under the Platform Launch[Imperas - Connect to running simulator] entry all the simulated processors and peripherals are listed (here, they are ArmCortexMFreeRTOS/cpu1 and ArmCortexMFreeRTOS/UART0) along with the current call stack for each (the call stack for ArmCortexMFreeRTOS/cpu1 is circled). When simulation returns control to the debugger (e.g. due to a breakpoint being hit or the debugger requesting an interrupt) all the simulated processors and peripherals are stopped and any of them may be debugged by selecting them in the Debug View. By selecting different lines in the Debug View (in the above figure the Reset() function entry in the call stack for ArmCortexMFreeRTOS/cpu0 is selected) the focus of the debugger is changed to that processor and all other views in the debugger will be updated to reflect the current selection.

eGui Eclipse™ User Guide
© 2018 Imperas Software Limited www.OVPworld.org Page 9 of 43 .
4.3 Multiple processor support in breakpoints The Breakpoints view has been enhanced to support defining processor-specific breakpoints. When setting a breakpoint in eGui it is set on only the current active processor by default. As an example, go to the ARM Cortex-A15UP multi_core demo and run it with the --mpdegui option: T> cd $IMPERAS_HOME/Demo/Processors/ARM/Cortex/Cortex-A15UP/multi_core T> ./Run_MultiCore2.sh --mpdegui
After starting eGui select iss/cpu1 and enter the commands b main and continue in the Debugger Console window:
We can see in the Breakpoint view that the newly created breakpoint has a context of iss/cpu1:

eGui Eclipse™ User Guide
© 2018 Imperas Software Limited www.OVPworld.org Page 10 of 43 .
If we subsequently select iss/cpu0 in the Debug view, then enter the command break main in the Debugger Console again and look at the breakpoint we will see iss/cpu0 added to it:

eGui Eclipse™ User Guide
© 2018 Imperas Software Limited www.OVPworld.org Page 11 of 43 .
The breakpoint properties menu may also be used to change a breakpoint's context after the breakpoint has been added by right-clicking the breakpoint and selecting Breakpoint Properties... from the context menu, and modifying the Context Filter setting:
NOTE: Opening the breakpoint properties with ALT-Enter rather than right clicking and selecting from the context menu opens a properties menu for gdb that is not supported by MPD. Do not use this method to edit the breakpoint properties when using MPD!
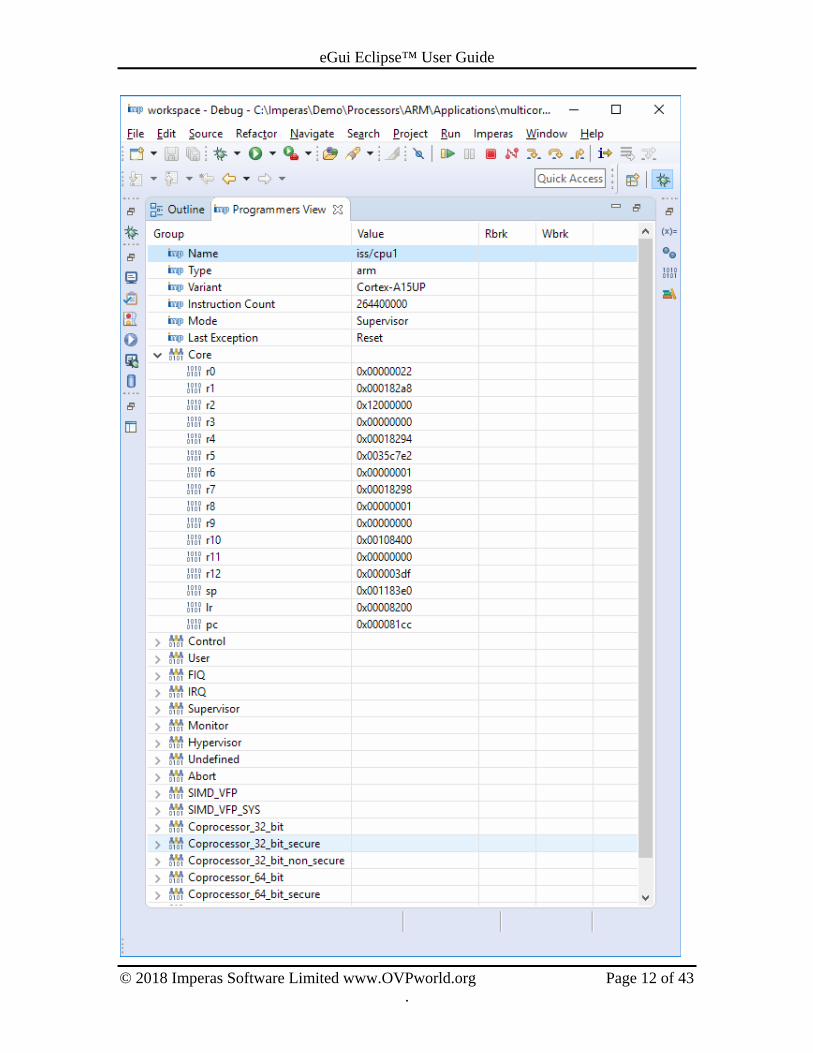
4.4 Imperas Programmers View object display eGui adds a new view that shows the Imperas Programmers View values for the selected processor. The Programmers View is a set of values selected by the model developer to be visible through the Programmers View interface. The values displayed vary depending on the specific model. For example, below is the programmers view for an ARM Cortex processor model:
eGui Eclipse™ User Guide
© 2018 Imperas Software Limited www.OVPworld.org Page 12 of 43 .

eGui Eclipse™ User Guide
© 2018 Imperas Software Limited www.OVPworld.org Page 13 of 43 .
Here we see there is various information about the processor including the name, type, variant, instruction count, mode and most recent exception type, as well as the current value of each register (including general purpose, banked and system registers). The Rbrk and Wbrk check boxes are available for peripheral models to set and remove read/write breakpoints for peripheral registers. However they are not available on processor models - use the MPD isetregwatchpoint command instead.
4.5 MPD Debugger Console for issuing MPD and VAP commands
eGui opens a Debugger Console window that allows commands to be given directly to the Imperas Multi-Processor Debugger (MPD):
Note: If the Debugger Console tab is not displayed you can add the view to your Debug Perspective by selecting Window->Show View->Debugger Console from the main Eclipse menus. The Debugger Console is where MPD commands (including VAP Tool commands) can be directly typed. For a full description of the commands available in this window see the Imperas Debugger User Guide. Note that there are two shell modes described in this document: Debug mode and Tcl mode. Use the command tcl to enter Tcl mode from Debug mode, and the command idebug to enter Debug mode from Tcl mode. In Debug mode use the command help to see online help messages. In Tcl mode use the command ihelp to see online help messages for that mode. When in Debug mode a single Tcl command may be executed by prefixing it with '::'. See the figure above for an example of executing the Tcl ::ihelp command in Debug mode.

eGui Eclipse™ User Guide
© 2018 Imperas Software Limited www.OVPworld.org Page 14 of 43 .
5 Starting a debug session There are several ways to start a debug session depending on whether you want to just run a standalone debug session or are using Eclipse as your IDE to edit and debug your projects, and also whether you have a license for the Imperas Multi-Processor Debug (MPD) utility. With Imperas MPD support all of the processors and peripherals in the platform may be debugged simultaneously. Without Imperas MPD support, GDB is used directly and only a single processor or peripheral may be debugged at a time with OVP.
5.1 Specifying platform options Debugging is enabled when starting an OVP platform by specifying command line or control file options, or can be built into the platform source. If the platform includes the Imperas Command Line Parser (CLP) then the platform executable file will support command line options to enable debugging without the need to make any changes to the platform source. See the Simulation Control of Platforms and Modules User Guide for information on adding the CLP to a platform. The examples in this document assume that the CLP is present in the platform, which is true for the examples and demos provided by Imperas. An alternative to the CLP is to use a control file to specify platform options at runtime. See the OVP Control File User Guide for information on using control files. The platform source may also enable debugging using OP API calls. See the OP API documentation for information, although the CLP makes the use of these unnecessary in most cases.
5.2 Starting a standalone debug session This is the simplest way to start a debug session. Standalone debugging sessions are started by the simulator, rather than from Eclipse, so do not require using Eclipse projects. eGui will be started if it is not already running. The following platform options are available for starting a standalone debug session: --mpdegui
This will start eGui in MPD mode. MPD mode supports simultaneous debug of all processors and peripherals in the platform. This require an Imperas MPD license.
--gdbegui This will connect to eGui in GDB mode, starting it up if it is not already running. A GDB mode connection supports debug of a single processor only. In platforms with multiple processors the --debugprocessor <platform>/<cpu> option will also be

eGui Eclipse™ User Guide
© 2018 Imperas Software Limited www.OVPworld.org Page 15 of 43 .
needed to specify the processor to be debugged, where platform and cpu are the respective platform and processor names.
As discussed in section X5.1X, these may be specified on the command line of the platform executable (if the CLP parser is present) or in a control file. 5.2.1 The eGui port file A standalone eGui debug session is initiated from the simulator. The simulator determines whether eGui is already running by looking for the eGui port file. This file is created when an Eclipse with the eGui feature starts up and it contains the TCP port number that eGui listens to for connections. The file name for the eGui port file is determined by:
1. The value of the IMPERAS_EGUI_PORT_FILE environment variable, if specified.
2. If that environment variable is not set then the file name defaults to: $HOME/.egui.port on Linux %USERPROFILE%\.egui.port on Windows
If the eGui port file exists and a listener is found on the port, then a standalone debug session is started in the running eGui Eclipse which connects to the newly started platform. If the eGui port file does not exist, or if no listener is found on the port, then eGui Eclipse is launched which then connects to the newly started platform. Note:
• If the eGui feature has been added to an existing Eclipse installation, then using --mpdegui or --gdbegui will connect to it if it is already running, since the eGui feature in that Eclipse will have created an eGui port file.
• When no valid eGui port file exists the platform will only start the eGui product in the Imperas installation - it will not start an Eclipse that has added the eGui feature. Thus if you wish to use your own Eclipse installation with the eGui feature for standalone debugging it must already be running when the platform is started.
• If multiple instances of the eGui feature run simultaneously the eGui port file will contain the port for the one started most recently. The IMPERAS_EGUI_PORT_FILE environment variable may be used to control connecting to different instances running simultaneously.

eGui Eclipse™ User Guide
© 2018 Imperas Software Limited www.OVPworld.org Page 16 of 43 .
5.3 Starting a debug session from Eclipse For users who use Eclipse as their IDE, starting a debug session from within Eclipse may be more convenient, but requires setting up Eclipse launch configurations to both run the platform and start the debug session. 5.3.1 Starting the Imperas eGui Eclipse product The eGui_Eclipse package includes a fully functional Eclipse, referred to here as eGui. Users may wish to use this as their IDE in addition to using it as a standalone debugger as described in section X5.2X. This section contains information on running the eGui Eclipse installation provided by Imperas as an IDE. eGui Eclipse may be started by executing the command egui.exe from any Linux or MSys shell or a Windows Command Prompt that has been setup with the Imperas environment. egui.exe is a wrapper program that verifies the environment and launches the eGui product found in:
$IMPERAS_HOME/lib/$IMPERAS_ARCH/eGui.neon/eguieclipse{.exe} egui.exe arguments include: --help
Print a help message listing all arguments --version
Print the version and exit --verbose
Print additional information that may be useful for troubleshooting --open <fn>
Open the indicated file in Eclipse, using the default viewer for the file type. This is primarily intended to be used for viewing the VAP Tools functionprofile (*.iprof) and linecoverage (*.icov) results but can be used for any file type supported by eGui.
--eguioptions <string> Specifies Eclipse command line options to be added to the eguieclipse command line. Consult the Eclipse documentation Running Eclipse section for the valid options. Multiple --eguioptions may be specified and they will be combined. Option strings containing spaces may be specified by enclosing in quotes.
(There are several additional arguments intended for internal use by the simulator when launching standalone debugging sessions that are not documented here.)
⇒ Note that Eclipse only supports options that start with '-' and will UsilentlyU ignore options that start with '--'.
5.3.1.1 The Java Runtime Environment (JRE) The eGui_Eclipse package includes a Java Runtime Environment (JRE) whose root is in the same directory as the eguieclipse executable and will be used by Eclipse by default.

eGui Eclipse™ User Guide
© 2018 Imperas Software Limited www.OVPworld.org Page 17 of 43 .
The Eclipse -vm command line option may be used to override this default JRE. See the Eclipse documentation for additional details. 5.3.1.2 Selecting a workspace When eGui is started a workspace prompt will appear (unless the Eclipse -data option specifying the workspace directory is specified):
The workspace is where Eclipse stores settings for the session. Settings from a previous session may be used again by using the same workspace. For standalone debugging you may want to just use a temporary workspace, perhaps in your working directory. If you are using Eclipse as your IDE you probably want to use a permanent workspace that will save projects and other information that you configure, so select an appropriate location for the workspace, perhaps in your home directory. Note that the workspace cannot be under a directory that will be imported as a project. See the Eclipse documentation for additional information about workspaces. 5.3.2 Importing a project To use eGui as your IDE you need to create a project. We will walk through the process of importing an Imperas Demo directory as a project. First select from The Eclipse menu File->Import->C/C++->Existing Code as Makefile Project and select Next. In the dialog box that comes up select Browse and browse to the $IMPERAS_HOME\demo\Processors\ARM directory, for example, and then select Finish:

eGui Eclipse™ User Guide
© 2018 Imperas Software Limited www.OVPworld.org Page 18 of 43 .
In order to see the project we must open the C/C++ perspective by selecting from the Eclipse menu Window->Perspective->Open Perspective->C/C++. The imported project will now be visible in the project Explorer view of the C/C++ perspective:

eGui Eclipse™ User Guide
© 2018 Imperas Software Limited www.OVPworld.org Page 19 of 43 .
5.3.3 Eclipse launch configurations To start a debug session from within Eclipse you use launch configurations. There are several different types of launch configurations. The following is a brief introduction to the ones relevant to starting debugging sessions for Imperas/OVP platforms. An Eclipse External Tools Configuration is used to start an OVP simulation platform from within Eclipse. The platform arguments should include the --port <port number> command line argument telling the simulator to open a debug port on the specified port number. (If the port number 0 is specified the simulator will open the next available system port and report the port number it selected.) An Eclipse Debug Configuration is then used to launch a debug session that connects to the simulation platform. If an MPD license is available this may use the Imperas - Connect debug configuration provided by the eGui feature. If an MPD license is not available a standard Eclipse CDT C/C++ Remote Application debug configuration may be used to connect using GDB. An Eclipse Launch Group may be used to launch both the external tools and debug configurations together with a single button for convenience. The External Tools Configuration, C/C++ Remote Application and Launch Group are standard Eclipse features and information on them may be found in the Eclipse documentation.

eGui Eclipse™ User Guide
© 2018 Imperas Software Limited www.OVPworld.org Page 20 of 43 .
To create a Debug Configuration select Run->Debug Configurations... This will bring up the Imperas - Connect dialog. Then select Imperas - Connect and then the New launch configuration (the rectangle with a + in the top left corner):
The fields are as follows: Name
This is the name assigned to the debug configuration, similar to standard Eclipse configurations.
Port This is the port that the platform is listening to, waiting for a connection. It should match the value specified when the platform was launched, or if a port of 0 was specified for the platform it should match the port number reported by the platform.
eGui Eclipse™ User Guide
© 2018 Imperas Software Limited www.OVPworld.org Page 21 of 43 .
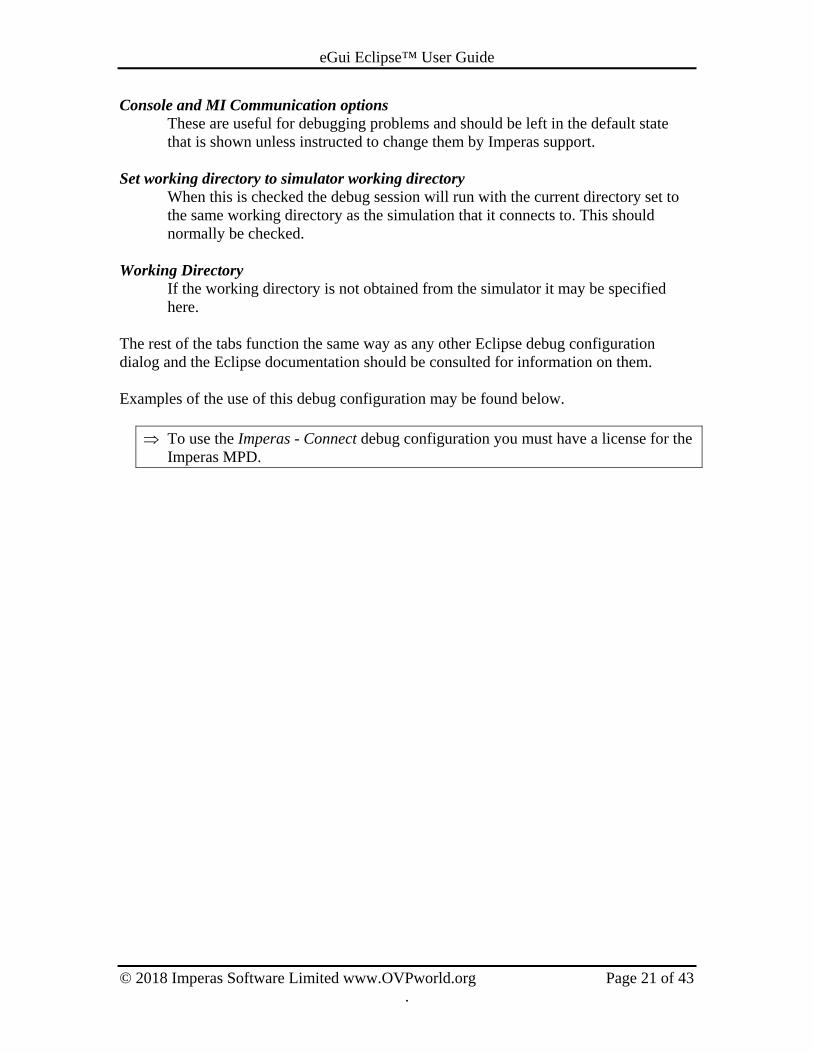
Console and MI Communication options These are useful for debugging problems and should be left in the default state that is shown unless instructed to change them by Imperas support.
Set working directory to simulator working directory
When this is checked the debug session will run with the current directory set to the same working directory as the simulation that it connects to. This should normally be checked.
Working Directory If the working directory is not obtained from the simulator it may be specified here.
The rest of the tabs function the same way as any other Eclipse debug configuration dialog and the Eclipse documentation should be consulted for information on them. Examples of the use of this debug configuration may be found below.
⇒ To use the Imperas - Connect debug configuration you must have a license for the Imperas MPD.

eGui Eclipse™ User Guide
© 2018 Imperas Software Limited www.OVPworld.org Page 22 of 43 .
6 A Sample Debug Session Using MPD The following is a quick walk through of a debug session using MPD to simultaneously debug a processor and peripheral models. This example requires the Imperas SDK product. Users of OVPsim or the Imperas DEV product should see the example using GDB instead. The platform being debugged has a processor, memory, a UART and a LED registers peripheral and is running the FreeRTOS operating system:
6.1 Prerequisites To follow this example you will need the following Imperas and OVP packages installed:
• Imperas_SDK • eGui_Eclipse • Demo_FreeRTOS_arm
The Imperas environment must be set up according to the directions in Imperas Installation and Getting Started Guide.

eGui Eclipse™ User Guide
© 2018 Imperas Software Limited www.OVPworld.org Page 23 of 43 .
An Imperas MPD license is required. Users without an MPD license should skip this section and see section X7X which uses GDB rather than MPD.
6.2 Starting the debug session After all the prerequisite packages have been installed and the Imperas environment configured, to start the session enter the following commands from a Linux shell or a Windows MSys shell: T> cd $IMPERAS_HOME/Demo/Platforms/FreeRTOS_arm/harness T> ./RUN_FreeRTOS.sh --mpdegui
or, from a Windows command shell: Tcd %IMPERAS_HOME%\Demo\Platforms\FreeRTOS_arm T> cd harness T.\RUN_FreeRTOS.sh --mpdegui eGui will prompt you to select a workspace Just select "workspace" which will create the directory workspace in the current directory:
6.3 The MPD Debug View The Debug view shows all the debuggable processors in the simulation:

eGui Eclipse™ User Guide
© 2018 Imperas Software Limited www.OVPworld.org Page 24 of 43 .
Here we see in the Debug view the following debuggable models listed:
• ArmCortexMFreeRTOS/cpu1 • ArmCortexMFreeRTOS/UART0 • ArmCortexMFreeRTOS/LEDRegister
With MPD we can simultaneously debug all of these processors - when a breakpoint is hit they all will stop and when a resume command is issued they will all start.
6.4 Setting a breakpoint from the console view Once the eGui window is open start the debug session by adding a breakpoint on the symbol main in the ARM processor. First select ArmCortexMFreeRTOS/cpu1 in the Debug view and then type the gdb command b main in the Debugger Console view:
If we select the Breakpoints view we can see the new breakpoint listed:

eGui Eclipse™ User Guide
© 2018 Imperas Software Limited www.OVPworld.org Page 25 of 43 .
6.5 Running and stepping the simulation We can now tell the simulation to start running by selecting the Resume icon (a yellow bar next to a green triangle) and it will run up to the breakpoint we have set in the function main, and display the source of the main function:

eGui Eclipse™ User Guide
© 2018 Imperas Software Limited www.OVPworld.org Page 26 of 43 .
At this point we can use the step into, step over and step return buttons to step through the program (Note: f5, f6 and f7 respectively may be used in place of each button):
6.6 Terminating the simulation If at any point we find we need to restart the simulation then simply select the Terminate icon (a red square) or press Ctrl-F2:
At this point we can re-run the simulation command in the terminal window (without first shutting down eGui): T> ./RUN_FreeRTOS.sh --mpdegui
and a new debug session will be started without the overhead of restarting eGui.
6.7 Viewing local variables in a function Press step over (or f6) once and then step into (or f5) to step into the vStartFlashCoRoutines function. Then select the Variables view to see the values of the local variables defined in the function:

eGui Eclipse™ User Guide
© 2018 Imperas Software Limited www.OVPworld.org Page 27 of 43 .
Note that the uxIndex value has a random value in it, as it has not been set yet in the function - press step over (or f6) several times until we see uxIndex initialized to 0 (when a variable changes it is highlighted in yellow in the Variables view):
The Variables view shows the local variables of the stack entry currently selected in the Debug view. If we select a different stack element in the debug view the Variables view will be updated. For example if we select the main() function in the stack for cpu1 the Variables view gets updated (and in fact is empty, as there are no local variables defined in main():

eGui Eclipse™ User Guide
© 2018 Imperas Software Limited www.OVPworld.org Page 28 of 43 .
6.8 Adding breakpoints from the source window Breakpoints may be added by double clicking on the left edge of the source line where the breakpoint is to be set. Here we will set a breakpoint in the LEDRegister peripheral model. First we open the led.user.c source file by selecting the appropriate line in the Debug view:

eGui Eclipse™ User Guide
© 2018 Imperas Software Limited www.OVPworld.org Page 29 of 43 .
Now we will scroll up to the showLEDs function near the top of the the led.user.c source file and set a breakpoint on the closing bracket of the function, (after the bhmMessage call), by double clicking in the left margin of the source window:
If we select the Breakpoints view we can see the new breakpoint listed, with the context set to the LEDRegister peripheral:
6.9 Examining context across the platform Now we press resume (or 8) to run the simulator to the breakpoint we just set and we see we have stopped in the showLEDs function in the LEDRegister peripheral:

eGui Eclipse™ User Guide
© 2018 Imperas Software Limited www.OVPworld.org Page 30 of 43 .
And if we look in our shell where we started the simulation we see that the bhmMessage output has been printed to the simulator program's standard output:
At this point we can also examine the call stack in the application processor at the time the write to the peripheral register was made by selecting ArmCortexMFreeRTOS/cpu1 in the debug view:

eGui Eclipse™ User Guide
© 2018 Imperas Software Limited www.OVPworld.org Page 31 of 43 .
This can be very useful when debugging complicated operating systems to determine when peripherals are being accessed.
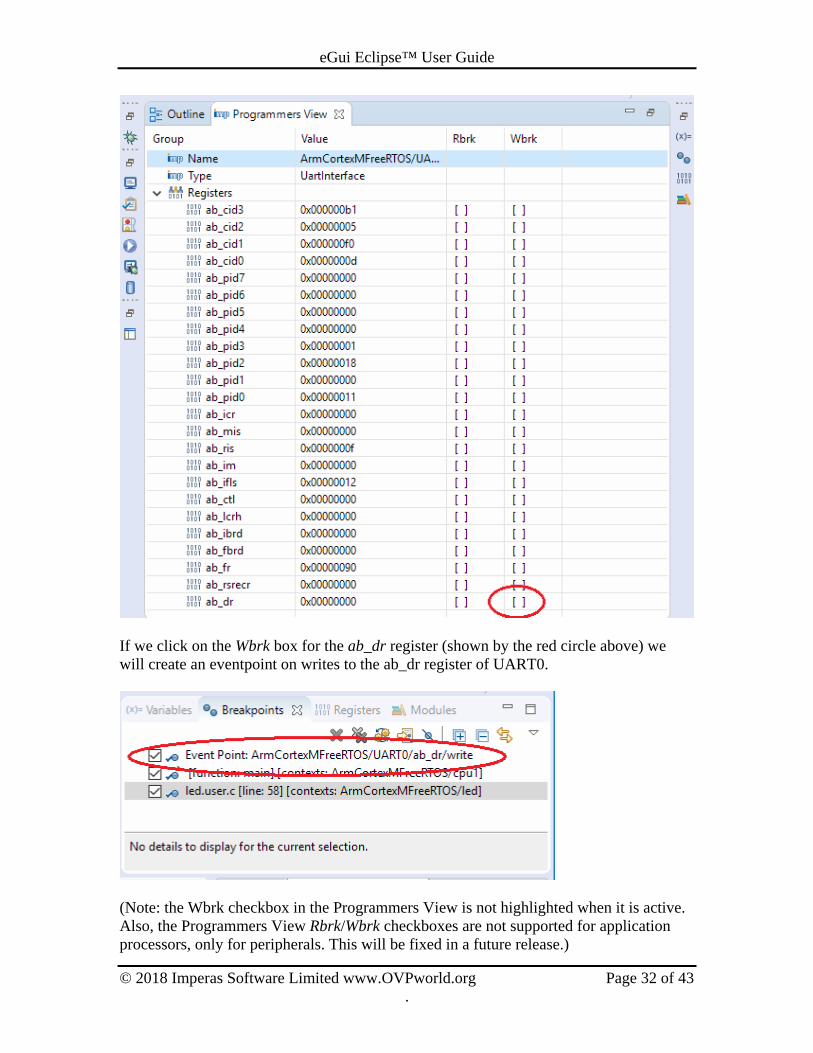
6.10 Eventpoints on reads/writes of peripheral registers The Programmers View may be used to easily insert Eventpoints (these are like breakpoints but for Programmers View events). The rbrk and wbrk boxes on each register may be used to add or remove an eventpoint on the read or write of a register. If we select the ArmCortexMFreeRTOS/UART0 peripheral in the Debug View, then select the Programmers View and expand the Registers list we see (after double clicking the Programmers View tab to expand it):
eGui Eclipse™ User Guide
© 2018 Imperas Software Limited www.OVPworld.org Page 32 of 43 .
If we click on the Wbrk box for the ab_dr register (shown by the red circle above) we will create an eventpoint on writes to the ab_dr register of UART0.
(Note: the Wbrk checkbox in the Programmers View is not highlighted when it is active. Also, the Programmers View Rbrk/Wbrk checkboxes are not supported for application processors, only for peripherals. This will be fixed in a future release.)

eGui Eclipse™ User Guide
© 2018 Imperas Software Limited www.OVPworld.org Page 33 of 43 .
Now we can press Resume (or f8) until the Debugger Console window shows that the eventpoint is hit:
(You may hit the led.user.c breakpoint a few times before the eventpoint is hit - disabling the breakpoint by unchecking its box in the Breakpoints view can avoid this.) Now if we look at the call stack for ArmCortexMFreeRTOS/cpu1 again we can again see where the write to that register has occurred:

eGui Eclipse™ User Guide
© 2018 Imperas Software Limited www.OVPworld.org Page 34 of 43 .
7 A Sample Debug Session Using GDB
7.1 Prerequisites To follow this example you will need the following Imperas and OVP packages installed:
• OVPsim Imperas_DEV • eGui_Eclipse
The Imperas environment must be set up according to the directions in Imperas Installation and Getting Started Guide. The installation includes a number of demos of processors running simple applications. These demos may be easily run in standalone debugging sessions by running with additional debug options specified. Also, the Imperas environment must be setup according to the directions in the Imperas Installation and Getting Started Guide.
7.2 Starting the debug session First we must change to the demo directory and start the demo in GDB mode. From a Linux shell or a Windows MSys shell: Tcd $IMPERAS_HOME/Demo/Processors/ARM/Cortex/Cortex-A15UP/single_core T./Run_Dhrystone.sh --gdbegui
or, from a Windows command shell: Tcd %IMPERAS_HOME%\Demo\Processors\ARM\Cortex\Cortex-A15UP/single_core T.\Run_Dhrystone.bat --gdbegui The shell from which the script was invoked will show the connection messages:

eGui Eclipse™ User Guide
© 2018 Imperas Software Limited www.OVPworld.org Page 35 of 43 .
Eclipse will prompt you for a workspace. Since we are just running a standalone debugging session we can create a new workspace in the current directory:
Once started Eclipse will be in the debug perspective stopped at main in the Dhrystone application waiting for debug commands:

eGui Eclipse™ User Guide
© 2018 Imperas Software Limited www.OVPworld.org Page 36 of 43 .
Now we can debug the program normally using the standard Eclipse features as described in the following section.

eGui Eclipse™ User Guide
© 2018 Imperas Software Limited www.OVPworld.org Page 37 of 43 .
7.3 Example GDB Debug Session for Dhrystone Benchmark application
1. Scroll down in the source code window to the line containing the call to
'Proc_5();' and set a breakpoint on that line by double clicking beside it:
Once set the breakpoint appears in the Breakpoints window:
2. Continue the simulation using the green 'Resume (F8)' symbol

eGui Eclipse™ User Guide
© 2018 Imperas Software Limited www.OVPworld.org Page 38 of 43 .
3. Step the application forward using the 'Step Into' button

eGui Eclipse™ User Guide
© 2018 Imperas Software Limited www.OVPworld.org Page 39 of 43 .
4. Select the register view; maximize the Registers window by double clicking on
the Registers tab; expand the 'General Registers' drop down list; select registers r0 through r12; Right click on the selected registers and set the format to hexadecimal

eGui Eclipse™ User Guide
© 2018 Imperas Software Limited www.OVPworld.org Page 40 of 43 .
5. Minimize the Registers window by double clicking on the Registers tab; step the application forward using the 'Step Into' button a few times. This will show you the colored highlighting of the registers that change
6. Open the Variables view; showing the current local variables. Note some variables are shown as '<optimized out>'. This is because we are debugging an executable with compiler optimizations enabled. Compiling your option with optimizations turned off, e.g. with the gcc option -O0, will allow allow all the variable values to be available.

eGui Eclipse™ User Guide
© 2018 Imperas Software Limited www.OVPworld.org Page 41 of 43 .
7. Select 'Instruction Stepping Mode' using the button.
8. Step the application forward using the 'Step Into' button. This will open the disassembly view and highlight the instructions as they are stepped.

eGui Eclipse™ User Guide
© 2018 Imperas Software Limited www.OVPworld.org Page 42 of 43 .
9. In the 'Memory' window, select 'Add Memory Monitor' (The plus symbol) and enter $sp to select the value of the register stack pointer to display in the memory window:
10. Move the application forward using the 'Step Return' button. The memory locations that are modified will be highlighted.
11. To finish the simulation you may either:

eGui Eclipse™ User Guide
© 2018 Imperas Software Limited www.OVPworld.org Page 43 of 43 .
a. Use 'Resume' (the green play button) to continue to the end of the application
b. Use 'Terminate' (the red square icon) After either of these the debug perspective can be cleaned up with the 'Remove All terminated Launches' button (the two gray x's in the debug view)
7.4 Removing Breakpoints Breakpoints are persistent between runs within Eclipse. It is not essential but it can be a good idea to remove all breakpoints prior to closing down Eclipse so that breakpoints are not applied erroneously on files when a different Eclipse session is invoked. ###