Embed Size (px)
Citation preview

eGROCERY: EVOLUTION, REVOLUTION OR HALLUCINATION?November 2000

Coriolis Research Ltd. is a strategic market research firm founded in 1997 and based in Auckland, New Zealand. Coriolis primarily works with clients in the food and fast moving consumer goods supply chain, from primary producers to retailers. In addition to working with clients, Coriolis regularly produces reports on current industry topics. Recent reports have included an analysis of the impact of the arrival of the German supermarket chain Aldi in Australia.
!
The lead researcher on this report was Tim Morris, one of the founding partners of Coriolis Research. Tim graduated from Cornell University in New York with a degree in Agricultural Economics, with a specialisation in Food Industry Management. Tim has worked for a number of international retailers and manufacturers, including Nestlé, Dreyer�s Ice Cream, Kraft/General Foods, Safeway and Woolworths New Zealand. Before helping to found Coriolis Research, Tim was a consultant for Swander Pace and Company in San Francisco, where he worked on management consulting and acquisition projects for clients including Danone, Heinz, Bestfoodsand ConAgra.
!
The coriolis force, named for French physicist Gaspard Coriolis (1792-1843), may be seen on a large scale in the movement of winds and ocean currents on the rotating earth. It dominates weather patterns, producing the counterclockwise flow observed around low-pressure zones in the Northern Hemisphere and the clockwise flow around such zones in the Southern Hemisphere. It is the result of a centripetal force on a mass moving with a velocity radially outward in a rotating plane. In market research it means understanding the big picture before you get into the details.
!
CORIOLISRESEARCHPO BOX 10 202, Mt. Eden, Auckland 1030, New Zealand
Tel: +64 9 623 1848; Fax: +64 9 353 1515; email: [email protected]

2
eGrocery
eGrocery
eGROCERY MARKET SHARE IN 2020
EVOLUTION REVOLUTION HALLUCINATION
2%
30%
0.02%
Projections of the potential for eGrocery vary widely

3
eGrocery
eGrocery
We believe that, at best, eGrocery retailing will be a niche business
I. Revolutions based on technological change can and have occurred in grocery retailing
II. Internet grocery retailing appears to be a rapidly emerging new channel
III. The financial viability of the concept is still unproven
IV. The impact of this evolution on traditional supermarkets will be limited, however, both manufacturers and retailers should carefully consider the consequences

4
eGrocery
eGrocery
I. Revolutions based on technological change can and have occurred in grocery retailing
– Major shifts in food buying behavior have been a result of technological change
– The companies that have recognized and adapted to these changes have prospered
– Successful concepts have shown massive and rapid growth
– The supermarket proved to be an irresistible proposition for most shoppers that beat home delivery once already

5
eGrocery
eGrocery
Major shifts in food buying behavior have been a result of technological change
FOUR ERA’S IN FOOD RETAILING
Railroad
Automobile(Truck)
-
“InformationSuperhighway”
Transport Appliances Media
Electric OvenCan Opener
RefrigeratorFreezer
Microwave
PersonalComputer
NewspaperMagazineTelegraph
TelephoneTelevision
-
Internet Web pages
1850’s
1940’s
1970’s
1990’s

6
eGrocery
eGrocery
The companies that have recognized and adapted to these changes have prospered
FOUR ERA’S IN FOOD RETAILING
RailroadNewspaper
AutomobileTelevisionRefrigeratorFreezer
Microwave
InternetPC
Transport Implications Companies
• Massive increase in food production in remote areas• Emergence of regional and national brands• Specialized production; economies of scale• Long distance spot orders; elimination of middleman• Mail order catalog sales
• Shoppers can buy more than they can carry• Shoppers go to best price, not where convenient• Interstate trucking - railroad for perishables• National promotion of national brands• Reduce need to buy on daily basis• Increase perishable item unit sizes
• Heat food very rapidly• Growth of convenience culture
• Timely information on demand
Sears RoebuckA&PNabiscoHormelPillsbury
SafewayKrogerP&GBirds Eye
Stouffer’sLean Cuisine
Webvan?

7
eGrocery
eGrocery
$0.1 $0.7$10.6
$37.8
$61.3
$106.2
$245.4
1890 1895 1900 1905 1910 1915 1920
1 25 100 200 372
4,621
15,737
1859 1865 1880 1900 1910 1920 1930
PAST REVOLUTIONS IN RETAILINGA&P Store Numbers
(1859-1930)Sears Roebuck Sales
($Millions; 1890-1920)
Source: Lebhar(1952); Emmet(1950); Wal-Mart(2000)
1 38
330
859
1,528
2,784
4,000
1962 1970 1980 1985 1990 1995 2000
Wal-Mart Store Numbers(1962-2000)
Successful concepts have shown massive and rapid growth

8
eGrocery
eGrocery
5.8%14.9%
36.5%
52.2%
63.9% 63.5% 59.8%
48.0%
52.4%
51.1%
37.1%
27.0%
19.4% 18.1%17.8%
2.4% 7.2%
17.0%
14.1%
14.6%
11.2%8.3%
7.3% 6.5% 4.8%
21.2%12.8%
8.2%7.9%
8.3%7.7% 8.1% 8.4%13.8% 14.9% 11.2% 7.3% 4.2% 1.7% 1.4% 2.0%
1929 1939 1948 1958 1967 1977 1987 1996
The supermarket proved to be an irresistible proposition for most shoppers…
FOOD AT HOME MARKET SHARE1
(% of sales by channel; 1929-1996)
Source: USDA ERS
Small GrocerConvenience
Supermarket
Butcher,Greengrocer,
Baker, etc.
Other
HomeDelivery
Mass/Club

9
eGrocery
eGrocery
…that beat home delivery once already
WHY DID IT FAIL THE FIRST TIME? c1940
Convenience
Cost
Accuracy
Logistics
Home Delivery Supermarket
• Wait for delivery boy• Women entering workforce
• Cost of product + cost of picking + cost of delivery
• May forget to order items• May not get correct items
• Usually small local grocery• Need to pick order• Buy through wholesaler
• Get in now• Get it on the way home from work
• Large volume/economies of scale• No service, no frills, low prices
• Visual clues to order• Get what you pay for
• “Super” market• Factory to store• Buy in truckload quantities

10
eGrocery
eGroceryeGrocery © CORIOLIS RESEARCH II - 10
II. Internet grocery retailing appears to be a rapidly emerging new channel
– Internet retailing is currently a small but growing component of food sales
– Internet grocery retailing (eGrocery) is currently a small part of the large and highly competitive food at home market
– Only 540,000 households in the United States have ever used the internet to order groceries
– Both major internet research firms agree that eGrocery will show massive growth
– There appears to be strong consumer interest in the concept
– Consumer surveys consistently indicate a demand for grocery home-delivery
– Convenience appears to play a key role in consumer demand for home delivery
– eGrocery has a clear base of target shoppers
– The eGrocery concept has quickly moved from start-up to consolidation

11
eGrocery
eGrocery
Supermarkets62%
Other8%
Other Grocery 9%
Convenience 5%
Warehouse Clubs 4%
Mass Merchants 5%
Specialty Food 5%
FOOD AT HOME MARKET SHARE BY CHANNEL(% of sales; 1999)
TOTAL = $450 Billion
Home Delivery/Mail Order 2%eGrocery 0.02%
Source: USDA; FMI; Progressive Grocer; Other; Coriolis analysis
Internet grocery retailing (eGrocery) is currently a small part of the large and highly competitive food at home market

12
eGrocery
eGrocery
Only 540,000 households in the United States have ever used the internet to order groceries
HOW BIG IS THE MARKET?(Millions; % of households)
Population
278 mm
Households
106 mm100%
Households with PC
56 mm53%
…and Internet
36 mm34%
…that have shopped online
18 mm17%
…for groceries
ever
0.54 mm0.5%
Source: US Census Bureau; PWC; Greenfield; Commerce Net; Nielsen Net Media; Coriolis analysis

13
eGrocery
eGrocery
$148 $350$750
$1,600
$3,500
$7,500
$235$540
$1,200
$2,800
$6,400
$10,800
1998E 1999E 2000E 2001E 2002E 2003E
Both major internet research firms agree that eGrocery will show massive growth
eGROCERY MARKET GROWTH PROJECTIONS($ Millions; 1998-2003)
Note that projections vary widely: Anderson Consulting $85 Billion by 2007; eMarketer $33.6 Billion by 2002; IDC $8.8 Billion by 2004Source: Forrester Research; Jupiter Communications; Other
SALESCAGR98-03
115%
119%

14
eGrocery
eGrocery
58%
49%
34%
34%
30%
26%
23%
23%
17%
13%
Prescription Drugs
Groceries
Flowers
Clothes
Gifts
Airline Tickets
Books
Office Supplies
Consumer Electronics
PCs
Consumer surveys consistently indicate a demand for grocery home-delivery
DEMAND FOR SAMEDAY FULFILLMENT BY CATEGORY(% rating important; survey; March 2000)
Source: Jupiter Communications

15
eGrocery
eGrocery
68%
66%
60%
60%
57%
47%
42%
41%
39%
35%
32%
Convenience
24-hour access
Shop without leaving home
Saves time
Saves money
Prices compare favorably
Won't forget items
Better selection
Can find new products
Can shop from work
Hate to shop
Convenience appears to play a key role in consumer demand for home delivery
REASONS SHOPPERS WOULD BUY GROCERIES ONLINE(% agreeing; 3/00)
Source: Netsmart Research

16
eGrocery
eGrocery
eGrocery has a clear base of target shoppers
WHO IS THE SHOPPER
Solid eGrocery Solid Traditionalist
• Technologically competent
• High disposable income
• Time starved - willing to trade
money for time
• Fashion conscious (must be seen
doing the latest thing)
• Younger, female
• White collar, professional
• Afraid of technology
• Fixed or low income
• Available time - willing to trade
time for money
• Price conscious (use coupons, shop
around, cherry pick specials)
• Older, retired
• Blue collar, less educated

17
eGrocery
eGrocery
The eGrocery concept has quickly moved from start-up to consolidation
– The eGrocery concept appeared highly attractive to a number of investors
– The eGrocery concept is presented as a massive opportunity
– There are clear cost savings from eGrocery/Home Delivery
– A core group of leading companies has already emerged
– There are four competing concepts for the structure of the eGrocery supply-chain
– While there are hundreds of start-ups, there is only a small group of well financed, operational eGrocers
– In 1999, six eGrocers captured 90% of online grocery sales
– The leading eGrocers have focused their efforts in the larger urban areas
– The channel has attracted investment from five of the top seven grocery retailers

18
eGrocery
eGrocery
The eGrocery concept is presented as a massive opportunity
– “I believe that the Internet grocery business will eventually capture between 10 and 15 percent of the market. Now if we define the market - groceries, nonprescription drugs and home replacement meals - that’s $650 billion. So if the e-grocers get 15 percent that’s close to $100 billion.”
George Shaheen, CEO, Webvan, January 2000
– “If online retailers captured just 30 percent of the US grocery market, they’d be raking in more than US$200 billion a year.”
David Bergh, VP, Grocery Shopping Network, Jan 2000
– “The market is huge, and if the on-line grocers only get 10% seven or eight years from now, that would be an $80 to $100 billion business.”
Barry Stouffer, Analyst, J.C. Bradford, May 2000

19
eGrocery
eGrocery
WHERE DO THE COST SAVINGS COME FROM?
SAVINGS COSTS
• No “bricks-and-mortar”
• No “expensive” real estate
• Low-cost, efficient order creation
• Less labor
• Regional fulfillment centers
• Fleet of trucks and drivers
• Team of computer programmers
• Computerized sorting and picking
system
There are clear cost savings from eGrocery/Home Delivery

20
eGrocery
eGrocery
There are four competing concepts for the structure of the eGrocery supply-chain
Store Dedicated Courier One HourPick Warehouse & Mail Delivery
Replacethe shopper
Pick from retail store at night
$110
PeapodAlbertsons.com
COMPETING eGROCERY MODELS
Philosophy
Concept
AverageOrder Size
Costs
Examples
Replacethe store
Pick from custom built warehouse
$100
WebvanHomegrocerStreamline
Replace thesupply-chain
Mail or courier from national
distribution point
$30-40
Net GrocerGrocer Online
Replacethe car
One-hour delivery by bicycle or car from store or DC
$10-15
KozmoPDQuick
Urban Fetch
• Capital
• Labor
• Delivery
Note: empty=low; half=medium; full=high

21
eGrocery
eGrocery
While there are hundreds of start-ups, there is only a small group of well financed, operational eGrocers
SF Bay Area(incl. Sacramento)
AtlantaChicago
Seattle, PortlandLos Angeles
Orange CountySan Diego
Boston SuburbsNth. New Jersey
Dallas/Ft. WorthHouston
Delivery SKU’s Sales Delivery AverageCompany Geography Method DC Size (Millions) Cost Order
Attendeddelivery
Attendeddelivery
Unattended- install
refrigerator
Attended delivery
$13.3 (99)
$21.6 (99)
$15.4 (99)
$10.0 (99E)
18,000 skus350k sqft
12,000 skus100k sqft
10,000 skus100k sqft
15,000skus120k sqft
$4.95 $50+ free
$9.95 $75+ free
$30month for 4
deliveries
Free
$90
$102
N/A
eGROCERY RETAILER PROFILES

22
eGrocery
eGrocery
Delivery SKU’s Sales Delivery AverageCompany Geography Method DC Size (Millions) Cost Order
$4 (99E)
$73 (99)
$5 (99E)
$10 (99E)
16,000 skus36+ Retail
Stores
20,000 skus50-70k sqft
12,000 skus65-83k sqft
$5.95$60+ free
$9.95to free
N/A
$106
$105
Over $100
SeattleDallas
Boston, ChicagoSF Bay AreaLong IslandConnecticut
Boston SuburbsSth. Connecticut
Boston
Attended deliveryIn-store pick-up
Attended delivery
Unattended - install
refrigerator
Attended delivery
eGROCERY RETAILER PROFILES
While there are hundreds of start-ups, there is only a small group of well financed, operational eGrocers

23
eGrocery
eGrocery
While there are hundreds of start-ups, there is only a small group of well financed, operational eGrocers
eDELIVERY RETAILER PROFILES
Delivery SKU’s Sales Delivery AverageCompany Geography Method DC Size (Millions) Cost Order
Same-day(Under 1hr)
Attendeddelivery
Same-daybicycle-courier
delivery
Same-day(30 min)
Attendeddelivery
$3.5 (99)
$ (99)
$ (99)
20 Free10am-12am
Free
$2.996am-3am
$10-15
B2C $8B2B $50
$20
Los AngelesNYC
SF Bay Area8 Others
B2C[New York& London
B2B closed]
Los Angeles

24
eGrocery
eGrocery
National
National
National
DeliveryCompany Geography Method Notes
Mail,Courier
Mail,Courier
Print-outcoupon
• Groceries by courier• Started by Israeli Special Forces Commando • 22% owned by Parmalat (for $30mm)• Sales $6.5 mm (99)
eOTHER RETAILER PROFILES
• Groceries by courier• Deliver frozen in dry-ice pouch
• Bid online for each of your groceries• “150,000” customers weekly• Take winning bid to store• Recently shutdown due to losses
While there are hundreds of start-ups, there is only a small group of well financed, operational eGrocers

25
eGrocery
eGrocery
80+Others
$10.06%
$13.38%
$15.410%
$21.614%
$73.046%
In 1999, six eGrocers captured 90% of online grocery sales
1999 eGROCERY MARKET SHARE($Millions; % of total; 1999)
$16.710%
$10.06%
TOTAL = $160 Million Dollars Source: Company Annual Reports; Hoovers; various articles; Coriolis estimates

26
eGrocery
eGrocery
Boston
The leading eGrocers have focused their efforts in the larger urban areas
eGROCERY OPERATIONS BY REGION(Actively trading; as of Sept 31, 2000)
Source: various websites; Coriolis analysis
Dallas

27
eGrocery
eGrocery
The channel has attracted investment from five of the top seven grocery retailers
Company Key Action• Early adopter; launched Walmart.com; national delivery of non-perishables • Relaunching revised website Q4/2000
TOP SEVEN GROCERY RETAILER eGROCERY ACTIVITY
• Partnership with Peapod and Priceline• Minimal activity
• Launched Albertsons.com in Seattle and Dallas• Building from scratch, good site, committed to concept
• Early partnership with Peapod; purchased 50% of Grocery Works ($30mm)• Launching Safeway.com powered by Grocery Works in Denver Q4/2000
• Early partnership with Peapod; purchased 51% (then 81%) of Peapod• Struggling Peapod now run by Ahold VP; strong commitment to concept
• Recently purchased Hannaford Bros., founder of Homeruns.com• Parts of Homeruns sold off to investor groups
• Minimal activity

28
eGrocery
eGrocery
III. The financial viability of the concept is still unproven
– Webvan, which has quickly become the bellwether of the industry, has lost billions and still not demonstrated financial viability
– Webvan represents the best chance for an eGrocery revolution
– Webvan has everything going for it
– Webvan has so far failed to deliver
– With the popping of the internet bubble, reality appears to have set in, and demonstrating DC profitability has become the key requirement
– It is still unclear who will ultimately win: clicks or bricks & clicks

29
eGrocery
eGrocery
Webvan represents the best chance for an eGrocery revolution
WHY WEBVAN?
• Re-engineered supermarket retailing from the ground up
• Contains defensible technology and patents
- Preventing or limiting competition
- Allowing national/international expansion
• Achieves lower cost than supermarkets if it achieves
required minimum volumes
• Recognizes that large scale change comes from:
- Lower cost/Higher profitability than competition
- Better consumer value proposition ($/convenience)
• Replaces labor with capital
Key Strengths of Webvan Model

30
eGrocery
eGrocery
Webvan has everything going for it
– Webvan has impeccable management and financial advisors
– Webvan has the best business model for eGrocery
– The company is delivering on customer satisfaction
– Webvan offers prices lower than conventional supermarkets
– Webvan has the highest level of customer satisfaction of any eGrocer
– The company is showing strong growth

31
eGrocery
eGrocery
Webvan has impeccable management and financial advisors
WEBVAN’S BLUE BLOOD
Founder
Louis Borders(Founder of Borders
Books; MIT educated mathematician;
“genius”)
First RoundInvestors ($400mm)
Sequoia Capital($50mm)
Softbank Corp.($125mm)
Goldman Sachs VC($100mm)
Benchmark Capital Knight Ridder Co.
CBS Inc.Yahoo!
E*TradeLVMH
($125mm)
Chief ExecutiveOfficer
George Shaheen(Ex-CEO Anderson
Consulting)
Initial PublicOffering ($375mm)1
Goldman, Sachs &Co
Donaldson, Lufkin & Jenrette
Merrill Lynch & Co.
Bear, Stearns & Co.
Deutsche Bank Alex Brown
Robertson Stephens
Thomas Weisel Partners
1. Managing Underwriter: Goldman Sachs; others: co-managersSource: Various Webvan documents

32
eGrocery
eGrocery
Webvan has the best business model for eGrocery
– Webvan has one of the most technologically advanced warehousing and distribution systems on the planet
– Webvan designed its supply-chain using a blank sheet of paper
– The hub-and-spoke architecture allows one distribution center to service a 70+ square mile urban area
– The model keeps delivery costs below 5% of sales
– Webvan has built partnerships with a number of key manufacturers that give the supplier real information and input
– Webvan’s model has been praised by the analysts, even when they question the details

33
eGrocery
eGrocery
Webvan has one of the most technologically advanced warehousing and distribution systems…
– “A single worker, standing at a pod, will be surrounded by motorized carousels holding 8,900 grocery items, many conveyer belts, a host of electronic-eye bar code scanners and 16 bins that collect shoppers’ orders. In just one hour, the worker should be able to pack 450 grocery items - nearly 10 times the productivity of a traditional “shopper” strolling a cart through a store or warehouse.”
Food Industry Report, April 1999
– “The automated warehouse gives us a 10 percentage-point edge in profit margins over traditional supermarkets, allowing the company to keep prices down, avoid surcharges and cover delivery costs.”
Kevin Czinge, Chief Financial Officer, Webvan, April 1999
– “We’re taking the grocery industry and completely reengineering it from the inside out. There’s nothing that resembles this distribution and delivery system. We’re conquering the last mile of e-commerce.”
Mark Zaleski, SVP Area Operations, Webvan, June 2000

34
eGrocery
eGrocery
…on the planet
– “The Webvan facility is a combination tech-head’s wet dream and chef’s fantasy. Workers carry small, handheld computers. Radio transmitters from a large computer tell the workers what items to put in the totes… Freeways of conveyer belts carry partially filled totes to workers in other parts of the warehouse… Workers in white frocks and hair bonnets cut fresh meat… Employees in a 70-degree room sort tropical fruit. Other workers in a bakery and a kitchen for prepared meals fix sumptuous-smelling treats.”
Tom Davey, Red Herring, March 2000
– “The Oakland distribution center for Webvan is an impressive sight. Covering an area of 330,000 square feet, it is divided into three broad, colour-coded segments. Yellow is for “ambient”: dry goods, the heavier of which (such as soft drinks) are manipulated around by giant insect-like “mechpods.” Green and blue are respectively, for “chilled”and “frozen”… The center processed some 2,000 orders a day, involving up to 20,000 totes… The contents of the order are computerized. That triggers a system of lights, as the tote travels around the warehouse, to show the packers precisely what needs to be added to the tote at each point… None of the 150-odd packing workers needs to move more than 19 feet to fill each item in an order.”
The Economist, Feb 2000

35
eGrocery
eGrocery
Webvan designed its supply-chain using a blank sheet of paper
WEBVAN DISTRIBUTION SYSTEM
DistributionCenter
DeliveryStation WebVan
Direct Delivery
Consumer
Wholesaler
• 350,000 sqft.
• 50,000 items
• 4½ mi. conveyer belt
• Picked into plastic totes
• 8,000 orders/day
• $300 million/year sales
• $35 million build/equip
• 30X/year inventory turns
PerishablesGreenleaf Produce
Niman RanchMonterey FishSemifreddi’s
• Large truck delivery
• Pure cross-dock to
Webvans
• 0-60 mile radius
• 12-15 stations/DC
• 144-225 trucks/DC
• 3 Temperatures
• 0-10 mile radius
• 12-15 trucks/station
• 30-45 min to shop
• Attended delivery
• 5-7 days
• 7am to 10pm
• 30 minute window
• 92% on-time
• 98-99% accuracy
GroceryFrozenDairy

36
eGrocery
eGrocery
The hub-and-spoke architecture allows one distribution center to service a 70+ square mile urban area
WEBVAN DISTRIBUTION SYSTEM
DistributionCenter
DeliveryStation
DeliveryStation
DeliveryStation
DeliveryStation
DeliveryStation
DeliveryStation
DeliveryStation
DeliveryStation
DeliveryStation
DeliveryStation
DeliveryStation
DeliveryStation
DeliveryStation
DeliveryStation
DeliveryStation
0-60 Miles 0-10 Miles

37
eGrocery
eGrocery
The model keeps delivery costs below 5% of sales
ECONOMICS OF AN ORDER
Courier wage & benefits $17-18Station manager cost $1-2Van cost $2-4Total cost per hour $20-24Deliveries per hour 5Average order size $90-100Revenue per hour $450-500Cost as a % of revenue 4-5%
Cost per Hour
Source: Webvan; E*Offering

38
eGrocery
eGrocery
Webvan has built partnerships with a number of key manufacturers…
WEBVAN ALLIANCES
Kimberly-Clark Feminine care, facial tissue, bath tissue, adult careCoca-Cola Carbonated soft drinks, bottled waters, bottled teas, bottled
juice drinksPillsbury Refrigerated dough, frozen pizza, Mexican foodKellogg Ready-to-eat cerealsNestlé Frozen entrees, pet foodQuaker Hot cereals, sports beveragesNabisco Cookies and crackersClorox Bleach, cleaning products
Company Categories
Source: Webvan press releases

39
eGrocery
eGrocery
…that give the supplier real information and input
VALUE OF ALLIANCES TO PARTNER
• Conduct research and gather data• Develop key insights on the emerging online channel• Test new interactive promotional vehicles• Assist with product assortment, merchandising, marketing & supply-chain
management• Realize new brand building opportunities• Create a powerful and new personalized shopping experience for customers
Key Points
Source: Webvan press releases

40
eGrocery
eGrocery
Webvan’s model has been praised by the analysts
– “The company has a big opportunity, strong management and a strong value proposition. STRONG BUY.”
Henry Blodget, Analyst, Merrill Lynch, Jan 2000
– “Webvan has the most promising business model… Its business model is basically a dream for the on-line grocery channel.”
Evie Black Dykema, Researcher, Forrester Research, July 1999
– “Webvan is in the best position to succeed in the business. It’s driving gains and cutting costs. Bricks-and-mortar grocers spend between 4% and 6% of their profits on leasing costs for their space. Webvan needs to spend 1% of their profits on its space, since it’s built on cheap land and is so automated. STRONG BUY.”
Peter Swan, Analyst, Pacific Growth Equities, March 2000
– “We view Webvan as one of the few true e-tailing enablers… leveraging Web technology to allow customers to shop in a way that was impossible without the internet. Webvan owns every inch of its business, from the time its products areinitially purchased form its suppliers to delivery to a customer. BUY.”
Lauren Cooks Levitan, Analyst, Robertson Stephens, January 2000

41
eGrocery
eGrocery
… even when they question the details
– “Webvan has done it the new economy way: Raise as much money as you can and bet the ranch. They have determined in advance, without experience, that they have the right model. Webvan is reducing picking costs through a lot of automation. The question is: Is that the best right trade-off, spending lots of capital to lower picking costs? You spend capital to save not that much money. Plus there’s the risk of not getting demand in the first place… BUY.”
Barry Stouffer, Analyst, J.C. Bradford, Feb 2000
42
eGrocery
eGrocery
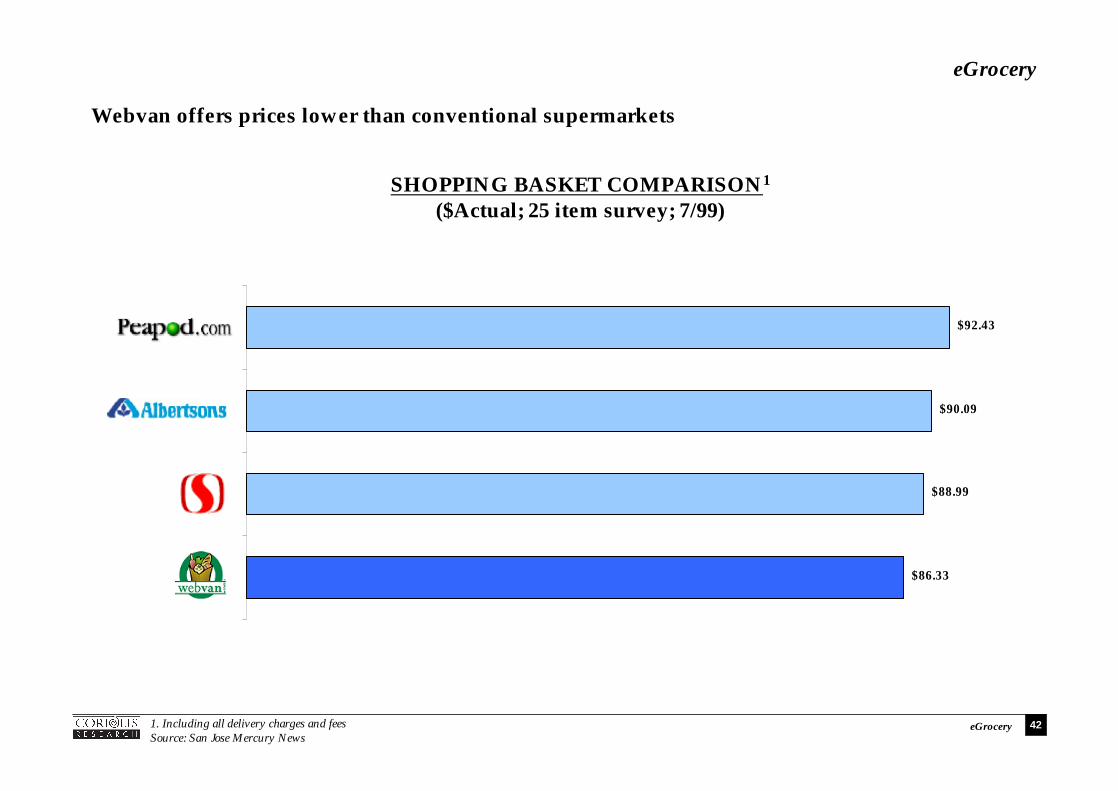
Webvan offers prices lower than conventional supermarkets
SHOPPING BASKET COMPARISON1
($Actual; 25 item survey; 7/99)
1. Including all delivery charges and feesSource: San Jose Mercury News
$92.43
$90.09
$88.99
$86.33

43
eGrocery
eGrocery
7.35
7.13
6.37
6.24
5.77
5.62
5.58
5.39
4.96
4.77
Webvan has the highest level of customer satisfaction of any eGrocer
CUSTOMER SATISFACTION RATING1
(10 = Perfect; Fall 2000)
1. Combined score from multiple categories: ease of use, on-site resources, meal-solution shopper, customer confidence, relationship services and overall costSource: Gomez Advisors

44
eGrocery
eGrocery
The company is showing strong growth
– The order metrics of the Webvan model are showing constant improvement
– Webvan has shown very strong sales growth, growing at a compound rate of 340% a quarter
– Webvan has quickly gained the dominant market position and almost 50% market share
– Webvan is expanding beyond groceries into higher value goods and services
– With its merger with Homegrocer, Webvan now quickly approaching a national distribution

45
eGrocery
eGrocery
4,00022,000
47,000
87,000
162,000
524,000
Q1/99 Q2/99 Q3/99 Q4/99 Q1/00 Q2/00 Q3/00
The order metrics of the Webvan model are showing constant improvement
WEBVAN ORDER METRICS1
$58.06
$72.53
$81.31
$90.33 $91.00
$103.00
Q1/99 Q2/99 Q3/99 Q4/99 Q1/00 Q2/00 Q3/00
Average Order Size($Actual)
Active Customers(Actual)
N/AN/A
46%
64%
78% 78% 76% 75%
Q1/99 Q2/99 Q3/99 Q4/99 Q1/00 Q2/00 Q3/00
Repeat Purchase(% of Customers)
1. Q3/00 figures includes HomegrocerSource: Webvan 10K; 10Q
# ofDCs 1 1 1 1 1 2 9
N/A N/A

46
eGrocery
eGrocery
Webvan has shown very strong sales growth, growing at a compound rate of 340% a quarter
WEBVAN SALES GROWTH($ Thousands; Q1/99-Q2/00)
$12 $383$3,841
$9,069
$16,269
$28,300
$87,384
Q1/99 Q2/99 Q3/99 Q4/99 Q1/00 Q2/00 Q3/00
1. Q3/00 figures includes HomegrocerSource: Webvan 10K; 10Q
QUARTERLYSALESCGR
Q1/99-Q3/00
340%

47
eGrocery
eGrocery
$73$90
$13
$170
$22
$52
$100
1999E 2000E
Webvan has quickly gained the dominant market position and almost 50% market share
eGROCERY SALES GROWTH($Millions; 1999 v. 2000)
Other
$160
$360
Other
SALESCAGR98-03125%
92%
386%
23%
Source: Company Annual Reports; Hoovers; Multex; DBAB; SSB; various articles; Coriolis estimates

48
eGrocery
eGrocery
Webvan is expanding beyond groceries into higher value goods and services
EXPANSION BEYOND GROCERY
Dry groceryPerishablesNon-foodPet Food
Source: Webvan press releases
Grocery
HBAOTC Drugs
Drug Store
Dry CleaningFlowersStamps
(25% of orders)Bus Passes
Bridge Tokens
Services
BooksSoftware
CD/DVD/VideoAppliancesElectronics
ApparelOffice Supplies
HardwareParty SuppliesSmoke Shop
DepartmentStore
Chef-prepared Meals
Fast Food/Foodservice

49
eGrocery
eGrocery
With its merger with Homegrocer, Webvan now quickly approaching a national distribution
WEBVAN GROUP PROJECTED OUTLETS(Distribution centers by location; company projection; Dec 31, 2000)
Source: Webvan press release
2001

50
eGrocery
eGrocery
Webvan has so far failed to deliver
– Webvan has not shown impressive bottom line performance
– Webvan has had massive losses, both on a total and on a per customer basis
– Webvan’s capital intensive distribution center appears to very negatively impact center profitability when not operating at full capacity
– For the time being, bricks appear to be beating clicks on the top and bottom line
– Webvan’s model has fallen over because it has been unable to achieve high enough penetration
– Webvan’s stock has not been a good investment
– Webvan’s stock has taken a punishing, despite the best efforts of the analysts
– Webvan and Homegrocer have seen a combined $11.3 Billion fall off their market capitalization highs

51
eGrocery
eGrocery
$12 $383 $3,841 $9,069$16,269
$28,300
$87,384
($11,690)($23,444)
($60,437)($48,998)
($57,815)
($74,365)
($120,234)
Q1/99 Q2/99 Q3/99 Q4/99 Q1/00 Q2/00 Q3/00
Webvan has had massive losses, both on a total and on a per customer basis
WEBVAN SALES GROWTH
Sales vs. Net Loss($Thousands)
Sales vs. Net Loss Per Active Customer($Actual)
($5,861)
($2,747)
($1,043)($665) ($459) ($229)
$96 $175 $193 $187 $175 $167
Q1/99 Q2/99 Q3/99 Q4/99 Q1/00 Q2/00 Q3/00
N/A
1. Q3/00 figures includes HomegrocerSource: Webvan 10K; 10Q

52
eGrocery
eGrocery
Webvan’s capital intensive distribution center appears to very negatively impact centerprofitability when not operating at full capacity
WEBVAN FINANCIAL PERFORMANCE Q1 2000
Sales 100.0% $91.00 $16,269COGS 74.6% 67.89 12,138Gross Margin 25.4% 23.11 4,131
Distribution 125.0% 113.75 20,336G&A 114.7% 104.38 18,657Engineering & Software Development 33.9% 46.77 5,523Sales & Marketing 51.4% 30.85 8,359Total Operating Expenses 325.0% 295.75 52,875Loss from Operations (299.8%) ($275.64) ($48,774)
Less depreciation of deferred compensation 108.9% 99.10 17,720Plus net interest income 53.2% 48.41 8,649
Net Loss 355.3% ($323.36) ($57,815)
Source: Webvan 10Q; DBAB; E*Offering; Coriolis analysis
% ofSales
Per order($)
Total($MM)

53
eGrocery
eGrocery
For the time being, bricks appear to be beating clicks on the top and bottom line
FINANCIAL PERFORMANCE: BRICKS VS. CLICKS
Sales 100% 100.0% 100.0%
COGS 75% 74.6% 70.5%
Gross Margin 25% 25.4% 29.5%
Operating & Administration 13% 325.0% 22.6%
Operating Profit 12% (299.8%) 6.9%
Source: Webvan prospectus; Webvan 10Q; DBAB; E*Offering; Safeway Annual Report; Coriolis analysis
Q1/2000 FY1999Model

54
eGrocery
eGrocery
Webvan’s model has fallen over because it has been unable to achieve high enough penetration
– There are three key components to strong eGrocery sales
– The Webvan model is only operating at 22% of planned capacity driven by lower order sizes and lower penetration
– The average spend per trip is over $91 dollars, and growing this to $103 does not appear to pose a challenge
– The average Webvan customers is shopping online eight times a year, a similar frequency to Warehouse Club stores, but much lower than at supermarkets
– In Q1/00, Webvan had orders from 3.1% of Bay Area households, but achieved only 0.55% market share, in a highly computer literate region that includes Silicon Valley, but where it battles two strong supermarket chains
– To achieve the planned 8,000 orders per day, either existing customers need to buy more frequently or more customers need to be attracted
– It appears that Webvan customers are unable to commit the time and planning required to shop more frequently and that the service may not be as convenient as initially expected

55
eGrocery
eGrocery
There are three key components to strong eGrocery sales
COMPONENTS OF eGROCERY SALES
Order Size
Order Frequency
Household Penetration
• Type of shopping occasion (e.g. stock-up)
• Frequency of shop• Household size / demographics
• Consumer planning horizon• Order size• Pack size• Willingness to hold inventory• Disposable income
• Households with computers and internet
• Knowledge of service• Household demographics• Consumer behavior patterns
Variables Challenges
• Growth in frequency or penetration may lower order size
• Requires weekly shop/large order• Not set up for large number of small
orders
• Reasonably high level of planning required
• Availability of desired delivery slot/window
• Households most able to order may be least willing to order
- Gen X&Y not planning meals- High food away purchase- Breakdown of traditional meals
• Shopper will pass traditional supermarket at least two times a day
Component

56
eGrocery
eGrocery
The Webvan model is only operating at 22% of planned capacity driven by lower order sizes and lower penetration
WEBVAN DISTRIBUTION CENTER FINANCIAL MODEL
AverageOrder1
$103.00
DailyOrders8,000
Ï Ï7 days/week
364 days/year à $300 Million/Year
Prospectus Financial Model
AverageOrder$90.33
DailyOrders2,000
Ï Ï7 days/week
364 days/year à$16.2 Million/Q1
$65.1 Million/Year(annualized)
Actual Q1/20002 21.7% Capacity
1. Prospectus model assumed 8,000 orders, 225,000 items, for 28.2 items/order at $3.65 each; 1-3% penetration (i.e. weekly shop); 2. Q1 used for clarity because financial Data is for one DC (SF) and one concept (Webvan); Q2 includes Atlanta DC; Q3 data includes Homegrocer; Source: Webvan prospectus, and 10Q; press articles; Coriolis analysis

57
eGrocery
eGrocery
$91.00
$81.57
$36.34
$31.82
$17.72
$10.22
$9.23
Webvan
Warehouse Clubs
Mass Merchants
Grocery/Supercenter
Drug
Dollar Stores
Convenience/Gas
The average spend per trip is over $91 dollars…
AVERAGE SPENDING PER SHOPPING TRIP BY OUTLET TYPE1
($ per shopping trip; those that shop channel; 2000)
1. Average amount spent per visit by customers who shop the channel; Webvan data for average Q1 customer Source: ACNielsen; Webvan; Coriolis analysis

58
eGrocery
eGrocery
… and growing this to $103 does not appear to pose a challenge
AVERAGE ORDER SIZE($ per delivery; Q1-Q2/20001)
$128
$102
$100
$98
$91
1. Peapod uses FY 1999 dataSource: Webvan 10Q; Homegrocer 10Q; Peapod 10Q; press reports

59
eGrocery
eGrocery
90
26
15
13
10
9
8
Grocery/Supercenter
Mass Merchants
Drug
Convenience/Gas
Dollar Stores
Warehouse Clubs
Webvan
The average Webvan customers is shopping online eight times a year, a similar frequency to Warehouse Club stores, but much lower than at supermarkets
SHOPPING TRIPS PER YEAR BY OUTLET TYPE1
(# of shopping trips; those that shop channel; 2000)
1. Average number of times customers who shop the channel visit the store type; Webvan data annualized from average Q1 customer Source: ACNielsen; Webvan; Coriolis analysis

60
eGrocery
eGrocery
In Q1/00, Webvan had orders from 3.1% of Bay Area households, but achieved only 0.55% market share…
WEBVAN MARKET SHARE - BEST CASE SCENARIO
SF Bay Area Households1 2,787,506 HH
Webvan customers 87,000 HH
Webvan HH Penetration 3.1%
Grocery/Drug Store expenditure per HH per year $4,250 HH/year
Regional Grocery Sales in Q1 $2,962 million
Webvan Sales in Q1 $16.3 million
Webvan Market Share 0.55%
1. Includes households in nearby Sacramento regionSource: US Census Bureau; FMI; Webvan 10Q; Coriolis analysis

61
eGrocery
eGrocery
… in a highly computer literate region that includes Silicon Valley, but where it battles two strong supermarket chains
SF BAY AREA MARKET SHARE1
(# of outlets; % of Sales; Q1/2000)
129 stores28.7%
118 stores26.2%
1 Distribution center15 Delivery Stations225 Delivery Vans
0.55%
Other44.5%
1. Includes San Francisco, Oakland and San Jose areasSource: ACNielsen Market Monitor; Webvan 10Q; Coriolis analysis

62
eGrocery
eGrocery
13.1%
10.5%
8.1%
4.0%
2.0%
To achieve the planned 8,000 orders per day, either existing customers need to buy more frequently or more customers need to be attracted
PENETRATION AS A FUNCTION OF YEARLY SHOPPING FREQUENCY1
(% households shopping vs. vans/household/year; to achieve planned 8,000 orders/day)
Average number of deliveries per household per year
Percent of SF Bay Areahouseholds required
as customers
1. Percent of households required as customers as a function of annual average household order frequency; to reach 8000 orders per day; 2. Q1 results on an annualized basis; Source: Webvan prospectus; Coriolis analysis
Actual Q18/year2
Five Weekly10/year
Four Weekly13/year
Fortnightly26/year
Weekly52/year
3.1%
Actual
Required

63
eGrocery
eGrocery
It appears that Webvan customers are unable to commit the time and planning required to shop more frequently and that the service may not be as convenient as initially expected
ORDER PROCESS
Drive from home to
store5-10 min
Timeto shop
15-45 min+
Drive from store to home
5-10 minà
Total time to shop
25-65 min+
Start computer & logon internet
5 min
Timeto shop1
15-45 min
Time todelivery2
1-5 days
Time to delivery3
1-5 days
Total time to shop
50-70 min
Delivery window30 min
+ à+ + +
Traditional Supermarket
WebVan
1. May be company time (i.e. free); 2. Limited delivery slot availability at popular times (e.g. 6pm) means first available delivery window may be days away3. Shopper will probably pass a conventional supermarket twice a day during this period

64
eGrocery
eGrocery
$0
$5
$10
$15
$20
$25
$30
$35
Nov
-99
Dec
-99
Jan-
00
Feb-
00
Mar
-00
Ap
r-00
May
-00
Jun-
00
Jul-
00
Au
g-00
Sep
-00
Oct
-00
Webvan’s stock has taken a punishing, despite the best efforts of the analysts
WEBVAN STOCK PRICE SINCE FLOAT(US$ per share; high/low/close; Nov99-Oct00)
Merrill Lynch (Strong Buy)Deutsche Bank (Strong Buy)Thomas Weisel (Strong Buy)Robertson Stephens (Buy)Donaldson, Lufkin & Jenrette (Buy)
Pacific Growth (Strong Buy) JC Branford (Buy)
Bank of America (Market Perform) E*Offering (Strong Buy)Bear Stearns (Attractive)
Thomas Weisel (Downgrade) Prudential (Hold)
AG Edwards (Accumulate) Thomas Weisel (Downgrade)Deutsche Bank (Strong Buy)
Merrill Lynch (Downgrade)
Deutsche Bank1 (Downgrade)
SSB (Neutral)
AG Edwards (Downgrade)
1. This is sometimes described as “closing the stable door after the horses have bolted”Source: BigCharts; Briefing.com
Prudential (Sell)

65
eGrocery
eGrocery
11 Oct 2000
$2,080.7
$387.8
10 March 2000 11 Oct 2000
$10,220.2
$580.4
5 Nov 1999 11 Oct 2000
Webvan and Homegrocer have seen a combined $11.3 Billion fall off their market capitalization highs
MARKET CAPITALIZATION HIGHS AND LOWS1
($thousands; market capitalization; opening day high vs. current)
1. Merger actually September 5th, 2000; 1.07605 shares of WBVN for every 1 share of HOMGSource: Briefing.com; Webvan; Coriolis analysis
($9.6 Billion)
($1.7 Billion)$968.2
(Merged Group)

66
eGrocery
eGrocery
With the popping of the internet bubble, reality appears to have set in, and demonstrating DC profitability has become the key requirement
– There have recently been a number of high profile failures causing three companies to close all or part of their operations and an ongoing wave of consolidation is taking place
– A number of people questioned the idea from the very start
– For the time being, the market appears to be much smaller than previously expected
– The key everyone is looking for is proof of DC profitability, including Webvan’scompetitors

67
eGrocery
eGrocery
There have recently been a number of high profile failures…
RECENT FAILURES
Houston, TXDallas, TXAustin, TXColombus, OH
• Closed Oct, 2000 after losing $360 million
• Used investor money to subsidize savings
• Ending B2C in NYC and London
• Focusing on profitable B2B in NYC
• Suddenly shutdown• Ceased operations
November 2000
• Sold Washington DC and Chicago to Peapod
• Ceased operation November 2000

68
eGrocery
eGrocery
Boston
… causing three companies to close all or part of their operations…
eGROCERY OPERATIONS BY REGION(Actively trading; as of Sept 31, 2000)
Source: various press releases
ÐÐ
Ð
Ð ÐÐ
ÐÐ
Ð
Ð

69
eGrocery
eGrocery
…and an ongoing wave of consolidation is taking place
RECENT MERGER AND TAKEOVER ACTIVITY
É
è
è
è(Chicago & Washington DC))
è(22%)
($73mm; 50%)
($30mm; 50%)

70
eGrocery
eGrocery
A number of people questioned the idea from the very start
– “The current model of neighborhood grocery stores will not be overtaken by Web-based grocers. The distribution pattern for low value-added goods exists for a reason… It will be very tough sledding except for very high-income areas… Who the hell am I to question Webvan when they have an $8 billion market cap? We’re at $12 billion, and I’m almost ashamed to say we have $2.4 billion in EBITDA.”
Fred Smith, Founder/CEO, Federal Express, November 1999
– “They’re expecting consumer behavior to change but are expecting the competition won’t change.”
Francis Gaskins, Gaskins IPO News, August 1999
– “I don’t believe they will be able to operate an online grocery store more cheaply than a bricks-and-mortar store in the next five or ten years.”
Ken Cassar, Jupiter Communications, July 1999

71
eGrocery
eGrocery
For the time being, the market appears to be much smaller than previously expected
HOW BIG IS THE MARKET?
HouseholdsWith
computers & internet
Ï Ï
In densely populated
cities
OrderSize
$
Order frequencyTimes/year
Ï Ï
Penetration of
Households
Basic Unit Ability to Order
Ability to deliver
How much? How often? How many?
The 1999Internet Bubble
Equation
The 2001Internet Bust
Equation
= $85 BillionMarket1
= $500 MillionMarket
1. Anderson Consulting, by 2007

72
eGrocery
eGrocery
The key everyone is looking for is proof of DC profitability…
– “We’re not overly concerned with the entire company generating profits, but we need to see a distribution center move to profitability. We want to know, can they give the Street any guidance on expected cash flow profitability of a particular distribution center whether it be in San Francisco or Atlanta, or at least at one of HomeGrocer’sfacilities?”
Shawn Milne, E-Offering Analyst, October 2000
– “The question is whether or not they’re going to be able to turn each of these distribution centers into profit centers.”
Matt Stamski, Gomez Advisors, July 2000
– “The problems that I have with Webvan are basically that it’s an unproven business model, and that they haven’t shown yet that they can make money delivering groceries.”
Mark Rowen, Prudential Securities, July 2000
– “Does it have enough fuel to make it into orbit?”Unnamed Analyst, Wall Street Journal, Oct 2000

73
eGrocery
eGrocery
…including Webvan’s competitors
– “I don’t believe you move forward without profitability. I’m not saying the company has to be profitable. But the model has to be profitable - and you have to prove you have a profitable model.”
Marc van Gelder, CEO Peapod, ex-Ahold VP, July 2000
– “Once we have achieved unit profitability, then and only then will we proceed with our rollout strategy.”
Edward Albertian, President, Streamline, Sept 2000
– “We recognize that what the market is looking for is both top-line growth and bottom-line performance.”
Mary Taylor, CEO HomeGrocer, [now on Webvan board], May 2000

74
eGrocery
eGrocery
It is still unclear who will ultimately win: clicks or bricks & clicks
– Existing supermarkets are still rushing to go online, but appear to be repeating the evolution of the industry
– The brawn of traditional supermarkets appear to be overcoming the brains of Webvan
– If DC-based eGrocery can demonstrate financial viability, we expect significant consolidation to occur as those with better financing or better technology thrive
– Just as Warehouse Clubs evolved from a large number of competing chains into two surviving independents and a division of a retail chain

75
eGrocery
eGrocery
Existing supermarkets are still rushing to go online…
• Broward & Palm Beach counties, Florida
• Washington D.C.
• Dallas, Texas• Houston, Texas• Austin, Texas• Phoenix, Arizona• Denver, Colorado
• Charlotte, North Carolina
RECENTLY ANNOUNCED eGROCERY ACTIVITY BY SUPERMARKETS
• Launching PublixDirect (April 2001)• Building regional distribution center
• Launching co-branded Peapod by Giant
• Rebranding Grocery Works by Tom Thumb• Rebranding Grocery Works by Randall’s• Launching Grocery Works by Randall’s• Launching Grocery Works by Safeway• Launching Grocery Works by Safeway
• Launched Harris Teeter Express Lane• Internet order, store pick-up
ActionLocationChain

76
eGrocery
eGrocery
… but appear to be repeating the evolution of the industry
Stage I Stage II Stage IIIStore Pick Manual DC Automated DC
• Low cost start-up• Use existing facilities
• Unable to handle large volumes
• Clog up existing stores• Cost plus approach• High error rate• No economies of scale
• Peapod (initially)• Albertsons• Harris Teeter
THE THREE STAGES OF eGROCERY IMPLEMENTATION
Strengths
Weaknesses
Examples
• Minimize risk• Flexible to low or
variable volumes
• Hard to achieve lowest cost position
• Lower margins than high-volume Stage III
• Ahold/Peapod (current)• Safeway/Grocery Works• PublixDirect
• Lower total cost than supermarkets
• Defensible technology & patents
• High initial capital cost ($35 million/DC)
• Requires high minimum volumes to achieve profitability
• [WebVan]

77
eGrocery
eGrocery
The brawn of traditional supermarkets appear to be overcoming the brains of Webvan
WHO WILL WIN?
• New-economy mindset and blank slate approach to the business
- Access to programmers and technology resources via stock options
- No commitment to existing system or supply chain
- Opportunity to associate new brand with new mind-space
• Sustainable competitive advantage - Defensible technology- Patent protection - Ownership of critical conveyer belt
equipment manufacturer• Well financed through VC and initial IPO
but burning cash at a rapid rate
• Existing merchandise volumes and discounts give lower cost of goods
• Existing, in-place structures- Buying- Warehousing- Distribution- Marketing
• Existing consumer relationship- Brand- Trust/history- Location
• Existing business can cross-subsidize web venture for a long time

78
eGrocery
eGrocery
If DC-based eGrocery can demonstrate financial viability, we expect significant consolidation to occur as those with better financing (Ahold) or better technology (Webvan) thrive
POTENTIAL CONSOLIDATION IN eGROCERY
1999 2002

79
eGrocery
eGrocery
Just as Warehouse Clubs evolved from a large number of competing chains into two surviving independents and a division of a retail chain
CONSOLIDATION IN WAREHOUSE CLUBS
BJ’s (46)Costco (114)
Max Clubs (10)Pace (120)
Price Club (102)Price Rite (3)
Sam’s Club (329)Source Club (7)
Warehouse Club (10)Wholesale Depot (10)
SupermarketClub Aisles
1992 2000
Costco (292)
BJ’s (107)
Sam’s Club (512)(Wal-Mart)

80
eGrocery
eGrocery
IV. The impact of this evolution on traditional supermarkets will be limited…
THREE SCENARIOS FOR eGROCERY
Hallucination
• Flash in the pan - a case study in internet mania
• Consumers unwilling to change
• Limited group willing to pay premium for home delivery
• Short consumer planning horizon limits order frequency
• Can’t achieve minimum delivery area household penetration
• Concept disappears when cash runs out
• Emerges a new and viable retail channel
• 3-5% household penetration; fortnightly orders
• DC’s achieve limited profitability in 20-40 highly populated urban regions
• Market share loss spread throughout market
Evolution Revolution
• Replaces significant percent of supermarket trips
• 20-40% penetration; weekly orders
• DC’s achieve economies of scale and are very profitable
• Conventional supermarkets make major changes; large number close

81
eGrocery
eGrocery
… however, both manufacturers and retailers should carefully consider the consequences
IMPLICATIONS OF SUCCESS
• What percent of food sales will this channel finally achieve?
• Where will the business come from?- Supermarket stock-up shop- Warehouse Clubs- Standard shopping-cart staples
• Where won’t the business come from?- Impulse purchases- Last minute requirements- Convenience foods
• Should we launch a home delivery service?- Leading edge or bleeding edge?- It there a downside to waiting?
Manufacturers
• Manufacturer brands may be a historical anomaly related to self-service supermarkets
• eGrocers have absolute control over the point-of-purchase
• Items in the regular cart have lock-in• With scale, what percent of sales will
ultimately be private label? 20%? 40%? 60%?
Existing Retailers