Embed Size (px)
Citation preview

EGEE’09 — V. Konoplev — September 21-25 2009 – Barcelona
Enabling Grids for E-sciencE
www.eu-egee.org
Veniamin Konoplev (RRC-KI) & …
EGEE’09
21-25 September 2009
Trouble ticket and incident correlation

Enabling Grids for E-sciencE
EGEE-III INFSO-RI-222667
Subject history
• Current ENOC mission area includes receiving and processing NREN’s TT flow to be aware of potential network connectivity problems that can affect EGEE operation.
• Smart and proper interpretation of TT content is essential for ENOC as mediator between NREN and EGEE end users.
• Statistical trouble ticket (TT) matching approach was proposed at the beginning of EGEE III to facilitate finding correlation of TT content to a part of possibly affected EGEE infrastructure.
• Statistical matching approach finds correlations between NREN’s TT content and real observed EGEE node connectivity status. Such correlations observed for a long period are forming a knowledge database.
• Starting from Dec 2008 statistical matching prototype was established in RBNET. It has been colleting EGEE node reachability status in terms of: fine,moderate,bad,unreachable.
• Principles of this approach as well as first obtained results was reported in EGEE’08, UF’09, DSA2.1. The details are summarized in the technical paper “…”.

Enabling Grids for E-sciencE
EGEE-III INFSO-RI-222667
Statistical TT matching principles • NREN’s trouble ticket is interpreted as a vector of essential attributes. Currently the
following attributes are used:– Problem Interval – begin/end time of problem as reported by NREN– Problem Location – short string describing where the problem arises in terms of NREN’s
identification scheme.– Problem Kind – tag describing the problem in unified ENOC classification scheme. Currently
this field does not practically used since it is not established during TT preprocessing.• Site connectivity history is summarized in alert database. An alert is represented as
interval and severity. • NREN’s TT are matched against NREN’s site alerts forming so called “hit statistic”.
– Hit = [Ticket_ID, Location, SITE, Alerts_Severity] – <= from ticket ===> <==== from alert ===>– The hit take place if a site has alerts during a TT time interval. – The hit inherits a severity of hardest alert in the group.
• Hit statistic is grouped by:– Location. For each Location in the ticket we track: all TT and TT with hits.– Site-Location. For each site we track: number of hits observed for particular severity.
• Metrics extracted from hits statistics and used in TT analysis:– Counts(Location) – number of tickets seen for this location.– Ratio(Location) – percentage of TTs with hits for a particular location.– SiteImpact (Site-Location) – probability to get an alert for particular site if we see TT with
particular location. This metric is tracked separately for different severities.
Enabling Grids for E-sciencE
EGEE-III INFSO-RI-222667
Increasing matching accuracy techniques
• Purifying initial TT and Alert data:– TTs and alerts with likely intervals only are taken into account (~
15min – 4hour).
• Detecting group connectivity events– Monitoring intermediate points. I.e. Pinger-to-GEANT uplink and
NREN-to-GEANT uplinks.– Check global number of simultaneous active alerts.– Check number of simultaneous active alerts per NREN.
• Apply TT and alert interval padding.– Extend TT and alert time intervals by small configurable parameter
(0-15min). This allows to reduce time errors (e.g. system clock offset or TT human mistakes).
• Put in correspondence data from several alert system located in different places (still pending).

Enabling Grids for E-sciencE
EGEE-III INFSO-RI-222667
Input data: NREN complexity
NREN Ticket
GARR 243
HEANET 143
RENATER 135
REDIRIS 88
HUNGARNET 60
E2ECU 38
NORDUNET 30
Typical NREN topology is a rather complex that makes difficult human TT interpretation. This complexity also prevents storing and maintaining detail NRENs topologies in NOD database
RENATERNetworkTopology
Number of unique locations seen in NRENs allows to estimate NREN
topology complexity

Enabling Grids for E-sciencE
EGEE-III INFSO-RI-222667
Matching Results (1)
LOCATION Ticket_Hits/Ticket_Counts Site Impact (%) Significance (%) Valid
IT / POP-CA -- POP-RM 1/3 INFN-CAGLIARI 33 33 Yes
IT / HSH-VICO EQUENSE 1/3 SPACI-CS-IA64 20 38 ?
IT / INFN - NAPOLI 1/3INFN-T1 33 55 No
INFN-CNAF 33 57 No
IT / ASI - TORINO -- 1/3
INFN-LNL-2 33 88 No
INFN-PADOVA 33 88 No
INFN-MILANO 33 73 No
ITB-BARI 33 50 No
IT / UNI-NAPOLI PARTH 1/4INFN-ROMA2 33 27 No
INFN-CAGLIARI 33 33 No
IT / UNI-ROMA-LUSPIO 1/4
INFN-BOLOGNA 25 71 ?
INFN-T1 25 55 ?
INFN-CNAF 25 57 ?
PPS-CNAF 25 50 ?
IT / POP-PD1 -- POP-M 1/6 INFN-TRIESTE 17 24 Yes
– Initial believe of statistical matching as a reliable method to map all essential ticket locations to list of affected sites turned out to be inconsistent.
– Main reason – very weak statistic data. Locations with hits count > 1 are seldom– Matching results for GARR from Jan 2009 to Aug 2009 as example are figured below.
Enabling Grids for E-sciencE
EGEE-III INFSO-RI-222667
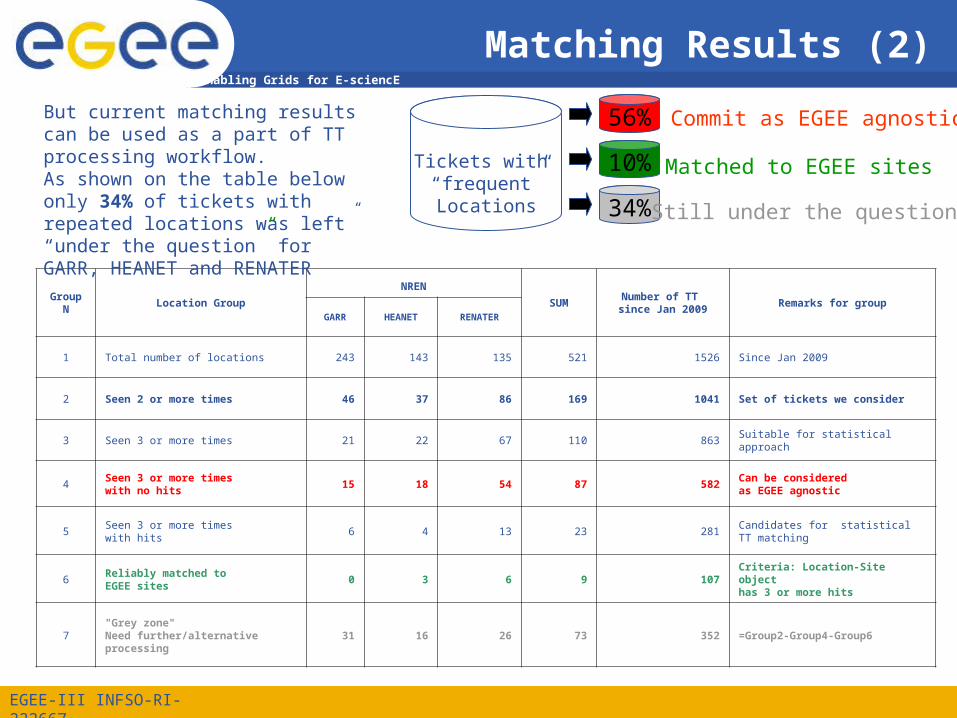
Matching Results (2)
GroupN
Location Group
NREN
SUMNumber of TT since Jan 2009
Remarks for groupGARR HEANET RENATER
1 Total number of locations 243 143 135 521 1526 Since Jan 2009
2 Seen 2 or more times 46 37 86 169 1041 Set of tickets we consider
3 Seen 3 or more times 21 22 67 110 863 Suitable for statistical approach
4Seen 3 or more times with no hits
15 18 54 87 582Can be considered as EGEE agnostic
5Seen 3 or more times with hits
6 4 13 23 281 Candidates for statistical TT matching
6Reliably matched to EGEE sites
0 3 6 9 107Criteria: Location-Site object has 3 or more hits
7"Grey zone"Need further/alternative processing
31 16 26 73 352 =Group2-Group4-Group6
Tickets with “frequent”Locations
56%
10%
34%
Commit as EGEE agnostic
Matched to EGEE sites
Still under the question
But current matching results can be used as a part of TT processing workflow. As shown on the table below only 34% of tickets with repeated locations was left” “under the question” for GARR, HEANET and RENATER

Enabling Grids for E-sciencE
EGEE-III INFSO-RI-222667
Matching Results (3) Details for matched locations
RENATER
LOCATION SITE-LOCATION
FR / STRASBOURG IN2P3-IRES
FR / MARSEILLE IN2P3-CPPM
FR / JUSSIEU IPSL-IPGP-LCG2
FR / GRENOBLE IN2P3-LPSC
FR / NANTES IN2P3-SUBATECH
FR / ORSAY IPSL-IPGP-LCG2
HEANET
LOCATION SITE-LOCATION
IE / DIAS cpDIASie
IE / IT TRALEE giITTRie
IE / GEANT
giITTRie
cpDIASie
giNUIMie
GARR
-- NONE --
Matching detail for strong criteria (Location-Site has >=3 hits) are shown above.We can see 100% matching accuracy.

Enabling Grids for E-sciencE
EGEE-III INFSO-RI-222667
Matching Results (4) Details for locations in “grey zone”
FR / CAYENNE-FTLD FR / PARIS-2
FR / CRETEIL FR / PARIS1
FR / AFNIC FR / CERIMES
FR / CSI FR / UNIVERSITE PARIS 10
FR / TELEHOUSE2 -INTERXION1 CIRCUIT FR / INRA
FR / PARIS1-ORSAY FR / INA
FR / CLERMONT-FERRAND FR / PARIS2
FR / CADARACHE FR / NICE-CADARACHE
FR / GEANT-E2E FR / BESANгON-STRASBOURG
FR / PARIS-NOUMиA FR / LYON1-NICE
FR / PARIS1-LYON1 FR / PAU-TOULOUSE
FR / TOURS - ORLиANS FR / NANTES-ANGERS
FR / LE MANS - TOURS FR / KOUROU-CSG
The list of locations left in grey zone for RENATER

Enabling Grids for E-sciencE
EGEE-III INFSO-RI-222667
Conclusions
• Main practical results:– 76% of repeated locations was considered as “EGEE agnostic” or mapped
to EGEE sites– All mapped repeated locations (10%) were with 100% accuracy
• The reasons for TT matching fails.– Weak TT statistic.
Only small part of locations was suitable for matching (ticket counts >=3). Part with ticket count >= 4 was really negligible.
– Not perfect node status detection. Matching was performed using data from Smokeping and DownCollector.
Smokeping had «not so good» uplink and DownCollector can not track multilevel node status detection.
• NREN can improve the content of their tickets– Short and accurate location (RENATER format is a good example)– Short problem severity tag.
• Matching results can be used as part TT processing in conjunction with lexicographical and manual location matching.
• Further directions:– Tune and improve matching criteria.– Go to combining statistical matching with other methods.– Renew Smokeping config and move it to “good” location.– Add multi-pinger TT processing functionality.