Embed Size (px)
Citation preview

EGEE 580 Geothermal Energy Recovery from Hydrocarbon Settings: Potential and
Challenges. By
Denis Pone and Eunhye Kim
2
Table of Contents Index of Figures .................................................................................................................. 4
Index of Tables ................................................................................................................... 6
PART A .............................................................................................................................. 7
1. Literature Review ........................................................................................................ 8
1.1. Introduction and Background .......................................................................................... 8
1.2. Geothermal Energy as a Natural Resource .............................................................. 8
1.3. Geopressured Geothermal Energy Resource ......................................................... 10
1.4 Coproduced Geothermal Energy Resource ................................................................... 11
1.5. State of the Knowledge and Gaps ................................................................................. 12
2. Approach and Goals .................................................................................................. 13
2.1. Reservoir Performance and Modeling ........................................................................... 14
2.1.1. Estimation of the Resource ................................................................................... 14
2.1.2. Fluid Production .................................................................................................... 16
2.2. Facilities Performance ................................................................................................... 20
2.2.1. Thermal Electric Power generation ....................................................................... 21
2.2.2. Natural gas power generation ............................................................................... 24
2.2.3. Hydraulic Power production .................................................................................. 25
2.2.4. Fluid Injection ........................................................................................................ 25
2.3. Financial Performance ................................................................................................... 26
3. Conclusions and Recommendations .......................................................................... 27
References ............................................................................................................................. 28
Appendix A ............................................................................................................................ 30
Appendix B ............................................................................................................................. 30
Part B ................................................................................................................................ 32
1. Introduction ............................................................................................................... 33
2. Literature review........................................................................................................ 34
2. 1 Model of EGS ................................................................................................................. 34
2. 2 Model of EOR ................................................................................................................. 35
2.3 Model of CS (Carbon Dioxide Storage) .......................................................................... 37
3. Methodology .............................................................................................................. 40

3
4. Simulation Result ...................................................................................................... 44
5. Cost estimation .......................................................................................................... 48
6. Result and Discussion ................................................................................................ 50
7. References ................................................................................................................. 52
4
Index of Figures Figure 1: Accessible geothermal resource -------------------------------------------------------- 9 Figure 2: Geopressured geothermal zone characteristics20 ----------------------------------- 11 Figure 3: Geopressured zones in northern Gulf of Mexico Basin --------------------------- 15 Figure 4: Production-well model ---------------------------------------------------------------- 17 Figure 5: Well production rate as a function of wellhead pressure for three types of geopressured wells -------------------------------------------------------------------------------- 18 Figure 6: Well production rate and wellhead pressure as a function of time for class I geopressured wells -------------------------------------------------------------------------------- 19 Figure 7: Well production rate and wellhead pressure as a function of time for class II geopressured wells -------------------------------------------------------------------------------- 19 Figure 8: Well production rate and wellhead pressure as a function of time for class III geopressured wells -------------------------------------------------------------------------------- 20 Figure 9: Geopressured energy recovery process flow diagram ----------------------------- 21 Figure 10: Correlation of binary plant cycle thermal efficiency with geofluid temperature in degrees ------------------------------------------------------------------------------------------- 22 Figure 11: Specific power output (in kW/(kg/s)) for low- to moderate-temperature geofluids as a function of inlet (T1) and outlet temperatures (T2) shown in degrees Celsius (°C). ---------------------------------------------------------------------------------------- 23 Figure 12: Power output (in kW) for low- to moderate-temperature geofluids as a function of inlet (T1) showed in degrees Celsius (°C); outlet temperatures (T2 = 55°C). 24 Figure 13: Hydraulic power output as a function of wellhead pressure for three types of geopressured wells -------------------------------------------------------------------------------- 25 Figure 14: Pump power requirements versus flow rate for three injection wells at different depths ------------------------------------------------------------------------------------ 26 Figure 15. Rate of net heat extraction for the five-spot fracture reservoir problem (full well basis). It also shows the ratio of heat extraction rates for the CO2 and water system. [1] ---------------------------------------------------------------------------------------------------- 35 Figure 16. Mass flow rate for five –spot problem. The ratio of flow rates in the CO2 and water systems is also shown.[1] ------------------------------------------------------------------ 35 Figure 17. CO2 miscible process which drives water and oil mixed with CO2. When CO2 is produced at production well it goes into separator and from the separator, heat bearing fluid goes to thermo plant to run binary turbine [2] ------------------------------------------- 36 Figure 18: Comparison of carbon dioxide emissions from geothermal and fossil fuel-fired power plants4 --------------------------------------------------------------------------------------- 38 Figure 19: Potential leakage routes and remediation techniques for CO2 injected into saline formations. The remediation technique also is suggested. 6 -------------------------- 39 Figure 20 Decision tree for screening candidate reservoirs[7, 8] ----------------------------- 40 Figure 21 Areas with miscible CO2 –EOR Potential [8] -------------------------------------- 41 Figure 22 Annual CO2 emissions in kilotons per year from power plants in the Texas, Louisiana, and Mississippi Gulf Coast area. Data from IEA (2002).[9] -------------------- 42 Figure 23 Annual CO2 emissions in kilotons per year from refineries, ethylene plants, and ethylene-oxide plants in the Texas, Louisiana, and Mississippi Gulf Coast area. Data from IEA (2002).[9] ------------------------------------------------------------------------------- 42 Figure 24 CO2 production Curve: 1.18 kg/day, 0.0096barrel/day--------------------------- 45 Figure 25 Water production Curve: 20m3/month (4193barrel/day) ------------------------- 45

5
Figure 26 Oil production Curve: 460m3/Month(96barrel/day) ------------------------------ 46 Figure 27 Schematic of the total facility outlay of a west Texas CO2 flood. -------------- 46 Figure 28. Mass flow chart of EOR process in five spot well reservoirs after result of CMG ------------------------------------------------------------------------------------------------ 47 Figure 29: Transport costs range for onshore and offshore pipelines per 250 km, “normal” terrain conditions. High (broken lines) and low range (continuous lines ) are indicated(Data based on various source).6 ----------------------------------------------------- 48 Figure 30: Total investment Costs for pipelines from various information sources for offshore and onshore pipeline. Cost excludes possible booster stations6 ------------------ 49 Figure 31 Gas Production –Yearly at surface condition, after simulation (CMG) -------- 50 Figure 32 CO2 saturation (2D graph), after end of simulation (CMG). It shows that around injection well, 100 % CO2 saturation -------------------------------------------------- 51

6
Index of Tables Table 1: Geopressured zone areas estimated exploitable in-place water volume ............. 15 Table 2: Representative parameters for wells and Reservoirs .......................................... 16 Table 3: Cycle thermal efficiencies for several binary power plants. ............................... 22 Table 4: Chemical energy produced from methane combustion ...................................... 24 Table 5: Power generation summary ................................................................................ 26 Table 6: Production economics ......................................................................................... 27 Table 7 Comparison between CO2 and Water in terms of capacity of bearing and carrying heat [1] ................................................................................................................. 34 Table 8 Screening criteria for enhanced recovery methods [2]- especially we focused on carbon dioxide flooding which is miscible gas injection method. The advantage of Carbon Dioxide is less restriction to apply, in terms of shallow depth (2500 ft) and regardless of net thickness, comparing to other method. .................................................. 37

7
PART A
Geo-Pressured
8
1. Literature Review
1.1. Introduction and Background Although energy is the driving force for the economic development and the key element for improving the quality of life, ever increasing use of fossil fuels cannot be the basis for sustainable development1, 2. These have unexpected environmental consequences in local and global scale. Most alternative energy sources, includes geothermal energy, can be perceived as a much cleaner source of energy than conventional sources. The geothermal energy, natural heat contained in the earth’s crust, is a renewable resource that can contribute significantly to the world's sustainable and diversified energy mix in the 21st century. With continually improving technology for development, geothermal energy is destined to become a major factor in solving the world’s increasingly complex energy equation. The heat continuously flowing from the Earth’s interior is estimated to be equivalent to 42 million megawatts of power3. Vastly greater, in fact, than the resource bases of coal, oil, gas, and nuclear energy combined. It is estimated that a recovery of even a small fraction of this heat would supply the world’s energy needs for centuries4. The source of geothermal energy, the earth’s heat, is permanently available. Solar and wind energy sources, in contrast, are dependent upon a number of factors, including daily and seasonal fluctuations and weather variations. For these reasons, electricity from geothermal energy is more consistently available, once the resource is tapped, than many other forms of electricity. However, it should be stressed that geothermal field development cost are relatively higher; water supplies for both hydrothermal resource and engineered geothermal systems (EGS) are questionable, development cost are difficult to quantify and more importantly energy companies with large capital resources are not involved. Considering the above mentioned issues it is clear that the large-scale use of geothermal energy will depend on the development of unconventional geothermal systems outside the hard rock areas. One way to increase the share of geothermal energy is to take advantage of conditions that eliminate or at least partially mitigate limitations to development encountered in hard rock sites. Fortunately for the United States, the Mexico Gulf Coast host high heat flow and high temperature in the crust that can be exploited commercially. Taking advantage of the confluence of high-permeability engineered reservoirs developed for oil or gas production, high temperatures, high flow rates and existing infrastructure in these existing hydrocarbon fields may facilitated the development of geothermal systems. The objective of this project is to investigate the potential and challenges of recovering geothermal energy from geopressured systems. Our targets are producing or abandon hydrocarbon reservoirs within the Golf Coast of Mexico. Carbon dioxide and waste fluid produced will be re-injected for enhanced oil recovery (EOR) purposes.
1.2. Geothermal Energy as a Natural Resource
Geothermal resources embrace a wide range of heat sources from the earth; from the hydrothermal resources currently economically well developed to the non-hydrothermal
9
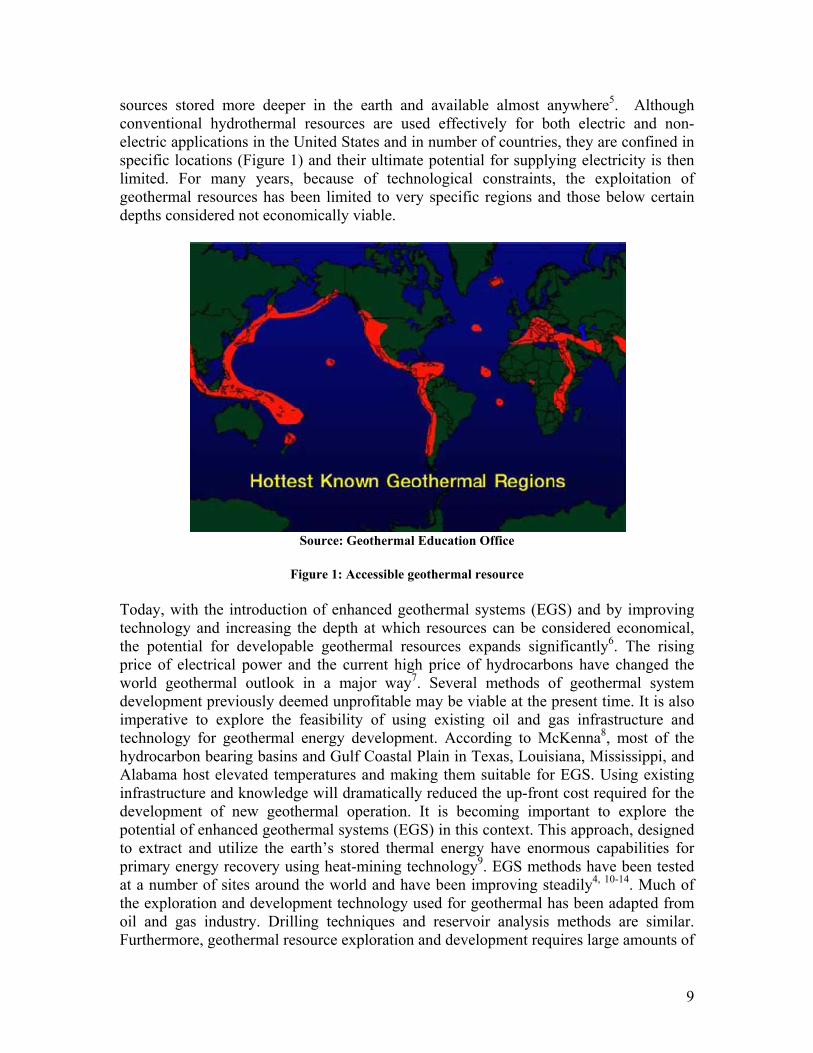
sources stored more deeper in the earth and available almost anywhere5. Although conventional hydrothermal resources are used effectively for both electric and non-electric applications in the United States and in number of countries, they are confined in specific locations (Figure 1) and their ultimate potential for supplying electricity is then limited. For many years, because of technological constraints, the exploitation of geothermal resources has been limited to very specific regions and those below certain depths considered not economically viable.
Source: Geothermal Education Office
Figure 1: Accessible geothermal resource
Today, with the introduction of enhanced geothermal systems (EGS) and by improving technology and increasing the depth at which resources can be considered economical, the potential for developable geothermal resources expands significantly6. The rising price of electrical power and the current high price of hydrocarbons have changed the world geothermal outlook in a major way7. Several methods of geothermal system development previously deemed unprofitable may be viable at the present time. It is also imperative to explore the feasibility of using existing oil and gas infrastructure and technology for geothermal energy development. According to McKenna8, most of the hydrocarbon bearing basins and Gulf Coastal Plain in Texas, Louisiana, Mississippi, and Alabama host elevated temperatures and making them suitable for EGS. Using existing infrastructure and knowledge will dramatically reduced the up-front cost required for the development of new geothermal operation. It is becoming important to explore the potential of enhanced geothermal systems (EGS) in this context. This approach, designed to extract and utilize the earth’s stored thermal energy have enormous capabilities for primary energy recovery using heat-mining technology9. EGS methods have been tested at a number of sites around the world and have been improving steadily4, 10-14. Much of the exploration and development technology used for geothermal has been adapted from oil and gas industry. Drilling techniques and reservoir analysis methods are similar. Furthermore, geothermal resource exploration and development requires large amounts of
10
risk capital, and petroleum producing companies are logical sources of the funds and specialized technology necessary to bring this resource to market. Geothermal energy resources from hydrocarbon setting can be divided into two categories: Geopressured Fluids and Coproduced Fluids. Thus, coproduced hot water from oil and gas production could be developed and provide a first step to more classical EGS exploitation.
1.3. Geopressured Geothermal Energy Resource
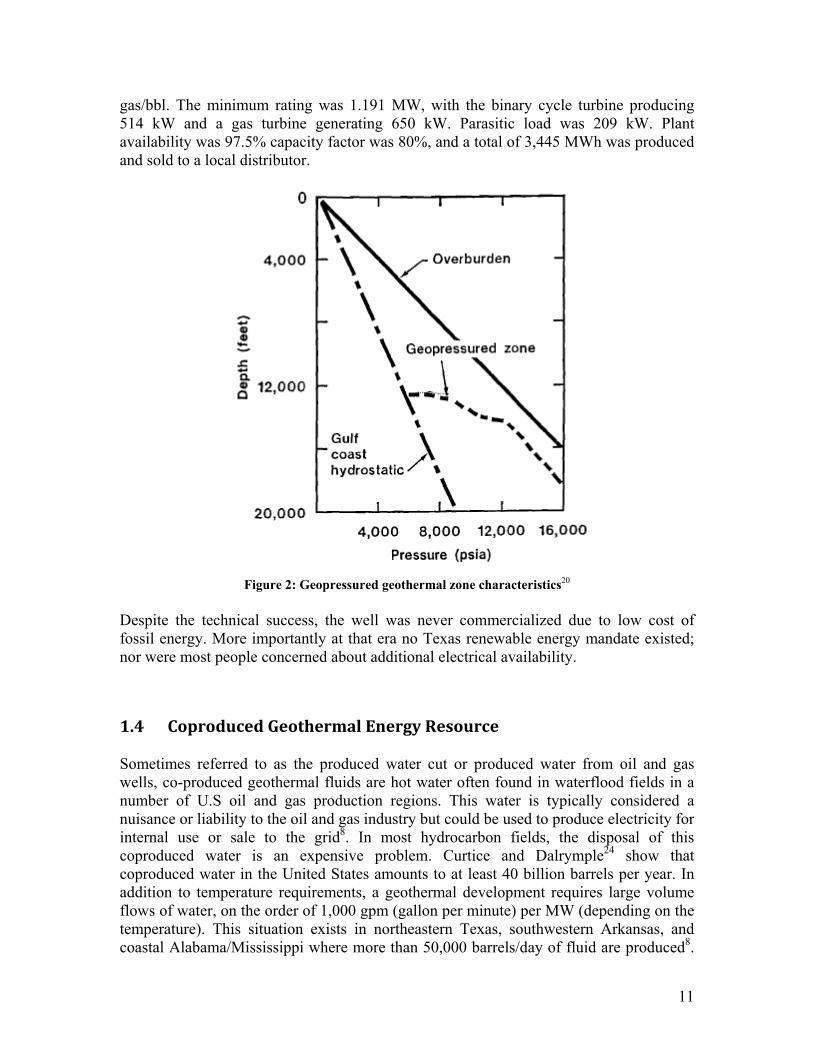
Geopressured reservoirs are deep reservoirs (4–10 km) in large sedimentary basins containing pressurized hot brine that remained trapped at the time of deposition of the sediment, and has a pressure gradient exceeding the normal hydrostatic gradient, which, in the Gulf Coast area, is 0.465 psi/ft and have been measured up to 100% in excess of the hydrostatic pressure corresponding to that depth6, 15-19 (figure 2). Geopressured resources have three energy forms: thermal, kinetic and chemical energy. These three forms of energy can be converted to higher value forms of energy using available technologies. The thermal energy can be converted to electricity using a geothermal binary turbine. The kinetic energy can be converted to electricity with hydraulic turbine. Dissolved methane gas (chemical energy) can be separated and sold, burned, compressed, liquefied, converted to methanol or to electricity by fueling a turbine20. Flow rates can vary between 10,000 and 100,000 barrels per day (BPD), and temperature range from 100 to 250 degrees Celsius. Bottom hole pressures are 12,000 – 18,500 pounds per square inch absolute (psia). Salinity is present in the amount of 20,000 – 200,000 milligrams per liter (mg/l), and between 23-100 standard cubic feet (scf) of gas exist in each barrel fluid20. Geological formations located in the northern Gulf of Mexico contain large reservoirs of hot, saline brine under abnormally high pressure and temperatures. Estimates21 of the energy potential of this undeveloped resource range as high as 160,000 quadrillion BTUs (quads). The USGS has estimated that there are 5,700 quads of recoverable gas and 11,000 quads of thermal energy in the onshore Gulf Coast reservoirs without regard to economics22. The energy consumption of the United States is presently 100 quads per year; this resource could conservatively provide a portion of the domestic energy supply for many centuries. In the late 1970’s through the 1980’s the DOE investigated the Texas and Louisiana Gulf Coast for developing geothermal electric power. According to the United States Geological Survey report22, hydrothermal resources have energy potentials equal to 23,000 megawatts electric (MWe), plus or minus 3400 MWe, for 30 years. The geopressured resources are estimated to contain from 23,000 to 240,000 MWe for 30 years. Geopressured resources have been investigated extensively in offshore wells in Texas and Louisiana in the US Gulf Coast area, and pilot projects were operated there for some years to produce geopressured fluid and extract its heat and methane gas content23. However, during this feasibility studies, only chemical and thermal energy conversion was achieved. The Wilcox and Frio/Vicksburg strata were target reservoirs, and while most of the investigated wells were in Louisiana, Pleasant Bayou # 2 in Brazoria County, Texas, became the first successful hybrid binary cycle system used in a deep sedimentary basin. Brine flow rate was estimated at a minimum of 20,000 bbl/day with 22 scf of
11
gas/bbl. The minimum rating was 1.191 MW, with the binary cycle turbine producing 514 kW and a gas turbine generating 650 kW. Parasitic load was 209 kW. Plant availability was 97.5% capacity factor was 80%, and a total of 3,445 MWh was produced and sold to a local distributor.
Figure 2: Geopressured geothermal zone characteristics20
Despite the technical success, the well was never commercialized due to low cost of fossil energy. More importantly at that era no Texas renewable energy mandate existed; nor were most people concerned about additional electrical availability.
1.4 Coproduced Geothermal Energy Resource Sometimes referred to as the produced water cut or produced water from oil and gas wells, co-produced geothermal fluids are hot water often found in waterflood fields in a number of U.S oil and gas production regions. This water is typically considered a nuisance or liability to the oil and gas industry but could be used to produce electricity for internal use or sale to the grid8. In most hydrocarbon fields, the disposal of this coproduced water is an expensive problem. Curtice and Dalrymple24 show that coproduced water in the United States amounts to at least 40 billion barrels per year. In addition to temperature requirements, a geothermal development requires large volume flows of water, on the order of 1,000 gpm (gallon per minute) per MW (depending on the temperature). This situation exists in northeastern Texas, southwestern Arkansas, and coastal Alabama/Mississippi where more than 50,000 barrels/day of fluid are produced8.
12
Collecting and passing the fluid through a binary system electrical power plant may required no further processing, because, in some cases, the produced fluid already is passed to a central collection facility for hydrocarbon separation and water disposal. The primary unknowns and, hence, limiting factors in these areas are the magnitude of the combined flow rates and the actual temperatures of the produced fluid in these existing hydrocarbon fields. In the case of two fields in Alabama, the temperatures appear to be more than 120°C (250°F), well within the range of binary generation capability. Its use in this way would also mitigate the environmental problems associated with disposal, by introducing a beneficial use of the waste product and ultimately lowering the cost of some forms of hydrocarbon extraction. Like geopressured resources, co-produced geothermal resources can deliver near-term energy savings, diminish greenhouse gas emissions, and extend the economical use of an oil or gas field. New low-temperature electric generation technology may greatly expand the geothermal resources that can be developed economically today.
1.5. State of the Knowledge and Gaps In a few places around the globe, the hot rock is in contact with water that can transport its heat to the surface. Hot springs and geysers are natural manifestations of geothermal heat. For decades, people have drilled into natural hydrothermal reservoirs and brought the fluid to the surface for direct use or to produce electricity. Unfortunately, there are a limited number of these hydrothermal regions. In contrast, hot-dry-rock (HDR) resources are plentiful at depths that can be reached by conventional drilling techniques, but they are not naturally in contact with the mobile fluids that could transport heat to the surface. Researchers during the past 30 years have developed a method for recovering the heat from HDR resources. Enhanced or engineered geothermal system (EGS) involves drilling an injection well into the HDR and pumping down highly pressurized fluid, generally water to open natural fractures in the hot rock. This process creates man-made geothermal systems of fractured rock. One or more additional wells are then drilled to intersect the engineered reservoir. The system is operated by injecting the fluid into one wellbore, circulating it through the reservoir where it is heated, and extracting superheated product at the production wellbores. After its thermal energy is extracted, the same fluid can be recirculated to remove more heat from the EGS. The hope is to engineer an improved environment capable to sustain heat production over long periods of time. The problem with development in this setting is that drilling characteristics, stress situations, and lithologic details remain poorly understood and the water supply is uncertain8. Significant technical challenges are encountered in understanding the formation of an HDR reservoir, verifying its position and dimensions, and extracting heat from it on a sustained basis. The United States Gulf Coast possesses few, if any, conventional electrical grade geothermal hydrothermal resources. However, there are areas identified in this region where high temperatures are routinely being encountered in sedimentary rock during drilling for hydrocarbons. Thousands of these wells have temperatures that reach 150°C (330°F) to more than 200°C (400°F). Additionally, significant porosity and permeability exists at depths of 3 to 6 km, and there is potential for large amounts of hot water either with or without stimulation of the reservoirs. Consequently, some of these wells are
13
candidates for exploitation of geopressured geothermal resources, already proven feasible at prices similar to those existing today23. In some of these cases, there may be opportunity to stimulate fluid flows high enough to produce significant quantities of geothermal energy without having to create a new reservoir, or with relatively minor modifications of an existing oil or gas reservoir. So, there is a real possibility of developing also a more conventional geothermal exploitation similar to the geothermal sites currently producing electric power in the Great Basin of Nevada. Costs for carbon dioxide sequestration into deep saline aquifers or depleted oil reservoirs can be transformed into more benefit when combined with ecologically desirable geothermal heat or power production. Recently, it has been theoretically proven that CO2, because of its thermo-physical characteristics (compressibility, expansibility and viscosity), has the potential to efficiently extract heat from enhanced geothermal systems25. This approach has the advantage that, during the energy extraction process, part of the carbon dioxide is diffused and sequestered within the reservoir. The drilling techniques and procedures for geothermal wells are similar to those used in the oil and gas industry. The Golf Coast region has developed infrastructure and an existing energy industry presence which make this region suitable for geothermal oil wells development. Despite this potential and the vast body of existing knowledge, EGS have yet to produce a single kilowatt-hour of electrical energy in the United States. Limiting issues relate to the expense of deep drilling, the uncertainties in creating a long-lived and low impedance reservoir, potentially unsustainable water losses, and the concomitant reluctance of oil companies to invest. Fischer26 summarized some of the issues as follows: Temperature depletion is not a serious problem, but water loss could be. Scale formation and/or fracture cementing could create flow problems. Flow short-circuiting could occur, but has not been a problem in experiments thus far. Vertical fractures are the most serious concern, because they either send water downhole, which wastes it, or uphole, which cools it. To overcome these problems involves understanding the rock mechanics and stresses, good fracture design and implementation, and monitoring the fracture progress using microseismic and other techniques, to ensure that the fracture network propagates horizontally. More importantly the use of CO2 as a working fluid may not only solve the problem of uncertain water availability but also add more value to the project in term of carbon sequestered during the operation.
2. Approach and Goals
Investigation to determine the economic feasibility of geopressured geothermal energy production generally centered either on reservoirs performance or financial viability of field development27. This approach may be compromised because for the past two decades, no complete studies characterizing commerciality of geopressured reservoirs have been performed. This study combines reservoir performance, facility efficiency and financial constraints to determine a range of potential outcomes for sustainable commercial development of geopressured geothermal reservoirs. The reservoir performance model utilizes a commercial reservoir simulation program (Computer Modeling Group Ltd, CMG) to predict the production rates from aquifers
14
under constrained surface pressure. Sensitivities consider single- well developments. Reservoir model components are varied to determine a wide range of reservoir productivities. Characteristic parameters include bulk volume, depth, porosity/permeability, initial pressure and temperature gradient, salinity, formation compressibility, maximum allowable flow rate, wellbore radius, and initial gas saturation. The facility model uses reservoir temperature, wellhead pressure, and flow rate from the reservoir performance model to estimate the net electric output of the energy recovery system. The financial model computes the discounted cash flow of geopressured aquifer developments. Input parameters for the financial model are net electric output, electricity price, capital and operational costs, severance taxes and net revenue interest. By combining the results of the reservoir, facility, and financial models, a range of input parameters that yield a positive life-cycle cash flow are delineated. The ranges can be applied to evaluate geopressured-geothermal resources and identify areas where additional research is warranted. Each of these components identify to evaluate the viability of geopressured utilization is defined by a different set of variables. Some of these variables are inter-related (e.g., flow rate affects reservoir performance, facility process design, and financial constraints). The following sections describe a methodology to determine potential commerciality of geopressured reservoirs. Variables expected to affect the commerciality of geopressured reservoirs are defined.
2.1. Reservoir Performance and Modeling
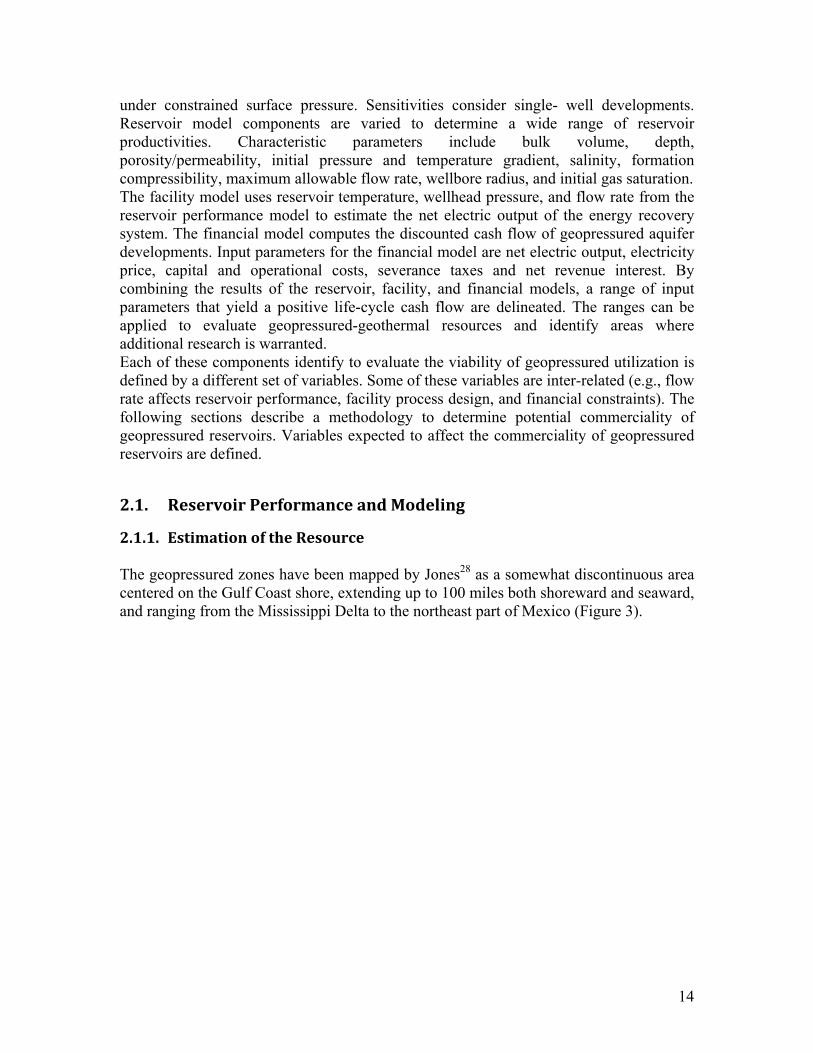
2.1.1. Estimation of the Resource The geopressured zones have been mapped by Jones28 as a somewhat discontinuous area centered on the Gulf Coast shore, extending up to 100 miles both shoreward and seaward, and ranging from the Mississippi Delta to the northeast part of Mexico (Figure 3).
15
Figure 3: Geopressured zones in northern Gulf of Mexico Basin The magnitude of the geopressured energy resource in the northern Gulf Coast of Mexico could be roughly estimated on the basis of the following:
• Estimation of the total in-place water. • Classification of the resource into three basic reservoir and well types. • Estimation of the total available gas production and electrical energy for each
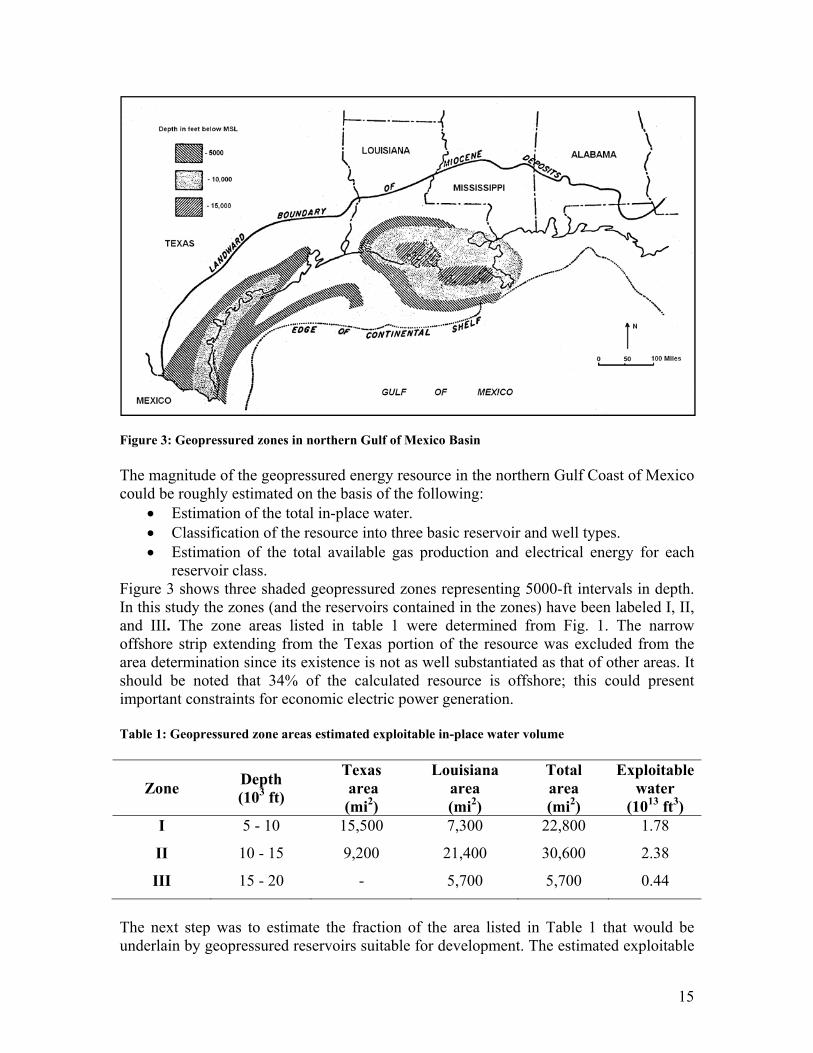
reservoir class. Figure 3 shows three shaded geopressured zones representing 5000-ft intervals in depth. In this study the zones (and the reservoirs contained in the zones) have been labeled I, II, and III. The zone areas listed in table 1 were determined from Fig. 1. The narrow offshore strip extending from the Texas portion of the resource was excluded from the area determination since its existence is not as well substantiated as that of other areas. It should be noted that 34% of the calculated resource is offshore; this could present important constraints for economic electric power generation. Table 1: Geopressured zone areas estimated exploitable in-place water volume
Zone Depth (103 ft)
Texas area (mi2)
Louisiana area (mi2)
Total area (mi2)
Exploitable water
(1013 ft3) I 5 - 10 15,500 7,300 22,800 1.78
II 10 - 15 9,200 21,400 30,600 2.38
III 15 - 20 - 5,700 5,700 0.44
The next step was to estimate the fraction of the area listed in Table 1 that would be underlain by geopressured reservoirs suitable for development. The estimated exploitable
16
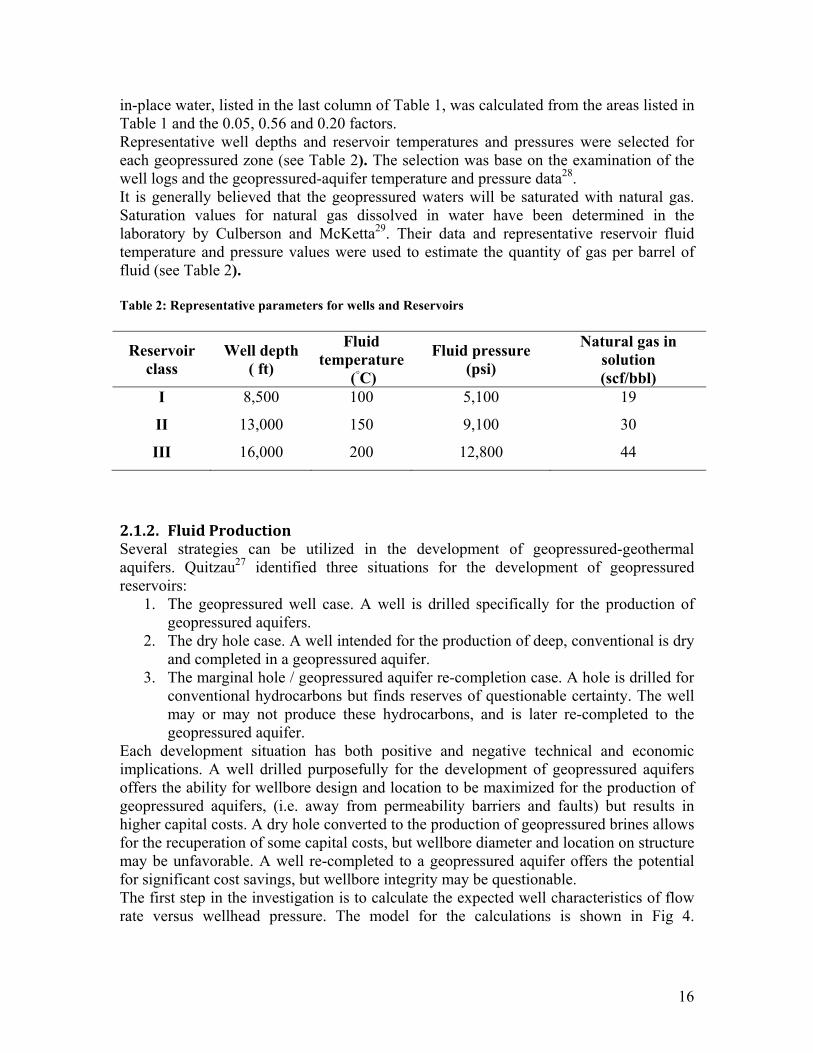
in-place water, listed in the last column of Table 1, was calculated from the areas listed in Table 1 and the 0.05, 0.56 and 0.20 factors. Representative well depths and reservoir temperatures and pressures were selected for each geopressured zone (see Table 2). The selection was base on the examination of the well logs and the geopressured-aquifer temperature and pressure data28. It is generally believed that the geopressured waters will be saturated with natural gas. Saturation values for natural gas dissolved in water have been determined in the laboratory by Culberson and McKetta29. Their data and representative reservoir fluid temperature and pressure values were used to estimate the quantity of gas per barrel of fluid (see Table 2). Table 2: Representative parameters for wells and Reservoirs
Reservoir class
Well depth ( ft)
Fluid temperature
(◦C)
Fluid pressure (psi)
Natural gas in solution (scf/bbl)
I 8,500 100 5,100 19
II 13,000 150 9,100 30
III 16,000 200 12,800 44
2.1.2. Fluid Production Several strategies can be utilized in the development of geopressured-geothermal aquifers. Quitzau27 identified three situations for the development of geopressured reservoirs:
1. The geopressured well case. A well is drilled specifically for the production of geopressured aquifers.
2. The dry hole case. A well intended for the production of deep, conventional is dry and completed in a geopressured aquifer.
3. The marginal hole / geopressured aquifer re-completion case. A hole is drilled for conventional hydrocarbons but finds reserves of questionable certainty. The well may or may not produce these hydrocarbons, and is later re-completed to the geopressured aquifer.
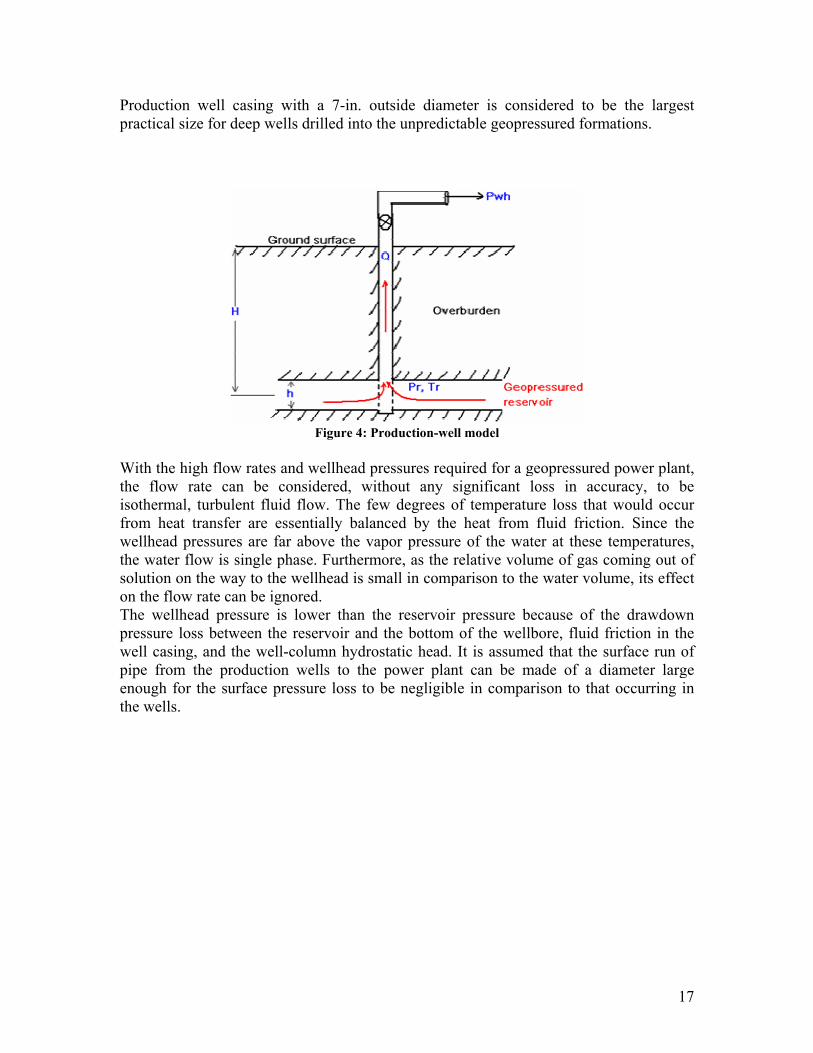
Each development situation has both positive and negative technical and economic implications. A well drilled purposefully for the development of geopressured aquifers offers the ability for wellbore design and location to be maximized for the production of geopressured aquifers, (i.e. away from permeability barriers and faults) but results in higher capital costs. A dry hole converted to the production of geopressured brines allows for the recuperation of some capital costs, but wellbore diameter and location on structure may be unfavorable. A well re-completed to a geopressured aquifer offers the potential for significant cost savings, but wellbore integrity may be questionable. The first step in the investigation is to calculate the expected well characteristics of flow rate versus wellhead pressure. The model for the calculations is shown in Fig 4.
Produpract
With the fisothefrom wellhthe wsolution thThe wpresswell pipe enougthe w
uction well ical size for
the high floflow rate cermal, turbuheat transf
head pressurwater flow ision on the we flow rate cwellhead prure loss betcasing, and from the prgh for the su
wells.
casing withdeep wells d
ow rates and can be consulent fluid flfer are essenres are far abs single phasway to the wecan be ignoreressure is lotween the rethe well-colroduction wurface press
h a 7-in. oudrilled into t
Figure 4: Pr
wellhead prsidered, witlow. The fewntially balanbove the vase. Furthermellhead is smed.
ower than theservoir and lumn hydros
wells to the sure loss to b
utside diamethe unpredict
roduction-wel
ressures requthout any sw degrees onced by theapor pressure
more, as the rmall in comp
he reservoir the bottom
static head. power plan
be negligibl
eter is constable geopre
ll model
uired for a gsignificant lof temperatu heat from e of the watrelative voluparison to the
pressure beof the wellbIt is assume
nt can be mle in compar
sidered to bessured form
geopressuredloss in accuure loss that
fluid frictioter at these tume of gas ce water volu
ecause of thbore, fluid fed that the s
made of a dirison to that
1
be the largesmations.
d power planuracy, to bwould occu
on. Since thtemperature
coming out oume, its effec
he drawdowfriction in thsurface run oiameter largt occurring i
7
st
nt, be ur he s, of ct
wn he of ge in
18
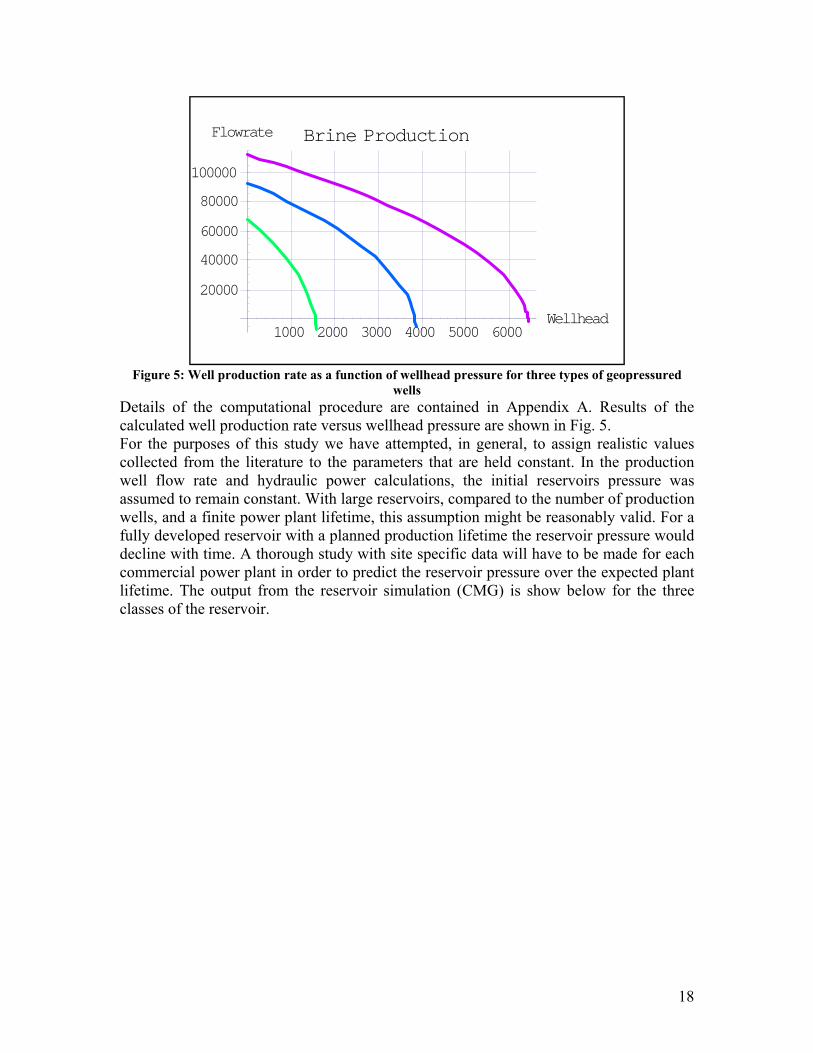
Figure 5: Well production rate as a function of wellhead pressure for three types of geopressured
wells Details of the computational procedure are contained in Appendix A. Results of the calculated well production rate versus wellhead pressure are shown in Fig. 5. For the purposes of this study we have attempted, in general, to assign realistic values collected from the literature to the parameters that are held constant. In the production well flow rate and hydraulic power calculations, the initial reservoirs pressure was assumed to remain constant. With large reservoirs, compared to the number of production wells, and a finite power plant lifetime, this assumption might be reasonably valid. For a fully developed reservoir with a planned production lifetime the reservoir pressure would decline with time. A thorough study with site specific data will have to be made for each commercial power plant in order to predict the reservoir pressure over the expected plant lifetime. The output from the reservoir simulation (CMG) is show below for the three classes of the reservoir.
1000 2000 3000 4000 5000 6000Wellhead
20000
40000
60000
80000
100000
Flowrate Brine Production
19
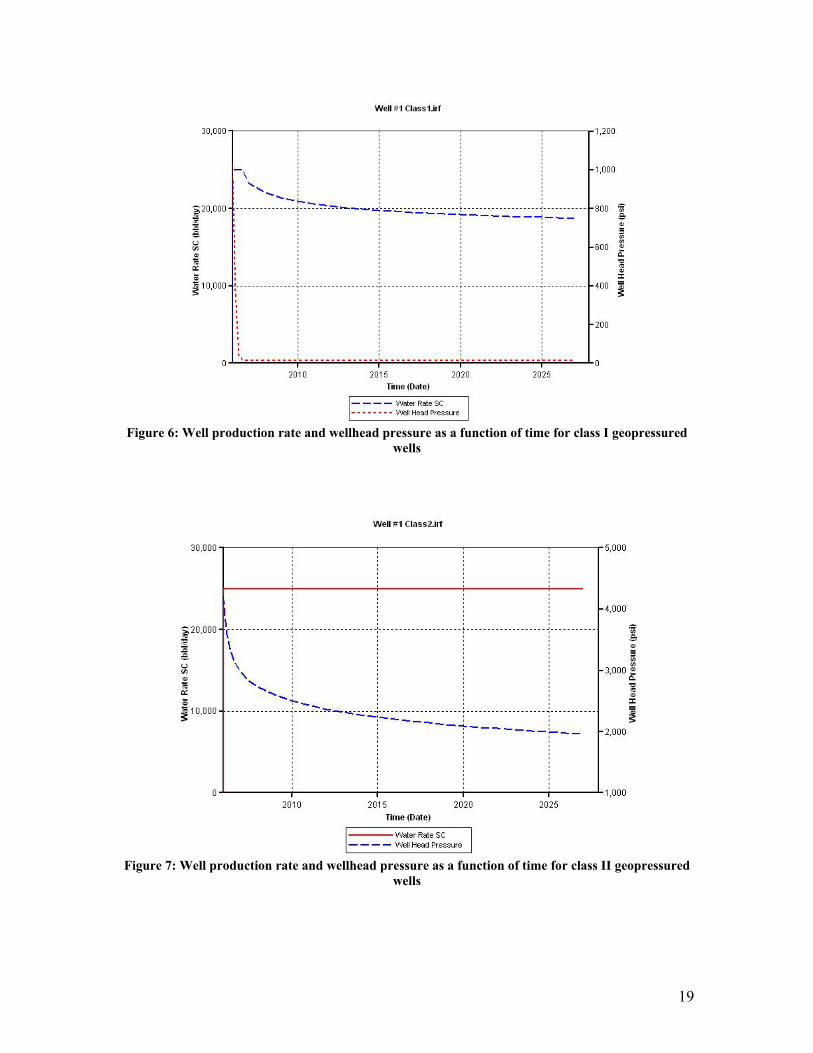
Figure 6: Well production rate and wellhead pressure as a function of time for class I geopressured
wells
Figure 7: Well production rate and wellhead pressure as a function of time for class II geopressured
wells
20
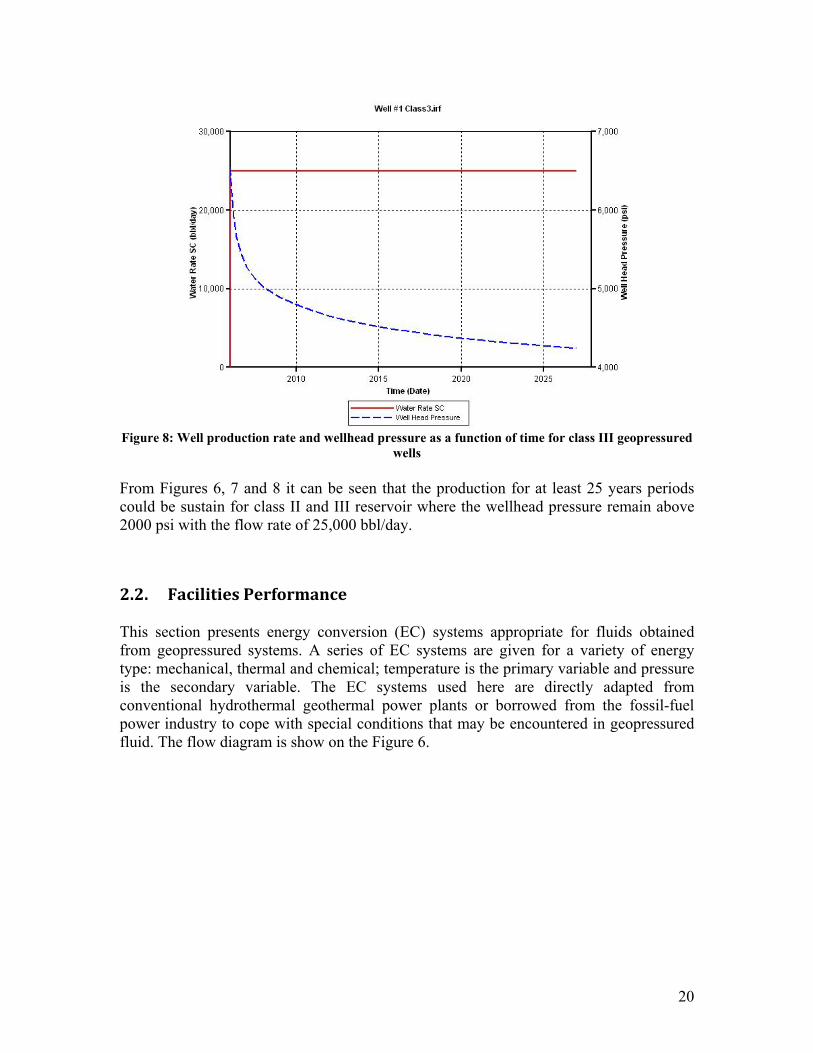
Figure 8: Well production rate and wellhead pressure as a function of time for class III geopressured
wells From Figures 6, 7 and 8 it can be seen that the production for at least 25 years periods could be sustain for class II and III reservoir where the wellhead pressure remain above 2000 psi with the flow rate of 25,000 bbl/day.
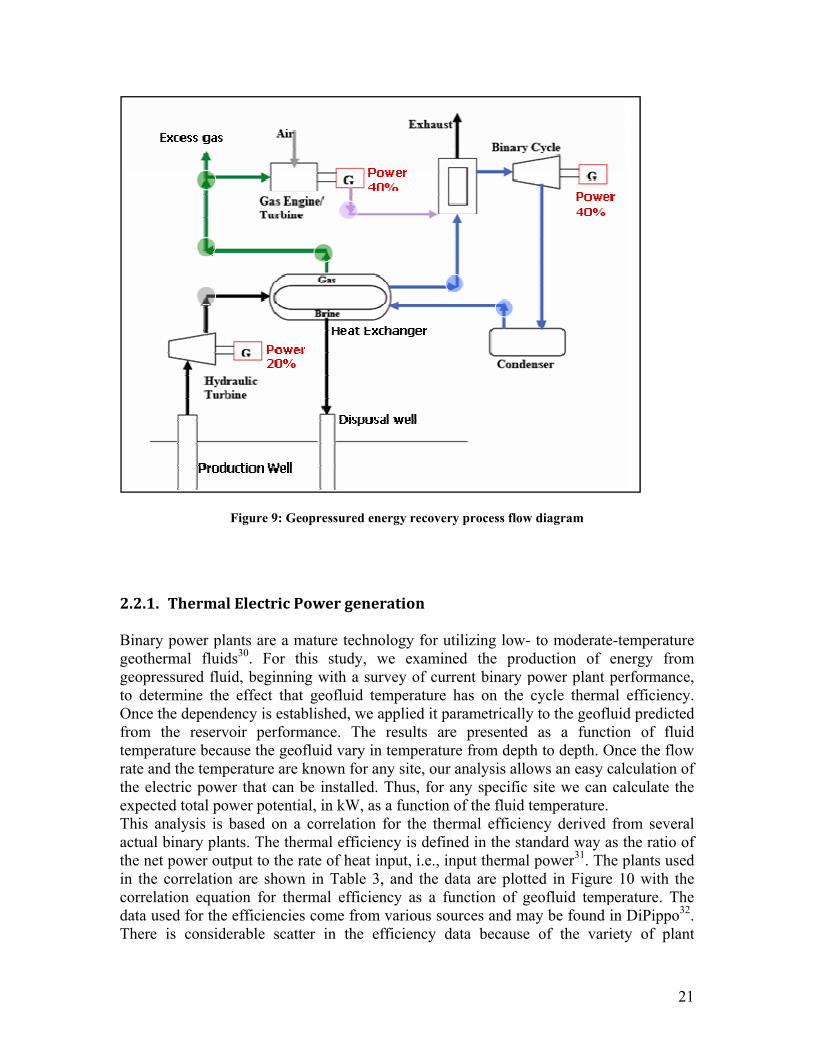
2.2. Facilities Performance This section presents energy conversion (EC) systems appropriate for fluids obtained from geopressured systems. A series of EC systems are given for a variety of energy type: mechanical, thermal and chemical; temperature is the primary variable and pressure is the secondary variable. The EC systems used here are directly adapted from conventional hydrothermal geothermal power plants or borrowed from the fossil-fuel power industry to cope with special conditions that may be encountered in geopressured fluid. The flow diagram is show on the Figure 6.
2.2.1 Binargeothgeoprto deOncefrom temprate athe eexpecThis actuathe nin thecorredata uThere
1. Thermal
ry power plahermal fluidressured fluietermine thee the depende
the reserverature becaand the templectric powected total poanalysis is
al binary planet power oute correlation
elation equatused for the e is conside
Figure 9: Geo
l Electric Po
ants are a mds30. For thid, beginnin
e effect that ency is estab
voir performause the geofperature are ker that can bower potentia
based on a nts. The thertput to the ran are showntion for therefficiencies
erable scatte
opressured en
ower gener
mature technohis study, wng with a sur
geofluid teblished, we a
mance. The fluid vary inknown for anbe installed. al, in kW, ascorrelation rmal efficienate of heat in
n in Table 3rmal efficiens come from er in the ef
nergy recovery
ration
ology for utiwe examinervey of curremperature happlied it pa
results aren temperatureny site, our aThus, for a
s a function ofor the therncy is definenput, i.e., in, and the dancy as a funvarious sou
fficiency da
y process flow
ilizing low-ed the prodrent binary phas on the carametricallye presented e from depthanalysis allo
any specific of the fluid trmal efficiened in the staput thermal
ata are plottenction of ge
urces and maata because
diagram
to moderateduction of power plant cycle therm
y to the geoflas a funct
h to depth. Oows an easy csite we can
temperature.ncy derived andard way a
power31. Thed in Figureeofluid tempay be found
of the var
2
e-temperaturenergy fromperformanceal efficiencyluid predictetion of fluiOnce the flowcalculation ocalculate th
from severa
as the ratio ohe plants usee 10 with thperature. Thin DiPippo3
riety of plan
21
re m e, y. ed id w of he
al of ed he he
2. nt
22
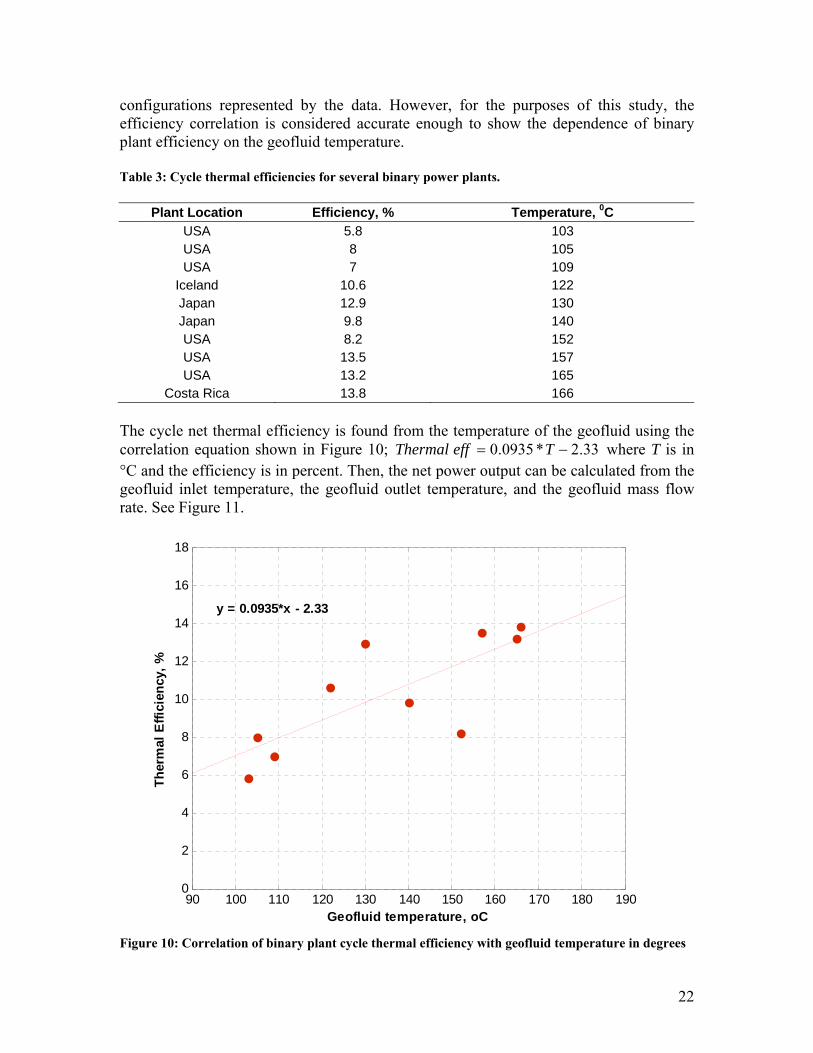
configurations represented by the data. However, for the purposes of this study, the efficiency correlation is considered accurate enough to show the dependence of binary plant efficiency on the geofluid temperature. Table 3: Cycle thermal efficiencies for several binary power plants.
Plant Location Efficiency, % Temperature, 0C USA 5.8 103 USA 8 105 USA 7 109
Iceland 10.6 122 Japan 12.9 130 Japan 9.8 140 USA 8.2 152 USA 13.5 157 USA 13.2 165
Costa Rica 13.8 166 The cycle net thermal efficiency is found from the temperature of the geofluid using the correlation equation shown in Figure 10; 33.2*0935.0 −= TeffThermal where T is in °C and the efficiency is in percent. Then, the net power output can be calculated from the geofluid inlet temperature, the geofluid outlet temperature, and the geofluid mass flow rate. See Figure 11.
Figure 10: Correlation of binary plant cycle thermal efficiency with geofluid temperature in degrees
90 100 110 120 130 140 150 160 170 180 1900
2
4
6
8
10
12
14
16
18
Geofluid temperature, oC
Ther
mal
Effi
cien
cy, %
y = 0.0935*x - 2.33
23
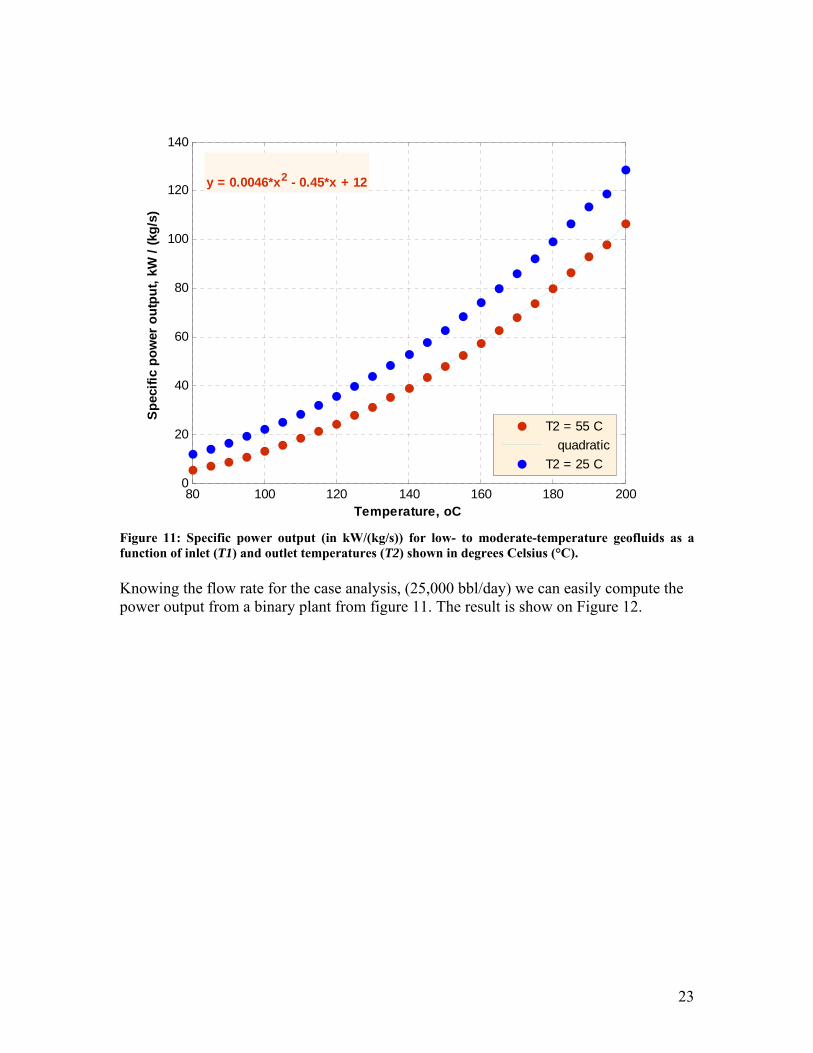
Figure 11: Specific power output (in kW/(kg/s)) for low- to moderate-temperature geofluids as a function of inlet (T1) and outlet temperatures (T2) shown in degrees Celsius (°C). Knowing the flow rate for the case analysis, (25,000 bbl/day) we can easily compute the power output from a binary plant from figure 11. The result is show on Figure 12.
80 100 120 140 160 180 2000
20
40
60
80
100
120
140
Temperature, oC
Spec
ific
pow
er o
utpu
t, kW
/ (k
g/s)
y = 0.0046*x2 - 0.45*x + 12
T2 = 55 C quadraticT2 = 25 C
24
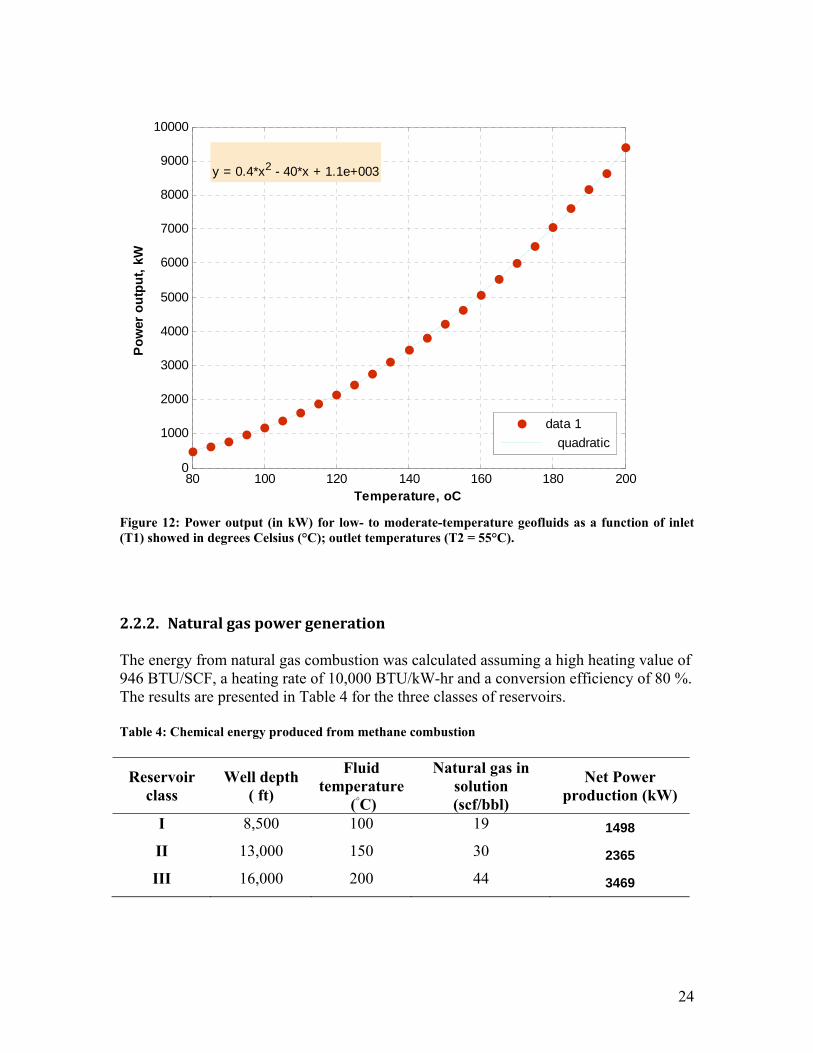
Figure 12: Power output (in kW) for low- to moderate-temperature geofluids as a function of inlet (T1) showed in degrees Celsius (°C); outlet temperatures (T2 = 55°C).
2.2.2. Natural gas power generation
The energy from natural gas combustion was calculated assuming a high heating value of 946 BTU/SCF, a heating rate of 10,000 BTU/kW-hr and a conversion efficiency of 80 %. The results are presented in Table 4 for the three classes of reservoirs. Table 4: Chemical energy produced from methane combustion
Reservoir class
Well depth ( ft)
Fluid temperature
(◦C)
Natural gas in solution (scf/bbl)
Net Power production (kW)
I 8,500 100 19 1498
II 13,000 150 30 2365
III 16,000 200 44 3469
80 100 120 140 160 180 2000
1000
2000
3000
4000
5000
6000
7000
8000
9000
10000
Temperature, oC
Pow
er o
utpu
t, kW
y = 0.4*x2 - 40*x + 1.1e+003
data 1 quadratic
25
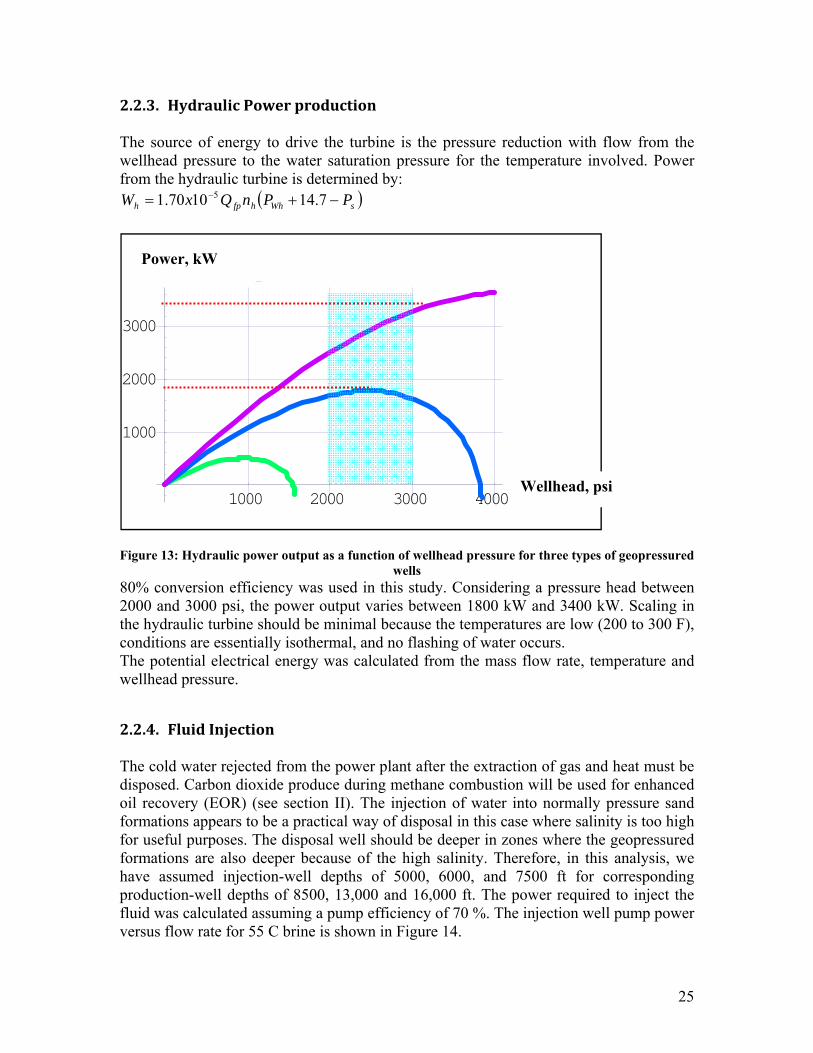
2.2.3. Hydraulic Power production The source of energy to drive the turbine is the pressure reduction with flow from the wellhead pressure to the water saturation pressure for the temperature involved. Power from the hydraulic turbine is determined by:
( )sWhhfph PPnQxW −+= − 7.141070.1 5
Figure 13: Hydraulic power output as a function of wellhead pressure for three types of geopressured wells
80% conversion efficiency was used in this study. Considering a pressure head between 2000 and 3000 psi, the power output varies between 1800 kW and 3400 kW. Scaling in the hydraulic turbine should be minimal because the temperatures are low (200 to 300 F), conditions are essentially isothermal, and no flashing of water occurs. The potential electrical energy was calculated from the mass flow rate, temperature and wellhead pressure.
2.2.4. Fluid Injection The cold water rejected from the power plant after the extraction of gas and heat must be disposed. Carbon dioxide produce during methane combustion will be used for enhanced oil recovery (EOR) (see section II). The injection of water into normally pressure sand formations appears to be a practical way of disposal in this case where salinity is too high for useful purposes. The disposal well should be deeper in zones where the geopressured formations are also deeper because of the high salinity. Therefore, in this analysis, we have assumed injection-well depths of 5000, 6000, and 7500 ft for corresponding production-well depths of 8500, 13,000 and 16,000 ft. The power required to inject the fluid was calculated assuming a pump efficiency of 70 %. The injection well pump power versus flow rate for 55 C brine is shown in Figure 14.
1000 2000 3000 4000Wellhead
1000
2000
3000
Power Hydraulic Power
Wellhead, psi
Power, kW
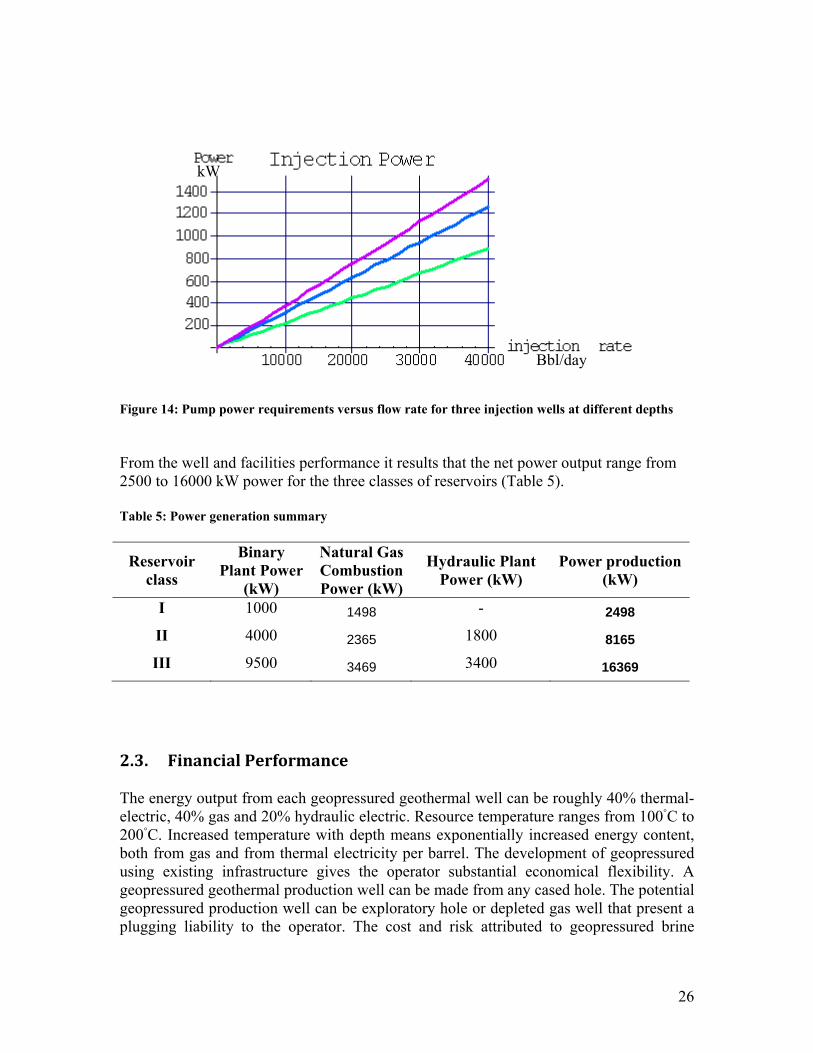
26
Figure 14: Pump power requirements versus flow rate for three injection wells at different depths From the well and facilities performance it results that the net power output range from 2500 to 16000 kW power for the three classes of reservoirs (Table 5). Table 5: Power generation summary
Reservoir class
Binary Plant Power
(kW)
Natural Gas Combustion Power (kW)
Hydraulic Plant Power (kW)
Power production (kW)
I 1000 1498 - 2498
II 4000 2365 1800 8165
III 9500 3469 3400 16369
2.3. Financial Performance The energy output from each geopressured geothermal well can be roughly 40% thermal-electric, 40% gas and 20% hydraulic electric. Resource temperature ranges from 100◦C to 200◦C. Increased temperature with depth means exponentially increased energy content, both from gas and from thermal electricity per barrel. The development of geopressured using existing infrastructure gives the operator substantial economical flexibility. A geopressured geothermal production well can be made from any cased hole. The potential geopressured production well can be exploratory hole or depleted gas well that present a plugging liability to the operator. The cost and risk attributed to geopressured brine
kW
Bbl/day
27
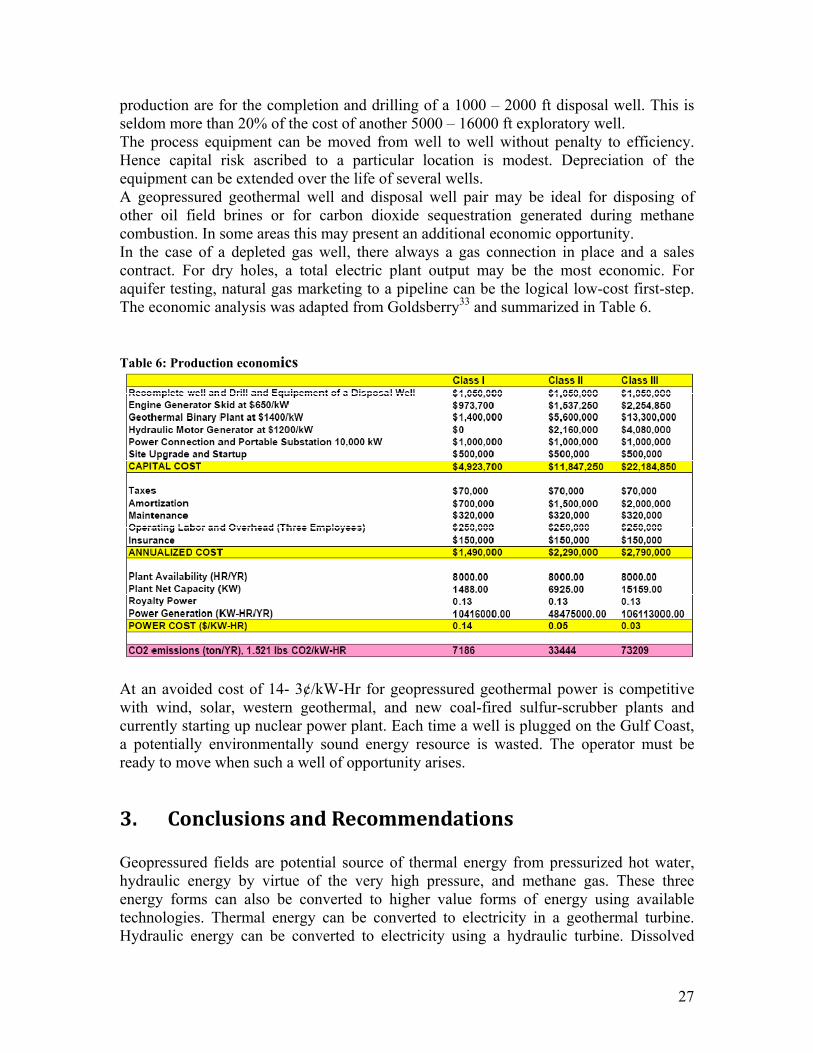
production are for the completion and drilling of a 1000 – 2000 ft disposal well. This is seldom more than 20% of the cost of another 5000 – 16000 ft exploratory well. The process equipment can be moved from well to well without penalty to efficiency. Hence capital risk ascribed to a particular location is modest. Depreciation of the equipment can be extended over the life of several wells. A geopressured geothermal well and disposal well pair may be ideal for disposing of other oil field brines or for carbon dioxide sequestration generated during methane combustion. In some areas this may present an additional economic opportunity. In the case of a depleted gas well, there always a gas connection in place and a sales contract. For dry holes, a total electric plant output may be the most economic. For aquifer testing, natural gas marketing to a pipeline can be the logical low-cost first-step. The economic analysis was adapted from Goldsberry33 and summarized in Table 6. Table 6: Production economics
At an avoided cost of 14- 3¢/kW-Hr for geopressured geothermal power is competitive with wind, solar, western geothermal, and new coal-fired sulfur-scrubber plants and currently starting up nuclear power plant. Each time a well is plugged on the Gulf Coast, a potentially environmentally sound energy resource is wasted. The operator must be ready to move when such a well of opportunity arises.
3. Conclusions and Recommendations Geopressured fields are potential source of thermal energy from pressurized hot water, hydraulic energy by virtue of the very high pressure, and methane gas. These three energy forms can also be converted to higher value forms of energy using available technologies. Thermal energy can be converted to electricity in a geothermal turbine. Hydraulic energy can be converted to electricity using a hydraulic turbine. Dissolved
28
methane gas can be separated and sold, burned, compressed, liquefied, converted to methanol, or converted to electricity by fuelling a turbine. Despite many drawbacks, it is a fact that the geothermal energy is currently cost competitive with conventional sources, and could be produced by means of well proven conventional technology. Geothermal energy is reliable, clean and sustainable. The geothermal technology is now mature. Many companies are highly qualified for every aspect of development, from prospecting to plant financing. Nevertheless, excellent geothermal prospects remain undeveloped because of the relatively low cost of fossil fuel. The introduction of a pollution tax for the emission of CO2 and sulfur would significantly improve the environment and the economic competitiveness of geothermal resources with respect to fossil fuels. References: 1. Rybach, L., Geothermal energy: sustainability and the environment. Geothermics
2003, 32, (4-6), 463-470. 2. Ghose, M. K., Environmentally sustainable supplies of energy with specific
reference to geothermal energy. Energy Sources 2004, 26, (6), 531-539. 3. Energy and Geosciences Institute Briefing on Geothermal Energy; University of
Utah, Prepared by the U.S. Geothermal Industry for the Renewable Energy Task Force (1997),: Washington, D.C. , 1997; p 87.
4. Budd, C. F. J., Geothermal energy for electrical generation. Society of Petroleum Engineers Journal 1984, SPE 12885.
5. Dickson, M. H.; Fanelli, M., Electricity from Geothermal-Energy - Analysis of the Trend to the Year-2000. Renewable Energy 1994, 5, (5-8), 1483-1491.
6. Barbier, E., Geothermal energy technology and current status: an overview. Renewable & Sustainable Energy Reviews 2002, 6, (1-2), 3-65.
7. Lund, J. W., The USA geothermal country update. Geothermics 2003, 32, (4-6), 409-418.
8. McKenna, J., Blackwell, D., Moyes, C., Patterson, P.D., Geothermal electric power supply possible from Gulf Coast, Midcontinent oil field waters. Oil and Gas Journal 2005, Sept. 5, 34.
9. Morris, J. R.; Sammis, C. G., Recovery of Chemical Energy from a Dry-Rock Geothermal Reservoir. Transactions-American Geophysical Union 1975, 56, (12), 1073-1073.
10. Awerbuch, L.; Lindemuth, T.; May, S.; Rogers, A., Geothermal-Energy Recovery Process. In Situ 1978, 2, (1), 68-68.
11. Awerbuch, L.; Lindemuth, T. E.; May, S. C.; Rogers, A. N., Geothermal-Energy Recovery Process. Desalination 1976, 19, (1-3), 325-336.
12. Bodvarsson, G.; Hanson, J., Secondary Recovery Method for Extraction of Geothermal-Energy. Transactions-American Geophysical Union 1977, 58, (3), 165-165.
13. Bodvarsson, G. S.; Pruess, K.; Lippmann, M.; Bjornsson, S., Improved Energy Recovery from Geothermal-Reservoirs. Journal of Petroleum Technology 1982, 34, (9), 1920-1928.
29
14. Dickson, M. H.; Fanelli, M., Small Geothermal Resources - a Review. Energy Sources 1994, 16, (3), 349-376.
15. Bebout, D. G.; Loucks, R. G.; Gregory, A. R., Testing Geopressured Geothermal Resource, Frio Formation, Texas Gulf-Coast. Aapg Bulletin-American Association of Petroleum Geologists 1979, 63, (9), 1595-1595.
16. Dorfman, M. H., Evaluation of the Geopressured Resources of the United-States Gulf-Coast. Abstracts of Papers of the American Chemical Society 1980, 180, (Aug), 9-Geoc.
17. Doscher, T. M.; Osborne, R. H.; Rhee, S. W.; Wilson, T.; Cox, D., Methane from Geopressured Aquifers Studied. Oil & Gas Journal 1979, 77, (15), 178-&.
18. Holt, B., Geopressured Resource - Sleeping Giant. Hydrocarbon Processing 1977, 56, (7), 96-98.
19. Kerr, R. A., Geopressured Energy Fighting Uphill Battle. Science 1980, 207, (4438), 1455-1456.
20. Negus-de Wys, J., Dorfman, M., The geopressured-geothermal resource: transition to commercialization. GRC Transactions 1990, 14, (I), 537-545.
21. Bebout, D. G.; Loucks, R. G., Geopressured Geothermal Prospects in Frio Formation of Texas Gulf Coast - Ideal Versus Actual Models. Aapg Bulletin-American Association of Petroleum Geologists 1976, 60, (9), 1606-1607.
22. Garg, S. K.; Riney, T. D.; Wallace, R. H., Brine and gas recovery from geopressured systems. Geothermics 1986, 15, (1), 23-48.
23. Morris, C. W.; Campbell, D. A., Geothermal Reservoir Energy Recovery - a 3-Dimensional Simulation Study of the East Mesa Field. Journal of Petroleum Technology 1981, 33, (4), 735-742.
24. Curtice, R. J., Dalrymple, E. D. , Just the cost of doing business. World Oil 2004, pp 77-78.
25. Pruess, K., Enhanced geothermal systems (EGS) using CO2 as working fluid - A novel approach for generating renewable energy with simultaneous sequestration of carbon. Geothermics 2006, 35, (4), 351-367.
26. Fischer, P. A., What's new in exploration. World Oil Magazine February 2004, 2004, pp 77-78.
27. Quitzau, R., Bassiouni, Z., The possible impact of the geopressure resource on conventional oil and gas exploration. SPE 1981, 10281.
28. Jones, P. H., Geothermal resources of the northern gulf of Mexico basin. Geothermics 1970, 2, (Part 1), 14-26.
29. Culberson, O. L., and McKetta, J.J., Phase equilibrium in hydrocarbon-water systems, III. The solubility of methane in water at pressures to 10,000 psia. AIME Petroleum Transactions, 192, 223-226.
30. DiPippo, R., Geothermal Power Plants: Principles, Applications and Case Studies,, . Elsevier Advanced Technology: Oxford, England, 2005.
31. Moran, M. J., Shapiro, H.N., Fundamentals of Engineering Thermodynamics, . 5th ed.; John Wiley & Sons, : Hoboken, NJ., 2004.
32. DiPippo, R., Second law assessment of binary plants for power generation from low-temperature geothermal fluids. Geothermics 2004, 33, 565-586.
30
33. Goldsberry, F. L., Salvaging dry holes on the Guld Coast: A management strategy for oil and gas exploration tied to economic geopressured geothermal cogeneration development. SPE 1994, 28283.
Appendix A The production-well model used in calculating fluid flow is shown in Figure 4 in the text. The symbols and units used in the calculations presented here are defined in Appendix B. The production-wellhead pressure whP is obtained as follow:
fddcrwh PPPPP Δ−Δ−−= The drawdown pressure loss ( )ddPΔ between the basic reservoir pressure and the well-bore bottom is calculated by the formula:
( )Khrw
reQP fp
dd 007082.0
lnμβ=Δ
The value used for the various factors are as follows: 1=β , 500=rwre , fth 500= and
100=K millidarcies. The pipes fluid-friction pressure drop is determined by the turbulent-flow head-loss equation:
21310*052.5 fpf QHP γ−=Δ The well-fluid-column hydrostatic pressure Pc is simply
144HPcγ
=
Appendix B The model used for calculating the fluid injection power requirements is similar to the production model. The volumetric injection flow rate is reduced from the production flow rate because of the temperature reduction and the reduced mass flow rate. Only the liquid portion from the separator downstream from the total-flow expander is injected.
1 15,390
The pump power is determined by:
14415,390 550 14.7 ∆ ∆
The quantities , ∆ and ∆ are determined by the methods outlined in Appendix A. Table B1 list the values of the various parameters needed.

31
Parameters values Pipe inside diameter D (ft) 0.729 Formation zone thickness h (ft) 500 Temperature T (F) 113 Specific weight (lb/ft3) 61.8 Viscosity µ (cp) 0.586 Pump efficiency 0.7 Pump inlet pressure 1.4
⁄ 500 Permeability (millidarcies) 85

32
Part B
Combination with EOR and CS
33
1. Introduction As geothermal plan is considered as a good renewable source, its economical model and application is important to produce energy such as heat and electricity. Most popular geothermal system is hydro- geothermal plant. However, it is difficult to satisfy for finding a high geothermal gradient geological reservoir and providing water as a working fluid, which has a regional restriction. For broadening conventional Enhanced Geothermal System (EGS), other types of geo-thermo resources have been considered such as Hot Dry Rock (HDR) EGS, Geo-pressured and magma energy. Especially, we are interested in combination of Geo-thermal resource with Enhanced Oil Recovery (EOR) and CO2 sequestration (CS) and produced economical benefit from this connection. Because we believe that in terms of geological reason, geothermal resource could be easily combined with EOR for increment oil production and CS for environmentally friendly reduction of CO2 emission. Thus, in this paper, we mainly examine feasibilities combination EOR and CS with geothermal resources. More detail, we will represent two ways to connect to EOR and CS to EGS and Geo-pressured as a treatment method of produced CO2; produced CO2 from Enhanced Geothermal System (EGS) with CO2 working fluid and Combustion plant with methane from Geo-pressure reservoir. Common benefit of both models is by using existing infrastructure, therefore reducing drilling cost. Moreover, each model has its own advantage. First model is EGS system which is using CO2 as a working fluid, in terms of increase of efficiency in transferring heat capacity instead of using Water. Second model is geo-pressured reservoir which does not require any working fluid which means that it does not need to spend money on extracting geothermal resource. Thus, in this model, actual connection with EOR and CS by using CO2 is CO2 emission from the gas fired plant using methane provided by geo-pressured reservoir. First of all, we will respectively talk about each EGS, EOR and CS. Geo-pressured reservoir is well described in before section. In this part, we focus on understanding the feasibility of model based on Geo-pressured reservoir, then study feasibility of second model. For testing feasibility, CMG (Computer Modeling Group) simulator is used for validating economical value with real reservoir condition from Texas.
34
2. Literature review
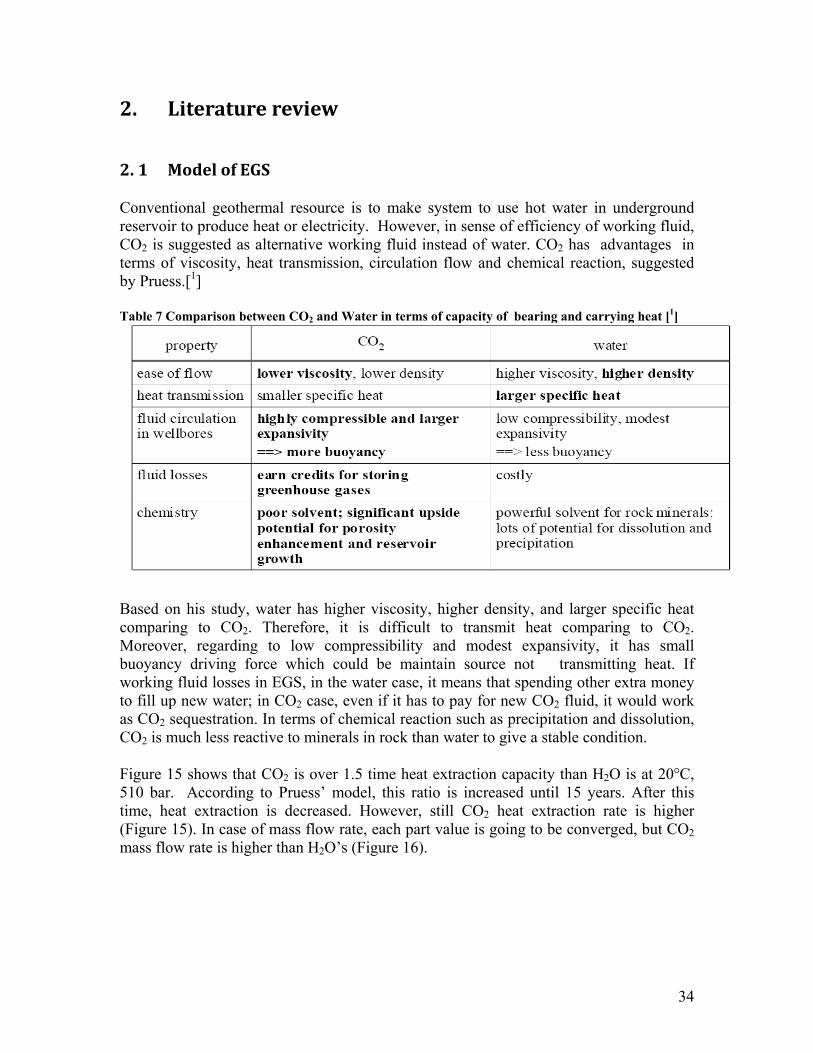
2. 1 Model of EGS Conventional geothermal resource is to make system to use hot water in underground reservoir to produce heat or electricity. However, in sense of efficiency of working fluid, CO2 is suggested as alternative working fluid instead of water. CO2 has advantages in terms of viscosity, heat transmission, circulation flow and chemical reaction, suggested by Pruess.[1] Table 7 Comparison between CO2 and Water in terms of capacity of bearing and carrying heat [1]
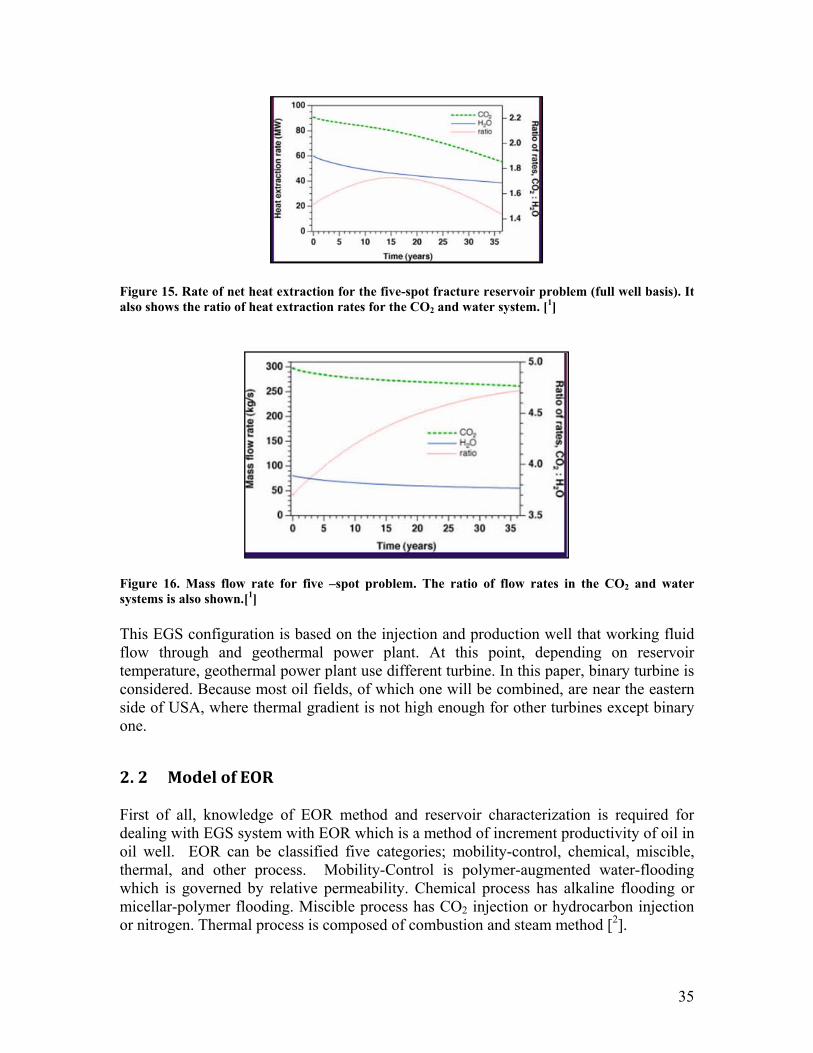
Based on his study, water has higher viscosity, higher density, and larger specific heat comparing to CO2. Therefore, it is difficult to transmit heat comparing to CO2. Moreover, regarding to low compressibility and modest expansivity, it has small buoyancy driving force which could be maintain source not transmitting heat. If working fluid losses in EGS, in the water case, it means that spending other extra money to fill up new water; in CO2 case, even if it has to pay for new CO2 fluid, it would work as CO2 sequestration. In terms of chemical reaction such as precipitation and dissolution, CO2 is much less reactive to minerals in rock than water to give a stable condition. Figure 15 shows that CO2 is over 1.5 time heat extraction capacity than H2O is at 20±C, 510 bar. According to Pruess’ model, this ratio is increased until 15 years. After this time, heat extraction is decreased. However, still CO2 heat extraction rate is higher (Figure 15). In case of mass flow rate, each part value is going to be converged, but CO2 mass flow rate is higher than H2O’s (Figure 16).
35
Figure 15. Rate of net heat extraction for the five-spot fracture reservoir problem (full well basis). It also shows the ratio of heat extraction rates for the CO2 and water system. [1]
Figure 16. Mass flow rate for five –spot problem. The ratio of flow rates in the CO2 and water systems is also shown.[1] This EGS configuration is based on the injection and production well that working fluid flow through and geothermal power plant. At this point, depending on reservoir temperature, geothermal power plant use different turbine. In this paper, binary turbine is considered. Because most oil fields, of which one will be combined, are near the eastern side of USA, where thermal gradient is not high enough for other turbines except binary one.
2. 2 Model of EOR First of all, knowledge of EOR method and reservoir characterization is required for dealing with EGS system with EOR which is a method of increment productivity of oil in oil well. EOR can be classified five categories; mobility-control, chemical, miscible, thermal, and other process. Mobility-Control is polymer-augmented water-flooding which is governed by relative permeability. Chemical process has alkaline flooding or micellar-polymer flooding. Miscible process has CO2 injection or hydrocarbon injection or nitrogen. Thermal process is composed of combustion and steam method [2].
36
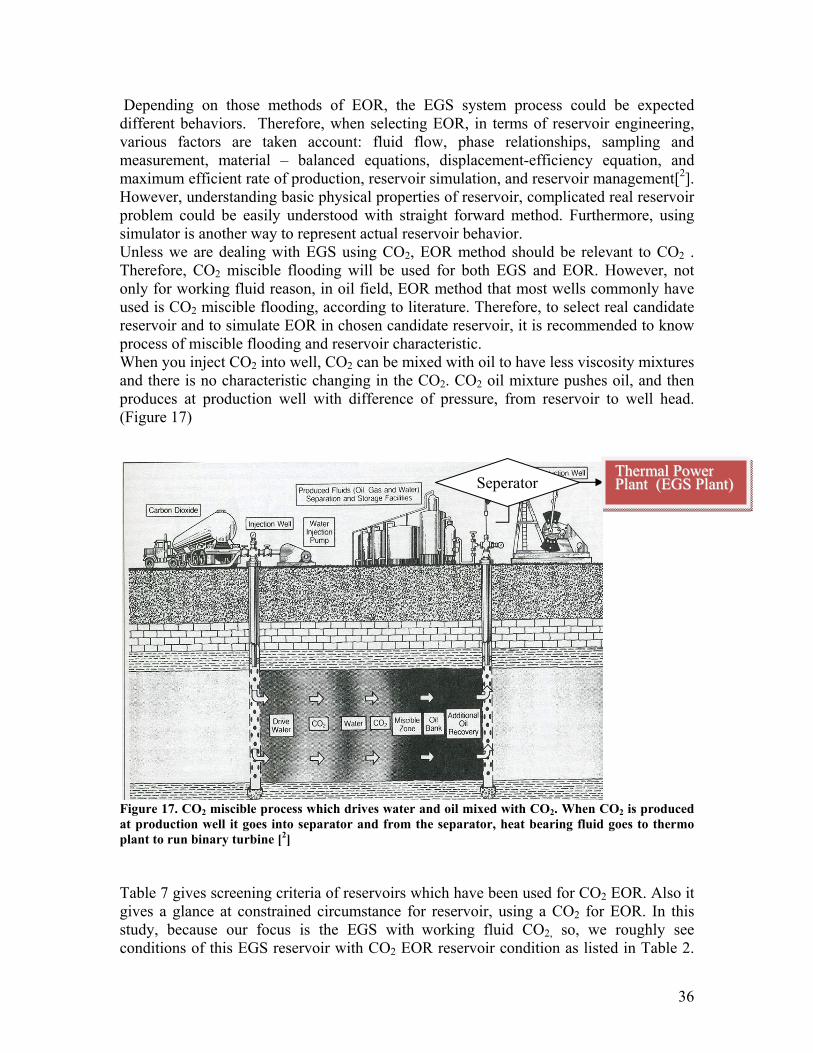
Depending on those methods of EOR, the EGS system process could be expected different behaviors. Therefore, when selecting EOR, in terms of reservoir engineering, various factors are taken account: fluid flow, phase relationships, sampling and measurement, material – balanced equations, displacement-efficiency equation, and maximum efficient rate of production, reservoir simulation, and reservoir management[2]. However, understanding basic physical properties of reservoir, complicated real reservoir problem could be easily understood with straight forward method. Furthermore, using simulator is another way to represent actual reservoir behavior. Unless we are dealing with EGS using CO2, EOR method should be relevant to CO2 . Therefore, CO2 miscible flooding will be used for both EGS and EOR. However, not only for working fluid reason, in oil field, EOR method that most wells commonly have used is CO2 miscible flooding, according to literature. Therefore, to select real candidate reservoir and to simulate EOR in chosen candidate reservoir, it is recommended to know process of miscible flooding and reservoir characteristic. When you inject CO2 into well, CO2 can be mixed with oil to have less viscosity mixtures and there is no characteristic changing in the CO2. CO2 oil mixture pushes oil, and then produces at production well with difference of pressure, from reservoir to well head. (Figure 17)
Figure 17. CO2 miscible process which drives water and oil mixed with CO2. When CO2 is produced at production well it goes into separator and from the separator, heat bearing fluid goes to thermo plant to run binary turbine [2] Table 7 gives screening criteria of reservoirs which have been used for CO2 EOR. Also it gives a glance at constrained circumstance for reservoir, using a CO2 for EOR. In this study, because our focus is the EGS with working fluid CO2, so, we roughly see conditions of this EGS reservoir with CO2 EOR reservoir condition as listed in Table 2.
TThheerrmmaall PPoowweerrPPllaanntt ((EEGGSS PPllaanntt)) Seperator
37
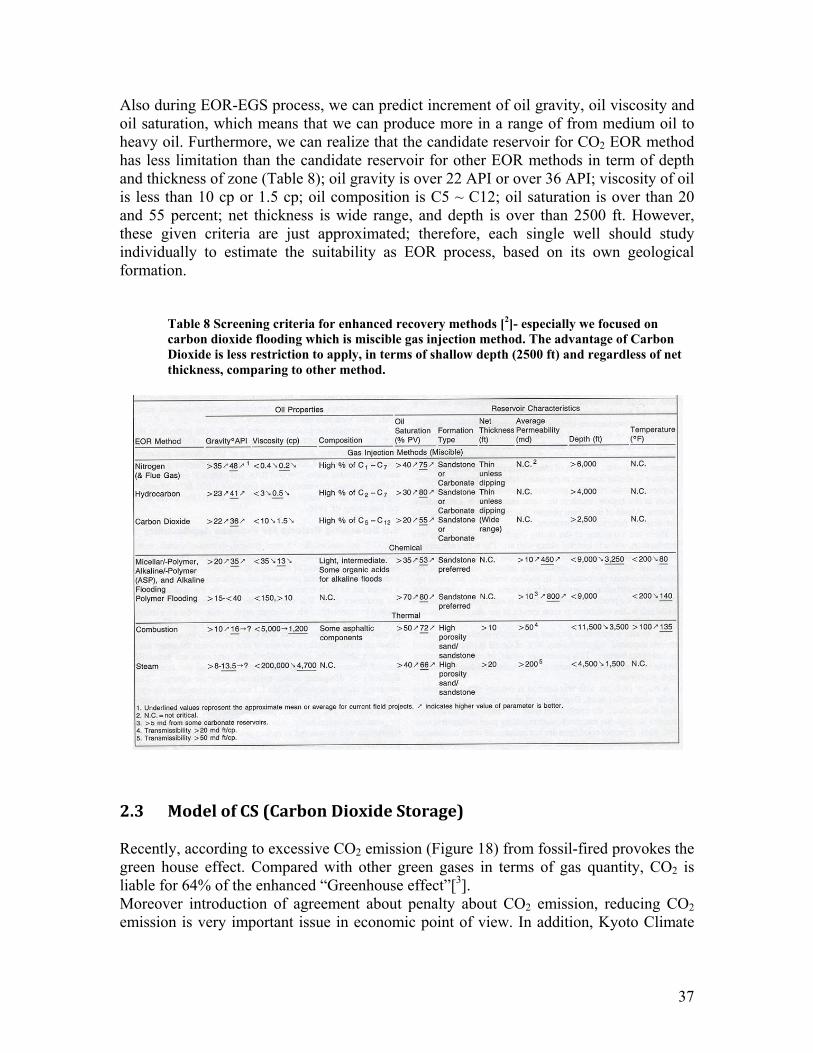
Also during EOR-EGS process, we can predict increment of oil gravity, oil viscosity and oil saturation, which means that we can produce more in a range of from medium oil to heavy oil. Furthermore, we can realize that the candidate reservoir for CO2 EOR method has less limitation than the candidate reservoir for other EOR methods in term of depth and thickness of zone (Table 8); oil gravity is over 22 API or over 36 API; viscosity of oil is less than 10 cp or 1.5 cp; oil composition is C5 ~ C12; oil saturation is over than 20 and 55 percent; net thickness is wide range, and depth is over than 2500 ft. However, these given criteria are just approximated; therefore, each single well should study individually to estimate the suitability as EOR process, based on its own geological formation.
Table 8 Screening criteria for enhanced recovery methods [2]- especially we focused on carbon dioxide flooding which is miscible gas injection method. The advantage of Carbon Dioxide is less restriction to apply, in terms of shallow depth (2500 ft) and regardless of net thickness, comparing to other method.
2.3 Model of CS (Carbon Dioxide Storage) Recently, according to excessive CO2 emission (Figure 18) from fossil-fired provokes the green house effect. Compared with other green gases in terms of gas quantity, CO2 is liable for 64% of the enhanced “Greenhouse effect”[3]. Moreover introduction of agreement about penalty about CO2 emission, reducing CO2 emission is very important issue in economic point of view. In addition, Kyoto Climate
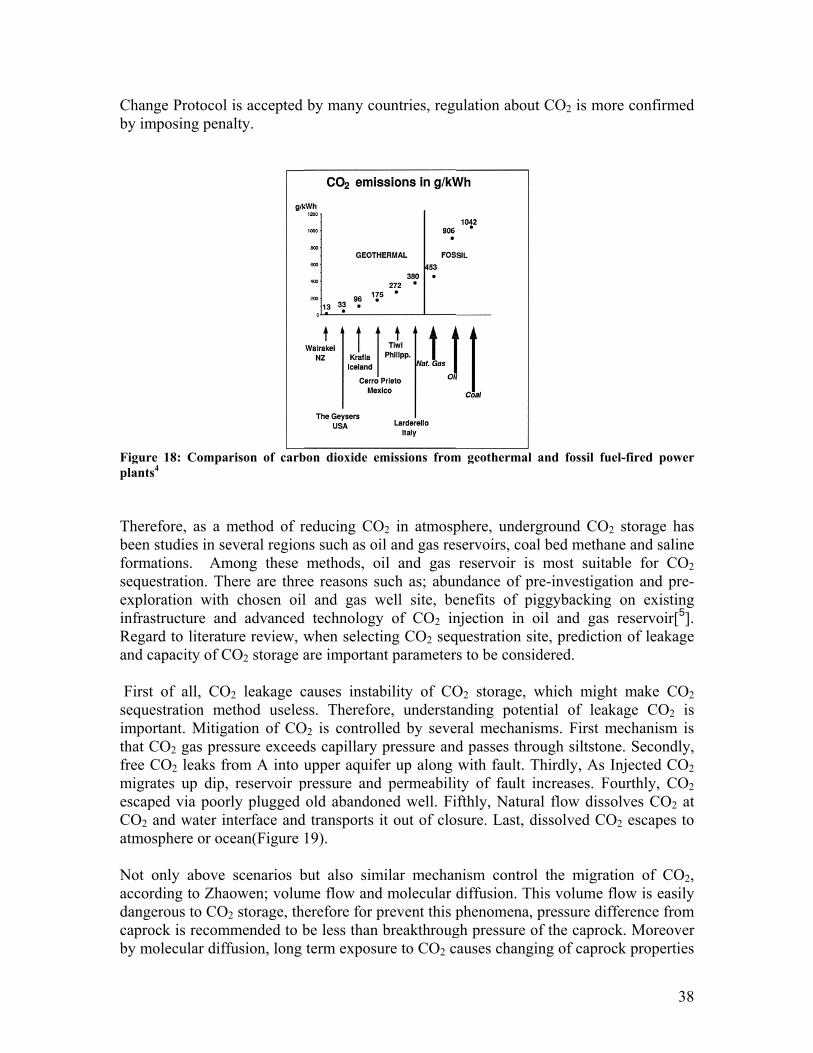
Chanby im
Figurplants Therebeen formasequeexploinfrasRegaand c Firstsequeimpothat Cfree CmigraescapCO2 atmo Not oaccordangecaproby m
nge Protocol mposing pena
e 18: Compas4
efore, as a mstudies in seations. Amestration. Thoration withstructure an
ard to literatucapacity of C
t of all, COestration mertant. MitigaCO2 gas preCO2 leaks frates up dip,ped via poorand water insphere or oc
only above rding to Zhaerous to COock is recom
molecular diff
is accepted alty.
arison of carb
method of reveral region
mong these here are threh chosen oilnd advancedure review, w
CO2 storage a
O2 leakage cethod uselesation of COssure exceedrom A into u reservoir prly plugged nterface andcean(Figure
scenarios baowen; volum
2 storage, thmmended to bfusion, long
by many co
bon dioxide em
reducing COns such as oimethods, o
ee reasons sul and gas w
d technologywhen selectiare importan
causes instabss. Therefor
O2 is controlds capillary upper aquife
pressure andold abandon
d transports i19).
but also simme flow anderefore for pbe less than term exposu
ountries, regu
missions from
O2 in atmospil and gas re
oil and gas uch as; abun
well site, bey of CO2 ining CO2 seqnt parameter
bility of COre, understalled by sevepressure and
er up along d permeabilined well. Fiit out of clo
milar mechand molecular prevent this pbreakthroug
ure to CO2 c
ulation abou
m geothermal
phere, underservoirs, coareservoir isndance of penefits of pnjection in questration ss to be consi
O2 storage, anding poteneral mechanid passes thrwith fault. Tty of fault i
ifthly, Naturosure. Last, d
nism controdiffusion. Thphenomena,gh pressure oauses chang
ut CO2 is mo
and fossil fu
rground COal bed methas most suitapre-investigaiggybackingoil and gasite, predictioidered.
which mighntial of leaisms. First mough siltstonThirdly, As increases. Fral flow dissdissolved CO
ol the migrahis volume f pressure difof the caproc
ging of capro
3
ore confirme
uel-fired powe
2 storage haane and salinable for COation and preg on existins reservoir[5
on of leakag
ht make COkage CO2 imechanism ine. SecondlyInjected CO
Fourthly, COsolves CO2 aO2 escapes t
ation of COflow is easilfference fromck. Moreove
ock propertie
38
ed
er
as ne O2 e-ng ].
ge
O2 is is y,
O2 O2 at to
2, ly m er es
39
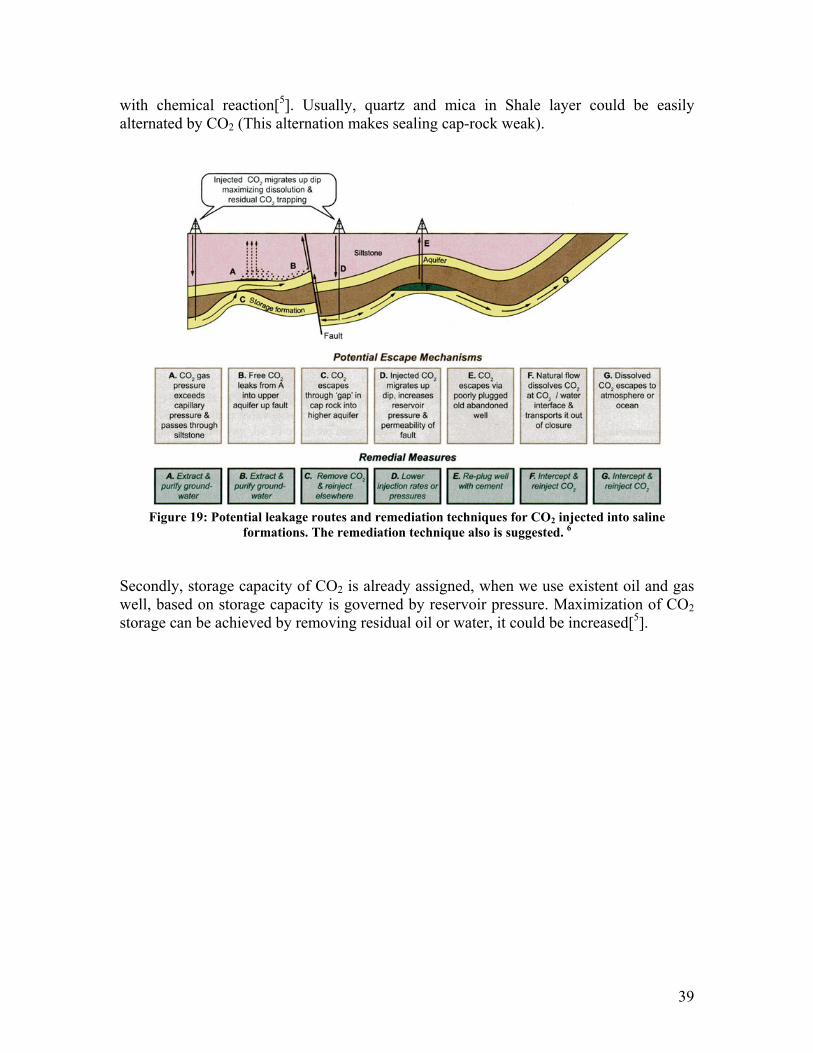
with chemical reaction[5]. Usually, quartz and mica in Shale layer could be easily alternated by CO2 (This alternation makes sealing cap-rock weak).
Figure 19: Potential leakage routes and remediation techniques for CO2 injected into saline
formations. The remediation technique also is suggested. 6 Secondly, storage capacity of CO2 is already assigned, when we use existent oil and gas well, based on storage capacity is governed by reservoir pressure. Maximization of CO2 storage can be achieved by removing residual oil or water, it could be increased[5].
40
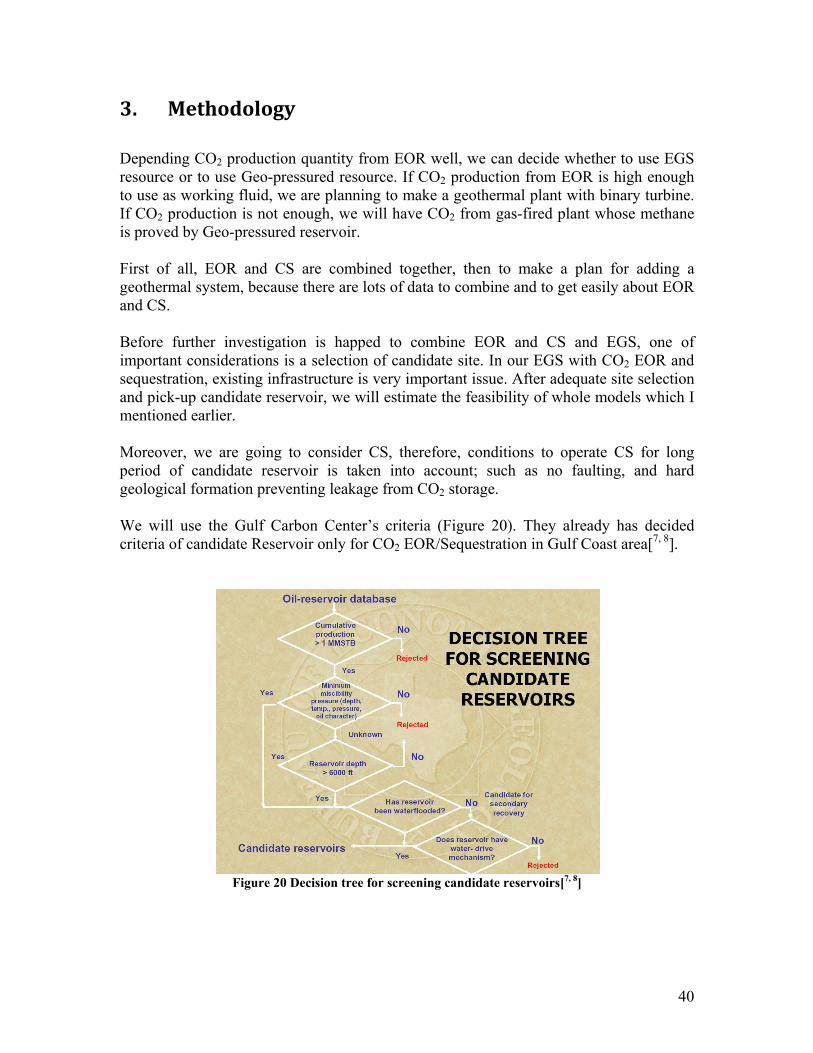
3. Methodology Depending CO2 production quantity from EOR well, we can decide whether to use EGS resource or to use Geo-pressured resource. If CO2 production from EOR is high enough to use as working fluid, we are planning to make a geothermal plant with binary turbine. If CO2 production is not enough, we will have CO2 from gas-fired plant whose methane is proved by Geo-pressured reservoir. First of all, EOR and CS are combined together, then to make a plan for adding a geothermal system, because there are lots of data to combine and to get easily about EOR and CS. Before further investigation is happed to combine EOR and CS and EGS, one of important considerations is a selection of candidate site. In our EGS with CO2 EOR and sequestration, existing infrastructure is very important issue. After adequate site selection and pick-up candidate reservoir, we will estimate the feasibility of whole models which I mentioned earlier. Moreover, we are going to consider CS, therefore, conditions to operate CS for long period of candidate reservoir is taken into account; such as no faulting, and hard geological formation preventing leakage from CO2 storage. We will use the Gulf Carbon Center’s criteria (Figure 20). They already has decided criteria of candidate Reservoir only for CO2 EOR/Sequestration in Gulf Coast area[7, 8].
Figure 20 Decision tree for screening candidate reservoirs[7, 8]
41
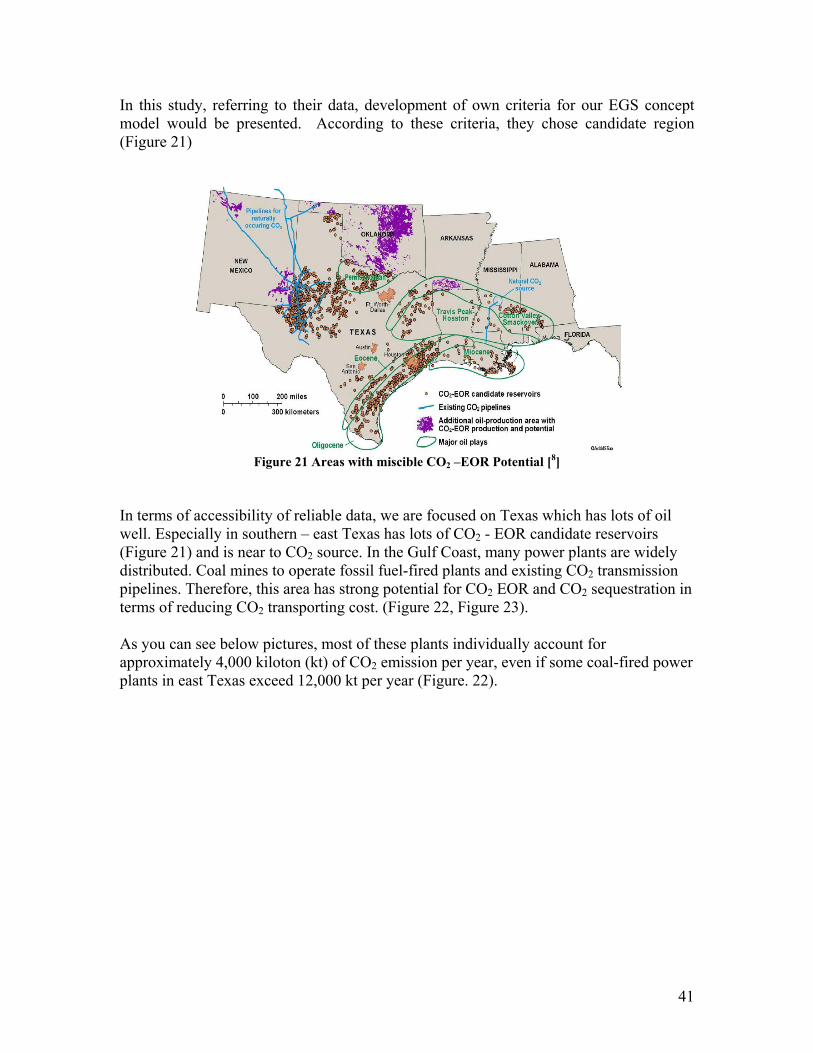
In this study, referring to their data, development of own criteria for our EGS concept model would be presented. According to these criteria, they chose candidate region (Figure 21)
Figure 21 Areas with miscible CO2 –EOR Potential [8]
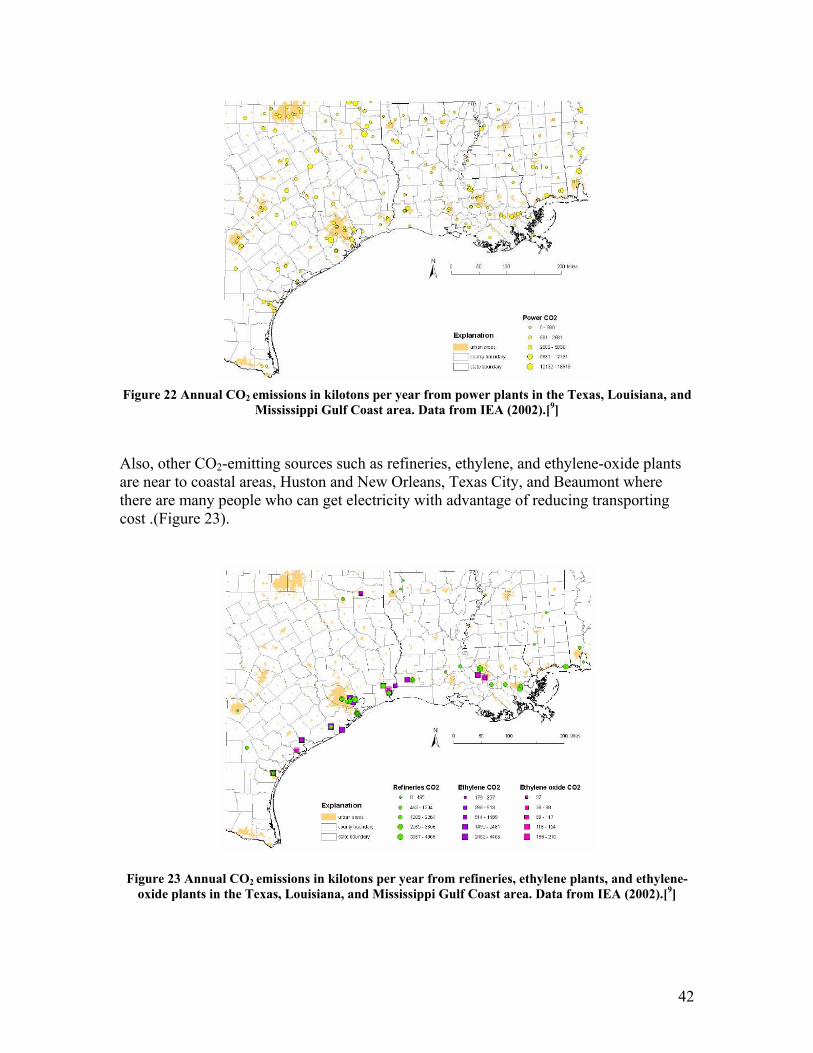
In terms of accessibility of reliable data, we are focused on Texas which has lots of oil well. Especially in southern – east Texas has lots of CO2 - EOR candidate reservoirs (Figure 21) and is near to CO2 source. In the Gulf Coast, many power plants are widely distributed. Coal mines to operate fossil fuel-fired plants and existing CO2 transmission pipelines. Therefore, this area has strong potential for CO2 EOR and CO2 sequestration in terms of reducing CO2 transporting cost. (Figure 22, Figure 23). As you can see below pictures, most of these plants individually account for approximately 4,000 kiloton (kt) of CO2 emission per year, even if some coal-fired power plants in east Texas exceed 12,000 kt per year (Figure. 22).
42
Figure 22 Annual CO2 emissions in kilotons per year from power plants in the Texas, Louisiana, and
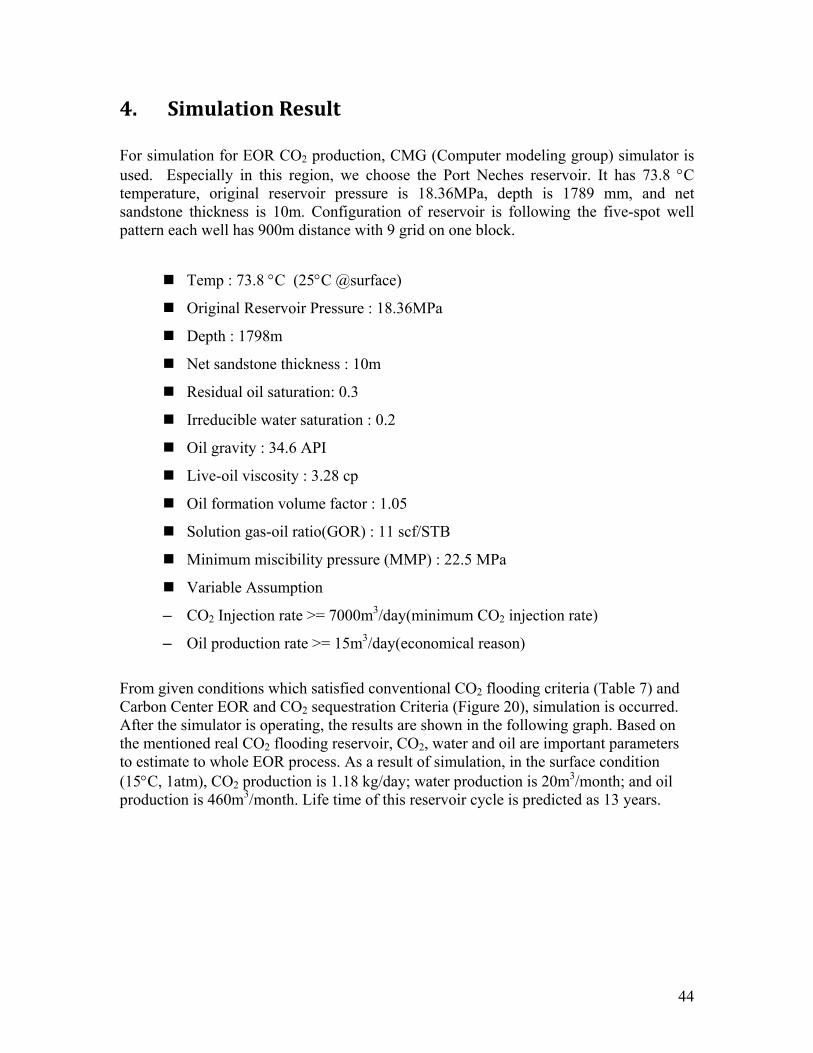
Mississippi Gulf Coast area. Data from IEA (2002).[9] Also, other CO2-emitting sources such as refineries, ethylene, and ethylene-oxide plants are near to coastal areas, Huston and New Orleans, Texas City, and Beaumont where there are many people who can get electricity with advantage of reducing transporting cost .(Figure 23).
Figure 23 Annual CO2 emissions in kilotons per year from refineries, ethylene plants, and ethylene-oxide plants in the Texas, Louisiana, and Mississippi Gulf Coast area. Data from IEA (2002).[9]

43
Therefore, in terms of economical reservoir, Texas is very suitable as candidate reservoir. In addition, for combination with Geo-pressured reservoir area, Texas is very suitable region.
44
4. Simulation Result For simulation for EOR CO2 production, CMG (Computer modeling group) simulator is used. Especially in this region, we choose the Port Neches reservoir. It has 73.8 °C temperature, original reservoir pressure is 18.36MPa, depth is 1789 mm, and net sandstone thickness is 10m. Configuration of reservoir is following the five-spot well pattern each well has 900m distance with 9 grid on one block.
Temp : 73.8 °C (25°C @surface)
Original Reservoir Pressure : 18.36MPa
Depth : 1798m
Net sandstone thickness : 10m
Residual oil saturation: 0.3
Irreducible water saturation : 0.2
Oil gravity : 34.6 API
Live-oil viscosity : 3.28 cp
Oil formation volume factor : 1.05
Solution gas-oil ratio(GOR) : 11 scf/STB
Minimum miscibility pressure (MMP) : 22.5 MPa
Variable Assumption
– CO2 Injection rate >= 7000m3/day(minimum CO2 injection rate)
– Oil production rate >= 15m3/day(economical reason)
From given conditions which satisfied conventional CO2 flooding criteria (Table 7) and Carbon Center EOR and CO2 sequestration Criteria (Figure 20), simulation is occurred. After the simulator is operating, the results are shown in the following graph. Based on the mentioned real CO2 flooding reservoir, CO2, water and oil are important parameters to estimate to whole EOR process. As a result of simulation, in the surface condition (15°C, 1atm), CO2 production is 1.18 kg/day; water production is 20m3/month; and oil production is 460m3/month. Life time of this reservoir cycle is predicted as 13 years.
45
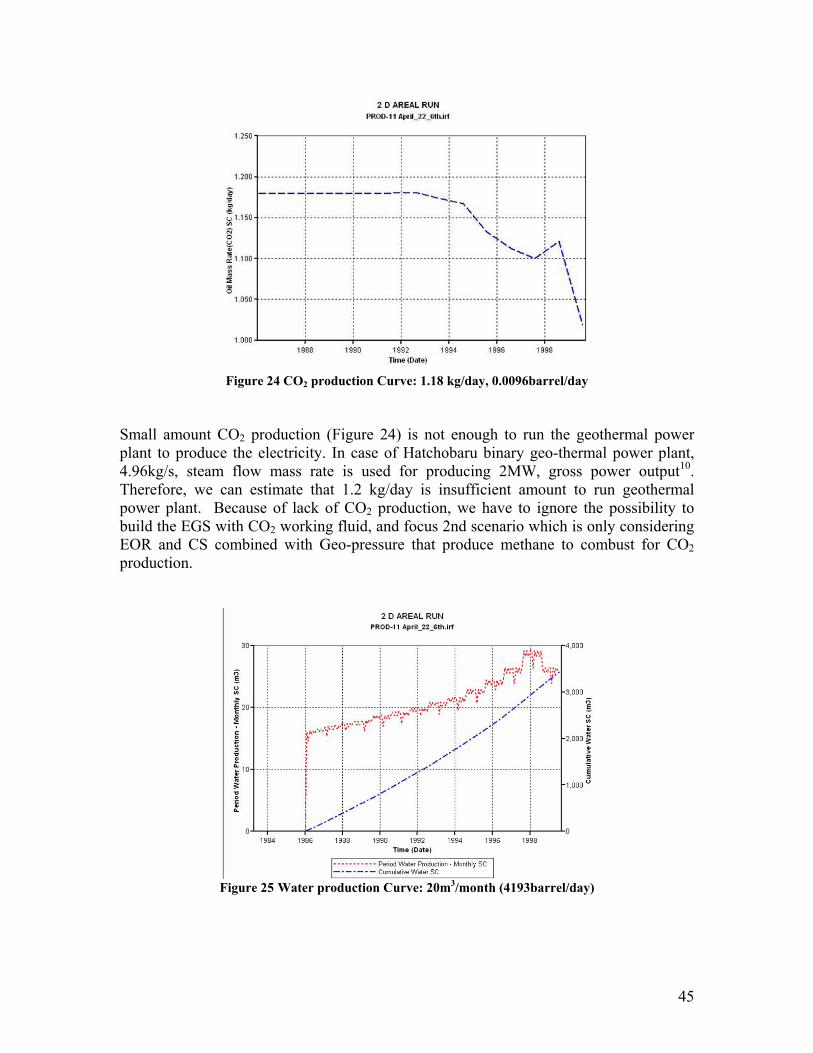
Figure 24 CO2 production Curve: 1.18 kg/day, 0.0096barrel/day
Small amount CO2 production (Figure 24) is not enough to run the geothermal power plant to produce the electricity. In case of Hatchobaru binary geo-thermal power plant, 4.96kg/s, steam flow mass rate is used for producing 2MW, gross power output10. Therefore, we can estimate that 1.2 kg/day is insufficient amount to run geothermal power plant. Because of lack of CO2 production, we have to ignore the possibility to build the EGS with CO2 working fluid, and focus 2nd scenario which is only considering EOR and CS combined with Geo-pressure that produce methane to combust for CO2 production.
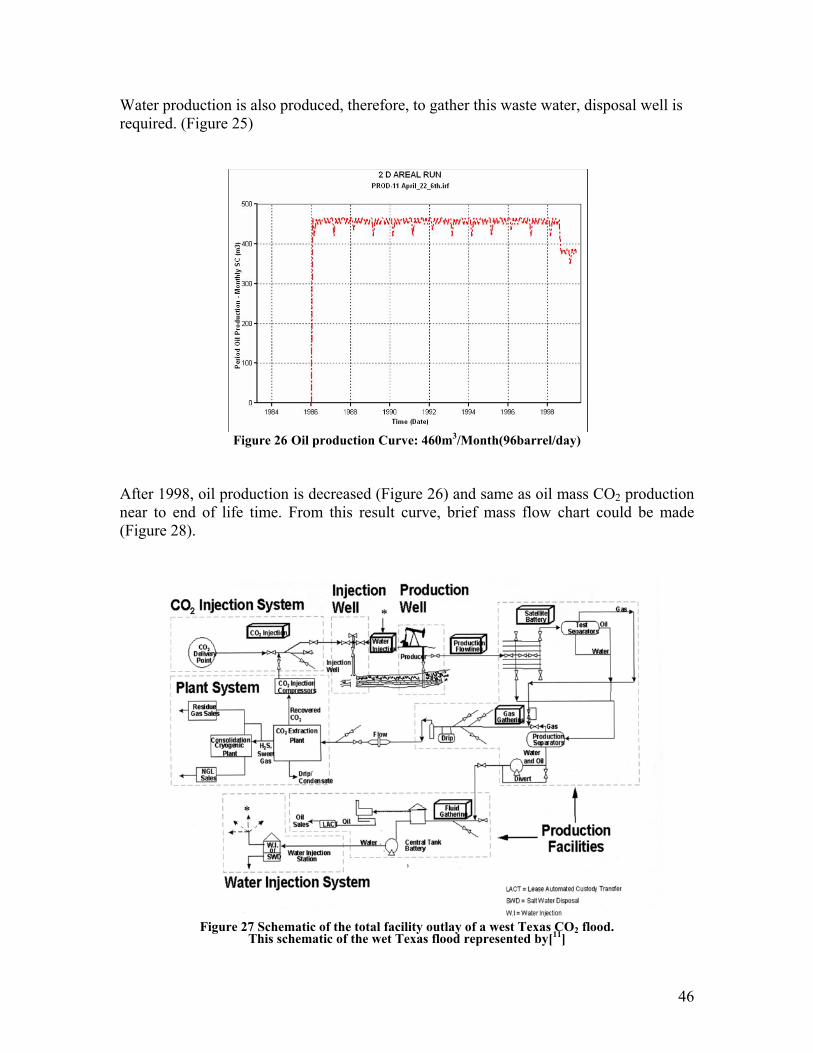
Figure 25 Water production Curve: 20m3/month (4193barrel/day)
46
Water production is also produced, therefore, to gather this waste water, disposal well is required. (Figure 25)
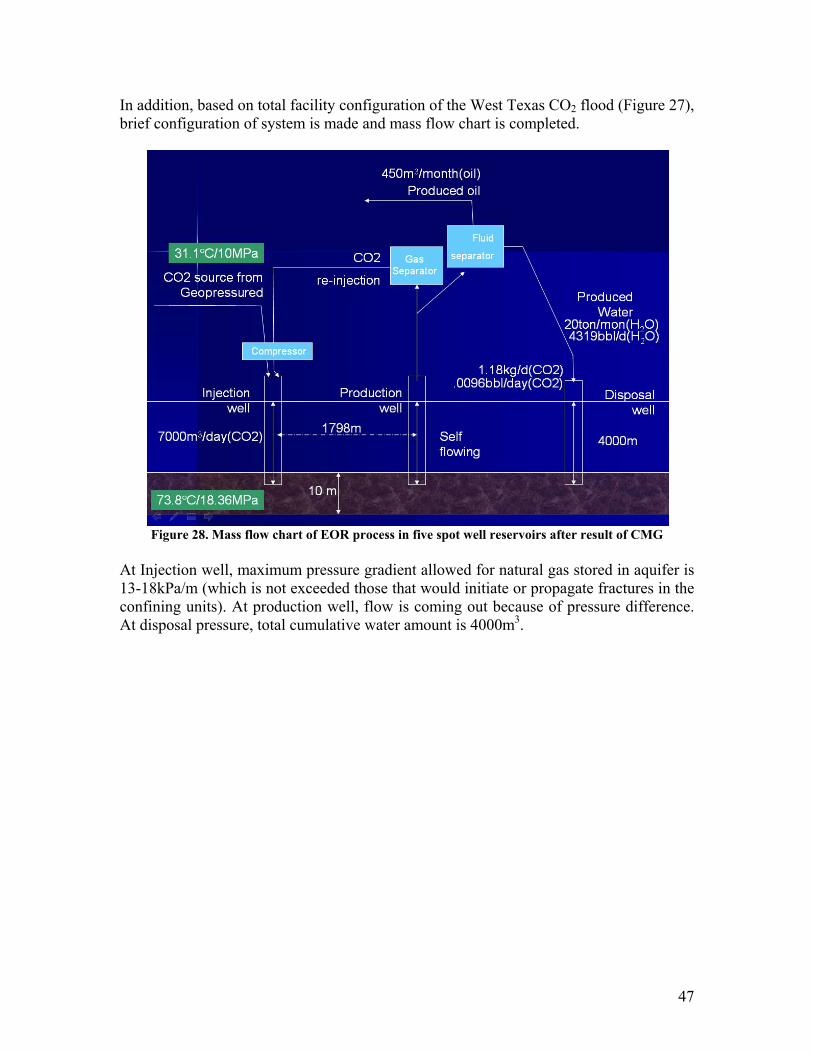
Figure 26 Oil production Curve: 460m3/Month(96barrel/day)
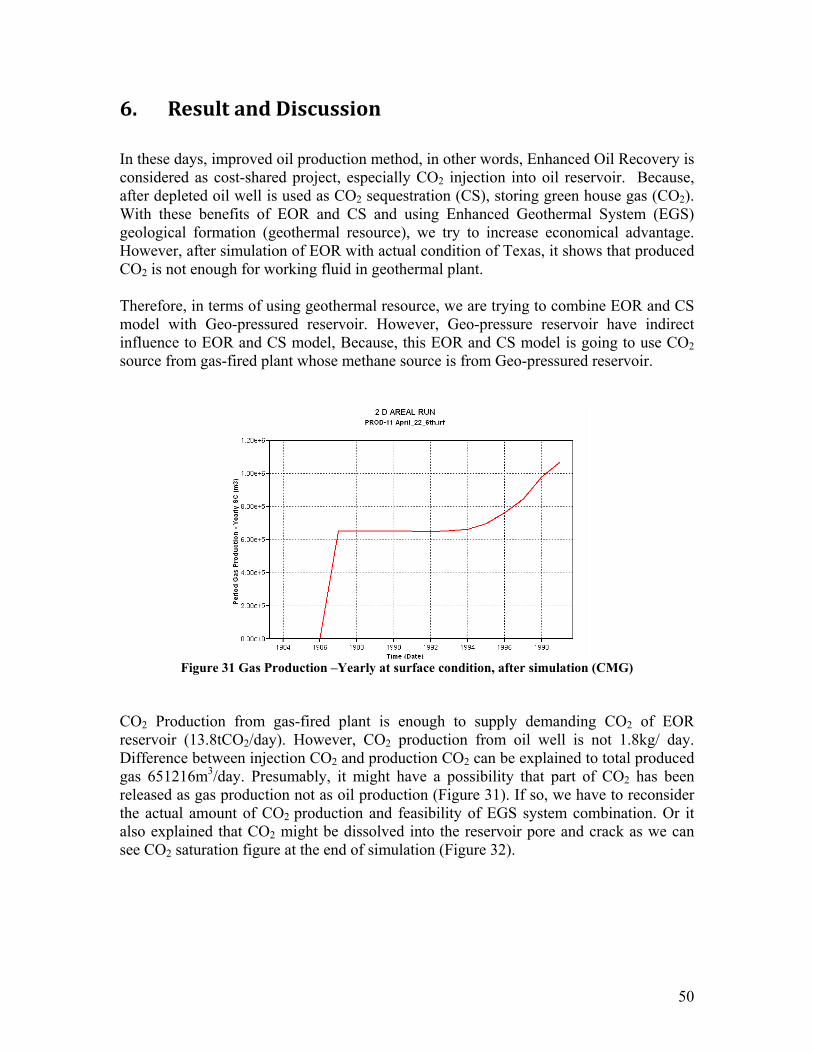
After 1998, oil production is decreased (Figure 26) and same as oil mass CO2 production near to end of life time. From this result curve, brief mass flow chart could be made (Figure 28).
Figure 27 Schematic of the total facility outlay of a west Texas CO2 flood.
This schematic of the wet Texas flood represented by[11]
47
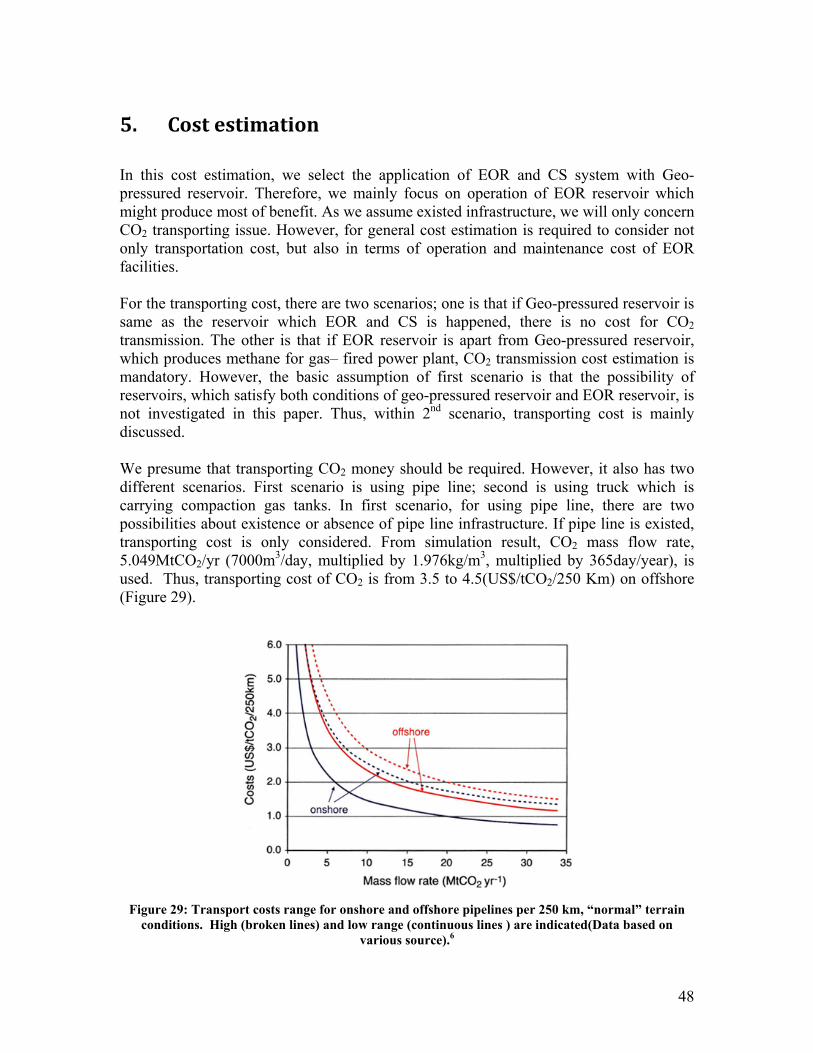
In addition, based on total facility configuration of the West Texas CO2 flood (Figure 27), brief configuration of system is made and mass flow chart is completed.
Figure 28. Mass flow chart of EOR process in five spot well reservoirs after result of CMG
At Injection well, maximum pressure gradient allowed for natural gas stored in aquifer is 13-18kPa/m (which is not exceeded those that would initiate or propagate fractures in the confining units). At production well, flow is coming out because of pressure difference. At disposal pressure, total cumulative water amount is 4000m3.
48
5. Cost estimation
In this cost estimation, we select the application of EOR and CS system with Geo-pressured reservoir. Therefore, we mainly focus on operation of EOR reservoir which might produce most of benefit. As we assume existed infrastructure, we will only concern CO2 transporting issue. However, for general cost estimation is required to consider not only transportation cost, but also in terms of operation and maintenance cost of EOR facilities. For the transporting cost, there are two scenarios; one is that if Geo-pressured reservoir is same as the reservoir which EOR and CS is happened, there is no cost for CO2 transmission. The other is that if EOR reservoir is apart from Geo-pressured reservoir, which produces methane for gas– fired power plant, CO2 transmission cost estimation is mandatory. However, the basic assumption of first scenario is that the possibility of reservoirs, which satisfy both conditions of geo-pressured reservoir and EOR reservoir, is not investigated in this paper. Thus, within 2nd scenario, transporting cost is mainly discussed. We presume that transporting CO2 money should be required. However, it also has two different scenarios. First scenario is using pipe line; second is using truck which is carrying compaction gas tanks. In first scenario, for using pipe line, there are two possibilities about existence or absence of pipe line infrastructure. If pipe line is existed, transporting cost is only considered. From simulation result, CO2 mass flow rate, 5.049MtCO2/yr (7000m3/day, multiplied by 1.976kg/m3, multiplied by 365day/year), is used. Thus, transporting cost of CO2 is from 3.5 to 4.5(US$/tCO2/250 Km) on offshore (Figure 29).
Figure 29: Transport costs range for onshore and offshore pipelines per 250 km, “normal” terrain
conditions. High (broken lines) and low range (continuous lines ) are indicated(Data based on various source).6
49
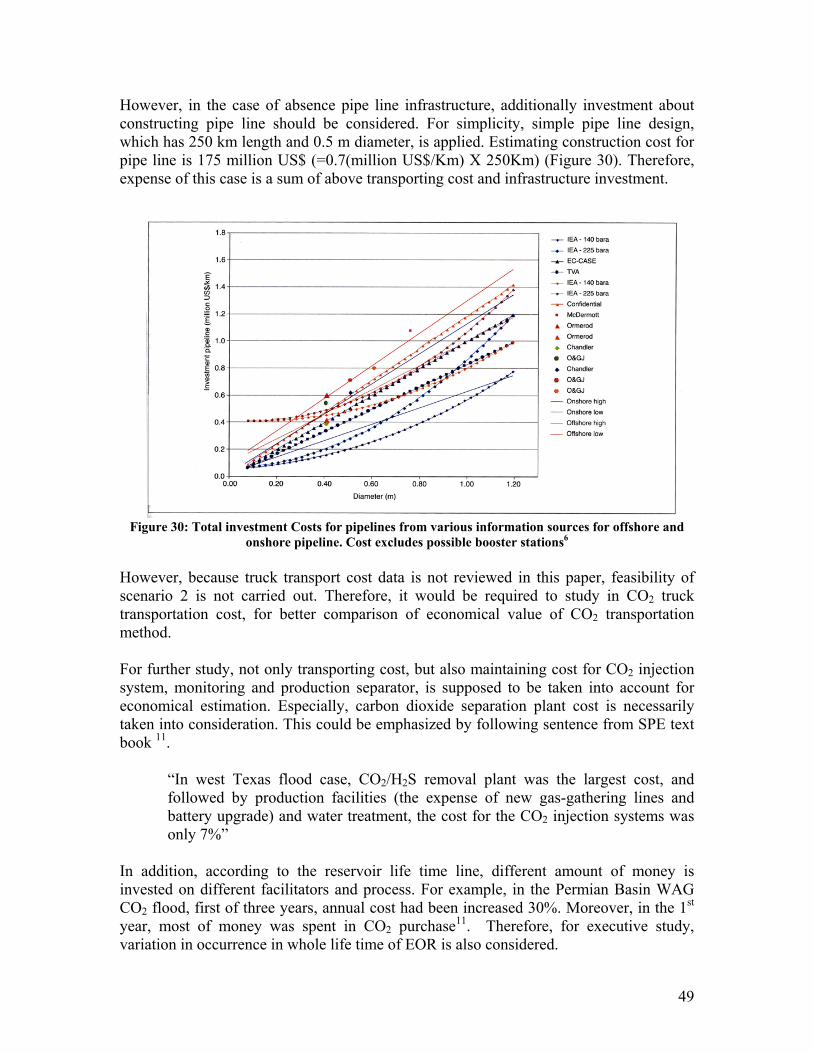
However, in the case of absence pipe line infrastructure, additionally investment about constructing pipe line should be considered. For simplicity, simple pipe line design, which has 250 km length and 0.5 m diameter, is applied. Estimating construction cost for pipe line is 175 million US$ (=0.7(million US$/Km) X 250Km) (Figure 30). Therefore, expense of this case is a sum of above transporting cost and infrastructure investment.
Figure 30: Total investment Costs for pipelines from various information sources for offshore and
onshore pipeline. Cost excludes possible booster stations6 However, because truck transport cost data is not reviewed in this paper, feasibility of scenario 2 is not carried out. Therefore, it would be required to study in CO2 truck transportation cost, for better comparison of economical value of CO2 transportation method. For further study, not only transporting cost, but also maintaining cost for CO2 injection system, monitoring and production separator, is supposed to be taken into account for economical estimation. Especially, carbon dioxide separation plant cost is necessarily taken into consideration. This could be emphasized by following sentence from SPE text book 11.
“In west Texas flood case, CO2/H2S removal plant was the largest cost, and followed by production facilities (the expense of new gas-gathering lines and battery upgrade) and water treatment, the cost for the CO2 injection systems was only 7%”
In addition, according to the reservoir life time line, different amount of money is invested on different facilitators and process. For example, in the Permian Basin WAG CO2 flood, first of three years, annual cost had been increased 30%. Moreover, in the 1st year, most of money was spent in CO2 purchase11. Therefore, for executive study, variation in occurrence in whole life time of EOR is also considered.
50
6. Result and Discussion In these days, improved oil production method, in other words, Enhanced Oil Recovery is considered as cost-shared project, especially CO2 injection into oil reservoir. Because, after depleted oil well is used as CO2 sequestration (CS), storing green house gas (CO2). With these benefits of EOR and CS and using Enhanced Geothermal System (EGS) geological formation (geothermal resource), we try to increase economical advantage. However, after simulation of EOR with actual condition of Texas, it shows that produced CO2 is not enough for working fluid in geothermal plant. Therefore, in terms of using geothermal resource, we are trying to combine EOR and CS model with Geo-pressured reservoir. However, Geo-pressure reservoir have indirect influence to EOR and CS model, Because, this EOR and CS model is going to use CO2 source from gas-fired plant whose methane source is from Geo-pressured reservoir.
Figure 31 Gas Production –Yearly at surface condition, after simulation (CMG)
CO2 Production from gas-fired plant is enough to supply demanding CO2 of EOR reservoir (13.8tCO2/day). However, CO2 production from oil well is not 1.8kg/ day. Difference between injection CO2 and production CO2 can be explained to total produced gas 651216m3/day. Presumably, it might have a possibility that part of CO2 has been released as gas production not as oil production (Figure 31). If so, we have to reconsider the actual amount of CO2 production and feasibility of EGS system combination. Or it also explained that CO2 might be dissolved into the reservoir pore and crack as we can see CO2 saturation figure at the end of simulation (Figure 32).
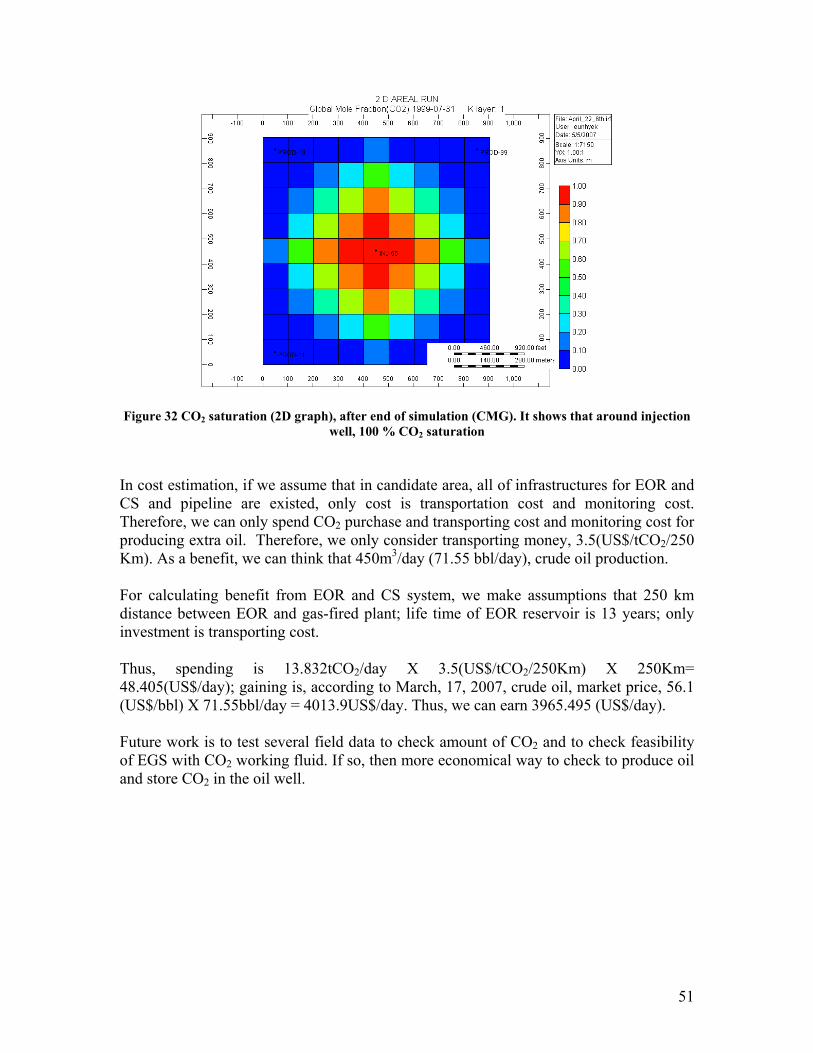
51
Figure 32 CO2 saturation (2D graph), after end of simulation (CMG). It shows that around injection well, 100 % CO2 saturation
In cost estimation, if we assume that in candidate area, all of infrastructures for EOR and CS and pipeline are existed, only cost is transportation cost and monitoring cost. Therefore, we can only spend CO2 purchase and transporting cost and monitoring cost for producing extra oil. Therefore, we only consider transporting money, 3.5(US$/tCO2/250 Km). As a benefit, we can think that 450m3/day (71.55 bbl/day), crude oil production. For calculating benefit from EOR and CS system, we make assumptions that 250 km distance between EOR and gas-fired plant; life time of EOR reservoir is 13 years; only investment is transporting cost. Thus, spending is 13.832tCO2/day X 3.5(US$/tCO2/250Km) X 250Km= 48.405(US$/day); gaining is, according to March, 17, 2007, crude oil, market price, 56.1 (US$/bbl) X 71.55bbl/day = 4013.9US$/day. Thus, we can earn 3965.495 (US$/day). Future work is to test several field data to check amount of CO2 and to check feasibility of EGS with CO2 working fluid. If so, then more economical way to check to produce oil and store CO2 in the oil well.
52
7. References 1. Pruess, K., Enhanced geothermal systems (EGS) using CO2 as working fluid- A novel approach for generating renewable energy with simultaneous sequestration of carbon. Geothermics 2006, 35, 351-367. 2. Don W.Green and G. Paul, W., Enhanced Oil Recovery 1998. 3. Bachu, S., Sequestration of CO2 in geological media: criteria and approach for site selection in response to climate change. Energy Conversion & Management 2000, 41, 953-970. 4. Barbier, E., Geothermal energy technology and current status: an overview. Renewable and Sustainable Energy Reviews 2002, 6, 3-65. 5. Zhaowen Li, M. D., Shuliang Li, Sam Huang CO2 sequestration in depleted oil and gas reservoirs - caprock characterization and storage capacity ENERGY CONVERSION AND MANAGEMENT 2006, 47, 1372-1382. 6. Change, I. P. o. C., Carbon dioxide capture and storage. Cambrige University Press: 2005. 7. Mark H.Holtz, e. K. N., and RObert J.Finley Reduction of Greenhouse Gas Emissions through underground CO2 Sequestration in Texas Oil and Gas Reservoirs; The university of Texas at Austin: August, 1999. 8. Duncan, I., The Gulf Coast Carbon Center: Exploring Synergies between gasification and CO2 Sequestration. In Gasification Technologies Conference, Gasification Technologies Council 2005. 9. William A. Ambrose, C. L. B., Ian Duncan, Mark H. Holtz, Susan D.; Hovorka, V. N. L., and Srivatsan Lakshminarasimhan, Source-Sink Matching and Potential for Carbon Capture and Storage in the Gulf Coast In Ground Water Protection Council 2006 UIC Conference Austin, 2006. 10. Dipippo, R., Geothermal Power Plants: Principle, Applications and Case Studies. 2005. 11. Perry M.JARRELL, C. E. F., MiCHAEL H. Stein and Steven L. Webb, Practical Aspects of CO2 Flooding 2002; Vol. 22.