Embed Size (px)
Citation preview
Bulletin of the Faculty of Humanities, Seikei University No.48 (2013) 233
Efforts for 100% Response Rate:Local Government Survey in the Philippines as a Case
Jun Kobayashi (Seikei University), Kenichi Nishimura (Osaka University),
Masao Kikuchi (Meiji University), Maynard V. Matammu (University of Philippines)
Abstract
We conducted an interview survey on randomly selected 300 local governments in the Philippines.
Fortunately, we collected data from all the respondents with 100% response rates. It seems that we attained
these high responses due to repeating pretesting, choosing an appropriate survey mode (interview), and
creating trust with a local counterpart.
1 Introduction
This paper reports on how to attain high response rate in random sampling surveys. We focus on a local
government survey in the Philippines as a case.
Our research project aims at comparing local governments in the Philippines to those in Thailand
and Indonesia. The population was all the basic local governments (cities and municipalities) with a
random sample of 300 governments. We interviewed mayors and planning/development officers (the top of
administrative officers) at each government.
So far, local governments have never been investigated at the national level in the Philippines (for
Philippine local governance, see McCoy 1994 and Sidel 1999). Therefore, to grasp the whole picture, we were
required to reduce nonresponse.
In general, we can use statistical inferences and tests only when the sample is randomly selected from
the population and enough many respondents cooperate for the survey. Improving survey response is a must
to guarantee data quality (Stoop et al. eds. 2010).
However, declining response rates have widely been observed in local government surveys. In Japan,
Tsujinaka conducted a mail survey on all the 1,827 local governments with a 64.5% response rate (Tsujinaka
and Ito eds. 2010). In Thailand, Nagai conducted a mail survey on all the local governments to collect data
from 32.8% Thesabans (municipalities) and 35.6% Tambons (villages) (Funatsu ed. 2008).
Jun Kobayashi, Kenichi Nishimura, Masao Kikuchi, Maynard V. Matammu Efforts for 100% Response Rate234
2 Methods
We conducted a survey “2011 Local Government Survey in the Philippines” as follows.
Survey Name. 2011 Local Government Survey in the Philippines: Local Capability and Decentralization.
Shortly, 2011 Local Government Survey in the Philippines.
Principal Investigator. Fumio Nagai (Osaka City University). The survey was implemented by Social
Weather Stations (SWS) in the Philippines.
Mode. We interviewed a mayor and a planning/development officer at each local government. We used a
questionnaire for mayors and that for officers. Only nominated persons can answer to the questionnaires. Most
interviews were conducted face-to-face. In very few cases, they were interviewed via telephone and self-
completion, given limited schedules of respondents.
In the survey, 50 SWS members interviewed (11 were local interviewers out of 50). In addition, three
research project members interviewed three mayors. SWS faxed three endorsement letters when making
appointments: one from the National President of the League of Cities of the Philippines, one signed by the
SWS Vice-President, and one signed by an SWS director.
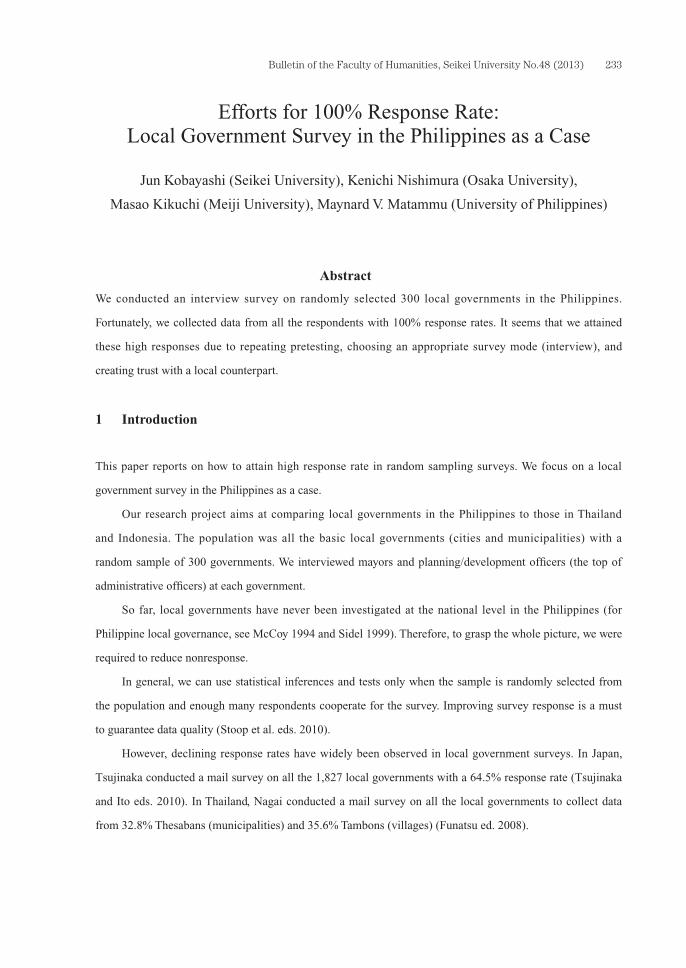
Questionnaires were written both in English and Tagalog. Still, all respondents used English.
Figure 1. Questionnaires (left for mayors, right for officers), Endorsement Letters
Period. Mayors were asked from October 12, 2011 to November 27, 2012. Officers were from October
12, 2011 to April 19, 2012.
Population. 1,515 local governments in 16 regions in 78 provinces as of February 2, 2011. Out of all the
1,591 governments in 17 regions in 79 provinces, we excluded 76 governments in 2 provinces in Autonomous
Region in Muslim Mindanao (ARMM) due to their political instability (Magindanao province belongs to both
ARMM and the other). The population consists of 135 cities and 1,380 municipalities; 771 governments in
Luzon, 336 in Visayas, and 408 in Mindanao.
Sample. A random, probabilistic sample of 300 local governments in 16 regions in 71 provinces. It
consists of 93 cities and 203 municipalities; 170 governments in Luzon, 67 in Visayas, and 63 in Mindanao.
Bulletin of the Faculty of Humanities, Seikei University No.48 (2013) 235
No substitution was allowed.
Sampling. A systematic random sampling was used. All the 1,515 governments were numbered from
the north to the south. Then, 300 governments were selected at even intervals, based on their population
sizes. The interval was 236,500 residents. To simplify sampling, we did not use information of land sizes and
income levels of governments.
Respondents and Response Rates. 300 respondents and 100% response rates for both mayors and
officers.
Before the survey, we conducted field pretesting at 20 governments (LGUs: Local government units).
Comparisons are shows in Table and Figure below.
Table 1. Comparisons of Whole country, Sample, and Pretests
In Whole country (%) In Sample (%) At Pretests (%)
Local governments 1,515 LGUs 300 LGUs 20 LGUs
Population 84,275,983 42,342,634 4,912,963
Mean population 55,628 141,142 245,648
Province 78 71 4
City/Municipality
City 135 LGUs (8.9%) 93 LGUs (31.0%) 6 LGUs (30.0%)
population 33,352,397 (39.6%) 28,923,112 (68.3%) 4,451,084 (90.6%)
Municipality 1,380 LGUs (91.1%) 207 LGUs (69.0%) 14 LGUs (70.0%)
population 50,923,586 (60.4%) 13,419,522 (31.7%) 461,879 (9.4%)
Island groups
Luzon 771 LGUs (50.9%) 170 LGUs (56.7%) 10 LGUs (50.0%)
population 49,747,961 (59.0%) 28,561,958 (67.5%) 4,660,258 (94.9%)
Visayas 408 LGUs (26.9%) 67 LGUs (22.3%) 10 LGUs (50.0%)
population 17,154,355 (20.4%) 6,228,052 (14.7%) 252,705 (5.1%)
Mindanao 336 LGUs (22.2%) 63 LGUs (21.0%) 0 LGUs (0.0%)
population 17,373,667 (20.6%) 7,552,624 (17.8%) 0 (0.0%)
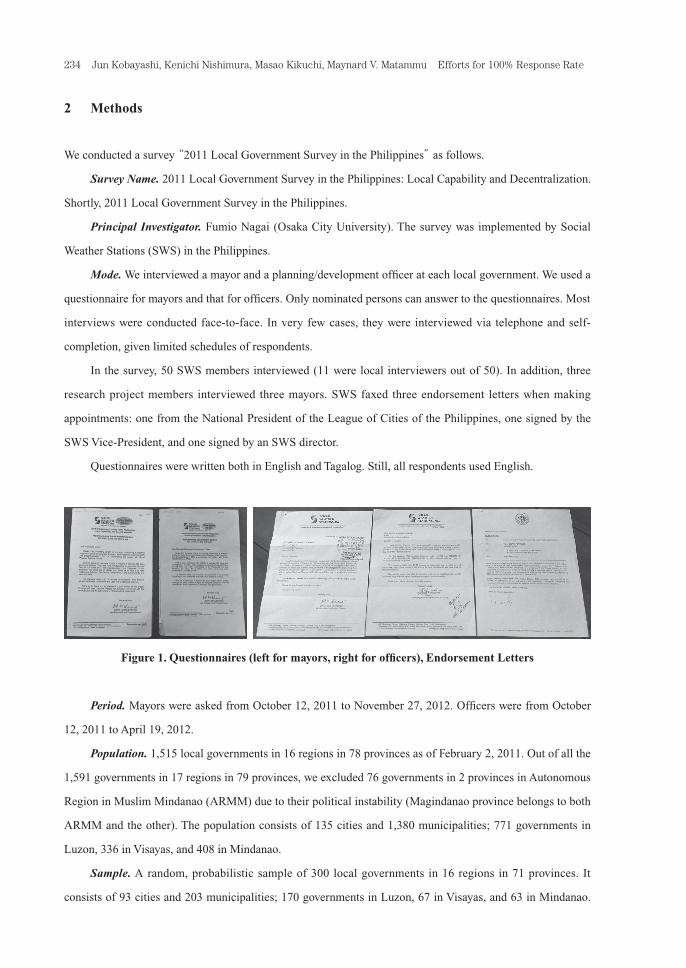
The sample contains one fifth governments of the whole country. Yet it covers more than half the
residents of the nation. Cities are overrepresented in the sample because of their large population sizes. The
sample mostly maintains proportions of governments and residents by island groups.
Jun Kobayashi, Kenichi Nishimura, Masao Kikuchi, Maynard V. Matammu Efforts for 100% Response Rate236
Figure 2. Comparisons of Whole country and Sample
3 Results
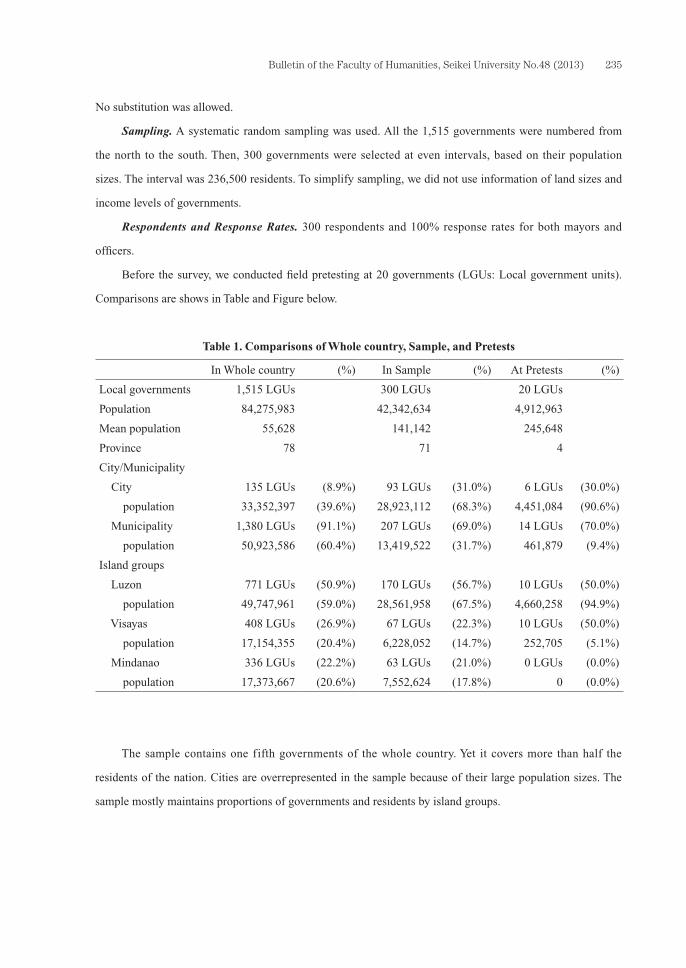
Most data are collected in 200 days (see Figure below). Out of 300 governments, 297 mayors answered by
then, while all the officers were interviewed. In a year, the rest three mayors agreed to be interviewed.
By the graph, both respondents were accelerated to answer around 80 days, and then decelerated around
120 days. This might be because Christmas had ended then. Finally, we collected all the questionnaires.
As a result, we obtained complete information of the sample with 100% response rates. The data provide
us with accurate understanding of how mayors and officers experience, behave, and think. For example, it was
revealed for the first time that more mayors prioritize efficiency rather than residents’ participation (Nishimura
et al. 2012).
Figure 3. Cumulative Response Rates
4 Hints on High Response Rates
Truly we made every effort to collect as many questionnaires as possible. Still, 100% was beyond our
expectation. How did we attain such high responses? The following points may provide some hints.
Diversity in Research Team. We organized our research team with a sociologist (Kobayashi), a
Philippines expert (Nishimura), and experts in public administration (Kikuchi and Matammu). This diversity
enabled us to complement each other.
Bulletin of the Faculty of Humanities, Seikei University No.48 (2013) 237
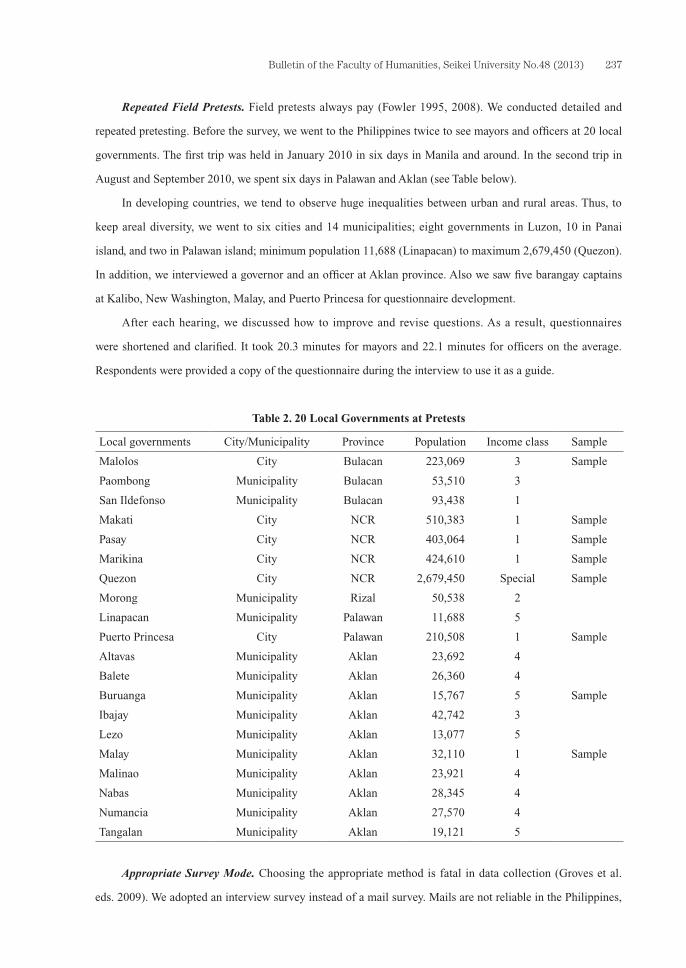
Repeated Field Pretests. Field pretests always pay (Fowler 1995, 2008). We conducted detailed and
repeated pretesting. Before the survey, we went to the Philippines twice to see mayors and officers at 20 local
governments. The first trip was held in January 2010 in six days in Manila and around. In the second trip in
August and September 2010, we spent six days in Palawan and Aklan (see Table below).
In developing countries, we tend to observe huge inequalities between urban and rural areas. Thus, to
keep areal diversity, we went to six cities and 14 municipalities; eight governments in Luzon, 10 in Panai
island, and two in Palawan island; minimum population 11,688 (Linapacan) to maximum 2,679,450 (Quezon).
In addition, we interviewed a governor and an officer at Aklan province. Also we saw five barangay captains
at Kalibo, New Washington, Malay, and Puerto Princesa for questionnaire development.
After each hearing, we discussed how to improve and revise questions. As a result, questionnaires
were shortened and clarified. It took 20.3 minutes for mayors and 22.1 minutes for officers on the average.
Respondents were provided a copy of the questionnaire during the interview to use it as a guide.
Table 2. 20 Local Governments at Pretests
Local governments City/Municipality Province Population Income class Sample
Malolos City Bulacan 223,069 3 Sample
Paombong Municipality Bulacan 53,510 3
San Ildefonso Municipality Bulacan 93,438 1
Makati City NCR 510,383 1 Sample
Pasay City NCR 403,064 1 Sample
Marikina City NCR 424,610 1 Sample
Quezon City NCR 2,679,450 Special Sample
Morong Municipality Rizal 50,538 2
Linapacan Municipality Palawan 11,688 5
Puerto Princesa City Palawan 210,508 1 Sample
Altavas Municipality Aklan 23,692 4
Balete Municipality Aklan 26,360 4
Buruanga Municipality Aklan 15,767 5 Sample
Ibajay Municipality Aklan 42,742 3
Lezo Municipality Aklan 13,077 5
Malay Municipality Aklan 32,110 1 Sample
Malinao Municipality Aklan 23,921 4
Nabas Municipality Aklan 28,345 4
Numancia Municipality Aklan 27,570 4
Tangalan Municipality Aklan 19,121 5
Appropriate Survey Mode. Choosing the appropriate method is fatal in data collection (Groves et al.
eds. 2009). We adopted an interview survey instead of a mail survey. Mails are not reliable in the Philippines,
Jun Kobayashi, Kenichi Nishimura, Masao Kikuchi, Maynard V. Matammu Efforts for 100% Response Rate238
so we had no choice other than an interview survey. This decision resulted in no missing information (no unit
nor item nonresponse).
On the other hand, interview surveys must urge us to adjust schedules with respondents. Interviewers
reported that they had difficulty making appointments with respondents, particularly with mayors. They could
not schedule an interview in one visit. It was even harder to contact secretaries than to interview mayors.
Some appointments had to be rescheduled according to respondents’ convenience. Most meetings were held
at offices, but some had to be done at hotels, restaurants, and respondents’ homes due to their requests. One
interview started even after midnight (1:30 AM).
To avoid inefficiency, we sent three letters by fax in advance. It would have been helpful to obtain
a signed letter from the National President of the League of Municipalities as well. Female interviewers
were supposed to be better (49 were females out of 50 interviewers). We found that the best time to set an
appointment was Mondays since most city or municipal officials are present.
Cooperation with Local Counterpart. We arranged the survey with our Philippine counterpart Social
Weather Stations. We asked them to implement the survey. This was the first random survey on local
governments in the country. Therefore, this survey was a challenge to them as well as to us.
To exchange opinions and information, we visited them five times before the survey (September 2008,
August 2009, January 2010, March and August 2011) and four times during it (January, March, June, and
October 2012).
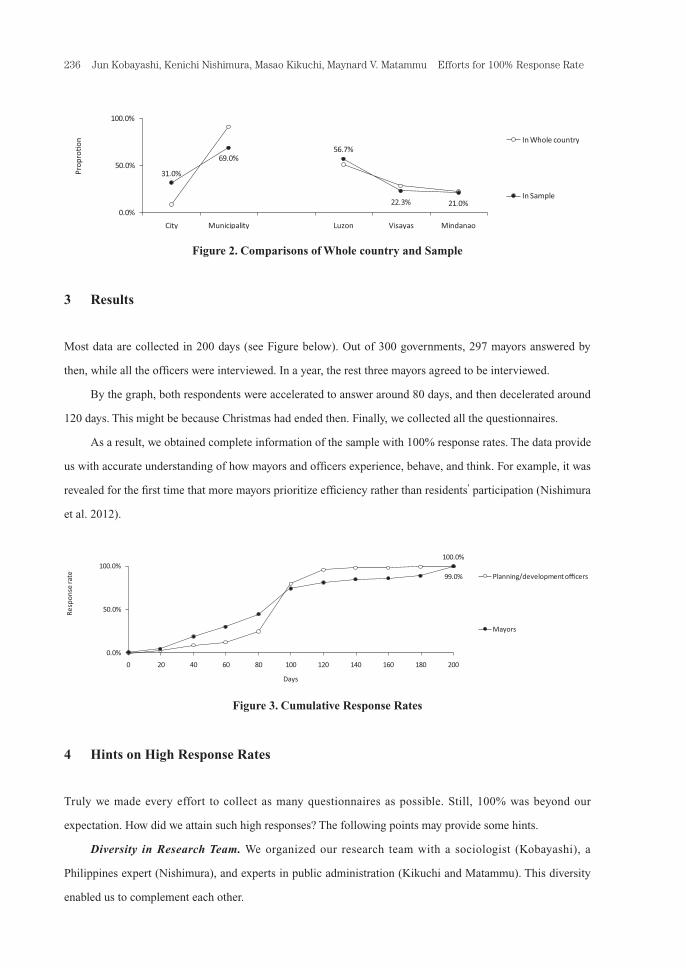
They have many experiences in conducting surveys in the Philippines, especially political surveys.
They also employ many trained interviewers. As a result, respondents often agreed to be interviewed once
they know that interviewers represented the company, due to their good reputation. When interviewers visited
offices, they always wore their company’s shirts with IDs, calling cards, and company’s brochures.
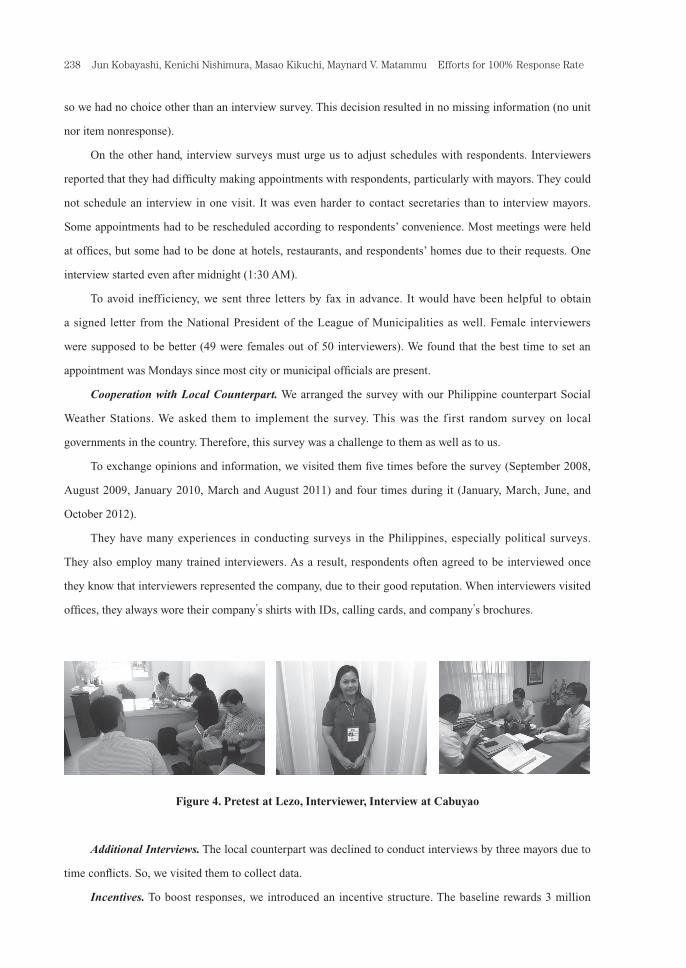
Figure 4. Pretest at Lezo, Interviewer, Interview at Cabuyao
Additional Interviews. The local counterpart was declined to conduct interviews by three mayors due to
time conflicts. So, we visited them to collect data.
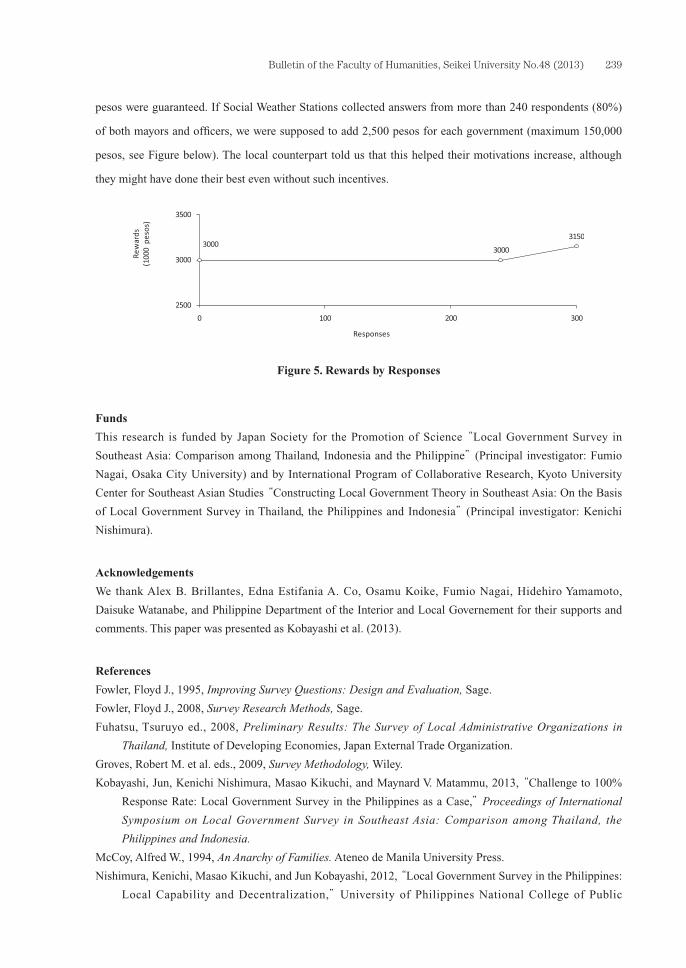
Incentives. To boost responses, we introduced an incentive structure. The baseline rewards 3 million
Bulletin of the Faculty of Humanities, Seikei University No.48 (2013) 239
pesos were guaranteed. If Social Weather Stations collected answers from more than 240 respondents (80%)
of both mayors and officers, we were supposed to add 2,500 pesos for each government (maximum 150,000
pesos, see Figure below). The local counterpart told us that this helped their motivations increase, although
they might have done their best even without such incentives.
Figure 5. Rewards by Responses
Funds
This research is funded by Japan Society for the Promotion of Science “Local Government Survey in
Southeast Asia: Comparison among Thailand, Indonesia and the Philippine” (Principal investigator: Fumio
Nagai, Osaka City University) and by International Program of Collaborative Research, Kyoto University
Center for Southeast Asian Studies “Constructing Local Government Theory in Southeast Asia: On the Basis
of Local Government Survey in Thailand, the Philippines and Indonesia” (Principal investigator: Kenichi
Nishimura).
Acknowledgements
We thank Alex B. Brillantes, Edna Estifania A. Co, Osamu Koike, Fumio Nagai, Hidehiro Yamamoto,
Daisuke Watanabe, and Philippine Department of the Interior and Local Governement for their supports and
comments. This paper was presented as Kobayashi et al. (2013).
References
Fowler, Floyd J., 1995, Improving Survey Questions: Design and Evaluation, Sage.
Fowler, Floyd J., 2008, Survey Research Methods, Sage.
Fuhatsu, Tsuruyo ed., 2008, Preliminary Results: The Survey of Local Administrative Organizations in
Thailand, Institute of Developing Economies, Japan External Trade Organization.
Groves, Robert M. et al. eds., 2009, Survey Methodology, Wiley.
Kobayashi, Jun, Kenichi Nishimura, Masao Kikuchi, and Maynard V. Matammu, 2013, “Challenge to 100%
Response Rate: Local Government Survey in the Philippines as a Case,” Proceedings of International
Symposium on Local Government Survey in Southeast Asia: Comparison among Thailand, the
Philippines and Indonesia.
McCoy, Alfred W., 1994, An Anarchy of Families. Ateneo de Manila University Press.
Nishimura, Kenichi, Masao Kikuchi, and Jun Kobayashi, 2012, “Local Government Survey in the Philippines:
Local Capability and Decentralization,” University of Philippines National College of Public

Jun Kobayashi, Kenichi Nishimura, Masao Kikuchi, Maynard V. Matammu Efforts for 100% Response Rate240
Administration and Governance at 60 International Conference, Manila.
Sidel, John T., 1999, Capital, Coercion, and Crime, Stanford University Press.
Stoop, Ineke et al. eds., 2010, Improving Survey Response: Lessons Learned from the European Social Survey,
Wiley.
Tsujinaka, Yutaka and Shuichiro Ito eds., 2010, Local Governance: Local Government and Civil Society
(Chihou Seifu to Shimin Shakai), Bokutakusha (In Japanese).


![UCHIMURA Meii Asian Studies ol 1(01) 40 Meiji Asian Studiesasian_studies/vol1/pdf/no3-uchimura.pdf · (4) Wada Shigejirō ... [About Tsūzoku minken hyakkaden], in Nihon bungaku dentō](https://img.pdfslide.us/doc/110x75/5f544b5a5c26cf7f9068dd17/uchimura-meii-asian-studies-ol-101-40-meiji-asian-asianstudiesvol1pdfno3-uchimurapdf.jpg)


![Eco labeling and the efforts to make it fair for business[10928]](https://img.pdfslide.us/doc/110x75/58cf09d51a28ab5f2b8b5631/eco-labeling-and-the-efforts-to-make-it-fair-for-business10928.jpg)
