Embed Size (px)
Citation preview
Efficient Modeling of Vehicle NVH fromLow- to Mid- to High-Frequency Ranges
Christophe Pierre, Professor
Nick Vlahopoulos, Associate Professor
Noel Perkins, Professor
Zheng-Dong Ma, Associate Research Scientist
Matt Castanier, Assistant Research Scientist
Xi Zhao, Graduate Student Research Assistant*
Yung-Chang Tan, Graduate Student Research Assistant
The University of Michigan
*Xi Zhao is now a freshly-minted Ph.D. working at Ford Motor Company
Overview
■ Current ARC research in structures and dynamics
■ Noise and vibration sources◆ Ground vehicles◆ Tracked vehicles
■ Low- to mid-frequency vibration and power flow
■ Radiated noise and acoustic signature
■ High-frequency vibration
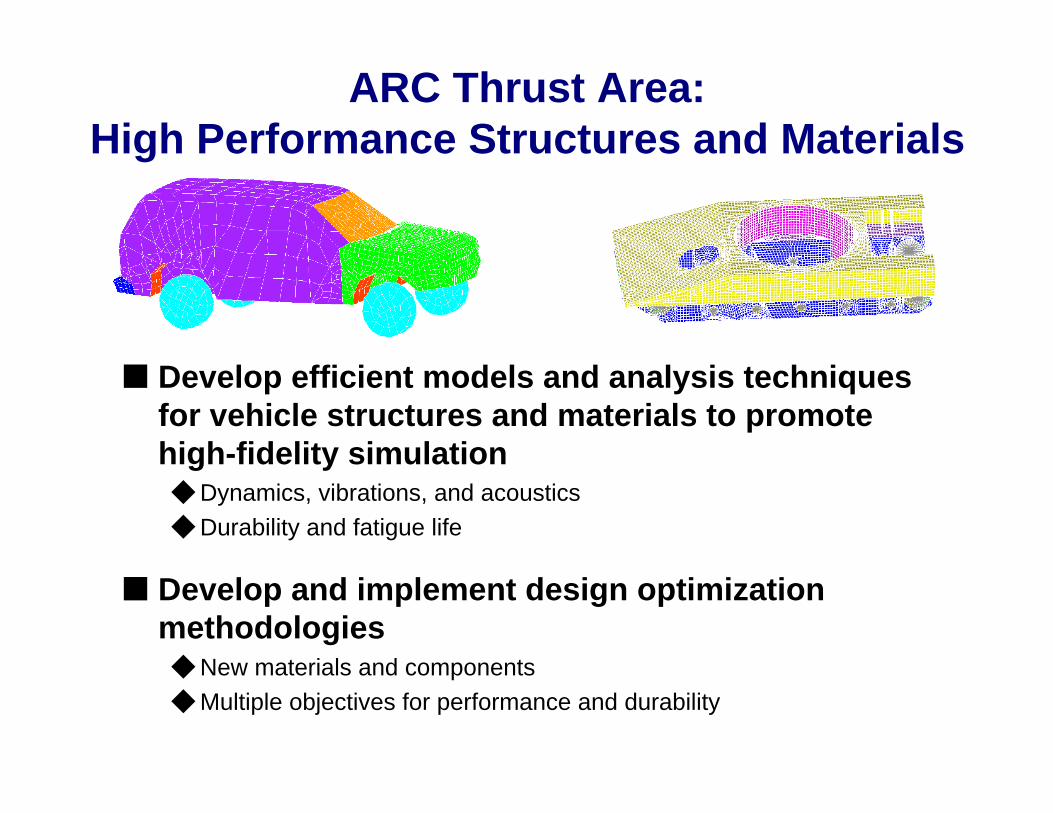
ARC Thrust Area:High Performance Structures and Materials
■ Develop efficient models and analysis techniquesfor vehicle structures and materials to promotehigh-fidelity simulation◆ Dynamics, vibrations, and acoustics◆ Durability and fatigue life
■ Develop and implement design optimizationmethodologies◆ New materials and components◆ Multiple objectives for performance and durability
Key Research Issues
■ Efficient modeling techniques for vehicle dynamics,vibration, radiated noise, and acoustic signature
■ Predictions of NVH across a wide frequency range
■ New simulation and modeling tools to enable durabilityanalyses and design
■ Integration of models in a distributed, flexible designenvironment
➩ New, modular framework for global analysis
■ Analysis capabilities for emerging class of light-weightvehicle body structures (e.g., hybrid vehicles)◆ Likely to suffer from vibration problems◆ More likely to have “mid-frequency” vibration
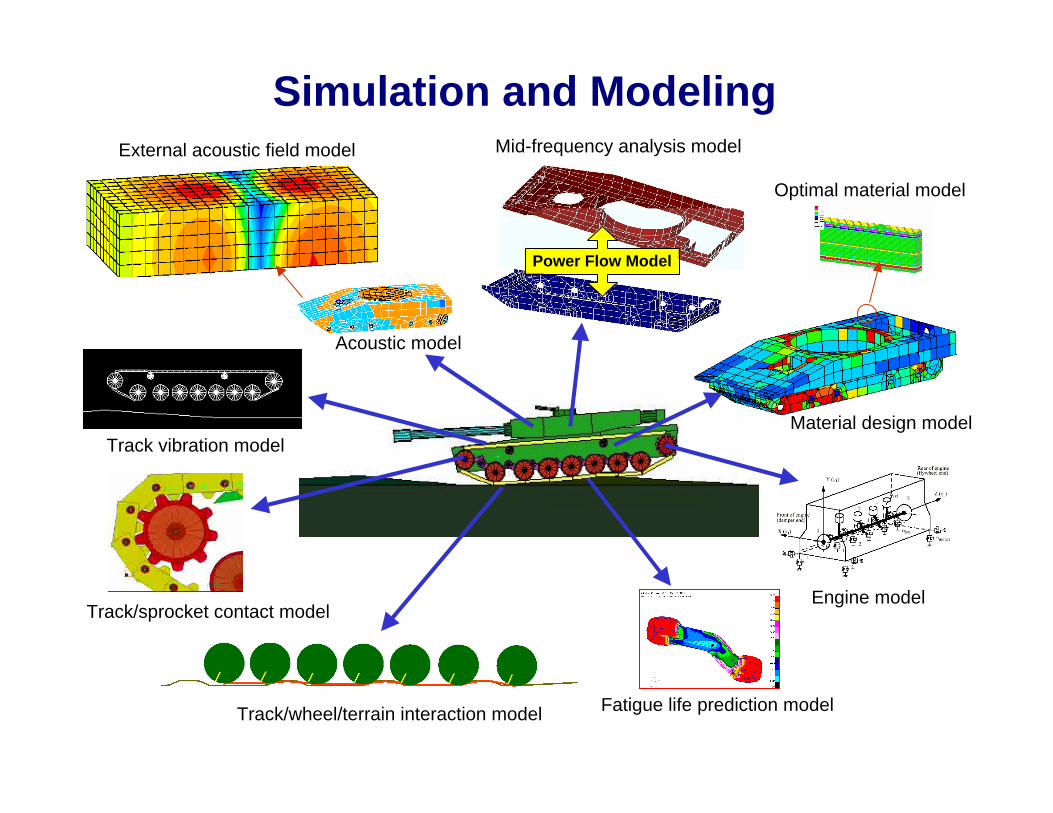
Power Flow Model
Track/wheel/terrain interaction model
Track/sprocket contact model
External acoustic field model
Track vibration model
Optimal material model
Engine model
Fatigue life prediction model
Acoustic model
Material design model
Mid-frequency analysis model
Simulation and Modeling
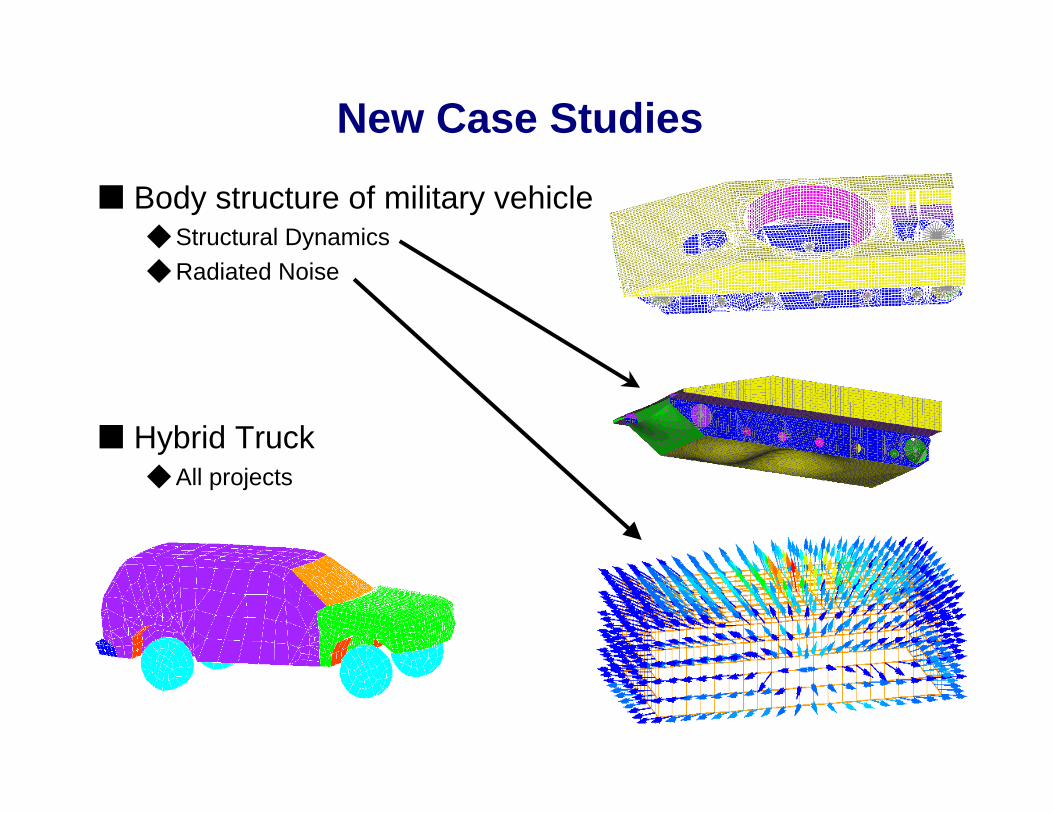
New Case Studies
■ Body structure of military vehicle◆ Structural Dynamics◆ Radiated Noise
■ Hybrid Truck◆ All projects

Application and Integration of Models
Sources ofVibrationand Noise
High-Frequency:Energy FEA
Low- Frequency toMid-Frequency:
FEA and Reduced
OrderModeling
Radiated NoisePrediction
Thrusts 1 and 3 Vehicle Dynamics Simulation
Thrust 4PowertrainSimulation
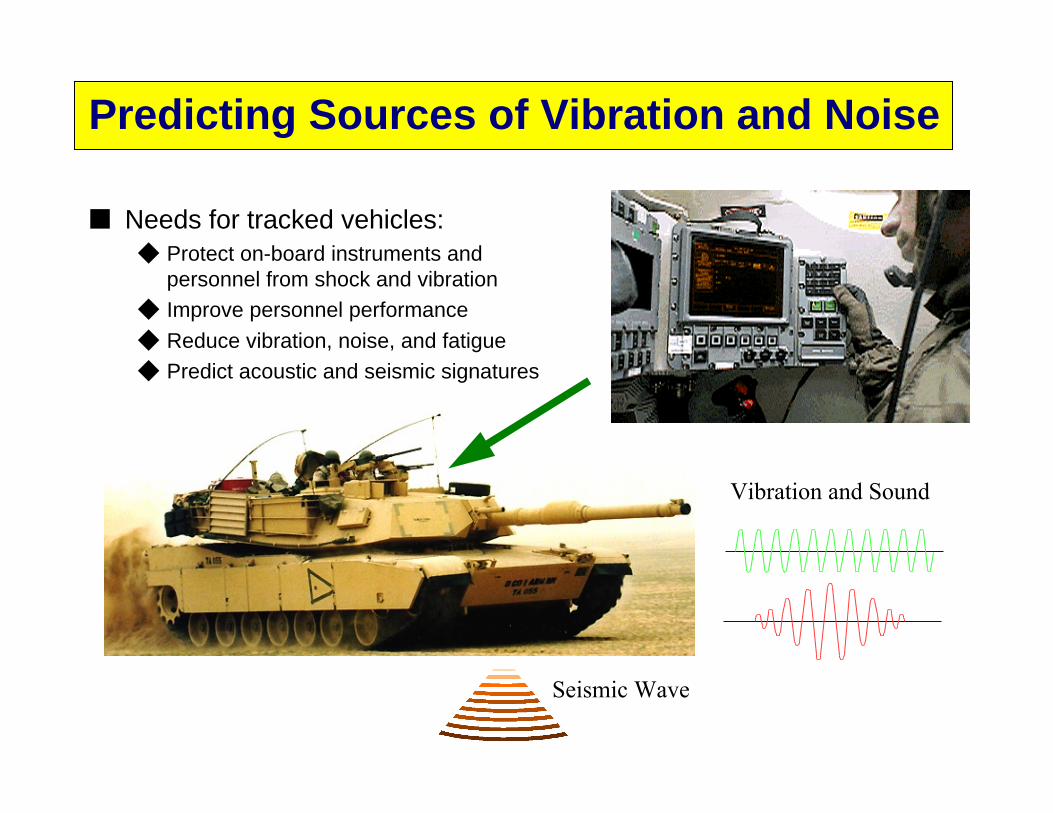
Predicting Sources of Vibration and Noise
■ Needs for tracked vehicles:◆ Protect on-board instruments and
personnel from shock and vibration◆ Improve personnel performance
◆ Reduce vibration, noise, and fatigue◆ Predict acoustic and seismic signatures
Seismic Wave
Vibration and Sound
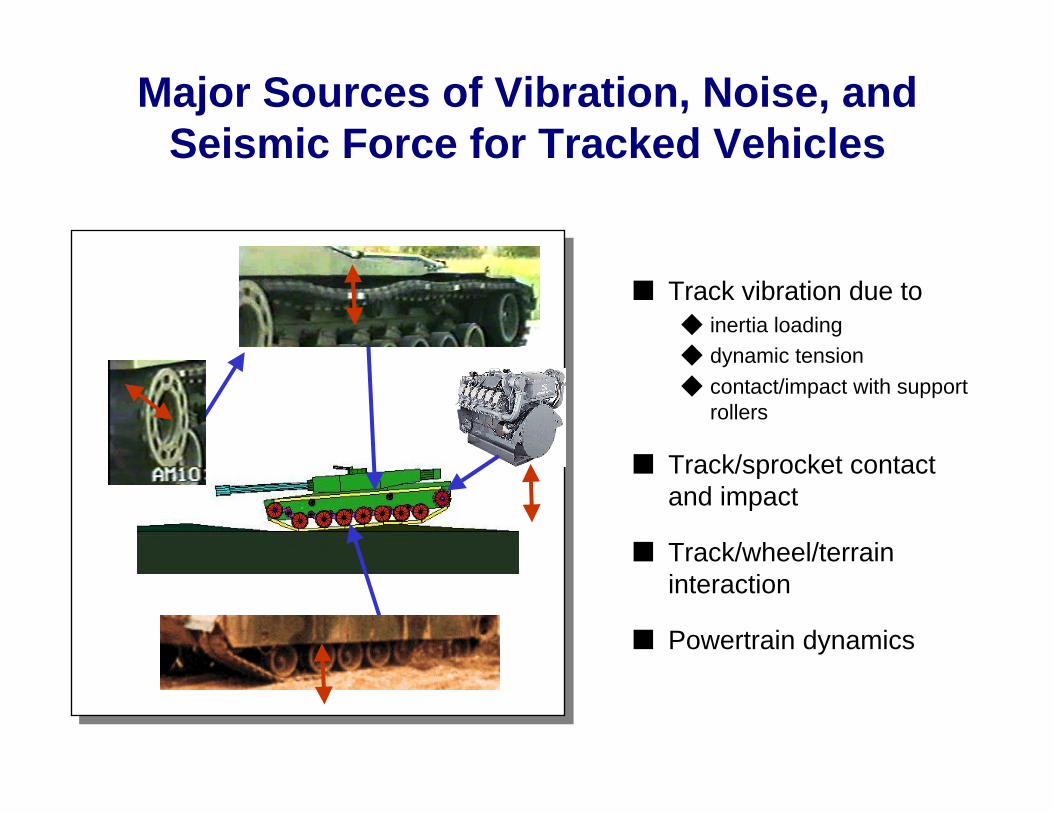
Major Sources of Vibration, Noise, andSeismic Force for Tracked Vehicles
■ Track vibration due to◆ inertia loading◆ dynamic tension
◆ contact/impact with supportrollers
■ Track/sprocket contactand impact
■ Track/wheel/terraininteraction
■ Powertrain dynamics
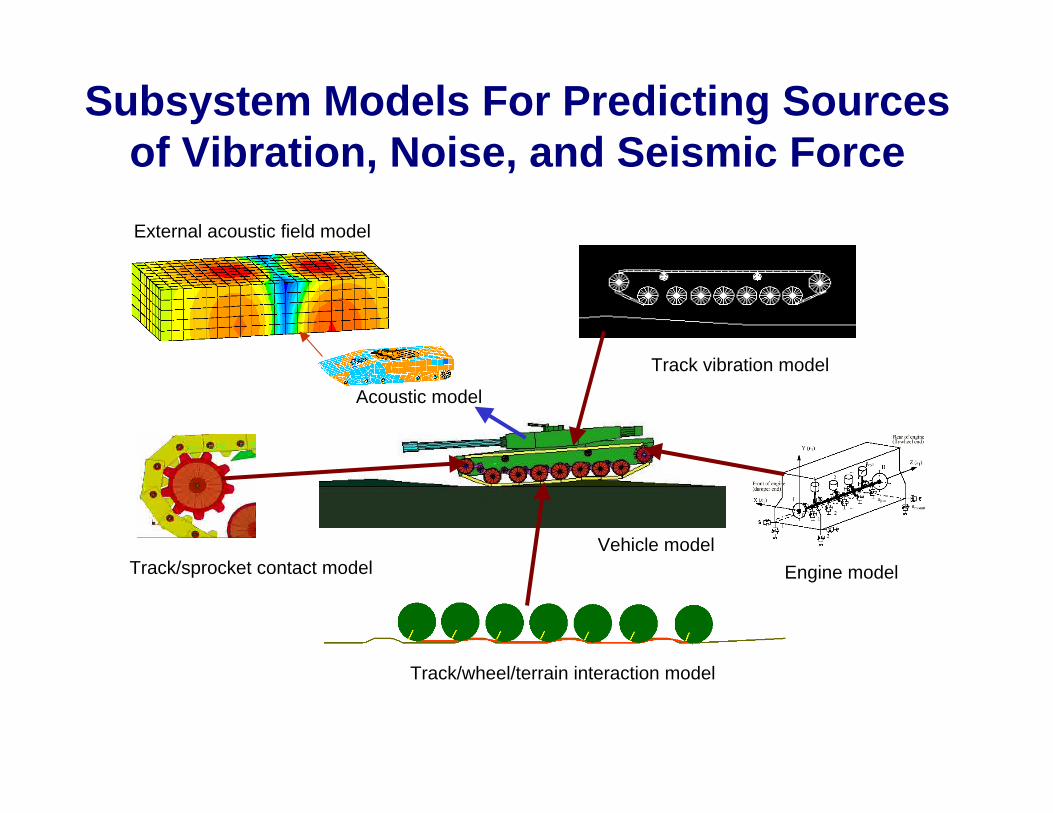
Subsystem Models For Predicting Sourcesof Vibration, Noise, and Seismic Force
Track/wheel/terrain interaction model
Track/sprocket contact model
External acoustic field model
Track vibration model
Acoustic model
Vehicle model
Engine model
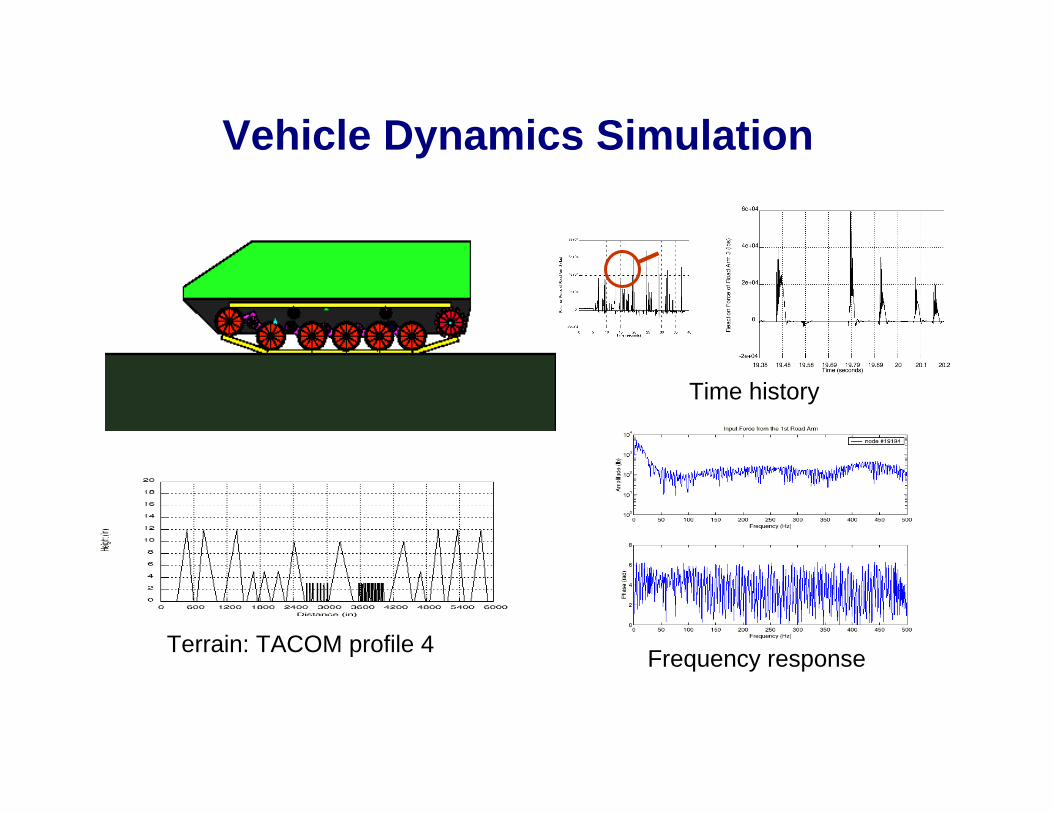
Terrain: TACOM profile 4
Time history
Frequency response
Vehicle Dynamics Simulation
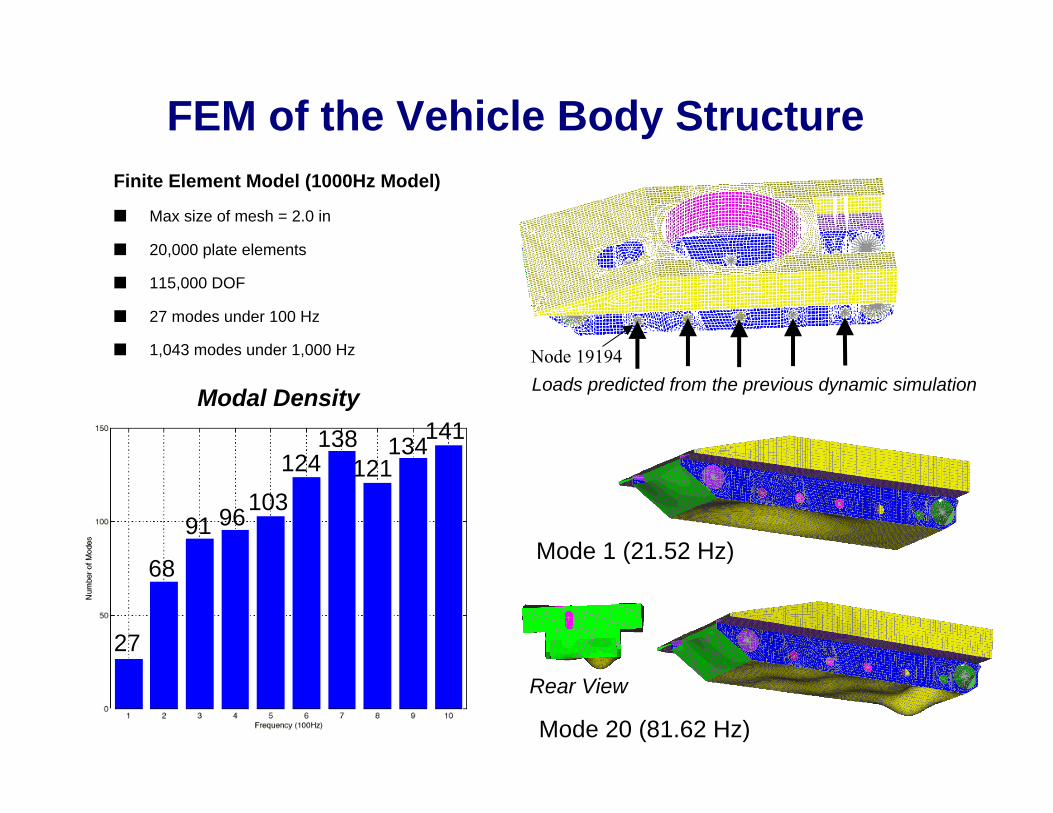
FEM of the Vehicle Body StructureFinite Element Model (1000Hz Model)
■ Max size of mesh = 2.0 in
■ 20,000 plate elements
■ 115,000 DOF
■ 27 modes under 100 Hz
■ 1,043 modes under 1,000 Hz
Mode 1 (21.52 Hz)
Mode 20 (81.62 Hz)
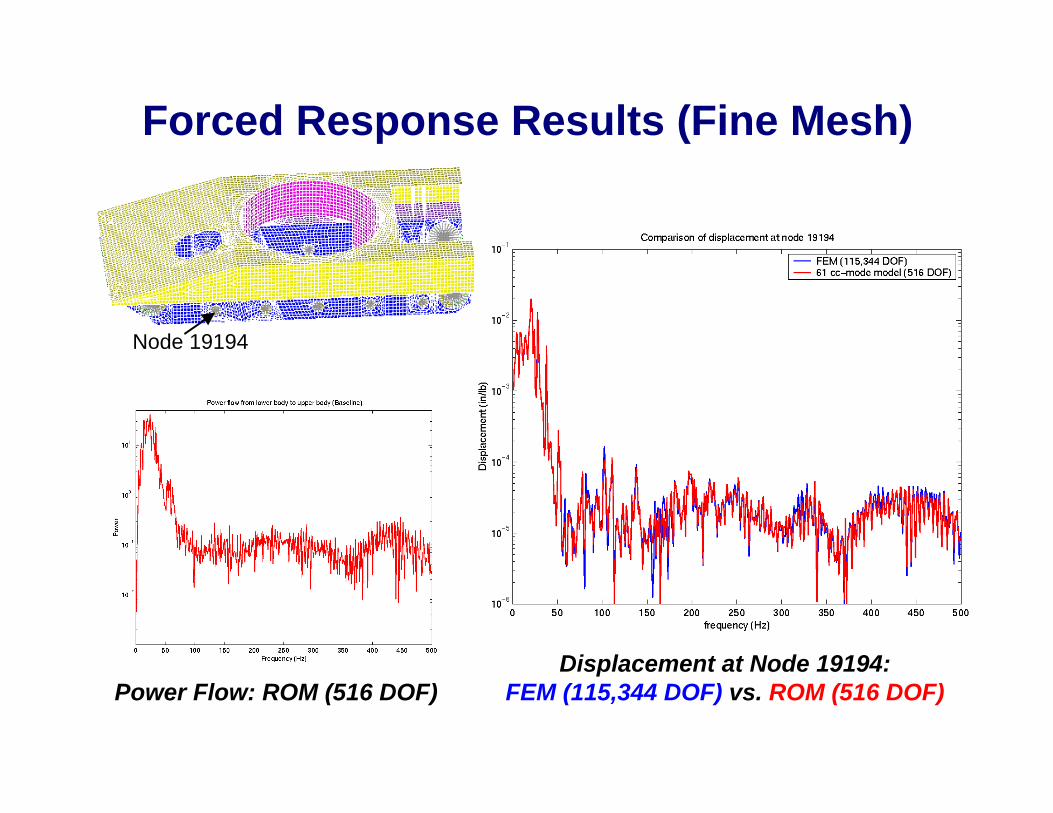
Node 19194
Loads predicted from the previous dynamic simulation
27
68
91 96103
124138
121134
141Modal Density
Rear View
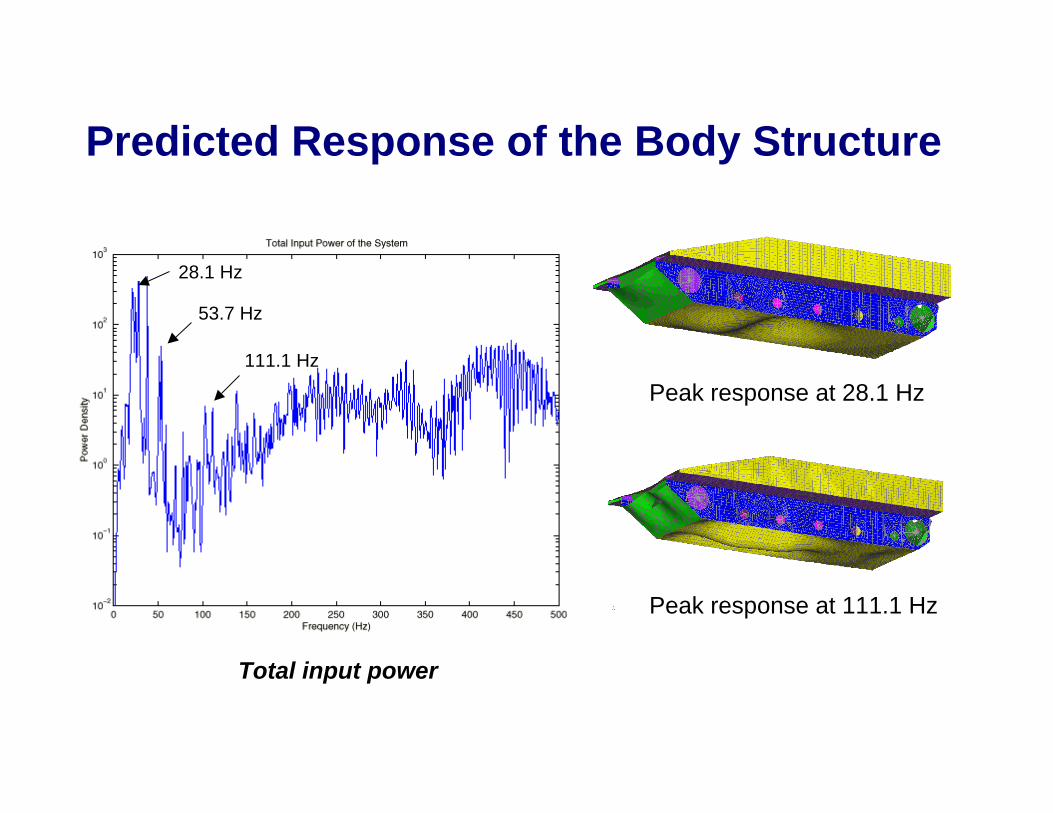
Predicted Response of the Body Structure
53.7 Hz
28.1 Hz
111.1 Hz
Peak response at 28.1 Hz
Peak response at 111.1 Hz
Total input power
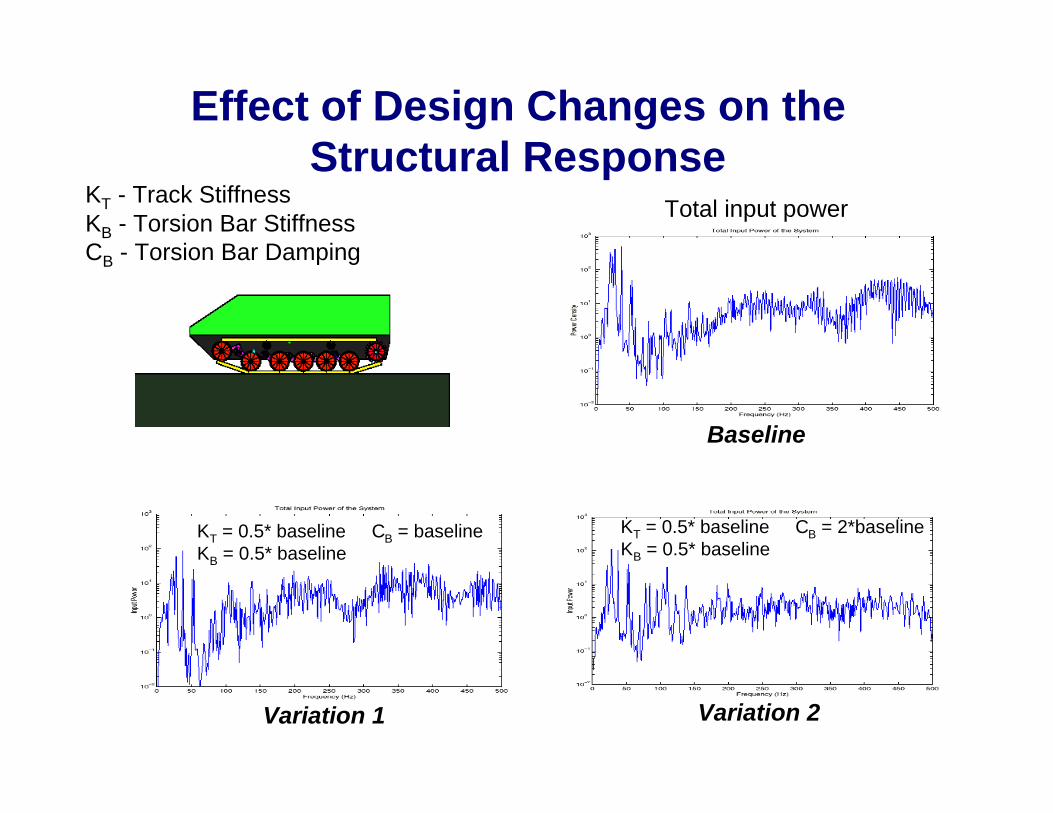
Effect of Design Changes on theStructural Response
KT - Track StiffnessKB - Torsion Bar StiffnessCB - Torsion Bar Damping
Variation 1
KT = 0.5* baseline CB = baselineKB = 0.5* baseline
Variation 2
KT = 0.5* baseline CB = 2*baselineKB = 0.5* baseline
Baseline
Total input power
Summary: Modeling NVH Sources
■ Modeling and simulation tools have been developed forpredicting various sources of vibration and noise
■ Flexible simulation environment has been established◆ Subsystem models may be chosen for desired fidelity and efficiency◆ Capabilities may be used for designing new concept vehicles
■ Simulation results provide input for structural dynamicsand durability analyses
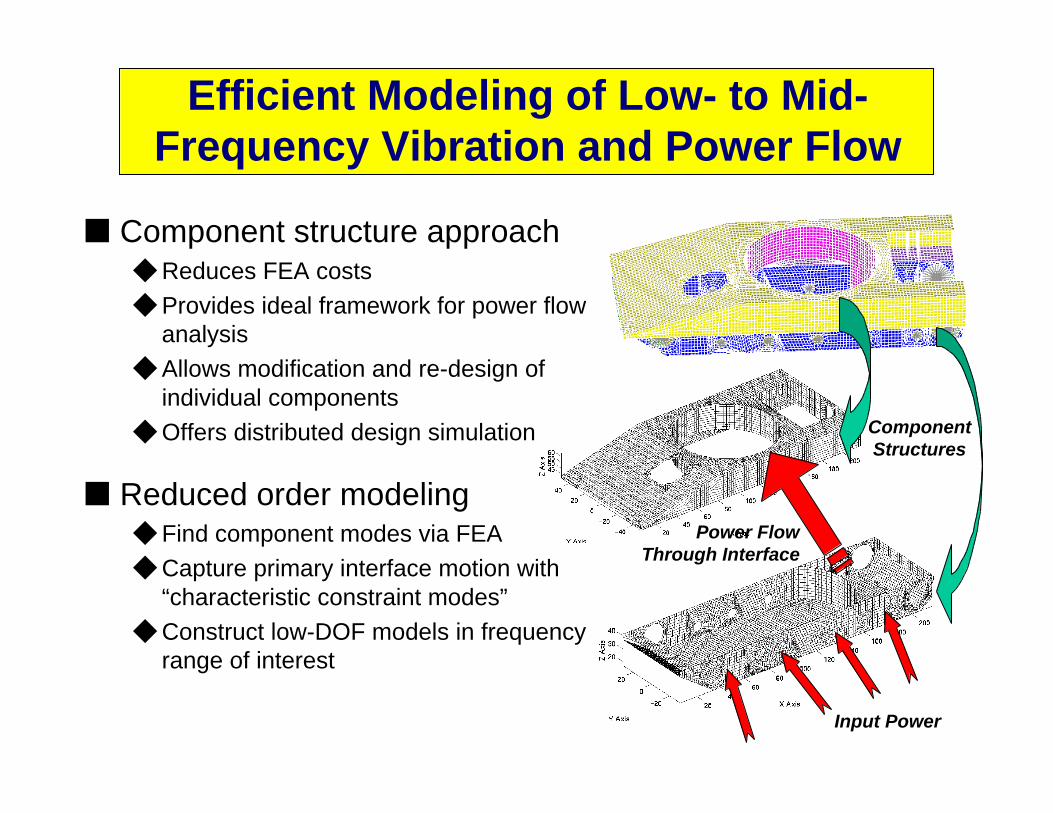
Efficient Modeling of Low- to Mid-Frequency Vibration and Power Flow
■ Component structure approach◆ Reduces FEA costs◆ Provides ideal framework for power flow
analysis◆ Allows modification and re-design of
individual components◆ Offers distributed design simulation
■ Reduced order modeling◆ Find component modes via FEA◆ Capture primary interface motion with
“characteristic constraint modes”◆ Construct low-DOF models in frequency
range of interest
ComponentStructures
Power FlowThrough Interface
Input Power
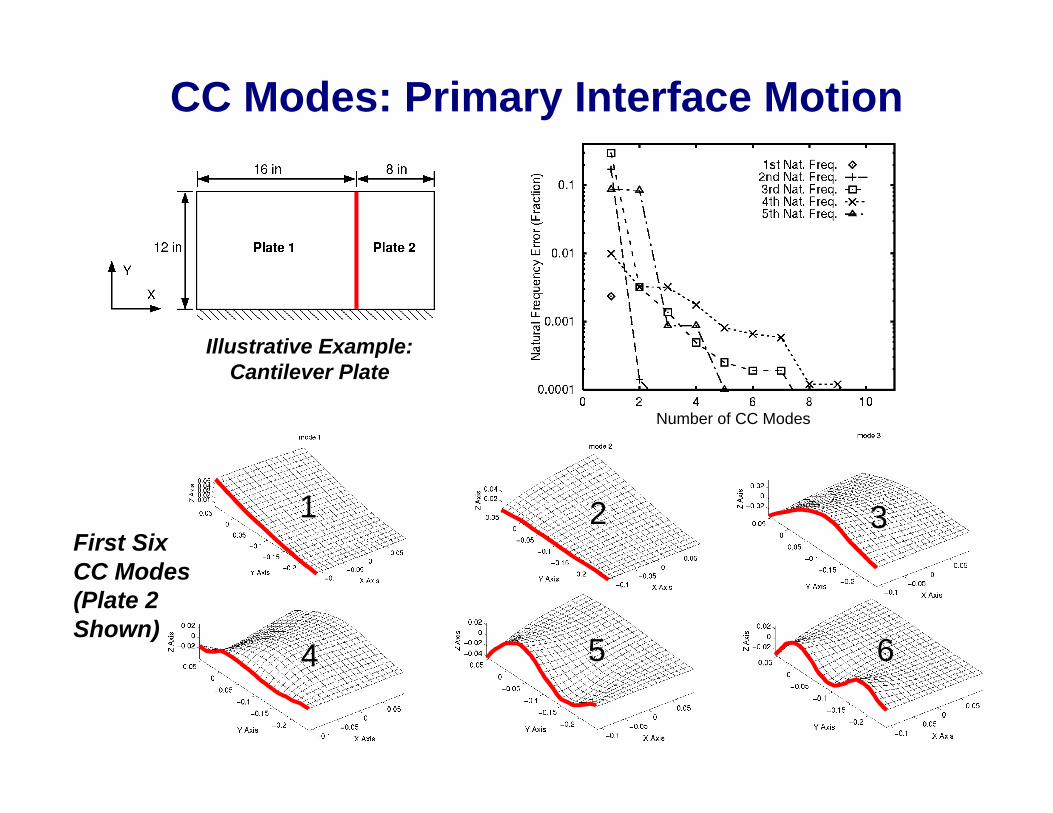
CC Modes: Primary Interface Motion
Number of CC Modes
4 5
1 2
6
3First SixCC Modes(Plate 2Shown)
Illustrative Example:Cantilever Plate
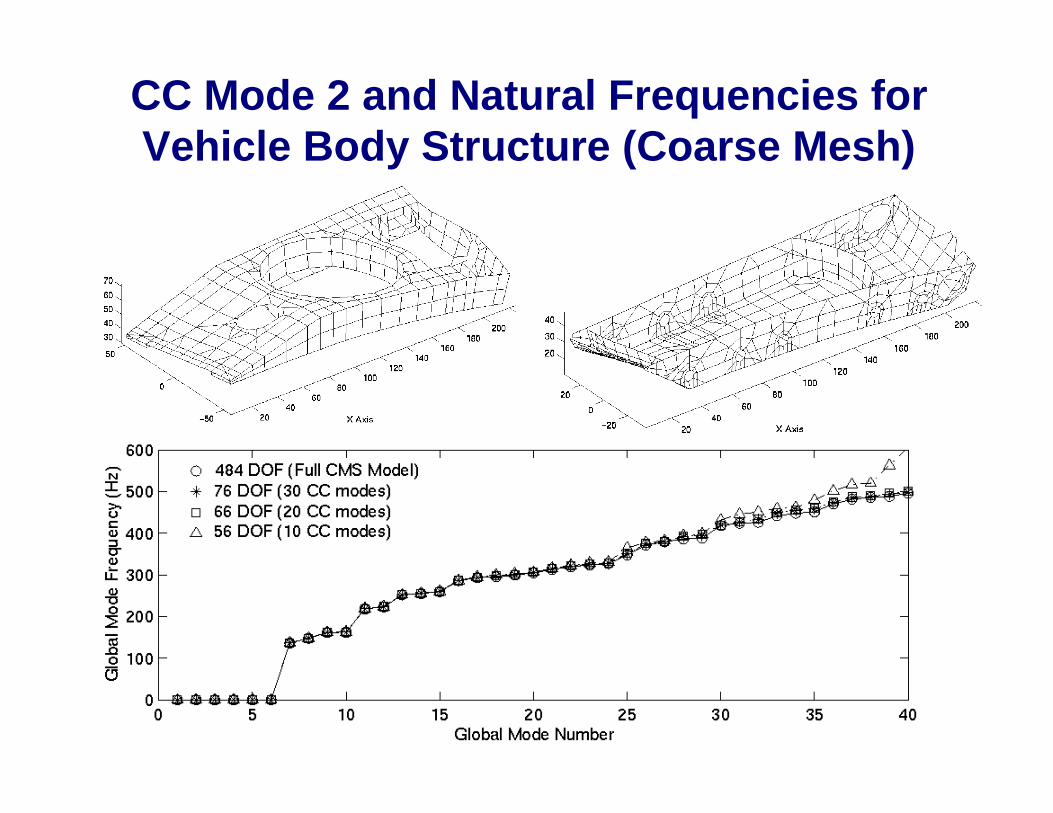
CC Mode 2 and Natural Frequencies forVehicle Body Structure (Coarse Mesh)
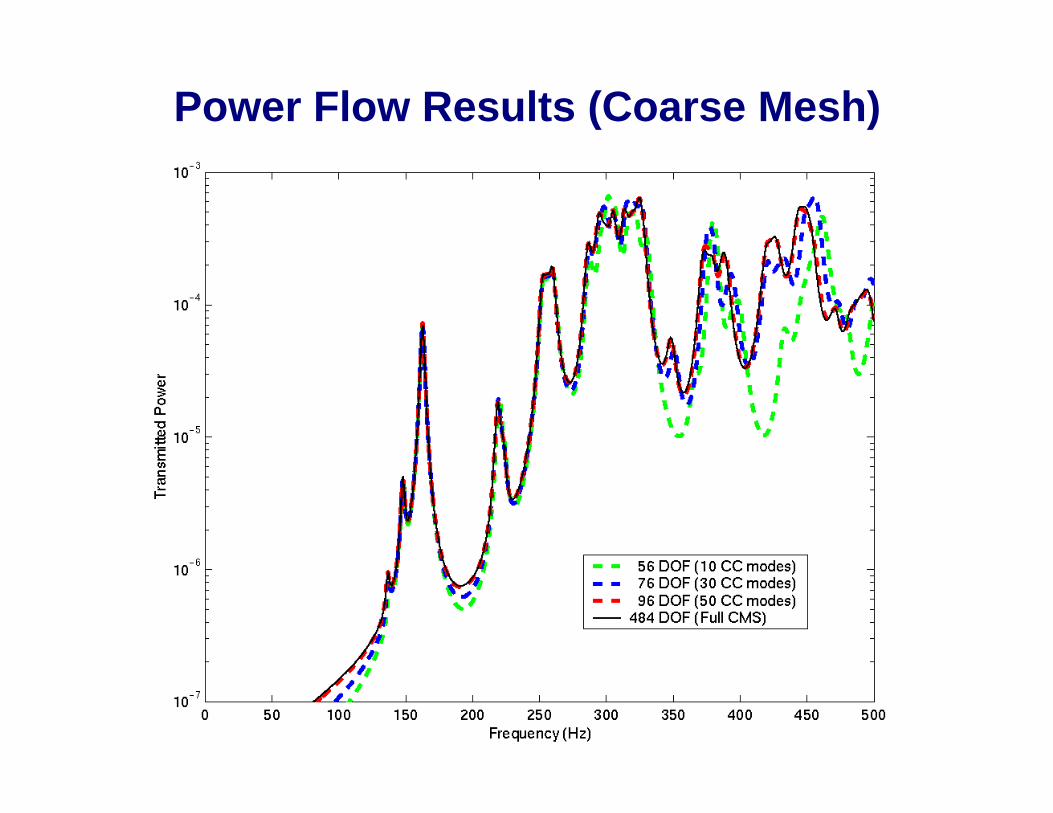
Power Flow Results (Coarse Mesh)
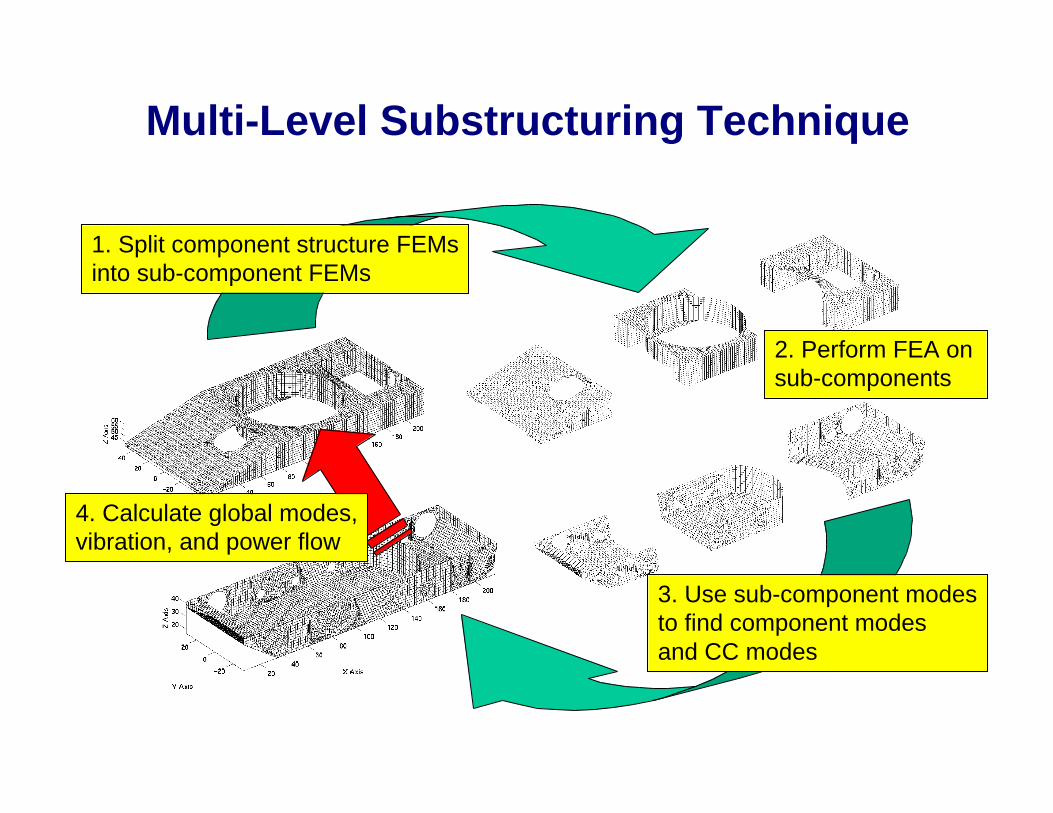
Multi-Level Substructuring Technique
1. Split component structure FEMsinto sub-component FEMs
2. Perform FEA onsub-components
3. Use sub-component modesto find component modes and CC modes
4. Calculate global modes,vibration, and power flow
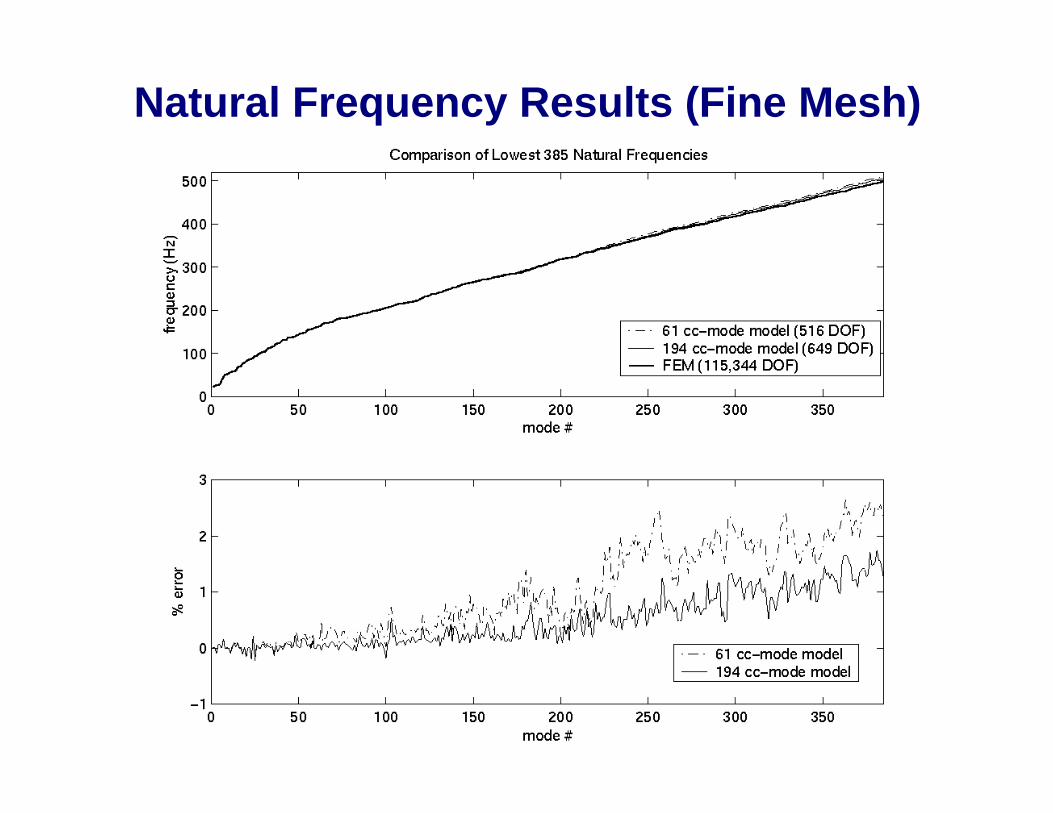
Natural Frequency Results (Fine Mesh)
Node 19194
Forced Response Results (Fine Mesh)
Power Flow: ROM (516 DOF)Displacement at Node 19194:
FEM (115,344 DOF) vs. ROM (516 DOF)
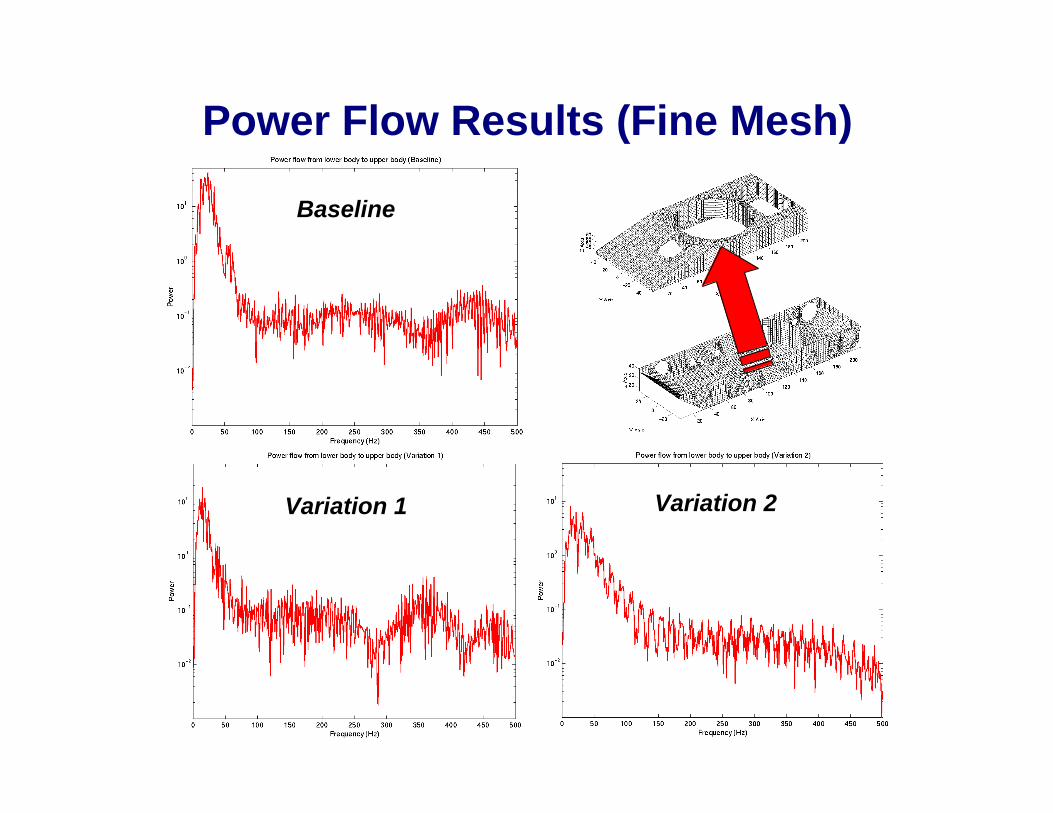
Power Flow Results (Fine Mesh)
Baseline
Variation 1 Variation 2
Summary: Low- to Mid-FrequencyVibration and Power Flow
■ New modeling techniques allow efficient analysis ofvibration and power flow◆ Fast yet accurate for low-frequency range◆ Suitable for mid-frequency range
■ Multi-level substructuring approach provides newcapabilities for analysis and design◆ Analysis of extremely large FEMs◆ Use of “library” of sub-components: plates, beams,...
■ Framework has been established for distributeddesign simulation◆ “Test” and modify individual components◆ Optimize design of global structure
➩ Supports target cascading approach
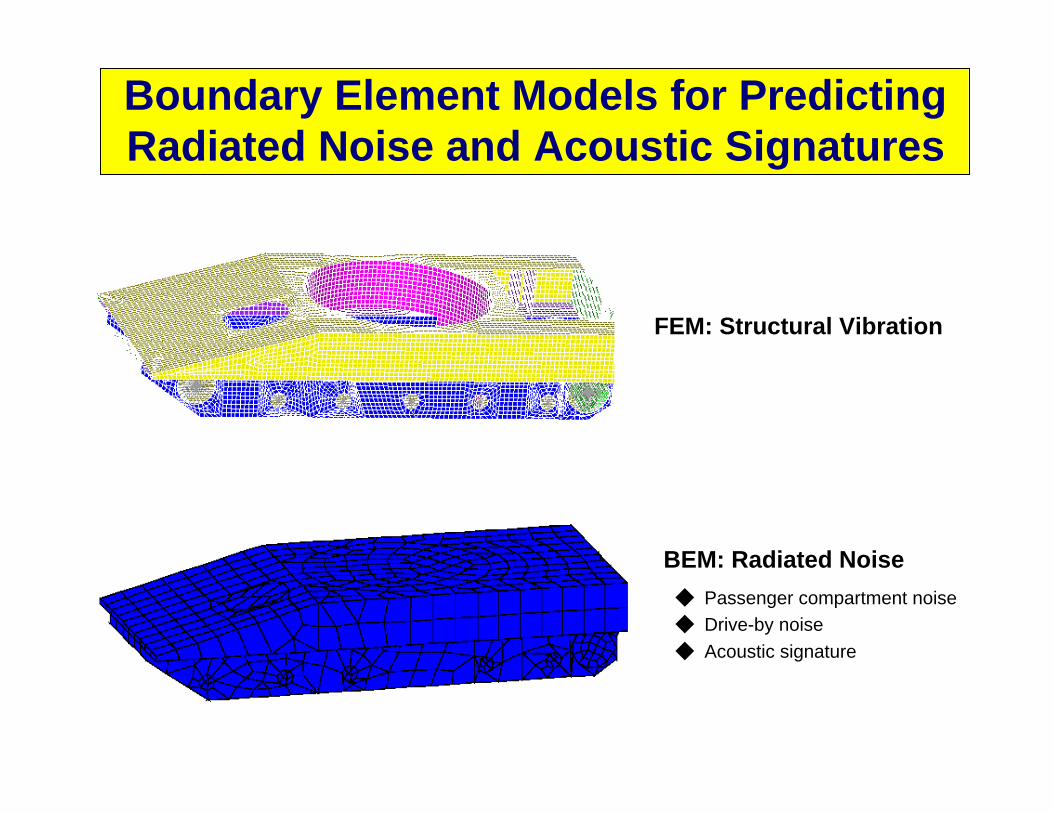
FEM: Structural Vibration
BEM: Radiated Noise
Boundary Element Models for PredictingRadiated Noise and Acoustic Signatures
◆ Passenger compartment noise◆ Drive-by noise
◆ Acoustic signature
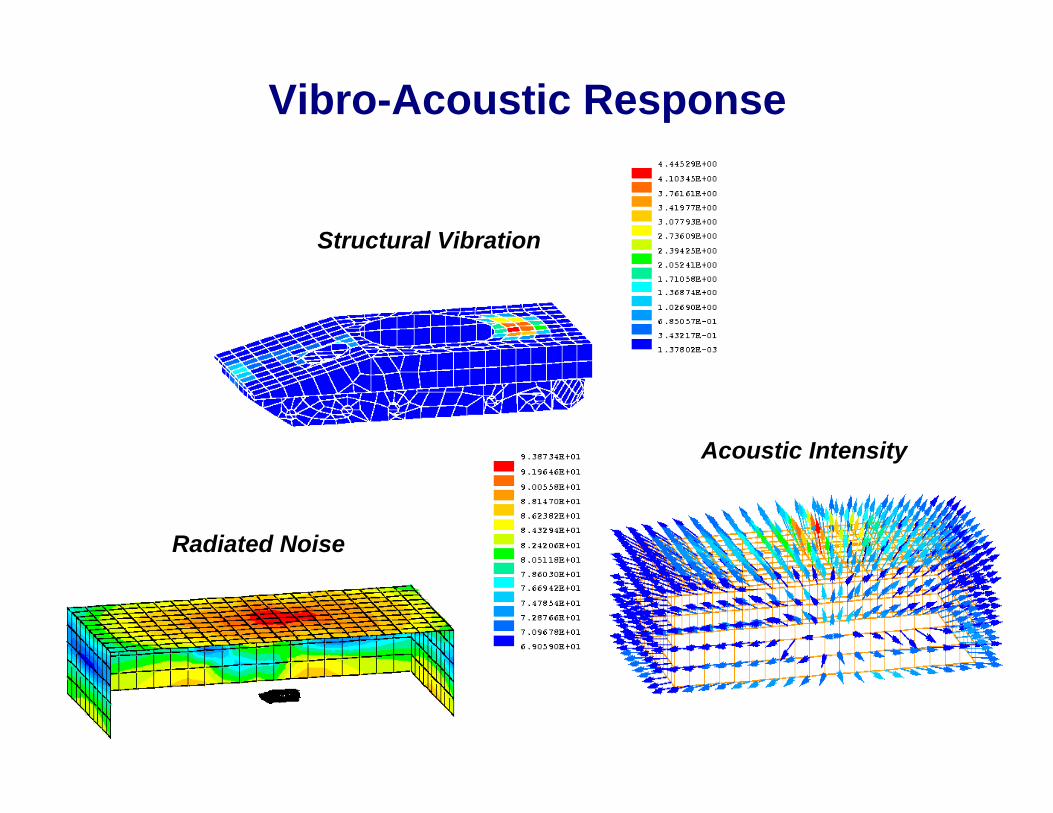
Radiated Noise
Acoustic Intensity
Structural Vibration
Vibro-Acoustic Response
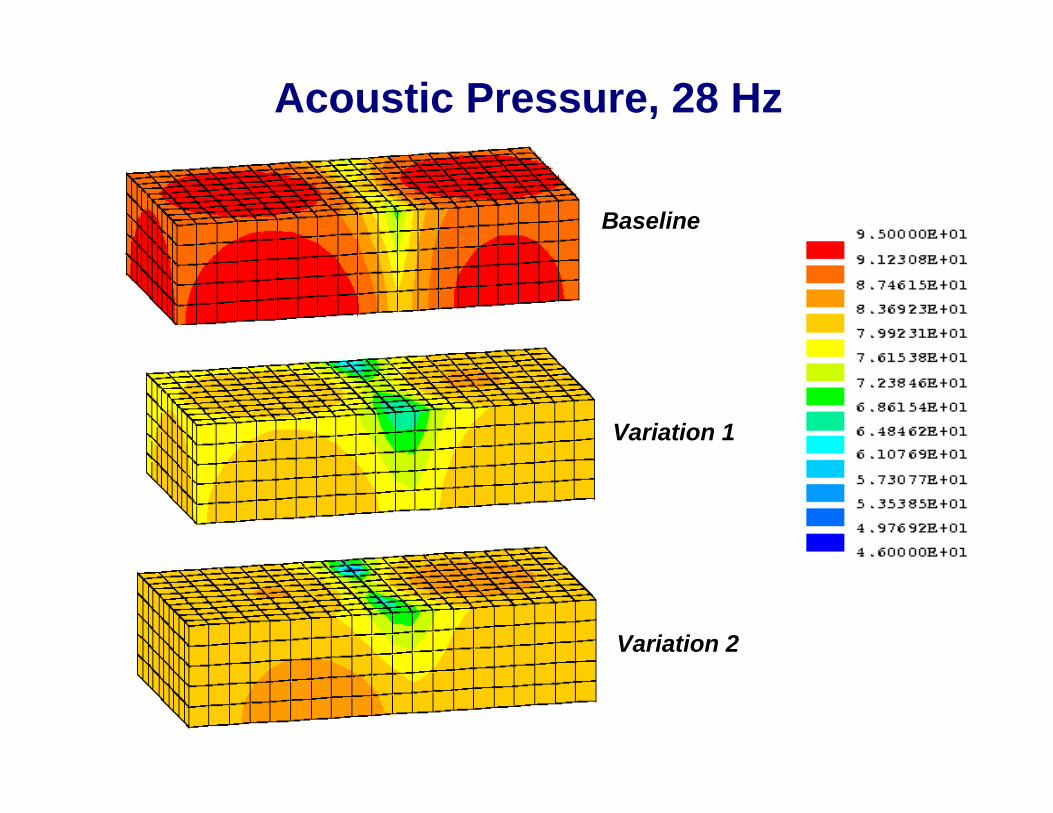
Baseline
Variation 1
Variation 2
Acoustic Pressure, 28 Hz
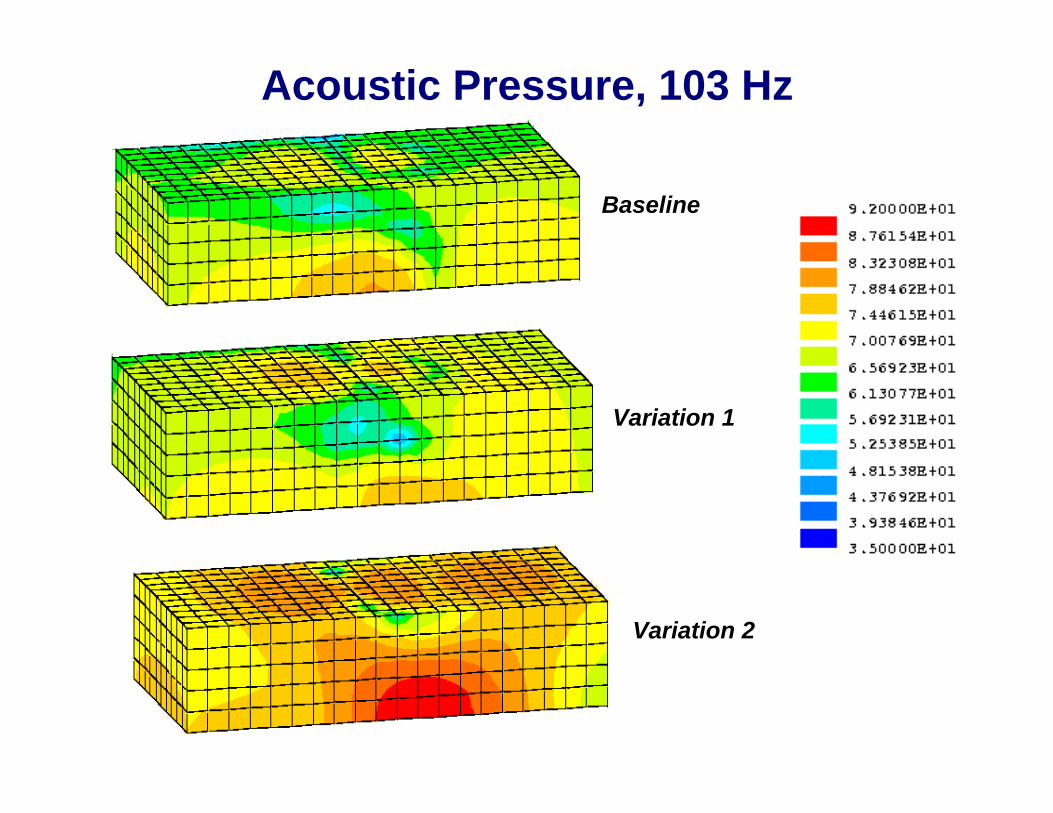
Baseline
Variation 1
Variation 2
Acoustic Pressure, 103 Hz
Summary: BEMs for Radiated Noise
■ Radiated noise can be predicted by integrating:◆ Vehicle dynamics simulation◆ Structural vibration analysis◆ Acoustic radiation analysis
■ Acoustic analysis is needed to determine best/worstdesign cases◆ Acoustic radiation efficiency plays important role◆ Noise levels may not correlate with vibration levels
● “Variation 1” is best case for noise
● “Variation 2” is best case for vibration
■ Technique can be used for both exterior and interior(passenger compartment) noise predictions

Conventional FEA Model
Primary Variable: Displacement
Energy FEA Model
Primary Variable: Energy Density
Fewer elements, yet well-suited forhigh-frequencyanalysis
Energy Finite Element Analysis forHigh-Frequency NVH
Both models generated from same geometry data
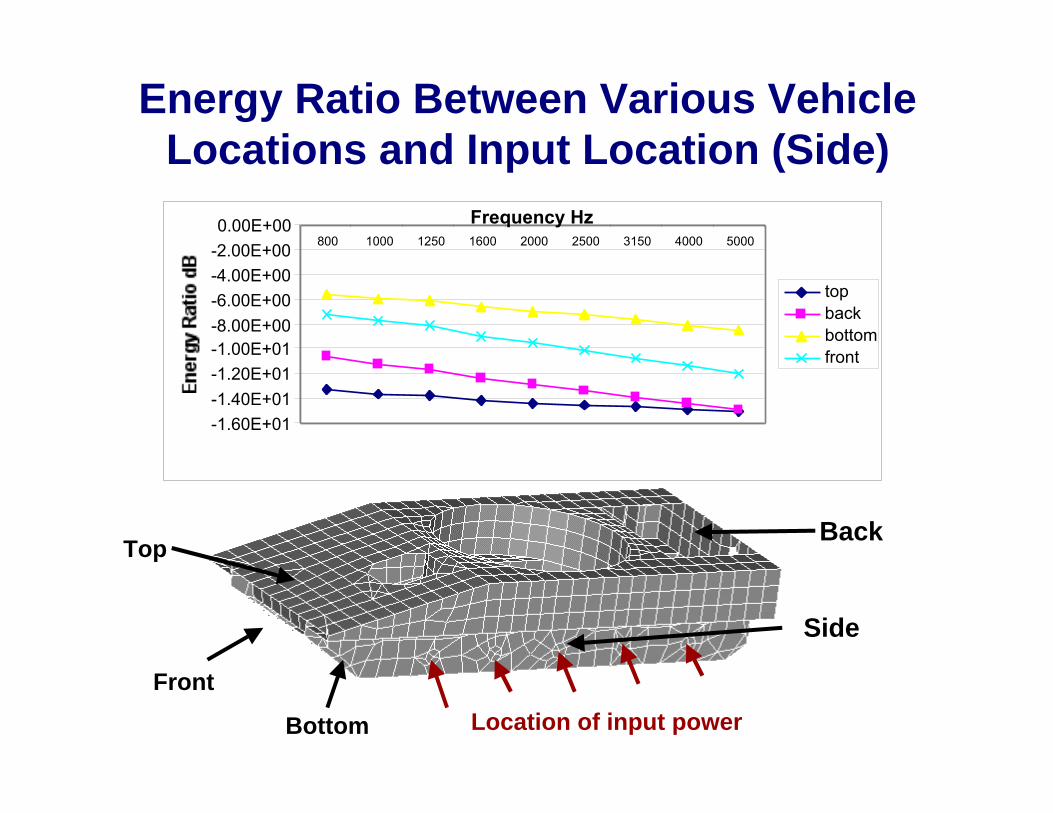
Side
Back
Bottom
Front
Top
Location of input power
-1.60E+01
-1.40E+01
-1.20E+01
-1.00E+01-8.00E+00
-6.00E+00
-4.00E+00
-2.00E+00
0.00E+00800 1000 1250 1600 2000 2500 3150 4000 5000
Frequency Hz
topbackbottomfront
Energy Ratio Between Various VehicleLocations and Input Location (Side)
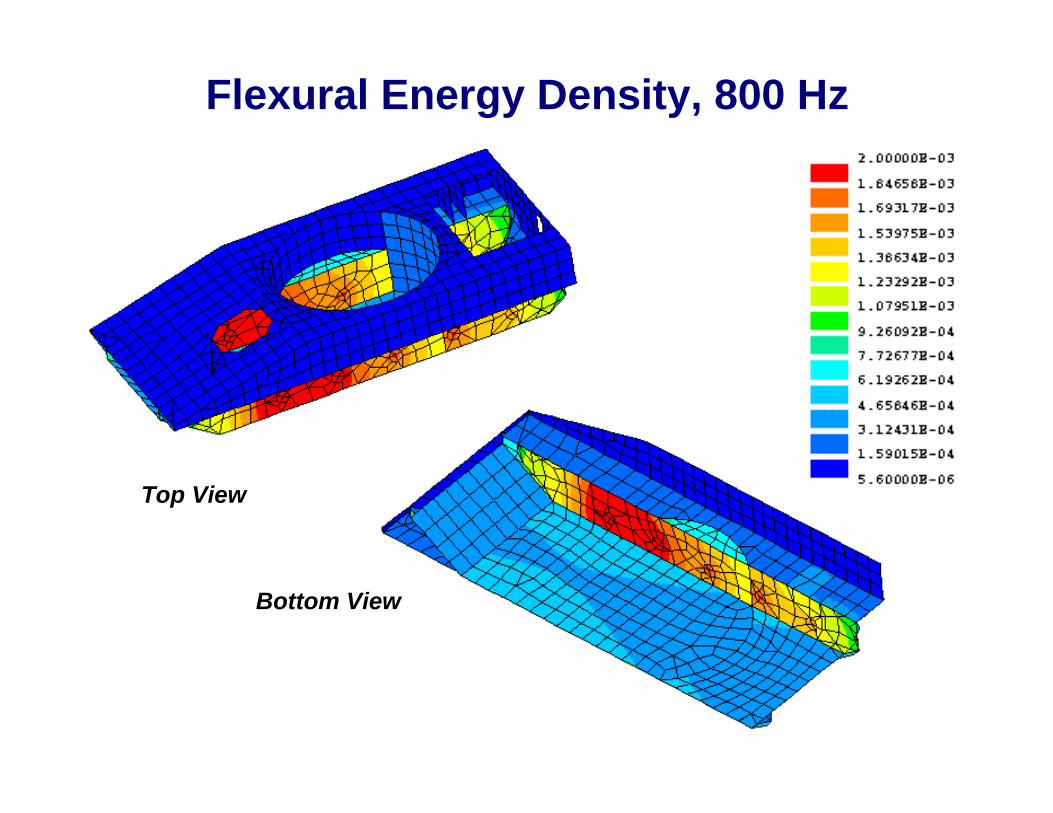
Top View
Bottom View
Flexural Energy Density, 800 Hz
Summary: High-Frequency EFEA
■ EFEA provides computationally efficient method forhigh-frequency analysis◆ Model is generated from same CAD data as for conventional FEM◆ Plot of energy vs. frequency: 5 minutes on Sun workstation
■ EFEA makes high-frequency analysis accessible toengineers, including large community of FEA users
Conclusions
■ New, efficient modeling techniques have beendeveloped for vehicle NVH
■ Models have been integrated to predict◆ Vehicle dynamics◆ Structural vibration◆ Radiated noise◆ Acoustic and seismic signatures
■ Low- to mid- to high-frequency analyses can beperformed using a single FEA-based code
■ Analysis tools provide new capabilities for a flexible,distributed design environment
Ongoing and Future Work
■ Further development of modeling techniques andassociated computer codes
■ Implementation in design studies◆ Optimization◆ Target cascading
■ Application to hybrid vehicles
■ System integration over the internet◆ Different computing platforms◆ Different locations