Embed Size (px)
Citation preview
symmetryS S
Article
Efficient Association Rules Hiding UsingGenetic Algorithms
Naadiya Khuda Bux 1, Mingming Lu 1,*, Jianxin Wang 1, Saajid Hussain 2 and Yazan Aljeroudi 3
1 School of Information Science and Engineering, Central South University, Changsha 410000, China;[email protected] (N.K.B.); [email protected] (J.W.)
2 School of Computer Software and Theory, Dalian University of Technology, Dalian 116024, China;[email protected]
3 Department of Mechanical Engineering, International Islamic University Malaysia,Selangor 53100, Malaysia; [email protected]
* Correspondence: [email protected]
Received: 8 October 2018; Accepted: 22 October 2018; Published: 2 November 2018�����������������
Abstract: In today’s world, millions of transactions are connected to online businesses, and the mainchallenging task is ensuring the privacy of sensitive information. Sensitive association rules hiding(SARH) is an important goal of privacy protection algorithms. Various approaches and algorithmshave been developed for sensitive association rules hiding, differentiated according to their hidingperformance through utility preservation, prevention of ghost rules, and computational complexity.A meta-heuristic algorithm is a good candidate to solve the problem of SARH due to its selectiveand parallel search behavior, avoiding local minima capability. This paper proposes simple geneticencoding for SARH. The proposed algorithm formulates an objective function that estimates the effecton nonsensitive rules and offers recursive computation to reduce them. Three benchmark datasetswere used for evaluation. The results show an improvement of 81% in execution time, 23% in utility,and 5% in accuracy.
Keywords: meta-heuristic optimization; privacy-preserving data mining; data mining; associationrule mining; genetic algorithm; association rule hiding
1. Introduction
Data mining is considered an influential technique to enhance decision-making, with severalorganizations and institutes using it to extract useful information and discover hidden patterns indatasets. This has made data mining a promising functional trend. Association rule mining (ARM) isan important data mining technique that extracts frequently co-occurring data items from transactionaland relational databases and reveals hidden correlations between them. In a set of transactions,ARM focuses on finding associations between frequent items, enabling researchers to predict thefrequency of one itemset depending on the frequency of another item in a transaction. The ARMtechnique has been extensively used in several applications, including privacy preservation [1],market-basket transaction data analysis [2], recommendation [3], health care [4,5], prediction [6],pattern finding in web browsing [7], ranking of text documents [8], and hazard identification [9],among others. The extraction of association rules from transaction datasets was initiated in 1993 [10].A transaction dataset consists of a series of n-transactions D = (t1, t2, . . . tn). Each transaction is a set ofitems I = {i1, i2 . . . im}, while the transaction is a pair comprising of an itemset and a unique transactionID (TID, X). Itemset X is considered frequent if Supp (X)≥ Ts, where Ts is the support threshold definedby the data miner. Supp (X) is the itemset support, which reflects the number of times itemset (X)occurs in the dataset. An association rule is presented as X⇒ Y, where X and Y are two distinct sets of
Symmetry 2018, 10, 576; doi:10.3390/sym10110576 www.mdpi.com/journal/symmetry

Symmetry 2018, 10, 576 2 of 18
items. The rule X⇒ Y shows that the presence of X suggests the presence of another Y in an identicaltransaction with certain confidence. To demonstrate this situation in a real-world scenario, we use thetransaction dataset of a supermarket as an example, where the customer’s shopping list is a transaction.If a customer is buying “bread” and “butter,” then he will surely buy “milk”—the possible associationrule is {bread, butter} ⇒ milk. More precisely, X ⇒ Y is considered as an association rule only ifconf (X U Y) ≥ Tc and Supp (X U Y) ≥ Ts. We define conf (X U Y) as the confidence of X ⇒ Y,which is the ratio of the rule support over the left-hand side conf (X U Y) = Supp (X U Y)/Supp (X).Tc represents the confidence threshold determined by the data miner. The support and confidencethreshold values of Ts and Tc are usually related to the category of the transaction, the usage of miningresults, and the dataset size. Although ARM is the most effective data technique for mining the hiddenpatterns and associations between items, extracting this information without a breach in privacy isa challenging task. Private information, which is normally hidden in the dataset, can be disclosed onconducting a cross-analysis of multiple related datasets [11]; a major side effect of this process is thedisclosure of sensitive information. Privacy has thus become a critical issue facing the data miningresearch community.
Association rule hiding (ARH) is a data mining technique used to preserve sensitive associationrules. All ARH algorithms aim to minimally modify datasets such that no sensitive rule is extracted [12].A hiding association rule can be regarded as a dataset inferential control, although it is concerned withprotecting sensitive rules, not sensitive data [13]; it is the sensitive rule that causes the privacy breach.
In ARH, the number of sensitive association rules is determined by the dataset provider. Thus,when ARM algorithms are applied to that dataset, it can only extract nonsensitive rules. There havebeen other efforts (techniques) to hide sensitive association by modifying the original dataset. However,modifying the original dataset may have certain side effects, such as the loss of nonsensitive patterns(lost rule) or the creation of new rules (ghost rules).
Another technique, privacy preservation data mining (PPDM), has also gained considerableattention in transactional datasets [8]. PPDM maintains privacy by allowing the discovery ofnonsensitive information and protecting sensitive information from disclosure.
The remainder of the paper is organized as follows: Section 2 provides a review of the literature.Section 3 describes the methodology used. Data description is provided in Section 4. Experimentalresults and analysis are given in Section 5. Finally, a conclusion and future work recommendations aregiven in Section 6.
2. Related Work
Association rule mining is the most extensively used (and promising) technique in the datamining field [14]. Since its introduction, it has created several opportunities to mine high-utilitydata [2]. It helps connect people with common interests [3] and provides new opportunities to improvepublic health and medicine; the prediction of post–liver transplantation survival is one example [4,5].This technique helps users find documents relevant to their search [8] and potentially leads to beneficialservices. However, privacy remains a critical issue [15].
Data sanitization strategies to preserve privacy are grouped into four categories: border-, exact-,evolutionary-, and heuristic-based algorithms. The border-based strategy specifies the revised positiveand negative borders of all frequent itemsets. It focuses only on the weight of the maximin set [16]or positive border [17] to minimize the support of the changed negative border. The efficiency ofthe border-based algorithm was enhanced by formulating a hybrid algorithm called the decreasethe confidence rule (DCR) based on the maximin approach. As the name suggests, the maximinapproach uses two heuristics to hide the association rule [18], with the objective of controlling thesanitizing procedure aftereffects on the resulting quality by finding the victim items that are associatedwith the maximin solution. This is achieved by eliminating the victim item that has the shortestlength. The intersection lattice of a frequent item approach for hiding association rules was mainlypresented by Hai at el. [19,20]. These algorithms aim to conceal a specific set of sensitive rules in

Symmetry 2018, 10, 576 3 of 18
three steps. The first step specifies a set of itemsets satisfying three conditions: that they (i) containa right-hand side of the sensitive rule, (ii) are a maximal sub-itemset of a maximal itemset, and (iii)have minimal support among those sub-itemsets specified in (ii). An item on the right-hand side of thesensitive rule that is related to the specified maximal support itemset is identified as the victim item.Second, the number of sensitive transactions is determined. Third, the victim items are deleted fromthe determined transactions until the confidence of the rule decreases below a specified minimumthreshold. Finally, a number is assigned to all transactions to estimate the influence of the data hidingprocess on the nonsensitive association rules (NSARs) [21].
The exact approach [9] is considered as a constraint satisfaction problem to determine the bestsolution in the rule hiding process. It provides the least modification on the original dataset. Relatively,the exact approach provides more undesirable side effects than other approaches, but it suffers fromhigh computational cost [9]. In recent years, many research studies have applied the evolutionaryapproach to hiding the frequent itemset.
Evolutionary algorithms are essentially inspired by Darwin’s evolutionary theory. The algorithmsdeal with populations of individuals in which all the individuals are possible candidate solutionsfor a particular problem to produce a better solution to that problem. The fitness function is usedto measure the goodness of each solution. Some of the most interesting generic search algorithmsproposed PGA2DT [22] and PS02DT [23] to solve the data hiding problem. The PGA2DT and PS02DTalgorithms are based on the transaction deletion strategy, where a fitness function is designed todetermine the suitable chromosomes for the minimum data sanitization process side effects. While allthe chromosomes encode a solution consisting a number of transactions to be deleted, Lin et al. [24]used the genetic algorithm (GA) concept to determine possible associations for data sanitization.In chromosomes, all available genes represent potential candidates to be placed into a transaction.Three user-specific weights are assigned to three factors—hiding failure-sensitive high-utility itemsets,missing high-utility itemsets, and artificial high-utility itemsets—to evaluate the fitness values ofchromosomes. The use of this algorithm reduces the computational time required for rescanningthe original database compared to the simple GA-based algorithm. However, the authors used theapproach of inserting new transactions, which affects the reliability of the generated dataset and mightcause the generation of ghost rules.
The heuristic approach provides a useful and fast algorithm that chooses the suitable items ina specific transaction for hiding sensitive association rules using a distortion or blocking technique.The distortion technique inserts or deletes selected items of sensitive association rules from specifiedtransactions or adds illegitimate transactions [25], to reduce the support [26] or confidence [27] ofthe rules under the given thresholds in order to hide single or multiple rules. Some research studyinvestigated only changing the position of sensitive items in original data reduce the risk of datadisclosure and balance the data confidentiality needs of the individual [28]. Chandra et al. [29] proposedan approach to select and alter the optimal transactions of a dataset to maintain the privacy and utilitytrade-off considering the Particle Swan Optimization (PSO) technique, which is a meta heuristictechnique for solving complex optimization problems. Paratha et al. [30] adopted the heuristic strategywith an artificial bee colony algorithm to conceal the sensitive association rules. The experimentalresults showed zero failure of hiding the sensitive rules, lost rules, and high accuracy, although thework has some limitations, including the minimization of iterations. In this paper, we adopt the onlyalteration of the transaction through deletion techniques in order to avoid the formation of ghost rules.Furthermore, we formulate the approach in a simple genetic framework where each sensitive rule isconcealed by calling the genetic algorithm to alter the set of transactions that have sensitive items incommon with the rule. In this way, the genetic algorithm will be called only for the number of timesequal to the sensitive rules, which assures lower computational cost. Moreover, the calculation ofthe objective function uses a recursive formula in order to guarantee low computational cost of thegenetic execution.
Symmetry 2018, 10, 576 4 of 18
In addition, artificial intelligence approaches were used to hide association rules. The researchshows a fuzzy association rules hiding algorithm that was introduced to prevent the extraction ofsensitive information from datasets while maintaining data utility [31]. In the algorithm, the supportvalue of the item is decreased on either side of the rule in order to hide the sensitive rule. Some researchersinvestigated the up-to-date methodologies and compared the results. In their papers, the proposedalgorithms achieved much better results for hiding failures, false rules, and reduced misses cost.
The existing approaches imply many solutions for hiding the sensitive rule observing theleft-hand side (LHS) and right-hand side (RHS) of the rule as preserving the quality of the originaldatabase. However, recent studies show that the algorithm for hiding sensitive association rules suffersfrom high computational cost [18]; the problem arises when the transaction {g} ⇒ {e, c} supportsthe sensitive rule and supports the selected minimum confidence rule (MCR) {c} ⇒ {e, g}. Also,the border-based algorithm primarily focuses on privacy preservation, while the utility of the datais compromised [16]. Furthermore, as the evolutionary algorithms employ two transaction selectionstrategies—the transaction insertion [22] and insertion strategies [23,24]—these strategies revise thenumber of transactions of the dataset; for this reason, it is hard to extract patterns with an earlierminimum threshold.
3. Methodology
This section provides the developed methodology for sensitive association rule hiding (SARH).It starts with presenting the terms and symbols in Section 3.1. The problem formulation is givenin Section 3.2. After that, we present efficient association rules hiding using a genetic algorithm(EARH-GA) in Section 3.3.
3.1. Terms and Symbols
This subsection provides the mathematical and algorithmic terms used in this paper, presented inTable 1.
Table 1. Other notations.
Term Meaning
AR Set of association rulesSAR Set of sensitive rules
NSAR Set of nonsensitive rulesMC or βmin Minimum confidence threshold for hiding a sensitive ruleMS or αmin Minimum support threshold for hiding a sensitive rule
δNumber of transactions to be altered with the object to hidethe sensitive rule
VI Set of victim items
3.2. Problem Formulation
Suppose we have the same database D from the previous section. After mining this database,we obtain the frequent itemsets and the association rules. We call the set of all association rules AR.There are two subsets of AR: SAR and NSAR. We are required to alter the set of transactions insideD called AT = {at1, at2, . . . , atk}, where AT ⊆ D, in order to conceal SAR. After this alteration,D is transformed to D′. In D′, all SARs have support or confidence lower than minimum support(MS) or minimum confidence (MC). Furthermore, we are required to conduct the alteration whileassuring a minimum reduction of NSAR in order to maximize the utility of D. Other considerationsare preventing ghost rules and assuring less computation time.
3.3. EARH-GA
Let us consider X ⊂ N k, where x ∈ X, x = (x1, x2, . . . xk), where k indicates the set of transactionsin D′ that contains the victim item. N refers the number of positive integers. The solution space is set

Symmetry 2018, 10, 576 5 of 18
as Y, where each element y ∈ Y, y = (y1, y2, . . . yδ), where Sy = {y1, y2, . . . yδ} ⊂ Sx = {x1, x2, . . . xk}.δ is the number of transactions to be altered with the aim of hiding the sensitive rule. If we have a ruleX⇒ Y, then δ is calculated by Equation (1):
δ(X ⇒ Y) = α(X ⇒ Y)− floor(MC× α(X)) (1)
A Venn diagram that represents the relationship between X and Y is presented in Figure 1.Symmetry 2018, 10, x FOR PEER REVIEW 5 of 18
A Venn diagram that represents the relationship between and is presented in Figure 1.
Figure 1. The relationship between X and Y. denotes the positive integer set with dimension , and denotes the positive integer set with dimension δ.
Two approaches are mostly used to alter the transaction, with the purpose of minimizing the confidence of sensitive rule X ⇒Ybelow the MC. (1) Item deletion: this approach decreases the support count by considering the right-hand side (RHS) of rule Y by eliminating certain items, while the removed items from the sensitive transaction support both X and Y. (2) Item addition: this approach, on the other hand, increases the support count of the itemset on the left-hand side (LHS) of rule X. The support count is increased by adding items to the transactions containing X. In the first approach, a few nonsensitive rules may be hidden while all others are authentic. On the contrary, the second strategy may generate illegitimate rules in the sanitized database, and it may also fail to conceal the sensitive rules. Therefore, the item deletion approach has more benefit than item addition. The data sanitization process is aimed at protecting the sensitive knowledge against mining techniques, so in all the side effects, the hiding failure is more essential. Thus, we adopt this approach.
Genetic optimization is proposed to convert D to D’. In order to achieve genetic optimization, two things have to be defined: the solution encoding and the objective function. The solution is encoded as a vector of indices that indicates the transactions that will be altered, while the objective function represents the ratio of the frequency of lost NSAR over the number of NSARs. The genetic algorithm will be called for the number of iterations of as many sensitive rules as we have. In each iteration, the algorithm deals with one sensitive association rule. First, in this step, our approach is to elect the victim item from the sensitive association rule. An item with minimum support of the RHS of the association rule is determined as the victim item, as such items produce fewer frequent itemsets and have minimum support. Therefore, the numbers of association rules containing the victim items have less frequency than other items, so deleting these items has a minor effect on nonsensitive association rules. Second, the algorithm will calculate , the number of transactions that need to be altered using Equation (3). Third, it will select the transactions that contain the victim item as candidate transactions. Fourth, the GA will be called, and it should return the selected transaction. These are the transactions whose alteration will have the minimum impact on the nonsensitive rules, and their number is . Finally, the algorithm will remove the victim item from the selected transaction according to the best solution, the database will be updated, and the algorithm will move on to the next SAR. Optimization association rule hiding using a genetic algorithm is presented in Algorithm 1. To elaborate on how the genetic algorithm works, we present the pseudocode in Algorithm 2. The genetic algorithm receives the DB’, which is the dataset that has to be altered. Also, it receives AR, SAR, CT, , VI, MS, and MC. The result of the genetic algorithm is the selected
Figure 1. The relationship between X and Y. N k denotes the positive integer set with dimension k,and N δ denotes the positive integer set with dimension δ.
Two approaches are mostly used to alter the transaction, with the purpose of minimizing theconfidence of sensitive rule X ⇒ Y below the MC. (1) Item deletion: this approach decreases thesupport count by considering the right-hand side (RHS) of rule Y by eliminating certain items, while theremoved items from the sensitive transaction support both X and Y. (2) Item addition: this approach,on the other hand, increases the support count of the itemset on the left-hand side (LHS) of rule X.The support count is increased by adding items to the transactions containing X. In the first approach,a few nonsensitive rules may be hidden while all others are authentic. On the contrary, the secondstrategy may generate illegitimate rules in the sanitized database, and it may also fail to conceal thesensitive rules. Therefore, the item deletion approach has more benefit than item addition. The datasanitization process is aimed at protecting the sensitive knowledge against mining techniques, so in allthe side effects, the hiding failure is more essential. Thus, we adopt this approach.
Genetic optimization is proposed to convert D to D′. In order to achieve genetic optimization,two things have to be defined: the solution encoding and the objective function. The solution isencoded as a vector of indices that indicates the transactions that will be altered, while the objectivefunction represents the ratio of the frequency of lost NSAR over the number of NSARs. The geneticalgorithm will be called for the number of iterations of as many sensitive rules as we have. In eachiteration, the algorithm deals with one sensitive association rule. First, in this step, our approach is toelect the victim item from the sensitive association rule. An item with minimum support of the RHS ofthe association rule is determined as the victim item, as such items produce fewer frequent itemsets andhave minimum support. Therefore, the numbers of association rules containing the victim items haveless frequency than other items, so deleting these items has a minor effect on nonsensitive associationrules. Second, the algorithm will calculate δ, the number of transactions that need to be altered usingEquation (3). Third, it will select the transactions that contain the victim item as candidate transactions.Fourth, the GA will be called, and it should return the selected transaction. These are the transactionswhose alteration will have the minimum impact on the nonsensitive rules, and their number is δ.Finally, the algorithm will remove the victim item from the selected transaction according to the bestsolution, the database will be updated, and the algorithm will move on to the next SAR. Optimizationassociation rule hiding using a genetic algorithm is presented in Algorithm 1. To elaborate on how thegenetic algorithm works, we present the pseudocode in Algorithm 2. The genetic algorithm receivesthe DB′, which is the dataset that has to be altered. Also, it receives AR, SAR, CT, δ, VI, MS, and MC.The result of the genetic algorithm is the selected transactions, which represent the algorithm’s globalbest solution. The operation of the genetic algorithm is described as a sequence of steps after initializingthe population, which indicates the set of random vectors that belong to the set X ⊂ Nδ, and the fitness
Symmetry 2018, 10, 576 6 of 18
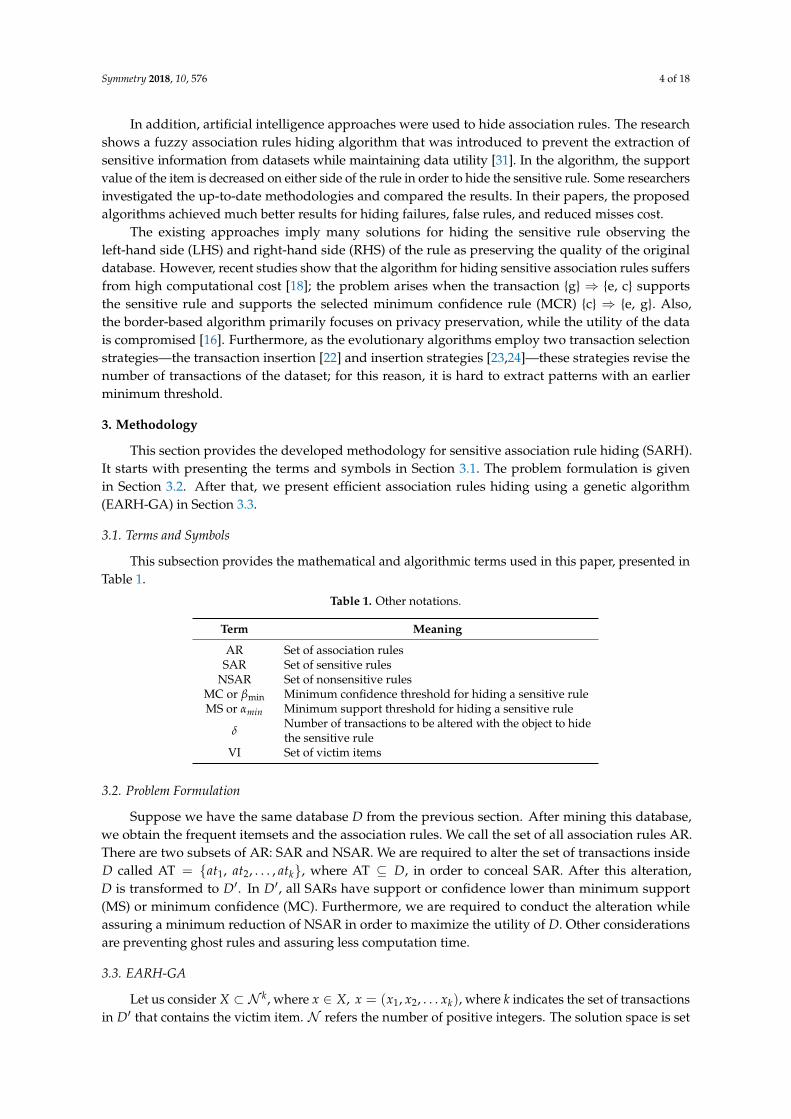
values of the solutions will be evaluated using the fitness function, which is the number of lost NSARsover the number of NSARs when the solution is applied. Applying the solution means deleting thevictim items from the selected transactions by the solution. A set of iterative steps is performed, and ineach step, the elites are selected and used to produce offspring through two operations: crossoverand mutation. In each iteration, the objective function will be called to evaluate the whole solution inthe population.
Algorithm 1. Optimizing association rule hiding using a genetic algorithm.
Input: Database (DB), association rules (ARs), sensitive association rules (SARs), SARcounter = 0, minimumsupport (MS), minimum confidence (MC)Output: DB′
Start
1. DB′ = DB2. While SARcounter < |SAR|3. SARcounter = SARcounter + 14. for i = 1 to |items in the right-hand side of SAR|5. itemSupport(i) = Support(DB′,item(i))6. end7. VI = the item with minimum itemSupport//VI indicates the victim item8. δ = Support(DB′,SAR items) − floor (MC × Support (DB′, items in the left hand side of SAR))9. candidateTransactions = transactions where victimItem belongs10. selectedTransactions = GeneticAlgorithm(DB′, AR, SAR, NSAR, candidateTransactions, δ,
victimItem, MS, MC)11. DB′ = Remove(selectedTransactions, victimItem, DB′)12. EndWhile
End
Algorithm 2. The adopted genetic algorithm pseudocode.
Input: Database (DB′), association rules (ARs), sensitive association rule (SAR), nonsensitive association rules(NSARs), candidate transactions (CTs), δ victimItem (VI), MS, MCOutput: Global best individualStart
1. initialPopulation = initialize population randomly2. FitnessValues = objectiveFunction (initialPopulation, DB′, CT, VI, AR, NSAR, MS, MC, δ)3. while (!stopCondition)4. bestFitIndividuals = selectElite (FitnessValues)5. newIndividuals = crossover and mutation (bestFitIndividuals)6. FitnessValues = objectiveFunction(newIndividuals, DB′, CT, VI, AR, NSAR, MS, MC, δ)7. endwhile8. globalBestIndividual = individual with min(FitnessValues)9. FitnessValues = objectiveFunction (Population, DB′, CT, VI, AR, NSAR, MS, MC, δ)10. For each solution from Population11. NewDB′ = DeleteVictim(DB′, VI, solution)12. LostRules = FindLostRules(NewDB′, DB′)13. LNSAR = FindLostNonSensitive(LostRules, NSAR)14. FitnessValues.Add(LNSAR/NSAR)15. end
End

Symmetry 2018, 10, 576 7 of 18
3.4. Tracing Example
The goal of this example is to elaborate on the operation of the genetic algorithm. We presentan example of a small dataset in Table 2 and all the following steps in order to obtain a new dataset forhiding a given sensitive rule.
Table 2. Transaction dataset.
ID Items
1 {l, m, n, r}2 {m, o, p, q}3 {l, m, n, t}4 {l, o, p, q}5 {l, m, n, t, r}6 {m, p, r}7 {l, m, n, o, p, q}8 {n, o, q, t}
Table 2 provides an example of a transaction database. Each dataset transaction comprises a set ofitems I = {a, b, c, d, e, f, g, h}, provided that the minimum support (MS) αmin = 37.5% and the minimumconfidence (MC) βmin = 75%. Twenty-four association rules are shown in Table 3. These rules are theresult of an a priori data mining algorithm [10]. Other popular ARM algorithms are FP-Growth [32]and Eclat [33].
Table 3. Association rules.
Association Rule Confidence
{l}⇒ {m} 80%{l}⇒ {n} 80%{n}⇒ {l} 80%
{n}⇒ {m} 80%{p}⇒ {m} 75%{r}⇒ {m} 100%{t}⇒ {n} 100%{o}⇒ {p} 75%{p}⇒ {o} 75%{o}⇒ {q} 75%{q}⇒ {o} 75%{p}⇒ {q} 75%{q}⇒ {p} 75%
{l}⇒ {m, n} 80%{n}⇒ {l, m} 80%{l, m}⇒ {n} 100%{l, n}⇒ {m} 100%{m, n}⇒ {l} 100%{o}⇒ {p, q} 75%{p}⇒ {o, q} 75%{q}⇒ {o, p} 75%{o, p}⇒ {q} 100%{o, q}⇒ {p} 100%{p, q}⇒ {o} 100%
If the rule {l}⇒ {m, n} was chosen as a sensitive rule, then the victim item would be (n) because ithas lower support compared to (m), where α(n) = 5 and α(m) = 6. Therefore, (n) should be removedfrom a certain number of transactions; this number is δ, which can be computed using Equation (2).So, altering one transaction is enough to hide the rule {l}⇒ {m, n} and this is due to the small sizeof the dataset in our example. Let us suppose a dataset with 120 transactions whose support count

Symmetry 2018, 10, 576 8 of 18
of the rule is 98 (α (X⇒ Y) = 98), the support count of itemset LHS of the rule is 102 (α (X) = 102),and the minimum confidence threshold is 0.75 (MC = 0.75), which can be formulated as Equation (3).Twenty-two transactions are sanitized; therefore, that it is possible the support count of itemset Y isreduced to 76, and thus the revised confidence of the rule would be 76/98 = 0.745.
δ (X ⇒ Y) = (α (X ⇒ Y)− floor [βmin× α (X)] (2)
δ = 4 − floor [0.75 × 5] = 4 − floor (3.75) = 1
δ = 98− floor(0.75× 10²) = 22 (3)
Obtaining the best transactions is the result of applying a genetic algorithm, and the next sectionwill demonstrate how this works.
Let us get back to the previous example, but with βmin = 50%, and with the sensitive rules (SARs)of {a}⇒ {b, c} and {d, f}⇒ {e}. First, we want to hide {a}⇒ {b, c}; the victim item is (c), and δ is now 2as computed using Equations (4) and (5). The sensitive rules are shown in Table 4.
δ (X ⇒ Y) = (α (X ⇒ Y)− floor [βmin× α (X)] (4)
δ = 4− floor [0.5× 5], δ = 4− floor (2.5) = 4− 2 = 2 (5)
Table 4. Sensitive rules set.
Association Rule Confidence
{l}⇒ {m, n} 40%{o, p}⇒ {q} 100%
Candidate transactions support the sensitive rule, so they are the transactions with the IDs {1, 3,5, 7} in the transaction dataset in Table 2, and they also represent the solution space for the geneticalgorithm. The solution length (chromosome length) is 2 because δ = 2. If the population size is 4,then the initial generation would be something like: {1, 3} {5, 7} {1, 5} {3, 7}.
Next, the objective function in the equation is applied to each of these solutions. For example,for solution {1, 3}, if we delete (c) from transactions with IDs 1 and 3, the new dataset would be D′,as shown in Table 5, and the new rules would be those shown in Table 6.
Table 5. Updated transaction dataset D′.
ID Items
1 {l, m, r}2 {m, o, p, q}3 {l, m, t}4 {l, o, p, q}5 {l, m, n, t, r}6 {m, p, r}7 {l, m, n, o, p, q}8 {n, o, q, t}
Table 6. Nonsensitive rules set.
Association Rule Confidence
{l}⇒ {m} 80%{l}⇒ {n} 40%{n}⇒ {l} 66.66%
{n}⇒ {m} 66.66%
Symmetry 2018, 10, 576 9 of 18
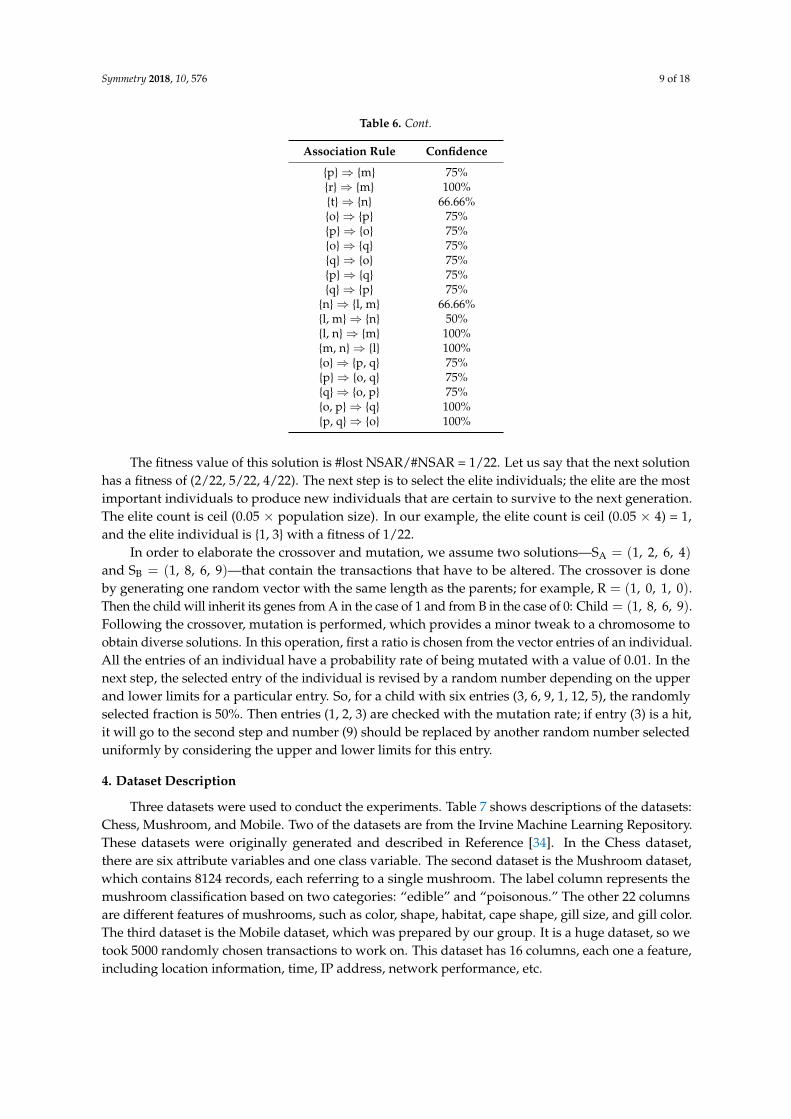
Table 6. Cont.
Association Rule Confidence
{p}⇒ {m} 75%{r}⇒ {m} 100%{t}⇒ {n} 66.66%{o}⇒ {p} 75%{p}⇒ {o} 75%{o}⇒ {q} 75%{q}⇒ {o} 75%{p}⇒ {q} 75%{q}⇒ {p} 75%
{n}⇒ {l, m} 66.66%{l, m}⇒ {n} 50%{l, n}⇒ {m} 100%{m, n}⇒ {l} 100%{o}⇒ {p, q} 75%{p}⇒ {o, q} 75%{q}⇒ {o, p} 75%{o, p}⇒ {q} 100%{p, q}⇒ {o} 100%
The fitness value of this solution is #lost NSAR/#NSAR = 1/22. Let us say that the next solutionhas a fitness of (2/22, 5/22, 4/22). The next step is to select the elite individuals; the elite are the mostimportant individuals to produce new individuals that are certain to survive to the next generation.The elite count is ceil (0.05 × population size). In our example, the elite count is ceil (0.05 × 4) = 1,and the elite individual is {1, 3} with a fitness of 1/22.
In order to elaborate the crossover and mutation, we assume two solutions—SA = (1, 2, 6, 4)and SB = (1, 8, 6, 9)—that contain the transactions that have to be altered. The crossover is doneby generating one random vector with the same length as the parents; for example, R = (1, 0, 1, 0).Then the child will inherit its genes from A in the case of 1 and from B in the case of 0: Child = (1, 8, 6, 9).Following the crossover, mutation is performed, which provides a minor tweak to a chromosome toobtain diverse solutions. In this operation, first a ratio is chosen from the vector entries of an individual.All the entries of an individual have a probability rate of being mutated with a value of 0.01. In thenext step, the selected entry of the individual is revised by a random number depending on the upperand lower limits for a particular entry. So, for a child with six entries (3, 6, 9, 1, 12, 5), the randomlyselected fraction is 50%. Then entries (1, 2, 3) are checked with the mutation rate; if entry (3) is a hit,it will go to the second step and number (9) should be replaced by another random number selecteduniformly by considering the upper and lower limits for this entry.
4. Dataset Description
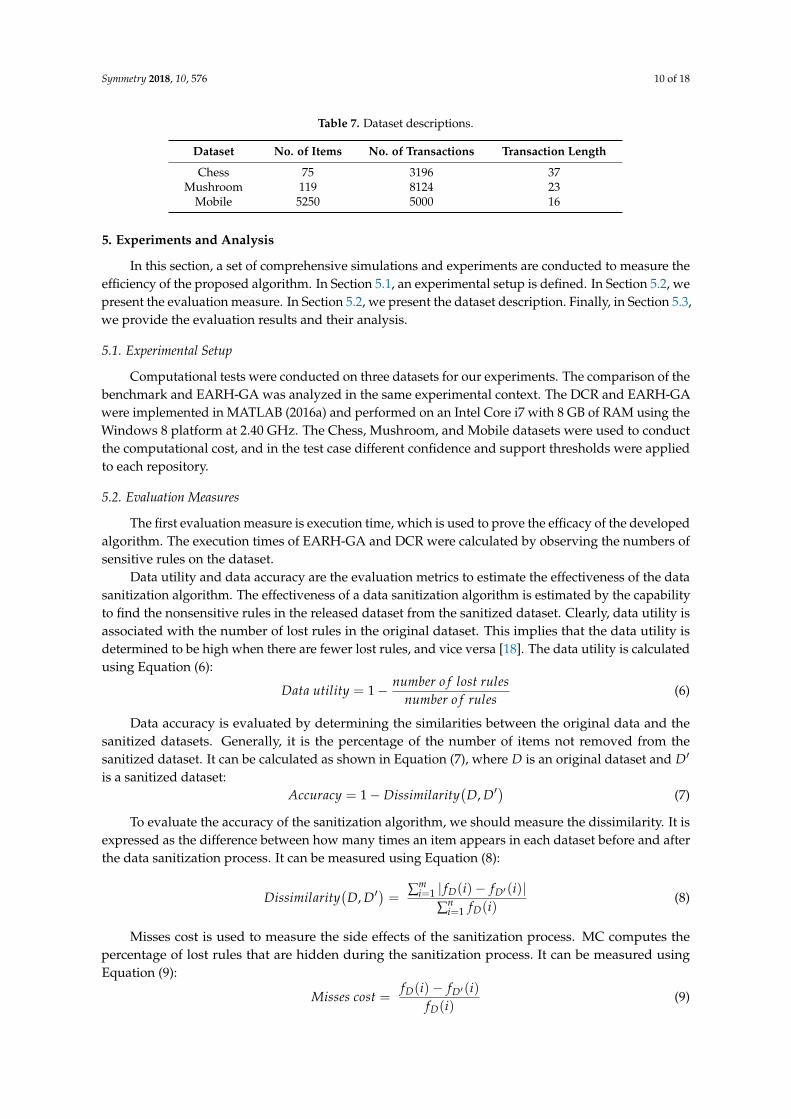
Three datasets were used to conduct the experiments. Table 7 shows descriptions of the datasets:Chess, Mushroom, and Mobile. Two of the datasets are from the Irvine Machine Learning Repository.These datasets were originally generated and described in Reference [34]. In the Chess dataset,there are six attribute variables and one class variable. The second dataset is the Mushroom dataset,which contains 8124 records, each referring to a single mushroom. The label column represents themushroom classification based on two categories: “edible” and “poisonous.” The other 22 columnsare different features of mushrooms, such as color, shape, habitat, cape shape, gill size, and gill color.The third dataset is the Mobile dataset, which was prepared by our group. It is a huge dataset, so wetook 5000 randomly chosen transactions to work on. This dataset has 16 columns, each one a feature,including location information, time, IP address, network performance, etc.
Symmetry 2018, 10, 576 10 of 18
Table 7. Dataset descriptions.
Dataset No. of Items No. of Transactions Transaction Length
Chess 75 3196 37Mushroom 119 8124 23
Mobile 5250 5000 16
5. Experiments and Analysis
In this section, a set of comprehensive simulations and experiments are conducted to measure theefficiency of the proposed algorithm. In Section 5.1, an experimental setup is defined. In Section 5.2, wepresent the evaluation measure. In Section 5.2, we present the dataset description. Finally, in Section 5.3,we provide the evaluation results and their analysis.
5.1. Experimental Setup
Computational tests were conducted on three datasets for our experiments. The comparison of thebenchmark and EARH-GA was analyzed in the same experimental context. The DCR and EARH-GAwere implemented in MATLAB (2016a) and performed on an Intel Core i7 with 8 GB of RAM using theWindows 8 platform at 2.40 GHz. The Chess, Mushroom, and Mobile datasets were used to conductthe computational cost, and in the test case different confidence and support thresholds were appliedto each repository.
5.2. Evaluation Measures
The first evaluation measure is execution time, which is used to prove the efficacy of the developedalgorithm. The execution times of EARH-GA and DCR were calculated by observing the numbers ofsensitive rules on the dataset.
Data utility and data accuracy are the evaluation metrics to estimate the effectiveness of the datasanitization algorithm. The effectiveness of a data sanitization algorithm is estimated by the capabilityto find the nonsensitive rules in the released dataset from the sanitized dataset. Clearly, data utility isassociated with the number of lost rules in the original dataset. This implies that the data utility isdetermined to be high when there are fewer lost rules, and vice versa [18]. The data utility is calculatedusing Equation (6):
Data utility = 1− number o f lost rulesnumber o f rules
(6)
Data accuracy is evaluated by determining the similarities between the original data and thesanitized datasets. Generally, it is the percentage of the number of items not removed from thesanitized dataset. It can be calculated as shown in Equation (7), where D is an original dataset and D′
is a sanitized dataset:Accuracy = 1− Dissimilarity
(D, D′
)(7)
To evaluate the accuracy of the sanitization algorithm, we should measure the dissimilarity. It isexpressed as the difference between how many times an item appears in each dataset before and afterthe data sanitization process. It can be measured using Equation (8):
Dissimilarity(
D, D′)=
∑mi=1 | fD(i)− fD′(i)|
∑ni=1 fD(i)
(8)
Misses cost is used to measure the side effects of the sanitization process. MC computes thepercentage of lost rules that are hidden during the sanitization process. It can be measured usingEquation (9):
Misses cost =fD(i)− fD′(i)
fD(i)(9)

Symmetry 2018, 10, 576 11 of 18
where D is the original dataset and D′ is the sanitized dataset, m is the frequency of items in thedataset, fD(i) is the frequency of nonsensitive rules in the original dataset, and fD′(i) is the frequencyof nonsensitive rules in D′. In order to maintain the quality of data, we need to reduce the number ofmissing nonsensitive rules as much as possible.
5.3. Performance Analysis
First, the data mining algorithm [10] was applied to these datasets using different values ofsupport and confidence thresholds. Then, 1% of the resulting association rules were randomly chosenas sensitive rules. Finally, the two algorithms were used to hide the sensitive data and the followingresults were generated. We conducted several experiments for each dataset. In each experiment,the number of sensitive rules was constantly 1% and they were randomly chosen each time. Table 8shows the different confidence thresholds during the association rules mining stage.
Table 8. Experimental settings of datasets.
Dataset Minimum Confidence No. of Association Rules No. of Sensitive Rules
94% 7177 72Chess 95% 6145 62
96% 4435 45
97% 4081 4145% 4949 50
Mushroom 50% 4402 4555% 3937 4060% 3535 36
40% 2092 2050% 1984 19
Mobile 60% 1801 1870% 1580 1580% 1333 1390% 1246 12
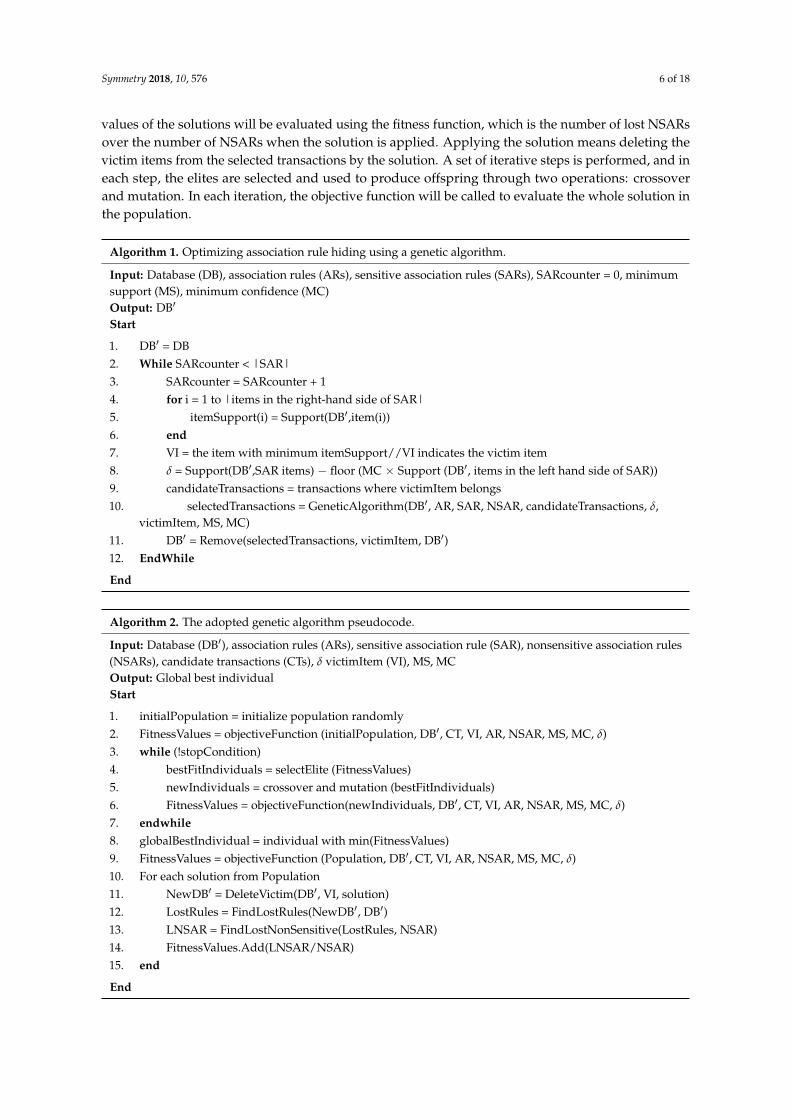
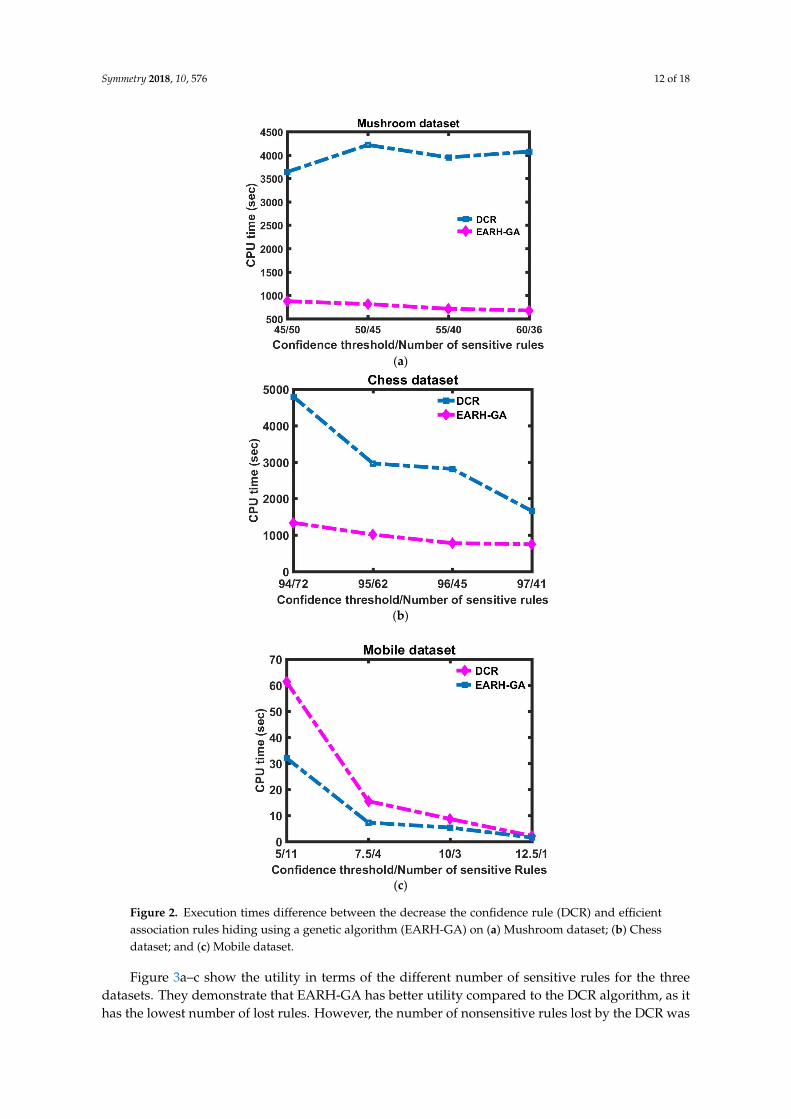
Figure 2a–c show the efficiency advantage of our approach compared to the DCR algorithm,where the execution time of EARH-GA and DCR are plotted against the confidence thresholds for thedatasets. Execution time is a time duration taken by the algorithm to run a program. These increasingconfidence thresholds resulted in a decreased number of sensitive rules and it is clear that less executiontime is needed by the proposed algorithm as compared to the DCR for all datasets in all conditions.
Symmetry 2018, 10, 576 12 of 18Symmetry 2018, 10, x FOR PEER REVIEW 12 of 18
(a)
(b)
(c)
Figure 2. Execution times difference between the decrease the confidence rule (DCR) and efficient association rules hiding using a genetic algorithm (EARH-GA) on (a) Mushroom dataset; (b) Chess dataset; and (c) Mobile dataset.
Figure 3a–c show the utility in terms of the different number of sensitive rules for the three datasets. They demonstrate that EARH-GA has better utility compared to the DCR algorithm, as it
Figure 2. Execution times difference between the decrease the confidence rule (DCR) and efficientassociation rules hiding using a genetic algorithm (EARH-GA) on (a) Mushroom dataset; (b) Chessdataset; and (c) Mobile dataset.
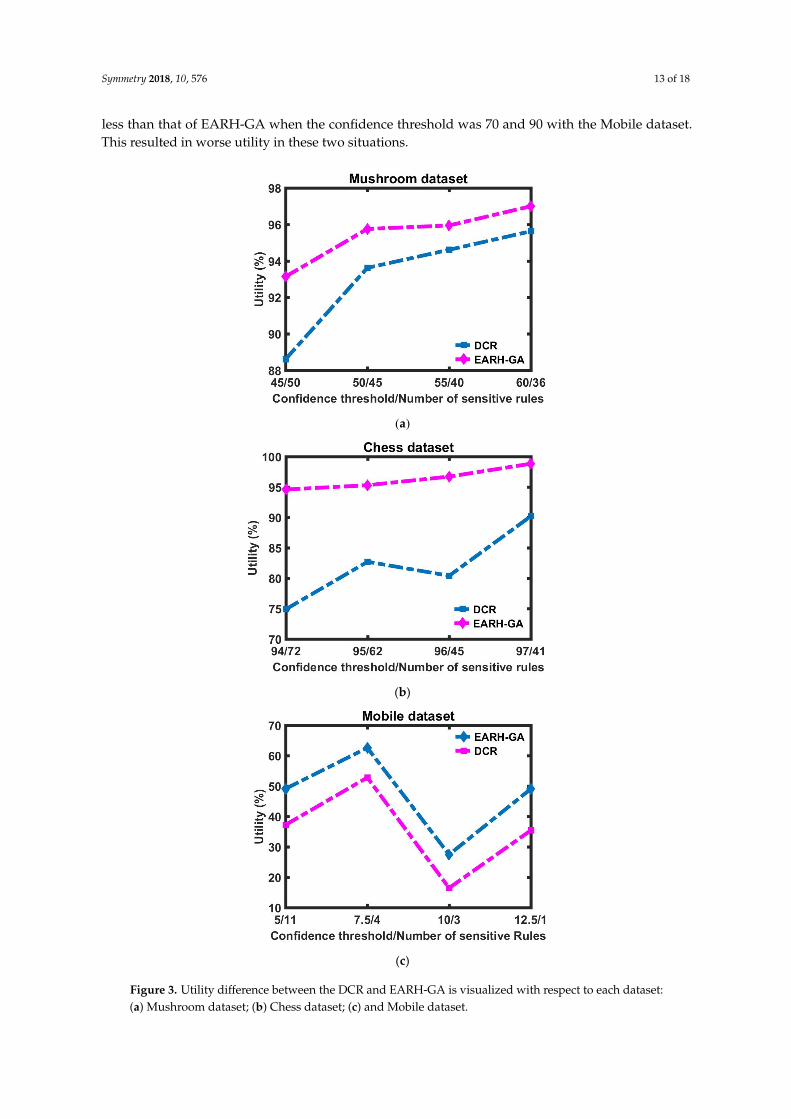
Figure 3a–c show the utility in terms of the different number of sensitive rules for the threedatasets. They demonstrate that EARH-GA has better utility compared to the DCR algorithm, as ithas the lowest number of lost rules. However, the number of nonsensitive rules lost by the DCR was
Symmetry 2018, 10, 576 13 of 18
less than that of EARH-GA when the confidence threshold was 70 and 90 with the Mobile dataset.This resulted in worse utility in these two situations.
Symmetry 2018, 10, x FOR PEER REVIEW 13 of 18
has the lowest number of lost rules. However, the number of nonsensitive rules lost by the DCR was less than that of EARH-GA when the confidence threshold was 70 and 90 with the Mobile dataset. This resulted in worse utility in these two situations.
(a)
(b)
(c)
Figure 3. Utility difference between the DCR and EARH-GA is visualized with respect to each dataset:(a) Mushroom dataset; (b) Chess dataset; (c) and Mobile dataset.

Symmetry 2018, 10, 576 14 of 18
Figure 4a–c demonstrate the accuracy advantage of EARH-GA over the DCR, where in all testedsituations our approach resulted in less dissimilarity and better accuracy. This comes back to theparallel nature of the GA when choosing the best solution.
Symmetry 2018, 10, x FOR PEER REVIEW 14 of 18
Figure 3. Utility difference between the DCR and EARH-GA is visualized with respect to each dataset: (a) Mushroom dataset; (b) Chess dataset; (c) and Mobile dataset.
Figure 4a–c demonstrate the accuracy advantage of EARH-GA over the DCR, where in all tested situations our approach resulted in less dissimilarity and better accuracy. This comes back to the parallel nature of the GA when choosing the best solution.
(a)
(b)
Symmetry 2018, 10, x FOR PEER REVIEW 15 of 18
(c)
Figure 4. Accuracy difference between the DCR and EARH-GA visualized with respect to each dataset: (a) Mushroom dataset; (b) Chess dataset; (c) and Mobile dataset.
Figure 5a–c demonstrate that with respect to different sizes of sensitive rules, EARH-GA has the lower misses count compared with the DCR algorithm. The misses cost of the proposed algorithm is less than that of the base algorithm.
(a)
Figure 4. Accuracy difference between the DCR and EARH-GA visualized with respect to each dataset:(a) Mushroom dataset; (b) Chess dataset; (c) and Mobile dataset.
Symmetry 2018, 10, 576 15 of 18
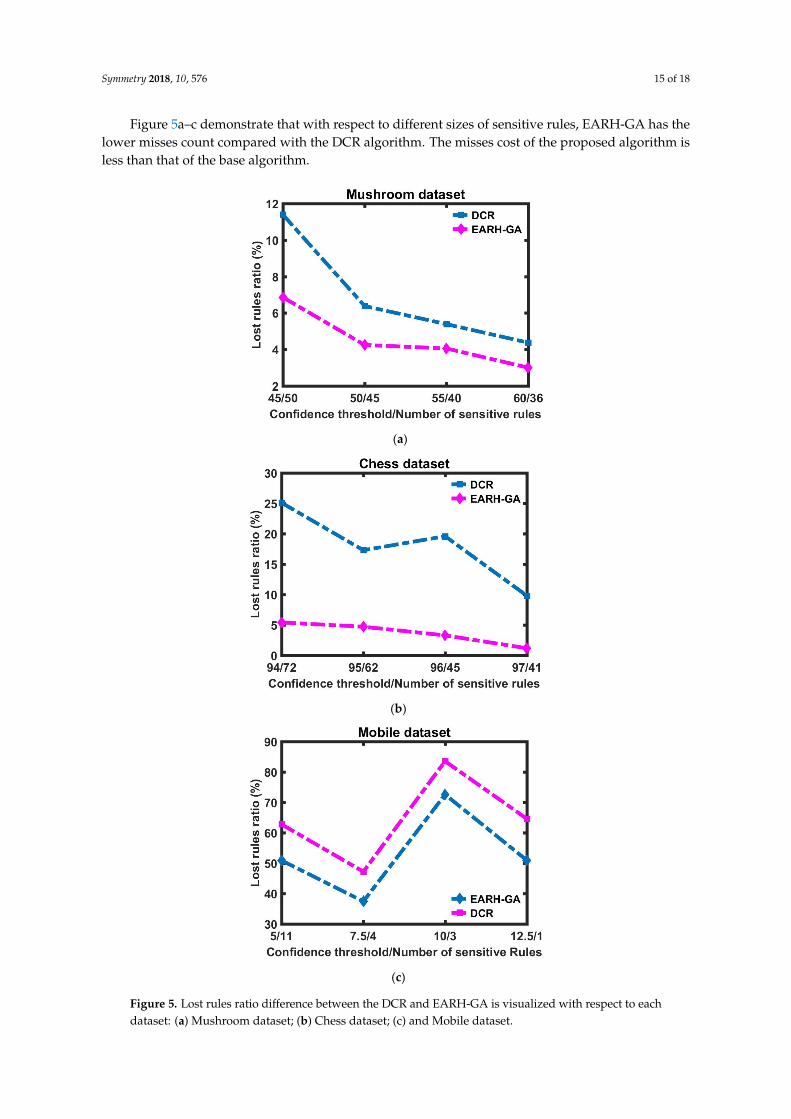
Figure 5a–c demonstrate that with respect to different sizes of sensitive rules, EARH-GA has thelower misses count compared with the DCR algorithm. The misses cost of the proposed algorithm isless than that of the base algorithm.
Symmetry 2018, 10, x FOR PEER REVIEW 15 of 18
(c)
Figure 4. Accuracy difference between the DCR and EARH-GA visualized with respect to each dataset: (a) Mushroom dataset; (b) Chess dataset; (c) and Mobile dataset.
Figure 5a–c demonstrate that with respect to different sizes of sensitive rules, EARH-GA has the lower misses count compared with the DCR algorithm. The misses cost of the proposed algorithm is less than that of the base algorithm.
(a)
Symmetry 2018, 10, x FOR PEER REVIEW 16 of 18
(b)
(c)
Figure 5. Lost rules ratio difference between the DCR and EARH-GA is visualized with respect to each dataset: (a) Mushroom dataset; (b) Chess dataset; (c) and Mobile dataset.
All the experiments show that the proposed algorithm outperforms the DCR algorithm in all aspects. The performance improvement is elaborated in Table 9.
Table 9. Percentage of improvement in results.
Improvement Mushroom Chess Mobile Max Time 81% 70% 48% 81%
Lost rules ratio 36% 79% 21% 79% Accuracy 5% 5% 3% 5%
Utility 2% `2% 23% 23%
6. Conclusions
In this work, a novel algorithm called efficient association rules hiding using a genetic algorithm (EARH-GA) was presented for hiding sensitive association rules with better time cost while doing a better job of controlling the side effects of the nonsensitive rules. We managed to achieve this by taking advantage of the genetic algorithm and by using recursion in its objective function. With the objective of demonstrating the superiority of our approach, an algorithm called the decrease the confidence rule (DCR) was chosen as a benchmark. The experimental analysis demonstrated that the
Figure 5. Lost rules ratio difference between the DCR and EARH-GA is visualized with respect to eachdataset: (a) Mushroom dataset; (b) Chess dataset; (c) and Mobile dataset.

Symmetry 2018, 10, 576 16 of 18
All the experiments show that the proposed algorithm outperforms the DCR algorithm in allaspects. The performance improvement is elaborated in Table 9.
Table 9. Percentage of improvement in results.
Improvement Mushroom Chess Mobile Max
Time 81% 70% 48% 81%Lost rules ratio 36% 79% 21% 79%
Accuracy 5% 5% 3% 5%Utility 2% ‘2% 23% 23%
6. Conclusions
In this work, a novel algorithm called efficient association rules hiding using a genetic algorithm(EARH-GA) was presented for hiding sensitive association rules with better time cost while doinga better job of controlling the side effects of the nonsensitive rules. We managed to achieve this bytaking advantage of the genetic algorithm and by using recursion in its objective function. With theobjective of demonstrating the superiority of our approach, an algorithm called the decrease theconfidence rule (DCR) was chosen as a benchmark. The experimental analysis demonstrated that theperformance of EARH-GA was better than the DCR with regard to execution time, utility, and accuracy.In future work, we aim to develop the formulation of EARH-GA to consider hiding a set of rules inone optimization run instead of hiding one rule in every run.
Author Contributions: N.K.B., J.W., and M.L. conceived and designed the whole system; S.H. and M.L. collectedall the data; N.K.B., S.H., and Y.A. conducted the experiment; N.K.B. and M.L. wrote the research paper.
Funding: This work was partially supported by the National Science Foundation of China, Project Nos. 61232001,61173169, 91646115, and 60903222; the Science Foundation of Hunan, Project No. 2016JJ2149; and the MajorScience and Technology Research Program for Strategic Emerging Industry of Hunan, Grant No. 2012GK4054.
Conflicts of Interest: The authors declare no conflict of interest.
References
1. Rehman, S.; Sharma, A. Privacy-Preserving Data Mining Using Association Rule Based on Apriori Algorithm.Int. Adv. Inform. Comput. Res. 2017, 712, 218–226.
2. Srivastava, N.; Gupta, K.; Baliyan, N. Improved Market Basket Analysis with Utility Mining. In Proceedingsof the 3rd International Conference on Internet of Things and Connected Technologies (ICIoTCT), Jaipur,India, 26–27 March 2018.
3. Liu, L.; Yu, S.; Wei, X.; Ning, Z. An improved Apriori-based algorithm for friends recommendation ina microblog. Int. J. Comput. Syst. 2018, 31, e3453. [CrossRef]
4. Hareendran, S.A.; Chandra, S.V. Association Rule Mining in Healthcare Analytics. In Data Mining and BigData; Springer: Cham, Switzerland, 2017; pp. 31–39.
5. Ning, C.P.; Ji, X.; Wang, H.Q.; Du, X.Y.; Niu, H.T.; Fang, S.B. Association between the sonographer’sexperience and diagnostic performance of IOTA simple rules. World J. Surg. Oncol. 2018, 16, 179. [CrossRef][PubMed]
6. Petrova, E.; Pauwels, P.; Svidt, K.; Jensen, R.L. In search of sustainable design patterns: Combining datamining and semantic data modeling on disparate building data. In Advances in Informatics and Computing inCivil and Construction Engineering; Springer: Cham, Switzerland, 2019; pp. 19–26.
7. Rekik, R.; Kallel, I.; Casillas, J.; Alimi, A.M. Assessing web sites quality: A systematic literature review bytext and association rules mining. Int. J. Inf. Manag. 2018, 38, 201–216. [CrossRef]
8. Jabri, S.; Dahbi, A.; Gadi, T.; Bassir, A. Ranking of text documents using TF-IDF weighting and associationrules mining. In Proceedings of the 2018 4th International Conference on Optimization and Applications(ICOA), Mohammedia, Morocco, 26–27 April 2018; pp. 1–6.

Symmetry 2018, 10, 576 17 of 18
9. Divanis, A.G.; Verykios, V. An integer programming approach for frequent itemset hiding. In Proceedings ofthe 15th ACM International Conference on Information and Knowledge Management, Arlington, VA, USA,5–11 November 2006; pp. 5–11.
10. Agrawal, R.; Imielinski, T.; Swami, A. Mining association rules between sets of items in large databases.In Proceedings of the 1993 ACM SIGMOD international conference on Management of data, Washington,DC, USA, 25–28 May 1993; pp. 207–216.
11. Yogendra, J.K.; Vinod, K.Y.; Geetika, S.P. An Efficient Association Rule Hiding Algorithm for PrivacyPreserving Data Mining. Int. J. Comput. Sci. Eng. 2011, 3, 2792–2798.
12. Sui, P.; Li, X. A privacy-preserving approach for multimodal transaction data integrated analysis.Neurocomputing 2017, 253, 56–64. [CrossRef]
13. Farkas, C.; Jajodia, S. The inference problem: A survey. ACM SIGKDD Explor. Newslett. 2001, 4, 6–11.Available online: http://www.utdallas.edu/~muratk/courses/course_material/p6-farkas.pdf (accessed on27 June 2018). [CrossRef]
14. Aqra, I.; Herawan, T.; Ghani, N.A.; Akhunzada, A.; Ali, A.; Razali, R.B.; Choo, K.K.R. A novel associationrule mining approach using TID intermediate itemset. PLoS ONE 2018, 13, e0196957.
15. Mohan, S.V.; Angamuthu, T. Association Rule Hiding in Privacy-Preserving Data Mining. Int. J. Inform.Secur. Priv. 2018, 12, 141–163. [CrossRef]
16. Moustakides, G.V.; Vassilios, V.S. A MaxMin Approach for Hiding Frequent Itemsets. In Proceedings of theSixth IEEE International Conference on Data Mining—Workshops, Hong Kong, China, 18–22 December 2006.
17. Sun, X.; Philip, S.Y. Hiding Sensitive Frequent Itemsets by a Border-Based Approach. J. Comput. Sci. Eng.2007, 1, 74–94. [CrossRef]
18. Telikani, A.; Shahbahrami, A. Optimizing association rule hiding using combination of border and heuristicapproaches. Appl. Intell. 2017, 47, 544–557. [CrossRef]
19. Le, H.Q.; Arch-Int, S. A Conceptual Framework for Privacy Preserving of Association Rule Mining inE-Commerce. In Proceedings of the 2012 7th IEEE Conference on Industrial Electronics and Applications(ICIEA), Singapore, 18–20 July 2012.
20. Le, H.Q.; Arch-Int, S.; Nguyen, X.Y.; Arch-Int, N. Association Rule Hiding in Risk Management for RetailSupply Chain Collaboration. Comput. Ind. 2013, 64, 776–784. [CrossRef]
21. Le, H.Q.; Arch-Int, S.; Arch, N. Association Rule Hiding Based on Distance and Intersection Lattice.Math. Probl. Eng. 2013, 2013, 210405.
22. Lin, C.W.; Zhang, B.; Yang, K.T.; Hong, T.P. Efficiently hiding sensitive itemsets with transaction deletionbased on genetic algorithms. Sci. World J. 2014, 2014, 398269. [CrossRef] [PubMed]
23. Lin, C.W.; Hong, T.P.; Yang, K.T.; Wang, S.L. The GA-based algorithms for optimizing hiding sensitiveitemsets through transaction deletion. Appl. Intell. 2015, 42, 210–230. [CrossRef]
24. Lin, C.W.; Hong, T.P.; Wang, J.P.; Lan, G.C. A GA-Based Approach to Hide Sensitive High Utility Itemsets.Sci. Word J. 2014, 2014, 804629. [CrossRef] [PubMed]
25. Hong, T.P.; Lin, C.W.; Chang, C.C.; Wang, S.L. Hiding sensitive item sets by inserting dummy transactions.In Proceedings of the 2011 IEEE International Conference on Granular Computing, Kaohsiung, Taiwan, 8–10November 2011; pp. 246–249.
26. Oliveira, S.R.M.; Osmar, R.Z. A Unified Framework for Protecting Sensitive Association Rules in BusinessCollaboration. Int. J. Bus. Intell. Data Min. 2006, 1, 247. [CrossRef]
27. Verykios, V.S.; Elmagarmid, A.K.; Bertino, E. Association Rule Hiding. IEEE Trans. Knowl. Data Eng. 2014, 16,434–447. [CrossRef]
28. Dhyanendra, J. Hiding Sensitive Association Rules without Altering the Support of Sensitive Item(S).Int. Conf. Comput. Sci. Inf. Technol. 2012, 3, 500–509.
29. Kalyani, G.; Chandra, S.R. Particle Swarm Intelligence and Impact Factor-Based Privacy PreservingAssociation Rule Mining for Balancing Data Utility and Knowledge Privacy. Arab. J. Sci. Eng. 2017, 43,4161–4178. [CrossRef]
30. Prabha, M.; Sathiya, S.V. Association rule hiding using artificial bee colony algorithm. Int. J. Comput. Appl.2011, 33, 41–47.
31. Gupta, M.; Joshi, R.C. Privacy-Preserving Fuzzy Association Rules Hiding in Quantitative Data. Int. J.Comput. Theory Eng. 2009, 1, 1793–8201. [CrossRef]

Symmetry 2018, 10, 576 18 of 18
32. Ji, C.R.; Deng, Z.H. Mining Frequent Ordered Patterns without Candidate Generation. In Proceedings of theFourth International Conference on Fuzzy Systems and Knowledge Discovery (FSKD 2007), Haikou, China,24–27 August 2007; pp. 402–406.
33. Zaki, M.K.; Srinivasan, P.; Ogihara, M.; Li, W. New Algorithms for Fast Discovery of Association Rules.In Proceedings of the 3rd International Conference on Knowledge Discovery and Data Mining, NewportBeach, CA, USA, 14–17 August 1997; pp. 283–286.
34. Bayardo, R. Efficiently Mining Long Patterns from Databases. 1998; pp. 85–89. Available online: https://archive.ics.uci.edu/ml/datasets.html (accessed on 5 July 2018).
© 2018 by the authors. Licensee MDPI, Basel, Switzerland. This article is an open accessarticle distributed under the terms and conditions of the Creative Commons Attribution(CC BY) license (http://creativecommons.org/licenses/by/4.0/).