Embed Size (px)
Citation preview
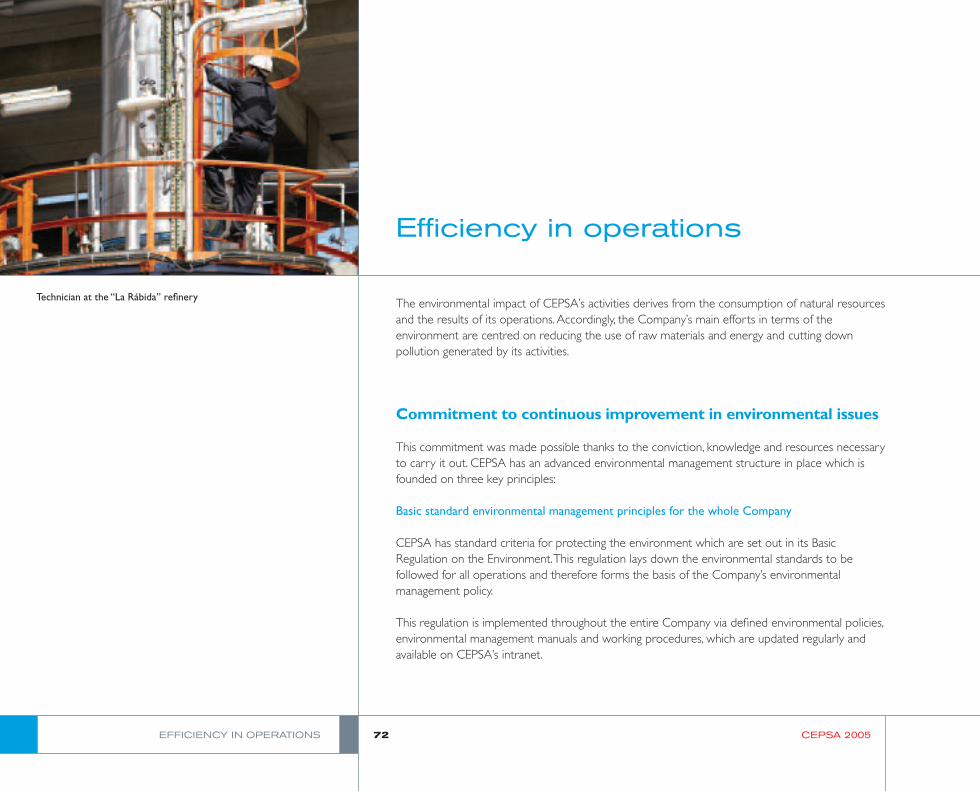
The environmental impact of CEPSA’s activities derives from the consumption of natural resourcesand the results of its operations.Accordingly, the Company’s main efforts in terms of theenvironment are centred on reducing the use of raw materials and energy and cutting downpollution generated by its activities.
Commitment to continuous improvement in environmental issues
This commitment was made possible thanks to the conviction, knowledge and resources necessaryto carry it out. CEPSA has an advanced environmental management structure in place which isfounded on three key principles:
Basic standard environmental management principles for the whole Company
CEPSA has standard criteria for protecting the environment which are set out in its BasicRegulation on the Environment.This regulation lays down the environmental standards to befollowed for all operations and therefore forms the basis of the Company’s environmentalmanagement policy.
This regulation is implemented throughout the entire Company via defined environmental policies,environmental management manuals and working procedures, which are updated regularly andavailable on CEPSA’s intranet.
EFFICIENCY IN OPERATIONS 72 CEPSA 2005
Efficiency in operations
Technician at the “La Rábida” refinery
Clear, specific objectives
CEPSA considers that the setting and follow-up of objectives are a key factor to improving itsenvironmental commitments.The Company regularly sets corporate objectives which aresubsequently integrated into the corresponding lines of business and activity centres.
Assignation of responsibilities and resources
CEPSA has a structure specifically designed to continuously improve environmental managementconsisting of the following:
Environmental Safety and Quality Committee (PA.S.CAL)This body answers directly to Technical General Management and its main functions includeupdating the Basic Regulations for Environmental Protection, Safety, Quality, Greenhouse GasManagement and environmental procedures.
PA.S.CAL CommitteeThis Committee is responsible for areas such as periodic reviews of EnvironmentalManagement Systems, Occupational Health and Safety and Quality management and reportsdirectly to Technical General Management.This Department strives to promote continuousimprovement in order to ensure that management systems are adapted to customers’ needsand expectations, that risk identification, assessment and control activities function properly andthat the Company adapts itself to the requirements of the environment in which the businessunits and production centres carry out their activities.
SUSTAINABILITY REPORT 73 EFFICIENCY IN OPERATIONS
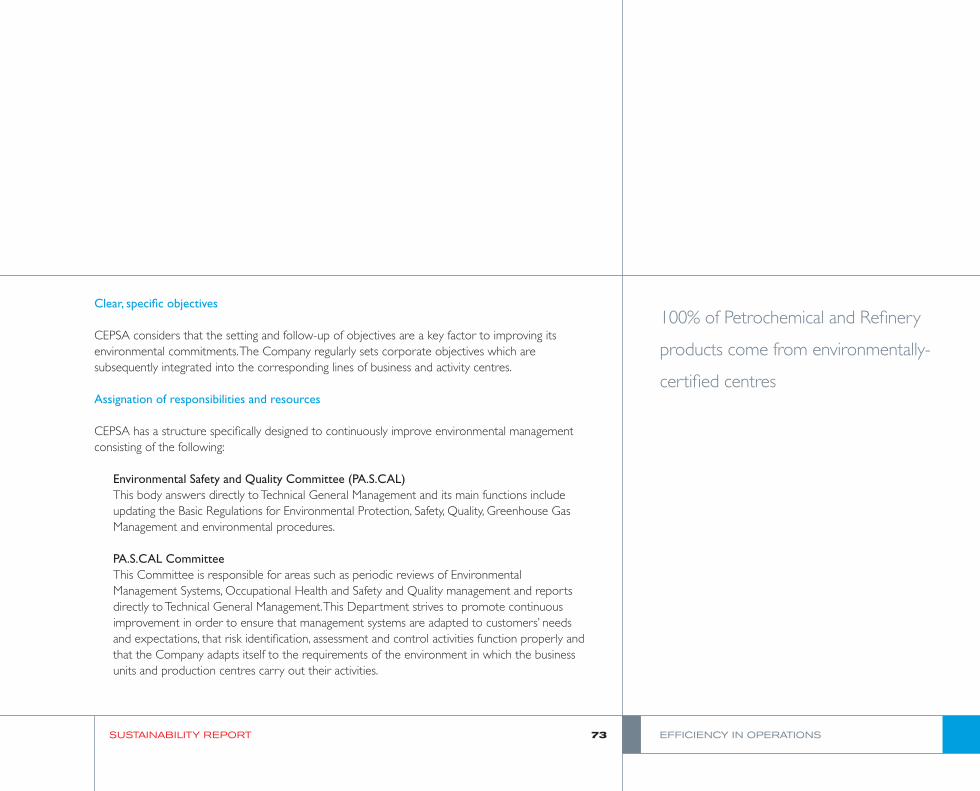
100% of Petrochemical and Refinery
products come from environmentally-
certified centres
Corporate environmental protection managementThe functions of this division, which reports to the Environmental, Safety and QualityCommittee (PA.S.CAL), include the enhancement, development and application of CEPSApolicies and regulations in relation to environmental protection, the consolidation ofenvironmental costs and the updating of environmental legislation.
Management of PA.S.CAL activities in business units and activity centresThe structure comprises the environmental, safety and quality departments in each of theCompany’s lines of business and activity centres.
Environmental investment
1. Investment trends
During 2005 environmental investment amounted to over Euros 24.8 million. Notable efforts inthe Refining and Marketing and Logistics areas during 2004 have led to a decrease of 38.50% ininvestments compared to the prior year.
EFFICIENCY IN OPERATIONS 74 CEPSA 2005
CEPSA is a pioneer in the voluntary environmentalcertification of its activities and the first Spanishcompany to obtain the ISO 1400I standard andenvironmental accreditation as part of the Eco-Management and Audit Scheme (EMAS).
Currently 100% of CEPSA’s Petrochemical andRefining products are manufactured in productioncentres with environmental certification.A certifiableenvironmental management system is currentlybeing implemented in the Exploration andProduction division, specifically in the RKF andOurhoud oil fields in Algeria and Espinal inColombia.
In the Marketing and Logistics area, 18 centres haveenvironmental control systems in place, 11 of whichare certified.
Environmental management certifications obtainedin 2005 include the ISO 1400I standard awarded toCMD Aeropuertos Canarios, CEPSA Aviación andINTERQUISA Canada.
Investment by areas of activity
%
Refining 41.76Petrochemicals 18.92Exploration and Production 14.78Marketing and Logistics 24.23Other 0.30
Environmental investments
%
Water 18.39Atmosphere 36.04Waste 11.35Volatile Organic Compounds 3.02Land and Groundwater 14.63Noise/other 16.57
2. Principal environmental investments 2005
Exploration and Production
The most significant project in this area is the development and implementation of a newtechnology known as TPS (Thermal Phase Separation) at the Ourhoud oil field in Algeria.Thistechnique enables hydrocarbon contaminants to be separated from solid perforation waste, thusfacilitating appropriate subsequent management13.
Refining
The main investments in the Refining area have aimed to reduce atmospheric emissions from thethree refineries14. Noteworthy investments include those made in the “Tenerife” refinery for themodification of hydrodesulphuration plant I, the adaptation of the Amina plant, the construction ofa new sulphur plant and the installation of electrical frequency converters to improve power plantefficiency.
Marketing and Logistics
The most significant investments in this division are those aimed at environmental riskmanagement in the service station network, for the prevention and control of ground andgroundwater contamination, and in PETROCAN, PROAS and energy subsidiaries.
Petrochemicals
The following key projects have been developed in the Petrochemicals area:
Ô Soundproofing of the compressor warehouse in INTERQUISA San Roque.
Ô Installation of new burners and acidic catalyst absorbers in PETRESA San Roque.
Ô Acquisition of new contamination control equipment and improvement of rainwater control inERTISA.This project was awarded the Buzón Verde environmental prize in 2005.
SUSTAINABILITY REPORT 75 EFFICIENCY IN OPERATIONS
(13) For further information regarding this project see the case study in the “Waste Management” section.(14) Further information regarding CEPSA investments in the section “The production centres and their environment”.
Asphalted road
Ô Improvements at the industrial effluent treatment plant and in the water collection network inINTERQUISA Canada.
Ô Groundwater control system in DETEN.
Ô The paraffin conversion plant to reduce volatile organic compound emissions in PETRESACanada.
Extension of environmental management requirements to suppliers and subcontractors
CEPSA’s environmental management, safety and quality systems also encompass suppliers andsubcontractors.The preventative nature of CEPSA’s policies means that, when endorsing a supplier,their quality control, environmental protection and risk prevention systems must taken intoaccount, amongst other factors.
Resource consumption indicator trends
Energy efficiency
CEPSA’s energy saving policy and programmes have generated reductions in energy consumptionin Refining and Petrochemicals.
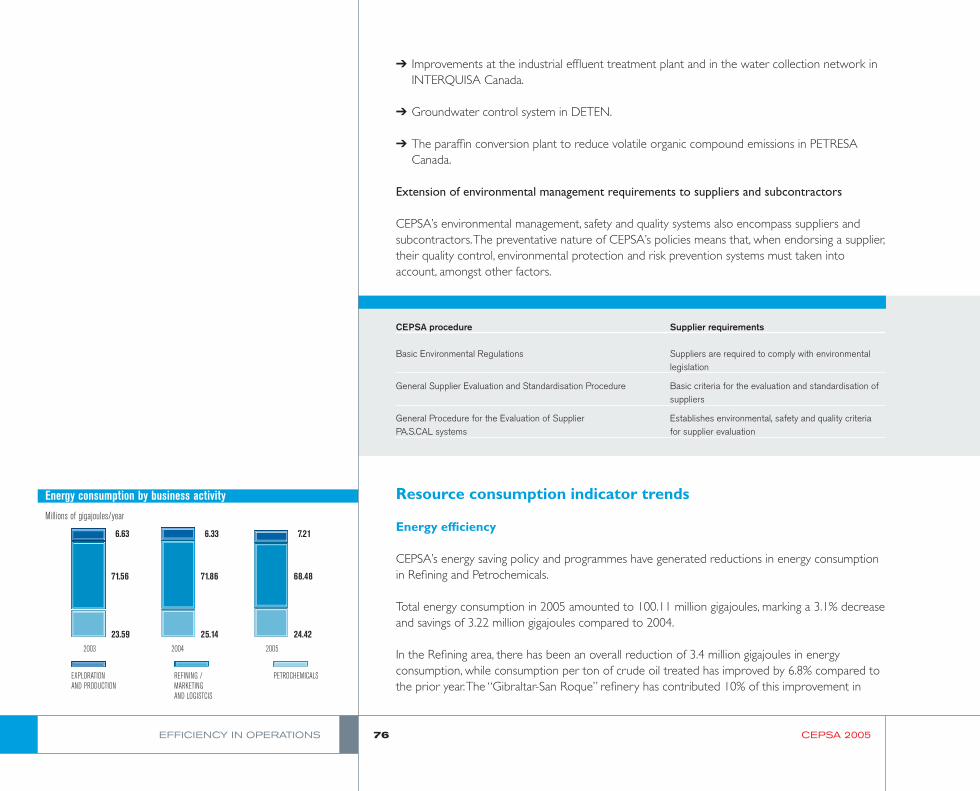
Total energy consumption in 2005 amounted to 100.11 million gigajoules, marking a 3.1% decreaseand savings of 3.22 million gigajoules compared to 2004.
In the Refining area, there has been an overall reduction of 3.4 million gigajoules in energyconsumption, while consumption per ton of crude oil treated has improved by 6.8% compared tothe prior year.The “Gibraltar-San Roque” refinery has contributed 10% of this improvement in
EFFICIENCY IN OPERATIONS 76 CEPSA 2005
CEPSA procedure Supplier requirements
Basic Environmental Regulations Suppliers are required to comply with environmental legislation
General Supplier Evaluation and Standardisation Procedure Basic criteria for the evaluation and standardisation of suppliers
General Procedure for the Evaluation of Supplier Establishes environmental, safety and quality criteria PA.S.CAL systems for supplier evaluation
2003 2004 2005
23.59
6.63
71.56
25.14
6.33
71.86
24.42
7.21
68.48
EXPLORATIONAND PRODUCTION
REFINING /MARKETINGAND LOGISTCIS
PETROCHEMICALS
Energy consumption by business activity
Millions of gigajoules/year
consumption through adjustments in steam generation.The “Tenerife” and “La Rábida” refinerieshave increased their energy consumption, albeit not to a significant extent.
CEPSA cogenerations have been producing electric energy at maximum output, achieving a grossproduction level of 1.9 million MWh in 2005.
In the Petrochemicals area, there has been a reduction of around 3% in both global energyconsumption and energy consumption per ton produced. Petresa San Roque and INTERQUISACanada have contributed significantly to this reduction in consumption, with 10% and 7.4%respectively.
The increase in production in the exploration and production area has caused energyconsumption to rise.
Consumption of Raw Materials
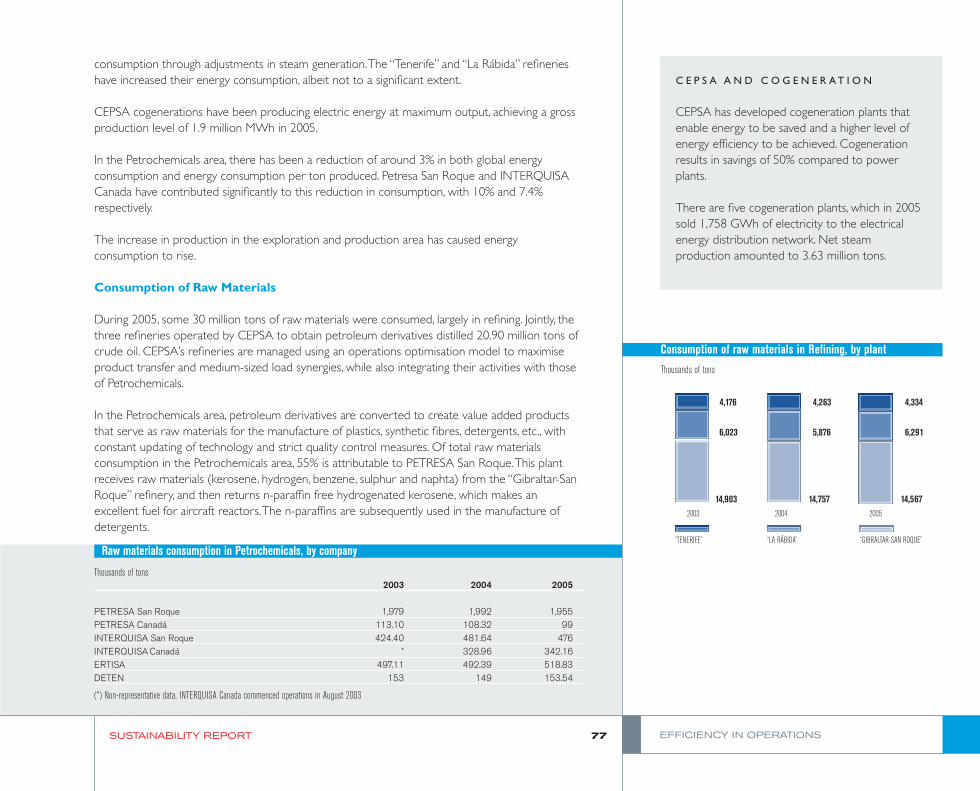
During 2005, some 30 million tons of raw materials were consumed, largely in refining. Jointly, thethree refineries operated by CEPSA to obtain petroleum derivatives distilled 20.90 million tons ofcrude oil. CEPSA’s refineries are managed using an operations optimisation model to maximiseproduct transfer and medium-sized load synergies, while also integrating their activities with thoseof Petrochemicals.
In the Petrochemicals area, petroleum derivatives are converted to create value added productsthat serve as raw materials for the manufacture of plastics, synthetic fibres, detergents, etc., withconstant updating of technology and strict quality control measures. Of total raw materialsconsumption in the Petrochemicals area, 55% is attributable to PETRESA San Roque.This plantreceives raw materials (kerosene, hydrogen, benzene, sulphur and naphta) from the “Gibraltar-SanRoque” refinery, and then returns n-paraffin free hydrogenated kerosene, which makes anexcellent fuel for aircraft reactors.The n-paraffins are subsequently used in the manufacture ofdetergents.
SUSTAINABILITY REPORT 77 EFFICIENCY IN OPERATIONS
C E P S A A N D C O G E N E R A T I O N
CEPSA has developed cogeneration plants thatenable energy to be saved and a higher level ofenergy efficiency to be achieved. Cogenerationresults in savings of 50% compared to powerplants.
There are five cogeneration plants, which in 2005sold 1,758 GWh of electricity to the electricalenergy distribution network. Net steamproduction amounted to 3.63 million tons.
Raw materials consumption in Petrochemicals, by company
2003 2004 2005
PETRESA San Roque 1,979 1,992 1,955PETRESA Canadá 113.10 108.32 99INTERQUISA San Roque 424.40 481.64 476INTERQUISA Canadá * 328.96 342.16ERTISA 497.11 492.39 518.83DETEN 153 149 153.54
(*) Non-representative data, INTERQUISA Canada commenced operations in August 2003
Thousands of tons
2003 2004 2005
14,903
4,176
6,023
14,757
4,263
5,876
14,567
4,334
6,291
“TENERIFE” “LA RÁBIDA” “GIBRALTAR-SAN ROQUE”
Consumption of raw materials in Refining, by plant
Thousands of tons
EFFICIENCY IN OPERATIONS 78 CEPSA 2005
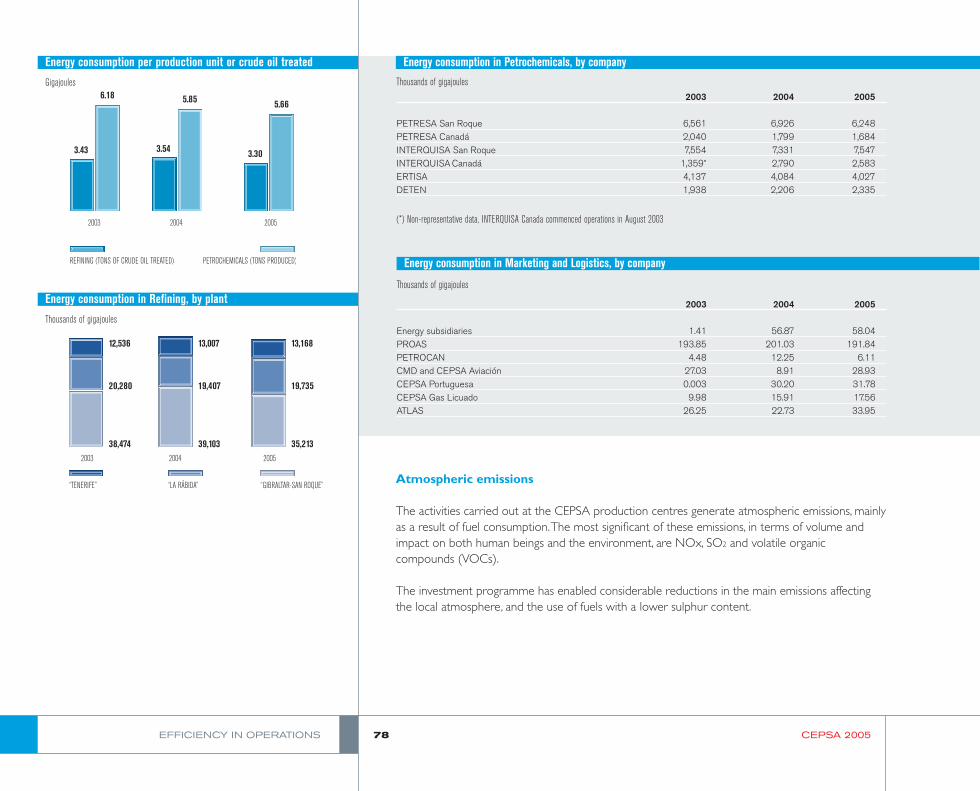
2003 2004 2005
3.43
6.18
3.54
5.85
3.30
5.66
REFINING (TONS OF CRUDE OIL TREATED) PETROCHEMICALS (TONS PRODUCED)
Energy consumption per production unit or crude oil treated
Gigajoules
2003 2004 2005
38,474
12,536
20,280
39,103
13,007
19,407
35,213
13,168
19,735
“TENERIFE” “LA RÁBIDA” “GIBRALTAR-SAN ROQUE”
Energy consumption in Refining, by plant
Thousands of gigajoules
Energy consumption in Petrochemicals, by company
2003 2004 2005
PETRESA San Roque 6,561 6,926 6,248PETRESA Canadá 2,040 1,799 1,684INTERQUISA San Roque 7,554 7,331 7,547INTERQUISA Canadá 1,359* 2,790 2,583ERTISA 4,137 4,084 4,027DETEN 1,938 2,206 2,335
(*) Non-representative data, INTERQUISA Canada commenced operations in August 2003
Thousands of gigajoules
2003 2004 2005
Energy subsidiaries 1.41 56.87 58.04PROAS 193.85 201.03 191.84PETROCAN 4.48 12.25 6.11CMD and CEPSA Aviación 27.03 8.91 28.93CEPSA Portuguesa 0.003 30.20 31.78CEPSA Gas Licuado 9.98 15.91 17.56ATLAS 26.25 22.73 33.95
Energy consumption in Marketing and Logistics, by company
Thousands of gigajoules
Atmospheric emissions
The activities carried out at the CEPSA production centres generate atmospheric emissions, mainlyas a result of fuel consumption.The most significant of these emissions, in terms of volume andimpact on both human beings and the environment, are NOx, SO2 and volatile organiccompounds (VOCs).
The investment programme has enabled considerable reductions in the main emissions affectingthe local atmosphere, and the use of fuels with a lower sulphur content.
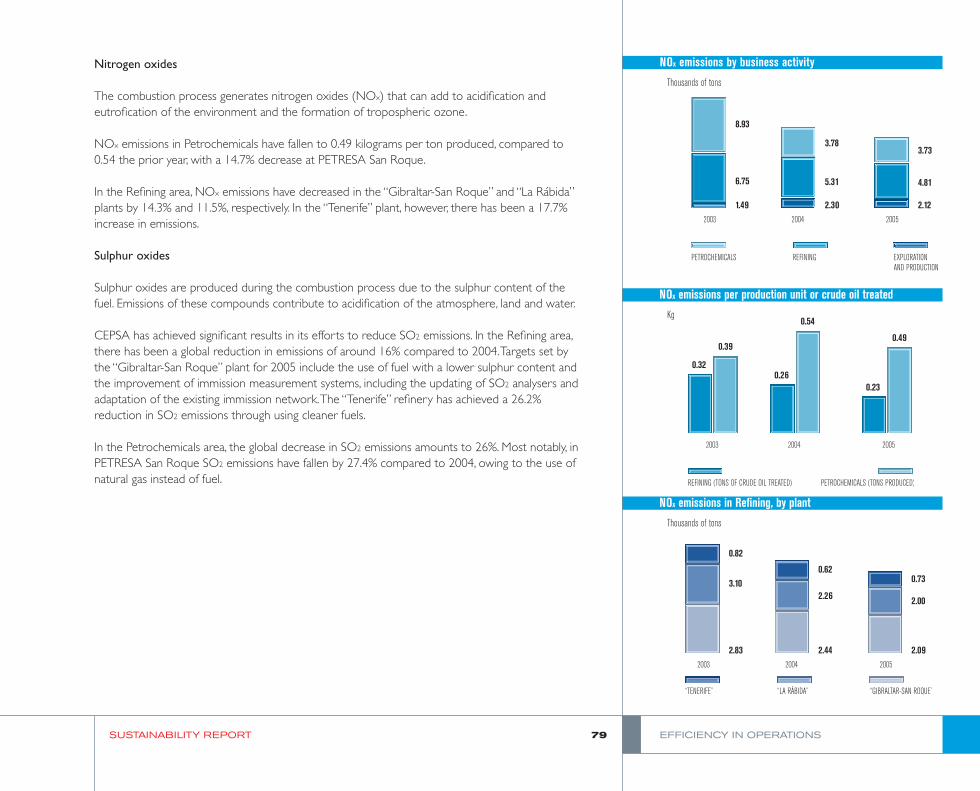
Nitrogen oxides
The combustion process generates nitrogen oxides (NOx) that can add to acidification andeutrofication of the environment and the formation of tropospheric ozone.
NOx emissions in Petrochemicals have fallen to 0.49 kilograms per ton produced, compared to0.54 the prior year, with a 14.7% decrease at PETRESA San Roque.
In the Refining area, NOx emissions have decreased in the “Gibraltar-San Roque” and “La Rábida”plants by 14.3% and 11.5%, respectively. In the “Tenerife” plant, however, there has been a 17.7%increase in emissions.
Sulphur oxides
Sulphur oxides are produced during the combustion process due to the sulphur content of thefuel. Emissions of these compounds contribute to acidification of the atmosphere, land and water.
CEPSA has achieved significant results in its efforts to reduce SO2 emissions. In the Refining area,there has been a global reduction in emissions of around 16% compared to 2004.Targets set bythe “Gibraltar-San Roque” plant for 2005 include the use of fuel with a lower sulphur content andthe improvement of immission measurement systems, including the updating of SO2 analysers andadaptation of the existing immission network.The “Tenerife” refinery has achieved a 26.2%reduction in SO2 emissions through using cleaner fuels.
In the Petrochemicals area, the global decrease in SO2 emissions amounts to 26%. Most notably, inPETRESA San Roque SO2 emissions have fallen by 27.4% compared to 2004, owing to the use ofnatural gas instead of fuel.
SUSTAINABILITY REPORT 79 EFFICIENCY IN OPERATIONS
2003 2004 2005
1.49
6.75
8.93
2.30
5.31
3.78
2.12
4.81
3.73
PETROCHEMICALS REFINING EXPLORATIONAND PRODUCTION
NOx emissions by business activity
Thousands of tons
2003 2004 2005
0.32
0.39
0.26
0.54
0.23
0.49
REFINING (TONS OF CRUDE OIL TREATED) PETROCHEMICALS (TONS PRODUCED)
NOx emissions per production unit or crude oil treated
Kg
2003 2004 2005
2.83
0.82
3.10
2.44
0.62
2.26
2.09
0.73
2.00
“TENERIFE” “LA RÁBIDA” “GIBRALTAR-SAN ROQUE”
NOx emissions in Refining, by plant
Thousands of tons
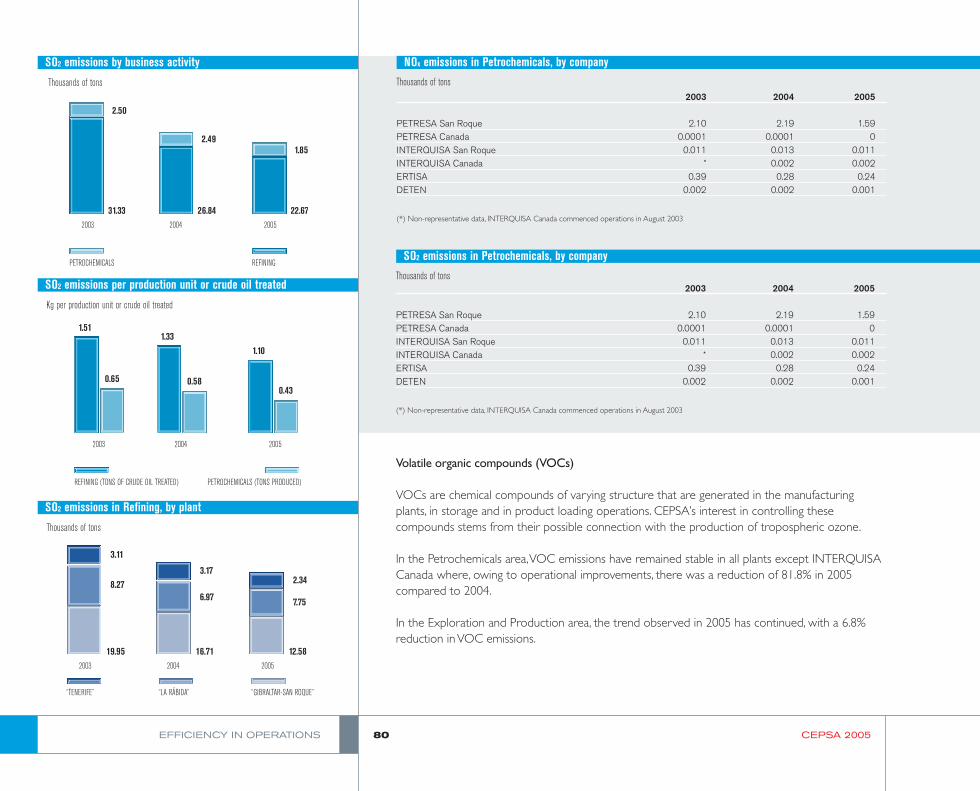
Volatile organic compounds (VOCs)
VOCs are chemical compounds of varying structure that are generated in the manufacturingplants, in storage and in product loading operations. CEPSA’s interest in controlling thesecompounds stems from their possible connection with the production of tropospheric ozone.
In the Petrochemicals area,VOC emissions have remained stable in all plants except INTERQUISACanada where, owing to operational improvements, there was a reduction of 81.8% in 2005compared to 2004.
In the Exploration and Production area, the trend observed in 2005 has continued, with a 6.8%reduction in VOC emissions.
EFFICIENCY IN OPERATIONS 80 CEPSA 2005
2003 2004 2005
19.95
3.11
8.27
16.71
3.17
6.97
12.58
2.34
7.75
“TENERIFE” “LA RÁBIDA” “GIBRALTAR-SAN ROQUE”
SO2 emissions in Refining, by plant
Thousands of tons
2003 2004 2005
1.51
0.65
1.33
0.58
1.10
0.43
REFINING (TONS OF CRUDE OIL TREATED) PETROCHEMICALS (TONS PRODUCED)
SO2 emissions per production unit or crude oil treated
Kg per production unit or crude oil treated
2003 2004 2005
31.33
2.50
26.84
2.49
22.67
1.85
PETROCHEMICALS REFINING
SO2 emissions by business activity
Thousands of tons
NOx emissions in Petrochemicals, by company
2003 2004 2005
PETRESA San Roque 2.10 2.19 1.59PETRESA Canada 0.0001 0.0001 0INTERQUISA San Roque 0.011 0.013 0.011INTERQUISA Canada * 0.002 0.002ERTISA 0.39 0.28 0.24DETEN 0.002 0.002 0.001
(*) Non-representative data, INTERQUISA Canada commenced operations in August 2003
Thousands of tons
SO2 emissions in Petrochemicals, by company
2003 2004 2005
PETRESA San Roque 2.10 2.19 1.59PETRESA Canada 0.0001 0.0001 0INTERQUISA San Roque 0.011 0.013 0.011INTERQUISA Canada * 0.002 0.002ERTISA 0.39 0.28 0.24DETEN 0.002 0.002 0.001
(*) Non-representative data, INTERQUISA Canada commenced operations in August 2003
Thousands of tons
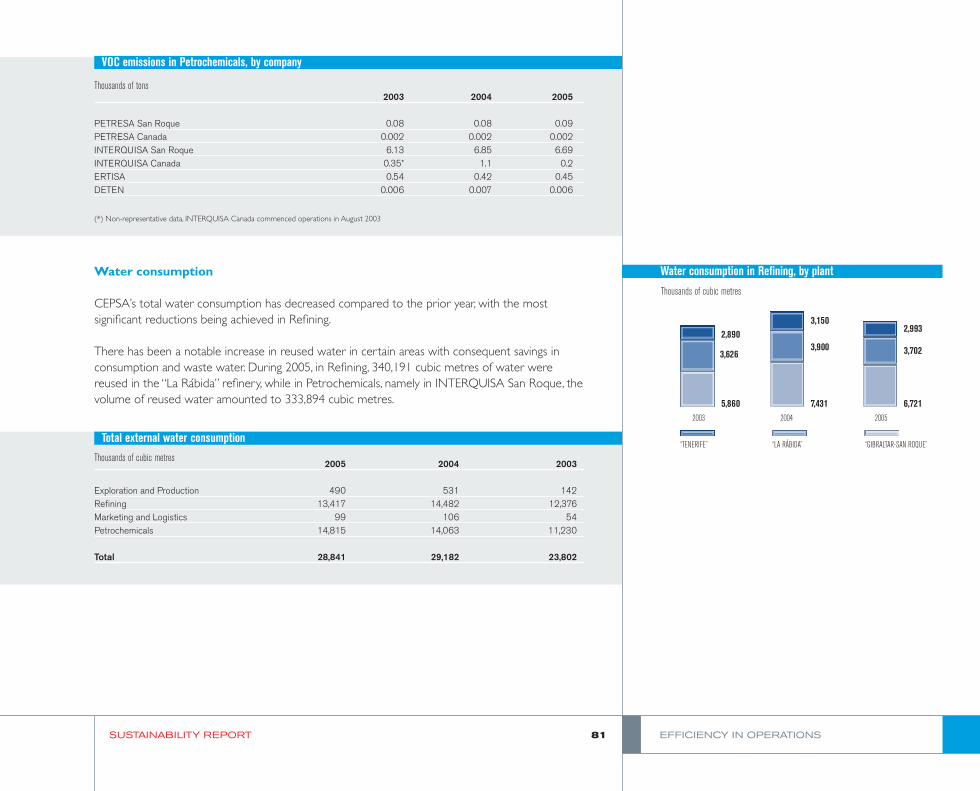
Water consumption
CEPSA’s total water consumption has decreased compared to the prior year, with the mostsignificant reductions being achieved in Refining.
There has been a notable increase in reused water in certain areas with consequent savings inconsumption and waste water. During 2005, in Refining, 340,191 cubic metres of water werereused in the “La Rábida” refinery, while in Petrochemicals, namely in INTERQUISA San Roque, thevolume of reused water amounted to 333,894 cubic metres.
SUSTAINABILITY REPORT 81 EFFICIENCY IN OPERATIONS
2003 2004 2005
PETRESA San Roque 0.08 0.08 0.09PETRESA Canada 0.002 0.002 0.002INTERQUISA San Roque 6.13 6.85 6.69INTERQUISA Canada 0.35* 1.1 0.2ERTISA 0.54 0.42 0.45DETEN 0.006 0.007 0.006
(*) Non-representative data, INTERQUISA Canada commenced operations in August 2003
VOC emissions in Petrochemicals, by company
Thousands of tons
2005 2004 2003
Exploration and Production 490 531 142Refining 13,417 14,482 12,376Marketing and Logistics 99 106 54Petrochemicals 14,815 14,063 11,230
Total 28,841 29,182 23,802
Total external water consumption
Thousands of cubic metres
2003 2004 2005
5,860
2,890
3,626
7,431
3,150
3,900
6,721
2,993
3,702
“TENERIFE” “LA RÁBIDA” “GIBRALTAR-SAN ROQUE”
Water consumption in Refining, by plant
Thousands of cubic metres
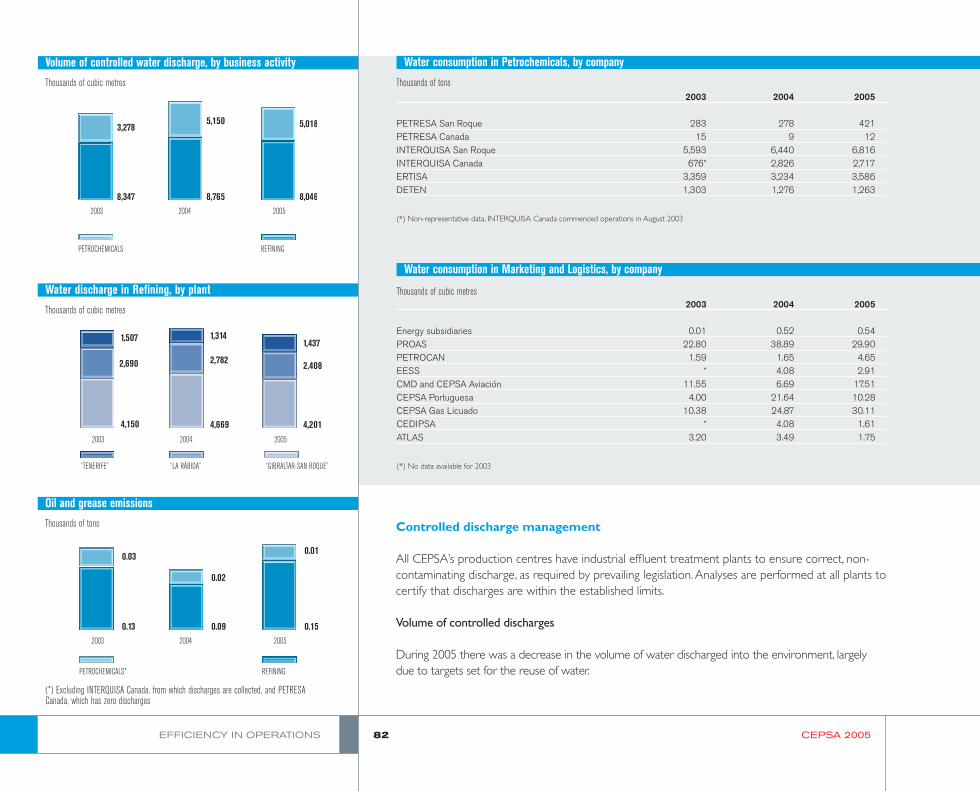
Controlled discharge management
All CEPSA’s production centres have industrial effluent treatment plants to ensure correct, non-contaminating discharge, as required by prevailing legislation.Analyses are performed at all plants tocertify that discharges are within the established limits.
Volume of controlled discharges
During 2005 there was a decrease in the volume of water discharged into the environment, largelydue to targets set for the reuse of water.
EFFICIENCY IN OPERATIONS 82 CEPSA 2005
Water consumption in Petrochemicals, by company
2003 2004 2005
PETRESA San Roque 283 278 421PETRESA Canada 15 9 12INTERQUISA San Roque 5,593 6,440 6,816INTERQUISA Canada 676* 2,826 2,717ERTISA 3,359 3,234 3,586DETEN 1,303 1,276 1,263
(*) Non-representative data, INTERQUISA Canada commenced operations in August 2003
Thousands of tons
2003 2004 2005
Energy subsidiaries 0.01 0.52 0.54PROAS 22.80 38.89 29.90PETROCAN 1.59 1.65 4.65EESS * 4.08 2.91CMD and CEPSA Aviación 11.55 6.69 17.51CEPSA Portuguesa 4.00 21.64 10.28CEPSA Gas Licuado 10.38 24.87 30.11CEDIPSA * 4.08 1.61ATLAS 3.20 3.49 1.75
(*) No data available for 2003
Water consumption in Marketing and Logistics, by company
Thousands of cubic metres
2003 2004 2005
8,347
3,278
8,765
5,150
8,046
5,018
PETROCHEMICALS REFINING
Volume of controlled water discharge, by business activity
Thousands of cubic metres
2003 2004 2005
1,507
4,150
2,690
1,314
4,669
2,782
1,437
4,201
2,408
“TENERIFE” “LA RÁBIDA” “GIBRALTAR-SAN ROQUE”
Water discharge in Refining, by plant
Thousands of cubic metres
2003 2004 2005
0.13
0.03
0.09
0.02
0.15
0.01
PETROCHEMICALS* REFINING
Oil and grease emissions
Thousands of tons
(*) Excluding INTERQUISA Canada, from which discharges are collected, and PETRESACanada, which has zero discharges
SUSTAINABILITY REPORT 83 EFFICIENCY IN OPERATIONS
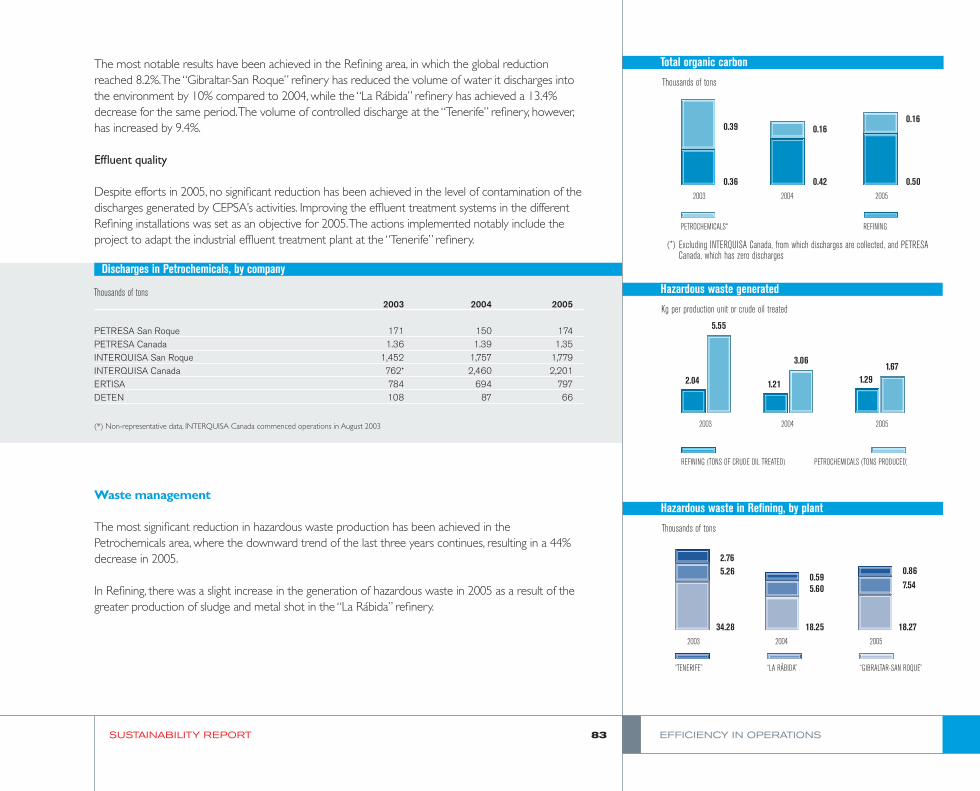
The most notable results have been achieved in the Refining area, in which the global reductionreached 8.2%.The “Gibraltar-San Roque” refinery has reduced the volume of water it discharges intothe environment by 10% compared to 2004, while the “La Rábida” refinery has achieved a 13.4%decrease for the same period.The volume of controlled discharge at the “Tenerife” refinery, however,has increased by 9.4%.
Effluent quality
Despite efforts in 2005, no significant reduction has been achieved in the level of contamination of thedischarges generated by CEPSA’s activities. Improving the effluent treatment systems in the differentRefining installations was set as an objective for 2005.The actions implemented notably include theproject to adapt the industrial effluent treatment plant at the “Tenerife” refinery.
Waste management
The most significant reduction in hazardous waste production has been achieved in thePetrochemicals area, where the downward trend of the last three years continues, resulting in a 44%decrease in 2005.
In Refining, there was a slight increase in the generation of hazardous waste in 2005 as a result of thegreater production of sludge and metal shot in the “La Rábida” refinery.
2003 2004 2005
PETRESA San Roque 171 150 174PETRESA Canada 1.36 1.39 1.35INTERQUISA San Roque 1,452 1,757 1,779INTERQUISA Canada 762* 2,460 2,201ERTISA 784 694 797DETEN 108 87 66
(*) Non-representative data, INTERQUISA Canada commenced operations in August 2003
Discharges in Petrochemicals, by company
Thousands of tons
2003 2004 2005
0.36
0.39
0.42
0.16
0.50
0.16
PETROCHEMICALS* REFINING
Total organic carbon
Thousands of tons
(*) Excluding INTERQUISA Canada, from which discharges are collected, and PETRESACanada, which has zero discharges
2003 2004 2005
2.04
5.55
1.21
3.06
1.291.67
REFINING (TONS OF CRUDE OIL TREATED) PETROCHEMICALS (TONS PRODUCED)
Hazardous waste generated
Kg per production unit or crude oil treated
2003 2004 2005
34.28
2.765.26
18.25
0.595.60
18.27
0.867.54
“TENERIFE” “LA RÁBIDA” “GIBRALTAR-SAN ROQUE”
Hazardous waste in Refining, by plant
Thousands of tons
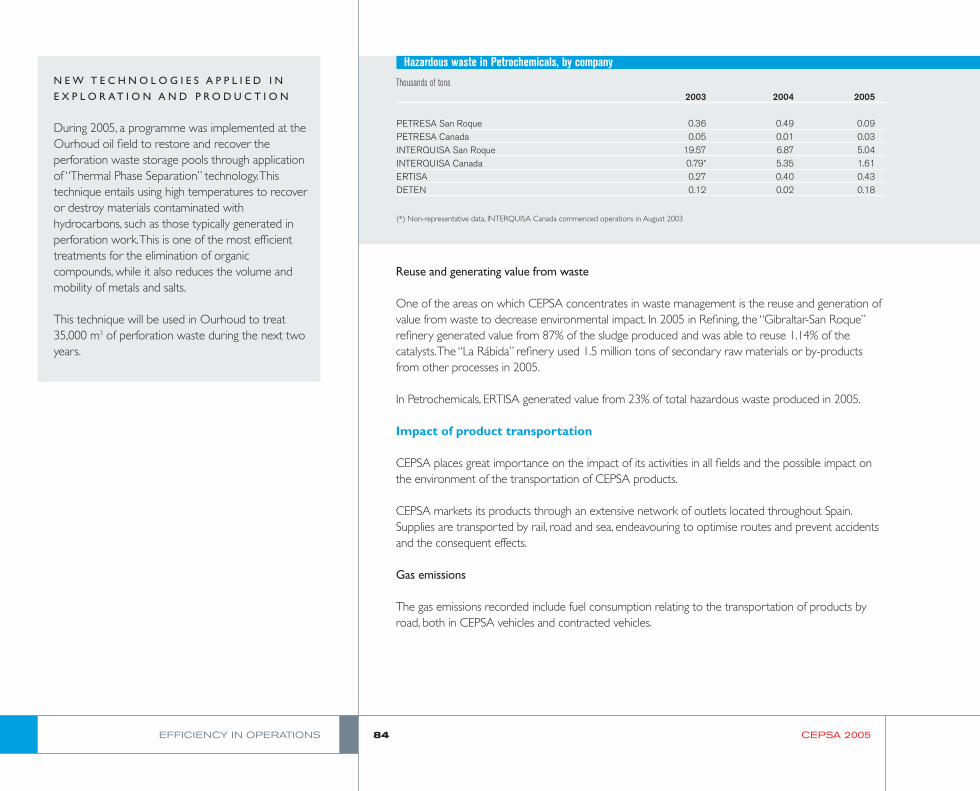
Reuse and generating value from waste
One of the areas on which CEPSA concentrates in waste management is the reuse and generation ofvalue from waste to decrease environmental impact. In 2005 in Refining, the “Gibraltar-San Roque”refinery generated value from 87% of the sludge produced and was able to reuse 1.14% of thecatalysts.The “La Rábida” refinery used 1.5 million tons of secondary raw materials or by-productsfrom other processes in 2005.
In Petrochemicals, ERTISA generated value from 23% of total hazardous waste produced in 2005.
Impact of product transportation
CEPSA places great importance on the impact of its activities in all fields and the possible impact onthe environment of the transportation of CEPSA products.
CEPSA markets its products through an extensive network of outlets located throughout Spain.Supplies are transported by rail, road and sea, endeavouring to optimise routes and prevent accidentsand the consequent effects.
Gas emissions
The gas emissions recorded include fuel consumption relating to the transportation of products byroad, both in CEPSA vehicles and contracted vehicles.
EFFICIENCY IN OPERATIONS 84 CEPSA 2005
Hazardous waste in Petrochemicals, by company
2003 2004 2005
PETRESA San Roque 0.36 0.49 0.09PETRESA Canada 0.05 0.01 0.03INTERQUISA San Roque 19.57 6.87 5.04INTERQUISA Canada 0.79* 5.35 1.61ERTISA 0.27 0.40 0.43DETEN 0.12 0.02 0.18
(*) Non-representative data, INTERQUISA Canada commenced operations in August 2003
Thousands of tonsN E W T E C H N O L O G I E S A P P L I E D I N
E X P L O R A T I O N A N D P R O D U C T I O N
During 2005, a programme was implemented at theOurhoud oil field to restore and recover theperforation waste storage pools through applicationof “Thermal Phase Separation” technology.Thistechnique entails using high temperatures to recoveror destroy materials contaminated withhydrocarbons, such as those typically generated inperforation work.This is one of the most efficienttreatments for the elimination of organiccompounds, while it also reduces the volume andmobility of metals and salts.
This technique will be used in Ourhoud to treat35,000 m3 of perforation waste during the next twoyears.
SUSTAINABILITY REPORT 85 EFFICIENCY IN OPERATIONS
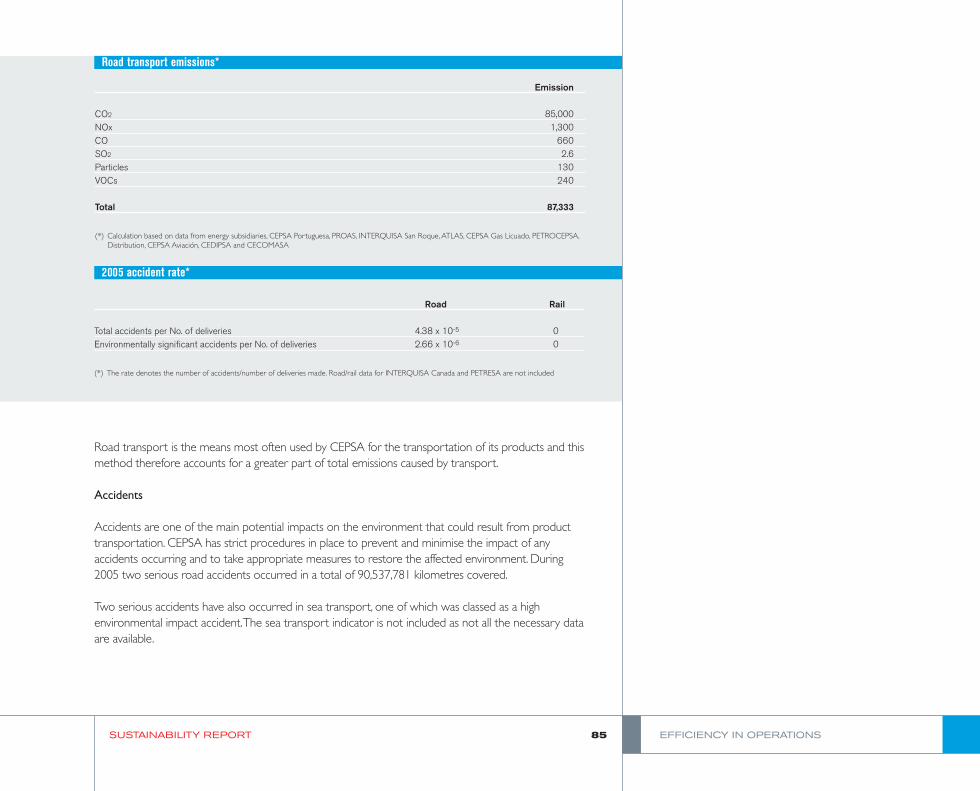
Road transport emissions*
Emission
CO2 85,000NOx 1,300CO 660SO2 2.6Particles 130VOCs 240
Total 87,333
(*) Calculation based on data from energy subsidiaries, CEPSA Portuguesa, PROAS, INTERQUISA San Roque,ATLAS, CEPSA Gas Licuado, PETROCEPSA,Distribution, CEPSA Aviación, CEDIPSA and CECOMASA
Road transport is the means most often used by CEPSA for the transportation of its products and thismethod therefore accounts for a greater part of total emissions caused by transport.
Accidents
Accidents are one of the main potential impacts on the environment that could result from producttransportation. CEPSA has strict procedures in place to prevent and minimise the impact of anyaccidents occurring and to take appropriate measures to restore the affected environment. During2005 two serious road accidents occurred in a total of 90,537,781 kilometres covered.
Two serious accidents have also occurred in sea transport, one of which was classed as a highenvironmental impact accident.The sea transport indicator is not included as not all the necessary dataare available.
Road Rail
Total accidents per No. of deliveries 4.38 x 10⁻⁵ 0Environmentally significant accidents per No. of deliveries 2.66 x 10⁻⁶ 0
(*) The rate denotes the number of accidents/number of deliveries made. Road/rail data for INTERQUISA Canada and PETRESA are not included
2005 accident rate*