Embed Size (px)
DESCRIPTION
Efficiency in Health Care - Cardiac Care in Sweden. R osita Claesson Wigand Project manager (MSc Economics, MPH) National Board of Health and Welfare (NBHW) Department of Statistics and Evaluation - PowerPoint PPT Presentation
Citation preview

Efficiency in Health Care - - Cardiac Care in Sweden
RRosita Claesson Wigandosita Claesson Wigand
Project manager (MSc Economics, MPH)Project manager (MSc Economics, MPH)National Board of Health and Welfare (NBHW)National Board of Health and Welfare (NBHW)Department of Statistics and EvaluationDepartment of Statistics and EvaluationUnit for Performance Assessment Unit for Performance Assessment Telephone : + 46 75 247 37 17Telephone : + 46 75 247 37 17E-mail: E-mail: [email protected]
Nordic Case Mix Conference , Helsinki, June 4, 2010 Nordic Case Mix Conference , Helsinki, June 4, 2010
N a t i o n e l l tNational National StrategyStrategy for Good Care for Good Care
Systematic reviews of evidence-based knowledge
Regulations, National guidelines and priorities
Monitoring and evaluation at national level: transparent
and open comparisons
Steering and systematic work of improvement at local and regional levels
Monitoring and evaluation at local and regional levels
• Regulation on systems for quality and patient safety • Patient Data Act• IT-based documentation• Health Data Registries• National Information Structure• National Terminology• National Indicators
Good Care
Prerequisites
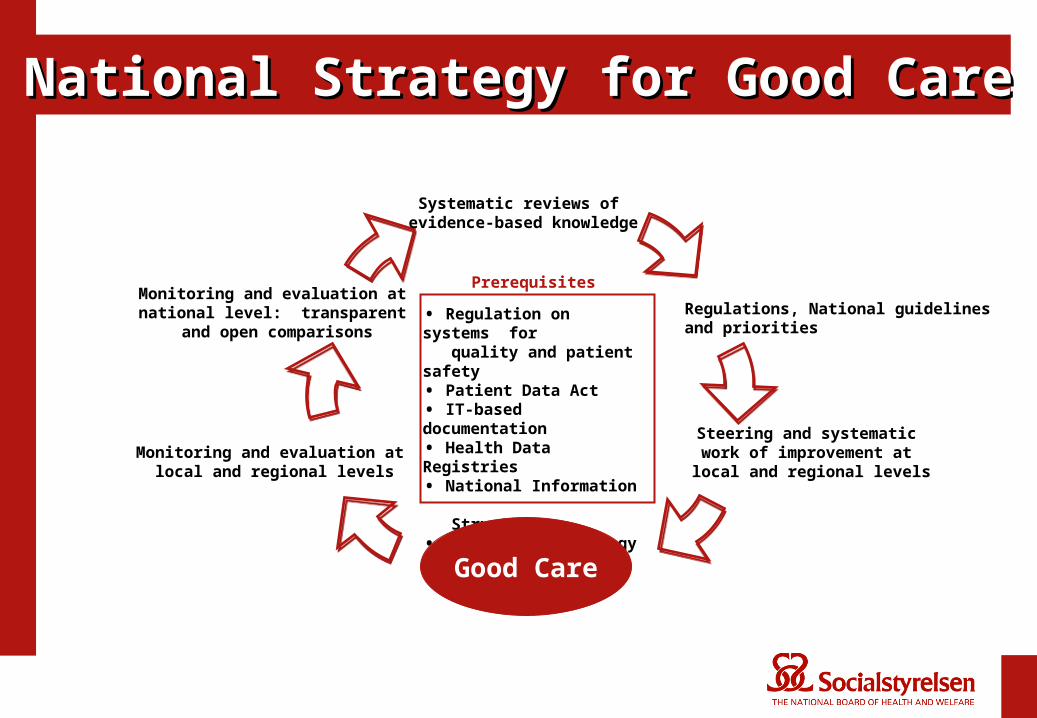
National GuidelinesNational Guidelines
• Evidence based reviews: effectiveness and cost effectiveness
• Recommendations – priority 1 - 10– ”not to do”– R&D
• Indicators• Expected consequences of
implementing the guideline (economic and organisational)
• Different versions
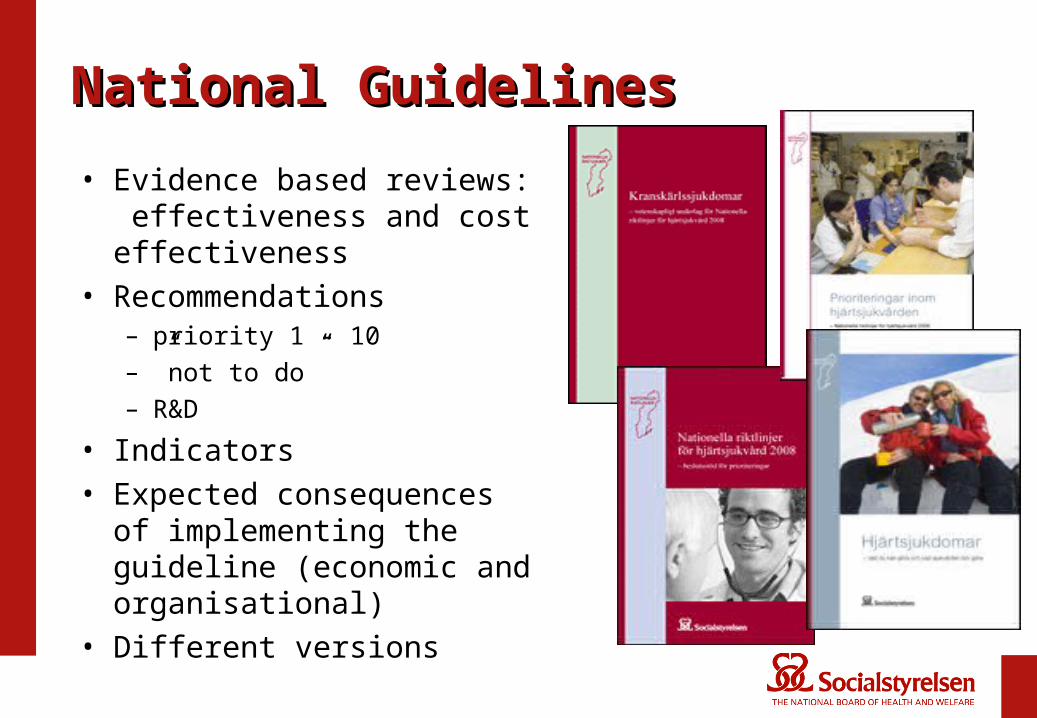
Performance Assessment Framework - Good Care Performance Assessment Framework - Good Care
Efficiency
Costs of CareQuality of Care
SafetyPatient-
centerednessTimeliness EquityEffectiveness
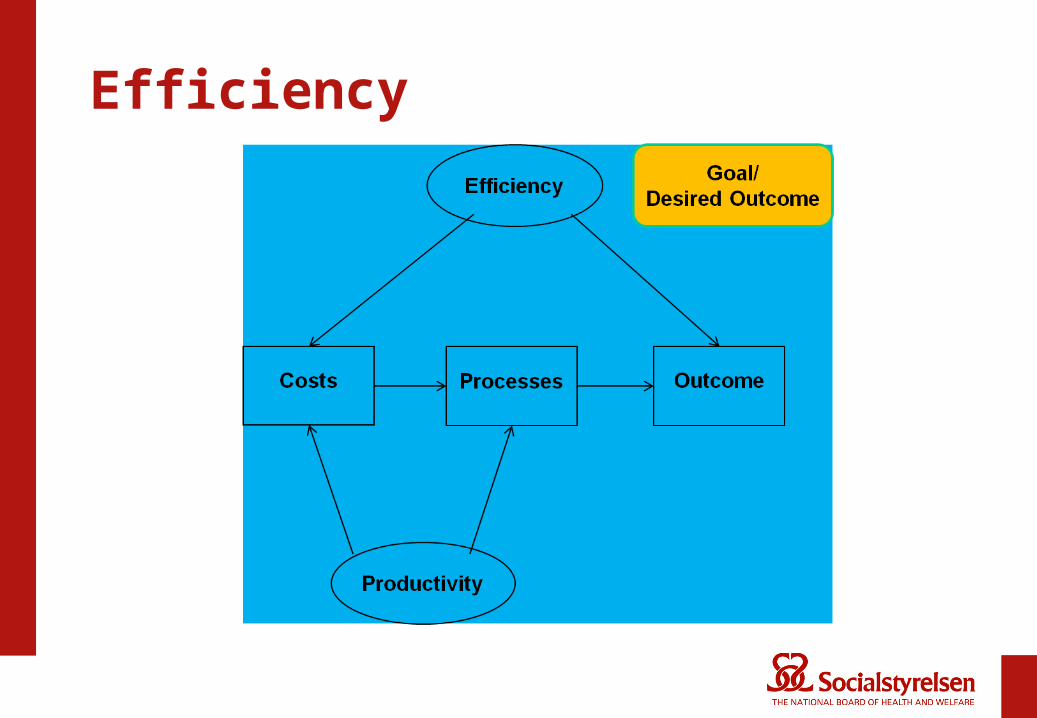
Efficiency
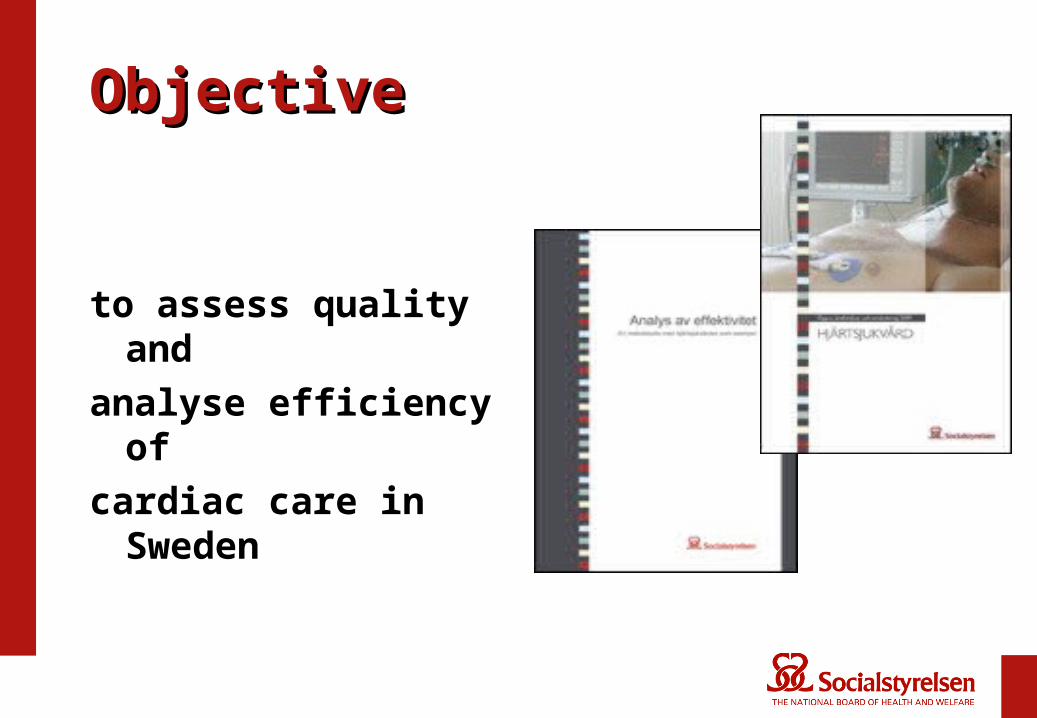
ObjectiveObjective
to assess quality and
analyse efficiency of
cardiac care in Sweden
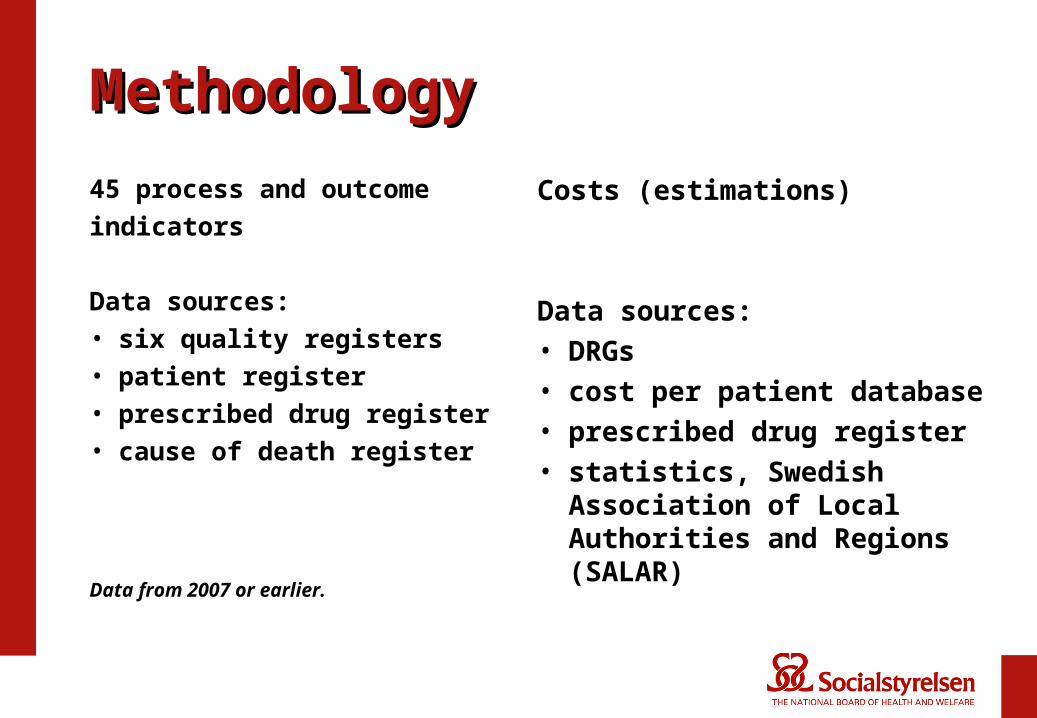
MethodologyMethodology
45 process and outcome
indicators
Data sources:
• six quality registers
• patient register
• prescribed drug register
• cause of death register
Data from 2007 or earlier.
Costs (estimations)
Data sources:• DRGs• cost per patient database• prescribed drug register• statistics, Swedish
Association of Local Authorities and Regions (SALAR)
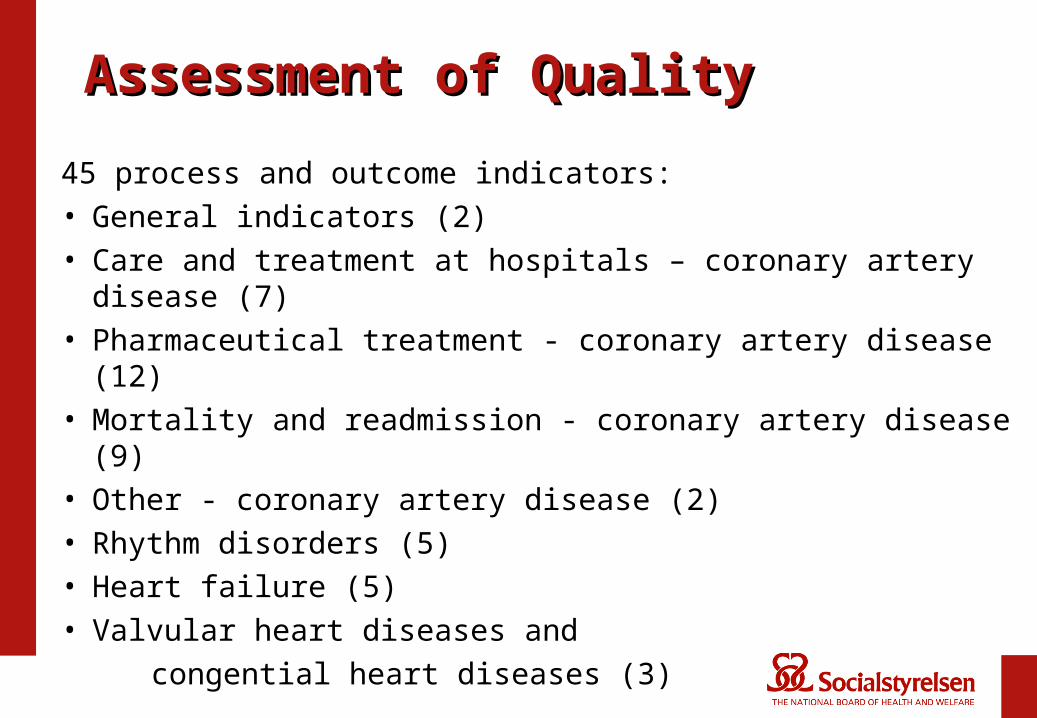
Assessment of QualityAssessment of Quality
45 process and outcome indicators:
• General indicators (2)
• Care and treatment at hospitals – coronary artery disease (7)
• Pharmaceutical treatment - coronary artery disease (12)
• Mortality and readmission - coronary artery disease (9)
• Other - coronary artery disease (2)
• Rhythm disorders (5)
• Heart failure (5)
• Valvular heart diseases and
congential heart diseases (3)
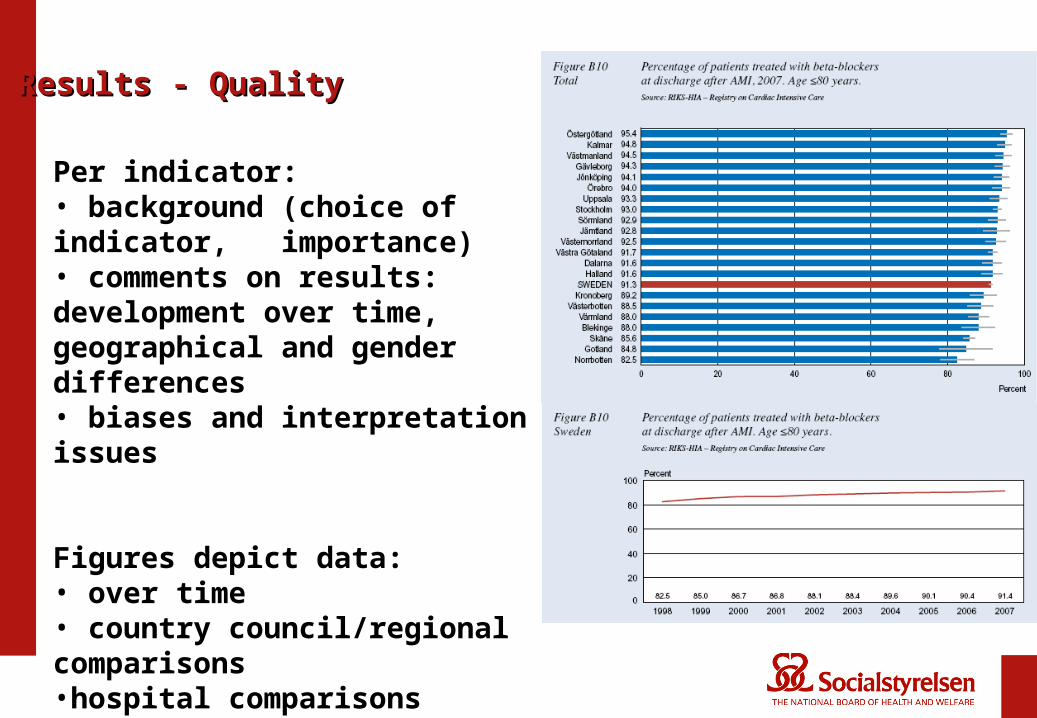
Per indicator: • background (choice of indicator, importance)• comments on results: development over time, geographical and gender differences• biases and interpretation issues
Figures depict data: • over time • country council/regional comparisons•hospital comparisons
Results - QualityResults - Quality
Analysis of Efficiency• How much cardiac care is consumed?
• What are the costs of cardiac care?
• Co-variation between costs and quality of cardiac care?
• What are the costs of not choosing cost-effective interventions/treatments? What are the costs of non-compliance with the National Guidelines? (Inefficient use of resources)
Consumption of cardiac care can only partly be described
• In-patient care (38/50 DRGs in MCD 5 defined as cardiac care: no of cases, total DRG-weight, number of hospital days, ALOS)
• Out-patient visits in specialised hospital care (physicians + surgery)
• Primary health care?
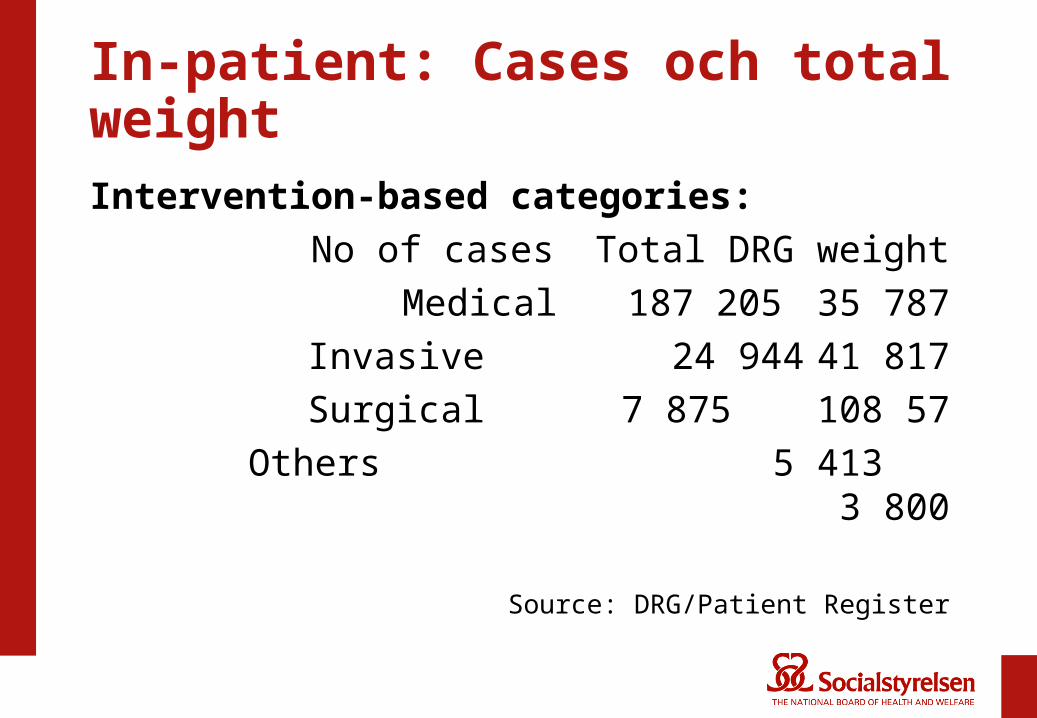
In-patient: Cases och total weight
Intervention-based categories:
No of cases Total DRG weight
Medical 187 205 35 787
Invasive 24 944 41 817
Surgical 7 875 108 57
Others 5 413 3 800
Source: DRG/Patient Register
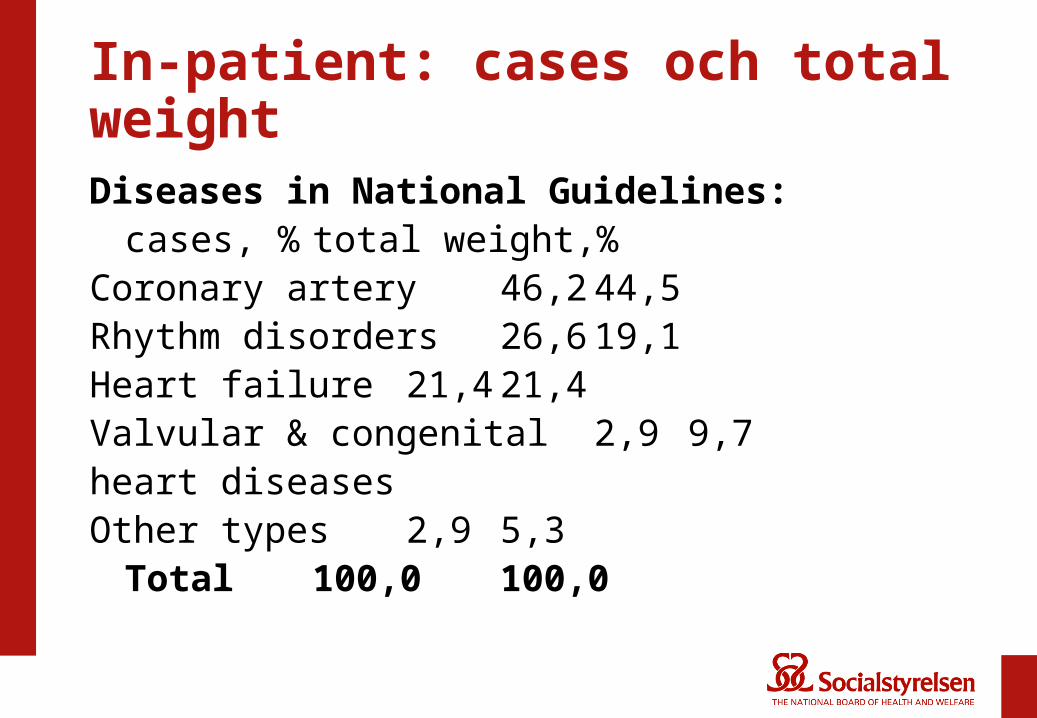
In-patient: cases och total weight
Diseases in National Guidelines: cases, % total weight,%
Coronary artery 46,2 44,5Rhythm disorders 26,6 19,1Heart failure 21,4 21,4Valvular & congenital 2,9 9,7heart diseasesOther types 2,9 5,3
Total 100,0 100,0
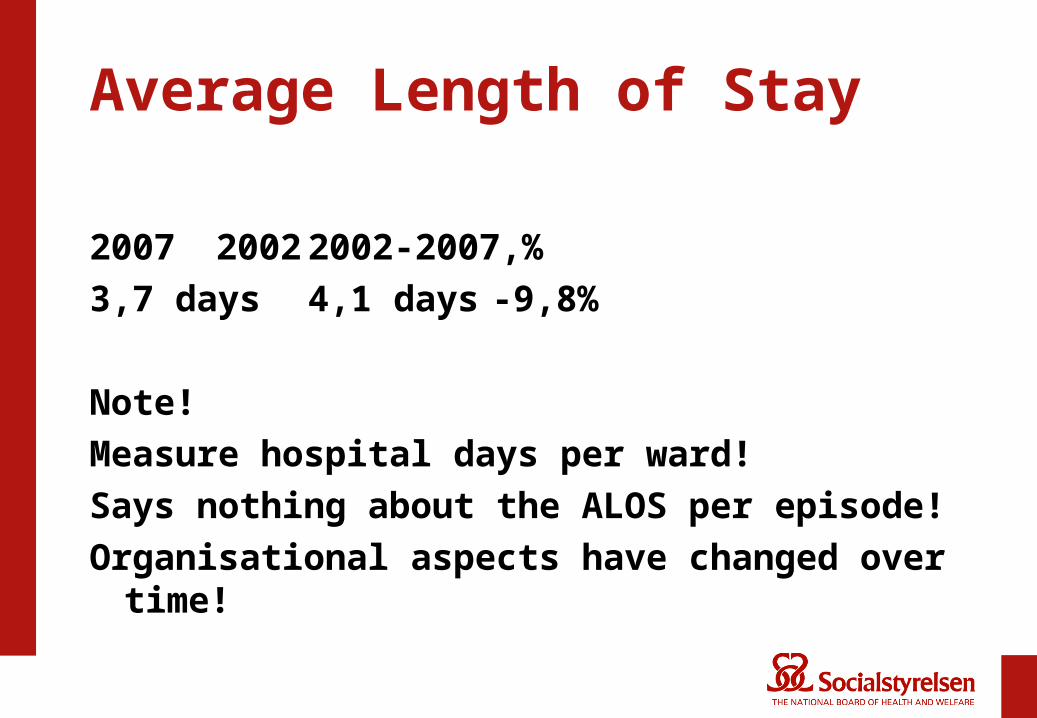
Average Length of Stay
2007 2002 2002-2007,%
3,7 days 4,1 days -9,8%
Note!
Measure hospital days per ward!
Says nothing about the ALOS per episode!
Organisational aspects have changed over time!
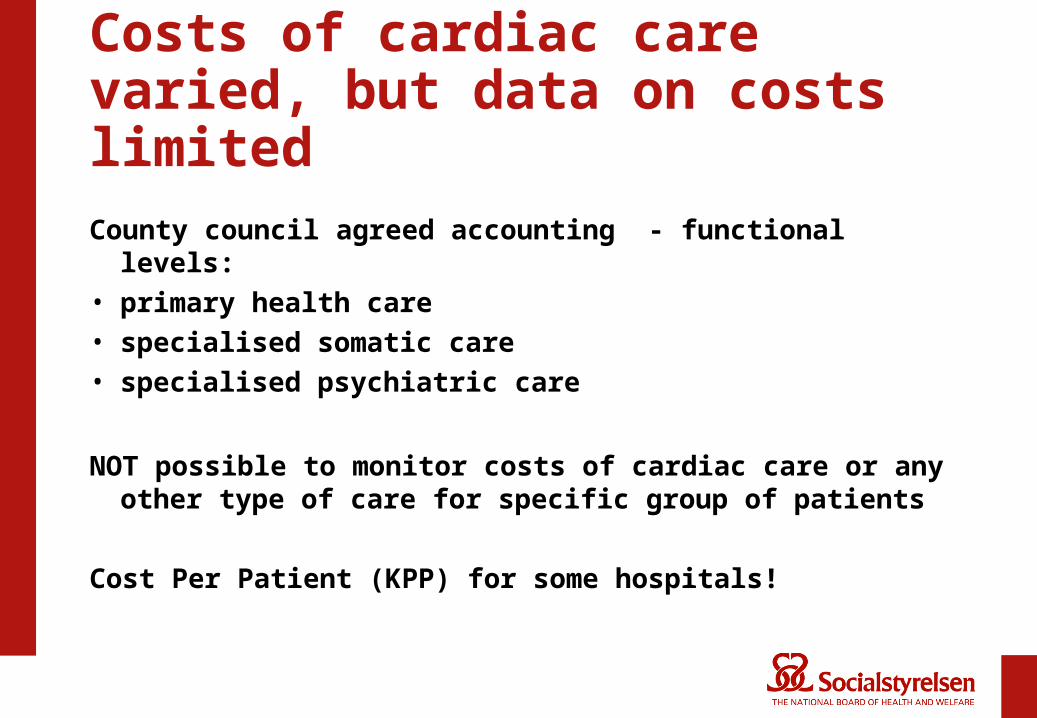
Costs of cardiac care varied, but data on costs limited
County council agreed accounting - functional levels:• primary health care• specialised somatic care • specialised psychiatric care
NOT possible to monitor costs of cardiac care or any other type of care for specific group of patients
Cost Per Patient (KPP) for some hospitals!
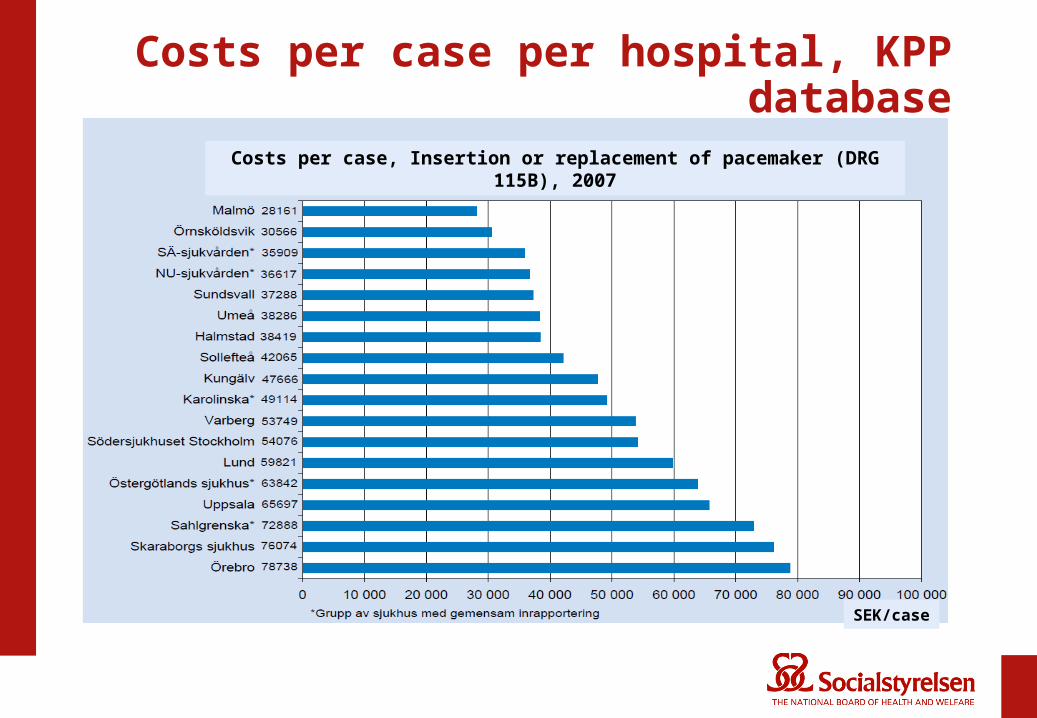
Costs per case per hospital, KPP database
Costs per case, Insertion or replacement of pacemaker (DRG 115B), 2007
SEK/case
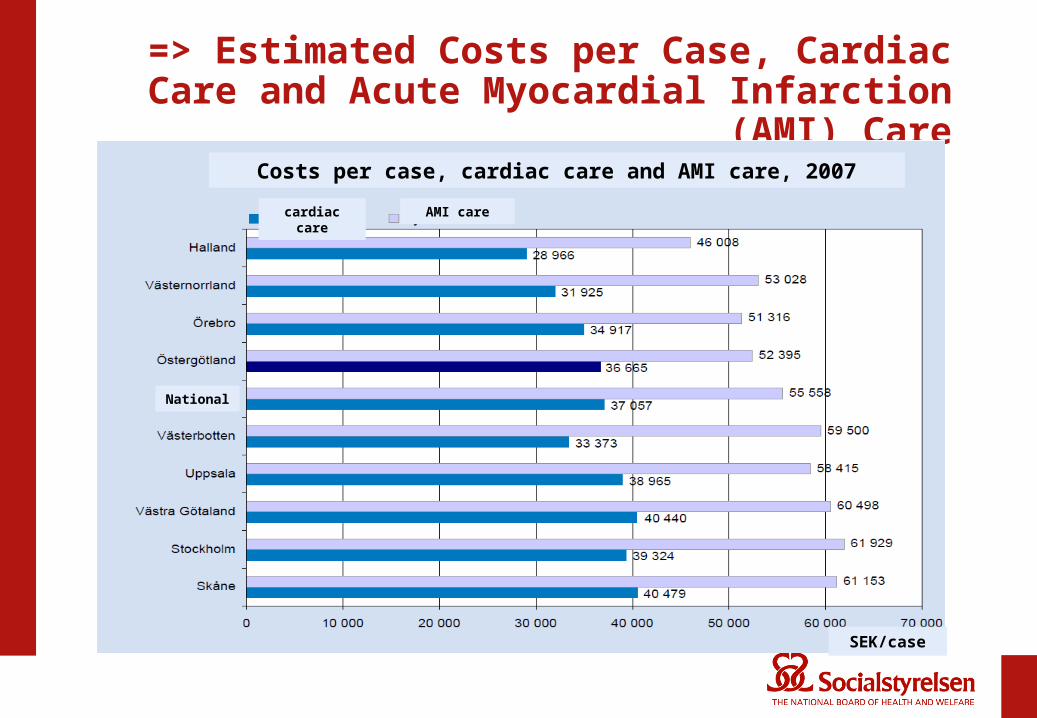
=> Estimated Costs per Case, Cardiac Care and Acute Myocardial Infarction (AMI) Care
Costs per case, cardiac care and AMI care, 2007
SEK/case
cardiac care AMI care
National
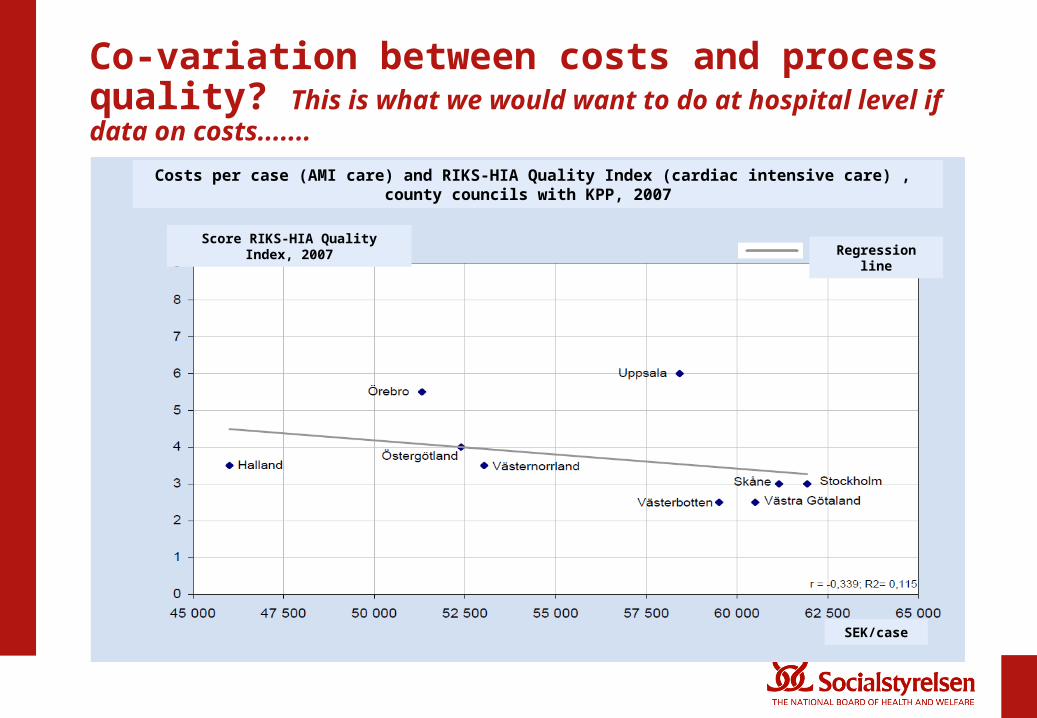
Co-variation between costs and process quality? This is what we would want to do at hospital level if data on costs.......
Costs per case (AMI care) and RIKS-HIA Quality Index (cardiac intensive care) , county councils with KPP, 2007
SEK/case
Regression lineScore RIKS-HIA Quality Index, 2007
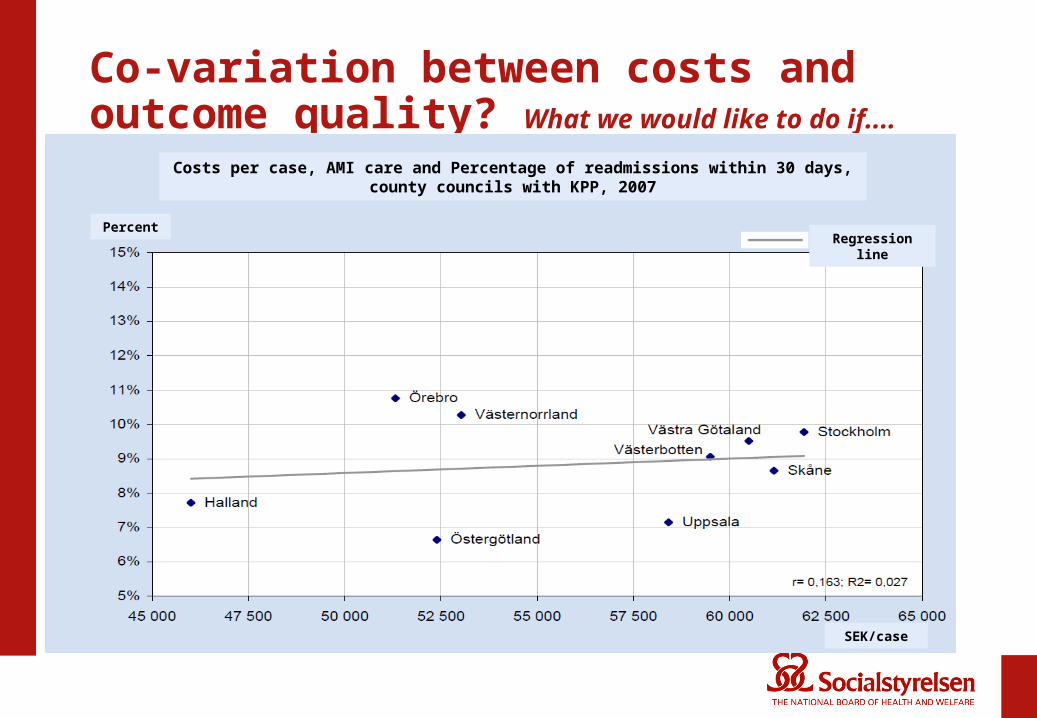
Co-variation between costs and outcome quality? What we would like to do if....
Costs per case, AMI care and Percentage of readmissions within 30 days, county councils with KPP, 2007
PercentRegression line
SEK/case
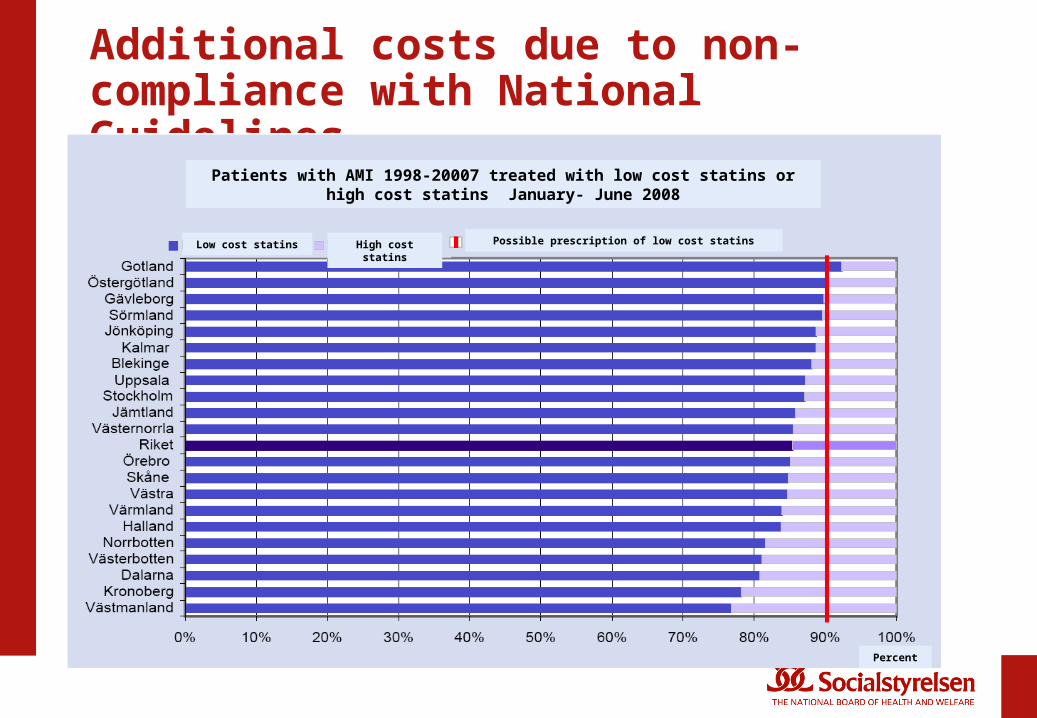
Additional costs due to non-compliance with National Guidelines
Patients with AMI 1998-20007 treated with low cost statins or high cost statins January- June 2008
Low cost statins High cost statins Possible prescription of low cost statins
Percent
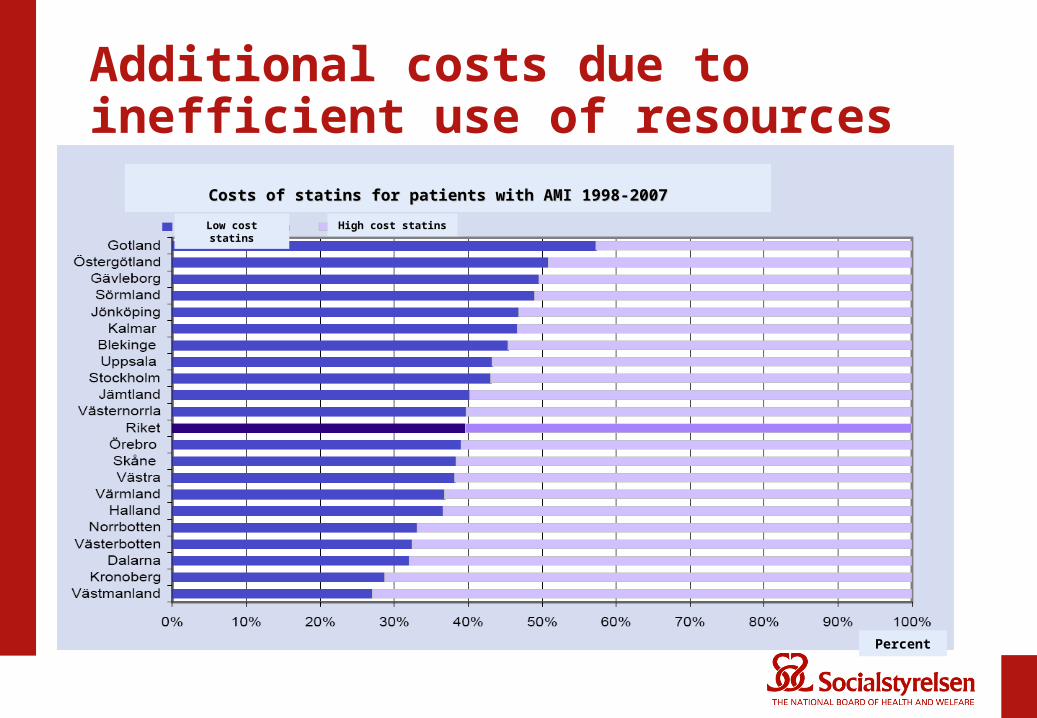
Additional costs due to inefficient use of resources
Costs of statins for patients with AMI 1998-2007Costs of statins for patients with AMI 1998-2007
Percent
Low cost statins High cost statins
Efficiency in cardiac care?
• differences in quality exists • differences in costs exists • no obvious co-variation between costs and
quality? But...........• could use resources more efficiently for
instance by prescribing low-cost (generic) drugs
Efficiency potential.............
.........but which hospital/county council is the most efficient?
Based on existing data it is not possible to determine which hospital/county council has the most efficient cardiac care!
Further developmental work
• Data on specialised out-patient care (not only physicians) and primary health care
• Costs per patient/case (based on unique patient identifier!)
• National health data registers and quality registers: coverage, outcome indicators (quality of life/health), case-mix

Thanks a million!Thanks a million!
More information:
www.socialstyrelsen.se