Embed Size (px)
Citation preview
Efficacy of IP-10 as a biomarker for
the diagnosis of tuberculosis
Ji Young Hong
Department of Medicine
The Graduate School, Yonsei University
Efficacy of IP-10 as a biomarker for the diagnosis of tuberculosis
Directed by Professor Young Sam Kim
The Master's Thesis submitted to the Department of Medicine the Graduate School of Yonsei University
in partial fulfillment of the requirements for the degree of Master of Medical Science
Ji Young Hong
December 2011

This certifies that the Master's Thesis of
Ji Young Hong is approved.
----------------------------------- Thesis Supervisor :Young Sam Kim
------------------------------------ Thesis Committee Member#1: Young Ae Kang
------------------------------------ Thesis Committee Member#2 Sang Nae Cho
The Graduate School
Yonsei University
December 2011

ACKNOWLEDGEMENTS
First of all, I wound like to express my deep and sincere
gratitude to Professor Young-sam Kim, M.D.,Ph.D. for his
supervision and encouraging suggestions throughout my
academic life.
I am deeply indebted to Professor Young-Ae Kang,
M.D.,Ph.D., who leads academic discussions and encourage
me to broaden my horizons.
I am grateful to Professor Sang Nae Cho for his precious
and constructive advices.
I wish to express sincere thanks to Professor Joon Chang,
M.D.,Ph.D., Se Kyu Kim, M.D.,Ph.D., Byung Hoon Park
M.D., Ji Ye Jung M.D., for their helpful advices and
encouragement .
I wish to thank my family who has been with me and always
given me lots of support and love.
<TABLE OF CONTENTS> ABSTRACT ······················································································· ··1
I. INTRODUCTION ············································································ ··3
II. MATERIALS AND METHODS ···················································· ··4
1. Study population ········································································· ··4
2. Tuberculin skin test and IFN-γ determination by QuantiFERON-TB
Gold In-Tube ························································································5
3. IP-10 determination·········································································6
4. Data analysis···················································································6
III. RESULTS ···················································································· ··7
1. Characteristics of the participants···················································7
2. IFN-γ inducible protein (IP-10), Interferon (IFN)-γ release
after antigen stimulation··································································9
3. Serum IP-10 level···········································································12
4.Diagnostic performance of serum IP-10 and antigen dependent
IP-10(IP-10TB-Nil) ····································································12
5.Classification of active TB and LTBI combining the diagnostic
results··15
IV. DISCUSSION ············································································· ·17
V. CONCLUSION ··········································································· ·19
REFERENCES ·················································································· 20
ABSTRACT(IN KOREAN) ····························································· 24
LIST OF FIGURES
Figure 1. The distribution of IP-10 and IFN-γ responses
to Mycobacterium tuberculosis specific antigen ··············· 11
Figure 2. ROC curve analysis for Serum IP-10 and IP-10
release after Mycobacaterium tuberculosis specific antigen
stimulation ··········································································· 13
LIST OF TABLES Table 1. Demographic and clinical characteristics of the
subjects enrolled in the study ············································· 10
Table 2. Interferon (IFN)-γ, IFN-γ inducible protein (IP-10)
release after antigen stimulation and serum IP-10 level in
active TB, latent TB and the healthy control groups ··········· 12
Table 3. Diagnostic performance of Interferon (IFN)-γ, IFN-γ
inducible protein (IP-10) release after antigen stimulation and
serum IP-10 ·········································································· 14
Table 4. Stepwise approach for differentiation between active
TB and LTBI ·········································································· 16
1
ABSTRACT
Efficacy of IP-10 as a biomarker for the diagnosis of tuberculosis
Ji Young Hong
Department of Medicine
The Graduate School, Yonsei University
(Directed by Professor Young-Sam Kim) Background: The aim of this study was to evaluate inducible protein
10 (IP-10) as an additional biomarker for specific tuberculosis (TB)
infection in an area of intermediate TB burden and to evaluate the
ability of IP-10 to distinguish between active TB and latent TB
infection (LTBI).
Method: Eighty individuals were prospectively enrolled: 25 with
active pulmonary TB, 25 household contacts, and 30 healthy controls.
We measured IP-10 in serum and in supernatants from whole blood
stimulated with Mycobacterium tuberculosis-specific antigen. Enrolled
individuals were also tested using a QuantiFERON-TB Gold In-Tube
assay (QFT-GIT) and a tuberculin skin test.
Results: TB antigen-dependent IP-10 secretion (IP-10 TB-Nil) was
significantly increased in the active TB and LTBI groups compared
with controls, but did not differ significantly between the active TB and
the LTBI groups. Serum IP-10 levels were higher in the active TB
group (174.9 pg/ml) than in the LTBI group (102.7 pg/ml, P=0.002).
When the IP-10 response to TB antigen was scored based on receiver
operating characteristic analysis, active TB was predicted with 88%
sensitivity and 90.5% specificity. The QFT-GIT assay showed 96%
2
sensitivity and 81% specificity for active TB. The combination of the
TB antigen-dependent IP-10 response and serum IP-10 level resulted in
81.6% correct classification of active TB or LTBI.
Conclusion: The IP-10 response to TB antigen stimulation may
represent a specific biomarker for TB infection, but does not by itself
distinguish between active TB and LTBI. Serum IP-10 may help to
distinguish active TB from LTBI when used in combination with
another marker.
-------------------------------------------------------------------------------------- Key words: IP-10, IGRA, latent TB infection
3
Efficacy of IP-10 as a biomarker for the diagnosis of tuberculosis
Ji Young Hong
Department of Medicine The Graduate School, Yonsei University
(Directed by Professor Young-Sam Kim)
I. INTRODUCTION
Despite the global effort to reduce the tuberculosis (TB) burden, TB is the
highest infectious cause of mortality and morbidity worldwide, with 1.7
million deaths and 9.4 million incident cases in 2009 alone 1. Efforts to reduce
the TB burden are linked to the development of rapid diagnostic tests for
infection with Mycobacterium tuberculosis .The interferon-γ (IFN-γ) release
assay (IGRA), a recently developed immunodiagnostic test for tuberculosis, is
commercially available as the QuantiFERON-TB Gold In-Tube assay
(QFT-GIT; Cellestis, Australia) and the T-SPOT.TB test (Oxford Immunotec,
UK). Compared with the tuberculin skin test (TST), the IGRA is less
influenced by the BCG vaccine and environmental mycobacterial exposure 2.
However, its sensitivity is suboptimal in immunocompromised patients, and it
is unable to discriminate between active TB and latent TB infection (LTBI)3,4.
The sensitivity of the IGRA can be enhanced by using alternative or additional
biomarkers. In this context, IFN-γ-inducible protein 10 (IP-10) has been
extensively studied in both adults and children 5-9.
IP-10 is produced primarily by monocytes/macrophages and has a role in
trafficking of Th1 lymphocytes to inflamed foci through an interaction with a
CXC chemokine receptor10. High levels of IP-10 were found in the pleural
effusion and lung tuberculosis granuloma of TB patients 11. Previous studies
4
have reported that IP-10 expression following stimulation with M.tuberculosis
is a promising biomarker with high sensitivity for the immunodiagnosis of
tuberculosis infection 5,6.In contrast to IFN-γ, IP-10 expression in response to
TB-specific antigen was not influenced by the ability to respond to mitogens
or by the CD4 cell number in HIV-infected patients 12,13. However, there were
discordant results as to whether IP-10 can distinguish between active TB and
LTBI. Plasma levels of IP-10 were higher in active TB than in LTBI and
showed a reduction at the end of M.tuberculosis treatment14. In addition,
baseline plasma IP-10 and CFP-10-stimulated IP-10 levels were significantly
higher in active TB than in LTBI in patients with rheumatoid arthritis15.
Conversely, TB-specific antigen-stimulated IP-10 could not distinguish
between active TB and LTBI in children diagnosed by IGRA7,16.
The aim of this study was to evaluate IP-10 as an additional biomarker for
specific TB infection in an area with intermediate TB burden and to evaluate
the ability of IP-10 to distinguish between active TB and LTBI. We measured
IP-10 levels in unstimulated serum and after whole blood stimulation with
M.tuberculosis antigen.
II. MATERIALS AND METHODS
1. Study population Participants were recruited from November 2010 to July 2011, after the
protocol was approved by the Severance Hospital Ethics review committee. Eligible subjects consenting to the study were recruited into three groups. Patients older than 20 years of age with suspected active TB based on clinical symptoms and radiographic examinations were included in the active TB group. Individuals with HIV infection, end stage renal disease, or leukaemia/lymphoma and those who had received anti-TB therapy for more than 2 weeks or immunosuppressive therapy, including anti-cancer chemotherapy for malignant disease, within 3 months of enrolment were
5
excluded from the study. For the household contact group, household members who had close contact and lived with a microbiologically confirmed active pulmonary TB patient for longer than 1 month were recruited. None of the household contacts showed clinical symptoms or chest X-ray signs suggestive of active TB. Community controls consisted of healthy adults who were free of TB symptoms and did not have close contact with active pulmonary TB patients. All control subjects had normal chest X-rays, negative AFB smears, and negative cultures. All study subjects gave informed consent to the use of obtained samples.
A. Definitions of active TB, latent TB infection (LTBI), and non-TB
control groups
For the active TB group, the presence of active TB was confirmed by
culture of M. tuberculosis from respiratory specimens; abnormalities
suggestive of tuberculosis on chest X-rays were classified as consolidation,
nodules, or cavities. As no gold standard exists for the diagnosis of LTBI,
household contacts with a positive TST were defined as the LTBI group.
Community controls with negative TST results were defined as the
non-TB control group.
2. Tuberculin skin test and IFN-γ determination by QuantiFERON-TB
Gold In- Tube
A. Tuberculin skin test
A TST was performed by intradermal injection of 2 Tuberculin units of
purified protein derivative (PPD, RT23; Statens Serum Institute,
Copenhagen, Denmark) using the Mantoux method. The induration was
measured 48-72h later, using a cut-off of 10mm for positivity
inimmunocompetent subjects.
6
B. IFN-γ determination by QuantiFERON-TB Gold In-Tube (QFT-GIT)
assay
IFN-γ release assays were performed using a QFT-GIT assay. Briefly, 1ml
of whole blood was collected in each of three tubes pre-coated with saline
(control), M.tuberculosis-specific antigen (ESAT-6, CFP-10, and TB7.7), or
mitogen and incubated for 20 h at 37°C. The plasma supernatant was
collected after centrifugation and stored frozen at −20°C until assayed. The
concentration of IFN-γ was determined using a QFT ELISA. Results were
calculated using QFT-IT software provided by the manufacturer. To
facilitate comparisons with IP-10 levels, IFN–γ results are presented in
pg/ml. One international unit (IU) of IFN-γ corresponds to 50 pg/ml,
according to the National Institute for Biological Standards and Control
(Potter’s Bar, UK) (5, 8).
3. IP-10 determination
The IP-10 level was measured in duplicate in supernatants collected from
the plasma of QTF-GIT tubes and in sera from all participants, using a
commercial ELISA according to the manufacturer’s instructions (R&D
Systems, Minneapolis, MN, USA). The upper limit of IP-10 for the assay
was set at 20,000 pg/ml.
4. Data analysis
Data are expressed as number (percentage) or median and interquartile
range (IQR). The majority of the data did not follow a normal distribution.
Categorical variables were analysed using Pearson’s Chi-square test or
Fisher’s exact test. Continuous variables were analysed using a
Kruskal-Wallis test with Bonferroni correction for multiple comparisons.
The most appropriate cut-off values for serum IP-10 and antigen-stimulated
IP-10 for the detection of active TB disease were established by ROC curve
7
analysis. TB antigen-dependent cytokine secretion was determined as the
difference in cytokine levels between the control tube and the TB
antigen-coated tube. The stimulation ratio was defined as the cytokine
concentration in the plasma of antigen-stimulated whole blood divided by
the cytokine concentration in unstimulated whole blood 7. A P value ≤0.05
was taken to indicate a significant difference. All data were analysed using
GraphPad Prism software (GraphPad, Inc., San Diego, CA, USA) and SPSS
software (version 18.0, SPSS, Inc., Chicago, IL, USA).
III. RESULTS
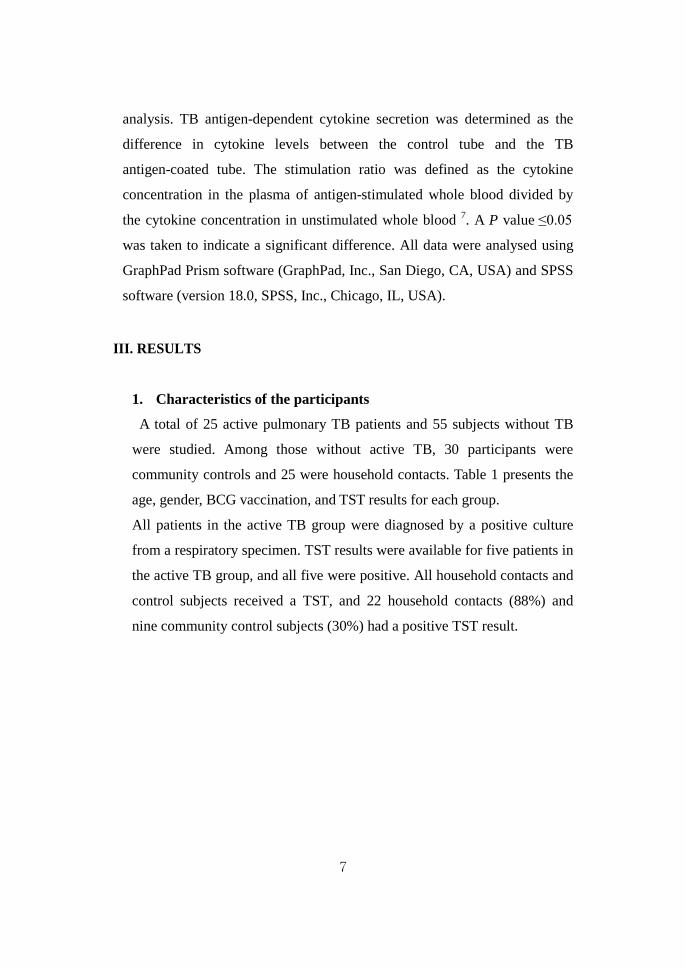
1. Characteristics of the participants
A total of 25 active pulmonary TB patients and 55 subjects without TB
were studied. Among those without active TB, 30 participants were
community controls and 25 were household contacts. Table 1 presents the
age, gender, BCG vaccination, and TST results for each group.
All patients in the active TB group were diagnosed by a positive culture
from a respiratory specimen. TST results were available for five patients in
the active TB group, and all five were positive. All household contacts and
control subjects received a TST, and 22 household contacts (88%) and
nine community control subjects (30%) had a positive TST result.
8
Table 1. Demographic and clinical characteristics of the subjects
Characteristic
Active TB Household Community
controls patients contacts
(n=25) (n=25) (n=30)
Age, years 31.0(29,52) 39(30,48) 30(28,33)
Gender, Male/Female 13/12 5/20 11/19
Body Mass Index 21.1(19.3,23.6) 21.6(20.4,24.0) 21.5(20.7,23.3)
Presence of BCG scar 18(72) 23(92) 26(87)
Prior TB treatment 4(16) 2(8) 0(0)
Co-morbidity
Hypertension 2(8) 0(0) 1(3)
Diabetes mellitus 3(12) 0(0) 1(3)
Others* 4(16) 2(8) 0(0)
Pulmonary TB diagnosis
AFB smear, positive 5 (20)
AFB culture, positive 25 (100)
Extent of lesion in pulmonary TB
One-third of lung field 11(44)
One-half of lung field 10(40)
More than half of lung field 4(16)
TST induration, mm 18(17,19.5) 16(13,20.5) 2.5(0,12)
TST negative 0(0) 3(12) 21(70)
TST positive 5(100)# 22(88) 9(30)
IFN-γ concentration, IU/ml 5.70(1.7,9.8) 2.51(0.91,6.63) 0.02(−0.03,0.11)
QFT-GIT negative 1(4) 3 (12) 26(87)
QFT-GIT positive 24(96) 22(88) 4(13)
Data are presented as the number (percentage) for categorical variables. Continuous variables
are presented as median (interquartile range).* Active TB group: Langerhans cell histocytosis,
thyroid cancer, non-small cell lung cancer, colon cancer. Household contact group: breast
cancer, endometrial cancer. #available for five patients
IQR: interquartile range, BCG: BacilleCalmette-Guerin, AFB: acid-fast bacillus, TST:
tuberculin skin test, IFN-γ: interferon-γ, QFT-GIT: QuantiFERON-TB Gold In-Tube assay
9
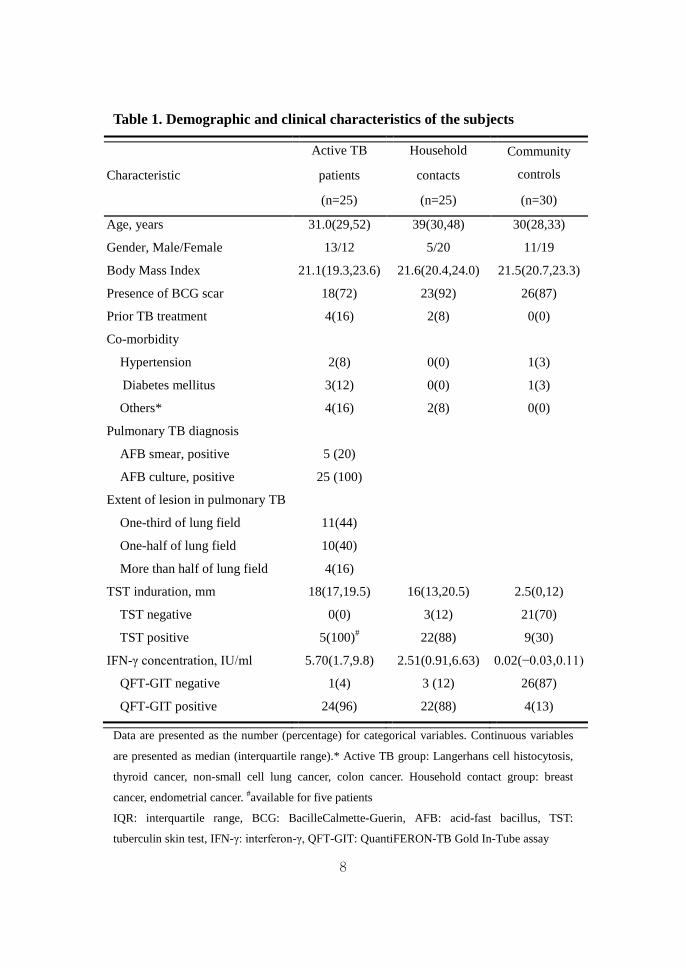
2. IFN-γ-inducible protein (IP-10) and IFN-γ release after antigen
stimulation
Table 2 shows IP-10 and IFN-γ following antigen stimulation in the
active TB, LTBI, and non-TB control groups. The level of IP-10 in the
control tube differed significantly among the three groups, particularly
between the LTBI and non-TB control groups (P=0.019). The median
IFN-γ and IP-10 responses to TB antigen were significantly greater in the
active TB and LTBI groups than in the non-TB group. Neither the IP-10
nor IFN-γ response to TB antigen differed significantly between the active
TB and LTBI groups (IP-10: P=2.29; IFN-γ: P=0.60). Figure 1 shows the
TB antigen-dependent secretion and stimulation ratio of IP-10 and IFN-γ
in the three groups. TB-specific antigen-dependent IP-10 was significantly
higher in the active TB group (median, 20,000 pg/ml; IQR, 9339-20000;
P<0.001) and LTBI group (median, 15,798 pg/ml; IQR, 605820000;
P<0.001) compared with the non-TB group (median, 270pg/ml; IQR,
−42-1412). However, the TB-specific antigen-dependent IP-10 and IFN-γ
responses showed no differences between the active TB and LTBI groups
(P=0.356 and P=0.329, respectively). The stimulation ratio of IP-10 was
increased in the active group (median, 14.06; IQR, 5.93-24.74; P<0.001)
and LTBI group (median, 5.59; IQR, 1.72-21.90; P=0.016) compared with
the non-TB group (median, 1.61; IQR, 0.94-3.02), but did not differ
significantly between the active TB and LTBI groups (P=0.247). Similarly,
the stimulation ratio of IFN-γ failed to differentiate between active TB and
LTBI (P=0.182).

10
Table 2. Interferon (IFN)-γ, IFN-γ inducible protein (IP-10) release after
antigen stimulation, and serum IP-10 levels in active TB, latent TB, and
healthy control groups
Test Active TB group LTBI group Non-TB group
P-value N=25 N=22 N=21
IFN-γ
Nil 6.5(2.8,12.5) 12.3(4.1,36.1) 5(2.3,8.5) 0.079
TB antigen 291.5(122.3,500) 148.8(96.9,500) 8(2.5,16.8) <0.001#
Mitogen 500 (430.5,500) 500(500,500) 500(500,500) 0.144
IP-10
Nil 1151 (723,3233) 2248(750.2,12010) 508.9 (272.3,1635) 0.012†
TB antigen 20000 (11126,20000) 20000 (17076,20000) 965.9(550.5,3232) <0.001‡
Mitogen 15739(6520,20000) 20000(11577,20000) 12308(9273,20000) 0.134
Serum
IP-10 174.9(123.8,368.4) 102.7(72.9,144.5) 71.14 (60.1,111.8) <0.001§
Data are presented as median concentration in pg/ml (interquartile range). #P=0.60 for active TB vs. LTBI, P<0.001 for active TB vs. non-TB, P<0.001 for LTBI vs.
non-TB. †P=0.591 for active TB vs. LTBI, P=0.109 for active TB vs. non-TB, P=0.019 for LTBI vs.
non-TB. ‡P=2.29 for active TB vs. LTBI, P<0.001 for active TB vs. non-TB, P<0.001 for LTBI vs.
non-TB. §P=0.002 for active TB vs. LTBI, P<0.001 for active TB vs. non-TB, P=0.047 for LTBI vs.
non-TB.
TB: tuberculosis; LTBI: latent TB infection.
11
Figure 1. Distribution of IP-10 and IFN-γ responses to Mycobacterium
tuberculosis-specific antigen in QFT-GIT assays, in active TB, LTBI, and
non-TB groups (a, b). Stimulation ratio of IFN-γ and IP-10 in active TB,
LTBI, and non-TB groups (c, d).
Horizontal lines indicate median values. ●, Active TB; ■, Contacts; ▲, Controls. TB Ag -Nil:
MTB antigen-dependent response measured as the difference in cytokine levels between the nil
tube and TB antigen-coated tube. Stimulation ratio: cytokine concentration in the plasma of
antigen-stimulated whole blood divided cytokine concentration in unstimulated whole blood.
IP-10: IFN-inducible protein 10,TB: tuberculosis, LTBI: latent TB infection, IFN-γ, interferon
gamma, QFT-GIT: QuantiFERON®-TB Gold In-Tube assay.
12
3. Serum IP-10 level
The level of serum IP-10 was significantly different among the three
groups. Serum IP-10 was significantly higher in active TB patients
(median, 174.9pg/ml; IQR, 123.8–368.4) than in LTBI subjects (median,
102.7pg/ml; IQR, 72.9–144.5; P<0.05) or non-TB subjects (median,
71.14pg/ml; IQR, 60.1–111.8;P<0.001).
4. Diagnostic performance of serum IP-10 and antigen-dependent
IP-10 (IP-10 TB-Nil)
To evaluate the diagnostic performance of IP-10 for detecting
TB-specific infection, we performed a receiver operating characteristic
(ROC) analysis of serum IP-10 and the antigen-dependent IP-10 response,
comparing the active TB and non-TB groups. We selected cut-off points to
maximize the sum of the sensitivity and specificity. The cut-off points for
best performance were 119.5 pg/ml for serum IP-10 (sensitivity 87.5%,
95% CI 67.6–97.3; specificity 90.5%, 95% CI 69.6–98.8; area under the
curve 0.931, 95% CI 0.86–1.00; P<0.001) (Fig. 2a) and 6168 pg/ml for TB
antigen-dependent IP-10 (sensitivity 88%, 95% CI 68.8–97.5; specificity
90.5%, 95% CI 69.62–98.8; area under the curve0.939, 95% CI 0.86–1.01;
P<0.001) (Fig. 2b).
The rate of positive responders was compared among the active TB, LTBI,
and non-TB control groups using the selected cut-offs for IP-10 and IFN-γ
(Table 3). Based on serum IP-10, the rates of positive responders were
87.5%, 45.5%, and 9.5% in the active TB, LTBI, and non-TB control
groups, respectively. Based on TB antigen-stimulated IP-10, the positive
response rates were 88%, 72.7%, and 9.5% in the respective groups.

13
Figure 2. ROC curve analysis of (a) serum IP-10 and (b) IP-10 release
after Mycobacterium tuberculosis-specific antigen stimulation.
ROC curve analysis was performed using active TB patients and controls as a comparison.
(a) AUC, 0.930 (95% CI, 0.86–1.0, P<0.001) for serum IP-10. (b) AUC, 0.939(95% CI
0.86–1.01, P<0.001) for Mycobacterium tuberculosis antigen-dependent IP-10 release.
14
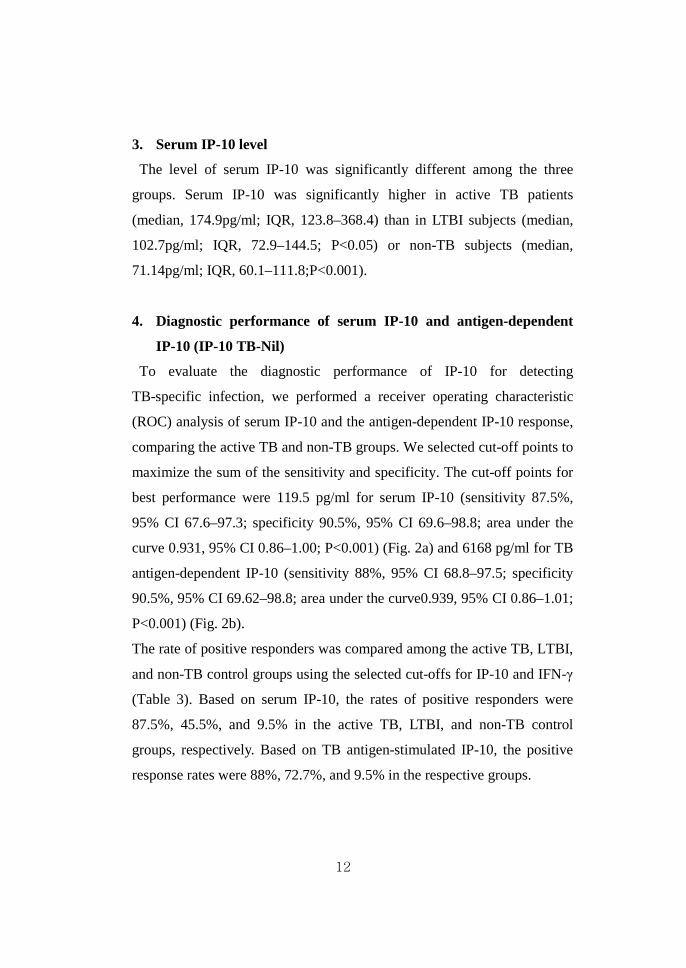
Table 3. Diagnostic performance of interferon (IFN)-γ, IFN-γ inducible
protein (IP-10) release after antigen stimulation, and serum IP-10
Test Active TB group LTBI group Non-TB group
P value
N=25 N=22 N=21
QTF-GIT <0.001 Positive 24(96) 20 (90.9) 4(19.0)
Negative 1(4) 2 (9.1) 17 (81.0) Serum IP-10 (119.5pg/ml‡)
<0.001 Positive 21(87.5) 10 (45.5) 2 (9.5)
Negative 3(12.5) 12 (54.5) 19 (90.5)
IP-10 release after TB antigen stimulation (6168 pg/ml)
<0.001 Positive 22(88) 16 (72.7) 2(9.5)
Negative 3(12) 6 (27.3) 19 (90.5)
Data are presented as number (percentage).
QFT-GIT: QuantiFERON®-TB Gold In-Tube assay. ‡Serum IP-10 was measured in 24 active TB patients.
15
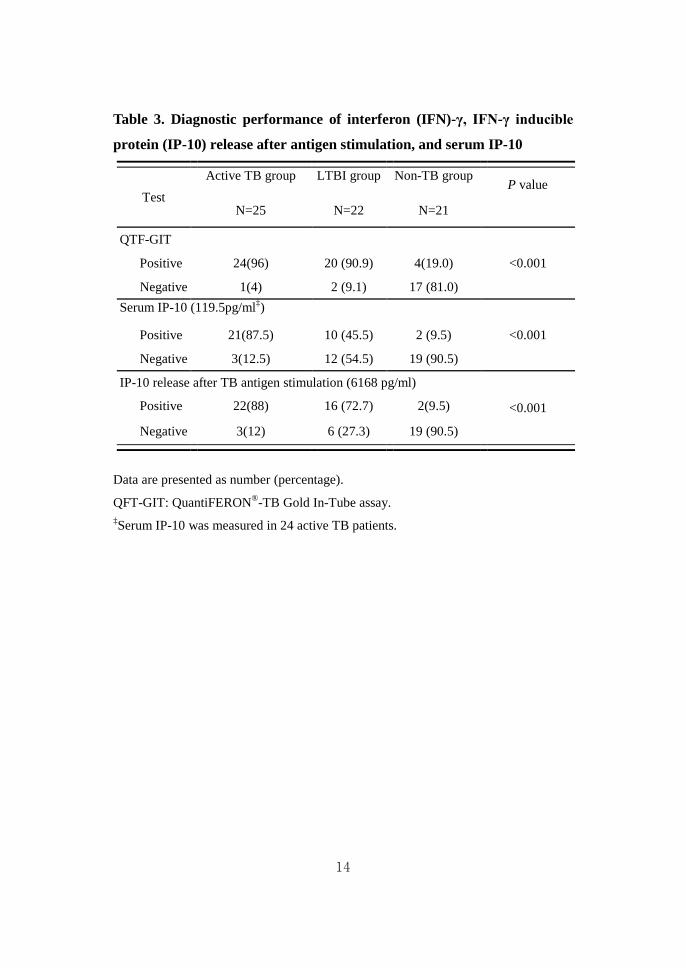
5. Classification of active TB and LTBI combining the diagnostic
results
To classify subjects as active TB or LTBI, the QFT-GIT assay results, TB
antigen-dependent IP-10 levels, and serum IP-10 levels were considered
together (Table 4). Using ROC analysis, two serum IP-10 cut-off values
were obtained to differentiate active TB and LTBI: 106.1pg/ml
(sensitivity 95.8%, 95% CI 78.9–99.9; specificity 54.6%, 95% CI
32.2–75.6) and 139.4 pg/ml(sensitivity 70.8%, 95% CI 48.9–87.4;
specificity 77.3%, 95% CI 54.6-92.2). When a positive QFT-GIT result
and serum IP-10 level of 106.1pg/ml were used together to differentiate
active TB and LTBI, 79.1% (34 of 43) were correctly classified. Using the
TB antigen-dependent IP-10 value and serum IP-10 level of 106.1 pg/ml,
81.6% (31 of 38) were correctly classified as active TB or LTBI.
16
Table 4. Stepwise approach for differentiation between active TB
and LTBI
Positive criteria Active TB LTBI Sensitivity, %
(95% CI)
Specificity,%
(95% CI)
Classified
correctly
QFT-GIT
with serum
IP-10_106.1
23/23
(100)
9/20
(45)
100
(72.2–100.0)
55.0
(39.7–55.0) 79.10%
QFT-GIT
with serum
IP-10_139.4
17/23
(73.9)
5/20
(25)
73.9
(58.0–85.0)
75.0
(56.1–88.2) 74.40%
TB antigen-stimulated
IP-10 with serum
IP-10_106.1
22/22
(100)
7/16
(43.75)
100
(86.8–100)
56.3
(38.1–56.3) 81.60%
TB-Ag stimulated
IP-10 with serum
IP-10_139.4
16/22
(72.7)
3/16
(18.75)
72.7
(57.1–82.3)
81.3
(59.8–94.4) 76.30%
Data are presented as number (percentage), unless otherwise indicated.
LTBI: Latent TB infection, QFT-GIT: QuantiFERON®-TB Gold In-Tube assay, CI:
Confidence interval

17
IV. DISCUSSION
This study demonstrates that IP-10 is a useful immunodiagnostic marker of
M. tuberculosis infection in an area with an intermediate TB burden. We
confirmed previous findings that IP-10 was secreted at high levels following
M.tuberculosis-specific antigen stimulation after TB infection, in a manner
similar to IFN-γ7,15. In addition, the serum IP-10 level differed among the
active TB, LTBI, and non-TB control groups.
IP-10, a member of the CC-chemokines, is increased in monocytes and
polymorphonuclear granulocytes following M.tuberculosis infection 17.
Increased IP-10 levels have also been identified in autoimmune disorders,
including systemic lupus erythematosus18, autoimmune hepatitis, primary
biliary cirrhosis 19, bronchial asthma 20, and atopic dermatitis 21.
Distinct from the assumption that IP-10 may reflect only inflammation and
may be too non-specific to be used alone in diagnosing tuberculosis, Ruhwald
et al. reported that the IP-10 response to M.tuberculosis-specific antigen could
be used to diagnose tuberculosis infection 5. Similarly, the present study
demonstrated that the area under the ROC curve for TB antigen-stimulated
IP-10 (0.939, 95% CI 0.86–1.01; P<0.001) was as high as that for IFN-γ
(0.962, 95% CI0.90–1.012;P<0.001). The sensitivity was similar between
IFN-γ and TB antigen-stimulated IP-10 in active TB patients (Table 3), but
TB antigen-stimulated IP-10 was not able to discriminate between active and
latent TB infection. Our results agree with previous studies demonstrating that
the IP-10 response to RD1 selected antigen did not differ significantly
between active and latent TB infection 22.
The stimulation ratio, i.e., the positive response to M.tuberculosis antigen
divided by the generalized activation of cytokine-producing cells, also failed
to discriminate between active and latent TB infection. The stimulation ratio
of IFN-γ was higher than that of IP-10 in active TB (IFN-γ, 43.48; IP-10,
18
14.06) and latent TB (IFN-γ, 15.16; IP-10, 5.59) owing to a lower background
level in unstimulated samples. Although the stimulation ratio did not
discriminate between active and latent TB, it may provide a diagnostic marker
of TB infection, being significantly higher in active TB and LTBI compared
with non-TB controls, in a fashion similar to the cytokine levels of TB
antigen.
Our results showed higher background IP-10 levels in whole blood from
LTBI subjects compared with active TB and non-TB subjects. Whittaker and
Lighter reported similar findings in children7,8. This could be explained by the
presence of a chronic inflammation state, evoking the recruitment of
neutrophils, monocytes, and Th1 lymphocytes to control TB infection, in
LTBI subjects. Chen showed that the levels of unstimulated IP-10 in the
control tubes paralleled the occurrence of active TB and the clinical remission
of TB after anti-tuberculosis treatment in rheumatoid arthritis patients15.
Whether high levels of unstimulated IP-10 in whole blood during latent TB
infection can serve as an additional marker to predict the disease status of
tuberculosis requires further evaluation.
It is worthwhile to note the differences in serum IP-10 levels and in
M.tuberculosis-antigen stimulated IP-10 levels among the three different TB
groups. The serum values are the circulating cytokine levels at a given time
point, and the M.tuberculosis-stimulated levels reflect the potential for
M.tuberculosis reactivity by circulating mononuclear cells. Thus, the higher
level of serum IP-10 in the active TB group compared with the LTBI group
represents the progressing inflammatory state of active TB patients. However,
serum IP-10 can be elevated in a number of inflammatory diseases 18-21, and
thus because of its low specificity, the serum IP-10 level alone is insufficient
for diagnosing active TB. When the TB antigen-stimulated IP-10 level and a
serum IP-10 level higher than 106.1pg/ml were used as criteria to differentiate
active TB and LTBI, more than 80% of the subjects were correctly classified,
19
with a sensitivity of 100%. Therefore, the serum IP-10 level may be useful as
part of a panel of diagnostic markers.
This study had some limitations. The sample size was too small to allow
definitive conclusions and to establish cut-off points. Furthermore, the active
TB group included only culture-proven pulmonary TB patients without HIV
infection. Although the serum IP-10 cut-off in the present study (119.5 pg/ml)
was similar to the value (132.8 pg/ml) in a previous study23, the cut-off for TB
antigen-stimulated IP-10 release (6,168 pg/ml) was higher than previously
reported values of 300 pg/ml24 and 673pg/ml25. The discordance among these
levels may be attributable to the different disease activities of patients or the
effects of additional factors such as geographic location and ethnicity. Further
studies in diverse well-defined patient populations are required to elucidate
the diagnostic efficacy of IP-10 and to improve the diagnosis of tuberculosis
by combining IP-10 and IFN-γ assay results.
V. CONCLUSION In conclusion, the present study showed that serum IP-10 and TB
antigen-dependent IP-10 represent complementary markers to IFN-γ in the
diagnosis of M.tuberculosis infection. Additionally, the serum IP-10 level,
which is rapidly and easily detectable by ELISA, may provide an adjunct
marker for differentiating between active TB and latent TB infection.
Although the IP-10 level does not appear to be superior to the IFN-γ level as a
tool for TB diagnosis, IP-10 has potential use as an adjunct biomarker to
enhance diagnostic performance and evaluate disease activity in TB. Further
studies in more diverse populations are required to validate the use of IP-10 as
a diagnostic marker for TB.
20
REFERENCES
1. WHO global tuberculosis control report 2010. Summary. Cent Eur
J Public Health 2010;18:237.
2. Detjen AK, Keil T, Roll S, Hauer B, Mauch H, Wahn U, et al.
Interferon-gamma release assays improve the diagnosis of
tuberculosis and nontuberculous mycobacterial disease in
children in a country with a low incidence of tuberculosis. Clin
Infect Dis 2007;45:322-8.
3. Mandalakas AM, Hesseling AC, Chegou NN, Kirchner HL, Zhu X,
Marais BJ, et al. High level of discordant IGRA results in
HIV-infected adults and children. Int J Tuberc Lung Dis
2008;12:417-23.
4. Lange C, Pai M, Drobniewski F, Migliori GB. Interferon-gamma
release assays for the diagnosis of active tuberculosis: sensible
or silly? Eur Respir J 2009;33:1250-3.
5. Ruhwald M, Bodmer T, Maier C, Jepsen M, Haaland MB,
Eugen-Olsen J, et al. Evaluating the potential of IP-10 and
MCP-2 as biomarkers for the diagnosis of tuberculosis. Eur
Respir J 2008;32:1607-15.
6. Ruhwald M, Bjerregaard-Andersen M, Rabna P, Kofoed K,
Eugen-Olsen J, Ravn P. CXCL10/IP-10 release is induced by
incubation of whole blood from tuberculosis patients with
ESAT-6, CFP10 and TB7.7. Microbes Infect 2007;9:806-12.
7. Whittaker E, Gordon A, Kampmann B. Is IP-10 a better biomarker
for active and latent tuberculosis in children than IFNgamma?
PLoS One 2008;3:e3901.
8. Lighter J, Rigaud M, Huie M, Peng CH, Pollack H. Chemokine

21
IP-10: an adjunct marker for latent tuberculosis infection in
children. Int J Tuberc Lung Dis 2009;13:731-6.
9. Ruhwald M, Dominguez J, Latorre I, Losi M, Richeldi L, Pasticci
MB, et al. A multicentre evaluation of the accuracy and
performance of IP-10 for the diagnosis of infection with M.
tuberculosis. Tuberculosis (Edinb) 2011;91:260-7.
10. Ferrero E, Biswas P, Vettoretto K, Ferrarini M, Uguccioni M, Piali
L, et al. Macrophages exposed to Mycobacterium tuberculosis
release chemokines able to recruit selected leucocyte
subpopulations: focus on gammadelta cells. Immunology
2003;108:365-74.
11. Okamoto M, Kawabe T, Iwasaki Y, Hara T, Hashimoto N, Imaizumi
K,etal.Evaluationofinterferon-gamma,interferon-gamma-inducin
g cytokines, and interferon-gamma-inducible chemokines in
tuberculous pleural effusions. J Lab Clin Med 2005;145:88-93.
12. Goletti D, Raja A, Syed Ahamed Kabeer B, Rodrigues C, Sodha A,
Carrara S, et al. Is IP-10 an accurate marker for detecting M.
tuberculosis-specific response in HIV-infected persons? PLoS
One 2010;5:e12577.
13. Kabeer BSA, Sikhamani R, Raja A. Comparison of interferon
gamma and interferon gamma-inducible protein-10 secretion in
HIV-tuberculosis patients. Aids 2010;24:323-5.
14. Azzurri A, Sow OY, Amedei A, Bah B, Diallo S, Peri G, et al.
IFN-gamma-inducible protein 10 and pentraxin 3 plasma levels
are tools for monitoring inflammation and disease activity in
Mycobacterium tuberculosis infection. Microbes Infect
2005;7:1-8.
15. Chen DY, Shen GH, Chen YM, Chen HH, Lin CC, Hsieh CW, et al.
Interferon-inducible protein-10 as a marker to detect latent and
22
active tuberculosis in rheumatoid arthritis. Int J Tuberc Lung Dis
2011;15:192-200.
16. Yassin MA, Petrucci R, Garie KT, Harper G, Arbide I, Aschalew M,
etal. Can interferon-gamma or interferon-gamma induced
protein-10 differentiate tuberculosis infection and disease in
children of high endemic areas? PLoS One 2011;6:e23733.
17. Ruhwald M, Ravn P. Biomarkers of latent TB infection. Expert
Rev Respir Med 2009;3:387-401.
18. Narumi S, Takeuchi T, Kobayashi Y, Konishi K. Serum levels of
ifn-inducible PROTEIN-10 relating to the activity of systemic
lupus erythematosus. Cytokine 2000;12:1561-5.
19. Nagayama K, Enomoto N, Miyasaka Y, Kurosaki M, Chen CH,
Sakamoto N, et al. Overexpression of interferon
gamma-inducible protein 10 in the liver of patients with type I
autoimmune hepatitis identified by suppression subtractive
hybridization. Am J Gastroenterol 2001;96:2211-7.
20. Brightling CE, Ammit AJ, Kaur D, Black JL, Wardlaw AJ, Hughes
JM, et al. The CXCL10/CXCR3 axis mediates human lung mast
cell migration to asthmatic airway smooth muscle. Am J Respir
Crit Care Med 2005;171:1103-8.
21. Villagomez MT, Bae SJ, Ogawa I, Takenaka M, Katayama I.
Tumour necrosis factor-alpha but not interferon-gamma is the
main inducer of inducible protein-10 in skin fibroblasts from
patients with atopic dermatitis. Br J Dermatol 2004;150:910-6.
22. Goletti D, Raja A, Ahamed Kabeer BS, Rodrigues C, Sodha A,
Butera O, et al. IFN-gamma, but not IP-10, MCP-2 or IL-2
response to RD1 selected peptides associates to active
tuberculosis. J Infect 2010;61:133-43.
23. Su WL, Perng WC, Huang CH, Yang CY, Wu CP, Chen JH.
23
Association of reduced tumor necrosis factor alpha, gamma
interferon, and interleukin-1beta (IL-1beta) but increased IL-10
expression with improved chest radiography in patients with
pulmonary tuberculosis. Clin Vaccine Immunol 2010;17:223-31.
24. Syed Ahamed Kabeer B, Raman B, Thomas A, Perumal V, Raja A.
Role of QuantiFERON-TB gold, interferon gamma inducible
protein-10 and tuberculin skin test in active tuberculosis
diagnosis. PLoS One 2010;5:e9051.
25. Frahm M, Goswami ND, Owzar K, Hecker E, Mosher A, Cadogan
E, et al. Discriminating between latent and active tuberculosis
with multiple biomarker responses. Tuberculosis (Edinb)
2011;91:250-6.
24
ABSTRACT (In Korean)
결핵 감염 진단을 위한 IP-10의 유용성 고찰
< 지도교수 김 영 삼 >
연세대학교 대학원 의학과
홍 지 영
배경: IP-10은 결핵 감염시 염증부위로 활성화된 T 세포와 단핵
구를 모집하는 케모카인이다. IP-10은 IGRA(Interferon–gamma
release assay)의 제한점을 보완하는 새로운 결핵 진단 지표로
서 연구되어 왔으나, 양성 기준과 활동성결핵과 잠복결핵 감별
여부가 아직 불분명하다. 본 연구의 목적은 IP-10의 결핵감염
진단의 유용성을 IFN-γ 와 비교하여 평가하고 활동성 결핵과
잠복결핵을 구분할 수 있는지 알아보는 것이다.
방법: 2010년 11월부터 2011년 7월까지 세브란스병원에 내원한
활동성결핵 환자 25명과 결핵 가족접촉자 25명, 건강인 30명을
대상으로 결핵피부반응검사, IFN– γ, ELISA 를 이용한 결핵항원
자극 IP-10과 혈청 IP-10을 측정하였다. 잠복결핵은 피부반응
검사가 양성인 가족접촉자로, 비결핵군은 피부반응검사가 음성
인 건강인으로 정의하였다.
결과: 결핵특이 항원 반응도는 활동성 결핵과 잠복결핵에서 비
결핵군에 비해 유의하게 증가하였으나 활동성 결핵과 잠복 결핵
사이에는 유의한 차이를 보이지 않았다. 혈청 IP-10 수치는 활
동성결핵(174.9pg/ml)이 잠복결핵보다(102.7pg/ml, P=0.002)
높았다. 결핵특이항원에 대한 IP-10 의 반응도를 ROC 곡선을

25
이용한 분리기준으로 구분했을 때 활동성 결핵에서 88% 의 민
감도와 90.5% 특이도를 보였다. IFN- γ 은 활동성 결핵에 대해
96% 의 민감도와 81% 특이도를 보였다. 결핵특이 항원에 대한
IP-10 과 혈청 IP-10을 통합하였을 때, 활동성 결핵 및 잠복결
핵 중 81.6%을 올바르게 분류할 수 있었다.
결론: 결핵 특이항원 자극 IP-10 수치는 결핵 감염 진단에 특이
한 진단 지표이나 활동성 결핵과 잠복결핵 감염을 구분하지 못
했다. 혈청 IP-10을 다른 지표와 조합했을 때 잠복결핵과 활동
성 결핵 감별에 도움이 될 수 있을 것으로 사료된다.
-------------------------------------------------------------------------------------- 핵심되는 말: 결핵, 인터페론감마유도단백