Embed Size (px)
Citation preview

1
Effectiveness of Virtual Reality Pain Distraction with Head-‐Mounted and Non Head-‐Mounted 3D Displays
Jacqueline E. Pickrell1, Ari Hollander3, Lloyd Mancl1, Howard Rose3, Mark T.
Drangsholt2, Diane Gromala4, and Susan E. Coldwell1, 2
University of Washington Departments of Oral Health Sciences1 and Oral Medicine2, Firsthand Technology Inc. 3, Seattle, WA., Simon Fraser University, Surry, BC. 4
Abstract Cost, bulkiness, and maintenance issues associated with head-‐mounted displays (HMDs) have been significant barriers to the widespread use of virtual reality (VR) for reducing pain in clinical settings. The purpose of the current investigation was to compare the analgesic potency of VR delivered through a lower-‐cost, 3-‐D display mounted on a laptop (DS) to that of VR delivered through HMD. Participants were randomly assigned to one of two VR groups (DS, n=45 or HMD, n = 45) or to a control group not receiving VR (n = 10). Prior to administration of any VR, baseline sensitivity to experimental heat pain delivered to the foot was established. Heat pain was then administered without VR or during VR delivered through either DS or HMD. Both VR groups reported significantly less pain intensity, time spent thinking about pain, and pain unpleasantness compared with the control group. There were no differences in analgesia observed between DS and HMD groups that might have indicated greater efficacy for one type of display over another. There were no significant differences between displays in measures of presence or physical discomfort. Results of this study indicate that both HMD-‐ and DS-‐delivered VR are effective for reducing experimental heat pain. Word Count 200 Key Words –pain analgesia, immersion, presence, distraction, pain therapy

2
Introduction Although advances in medicine have led to the development of numerous opioid analgesics, excess procedural pain continues to be a major point of concern for patients and health professionals. The use of pharmacological analgesics for treatment of pain is limited due to potential side effects -‐-‐ most commonly nausea, cognitive dysfunction, and constipation.3 Virtual reality (VR) distraction therapy has been successfully employed with patients as an alternative or adjunct to opiate medications for reducing pain during wound care and numerous other procedures.2,5,7,8,9,14,15,16,17,23,24,29,30,31,32,33,35,36,37 Burn patients treated with VR report both a reduction in pain and reduced time spent thinking about the pain during debridement procedures. 17 The explanation for the mechanism underlying VR pain control most widely accepted is the “Gate Theory” of attention model.10, 28 Gate Theory postulates that VR reduces the perception of pain by absorbing and diverting attention away from pain. This explanation is supported by findings from an induced pain study19 that compared VR to a non-‐VR control, finding reduced brain activity in pain-‐related brain areas, and increased activity in brain areas associated with cognitive processing. However, despite more than a decade of research demonstrating pain reduction using VR distraction therapy, VR has yet to be adopted by hospitals as a regular protocol for reducing procedural pain. Challenges in practical deployment of VR hardware systems hinder study and proliferation of this technique. Several factors inhibit the widespread use of VR in clinical settings, including the excessive cost and technical limitations involved with use of the head-‐mounted displays (HMDs) typically employed with VR analgesia. Markus et al., 26 conducted a feasibility study of VR pain control with an HMD in a regional burn center and concluded that the positive analgesic affect of the approach is undermined by equipment setup and maintenance requirements, a lack of sufficient on-‐site technical expertise and the effect of time-‐consuming setup on clinic staff.
In an attempt to address these limitations, Firsthand Technology Inc. developed a stereoscopic 3D display, the DeepStream 3D Viewer (DS), using low-‐cost, conventional technologies with the goal of achieving high immersion with the analgesic qualities of more costly HMDs. HMDs can be uncomfortable and are especially problematic for patients with injuries to the head or face. Maani [2008] provides two case studies that demonstrate varying degrees of success using the image generators and optics from an HMD detached from the headband and re-‐mounted on an articulated arm. The DS may be used in a similar manner by mounting the laptop with attached viewer onto a swiveling arm. While still in the developmental phase, the use of readily available, standardized components means that the DS has the potential to deliver an immersive VR experience at significant cost savings compared to the current standard of care using HMDs. The purpose of the current investigation is to test the efficacy of VR analgesia delivered through an alternative to an HMD for reduction of standardized heat pain. Healthy volunteers were randomized to receive pain stimulation without VR or while undergoing VR delivered either through DS or HMD. Comparisons of pain reports are made between the three conditions in order to assess the analgesic effect of DS compared with HMD. Those experiencing VR provided reports of the experience through measures of presence in the virtual world and of physical discomfort. These additional measures permitted further comparisons of the VR experience as viewed through DS compared with HMD.
Methods
Participants One hundred healthy adults between the ages of 18 and 39 years provided both written and oral informed consent using a protocol approved by the University of Washington’s Institutional Review Board (IRB). Inclusion criteria for both male and female participants dictated that they were free of any seizure disorders, currently not taking analgesic medications, and were free from chronic pain disorders.

3
Participants were randomly assigned to one of the two active VR groups (DS, n=45, or HMD, n=45), or to the no distraction Control group (n=10) using randomly permuted blocks of size 3 with 3/7 probability for the two active VR groups and 1/7 probability for the control group for the first 70 subjects, and then randomly permuted blocks of size 2 with equal probability to the two active VR groups for the remaining 30 subjects. A sample size of 45 subjects each in the DS and HMD groups and 10 subjects in the Control group was determined to provide 94% power to detect an effect size of 0.75 and 80% power to detect an effect size as small as 0.6 between the DS and HMD groups based on the Holm’s multiple comparison procedure used in conjunction with analysis of variance at an overall two-‐sided 0.05 significance level 21. Based on the results of Hoffman et al., 20 an effect size of 0.75 corresponds to about a 1 to 1.5 point difference in pain ratings on a 0 to 10 scale.
General Procedure Experimental procedures took place in the Oral Medicine dental clinic at the University of Washington in Seattle. Procedures were conducted when clinic was not in session in an isolated dental operatory. Subjects were seated in an upright position in a standard dental chair for the duration of study procedures. Heat pain stimulation was delivered using a commercially available thermal stimulator, the Pathway pain and sensory evaluation system (Medoc, Israel), fitted with a 30 X 30mm square surface
thermode. The psychophysical method of ascending limits was first used to determine each participant’s temperature tolerance threshold for noxious heat stimulation at baseline, prior to the use of any VR. The Medoc thermode was used to delivered noxious heat to the dorsal surface of the right foot. The starting level of heat was 43¡C. This temperature was delivered first for 7 seconds in order to acclimate the participant to the stimulus. Subsequent stimulations were 30 seconds in duration. After each heat stimulation, participants were asked to rate their “worst pain” using a 0-‐10 graphic rating scale. If participants agreed to increase the level of heat stimulation, additional 30-‐second heat stimuli, each 1¡C greater than the previous stimulus, were administered until a level of heat stimulus of “painful but tolerable” or a maximum temperature of 49°C was reached. A two-‐minute rest period was employed between each pain rating and the administration of the next heat level. This determined tolerance threshold served as the pain stimulus temperature during the intervention phase of the study. Participants then sat quietly for two minutes prior to initiation of study procedures specific to each experimental or control condition.
Experimental Conditions and Specific Procedures
Head-‐Mounted Display
An nVisor SX60 head-‐mounted display [NVIS, Reston,
Figure 1. Image of the DeepStream (left) and the head mounted display (right)

4
Virginia. www.nvisinc.com] was used in this study. The nVisor SX60, (shown in Figure 1 on the right) has a 1280x1024 pixel display for each eye, weighs 1050 grams and has 60º diagonal field of view (FOV). See Table 1 for a comparison of display characteristics. In this HMD condition, SnowWorld (described below) was run on a Windows 7 desktop personal computer with an Intel 3.33GHz Core i7-‐975 CPU, 6GB RAM and dual NVIDIA GeForce FX285 graphics cards running in SLI mode. Participants were fitted with the HMD, adjusted to head size and fit over corrective lenses. The participant used the manual optical adjustments on the HMD to set the interpupillary distance (IPD) to their own comfort level. After fitting was complete, the procedure continued with the participant playing SnowWorld for two minutes to get acclimated to the display and learn the mechanics of the game. After 2 minutes, the heat stimulus was administered for 30 seconds at the individual’s tolerance threshold temperature established in the baseline procedure. Immediately following heat stimulation, a research assistant turned off and removed the HMD VR system. At that time, participants were given the Pain Assessment, along with the Presence Assessment and Physical Discomfort measures to complete.
DeepStream 3D Viewer (DS)
The Firsthand DeepStream 3D Viewer (Figure 1 on the left) is a purely optical device (lenses and mirrors, but no electronics) that slides over the screen of a laptop, enabling the user to view the laptop screen as an immersive, wide FOV stereoscopic 3-‐D display. The laptop display is divided in half, in an over and under configuration. The DS uses mirrors and low-‐powered lenses to direct views rendered on each half of the
display to the appropriate eye. The resulting stereoscopic image has approximately 2600x900 pixels per eye, and an 86º diagonal FOV (Table 1). In the clinic, the laptop with the DS attached is mounted upside-‐down on a flexible computer monitor arm, so it can be repositioned easily for patients seated or supine. Audio was provided via headphones. In the DS condition, SnowWorld was run on the 2012 MacBook Pro with Retina Display running Windows 7 (under Bootcamp) and configured with a 2.3GHz core i7 3615QM CPU, 8GB RAM and a NVIDIA GeForce 650M GPU. The DS was suspended on an arm in front of the patient sitting in the dental chair. The lenses of the DS are movable to adjust to the exact interpupillary distance (IPD) of each user. The fitting procedure included measurement of the participant’s IPD in millimeters using a ruler, and adjustment of the movable lenses to the appropriate IPD by the research staff. After fitting was complete, the procedure continued with the participant playing SnowWorld for two minutes to get acclimated to the display and learn the mechanics of the game. After 2 minutes, the heat stimulus was administered for 30 seconds at the individual’s tolerance threshold temperature established in the baseline procedure. Immediately following heat stimulation, the simulation was terminated and the display was moved out of the way. At that time, participants were given the Pain Assessment, along with the Presence Assessment and Physical Discomfort measures to complete.
Control Participants received no distraction and simply sat quietly for a total of two minutes. At this point, the 30-‐
Table 1: Comparing DS to the nVisor SX60 and Rockwell Collins SR-‐80A
Firsthand DeepStream 3D
NVIS nVISOR SX60
Rockwell-‐Collins SR-‐80A
Field-‐of-‐view (Horizontal) 86˚ (stereo), 79º (mono) 48˚ 63º Field-‐of-‐view (Vertical) 31˚ 39˚ 53º Field-‐of-‐view (Diagonal) ~88º (stereo), 83º (mono) 60˚ 80º Stereo Overlap ~73º 48º 53º Resolution 2600x900 1280x1024 1280x1024 Average Angular Resolution 30 pixels/degree 26 pixels/degree 20 pixels/degree Brightness 88 fL 30 fL 50 fL

5
second pain stimulus was administered at tolerance threshold temperature. Immediately following heat stimulation, participants were given the Pain Assessment to complete.
Materials and Measures Participants in the two active conditions experienced the virtual environment, SnowWorld (1998, 2009). SnowWorld is a simulated journey through an icy canyon with a flowing river below, blue skies above, and surrounded by gently falling snow. The landscape is populated with snowball-‐hurling snowmen, penguins, wooly mammoths and flying fish. Participants are given the illusion of being carried through the canyon on a predetermined path, and are able to explore the environment in 360 degrees using a trackball. Participants can use a button on the trackball to throw snowballs at any of the features in the environment, and may experiment with the game’s physics by bouncing simulated balls off walls or shooting them in the air. The musical soundtrack of SnowWorld is from the album Graceland by Paul Simon along with the ambient sound of the flowing river and sound effects from the game play.
Pain Assessment
Participants rated their sensory experience of pain using Hoffman’s Graphic Rating Scales20, a series of 0 to 10 labeled numeric scales. The Worst Pain scale was labeled on the left with “no pain at all” and on the right with “excruciating pain”. Additional pain measures included an item asking “How unpleasant was the experience?” labeled on the left with “not unpleasant at all” and on the right with “excruciatingly unpleasant”, and an item assessing “How much time did you spend thinking about your pain?” labeled on the left with “none of the time” and on the right with “all of the time”. Previous validation of these scales demonstrated strong associations with other measures of pain intensity.
Immersion Assessment
In order to assess the participants’ sense of presence in the virtual world, participants in the two active conditions were given additional scales to complete. These scales consisted of two 10cm graphic ratings scales that measure sense of immersion in the virtual world by asking first, “to what extent did you feel like
you went inside the virtual world (labeled on the left with “I did not feel like I went inside at all” and on the right with “I went completely inside the virtual world”), and second, “How real did the objects seem to you?” (labeled on the left with “completely fake” and on the right with “indistinguishable from a real object”) 20.
Physical Discomfort Assessment
In order to assess the participants’ level of physical discomfort in the virtual world, participants in the two active conditions were given additional scales to complete. These scales consisted of three 10cm graphic ratings scales that measure feelings of dizziness in the virtual world (labeled on the left with “no dizziness at all” and on the right with “faint”), headaches in the virtual world (labeled on the left with “no headache at all” and on the right with “worst headache possible”) and the final scale designed to measure feelings of nausea that may be present as a result of the virtual environmental experience (labeled on the left with “no nausea at all” and on the right with “vomit”) 20.
Data Analysis Analysis of variance (ANOVA) with heteroscedasticity-‐consistent standard errors, to account for unequal variances, was used to compare average baseline thresholds and ratings, and average experimental ratings between the three conditions.12 If group differences were present, pairwise testing was performed using analysis of variance and Holm’s procedure to account for the multiple comparisons.21 ANOVA was also used to compare the change from baseline in worst pain rating. Given the occurrence of nausea, dizziness and headaches was very low, the ratings for these outcomes were dichotomized into any versus none and exact logistic regression, adjusted for gender, was used to compare the HDM and DS conditions.1,27 Additional ANOVA analyses compared ratings between males and females, and assessed if differences between conditions varied by gender (i.e., test for condition by gender interaction). All analyses were adjusted for gender, and in addition, comparisons of worst pain ratings were adjusted for the baseline pain rating. Statistical analyses were performed using SAS Version 9.3 (SAS Institute Inc.,
6
Cary, NC) and a 0.05 significant level was for all comparisons.
Results
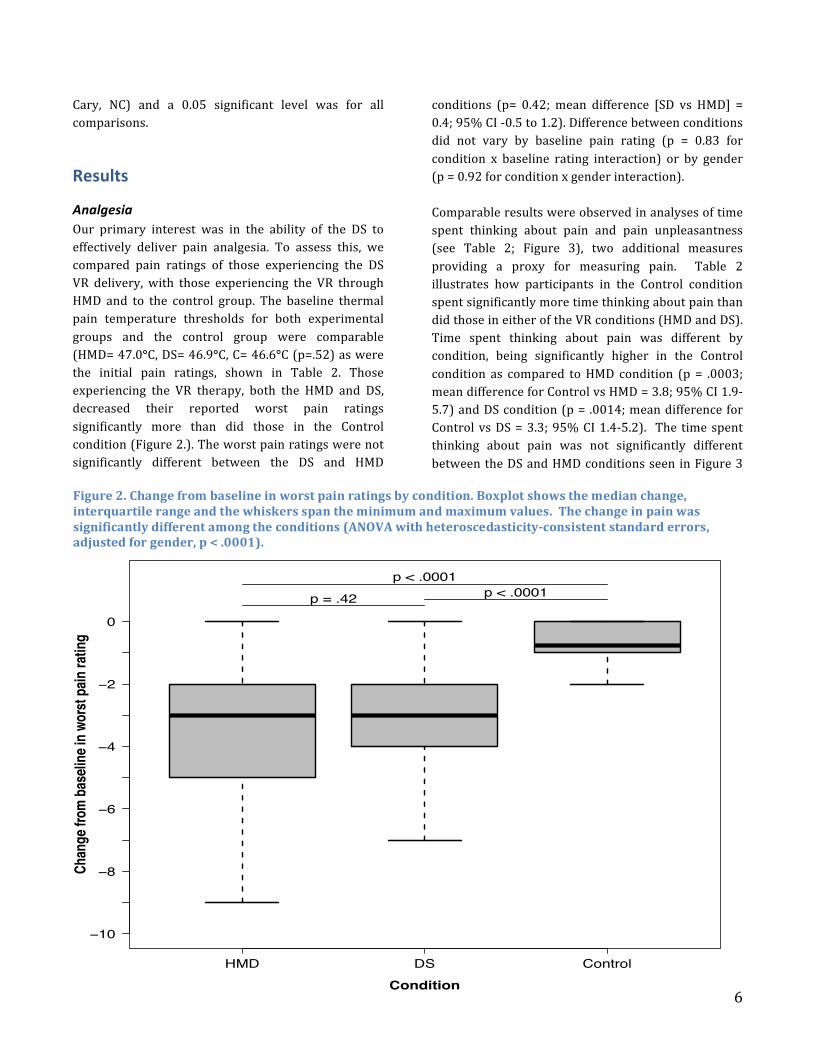
Analgesia Our primary interest was in the ability of the DS to effectively deliver pain analgesia. To assess this, we compared pain ratings of those experiencing the DS VR delivery, with those experiencing the VR through HMD and to the control group. The baseline thermal pain temperature thresholds for both experimental groups and the control group were comparable (HMD= 47.0°C, DS= 46.9°C, C= 46.6°C (p=.52) as were the initial pain ratings, shown in Table 2. Those experiencing the VR therapy, both the HMD and DS, decreased their reported worst pain ratings significantly more than did those in the Control condition (Figure 2.). The worst pain ratings were not significantly different between the DS and HMD
conditions (p= 0.42; mean difference [SD vs HMD] = 0.4; 95% CI -‐0.5 to 1.2). Difference between conditions did not vary by baseline pain rating (p = 0.83 for condition x baseline rating interaction) or by gender (p = 0.92 for condition x gender interaction). Comparable results were observed in analyses of time spent thinking about pain and pain unpleasantness (see Table 2; Figure 3), two additional measures providing a proxy for measuring pain. Table 2 illustrates how participants in the Control condition spent significantly more time thinking about pain than did those in either of the VR conditions (HMD and DS). Time spent thinking about pain was different by condition, being significantly higher in the Control condition as compared to HMD condition (p = .0003; mean difference for Control vs HMD = 3.8; 95% CI 1.9-‐5.7) and DS condition (p = .0014; mean difference for Control vs DS = 3.3; 95% CI 1.4-‐5.2). The time spent thinking about pain was not significantly different between the DS and HMD conditions seen in Figure 3
HMD DS Control
−10
−8
−6
−4
−2
0
Chan
ge fr
om ba
selin
e in w
orst
pain
ratin
g
Condition
p = .42 p < .0001p < .0001
Figure 2. Change from baseline in worst pain ratings by condition. Boxplot shows the median change, interquartile range and the whiskers span the minimum and maximum values. The change in pain was significantly different among the conditions (ANOVA with heteroscedasticity-‐consistent standard errors, adjusted for gender, p < .0001).

7
(p = 0.15; mean difference [DS vs HMD] = 0.5; 95% CI -‐0.17 to 1.2). Time spent thinking about pain did not differ by gender, the mean difference for Female vs Male = -‐0.3; 95% CI -‐1.0-‐0.
Ratings of unpleasantness (Table 2) were different by condition, in that unpleasantness was significantly higher in the Control condition as compared to the HMD condition (p < .0001; mean difference for Control vs HMD = 3.5; 95% CI 2.1-‐4.8) and DS condition (p < .0001; mean difference for Control vs DS = 3.4; 95% CI 2.0-‐4.6). Unpleasantness was not significantly different between the DS and HMD conditions (p-‐value = 0.81; mean difference [DS vs HMD] = 0.4; 95% CI -‐0.8 to 1.0). Finally, in Table 2. we see that the amount of fun participants reported having during the experience did not differ between the two VR delivery systems (DS, M=7.2 (SD,1.6); HMD, M=7.7 (1.4 SD). As seen in Figure 3, both were significantly more fun than the control participants report (M=4.0 (SD 2.5).
A 30% or greater decrease in pain intensity is accepted as being clinically meaningful 6. Therefore we analyzed the percent change in pain ratings from baseline. The percentage of subjects with a 30% or greater reduction in pain was significantly different between the conditions (p = .0096, exact chi-‐square test). More subjects in the HMD condition (62%) had a 30% or greater reduction in pain as compared to the Control condition (10%; p = 0.012) and more subjects in the DS condition (58%) had a 30% or greater reduction in pain as compared to the Control condition (p = 0.023). The difference in the percent with a 30% or greater reduction pain was not significantly different between the HMD and SD conditions (p = 0.83). More subjects in both the HMD and SD conditions experience a 30% or greater reduction in pain than compared to the Control condition
Aver
age
Ratin
g (e
rror b
ar =
SD)
0
2
4
6
8
10HMDDSControl
Worstpain
Time spentthinking
about painPain
unpleasantnessAmountof fun
Figure 3. Average pain ratings at final assessment by condition. Values represent the mean (± SD).

8
Presence For the HMD and DS conditions only, we summarized and compared ratings of the extent of feeling one went inside the virtual world, and how real the virtual objects were to the subject (Table 3). The extent to which participants went inside the virtual world did not differ between the HMD and DS conditions (p = 0.16, mean difference [DS vs HMD] = 0.7; 95% CI -‐0.3 to 1.6). The difference between conditions did not vary by gender (p = .32). How real objects in the virtual world were was not significantly different between the DS and HMD conditions (p=.07; mean difference [DS vs HMD] = 0.9; 95% CI -‐0.1 to 1.8). How real differed by gender (p = .015). Mean difference for Female vs Male = 1.2; 95% CI 0.2 to 2.1, however the difference between conditions did not vary by gender (p = .16).
Physical Discomfort Nausea was uncommon in both conditions, therefore the nausea measure was dichotomized, none (0 rating) versus any (1 to 10 rating). The percentage of subjects experiencing nausea did not differ between HMD and DS, (p = 0.83; exact 95% confidence interval for HMD: 8.0% to 32.1% and DS: 8.1% to 32.7%.) (Table 3). The differences between conditions did not vary by gender (p = 0.51). Like nausea, dizziness was uncommon in both conditions, so the dizziness measure was dichotomized, none (0 rating) versus any (1 to 10 rating). The percentage of subjects experiencing dizziness was marginally higher in the HMD condition than the DS condition (exact chi-‐square test, p = .051). Similarly, there was a marginally significant difference after adjusting for gender (Table 3). The percentage of subjects experiencing headaches did not differ between HMD and DS (exact chi-‐square test, p = 0.52), and was uncommon in both conditions, so the headache measure was dichotomized, none (0 rating) versus any (1 to 10 rating). There was no difference by gender (p = 0.69).