Embed Size (px)
Citation preview

Open Journal of Accounting, 2013, 2, 53-78 http://dx.doi.org/10.4236/ojacct.2013.23009 Published Online July 2013 (http://www.scirp.org/journal/ojacct)
Copyright © 2013 SciRes. OJAcct
Efficacy Assessments of Z-Score and Operating Cash Flow Insolvency Predictive Models
Angus Unegbu1*, James Adefila2 1School of Business & Entrepreneurship, American University of Nigeria, Yola, Nigeria;
2Accountancy Department, University of Maiduguri, Maiduguri, Nigeria Email: *[email protected]
Received October 22, 2012; revised January 4, 2013; accepted January 15, 2013
Copyright © 2013 Angus Unegbu, James Adefila. This is an open access article distributed under the Creative Commons Attribution License, which permits unrestricted use, distribution, and reproduction in any medium, provided the original work is properly cited.
ABSTRACT
This study examines the efficacy of Z-Score and operating cash flow as Corporate Insolvency prediction models in de- veloping cash economy. The research specific objectives are to determine the predictive efficacy of Z-Score and oper- ating cash flow in discriminating between would fail and going concern companies, identify more effective model for predicting Corporate Insolvency between Z-Score and operating cash flow and assess the predictive ability across in-dustries of the two models. Sixty-two corporate financial statements possessing flow-based insolvency symptoms were tested. Tools of analyses employed are ANOVA, Loglinear Analysis, Fredman ANOVA and Percentages. Z-Score pre- dictive ability across Services and Merchandising sectors is found to be very poor but very strong on Manufacturing and Oil Services, while Operating Cash Flow model is found to be more effective in predicting accurately Service and Merchandising Sectors. The predictive efficacy of the two models significantly varies as the year becomes closer to the year of corporate failure. It is recommended that across industrial sectors, Z-Score model should be used for testing business failures in Manufacturing and Oil Services while Operating Cash Flow model is better employed in solvency stress test for Merchandising, Transport & Aviation and Service industrial sectors. Keywords: Insolvency Prediction; Operating Cash Flow; Z-Score; Developing Economy; Efficacy Assessment of
Prediction Models
1. Introduction
1.1. Background to the Study
Working capital is vital for business survival. Account- ing and finance practitioners presume working capital as the differences of current assets over current liabilities. Working capital is the effective blood of any business. It is the amount of money that the firm must obtain from non-free sources to carry its current operating assets thus it is the life wire of any business. Lack of working capital or its inadequacy is termed “insolvency”, although insol- vency has other conceptualizations. To many authorities, working capital is a state of inability to meet with de- mand for debt repayments as and when due. Prolonged insolvency leads to corporate liquidation and winding up. Corporate liquidation brings with economic losses to Corporate managers, Shareholders, Employees, Investors and other Corporate Stakeholders. Although before the advent of global economic meltdown, the rate at which
companies become financially distressed is alarming and the “global economic meltdown” has added impetus to the deteriorating situation of Nigerian companies. Entre- preneurship development and enhancement require a healthy environment. Incorporated companies are ex- pected to grow and be sustained for a foreseeable future but these expectations are usually cut short by Corporate Insolvency. Corporate failures exert negative pressures on the economy. It dries up household feeding hands and breeds social crimes, thus the need to undertake a study of Nigerian Corporate Insolvency becomes more expe- dite. An assessment of the efficacy of insolvency predic- tive models that will generate early warning signals of Corporate Insolvency to Entrepreneurs, Policy makers, Business Owners and Professionals in developing ec- onomies has become greater.
1.2. Statement of the Problem
Nigeria since coming into being as a state operates “Cash Economy”. Cash economy is akin to developing econo- *Corresponding author.

A. UNEGBU, J. ADEFILA
Copyright © 2013 SciRes. OJAcct
54
mies in all aspects. Nigeria was one of the prospering economies of the world during the 1970s, thus [1] classi- fied her as an “emerging economy” with great large terri- tories, consumer markets and growing populations. Ni- geria helped by the oil boom of 1970s was undertaking extraordinary developmental projects that called for new infrastructure, such as power-generating plants, huge electrifications of the entire country, construction of large networks of roads, provision of improved educa- tional facilities, harbouring flourishing corporate bodies and carrying our massive investment in telecommunica- tions. These developments caused increased demand for consumer goods, social goods and capital equipments. Nigeria pursued vigorously economic policies leading to faster growth and expanding trade and investment with the rest of the world. The International Trade Admini- stration cited Nigeria, South Africa, Brazil, Turkey, India, and Malaysia as emerging economies/markets but by the year 2000 and thereafter, things were not the same any- more. Between 1995 to 1998, [2] had it that number of Commercial Banks had declined from 64 to 51, while Merchant Banks also declined from 54 in 1991 to 38 in 1998. It is known that over two thousand companies have been delisted and many products or services of existing companies have disappeared in the markets thus prompt- ing Nigerians to ask for the reasons for such disappear- ances. Consumers are alarmed as to what has happened. Policy makers and Professionals are deeply concerned about the increasing corporate failures in recent years. Investors are worried of the efficacy of tools of future and early warning signals of insolvency in the affairs of corporate bodies in the country. These have made it nec- essary to investigate the efficacy of Z-Score and Operat- ing Cash Flow models as tools for assessing early warn- ing signals of corporate liquidation in Nigeria. It is also pertinent that there is increasing economic meltdown in many “Credit” economies where the efficacy of Z-Score and Operating Cash Flow Insolvency models have been tested to enhance the need to examine their efficacy in a “Cash” economy. Furthermore as Nigeria is speculating to transit into “Credit” economy, scholars and research- ers with profound interest in the affairs of the country need to investigate and document the efficacy of Z-Score Insolvency prediction model adapted for “Credit” eco- nomies and compare it with Operating Cash Flow Insol- vency prediction model which is adapted to “Cash” eco- nomies, in readiness to analysis corporate dynamics when the transition to credit economics is completed.
1.3. Objectives of the Study
The main objective of this research is to assess the eff- icacy of Z-Score and Operating Cash Flow models in prediction of Corporate Insolvency in a developing economy anchored on “flow-based” insolvency meas-
urements using Nigeria as a study case. Specific objec- tives are to:
1) determine the predictive efficacy of Z-Score and operating cash flow in discriminating between would fail and going concern companies,
2) identify more effective model for predicting cor- porate insolvency between Z-Score and operating cash flow and examine and assess the predictive ability across industries of Z-Score and operating cash flow.
1.4. Research Hypotheses
In order to address the research specific objectives, the following null hypotheses are formulated:
Ho1: The predictive efficacy of Z-Score and Operating Cash Flow models is not significantly different in dis- criminating between would fail and going concern com- panies in developing economy.
Ho2: The predictive ability across industries in deve- loping economy between Z-Score and Operating Cash Flow models are not significantly different.
Ho3: Predictive efficacy of the two models does not change significantly as the year increases prior to Cor- porate failure in developing Economy.
1.5. Significance of the Study
This study will not only highlight the symptoms of inso- lvency in “cash” economy such as Nigerian economy but also will test the predictive ability of Z-Score insolvency model, compared with that of Operating Cash Flow model. The outcome of the research will produce a working base for financial analysts, insolvency practi- tioners, managers of corporate bodies and the academia to grasp and understand insolvency symptoms, manifes- tations and predictions in a cash economy for further decisions. The outcome will also afford researchers the opportunity to compare the efficacies of these insolvency prediction models both in a cash economy and credit economy based on the same geographical and human nature. The research is also necessary as it will capture and document relevant data concerning corporate insol- vency dynamics during Nigerian Cash Economy before transiting fully to a credit economy.
1.6. Scope of the Study
Legally induced insolvency and Stock Market Value inf- licted insolvency are not covered in this study but flow-based insolvency measurement. The research cov- ered sixty two financial statements of thirty one compa- nies in Nigeria. It is limited to the analysis of events that appear in the financial statements. Two consecutive years of financial statements of companies with any or combi- nations of flow based Corporate Insolvency symptoms were variously selected between years 1990 to 2009.

A. UNEGBU, J. ADEFILA
Copyright © 2013 SciRes. OJAcct
55
1.7. Justification for the Choice of 1990 to 2009 Cut-Off Period
Nigerian economy started suffering from critical negative pressures in 1980s when austerity policies were intro- duced and its adverse measures were implemented. The effect of this macroeconomic indicator of depressed and declining economic indices impacted heavily on corpo- rate bodies in the 1990s leading to more and increasing corporate failures. By the end of 1990s and thereafter there had been rampant corporate failures and delisting of dormant corporate bodies in the country. In the 2000s, global economic meltdown had increased the tempo of corporate failures throughout the world thus the choice of 1990 to 2009 as a cut-off period for the study of efficacy of Z-Score and Operating Cash Flow models as tools for assessing early warning signals of corporate liquidation is justified.
2. Literature Review
2.1. Causes of Corporate Insolvency
It is the assertion of [3] that incompetent management, downturn in economic conditions, inflation, new inven- tions, fraud, and negligence are the causes of Corporate Insolvency. Incompetent management relates to lack of the Directors’ foresight in planning, control, directing, organizing and “deaf” management. Downturn in eco- nomic conditions comprises of prolonged losses, change of laws, economic depressions and sudden natural disas- ter negatively affecting the firm. New inventions and changes in technology can cause the existing products to become obsolete and lack of demands, leading to insol- vency. Financial fraud in an organization may send a fund shock into the Organization, thus resulting to the firm becoming insolvent. Accounting fraud, which is accounting distortions or accounting engineering aimed at covering misstatements to show that the firm is healthy when it is otherwise, thus the act cannot be managed any longer, insolvency sets in.
2.2. Indicators of Insolvency in Cash Economy
A study was carried out by [4] on what influences the number of bankruptcies in Norwegian enterprises. Their study concentrated on external influences (macroeco- nomic variables) that influences bankruptcies or prevents firms from becoming bankrupt. The cut-off period of the research was 1991 to 2004. The research of [4] focused on the macroeconomic indicators/causes of Corporate Insolvency though very significant but it is different from current research which focuses on flow-based indicators of Corporate Insolvency.
2.3. Efficacy of Z-Score Corporate Insolvency Prediction Model in Cash Economy
Both [5] and [6] compared the results of Z-Score against the neural network approach and their results suggested that the Neural Networks approach is more effective than Z-Score model in classifying distressed and non-distre- ssed firms, whereas [7], after comparing two Neural Networks techniques to Z-Score using Probit and Logit prediction models, it was found that the two Neural Networks techniques did not provide superior classifica-tion rates.
A study on predicting corporate failure, using United Kingdom firms was carried by [8]. Their main objective is the development and validation of a failure classifica- tion model for UK public industrial companies using logit analysis and Neural Networks techniques. Their dataset consists of 51 matched-pairs of failed and non-fa- iled UK public industrial firms over the period 1988- 1997. Their results indicate that a parsimonious model that includes three financial variables, profitability, an operating cash flow and a financial leverage variable can yield an overall correct classification accuracy of 83% one year prior to failure. These researchers selected fi- nancial ratios as predictor variables mainly because of their popularity and predictive success in previous re- search. They tend to forget that organizations in devel- oping economies cannot survive without generating cash from their normal everyday operations, thus the need for operating cash flow related models’ usefulness in pre- dicting corporate failure.
2.4. Comparative Efficacy of Z-Score and Operating Cash Flow Models
A research on Corporate bankruptcy prediction models applied to emerging economies, using Argentina was done by [9] with a cut-off period of 1991 to 1998 as a case study. The research specific objectives are to inves- tigate the applicability of Z-Score to predict Corporate Insolvency in emerging economies and to compare the efficacy of Z-Score with profitability ratios in predicting Corporate Insolvency. This study was based on flow-ba- sed insolvency indicators. Eleven bankrupt and eleven healthy companies were sampled by [9] during the re- search. The research findings is that Z-Score model can be used in predicting Corporate Insolvency in emerging economics because it pays attention to solvency indica- tors but in a rapid changing environment, profitability ratios should be better used.
On the forms of Corporate Insolvency, [10] asserted that there are two forms of insolvency investigations; those concerned with ability to pay maturing debts (Cash flow test) and those on the entire value of the enterprise (Balance sheet test from where Z-Score drew its vari-

A. UNEGBU, J. ADEFILA
Copyright © 2013 SciRes. OJAcct
56
ables). The research study sampled three thousand, six hundred firms between the periods of 2005 to 2009 on the premises of understanding how recession has affected the solvency of companies. The research findings is that though the two models showed significant results but that nonfinancial indicators must be taken into consideration as financial indicators alone are inconclusive indicators of distress. This conclusion was made because his analy- ses of nonfinancial indicators, as opposed to financial ones, show a clear trend of increasing distress. This [10] assertion on the important forms of insolvency investiga- tions is very significant to the present research.
Using cash flow ratios to predict business failures and comparing the outcomes of these ratios with outcome of Z-Score tests was a research carried out by [11]. This research is very significant to current research because there is resemblance. The present research is different because it is not concerned with comparing the efficacy of Z-Score with individual cash flow ratios.
[12] conducted a study to assess whether operating cash flow data and related measures lead to more accu- rate predictions of bankrupt and non-bankrupt firms in the United Kingdom. Their statement of problem is most accounting and finance studies of corporate financial distress define “Cash Flow” as net income plus nonwork- ing capital expenses, so they omit items such as changes in current assets and current liabilities which may have a significant impact on a company’s actual cash flow from operations and more worrisome is that past empirical research on the relationship between cash flow operating activities and financial distress where carried out without having hold-out samples. In their research, cash flow from operating activities was redefined to mean as net income plus nonworking capital expenses divided by current liabilities. The research of [12] went further to compare the relative efficacy of their cash flow model with Z-Score model. The study sample includes hold-out samples. Their findings showed that both Operating Cash Flow model and the Z-Score were statistically significant for the first three years prior to bankruptcy. The research of [12] is very significant to the current study although it was conducted on a developed economy.
While agreeing on the relevance of operating cash flow in corporate failure predictions, [13] was concerned with the conceptualizations of operating cash flows. The study highlighted fifteen studies where operating cash flow was differently conceived with each showing var- ied efficacy of the model in predicting corporate failure.
In contrast to [12], current research centers on exami- ning the efficacy of Operating Cash Flow and Z-Score models in cash/developing economy. In reference to the work of [13], the current research is not concerned with comparative conceptualizations validity of the construct “Operating Cash Flow”. The study of [9] is very material to use, as it has found Z-Score usable with financial data
from developing economies, of which Nigeria is an ex- ample.
A research on the efficacy of liquidation and bank- ruptcy prediction models for assessing going concern was carried out by [14]. The purpose of the study is to examine the efficacy of statistical corporate liquidation prediction models for assessing client going concern status. Previous researches show that statistical bank- ruptcy prediction models consistently outperform audi- tors’ going concern judgment in discriminating between bankrupt and non-bankrupt companies. The [14] research worry is that in countries such as the US where the in- solvency laws are debtor oriented, corporate bankruptcy procedures encourage companies in financial difficulty to continue as going concerns. This concern was shared by [15]. Therefore it is possible for companies that file for bank- ruptcy to reorganize and emerge from bankruptcy, or to merge with another entity as a going concern. [16] also concords. This is in contrast to the insolvency pro- cedures in creditor oriented countries such as the UK, Germany, Australia, Nigeria and New Zealand where liquidation is the most common outcome of Corporate Insolvency [15,17].
The argument of [14] is that given the differences in debtor and creditor oriented insolvency frameworks. The research aimed at finding ways and procedures that can assist auditors in choosing appropriate business failure prediction models as an analytical technique for assess- ing going concern. The findings of their study raised the issue of the appropriateness of using bankruptcy predic- tion models in countries where the insolvency code is essentially creditor oriented. In countries such as the UK, Nigeria, Australia and New Zealand, a liquidation pre- diction model is likely to be more appropriate because the majority of insolvent companies are liquidated, and not given the opportunity of remaining as a going con- cern as encouraged by the US Chapter 11 insolvency procedures.
The study of [15], though carried out in a credit economy and operating cash flow was not one of the prediction models compared, however, it will be highly relevant to current research as it showed that Z-Score model has high efficacy for predicting corporate failures but less in predicting concern firms in a creditor oriented insolvency economy which is akin to Nigeria’s economy. The study also raised a crucial issue in the use of Z-Score prediction model for assessing going concern financial stress in a creditor oriented economies which is relevant in the current Nigerian investigation.
3. Research Methods
3.1. Study Area and Sources of Data
This study is designed to focus on corporate bodies ope-

A. UNEGBU, J. ADEFILA
Copyright © 2013 SciRes. OJAcct
57
rating and those that had operated in Nigeria, an example of countries that operate “cash” economy. It is the asser- tion of [18] that there are more than two million regis- tered businesses in Nigeria as at 31st December 2011. This is made up of 896,095 companies, 1,917,670 busi- ness names and 47,421 incorporated trustees. The study area of this research is on the incorporated companies. It was further asserted by [18] that out of the incorporated companies, 59,000 of them were dormant, Liquidated or had been delisted from the Corporate Affairs Register. Available data from The Nigerian Stock Exchange as at 06/08/2012 and from Corporate Affairs Commission showed out of the remaining 837,095 companies, 398 of them are quoted while a total of 836,697 companies were registered as unquoted companies.
The data for this study were drawn from secondary sources. Published financial statements of selected cor- porate bodies from 1990 to 2009 were analyzed. These published financial statements of companies in Nigeria were collected from Corporate Affairs Commission and the Nigerian Stock Exchange. The cut-off period was chosen because of increasing wave of corporate liquida- tion within the period and rising global economic melt- down.
3.2. Population of the Study
The population of this study comprises 896,095 existing and liquidated companies that is operating or had oper- ated in Nigeria (Table 1).
Corporate bodies were stratified by names as obtained from Corporate Affairs Commission and the Nigerian Stock Exchange, ranging from A to Z. Forty firms were randomly generated from each alphabet, thus giving a total of one thousand and forty entities as the research theoretical population (i.e. a population to generalize to).
Out of the theoretical population, six hundred and ten companies were found to have one or combination of flow based Corporate Insolvency symptoms, hence the study accessible population (i.e. population that is avail- able).
Basis of financial year selections: Two consecutive years of financial statements of companies with any or combinations of the listed insolvency symptoms were variously selected between years 1990 to 2009 thus;
1) Failed Companies: Financial statements with inhe- rent Corporate Insolvency symptoms 3rd and 2nd year prior to failure were selected for examination. A year’s gap prior to failure is given for strategic decisions and implementations of re-organization, refinancing and other necessary measures that should have helped the enterprise to avert the looming liquidation on identifying that the company is moving towards failure three to two years earlier.
2) Going Concern Companies: Financial statements with material Corporate Insolvency symptoms persisting for two financial years consecutively but not later than December 2010 were selected for study. The year 2010 is selected as a cut-off date. The period covered by the study is 20 years of 1990 to 2009.
3.3. Sample Size Determination
Having identified accessible population to be made up 610, Banking and Financial sectors were excluded for information sensitivity and ongoing consolidation exer- cise in the sector. Other industries excluded as a result of capital adequacy and other special requirements are Mining, Shipping, Oil Explorations and Ammunitions. The industries concentrated on for availability of finan- cial statements, uniformity in accounting and lacks of capital adequacy requirements were:
Table 1. The detailed industrial sectors that made up the population as at date based were as follows.
Number of Existing Companies Sector
Quoted Non-Quoted Liquidated/Delisted Numbers
Agriculture 7 50,562 2051
Merchandising 50 208,000 13,736
Construction, Property and Real Estates 10 48,500 2507
Food, Beverages and Consumer Goods 30 50,608 3600
Insurance and Financial Services 123 62 96
Health Care and Medicals 11 69,000 3883
Information, Computer and Telecommunications 12 40,060 2768
Manufacturing and Industrial goods 110 100,601 4105
Natural Resources and Mining 6 6750 668
Oil and Gas Services 16 80,705 9500
General Services 18 106,000 10,985
Transport and Aviation 5 75,913 5101
Total 398 836,697 59,000
A. UNEGBU, J. ADEFILA
Copyright © 2013 SciRes. OJAcct
58
Service Industry Transport and Aviation (Nigerian based) Oil Services Merchandising Manufacturing.
Seventy Corporate bodies were found from the indu- strial focus, and using [19] equation:
0
0 11
nn
n
N
where; n = required sample size (Number of Financial stat-
ements to be analyzed). n0 = concerned (valid) sample size (Available and Re-
levant Financial statements to draw sample from). N = Population size (To generated/identified relevant
financial statement from stratification sampling). The required sample sizes were generated by SPSS
based Cochran equation thus; 1) 62 Financial Statements as required sample for inv-
estigation. 45 Financial statements out of the 62 are to be reserved for failed companies, while the remaining 17 financial statements is generated as a good sample size from going concern financial statements. Across indus- trial sectors, the same sizes were generated using SPSS based Cochran equation thus: Service 10; Transport and Aviation 6; Oil Services 8; Merchandising 14; Manufacturing 24.
3.4. Method of Data Collection
Certified True Copies of the generated financial statem- ents via stratified sampling technique were collected from the Head Office of the Nigerian Corporate Affairs. Each of the financial statement was professional ana- lyzed to extract the relevant Z-Score and operating cash flow prediction data.
3.5. Techniques of Data Analysis
Reliability and validity of the effectiveness of Z-Score model and Operating Cash Flow were confirmed vari- ously by the use of ANOVA (Analysis of Variance), Fredman ANOVA, and Loglinear at 5% significant level. A comparative analysis of test outcomes employed the use of Percentages (Cross tabulations). Computations of these test statistics were carried out and decision criteria based on SPSS statistical software processing.
3.6. Theoretical Frameworks Adopted
The conception of operating cash flow and measur-
ement for the purposes of this research is as defined by [20] as earnings before interest and depreciation minus taxes. The solvency decision criterion using operating cash flow is that it has to be positive. A firm having neg-ative operating cash flow shows a strong symptom of insolvency.
Z-Score Insolvency Prediction model adopted for this research is as stipulated by [21] thus;
Equation: Z-Score model for quoted companies Z = 0.717X1 + 0.847X2 + 3.107X3 + 0.420X4 +
0.998X5
Given that: X1 = Net Working capital/Total assets X2 = Accumulated retained earnings/Total assets X3 = EBIT/Total assets X4 = Market Value of equity/Book value of debt X5 = Sales/Total assets. The decision criterion is thus: If Z is between 1.23 and 1.81, the firm is bankrupt. If Z is greater than 1.81 but equal to or lower than 2.90,
the firm is in a gray area. If the firm has Z-Score greater than 2.90, the firm is
None-bankrupt. Equation: Z-Score model for non-quoted companies Z= 6.56X1 + 3.26X2 + 6.72X3 + 1.05X4 Given that: X1 = Net working capital/Total assets X2 = Accumulated retained earnings/Total assets X3 = EBIT/Total assets X4 = Book value of equity/Total liabilities. The decision criteria are: If Z is <1.21, the firm is bankrupt. If Z is between 1.22 and 2.90, the firm is in a gray area. If Z is >2.90, the firm is Non-bankrupt.
4. Data Presentation, Analysis, Findings & Recommendations
4.1. Data Presentation
4.1.1. Discussion of Table 2 Out of the ten sampled financial statements from General Service Industrial, Z-Score model predicted seven of them as heading towards failure while two financial statements were confirmed as going concern from avail- able indicators and one was predicted as being within gray area. On the other hand, Operating Cash Flow mod-el using variables from the same corporate bodies pre-dicted four sampled service sectors as heading towards failure and six of them were certified as possessing the indicators of going concern.
4.1.2. Discussion of Transport and Aviation Industrial Data
Table 3 contains data from sampled Transport and Av-

A. UNEGBU, J. ADEFILA
Copyright © 2013 SciRes. OJAcct
59
Table 2. Variables used for computation of Z-Score and operating cash flow predictions of service industrial sampled compa-nies.
Company Variables from financial statements Figures of Financial Years Tested which have symptoms of Insolvency
2005 2004
Working Capital (9,711,527) (2,645,090)
Total Assets 23,719,261 13,293,337
Accumulated Retained Earnings (2,987,297) (1,656,048)
EBIT (1,110,377) (1,278,809)
Book Value of Equity (1,987,297) (656,048)
Total Liabilities 25,706,558 13,949,385
Z-Score Result (3.493413) (2.407555)
Z-Score Prediction Bankrupt Bankrupt
Company Status as at 31st December 2010 Winded up 2008 Winded up 2008
Operating Cash Flow Result 130,091,000 (290,531,000)
Spa
rnoo
n N
iger
ia L
td.
Operating Cash Flow Prediction Non-Bankrupt Bankrupt
2004 2003
Working Capital 2,225,647 7,096,681
Total Assets 4,658,553 12,749,655
Accumulated Retained Earnings 528,303 5,290,370
EBIT 350,689 7,659,322
Book Value of Equity 2,000,000 2,000,000
Total Liabilities 2,130,250 5,459,290
Z-Score Result 4.995913 9.425189
Z-Score Prediction Non-Bankrupt Non- Bankrupt
Company Status as at 31st December 2010 Winded up in 2006
Operating Cash Flow Result (1,629,041) (6,245,794)
Hos
pita
lity
Mar
keti
ng
Con
cept
s
Operating Cash Flow Predict Bankrupt Bankrupt
2006 2005
Working Capital (2,881,844,000) (2,472,392,000)
Total Assets 7,658,925,000 7,116,239,000
Accumulated Retained Earnings (507,852,000) (211,236,000)
EBIT (3,649,000) (61,244,000)
Market Value of Equity 569,149,000 569,149,000
Book Value of Debts 6,978,093,000 6,136,791,000
Sales 1,230,217,000 1,030,395,000
Z-Score Result (0.1328661) (0.1175472)
Z-Score Prediction Bankrupt Bankrupt
Company Status as at 31st December 2010 Going Concern
Operating Cash Flow Result (99,349,000) 354,146,000 Th
e T
ouri
st C
ompa
ny
of N
iger
ia P
LC
Operating Cash flow Prediction Bankrupt Non-Bankrupt
2008 2007
Working Capital 231,991,227 (1,304,487,868)
Total Assets 4,138,574,256 3,287,605,637
Accumulated Retained Earnings 316,158,872 10,000,000
Tan
tali
zers
PL
C
EBIT 402,678,975 526,595,255

A. UNEGBU, J. ADEFILA
Copyright © 2013 SciRes. OJAcct
60
Continued
Operating Cash Flow Result 702,871,318 748,869,692
Operating Cash flow Prediction Non-Bankrupt Non-Bankrupt
2005 2004
Working Capital 12,903,000 (511,441,000)
Total Assets 3,450,968,000 2,789,304,000
Accumulated Retained Earnings 615,249,000 387,521,000
EBIT 594,008,000 149,554,000
Market Value of Equity 150,000,000 150,000,000
Book Value of Debts 2,685,399,000 2,251,463,000
Sales 3,050,539,000 2,343,618,000
Z-Score Result 1.5944801 2.7438436
Z-Score Prediction Bankrupt Gray Area
Company Status as at 31st December 2010 Going Concern
Operating Cash Flow Result 637,832,000 322,695,000
Nig
eria
n A
viat
ion
Han
dlin
g C
ompa
ny
PL
C
Operating Cash Flow Prediction Non-Bankrupt Non-Bankrupt
Source: Published Financial Statements.
iation Industrial sector. It shows that Z-Score model pre- dictions had inverse relationship with that of operating cash flow predictions. Out of the six sampled companies, Z-Score predicted five for failure and one company for continuation in business. On the other hand, operating cash flow predicted one company to be heading for fail- ure, while five companies were predicted as having clean sheets to continue in business.
4.1.3. Discussion of Table 4 Data Oil Service Industrial sector sampled financial statements were eight in number. Z-Score and Operating Cash Flow models predicted in like directions on this sector. Both models predicted five of the financial statements as pos- sessing indicators of failure while three of them were given clean bills of failure indicators thus they were ad- judicated of having the ability of continuing in busi- ness.
4.1.4. Discussion of Table 5 Data This table captured the relevant data on sampled merch- andising industrial sector. In total, fourteen financial statements were investigated. Z-Score model predicted twelve of the financial statements of having inherent in-dicators of failure while two of them had indicators of healthy companies. On the other hand, investigation conducted with Operating Cash Flow model using same sampled financial statements showed that eleven finan- cial statements possess all the indicators of healthy cor- porate bodies while three financial statements possess symptoms of corporate failure.
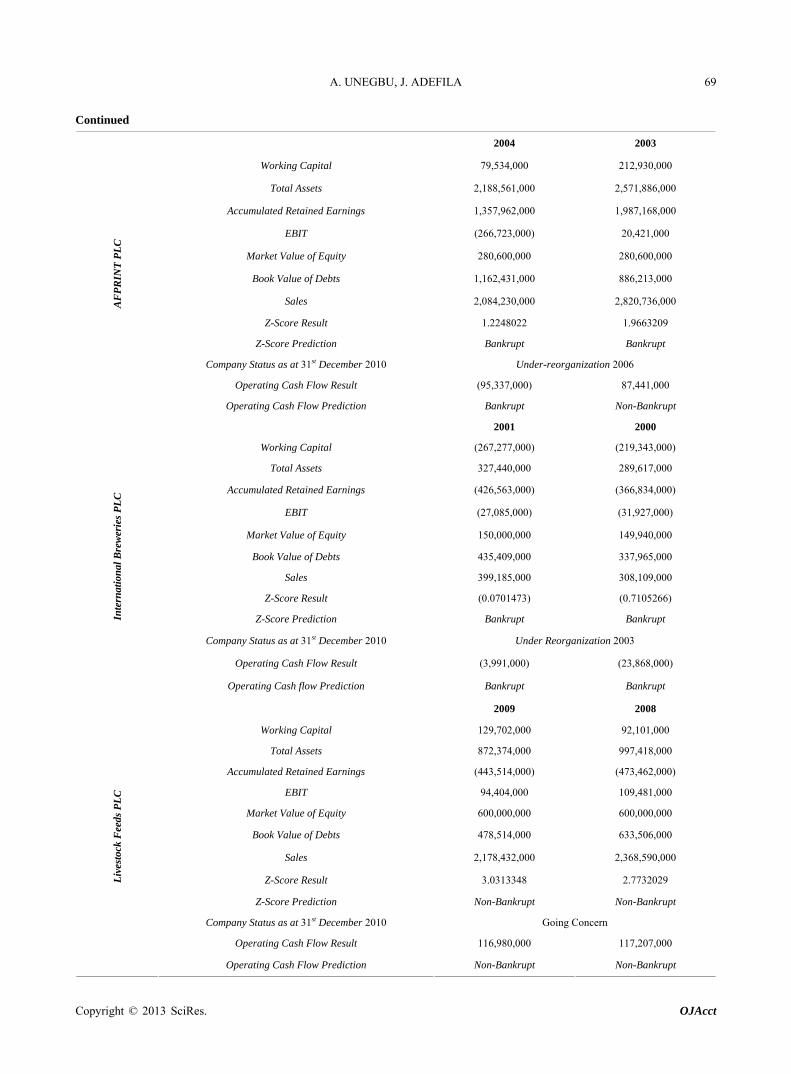
4.1.5. Discussion of Table 6 Data Twenty four corporate bodies from manufacturing indu- strial sector were sampled. Z-Score model predicted twenty of the sampled companies of having inherent failure symptoms and four of possessing healthy con- tinuing indicators. Sample corporate bodies were tested with Operating Cash Flow model where ten financial statements were adjudicated of heading towards failure while fourteen were predicted of healthy enough to con- tinue in business.
4.2. Analyses of Data and Testing of Hypotheses
The relevant data as presented in Tables 2 to Table 7 are analyzed hereafter according to each stated hypothesis using relevant statistical SPSS based statistical tech- ni-ques.
4.2.1. Testing of Hypothesis 1 Ho1: The predictive efficacy of Z-Score and Operating Cash Flow models is not significantly different in dis- criminating between would fail and going concern com- panies in cash/developing economy.
This hypothesis is concerned with the comparative eff- icacy of Z-Score model against Operating Cash Flow model in predicting business failures. Here also the re- search is profoundly concerned with the predictive effi- cacy of both models to discriminate in their predictions accurately or wrongly between would fail and going concern companies. This explains the need for capturing against each model, the number of times it accurately or

A. UNEGBU, J. ADEFILA
Copyright © 2013 SciRes. OJAcct
61
Table 3. Variables used for computation of Z-Score and operating cash flow predictions of transport & aviation industrial sampled companies.
2003 2002
Working Capital 66,873,000 92,655,000
Total Assets 1,872,765,000 1,738,011,000
Accumulated Retained Earnings (216,128,000) (282,254,000)
EBIT (38,975,000) (100,085,000)
Book Value of Equity 255,000,000 1,032,990,000
Total Liabilities 984,852,000 838,152,000
Sales 2,387,836,000 2,967,055,000
Z-Score Result 1.24439 1.942027
Z-Score Prediction 9 39
Company Status as at 31st December 2010 Bankrupt Bankrupt
Operating Cash Flow Result Winded up 2005
Operating Cash Flow Prediction (54,276,000) 51,201,000
Alb
arka
Air
PL
C
Bankrupt Non-Bankrupt
2006 2005
Working Capital (1,536,772,000) (1,232,411,000)
Total Assets 461,148,000 277,399,000
Accumulated Retained Earnings 1,643,778,000) (1,666,432,000)
EBIT (22,707,000) 215,911,000
Market Value of Equity 100,000,000 93,255,000
Book Value of Debts 1,928,025,000 1,773,675,000
Sales 3,005,461,000 3,195,015,000
Z-Score Result 0.9643694 6.9014646
Z-Score Prediction Bankrupt Non-Bankrupt
Company Status as at 31st December 2010 2008 Winded up
Operating Cash Flow Result 89,808,000 228,716,000
Avi
atio
n D
evel
opm
ent C
ompa
ny
PL
C
Operating Cash flow Prediction Non-Bankrupt Non-Bankrupt
2009 2008
Working Capital (244,561,000) (289,424,000)
Total Assets 4,060,958,000 3,300,820,000
Accumulated Retained Earnings 164,666,000 239,280,000
EBIT 315,008,000 593,436,000
Market Value of Equity 753,500,000 753,500,000
Book Value of Debts 3,493,454,000 3,020,566,000
Sales 4,051,502,000 3,956,880,000
Z-Score Result 1.3185549 1.8583576
Z-Score Prediction Bankrupt Bankrupt
Company Status as at 31st December 2010 Going Concern
Operating Cash Flow Result 990,853,000 923,777,000
Ass
ocia
ted
Bu
s C
ompa
ny
PL
C
Operating Cash Flow Prediction Non-Bankrupt Non-Bankrupt
Source: Published Financial Statements.
wrongly predicted the future outcomes of corporate enti- ties with material insolvency symptoms. From Tables 2 to Table 5, the predictions of the two models in these re-
spects were extracted. The information is as seen in Ta-ble 7.
A good statistical tool to use in analyzing the informa

A. UNEGBU, J. ADEFILA
Copyright © 2013 SciRes. OJAcct
62
Table 4. Variables used for computation of Z-Score and operating cash flow predictions of Oil Service industrial sampled companies.
2004 2003
Working Capital (287,708,036) (483,922,542)
Total Assets 875,224,406 822,659,783
Accumulated Retained Earnings 375,541,964 179,327,458
EBIT 210,554,856 142,916,318
Book Value of Equity 5,000,000 5,000,000
Total Liabilities 494,682,442 638,332,325
Z-Score Result 0.869375 (1.972337)
Z-Score Prediction Bankrupt Bankrupt
Company Status as at 31st December 2010 Winded up 2008
Operating Cash Flow Result 142,054,856 97,183,639 Mer
idie
n M
arit
ime
and
Off
shor
e S
ervi
ces
Lim
ited
Operating Cash Flow Prediction Non-Bankrupt Non-Bankrupt
2008 2007
Working Capital 58,552,000 52,861,000
Total Assets 175,790,000 100,554,000
Accumulated Retained Earnings (17,654,000) (9,362,000)
EBIT (104,000) (31,281,000)
Book Value of Equity 55,000,000 55,000,000
Total Liabilities 138,444,000 54,916,000
Z-Score Result 2.270639 2.106069
Z-Score Prediction Bankrupt Bankrupt
Company Status as at 31st December 2010 Winded up 2010
Operating Cash Flow Result (8,261,000) (26,617,000)
Sai
pem
Log
isti
cs S
ervi
ces
Lim
ited
Operating Cash Flow Prediction Bankrupt Bankrupt
2007 2006
Working Capital 73,000 1,812,000
Total Assets 1,359,000 2,894,000
Accumulated Retained Earnings (9,927,000) (8,188,000)
EBIT (1,571,000) 1,717,000
Book Value of Equity 1,000,000 10,000,000
Total Liabilities 1,286,000 1,082,000
Z-Score Result (23.063809) 8.57564
Z-Score Prediction Bankrupt Non-Bankrupt
Company Status as at 31st December 2010 Winded up 2009
Operating Cash Flow Result (1,596,000) 1,658,000
NI
Pla
nt S
ervi
ces
Nig
eria
Lim
ited
Operating Cash Flow Prediction Bankrupt Non-Bankrupt

A. UNEGBU, J. ADEFILA
Copyright © 2013 SciRes. OJAcct
63
Continued
2005 2004
Working Capital 5,676,366 6,434,928
Total Assets 9,967,195 10,227,757
Accumulated Retained Earnings 676,366 1,430,957
EBIT (758,562) (716,808)
Book Value of Equity 5,000,000 5,000,000
Total Liabilities 4,292,829 3,792,829
Z-Score Result 4.668507 5.498073
Z-Score Prediction Non-Bankrupt Non-Bankrupt
Company Status as at 31st December 2010 Winded up 2007
Operating Cash Flow Result (758,562) (716,808)
AB
B O
il a
nd
Gas
Nig
eria
Lim
ited
Operating Cash Flow Prediction Bankrupt Bankrupt
Source: Published Financial Statements.
tion contained in Tables 4 and 6 is Analysis of Variance (ANOVA). Using the data from Table 7, weighting with Frequency of predictions and running both Z-Score and Operating Cash aspects in ANOVA thus;
4.2.2. Interpretations and Discussion of Outcomes of Hypothesis One Tests
The result as captured in Table 8 showed that the freq- uencies of outcomes between the two models are signifi- cant as p < 0.05 with F value as large as 8.47 thus, the null hypothesis which states that the predictive efficacy of Z-Score and Operating Cash Flow models is not sig- nificantly different in discriminating between would fail and going concern companies in cash economy is re- jected. Though the result showed that there are very sig- nificant differences between the discriminatory efficacies of the two models, it did not tell us vividly the areas of these differences. To understand the focus of these dif- ferences, it is necessary that further analyzes of the out- comes using cross tabulation percentages be carried out. The outcome of this further analysis is captured in Table 9.
Further analysis of the result as seen in Table 9, showed that Z-Score model had 56.5% of the failed companies rightly predicted as such. On individual pre- dictions of “right” and “wrong”, this represents 79.5% of accurate predictions of would fail companies before they failed. On the other hand, Z-Score model wrongly pre- dicted 14.5% on combined basis representing 20.5% of the predictions of would fail companies as at 31st De- cember 2010. In the same vein, the Z-Score Model only predicted correctly 3.2% representing 11.1% of going concern companies. The model wrongly predicted 25.8% representing 88.9% of going concern companies as at the
date under consideration. Other facts leading to the rejection of the null hypo-
thesis which states that the predictive efficacy of Z-Score and Operating Cash Flow models is not significantly different in discriminating between would fail and going concern companies in cash economy is 40.3% repre- senting 55.6% of failed companies which were rightly predicted by Operating Cash Flow model, while 32.3% representing 44.4% of such companies were wrongly predicted using Operating Cash Flow model. The model in summary effectively predicted 94.1% of going con-cern companies rightly with a slight error prediction of 5.9% of such companies as at 31st December 2010.
A look at Table 9 showed that Z-Score Model was able to predict 79.5% of failed companies accurately but could predict only 11.1% of going concern companies accurately. On the other hand, Operating Cash Flow model was able to predict 94.1% of going concern com- panies rightly and 55.6% of failed companies accurately as seen from Table 9.
4.2.3. Testing of Hypothesis 2 Ho2: The predictive ability across industries in develo- ping economy between Z-Score and Operating Cash Flow models is not significantly different.
To test this hypothesis, the results of prediction of Z-Score and Operating Cash Flow models across the dif- ferent industrial sectors were extracted from sampled companies. In order to test the stated hypothesis, Loglin- ear analysis is made use of so as to extract the nature of partial associations between the models used and out- come of predictions. Data contained in Tables 2 to 6 were extracted and captured as seen in Table 4, 9 infor- mation.

A. UNEGBU, J. ADEFILA
Copyright © 2013 SciRes. OJAcct
64
Table 5. Variables used for computation of Z-Score and operating cash flow predictions of merchandising industrial sampled companies.
2004 2003
Working Capital 363,223,000 343,543,000
Total Assets 755,223,000 785,665,000
Accumulated Retained Earnings 3,755,000 3,543,000
EBIT 206,441,000 218,319,000
Book Value of Equity 340,000,000 340,000,000
Total Liabilities 180,578,000 168,056,000
Z-Score Result 4.1459584 6.875101
Z-Score Prediction Non-Bankrupt Non-Bankrupt
Company Status as at 31st December 2010 Winded up 2006
Operating Cash Flow Result 4 4,590,140 (6,245,794)
El-
Jibo
r M
arke
tin
g C
once
pts
Ltd
Operating Cash Flow Prediction Non-Bankrupt Bankrupt
2005 2004
Working Capital (663,186,00) (713,599,00)
Total Assets 3,536,338,000 3,218,444,000
Accumulated Retained Earnings 369,836,000 466,240,000
EBIT 387,021,000 426,813,000
Market Value of Equity 250,000,000 170,178,000
Book Value of Debts 1,742,973,000 2,053,389,000
Sales 1,369,364,000 1,236,626,000
Z-Score Result 0.7410989 0.794348
Z-Score Prediction Bankrupt Bankrupt
Company Status as at 31st December 2010 Going Concern
Operating Cash Flow Result 406,787,000 567,876,000
Pre
sco
PL
C
Operating Cash Flow Prediction Non-Bankrupt Non-Bankrupt
2009 2008
Working Capital 1,436,066,000 909,593,000
Total Assets 12,178,937,000 11,493,217,000
Accumulated Retained Earnings (3,221,317,000) (3,232,159,000)
EBIT 115,825,000 893,686,000
Market Value of Equity 2,815,770,000 2,600,000,000
Book Value of Debts 5,331,316,000 5,098,493,000
Sales 1,897,583,000 2,295,801,000
Z-Score Result 0.1429941 0.4738503
Z-Score Prediction Bankrupt Bankrupt
Company Status as at 31st December 2010 Going Concern
Operating Cash Flow Result 169,892,000 937,313,000
Sec
ure
Ele
ctro
nic
Tec
hn
olog
y P
LC
Operating Cash Flow Prediction Non-Bankrupt Non-Bankrupt

A. UNEGBU, J. ADEFILA
Copyright © 2013 SciRes. OJAcct
65
Continued
2008 2007
Working Capital (545,187,000) (430,027,000)
Total Assets 2,681,934,000 2,520,299,000
Accumulated Retained Earnings (454,672,000) (547,923,000)
EBIT 93,251,000 37,565,000
Market Value of Equity 616,688,000 560,625,000
Book Value of Debts 1,330,090,000 1,261,706,000
Sales 2,153,930,000 1,465,050,000
Z-Score Result 0.8150539 0.50655
Z-Score Prediction Bankrupt Bankrupt
Company Status as at 31st December 2010 Going Concern
Operating Cash Flow Result 147,916,000 216,412,000
UT
C N
iger
ia P
LC
Operating Cash Flow Prediction Non-Bankrupt Non-Bankrupt
2000 1999
Working Capital (1,818,679) 8,537,461
Total Assets 50,187,983 55,673,448
Accumulated Retained Earnings (42,831,271) (29,968,523)
EBIT (10,681,134) (9,848,070)
Market Value of Equity 67,668,042 67,668,042
Book Value of Debts 25,351,212 17,973,929
Sales 24,164,859 27,675,663
Z-Score Result 0.1912211 1.1817412
Z-Score Prediction Bankrupt Bankrupt
Company Status as at 31st December 2010 Winded up 2002
Operating Cash Flow Result 1,318,572 1,107,475
Rei
tzco
t Nig
eria
Com
pan
y P
LC
Operating Cash Flow Prediction Non-Bankrupt Non-Bankrupt
2005 2004
Working Capital (136,500,000) (256,314,000)
Total Assets 957,401,000 526,600,000
Accumulated Retained Earnings (228,479,000) (230,918,000)
EBIT 41,396,000 (73,502,000)
Book Value of Equity 40,500,000 40,500,000
Total Liabilities 592,623,000 510,275,000
Z-Score Result (1.350822) (5.47766)
Z-Score Prediction Bankrupt Bankrupt
Company Status as at 31st December 2010 Winded up 2007
Operating Cash Flow Result 67,854,000 (46,676,000)
Lu
ckyC
has
Nig
eria
Lim
ited
Operating Cash Flow Prediction Non-Bankrupt Bankrupt

A. UNEGBU, J. ADEFILA
Copyright © 2013 SciRes. OJAcct
66
Continued
2003 2002
Working Capital (98,199,000) (94,985,000)
Total Assets 563,050,000 386,951,000
Accumulated Retained Earnings (104,574,000) (109,578,000)
EBIT 49,976,000 (6,092,000)
Market Value of Equity 40,500,000 40,500,000
Book Value of Debts 335,255,000 372,478,000
Sales 559,766,000 421,038,000
Z-Score Result 1.1032751 0.6666353
Z-Score Prediction Bankrupt Bankrupt
Company Status as at 31st December 2010 Under reorganization 2005
Operating Cash Flow Result 67,901,000 (377,000)
BH
N P
LC
Operating Cash Flow Prediction Non-Bankrupt Bankrupt
Source: Published Financial Statements.
The outcome of the analysis using Loglinear analysis
is as seen in Tables 11 and 12.
4.2.4. Interpretations and Discussion of Outcomes of Hypothesis Two Tests
The results as shown by Table 11, indicates that the eff- ect associated with Sectors and Models used, Sector and Predictions and Models and Predictions are all in-signi- ficant. This result therefore confirms the null hypothesis which stated that predictive ability across industries in developing economy between Z-Score and Operating Cash Flow models is not significantly different. Each model effect on each of the sampled sectors is shown in Table 12. The results as captured by Table 12 also showed that both Z-Score and Operating Cash Flow models is not significantly different. However both Ta- bles 11 and 12 did indicate that each of the models on individual bases is significantly effective on the sectors and frequency of predictions. To identify the skewness of these significant differences; a further analysis is carried out, using the same Table 10 data to running a cross ta- bulation percentages of these efficacies across industrial sectors. This is vividly seen as provided in Table 13.
Z-Score right predictive efficacy on manufacturing sector is about 97.1% as can be seen from Table 13. It is the sector that has highest right prediction efficacy when Z-Score model is used in predicting business failures. In contrast, Z-Score is very poor in predicting accurately would fail enterprises in Service industrial sectors. The model predicted rightly only 20% of would fail service corporate bodies while 80% of firms in service sector were wrongly predicted. At the Transport & Aviation industry, the predictive efficacy is 50% each. Oil Ser- vices got 62.5% rightly predicted by Z-Score. In the
merchandising industry, Z-Score model was found to have poor predictive efficacy as it rightly produced 42.9% of its prediction. In summary, Z-Score predictive efficacy across industrial sectors is very strong in accu- rately predicting the future status of insolvency vermin ridding corporate bodies in the manufacturing, and Oil Services sectors. However its predictive ability across Services and Merchandising sectors were found to be very poor. Z-Score predictive ability on Transport and Aviation industry is only accurate by half.
In conclusion, Z-Score predictive efficacy across indu- strial sectors is accurate within the range of 91.7% for manufacturing, 62.5% for Oil Services, 50% for Trans- port & Aviation, 42.9% for Merchandising and 20% for Services. The outcomes of predictive ability of operating cash flow across industrial sectors were found to be very significant for both rightly and wrongly predictions. The model predicted accurately the future outcomes of Ser-vice sector industries at 77.8%, Merchandising 64.3%, Manufacturing 62.5%, Oil Services 62.5% while Trans- port & Aviation centered around 40%.
4.2.5. Testing of Hypothesis 3 Ho3: Predictive efficacy of the two models does not change significantly as the year increases prior to Cor- porate failure.
The compilations from Tables 2 to 6 in this regard are as seen in Tables 14 and 15 for Z-Score and Operating Cash Flow models respectively.
In order to carry out the test for Z-Score model, Table 14 is made use of, comparing right predictions for two years prior to failure with right predictions of same mod-el three years prior to failure, verse visa. Processing each of the aspects for Z-Score model using Friedman’s

A. UNEGBU, J. ADEFILA
Copyright © 2013 SciRes. OJAcct
67
Table 6. Variables used for computation of Z-Score and operating cash flow predictions of manufacturing industrial sampled companies.
2007 2006
Working Capital (1,652,492) (28,737,320)
Total Assets 1,101,621 32,316,036
Accumulated Retained Earnings (145,961,049) (145,961,049)
EBIT (125,000) (125,000)
Book Value of Equity 250,000 250,000
Total Liabilities 2,754,113 3,578,716
Z-Score Result (442.42478) (46.477815)
Z-Score Prediction Bankrupt Bankrupt
Company Status as at 31st December 2010 Winded up 2009
Operating Cash Flow Result (125,000) (53,556,381)
Moc
oh A
xis
Nig
eria
Lim
ited
Operating Cash Flow Prediction Bankrupt Bankrupt
2005 2004
Working Capital (6,987,603) (10,507,154)
Total Assets 76,536,763 74,513,513
Accumulated Retained Earnings (41,135,520) (43,495,201)
EBIT 3,489,090 (6,566,522)
Market Value of Equity 18,000,000 16,467,869
Book Value of Debts 9,757,227 10,936,419
Sales 94,920,000 22,494,480
Z-Score Result 1.6334902 0.0640475
Z-Score Prediction Bankrupt Bankrupt
Company Status as at 31st December 2010 Refinanced in 2007
Operating Cash Flow Result 2,359,681 (6,601,644)
Sm
art P
rodu
cts
Nig
eria
PL
C
Operating Cash Flow Prediction Non-Bankrupt Bankrupt
1998 1997
Working Capital (42,222,000) (20,344,000)
Total Assets 89,289,000 96,111,000
Accumulated Retained Earnings (37,241,000) (3,620,000)
EBIT (13,661,000) (531,000)
Market Value of Equity 25,000,000 25,000,000
Book Value of Debts 77,904,000 51,105,000
Sales 92,688,000 64,541,000
Z-Score Result 0.0030778 0.6743014
Z-Score Prediction Bankrupt Bankrupt
Company Status as at 31st December 2010 Sold/Restructured 2000
Operating Cash Flow Result (187,570,000) (17,652,000)
Ben
ue
Cem
ent C
ompa
ny
PL
C
Operating Cash Flow Prediction Bankrupt Bankrupt

A. UNEGBU, J. ADEFILA
Copyright © 2013 SciRes. OJAcct
68
Continued
1995 1994
Working Capital (129,658,000) 49,827,000
Total Assets 788,844,000 557,507,000
Accumulated Retained Earnings (94,186,000) 32,410,000
EBIT (47,891,000) 72,006,000
Market Value of Equity 40,500,000 40,500,000
Book Value of Debts 727,346,000 466,661,000
Sales 282,224,000 229,119,000
Z-Score Result (0.0274338) 0.9614536
Z-Score Prediction Bankrupt Bankrupt
Company Status as at 31st December 2010 1997 Under administration
Operating Cash Flow Result (18,649,000) 16,842,00
WT
N P
LC
Operating Cash Flow Prediction Bankrupt Non-Bankrupt
1997 1996
Working Capital (1,688,000) (1,423,000)
Total Assets 15,561,000 17,636,000
Accumulated Retained Earnings (4,333,000) (4,859,000)
EBIT 1,069,000 421,000
Market Value of Equity 3,750,000 3,750,000
Book Value of Debts 8,777,000 11,378,000
Sales 12,922,000 10,571,000
Z-Score Result 0.908010768 0.519579544
Z-Score Prediction Bankrupt Bankrupt
Company Status as at 31st December 2010 Winded up 1999
Operating Cash Flow Result 94,876,000 502,000
Nig
eria
n W
ire
indu
stri
es P
LC
Operating Cash Flow Prediction Non-Bankrupt Non-Bankrupt
2003 2002
Working Capital (99,389,000) (40,693,000)
Total Assets 1,312,038,000 1,212,017,000
Accumulated Retained Earnings 60,232,000 41,800,000
EBIT 105,789,000 97,671,000
Market Value of Equity 157,128,000 157,128,000
Book Value of Debts 831,014,000 749,425,000
Sales 395,808,000 320,523,000
Z-Score Result 0.6157822 0.6075995
Z-Score Prediction Bankrupt Bankrupt
Company Status as at 31st December 2010 Went through reorganization in 2005
Operating Cash Flow Result 127,593,000 124,329,000
Tri
pple
Gee
& C
ompa
ny
PL
C
Operating Cash Flow Prediction Non-Bankrupt Non-Bankrupt
A. UNEGBU, J. ADEFILA
Copyright © 2013 SciRes. OJAcct
69
Continued
2004 2003
Working Capital 79,534,000 212,930,000
Total Assets 2,188,561,000 2,571,886,000
Accumulated Retained Earnings 1,357,962,000 1,987,168,000
EBIT (266,723,000) 20,421,000
Market Value of Equity 280,600,000 280,600,000
Book Value of Debts 1,162,431,000 886,213,000
Sales 2,084,230,000 2,820,736,000
Z-Score Result 1.2248022 1.9663209
Z-Score Prediction Bankrupt Bankrupt
Company Status as at 31st December 2010 Under-reorganization 2006
Operating Cash Flow Result (95,337,000) 87,441,000
AF
PR
INT
PL
C
Operating Cash Flow Prediction Bankrupt Non-Bankrupt
2001 2000
Working Capital (267,277,000) (219,343,000)
Total Assets 327,440,000 289,617,000
Accumulated Retained Earnings (426,563,000) (366,834,000)
EBIT (27,085,000) (31,927,000)
Market Value of Equity 150,000,000 149,940,000
Book Value of Debts 435,409,000 337,965,000
Sales 399,185,000 308,109,000
Z-Score Result (0.0701473) (0.7105266)
Z-Score Prediction Bankrupt Bankrupt
Company Status as at 31st December 2010 Under Reorganization 2003
Operating Cash Flow Result (3,991,000) (23,868,000)
Inte
rnat
ion
al B
rew
erie
s P
LC
Operating Cash flow Prediction Bankrupt Bankrupt
2009 2008
Working Capital 129,702,000 92,101,000
Total Assets 872,374,000 997,418,000
Accumulated Retained Earnings (443,514,000) (473,462,000)
EBIT 94,404,000 109,481,000
Market Value of Equity 600,000,000 600,000,000
Book Value of Debts 478,514,000 633,506,000
Sales 2,178,432,000 2,368,590,000
Z-Score Result 3.0313348 2.7732029
Z-Score Prediction Non-Bankrupt Non-Bankrupt
Company Status as at 31st December 2010 Going Concern
Operating Cash Flow Result 116,980,000 117,207,000
Liv
esto
ck F
eeds
PL
C
Operating Cash Flow Prediction Non-Bankrupt Non-Bankrupt

A. UNEGBU, J. ADEFILA
Copyright © 2013 SciRes. OJAcct
70
Continued
2002 2001
Working Capital (83,603,124) (63,550,383)
Total Assets 415,587,139 369,386,493
Accumulated Retained Earnings (172,297,811) (151,206,439)
EBIT 13,307,085 45,733,634
Market Value of Equity 109,978,000 109,978,000
Book Value of Debts 352,950,663 285,578,645
Sales 446,300,320 492,303,099
Z-Score Result 0.7872343 1.4063655
Z-Score Prediction Bankrupt Bankrupt
Company Status as at 31st December 2010 Going Concern
Operating Cash Flow Result 25,704,010 45,613,550
Operating Cash Flow Prediction Non-Bankrupt Non-Bankrupt
2008 2007
Working Capital 6,981,320,000 3,163,438,000
Total Assets 15,129,771,000 12,428,617,000
Accumulated Retained Earnings (237,654,000) 1,416,254,000
EBIT (994,866,000) (465,234,000)
Market Value of Equity 421,642,000 421,642,000
Book Value of Debts 10,923,683,000 6,568,621,000
Sales 8,433,011,000 11,436,696,000
Z-Score Result 0.6856542 3.7769753
Z-Score Prediction Bankrupt Bankrupt
Company Status as at 31st December 2010 Under reorganization 2010
Operating Cash Flow Result (383,333,000) 93,374,000
Operating Cash Flow Prediction Bankrupt Non-Bankrupt
2003 2002
Working Capital (4,153,292,000) (2,923,698,000)
Total Assets 7,515,055,000 3,432,133,000
Accumulated Retained Earnings (6,495,233,000) (5,582,773,000)
EBIT (376,655,000) (1,118,415,000)
Market Value of Equity 247,500,000 247,500,000
Book Value of Debts 17,214,000 5,682,996,000
Sales Nil 390,996,000
Z-Score Result (1.2686114) (2.8691145)
Z-Score Prediction Bankrupt Bankrupt
Company Status as at 31st December 2010 Successfully reorganized in 2005 to 2006
Operating Cash Flow Result (181,572,000) (17,652,000)
Operating Cash Flow Prediction Bankrupt Bankrupt
Source: Published Financial Statements.
ANOVA, the test results are shown in Tables 16 and 17 for Right and Wrong predictions respectively as shown

A. UNEGBU, J. ADEFILA
Copyright © 2013 SciRes. OJAcct
71
Table 7. Rightly & Wrongly predictions of Z-Score and Operating Cash Flow models for failed and going concern companies.
Predictors
Z-Score Prediction Operating Cash Flow Status
Rightly Predicted Wrongly Predicted Rightly Predicted Wrongly Predicted
Failed Companies 36 9 25 20
Going Concern Companies 1 16 16 1
Source: Extracts from Tables 2 to 6.
Table 8. Rightly and wrongly discriminatory ANOVA between Z-Score and operating cash flow.
Sum of Squares df Mean Square F Sig.
(Combined) 0.016 1 0.016 0.074 0.787Between Groups
Linear Term Contrast 0.016 1 0.016 0.074 0.787
Within Groups 26.198 122 .215
Status of the Company as at
31/12/2010
Total 26.214 123
(Combined) 650.452 1 650.452 8.4710 0.004Between Groups
Linear Term Contrast 650.452 1 650.452 8.4710 0.004
Within Groups 9367.419 122 76.782
Frequencies of Outcome
Total 10017.871 123
Source: SPSS generated ANOVA.
Table 9. Efficacy of Z-Score and operating cash flow on predicting future status of companies expressed in percentages.
Status of the Company as at 31/12/2010
Failed Company Rightly Predicted
Failed Company Wrongly Predicted
Going Concern Company Rightly
Predicted
Going Concern Company Wrongly
Predicted
Total
Count 35.0% 9.0% 2.0% 16.0% 62.0%
Expected Count 30.0 14.5 9.0 8.5 62.0 Z-Score Model
% within Prediction Mod-el Used
56.5% 14.5% 3.2% 25.8% 100.0%
Count 25.0% 20.0% 16.0% 1.0% 62.0%
Expected Count 30.0 14.5 9.0 8.5 62.0
Prediction Model Used
OCF Model
% within Prediction Mod-el Used
40.3% 32.3% 25.8% 1.6% 100.0%
Count 60.0% 29.0% 18.0% 17.0% 124.0%
Expected Count 60.0 29.0 18.0 17.0 124.0 Total
% within Prediction Mod-el Used
48.4% 23.4% 14.5% 13.7% 100.0%
Source: SPSS generated Percentages.
below.
4.2.6. Interpretations and Discussion of Outcomes of Aspects of Hypothesis Three Tests
The Z-Score model “right predictions” of Friedman’s ANOVA result as shown in Table 16 confirmed that there are significant differences in right prediction efficacies of the model as the year increases prior to business failure. Also the “wrong predictions” of Friedman’s ANOVA
result as seen in Table 17 did confirm that there is sig- nificant changes on the predictive efficacy of Z-Score model relative to year prior to corporate failure. In both cases p < 0.05 but the variation in changes were more with “Right” Predictions than with “Wrong” predictions because the differences in chi-square value were more in right predictions than in wrong predictive efficacy of Z-Score model. In conclusion, the null hypothesis which suggests that the predictive efficacy of Z-Score model

A. UNEGBU, J. ADEFILA
Copyright © 2013 SciRes. OJAcct
72
Table 10. Predictive efficacy across industrial sectors of Z-Score & operating cash models.
Z-Score Model Operating Cash Flow Model Industrial Sector
Rightly Predicted Wrongly Predicted Rightly Predicted Wrongly Predicted
Services 2 8 7 2
Transport and Aviation 3 3 2 3
Oil Services 5 3 5 3
Merchandising 6 8 9 5
Manufacturing 22 2 15 9
Source: Extracts from Tables 2 to 6.
Table 11. Partial associations.
Effect df Partial Chi-Square Sig. Number of Iterations
Sector*Model 10 0.089 1.000 2
Sector*Prediction 10 8.691 0.562 2
Model*Prediction 4 0.032 1.000 2
Sector 5 76.612 0.000 2
Model 2 98.966 0.000 2
Prediction 2 106.387 0.000 2
does not change significantly as the year increases prior to Corporate failure is hereby rejected. To see detailed directions of these variations in predictive efficacy of Z-Score relative to the year prior to business failures, a Cross tabulation percentage analysis is carried out. The result is as seen in Table 18.
The changes in predictive efficacy of Z-Score in two years prior to failure compared with three years prior to failure are depicted in Table 18 clearly. The table showed that for Service and Merchandising industrial sectors, there were no changes in predictions but for Transport & Aviation Sector, the right predictive efficacy of Z-Score model increases as the year tends towards failure. This is confirmed by the fact that the right pre- diction of the model by the third year prior to failure was 50% for Transport & Aviation but the second year prior to failure has increased to 100%. There were also in- creases in the predictive ability of Z-Score for both Oil Services and Manufacturing Sectors as the year under consideration becomes closer to the year of business failure. In summary, this is the direction of predictive changes from three years to two years prior to business failure inherent in Z-Score model: Manufacturing 90% to 100% Right Predictions (In-
creases in predictive ability). Oil Services 40% to 60% Right Predictions (Increases
in predictive ability). Transport & Aviation 50% to100% Right Predictions
(Increases in predictive ability). Merchandising 75% to 75% Right Predictions (No
Change in predictive ability).
Service 50% to 50% Right Predictions (No Change in predictive ability).
In conclusion of this aspect of the hypothesis, there are significant changes in the predictive efficacy of Z-Score model in Manufacturing, Oil Services and Transport & Aviation Industrial Sectors as the year towards year of failure becomes closer but there are no changes in the predictive efficacy for Service and Merchandising Indus-trial Sectors.
In order to test same hypothesis for Operating Cash Flow model, the data in Table 19 are processed with Friedman’s ANOVA for both predictive aspects of the model. The results are as shown in Tables 19 and 20 re- spectively.
4.2.7. Interpretations and Discussion of Outcomes of Aspects of Hypothesis Five Tests
As seen from Tables 19 and 20 of the results of Frie- dman’s ANOVA test statistics (p < 0.05), there are sig- nificant changes in the Operating Cash Flow model’s predictive efficacy as the year tends towards year of corporate failure. To understand clearly these variations, a cross percentage tabulations of these changes is com- puted. This tabulation is contained in Table 21.
The cross percentage analysis shown in Table 21 clearly shows that the predictive efficacy of Operating Cash Flow model changes as the year closes towards year of corporate failure. This contradicts the trend shown by Z-Score model. In contradiction to Z-Score model, the predictive efficacy of Operating Cash Flow model changes significantly as the year of corporate fail-

A. UNEGBU, J. ADEFILA
Copyright © 2013 SciRes. OJAcct
73
Table 12. Parameter estimates.
95% Confidence Interval Dependent Variable
Parameter B Std. Error t Sig. Lower Bound Upper Bound
Intercept 3.000 0.460 6.528 0.000 2.090 3.910
[Model = 1] −1.500 0.563 −2.665 0.009 −2.615 −0.385
[Model = 2] −1.500 0.563 −2.665 0.009 −2.615 −0.385
[Model = 3] 0a . . . . .
[Sector = 1] * [Model = 1] 0.300 0.741 0.405 0.686 −1.167 1.767
[Sector = 1] * [Model = 2] −0.278 0.743 −0.374 0.709 −1.748 1.193
[Sector = 1] * [Model = 3] 0a . . . . .
[Sector = 2] * [Model = 1] 2.240E-14 0.750 0.000 1.000 −1.486 1.486
[Sector = 2] * [Model = 2] 0.100 0.755 0.132 0.895 −1.395 1.595
[Sector = 2] * [Model = 3] 0a . . . . .
[Sector = 3] * [Model = 1] −0.125 0.629 −0.199 0.843 −1.371 1.121
[Sector = 3] * [Model = 2] −0.125 0.629 −0.199 0.843 −1.371 1.121
[Sector = 3] * [Model = 3] 0a . . . . .
[Sector = 4] * [Model = 1] 0.071 0.737 0.097 0.923 −1.388 1.531
[Sector = 4] * [Model = 2] −0.143 0.737 −0.194 0.847 −1.602 1.317
[Sector = 4] * [Model = 3] 0a . . . . .
[Sector = 5] * [Model = 1] −0.417 0.733 −0.569 0.571 −1.868 1.034
Outcome of Prediction
[Sector = 5] * [Model = 2] −0.125 0.733 −0.171 0.865 −1.576 1.326
Intercept 1.000 3.085 0.324 0.746 −5.110 7.110
[Sector = 1] * [Model = 1] 5.800 4.975 1.166 0.246 −4.052 15.652
[Sector = 1] * [Model = 2] 4.889 4.985 0.981 0.329 −4.984 14.762
[Sector = 1] * [Model = 3] 0a . . . . .
[Sector = 2] * [Model = 1] 2.000 5.038 0.397 0.692 −7.978 11.978
[Sector = 2] * [Model = 2] 1.600 5.070 0.316 0.753 −8.440 11.640
[Sector = 2] * [Model = 3] 0a . . . . .
[Sector = 3] * [Model = 1] 0.250 4.225 0.059 0.953 −8.117 8.617
[Sector = 3] * [Model = 2] 0.250 4.225 0.059 0.953 −80.117 8.617
[Sector = 3] * [Model = 3] 0a . . . . .
[Sector = 4] * [Model = 1] 6.143 4.947 1.242 0.217 −3.655 15.941
[Sector = 4] * [Model = 2] 6.571 4.947 1.328 0.187 −3.227 16.369
[Sector = 4] * [Model = 3] 0a . . . . .
[Sector = 5] * [Model = 1] 19.333 4.919 3.931 0.000 90.592 29.074
[Sector = 5] * [Model = 2] 11.750 4.919 2.389 0.018 2.009 21.491
Frequencies of Predictions
[Sector = 6] * [Model = 3] 0a . . . . .
a0. This parameter is set to zero because it is redundant 0.
ures becomes nearer for Service, Transport & Aviation, Oil Services, Merchandising and Manufacturing Indus- trial Sectors. These predictive changes were not at same
rate and towards the same directions. Using Operating Cash Flow model there are significant right prediction increases from 3 to 2 years prior to failure in the follow-

A. UNEGBU, J. ADEFILA
Copyright © 2013 SciRes. OJAcct
74
Table 13. Industrial sector predictions and outcomes of prediction models expressed in percentages.
Prediction outcomes Total Prediction Model Used
Rightly Predicted Wrongly Predicted
Count 2 8 10 Service
% within Industrial Sector 20.0% 80% 100.0%
Count 3 3 6 Transport & Aviation
% within Industrial Sector 50.0% 50% 100.0%
Count 5 3 8 Oil Services
% within Industrial Sector 62.5% 37.5% 100.0%
Count 6 8 14 Merchandising
% within Industrial Sector 42.9% 57.1% 100.0%
Count 22 2 24
Industrial Sector
Manufacturing % within Industrial Sector 91.7% 8.3% 100.0%
Count 38 24 62
Z-Score
Total % within Industrial Sector 61.3% 38.7% 100.0%
Count 7 2 9 Service
% within Industrial Sector 77.8% 22.2% 100.0%
Count 2 3 5 Transport & Aviation
% within Industrial Sector 40.0% 60.0% 100.0%
Count 5 3 8 Oil Services
% within Industrial Sector 62.5% 37.5% 100.0%
Count 9 5 14 Merchandising
% within Industrial Sector 64.3% 35.7% 100.0%
Count 15 9 24
Industrial Sector
Manufacturing % within Industrial Sector 62.5% 37.5% 100.0%
Count 38 22 60
Operating Cash Flow
Total % within Industrial Sector 63.3% 36.7% 100.0%
Source: SPSS generated Cross-tabulation percentages.
ing sectors: Manufacturing : 50% to 70% Right predictions Oil Services : 50% to 75% Right Predictions Transport & Aviation 0.0% to 50% Right Predictions.
However, there were reductions in right prediction in the following sectors: Merchandising 75% to 0.0% Service 100% to 50%.
As a result of these manifest changes both in magn- itude and in direction, the hypothesis which states that predictive efficacy of Z-Score and Operating Cash Flow models does not change significantly as the year in- creases prior to Corporate failure is therefore rejected. Alternatively the stipulation that the predictive efficacy of Z-Score and Operating Cash Flow models do change positively as the year becomes closer to the year of cor-
porate failure, for some industrial sectors is accepted although it turns out to be negative for some but some- times no change depending on the model in question.
4.3. Findings
The predictive efficacy of Z-Score and Operating Cash Flow models is significantly different in discriminating between would fail and going concern companies in cash economy.
From the outcome of test statistics of hypothesis three, the study found that Z-Score model has a higher efficacy of predicting would fail/failing companies than Operat- ing Cash Flow model in cash economy. On the other hand, Operating Cash Flow model has a higher capacity to predicting more accurately going concern future status

A. UNEGBU, J. ADEFILA
Copyright © 2013 SciRes. OJAcct
75
Table 14. Z-Score model’s predictive efficacy over 2 to 3 years prior to failure.
2 years prior to failure 3 years prior to failure Industrial Sector
Rightly Predicted Wrongly Predicted Rightly Predicted Wrongly Predicted
Services 1 1 1 1
Transport and Aviation 2 0 1 1
Oil Services 3 2 2 3
Merchandising 3 1 3 1
Manufacturing 10 0 9 1
Source: Extracts of Tables 2 to 6.
Table 15. Operating Cash Flow model’s predictive efficacy over 2 to 3 years prior to failure.
2 years prior to failure 3 years prior to failure Industrial Sector
Rightly Predicted Wrongly Predicted Rightly Predicted Wrongly Predicted
Services 1 1 2 0
Transport and Aviation 1 1 0 2
Oil Services 3 1 2 2
Merchandising 0 4 3 1
Manufacturing 7 3 5 5
Source: Extracts of Tables 2 to 6.
Table 16. Z-Score model’s right predictive efficacy over 2 to 3 years prior to failure—Friedman ANOVA test statistics.
N 35
Chi-Square 42.252
df 1
Asymp. Sig. 0.000
Exact Sig. 0.000
Point Probability 0.000
Source: SPSS generated result.
of companies than failing ones. In summary, Z-Score model is highly effective in predicting the future faith of failing companies but less effective in asserting the fu- ture status of going concern companies in cash economy. Also found to be effective in predicting insolvency in cash economy is Operating Cash Flow model but it is more effective in testing corporate future solvency stress status of going concern companies than failing compa- nies. Z-Score model predicted correctly 79.5% failed companies before they eventually failed. This result can conveniently help us to assert that Z-Score Insolvency prediction model level of efficacy is more than 79% with corporate bodies operating in Cash Economy.
Analysis of predictive efficacy across industrial sect- ors shows that the predictive ability across industries in developing economy between Z-Score and Operating Cash Flow model is not significantly different. On indi- vidual basis, Z-Score predictive efficacy across industrial sectors is accurate within the range of 91.7% for manu-
Table 17. Z-Score model’s wrong predictive efficacy over 2 to 3 years prior to failure—Friedman ANOVA Test Statis-tics.
N 11
Chi-Square 7.588
df 1
Asymp. Sig. 0.023
Exact Sig. 0.020
Point Probability 0.003
Source: SPSS generated result.
facturing, 62.5% for Oil Services, 50% for Transport & Aviation, 42.9% for Merchandising and 20% for Services. On the other hand, The outcomes of predictive ability of operating cash flow across industrial sectors were found to be very significant for both rightly and wrongly pre- dictions. The model predicted accurately the future out- comes of Service sector industries at 77.8%, Merchan- dising 64.3%, Manufacturing 62.5%, Oil Services 62.5% while Transport & Aviation centered around 40%. Pre-cisely, there are significant differences in the efficacy of predictions between Z-Score and Operating Cash Flow models across industrial sectors. While Z-Score model is found to be more effective in its accurate predictive abil- ity on Manufacturing and Oil Service Sectors, Operating Cash Flow Model is seen to be more effective in predict- ing accurately Service and Merchandising Sectors. It should be noted that Z-Score model showed a poor accu- rate predictive capacity on both Service and Merchan- dising sectors while Operating Cash Flow model was

A. UNEGBU, J. ADEFILA
Copyright © 2013 SciRes. OJAcct
76
Table 18. Z-Score model’s predictive efficacy over 2 to 3 years prior to failure cross tabulation percentages.
Prediction Outcome Years prior to failure
Rightly Predicted Wrongly Predicted
Total
Count 1 1 2 Service
% within Industrial Sector 50.0% 50.0% 100.0%
Count 2 0 2 Transport and Avia-tion % within Industrial Sector 100.0% 0.0% 100.0%
Count 3 2 5 Oil Services
% within Industrial Sector 60.0% 40.0% 100.0%
Count 3 1 4 Merchandising
% within Industrial Sector 75.0% 25.0% 100.0%
Count 10 0 10
Industrial Sector
Manufacturing % within Industrial Sector 100.0% 0.0% 100.0%
Count 19 4 23
Two Years prior to failure
Total % within Industrial Sector 82.6% 17.4% 100.0%
Count 1 1 2 Service
% within Industrial Sector 50.0% 50.0% 100.0%
Count 1 1 2 Transport and Aviation % within Industrial Sector 50.0% 50.0% 100.0%
Count 2 3 5 Oil Services
% within Industrial Sector 40.0% 60.0% 100.0%
Count 3 1 4 Merchandising
% within Industrial Sector 75.0% 25.0% 100.0%
Count 9 1 10
Industrial Sector
Manufacturing % within Industrial Sector 90.0% 10.0% 100.0%
Count 16 7 23
Three Years prior to failure
Total % within Industrial Sector 69.6% 30.4% 100.0%
Source: SPSS generated result.
Table 19. Operating Cash Flow model’s Right predictive efficacy over 2 to 3 years prior to failure—Friedman ANO-VA test statistics.
N 20
Chi-Square 16.088
df 1
Asymp. Sig. 0.000
Exact Sig. 0.000
Point Probability 0.000
Source: SPSS generated result.
equally found to be a poor prediction tool for Transport & Aviation industrial sector. On the average, operating cash flow is a better predictor across industrial sectors.
Table 20. Operating Cash Flow model’s wrong predictive efficacy over 2 to 3 years prior to failure—Friedman ANO- VA test statistics.
N 20
Chi-Square 17.000
df 1
Asymp. Sig. 0.000
Exact Sig. 0.000
Point Probability 0.000
Source: SPSS generated result.
The research outcomes showed that the predictive effi-
cacy of Z-Score model does change significantly as the year becomes closer prior to Corporate failure. Results
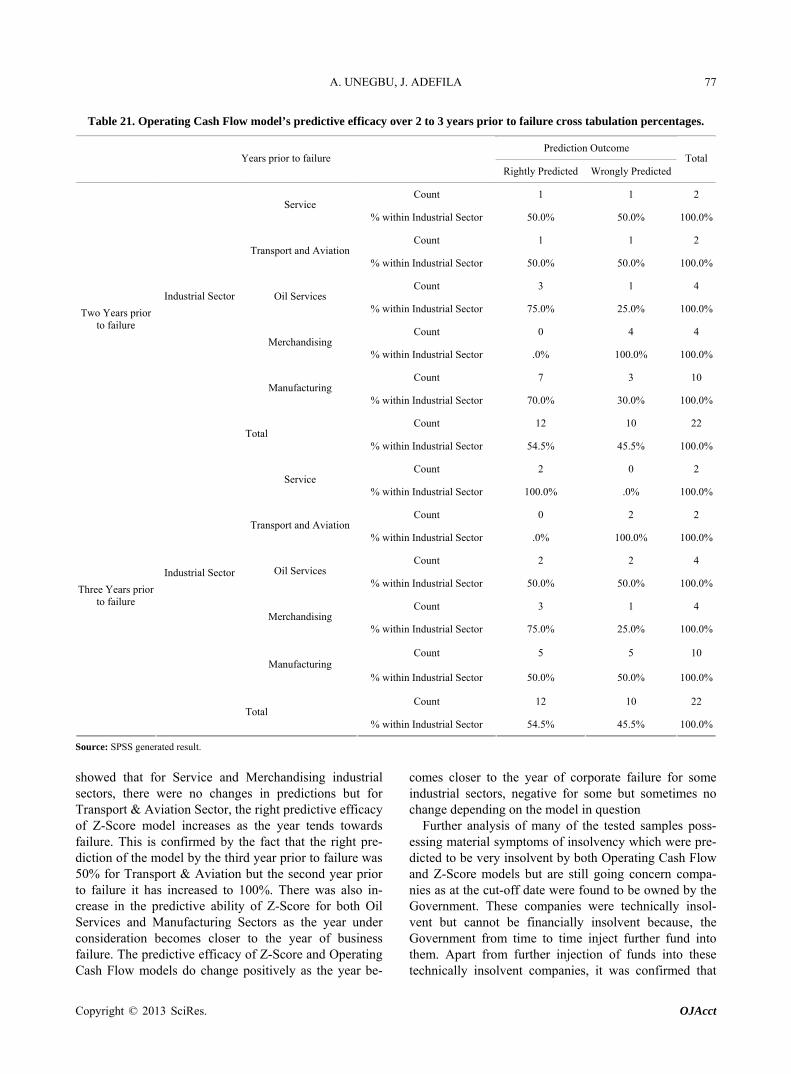
A. UNEGBU, J. ADEFILA
Copyright © 2013 SciRes. OJAcct
77
Table 21. Operating Cash Flow model’s predictive efficacy over 2 to 3 years prior to failure cross tabulation percentages.
Prediction Outcome Years prior to failure
Rightly Predicted Wrongly PredictedTotal
Count 1 1 2 Service
% within Industrial Sector 50.0% 50.0% 100.0%
Count 1 1 2 Transport and Aviation
% within Industrial Sector 50.0% 50.0% 100.0%
Count 3 1 4 Oil Services
% within Industrial Sector 75.0% 25.0% 100.0%
Count 0 4 4 Merchandising
% within Industrial Sector .0% 100.0% 100.0%
Count 7 3 10
Industrial Sector
Manufacturing % within Industrial Sector 70.0% 30.0% 100.0%
Count 12 10 22
Two Years prior to failure
Total % within Industrial Sector 54.5% 45.5% 100.0%
Count 2 0 2 Service
% within Industrial Sector 100.0% .0% 100.0%
Count 0 2 2 Transport and Aviation
% within Industrial Sector .0% 100.0% 100.0%
Count 2 2 4 Oil Services
% within Industrial Sector 50.0% 50.0% 100.0%
Count 3 1 4 Merchandising
% within Industrial Sector 75.0% 25.0% 100.0%
Count 5 5 10
Industrial Sector
Manufacturing % within Industrial Sector 50.0% 50.0% 100.0%
Count 12 10 22
Three Years prior to failure
Total % within Industrial Sector 54.5% 45.5% 100.0%
Source: SPSS generated result.
showed that for Service and Merchandising industrial sectors, there were no changes in predictions but for Transport & Aviation Sector, the right predictive efficacy of Z-Score model increases as the year tends towards failure. This is confirmed by the fact that the right pre- diction of the model by the third year prior to failure was 50% for Transport & Aviation but the second year prior to failure it has increased to 100%. There was also in- crease in the predictive ability of Z-Score for both Oil Services and Manufacturing Sectors as the year under consideration becomes closer to the year of business failure. The predictive efficacy of Z-Score and Operating Cash Flow models do change positively as the year be-
comes closer to the year of corporate failure for some industrial sectors, negative for some but sometimes no change depending on the model in question
Further analysis of many of the tested samples poss- essing material symptoms of insolvency which were pre- dicted to be very insolvent by both Operating Cash Flow and Z-Score models but are still going concern compa- nies as at the cut-off date were found to be owned by the Government. These companies were technically insol- vent but cannot be financially insolvent because, the Government from time to time inject further fund into them. Apart from further injection of funds into these technically insolvent companies, it was confirmed that

A. UNEGBU, J. ADEFILA
Copyright © 2013 SciRes. OJAcct
78
these Government Companies’ liabilities were owed to different levels or organs of Government which by law cannot bring actions that will liquidate their debtor com- panies. Government owned companies that are still going concern despite confirmed by the two models that they are technically insolvent represent 67% of companies that are still in operation as at the research cut-off date.
4.4. Recommendations
It is our recommendation that: 1) Z-Score model should be employed for prediction
of corporate failure for Manufacturing and Oil Service industrial sectors while operating cash flow is better used for the prediction of corporate failures for Merchandising, Transport, Aviation and Service industrial sectors.
2) Though technical insolvency is not a sign of corp- orate bankruptcy surely it is an indicator of negative Cor- porate Solvency Stress test. Where Government owned or substantially owned Firm is confirmed technically insolvent, further dealings with such Organization is ad- vised to be carried out on cash basis because there is all indication that payment may be defaulted on the part of such Organization on completion of the transaction. However, where there is foreseeable evidence of injec- tion of funds from the Government on or before the completion of the transaction, this stipulated solvency fears may be waived.
REFERENCES [1] L. Beloqui, J. M. Usategui and M. Tran, “Emerging Eco-
nomies,” 2008. www.answers.com/topic/emerging-markets
[2] FIN24.com, “13 Banks Liquidated in Nigeria,” 2009. http://www.cenbank.org/MonetaryPolicy/policy.asp
[3] J. A. Ibiyemi, “Introduction to Insolvency Practice in Ni- geria,” Spectrum Books Limited, Ibadan, 1999, pp. 3-60.
[4] B. T. Kloster and H. D. Jacobsen, “What Influences the Number of Bankruptcies?” Economic Bulletin, Vol. 76, No. 4, 2005, pp. 191-211.
[5] K. P. Coats and L. F. Fant, “Recognizing Financial Dis- tress Patterns Using Neural Network Tool,” Financial Management, Vol. 23, No. 3, 1993, pp. 142-154. doi:10.2307/3665934
[6] R. L. Wilson and R. Sharda, “Bankruptcy Prediction Us- ing Neural Networks,” Decision Support Systems, Vol. 11, No. 5, 1994, pp. 545-557. doi:10.1016/0167-9236(94)90024-8
[7] D. E. O’Leary, “Using Neural Networks to Predict Cor- porate Failure,” International Journal of Intelligent Sys- tems in Accounting, Finance and Management, No. 7,
1998, pp. 187-197.
[8] E. Neophytou, A. Charitou and C. Charalambous, “Pre- dicting Corporate Failure, Empirical Evidence for the United Kingdom,” Journal of Finance, Vol. 16, No. 3, 2000, pp. 884-908.
[9] Goliath, “Corporate Bankruptcy Prediction Models Ap- plied to Emerging Economies: Evidence from Argentina in the Years 1991-1998,” International Journal of Com- merce and Management, Vol. 17, No. 4, 2007, pp. 295- 311.
[10] G. Thornton, “Corporate Governance Series-Zone of In- solvency: Decision-Making in Times of Distress,” 2010. http://www.gt.com/staticfiles/../Corporate%20goverance/CG_Insolvency.pdf
[11] M. A. Rujoub, D. M. Cook and L. E. Hay, “Using Cash Flow Ratios to Predict Business Failures,” Journal of Managerial, Vol. 7, No. 1, 1995, pp. 47-72.
[12] C. Casey and N. Bartczak, “Using Operating Cash Flow Data to Predict Financial Distress: Some Extensions,” Journal of Accounting Research, Vol. 23, No. 1, 1985, pp. 384-401. doi:10.2307/2490926
[13] D. S. Sharma, “The Role of Cash Flow Information in Predicting Corporate Failure—The State of the Litera- ture,” Accounting Forum, Vol. 27, No. 4, 2001, pp. 1-26.
[14] N. Kuruppu, F. Laswad and P. Oyelere, “The Efficacy of Liquidation and Bankruptcy Prediction Models for As-sessing Going Concern,” Centre of Accounting Education and Research, 2002, pp. 1-18.
[15] J. R. Franks, K. G. Nyborg and W. N. Torous, “A Com- parison of US, UK, and German Insolvency Codes,” Fi- nancial Management, Vol. 25, No. 3, 1996, pp. 86-101. doi:10.2307/3665810
[16] S. M. Schultz, “Financial Reporting for firms in Chapter 11 Reorganization,” National Public Accountant, Vol. 40, No. 1, 1995, pp. 2-24.
[17] K. M. J. Kaiser, “European Bankruptcy Laws: Implica- tions for Corporations Facing Financial Distress,” Finan- cial Management, Vol. 25, No. 3, 1996, pp. 67-85. doi:10.2307/3665809
[18] G. Omoh, “Two Million Registered Companies in Nige-ria,” 2012. http://omohgabriel.com/two-million-registered-companies-in-nigeria/..0.2
[19] W. G. Cochran, “Sampling Techniques,” 2nd Edition, John Wiley & Sons, New York, 1963, p. 75.
[20] A. S. Ross, W. R. Westerfield and J. Jaffe, “Corporate Finance,” 6th Edition, The McGraw-Hill/Irwin Compa-nies, Incorporated, Boston, 2002, pp. 172-871.
[21] E. I. Altman, “Predicting Financial Distress of Companies Using Z-Score & Zeta Models,” Working Paper, Stern School of Business, New York University, 2000, pp. 22- 24.