Embed Size (px)
DESCRIPTION
Effects of Young Clusters on Forming Solar Systems. Fred C. Adams University of Michigan. Stars to Planets, Univ. Florida. WITH: Eva M. Proszkow, Anthony Bloch (Univ. Michigan) Philip C. Myers (CfA), Marco Fatuzzo (Xavier University) David Hollenbach (NASA Ames), Greg Laughlin (UCSC). - PowerPoint PPT Presentation
Citation preview
Effects of Young Clusters
on Forming Solar Systems
WITH: Eva M. Proszkow, Anthony Bloch (Univ. Michigan)Philip C. Myers (CfA), Marco Fatuzzo (Xavier University)David Hollenbach (NASA Ames), Greg Laughlin (UCSC)
Fred C. AdamsUniversity of Michigan
Stars to Planets, Univ. Florida
Most stars form in clusters:
In quantitative detail: What effects does the cluster environment haveon solar system formation?
•N-body Simulations of Clusters
•UV Radiation Fields in Clusters
•Disk Photoevaporation Model
•Scattering Encounters
Outline
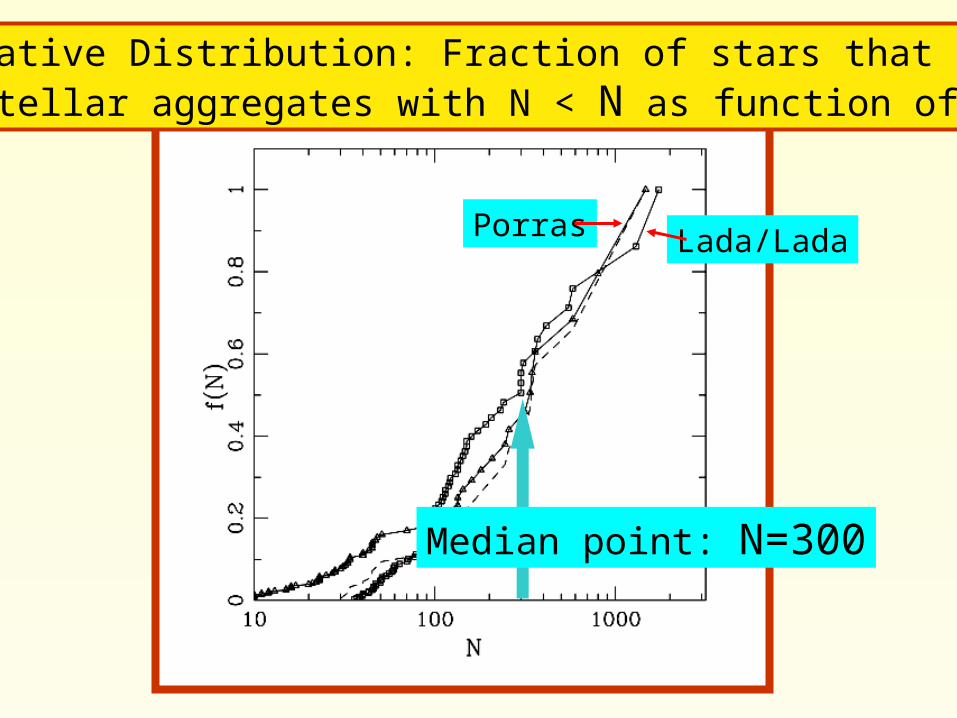
Cumulative Distribution: Fraction of stars that form in stellar aggregates with N < N as function of N
Lada/LadaPorras
Median point: N=300
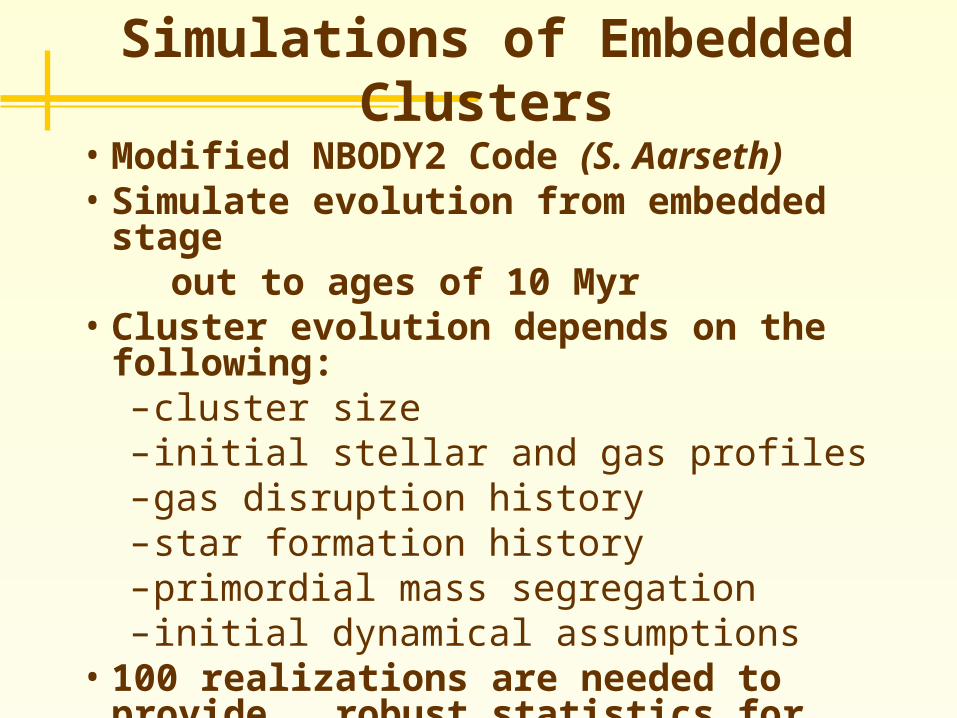
Simulations of Embedded Clusters
• Modified NBODY2 Code (S. Aarseth)• Simulate evolution from embedded
stage out to ages of 10 Myr• Cluster evolution depends on the
following:–cluster size– initial stellar and gas profiles–gas disruption history–star formation history–primordial mass segregation– initial dynamical assumptions
• 100 realizations are needed to provide robust statistics for output measures
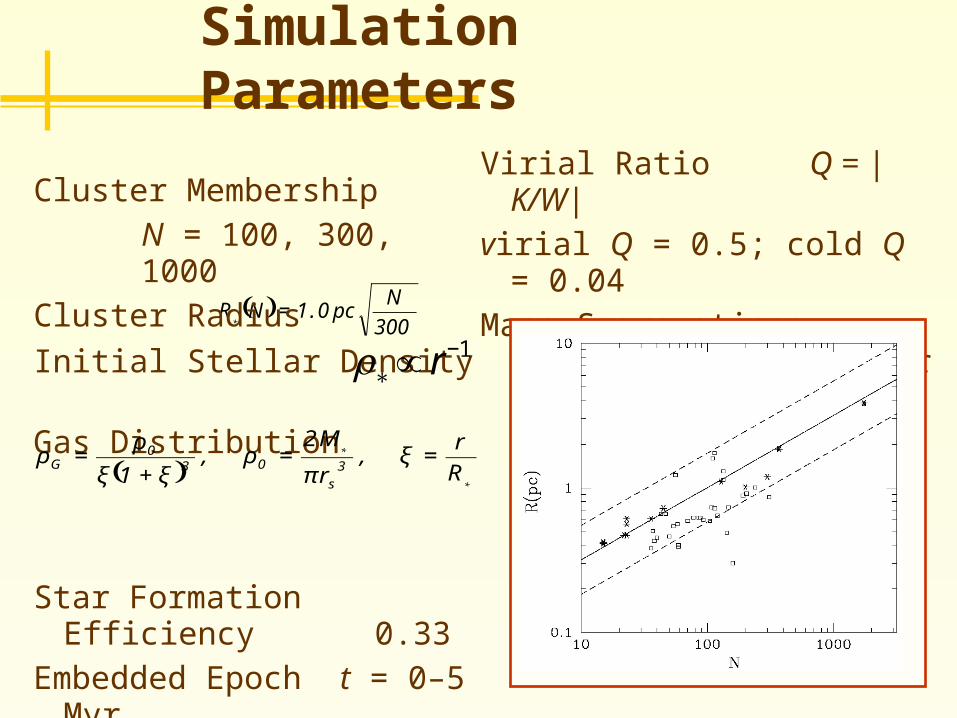
Virial Ratio Q = |K/W|virial Q = 0.5; cold Q = 0.04Mass Segregation: largest
star at center of cluster
Simulation Parameters
( )300N
pc0.1NR*
=
Cluster MembershipN = 100, 300, 1000
Cluster Radius
Initial Stellar DensityGas Distribution
Star Formation Efficiency0.33
Embedded Epoch t = 0–5 Myr
Star Formation t = 0-1 Myr
( )*
*
Rr
,r
M2,
1 3s
030
G ==+
= ξπ
ρξξ
ρρ
€
ρ∗∝ r−1
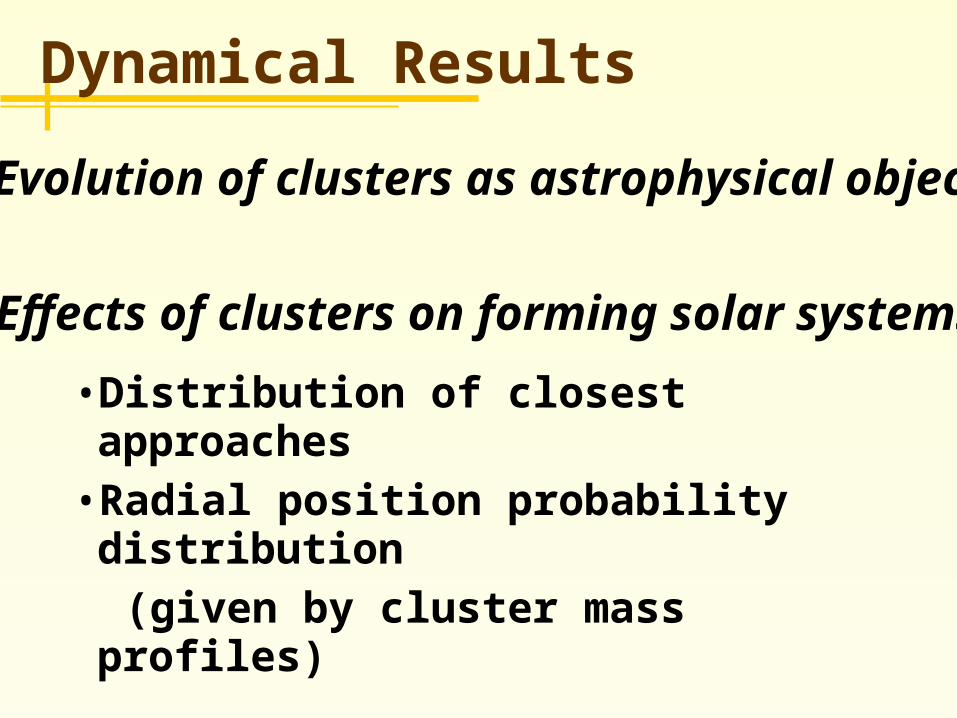
Dynamical Results
•Distribution of closest approaches
•Radial position probability distribution
(given by cluster mass profiles)
I. Evolution of clusters as astrophysical objects
II.Effects of clusters on forming solar systems
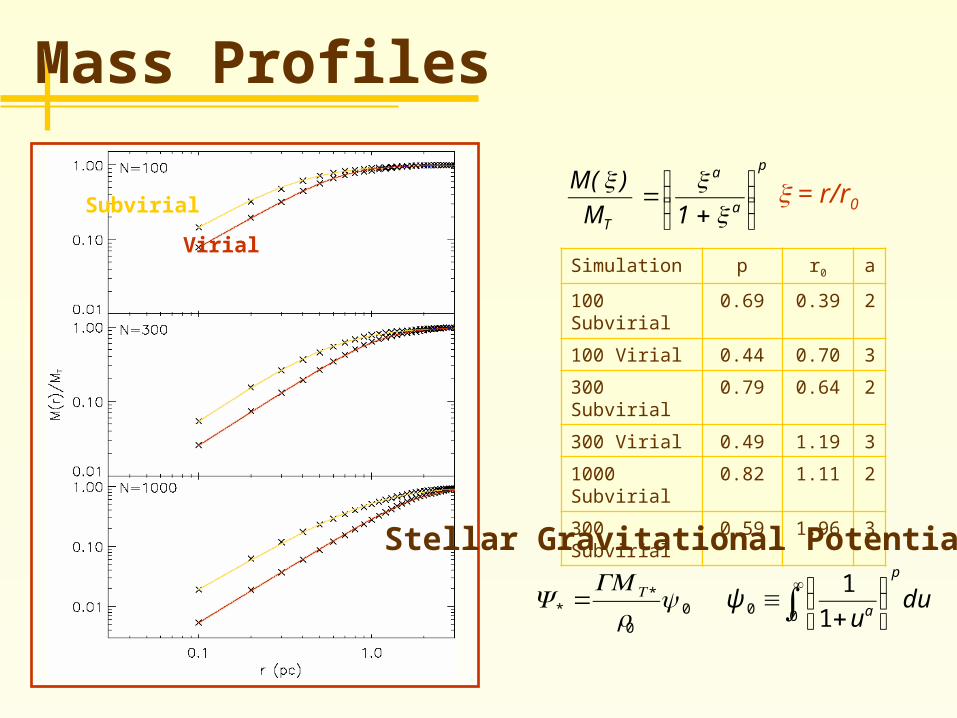
Mass Profiles
Subvirial
Virial
p
a
a
T 1M)(M
⎟⎟⎠
⎞⎜⎜⎝
⎛
+=
ξξξ ξ = r/r0
Simulation p r0 a
100 Subvirial
0.69 0.39 2
100 Virial 0.44 0.70 3
300 Subvirial
0.79 0.64 2
300 Virial 0.49 1.19 3
1000 Subvirial
0.82 1.11 2
300 Subvirial
0.59 1.96 3Stellar Gravitational Potential
∫∞
⎟⎠
⎞⎜⎝
⎛+
≡00 1
1du
u
p
aψ0
0
** ψΨ
rGMT=
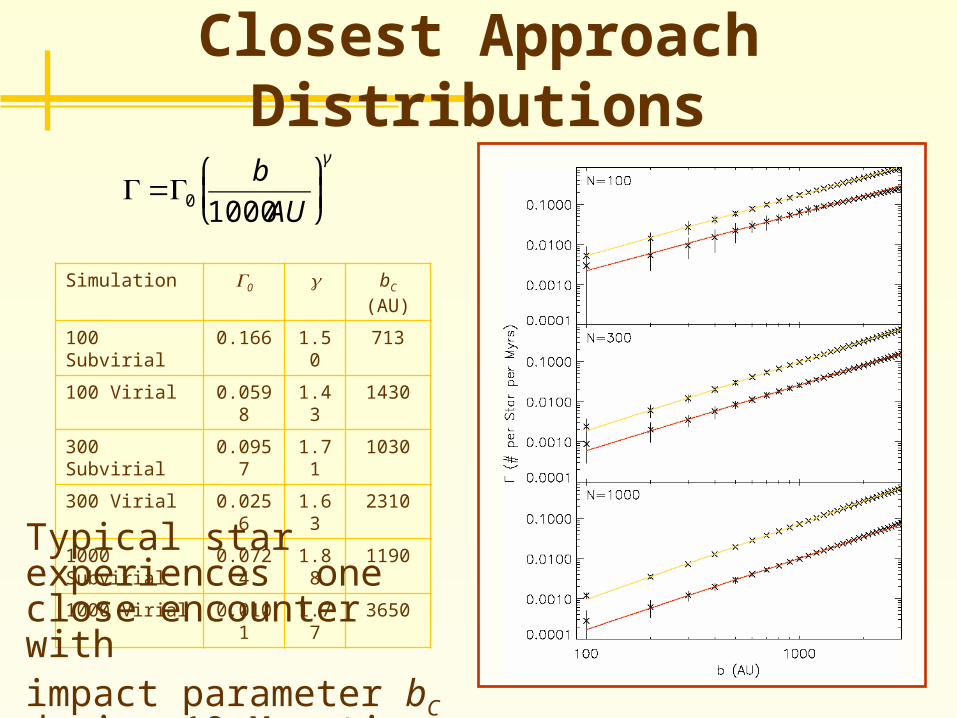
Closest Approach Distributions
€
Γ=Γ0
b
1000AU
⎛
⎝ ⎜
⎞
⎠ ⎟γ
Simulation Γ0 bC (AU)
100 Subvirial 0.166 1.50 713
100 Virial 0.0598
1.43 1430
300 Subvirial 0.0957
1.71 1030
300 Virial 0.0256
1.63 2310
1000 Subvirial
0.0724
1.88 1190
1000 Virial 0.0101
1.77 3650Typical star experiences one close encounter with impact parameter bC during 10 Myr time span
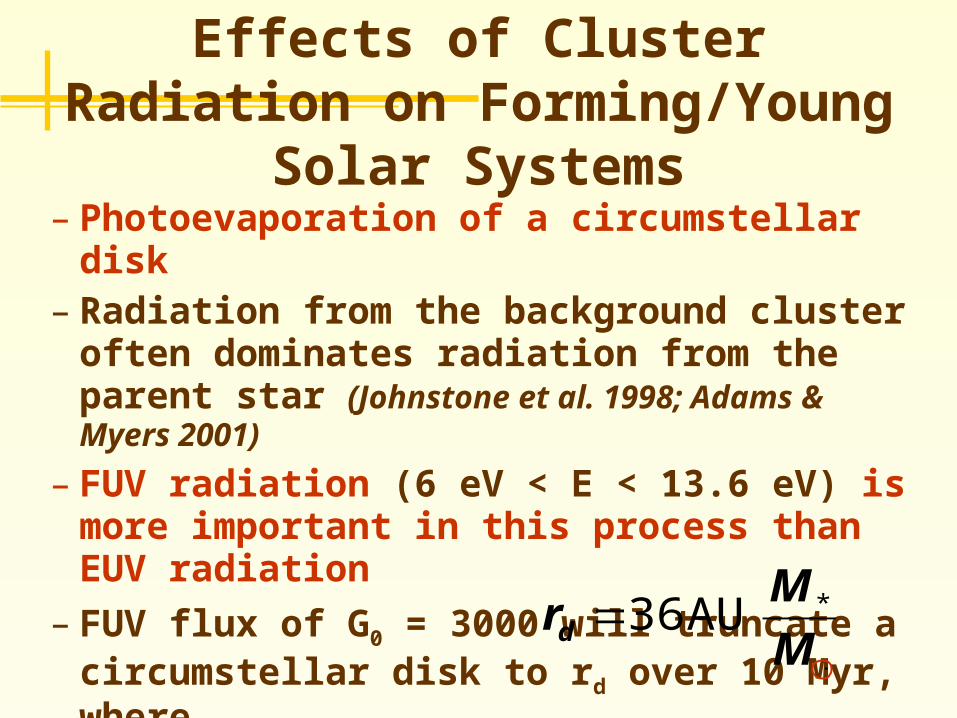
– Photoevaporation of a circumstellar disk
– Radiation from the background cluster often dominates radiation from the parent star (Johnstone et al. 1998; Adams & Myers 2001)
– FUV radiation (6 eV < E < 13.6 eV) is more important in this process than EUV radiation
– FUV flux of G0 = 3000 will truncate a circumstellar disk to rd over 10 Myr, where
Effects of Cluster Radiation on Forming/Young Solar
Systems
⋅
=M
Mrd
*AU36
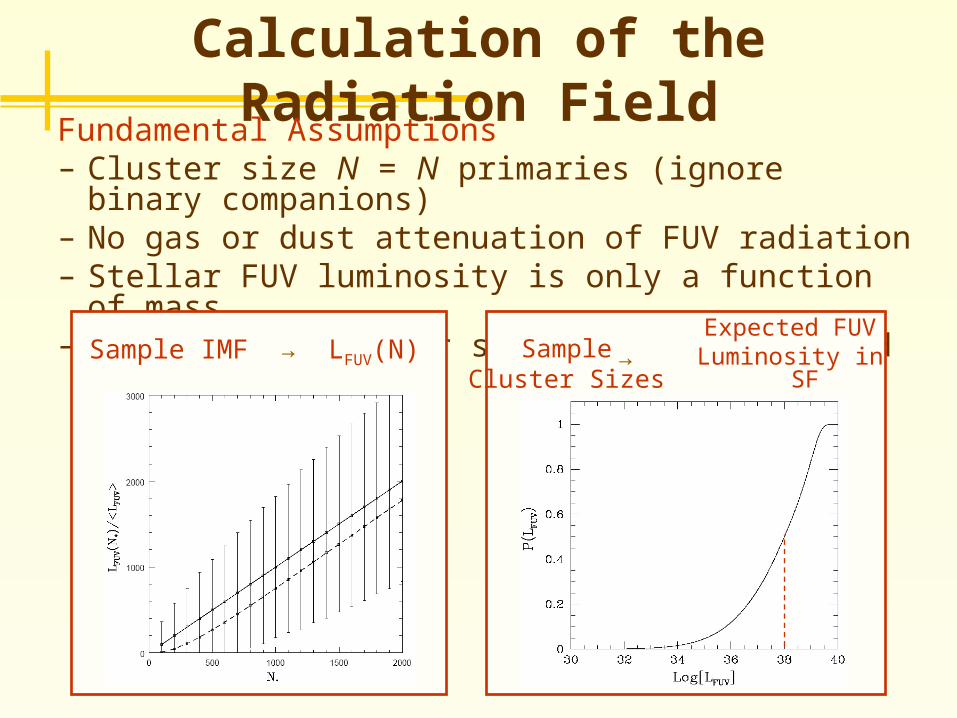
Calculation of the Radiation Field
Fundamental Assumptions– Cluster size N = N primaries (ignore binary
companions)– No gas or dust attenuation of FUV radiation– Stellar FUV luminosity is only a function of mass– Meader’s models for stellar luminosity and
temperature Sample IMF → LFUV(N) SampleCluster Sizes
Expected FUVLuminosity in SF
Cluster→
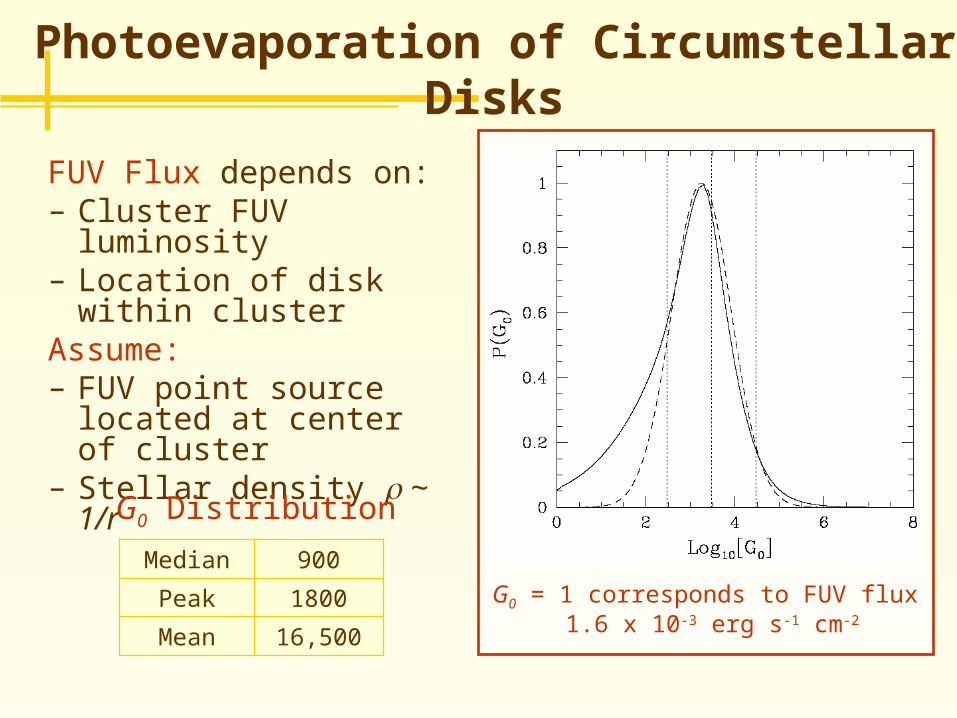
FUV Flux depends on:– Cluster FUV luminosity– Location of disk within
clusterAssume:– FUV point source
located at center of cluster
– Stellar density ρ ~ 1/r
Photoevaporation of Circumstellar Disks
G0 = 1 corresponds to FUV flux 1.6 x 10⁻³ erg s-1 cm-2
Median 900
Peak 1800
Mean 16,500
G0 Distribution
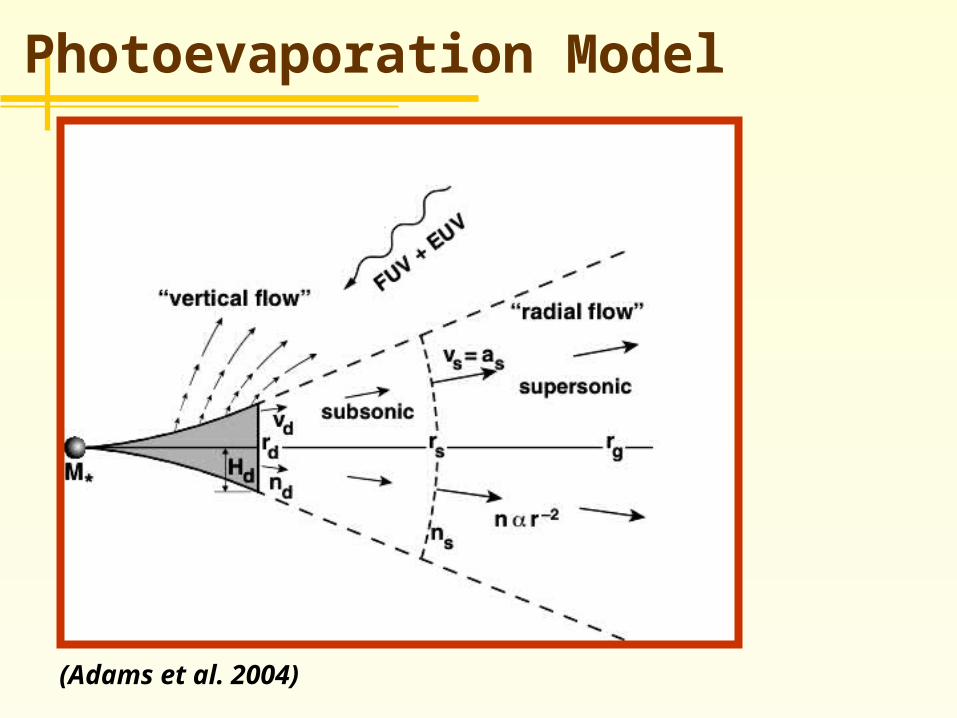
Photoevaporation Model
(Adams et al. 2004)
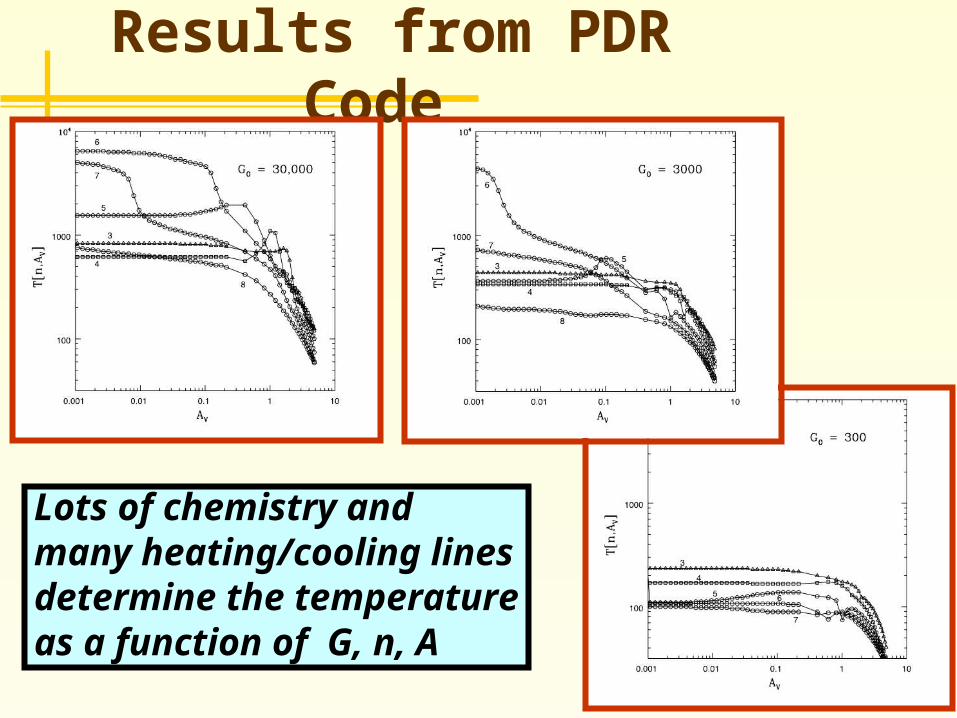
Results from PDR Code
Lots of chemistry and many heating/cooling linesdetermine the temperatureas a function of G, n, A
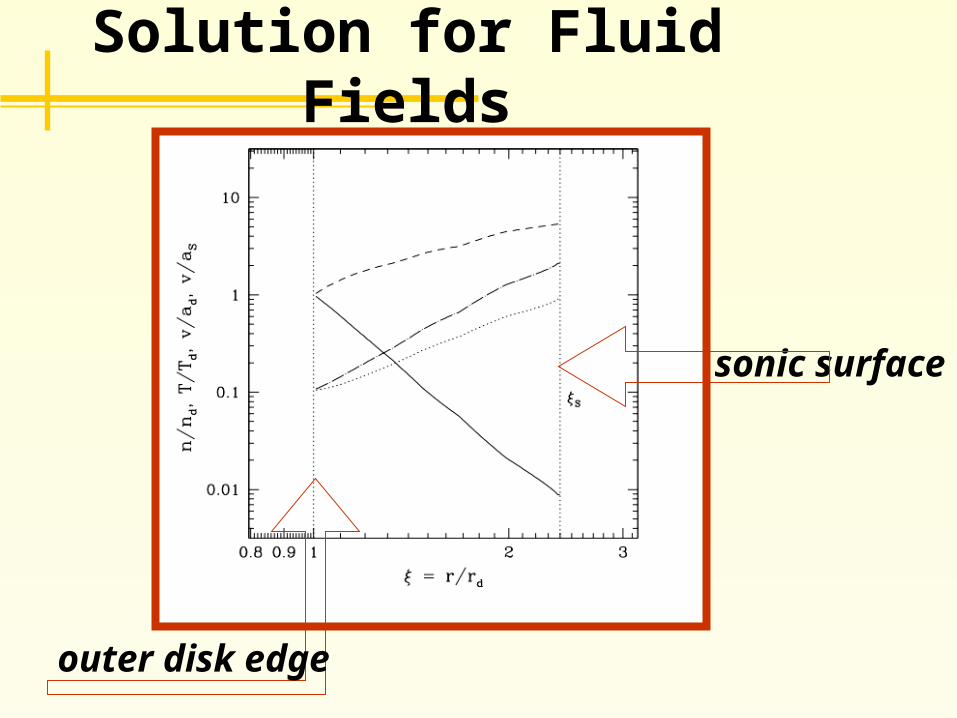
Solution for Fluid Fields
outer disk edge
sonic surface
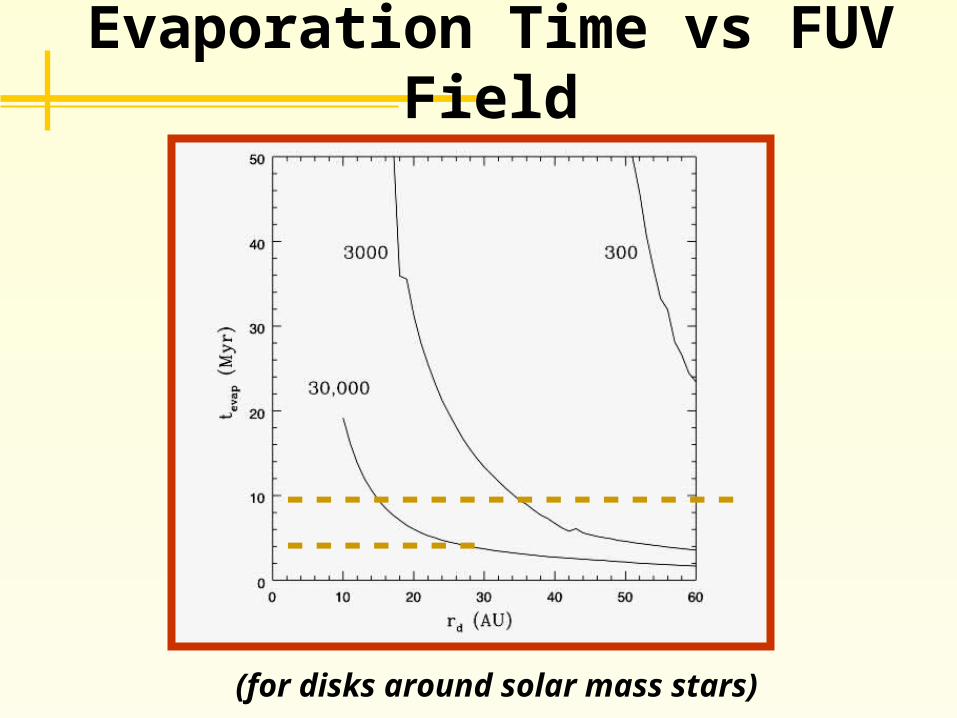
Evaporation Time vs FUV Field
-----------------------
(for disks around solar mass stars)
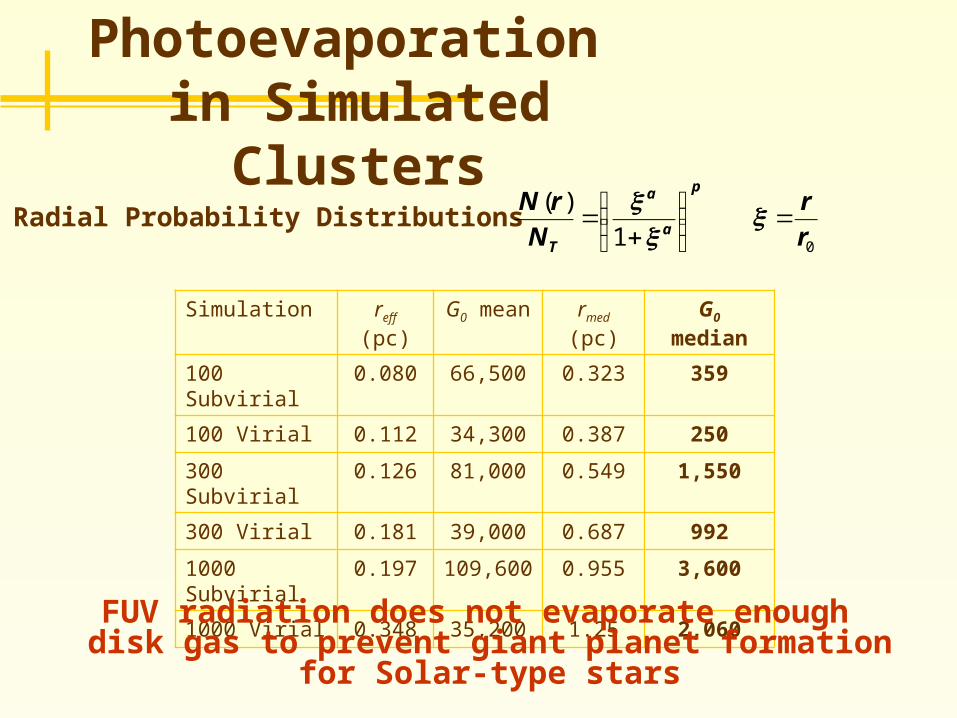
Photoevaporation in Simulated
ClustersRadial Probability Distributions
01
)(
r
r
N
rNp
a
a
T
=⎟⎟⎠
⎞⎜⎜⎝
⎛
+= ξ
ξξ
Simulation reff (pc) G0 mean
rmed (pc)
G0 median
100 Subvirial 0.080 66,500 0.323 359
100 Virial 0.112 34,300 0.387 250
300 Subvirial 0.126 81,000 0.549 1,550
300 Virial 0.181 39,000 0.687 992
1000 Subvirial
0.197 109,600 0.955 3,600
1000 Virial 0.348 35,200 1.25 2,060
FUV radiation does not evaporate enough disk gas to prevent giant planet formation
for Solar-type stars
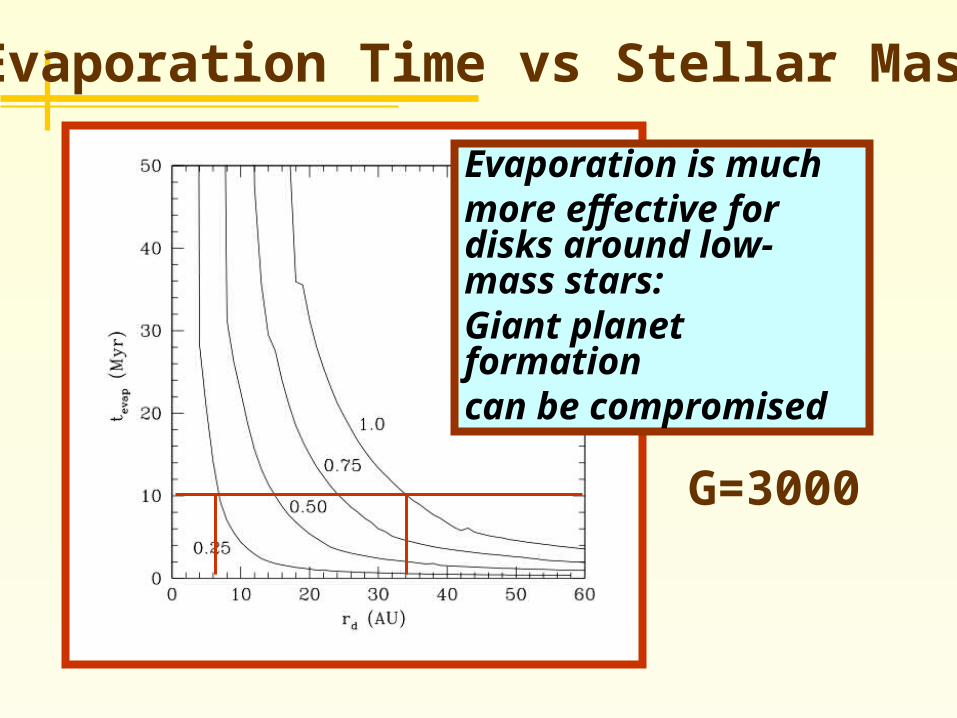
Evaporation Time vs Stellar Mass
Evaporation is much more effective for disks around low-mass stars:Giant planet formation can be compromised
G=3000
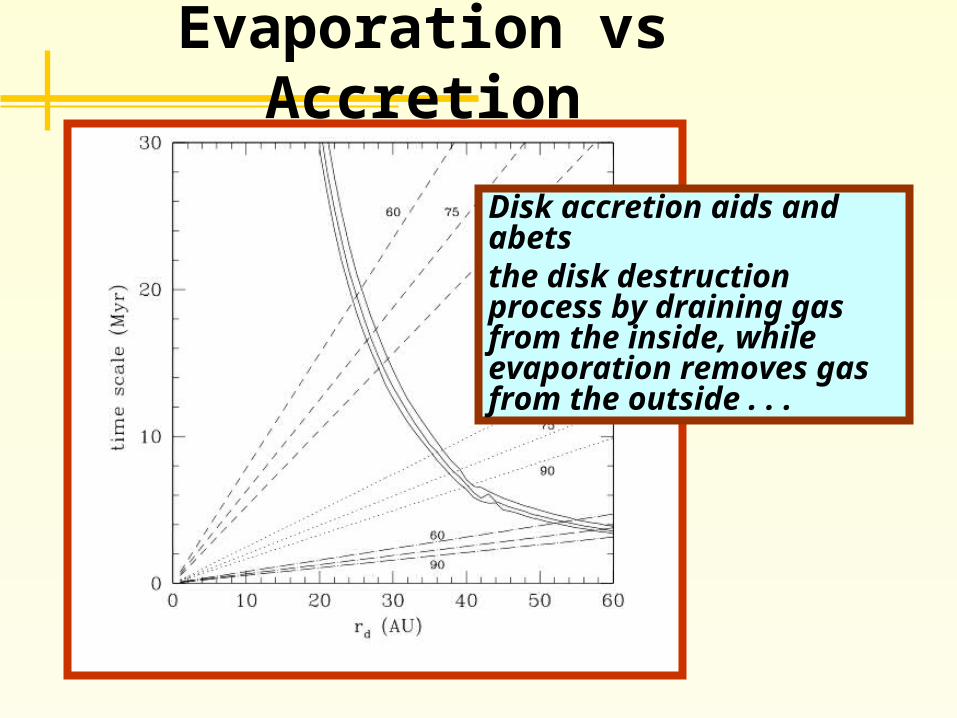
Evaporation vs Accretion
Disk accretion aids and abetsthe disk destruction process by draining gas from the inside, while evaporation removes gas from the outside . . .
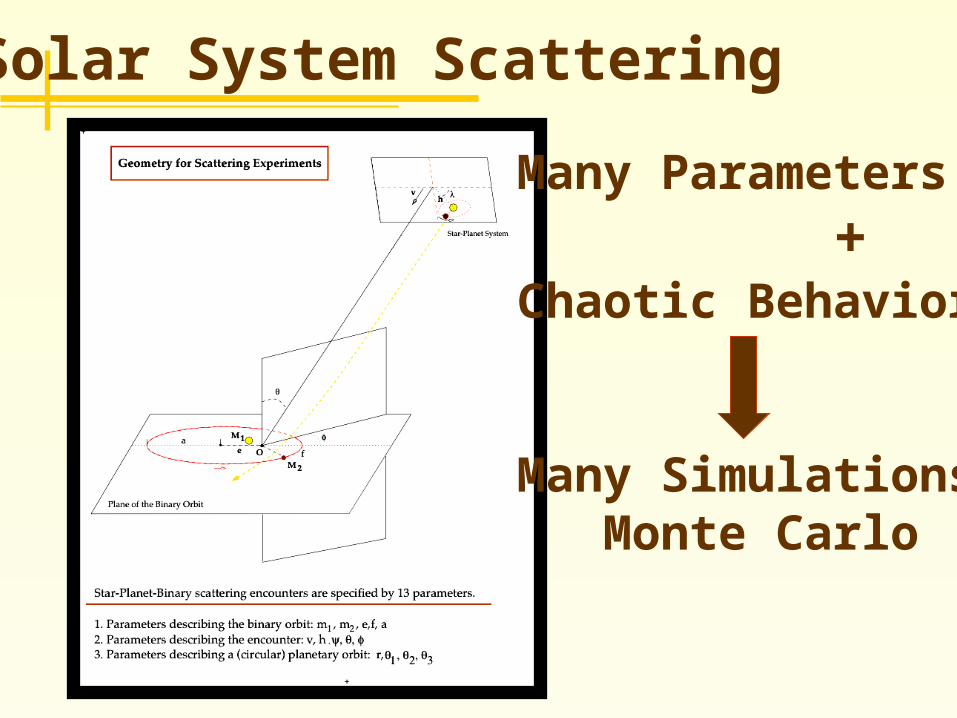
Solar System Scattering
Many Parameters +Chaotic Behavior
Many Simulations Monte Carlo
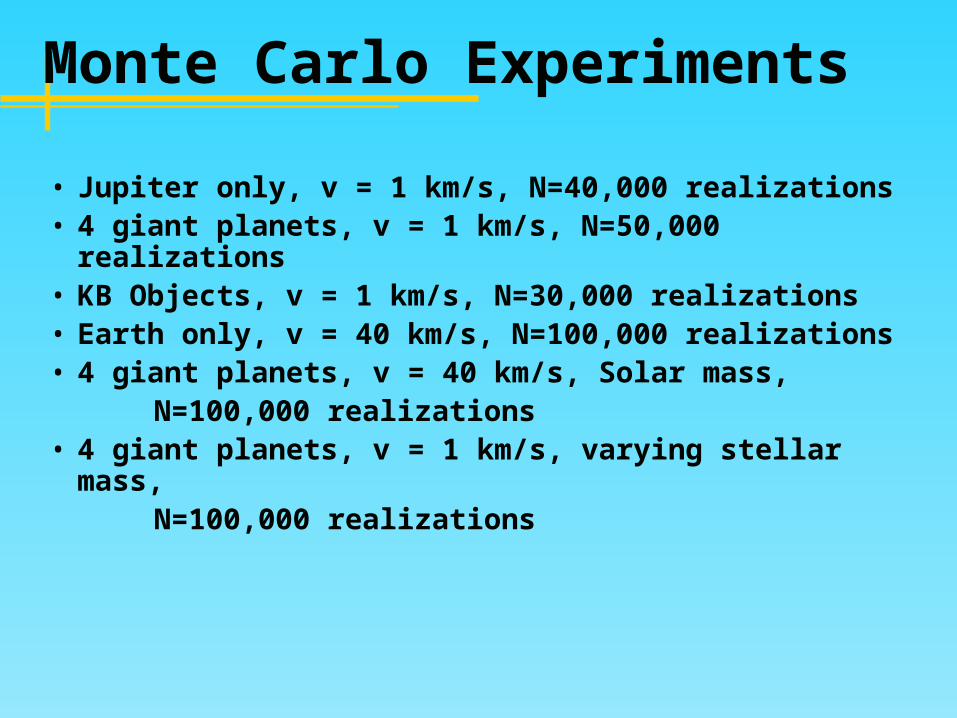
Monte Carlo Experiments
• Jupiter only, v = 1 km/s, N=40,000 realizations• 4 giant planets, v = 1 km/s, N=50,000 realizations• KB Objects, v = 1 km/s, N=30,000 realizations • Earth only, v = 40 km/s, N=100,000 realizations • 4 giant planets, v = 40 km/s, Solar mass, N=100,000 realizations• 4 giant planets, v = 1 km/s, varying stellar mass, N=100,000 realizations
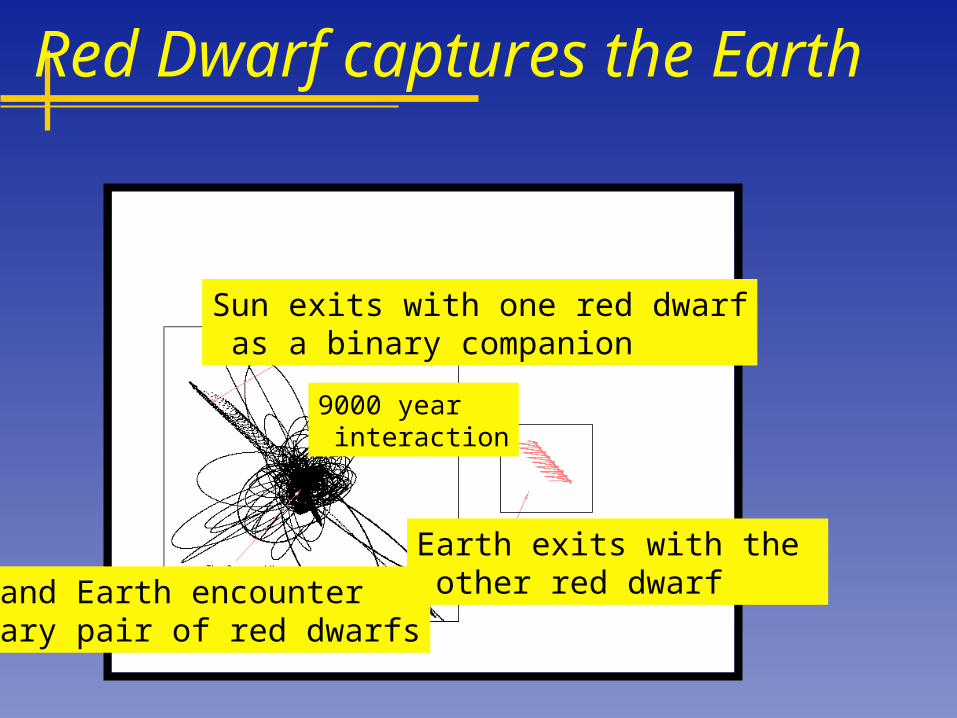
Red Dwarf captures the Earth
Sun exits with one red dwarf as a binary companion
Earth exits with the other red dwarfSun and Earth encounter
binary pair of red dwarfs
9000 year interaction
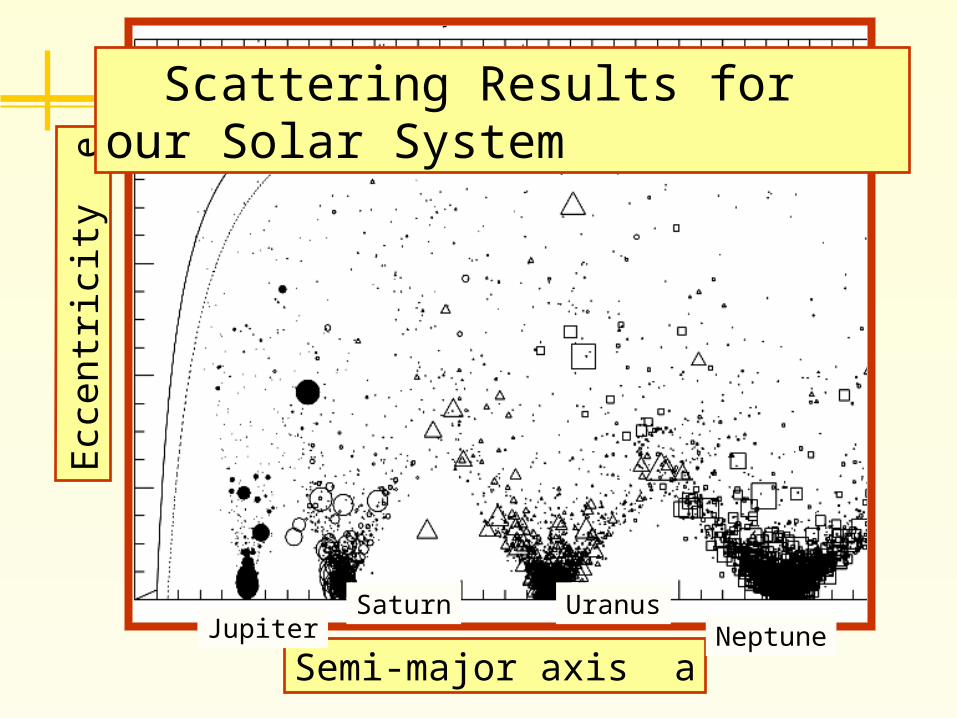
Ecc
en
t ric
ity
e
Semi-major axis aJupiter
Saturn UranusNeptune
Scattering Results for our Solar System
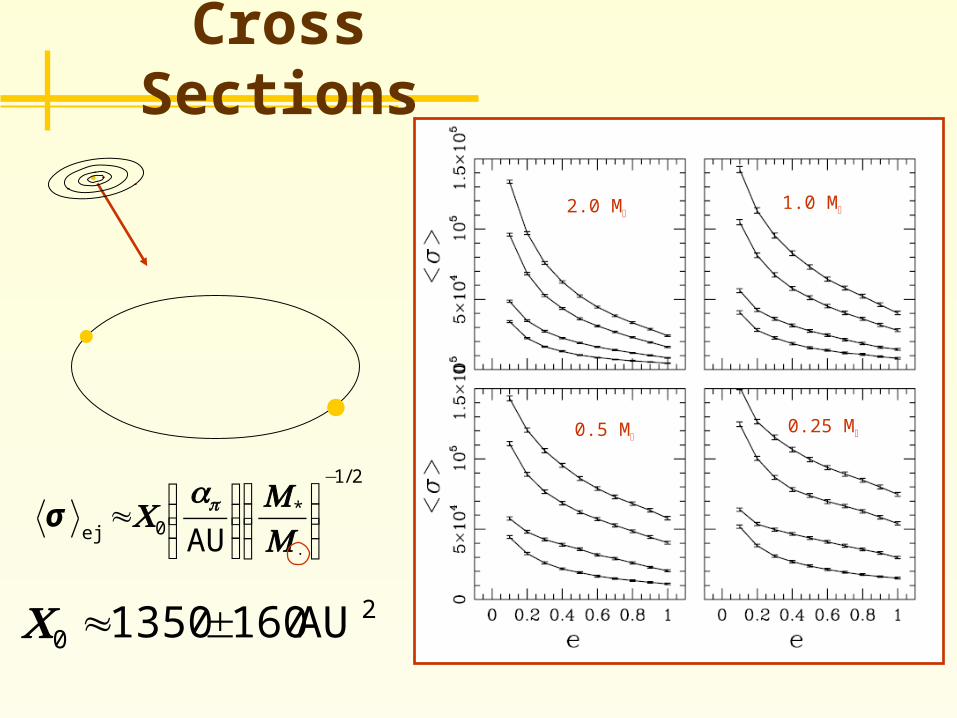
20 AU1601350±≈C
Cross Sections
2.0 M1.0 M
0.5 M0.25 M
2/1
*0
−
⋅⎟⎟⎠
⎞⎜⎜⎝
⎛⎟⎟⎠
⎞⎜⎜⎝
⎛≈
MMa
C p
AUejσ
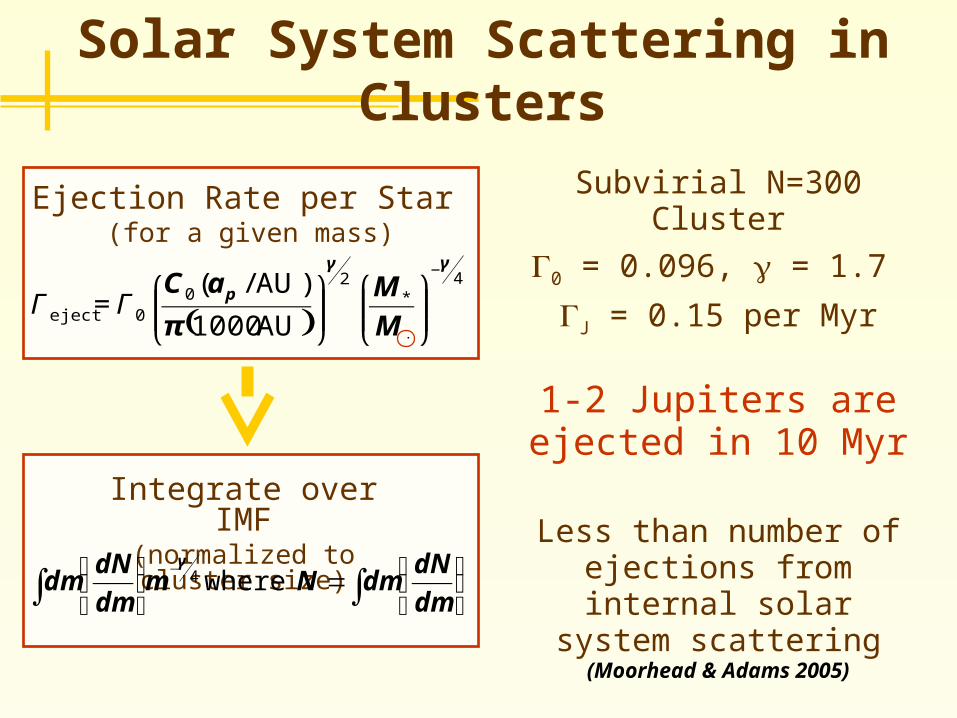
Solar System Scattering in Clusters
( )4
*2
00eject AU 1000
)AU/(γγ
π
−
⋅⎟⎟⎠
⎞⎜⎜⎝
⎛⎟⎟⎠
⎞⎜⎜⎝
⎛=
M
MaC pΓΓ
Ejection Rate per Star (for a given mass)
Integrate over IMF(normalized to cluster
size)
∫∫ ⎟⎠
⎞⎜⎝
⎛=⎟⎠
⎞⎜⎝
⎛ −
dm
dNdmNm
dm
dNdm where4
γ
Subvirial N=300 Cluster
0 = 0.096, = 1.7
J = 0.15 per Myr
1-2 Jupiters are ejected in 10 Myr
Less than number of ejections from internal solar system scattering
(Moorhead & Adams 2005)
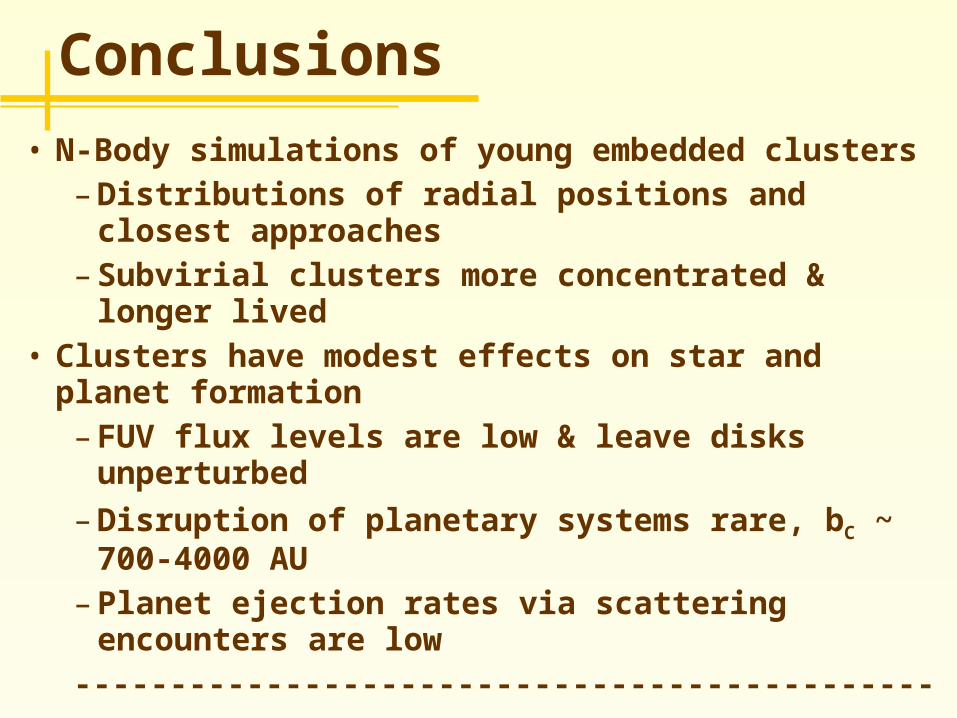
Conclusions• N-Body simulations of young embedded clusters
– Distributions of radial positions and closest approaches
– Subvirial clusters more concentrated & longer lived
• Clusters have modest effects on star and planet formation– FUV flux levels are low & leave disks
unperturbed– Disruption of planetary systems rare, bC ~
700-4000 AU – Planet ejection rates via scattering encounters
are low------------------------------------------------------------------
---• Photoevaporation model for external FUV
radiation• Distributions of FUV flux and luminosity • Cross sections for solar system disruption • [Orbit solutions, triaxial effects, spirographic
approx.]

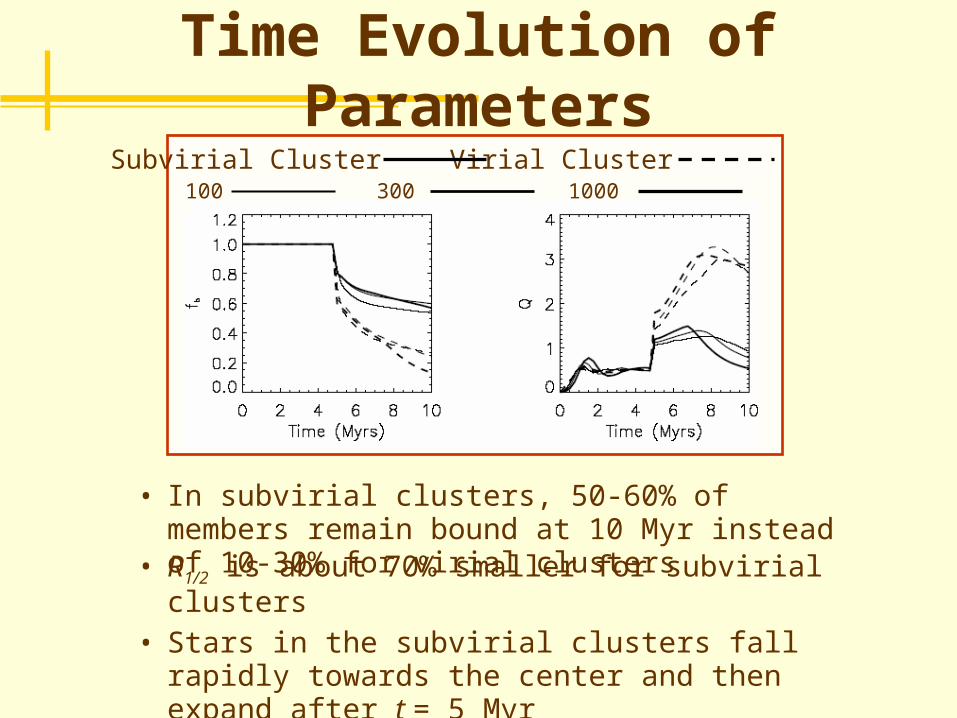
Time Evolution of Parameters
Subvirial Cluster Virial Cluster100 300 1000
• In subvirial clusters, 50-60% of members remain bound at 10 Myr instead of 10-30% for virial clusters • R1/2 is about 70% smaller for subvirial clusters
• Stars in the subvirial clusters fall rapidly towards the center and then expand after t = 5 Myr
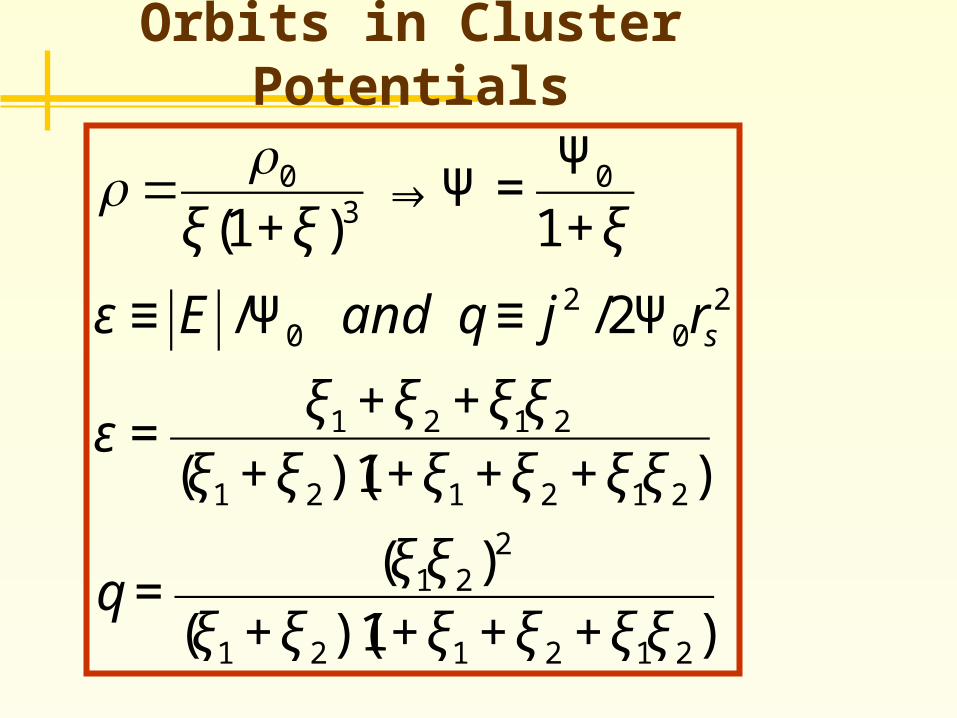
Orbits in Cluster Potentials
€
ρ = ρ0
ξ (1+ ξ )3⇒ Ψ =
Ψ0
1+ ξ
ε ≡ E /Ψ0 and q ≡ j 2 /2Ψ0rs2
ε =ξ1 + ξ 2 + ξ1ξ 2
(ξ1 + ξ 2)(1+ ξ1 + ξ 2 + ξ1ξ 2)
q =(ξ1ξ 2)2
(ξ1 + ξ 2)(1+ ξ1 + ξ 2 + ξ1ξ 2)
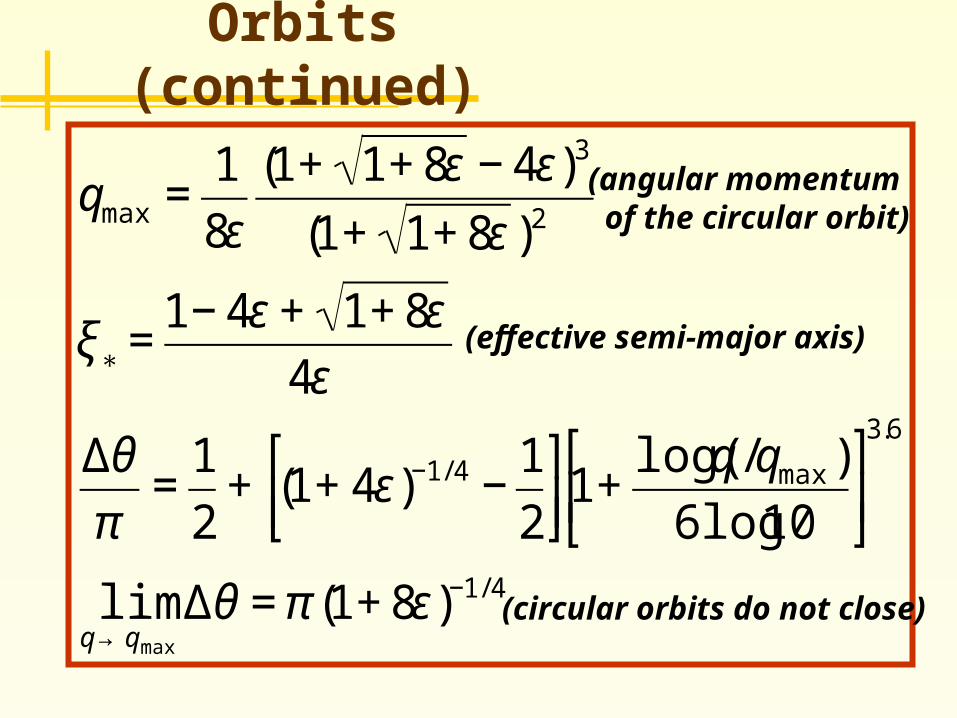
Orbits (continued)
€
qmax =1
8ε
(1+ 1+ 8ε − 4ε)3
(1+ 1+ 8ε )2
ξ∗ =1− 4ε + 1+ 8ε
4ε
Δθ
π=
1
2+ (1+ 4ε)−1/ 4 −
1
2
⎡ ⎣ ⎢
⎤ ⎦ ⎥1+
log(q /qmax )
6log10
⎡
⎣ ⎢
⎤
⎦ ⎥
3.6
limq→qmax
Δθ = π (1+ 8ε)−1/ 4
(effective semi-major axis)
(angular momentum of the circular orbit)
(circular orbits do not close)
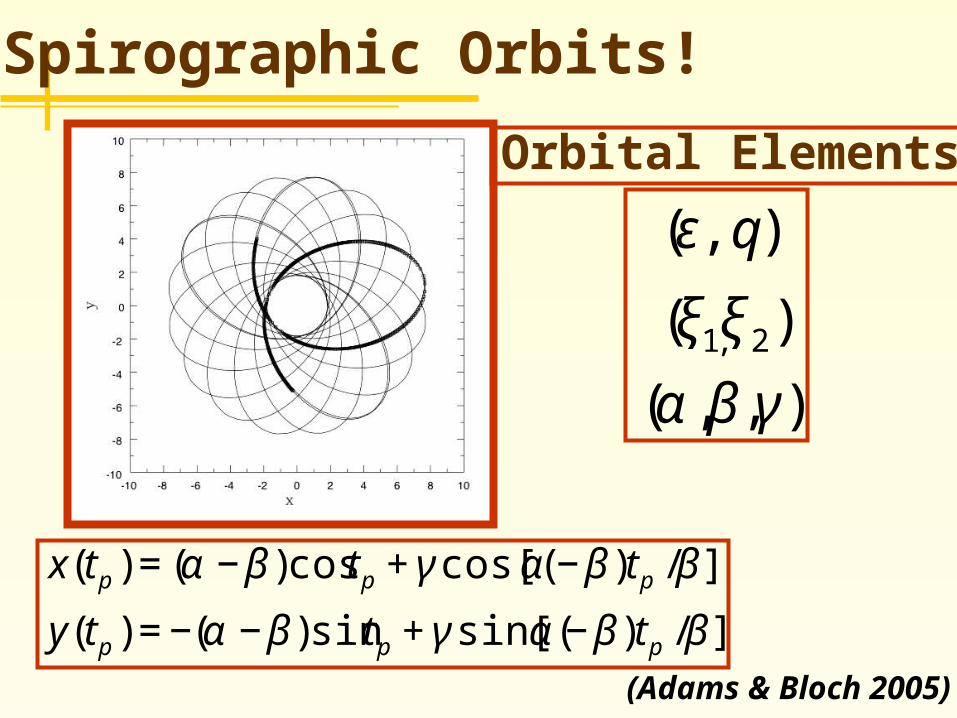
Spirographic Orbits!
(Adams & Bloch 2005)
€
x(tp ) = (α −β )cos t p + γ cos[(α −β )t p /β ]
y(tp ) = −(α −β )sin t p + γ sin[(α −β )t p /β ]€
(ε, q)
(ξ1,ξ 2)
(α ,β,γ )
Orbital Elements
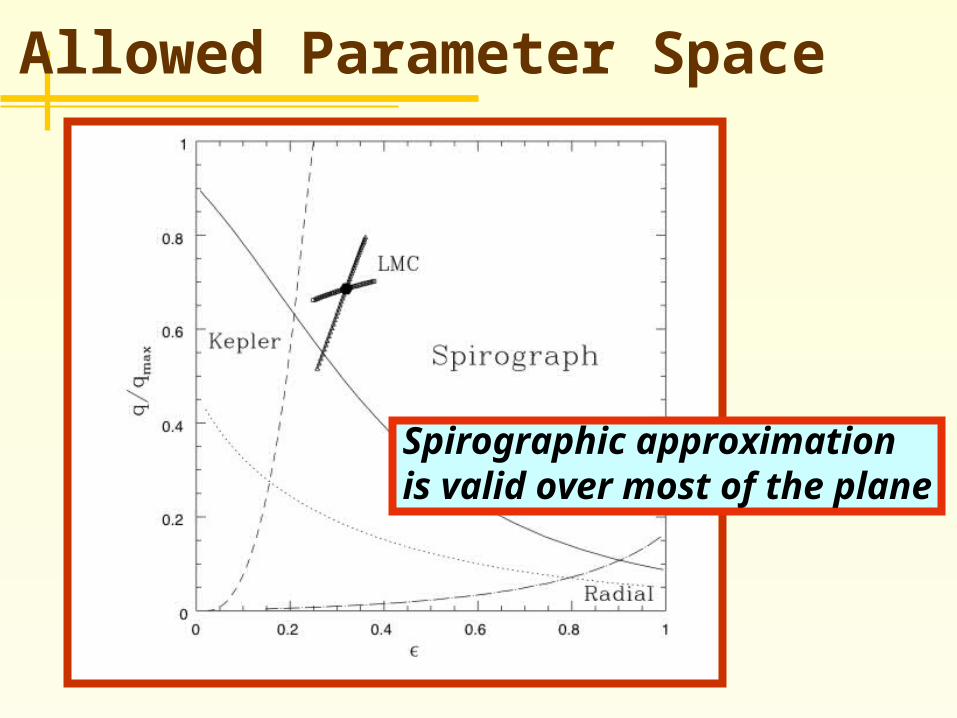
Allowed Parameter Space
Spirographic approximationis valid over most of the plane
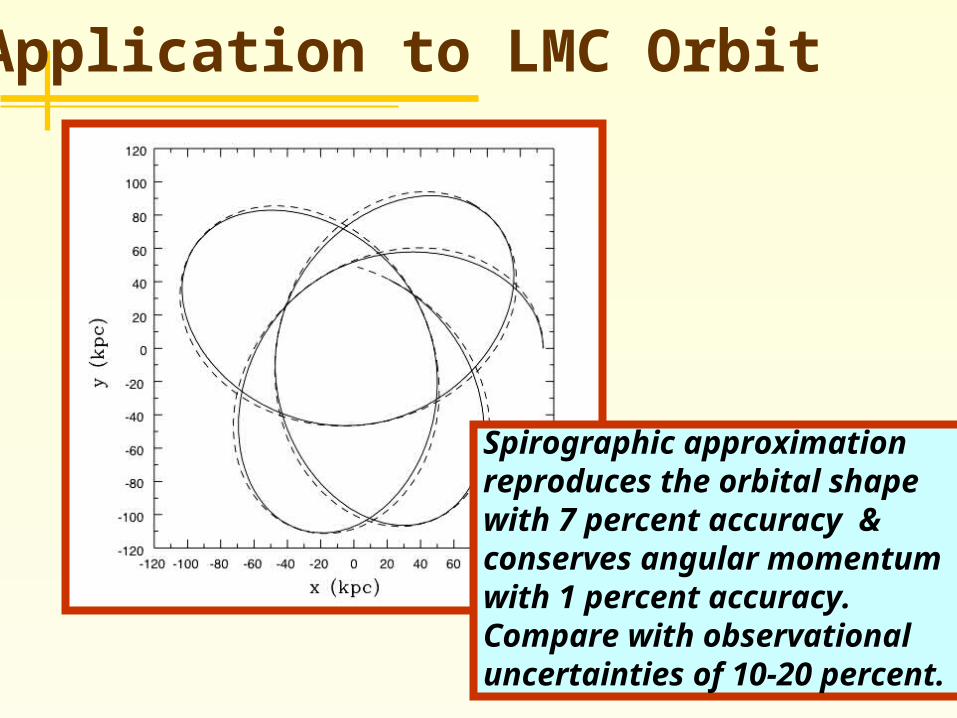
Application to LMC Orbit
Spirographic approximationreproduces the orbital shape with 7 percent accuracy & conserves angular momentumwith 1 percent accuracy.Compare with observationaluncertainties of 10-20 percent.
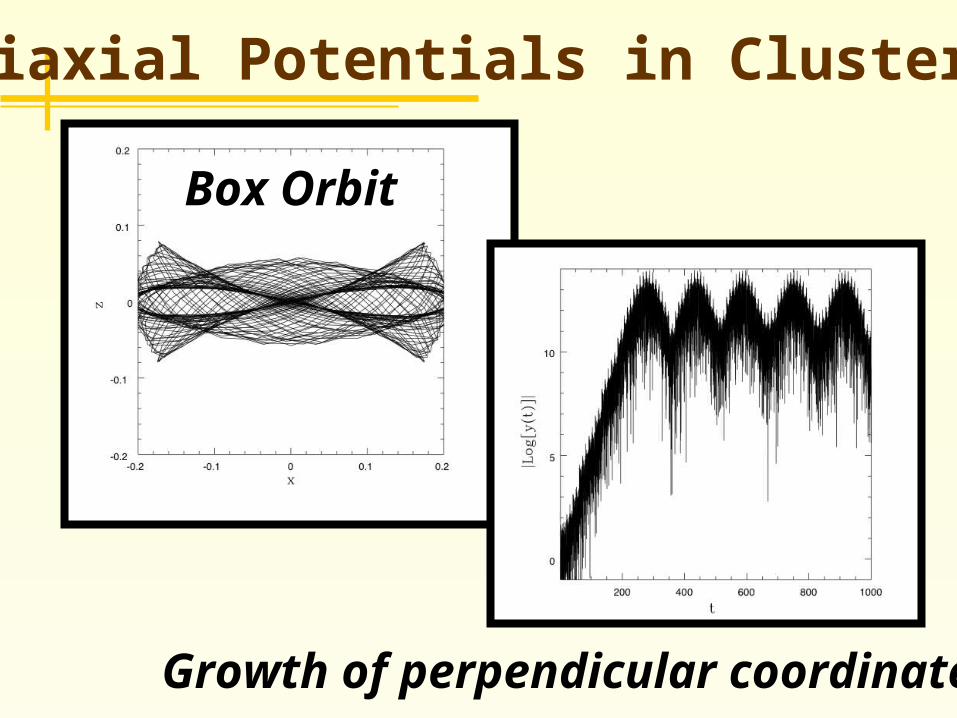
Triaxial Potentials in Clusters
Box Orbit
Growth of perpendicular coordinate
Where did we come from?
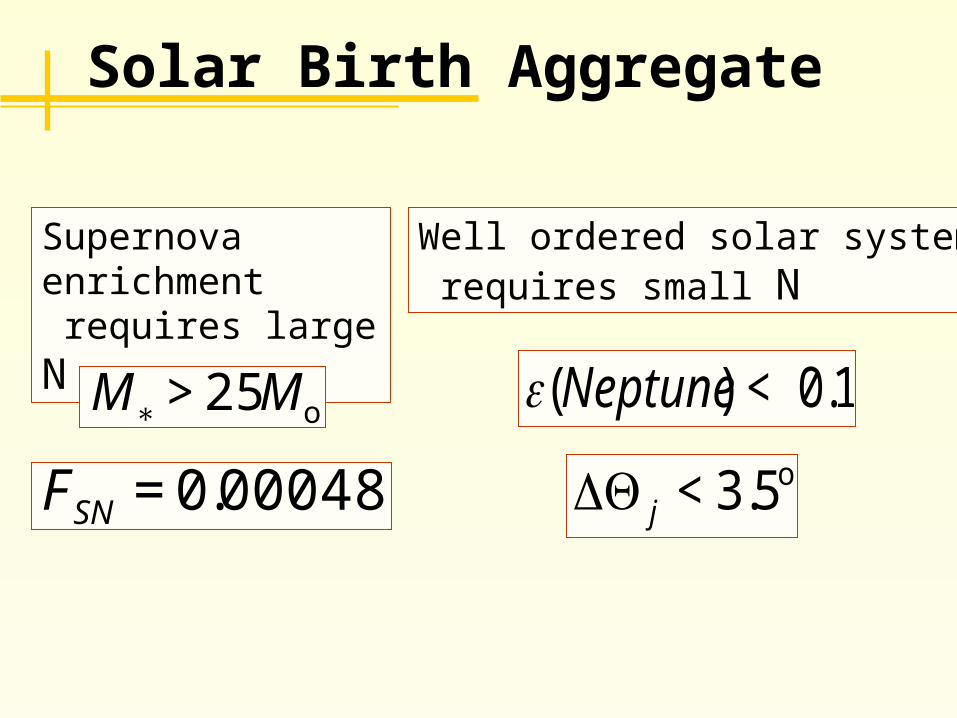
Solar Birth Aggregate
Supernova enrichment requires large N
€
M∗ > 25Mo
Well ordered solar system requires small N
€
FSN = 0.000485
€
ε(Neptune) < 0.1
€
ΔΘ j < 3.5o
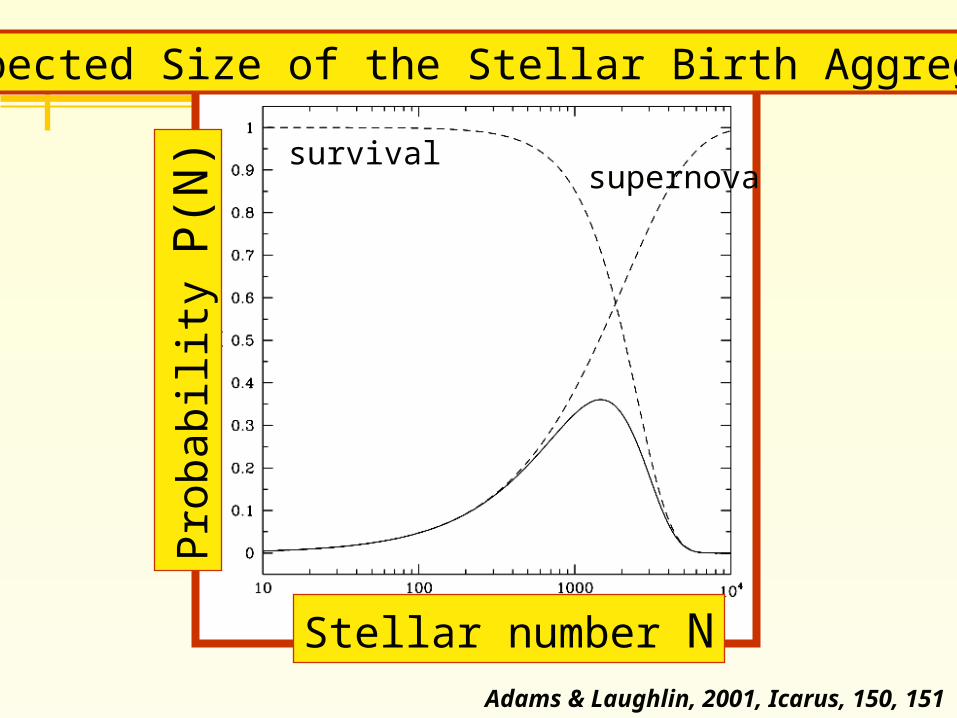
Stellar number N
Pro
babili
ty P
(N)
Expected Size of the Stellar Birth Aggregate
survivalsupernova
Adams & Laughlin, 2001, Icarus, 150, 151
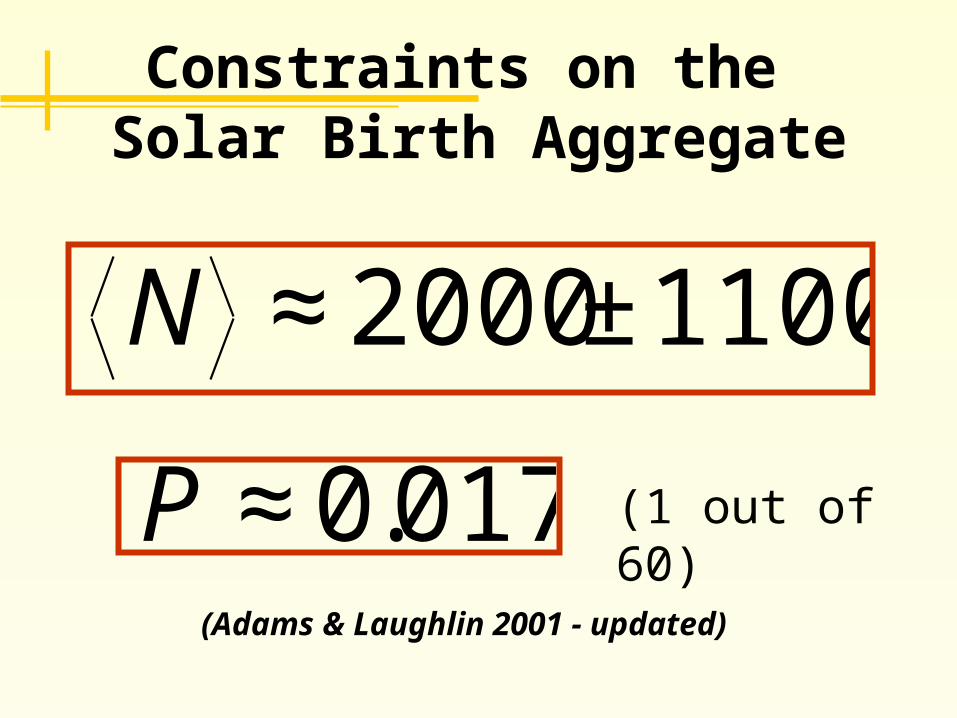
Constraints on the Solar Birth Aggregate
€
N ≈ 2000 ±1100
€
P ≈ 0.017 (1 out of 60)
(Adams & Laughlin 2001 - updated)
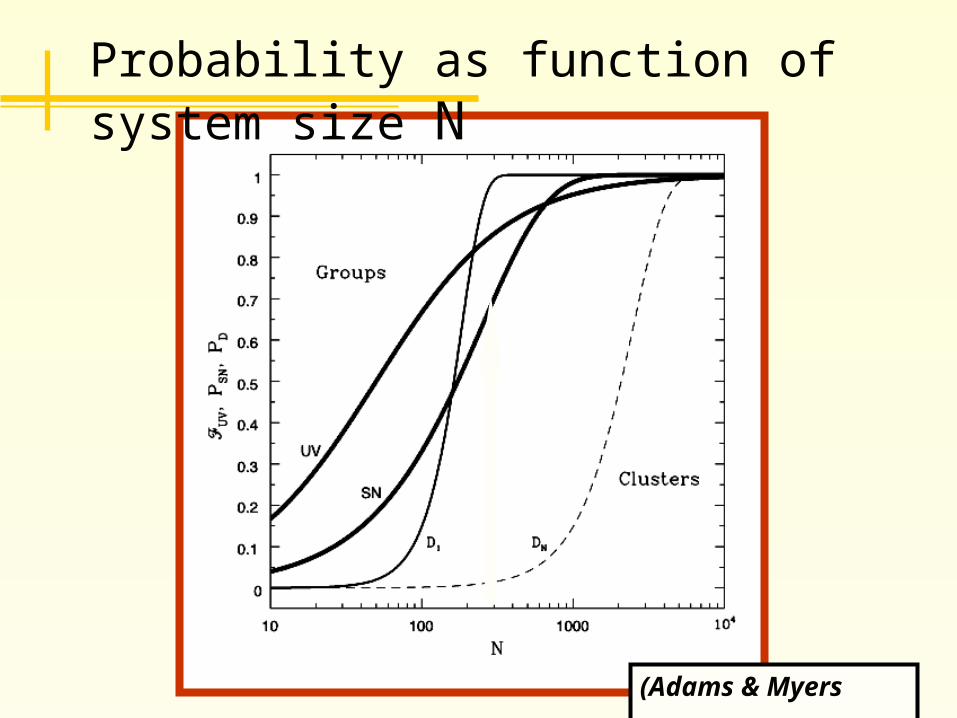
Probability as function of system size N
(Adams & Myers 2001)
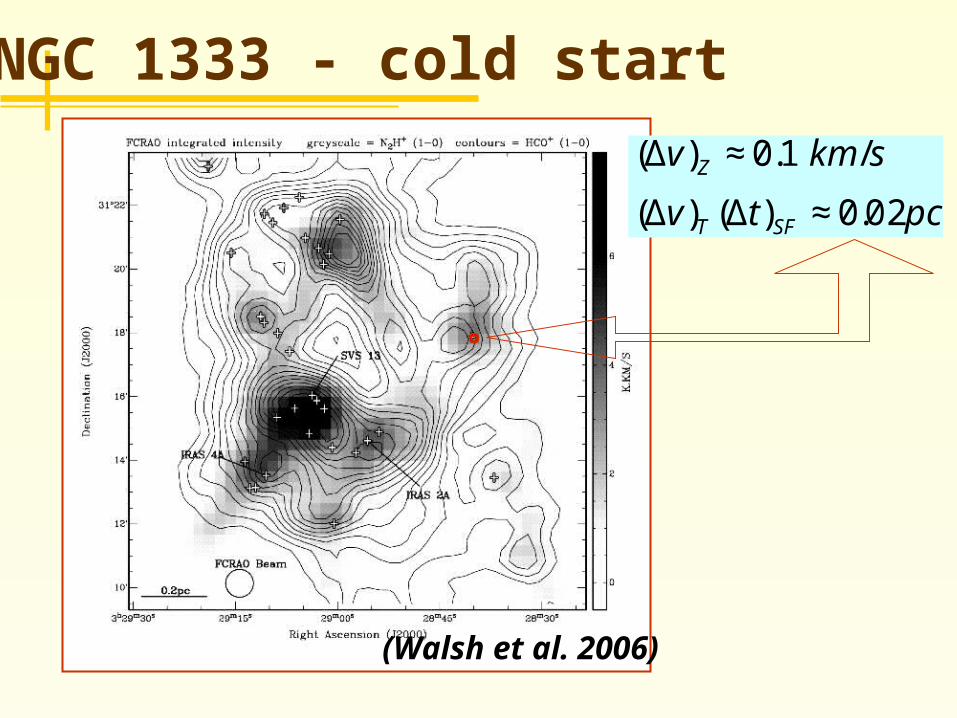
(Walsh et al. 2006)
NGC 1333 - cold start
€
(Δv)Z ≈ 0.1 km /s
(Δv)T (Δt)SF ≈ 0.02pc
Probability of Supernovae
€
PSN (N) =1− fnotN
Probability of Supernovae
€
PSN (N) =1− fnotN =1− (1− FSN )N
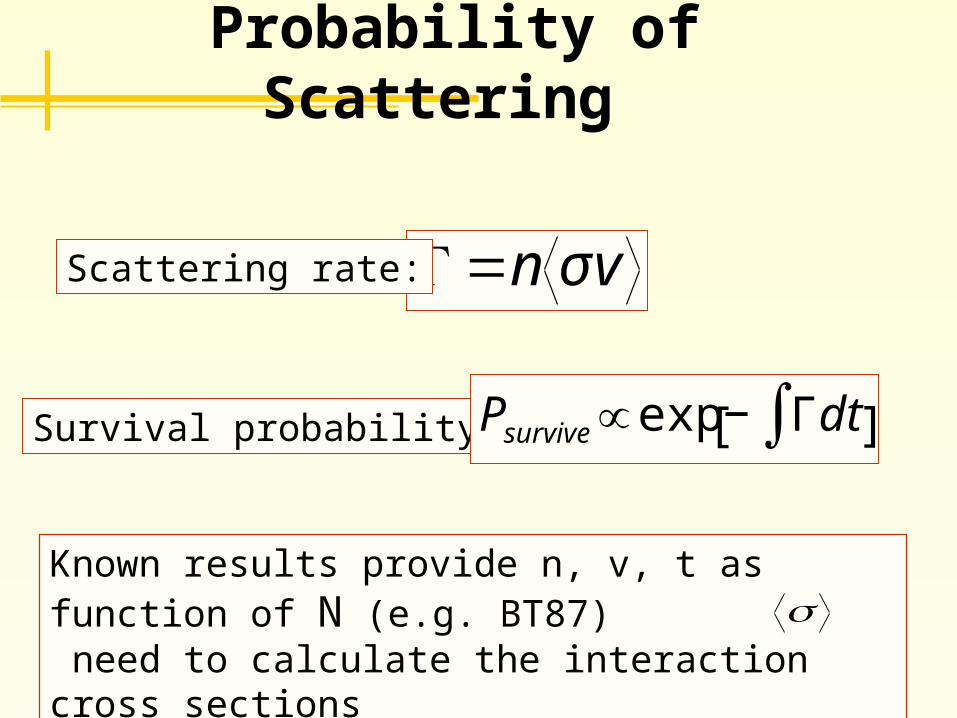
Probability of Scattering
€
Γ=n σvScattering rate:
Survival probability:
€
Psurvive ∝ exp − Γdt∫[ ]
Known results provide n, v, t as function of N (e.g. BT87) need to calculate the interaction cross sections
€
σ
Cross Section for Solar System
Disruption
€
σ ≈(400AU)2