Embed Size (px)
Citation preview

1
Author: Onderi, Meshack Omari
Title: Effects of Xanthan Gum and Added Protein on the Physical Properties of Gluten-Free Pizza Dough–A Texture Characterization Study Using Instron Model 3342 The accompanying research report is submitted to the University of Wisconsin-Stout, Graduate School in partial completion of the requirements for the
Graduate Degree/ Major: MS Food & Nutritional Sciences
Research Advisor: Naveen Chikthimmah, Ph.D.
Submission Term/Year: Spring, 2013
Number of Pages: 131
Style Manual Used: American Psychological Association, 6th edition
I understand that this research report must be officially approved by the Graduate School and that an electronic copy of the approved version will be made available through the University Library website
I attest that the research report is my original work (that any copyrightable materials have been used with the permission of the original authors), and as such, it is automatically protected by the laws, rules, and regulations of the U.S. Copyright Office.
My research advisor has approved the content and quality of this paper.
STUDENT: NAME Meshack Omari Onderi DATE: 5/8/2013
ADVISOR: (Committee Chair if MS Plan A or EdS Thesis or Field Project/Problem):
NAME Dr. Naveen Chikthimmah DATE: 5/8/2013
---------------------------------------------------------------------------------------------------------------------
This section for MS Plan A Thesis or EdS Thesis/Field Project papers only Committee members (other than your advisor who is listed in the section above)
1. CMTE MEMBER’S NAME: Dr. Joongmin Shin DATE: 5/8/2013
2. CMTE MEMBER’S NAME: Dr. Karunanithy Chinnadurai DATE: 5/8/2013
3. CMTE MEMBER’S NAME: DATE:
--------------------------------------------------------------------------------------------------------------------- This section to be completed by the Graduate School This final research report has been approved by the Graduate School.
Director, Office of Graduate Studies: DATE:

2
Onderi, Meshack, O. Effects of Xanthan Gum and Added Protein on the Physical Properties
of Gluten-Free Pizza Dough–A Texture Characterization Study Using Instron Model 3342
Abstract
Gluten, an essential structure-binding protein is responsible for pizza crust quality.
Although important, gluten causes health problems to celiac disease sufferers. Thus, the aim of
this study was to develop a pizza crust using a gluten-free composite flour, xanthan gum and
dairy ingredients. The study was conducted in two phases: first phase, xanthan gum at levels 0-
5% was incorporated into the gluten-free flour composite. Dough was made and sheeted before
being evaluated by physical methods compared to wheat dough. Then an optimum xanthan gum
concentration was selected. Second phase, the selected 2% xanthan gum together with
composite flour was mixed with dairy ingredients at 1-3% whey protein or 5-15% nonfat dry
milk. Dough was made and sheeted then evaluated for physical properties. It was observed that
xanthan gum successfully replaced gluten with 2% xanthan gum giving sheetable pizza crusts
with optimum strength and extension. Together with 2% xanthan gum, dairy ingredients
incorporation softened and increased the extension length of the pizza crust dough. A
combination of 2% xanthan gum with 2% whey protein or 5% nonfat dry milk gave optimum
dough performance in handling and processing. However, whey proteins had critical thresholds
above which they increased dough resistance to puncture.

3
Acknowledgements
I would like to thank my main research adviser, Dr. Naveen Chikthimmah, for
introducing me to the grateful grains project and his guidance throughout this research project.
Dr. Naveen’s knowledge and patience helped me achieve my goals. Also, I acknowledge the
other committee members for their knowledge and support: Dr. Hans Zoerb (Replaced by Dr.
Chinnadurai) and Dr. Joongmin Shin. Dr. Zoerb was fun to work with in the Food Technology
Laboratory, especially his vast knowledge with the Instron machine and other lab equipment.
Dr. Shin always gave an engineering perspective to data reporting and analyses. A thank you to
Dr. Chinnadurai for taking Dr. Zoerb’s place as a committee member.
Although it was not his responsibility, Dr. Naveen was patient when it came to meeting
including weekends, to discuss the progress of the project and analyzing data. Dr. Naveen never
gave up in the endless e-mails exchange concerning the project and he always encouraged me to
become a better research writer.
I would also like to thank Connie Galep, food and nutrition, for her help in sourcing the
project materials and her knowledge with the ingredient functionalities. My family for their
support and belief in my abilities, my mother has helped me persevere through thin and thick.
My late dad Mr. Francis Onderi, dad you are my hero. My late sister Jackline, I promised to
never let you down girl!
Lastly, thank you, to the discovery center for funding the project and acting as link to the
grateful grains project.

4
Table of Contents
.................................................................................................................................................. Page
Abstract ............................................................................................................................................2
List of Tables ...................................................................................................................................6
List of Figures ..................................................................................................................................8
Chapter I: Introduction ..................................................................................................................11
Statement of the Problem ...................................................................................................14
Purpose of the Study ..........................................................................................................14
Assumptions of the Study ..................................................................................................15
Objectives ..........................................................................................................................15
Hypotheses .........................................................................................................................16
Definition of Terms............................................................................................................16
Symbols and Acronyms .....................................................................................................17
Limitations .........................................................................................................................18
Chapter II: Literature Review ........................................................................................................29
Gluten .................................................................................................................................29
Gluten-Free ........................................................................................................................34
Hydrocolloids .....................................................................................................................36
Dairy Ingredients in Baking ...............................................................................................44
Rheological Properties of Doughs .....................................................................................46
Chapter III: Methodology ..............................................................................................................50
Rheological Properties of Doughs .....................................................................................50
Ingredients and Additives ..................................................................................................50

5
Dough Making Process ......................................................................................................50
Gluten-Free Pizza Dough Formulations ............................................................................50
Texture Analyses ...............................................................................................................53
Statistical Analysis .............................................................................................................54
Chapter IV: Results ........................................................................................................................55
Gluten-Free Pizza Dough Formulations ............................................................................55
Xanthan Gum Addition ......................................................................................................55
Dairy Ingredients ...............................................................................................................70
Chapter V: Discussion ...................................................................................................................97
Effect of Xanthan Gum Addition on GF Dough Texture Characteristics .........................97
Effect of Dairy Ingredients Addition on GF Dough Texture Characteristics ....................99
Chapter VI: Conclusions and Recommendations ........................................................................104
References ....................................................................................................................................105
Appendix A: Raw Data Xanthan Addition ..................................................................................122
Appendix B: Raw Data Whey Addition ......................................................................................126
Appendix C: Raw Data NFDM Addition ....................................................................................129

6
List of Tables
Table 1: Amino Acid Composition of Wheat Flour Components per 100,000g of Wheat Flour……………………………………………………………… 22
Table 2: New Products Claiming ‘Gluten-Free’ in the United States by Year……. 35 Table 3: Common Hydrocolloids and Their Functionality in Food Products……… 38 Table 4: Summary of Studies Involving Gluten-Free Breads and Xanthan Gum…... 42 Table 5: Gluten-Free Pizza Dough and Controls Formulations With Their Symbols. 51 Table 6: A Summary of 2% Xanthan Gum Gluten Formulations With Their
Control……………………………………………………………………… 52 Table 7: Mean Elongation Parameter Values of Pizza Dough Treatments With
Increasing Levels of Xanthan Gum Concentrations (0 - 5%; Wheat Flour Control)………………………...….............................................................. 58
Table 8: Mean Puncture Parameter Values of Pizza Dough Treatments With
Increasing Levels of Xanthan Gum Concentrations (0 - 5%; Wheat Flour Control)......................................................................................................... 61
Table 9: Mean TPA Parameter Values of Pizza Dough Treatments With
Increasing Levels of Xanthan Gum Concentrations (0 - 5%; Wheat Flour Control)………………………………………………………………….... 62
Table 10: Mean TPA Parameter Values of Pizza Dough Treatments With Increasing Levels of Xanthan Gum Concentrations (0 - 5%; Wheat Flour Control) Continued………………………………………………….......... 68
Table 11: Mean Elongation Parameter Values of Pizza Dough Treatments With Increasing Levels of Whey Protein Concentrations (1 - 3%; 2% Xanthan Control)………………………………………………………………..….. 73
Table 12: Mean Puncture Parameter Values of Pizza Dough Treatments With
Increasing Levels of Whey Protein Concentrations (1 - 3%; 2% Xanthan Gum Control)……...…...…….….................................................. 76
Table 13: Mean TPA Parameter Values of Pizza Dough Treatments With Increasing Levels of Whey Protein Concentrations (1 - 3%; 2% Xanthan Gum Control)…………….…………..…………………………………… 77

7
Table 14: Mean Elongation Parameter Values of Pizza Dough Treatments With Increasing Levels of NFDM Concentrations (5 - 15%; 2% Xanthan Gum Control) Continued…….……..…………………………………………… 85
Table 15: Mean Puncture Parameter Values of Pizza Dough Treatments With Increasing Levels of NFDM Concentrations (5 - 15%; 2% Xanthan Gum Control)……………………………………………………………………… 88
Table 16: Mean TPA Parameter Values of Pizza Dough Treatments With
Increasing Levels of NFDM Concentrations (5 - 15%; 2% Xanthan Gum Control)...…………….………………………………………………………. 89
Table 17: Mean TPA Parameter Values of Pizza Dough Treatments With Increasing Levels of NFDM Concentrations (5 - 15%; 2% Xanthan Gum Control) continued...….……………………………………………………… 95

8
List of Figures
Figure 1: Schematic procedure for the preparation of gluten and its major components………. 20 Figure 2: Schematic drawing of gliadin and glutenin association and disulfide linkages that form
gluten…………………………………………………………………………..….……. 26 Figure 3: Schematic representation of wheat dough foam………………..……………….…… 27 Figure 4: Schematic representation of pizza production……………………………………….. 28 Figure 5: Schematic representation of relationships among types of food sensitivities.............. 30 Figure 6: Normal small-bowel biopsy with finger-like villi and small-bowel biopsy from a
patient with celiac disease showing villous atrophy and hypertrophy of crypts……….. 32 Figure 7: Iceberg model………………………………………………………………………… 33 Figure 8: Xanthan gum monomer……………………...……………………………………….. 40 Figure 9: Effect of xanthan gum (0-5%) on the elongation force at maximum load (mN) applied on Gluten-Free dough compared to wheat flour dough………………...……………… 55 Figure 10: Effect of xanthan gum (0-5%) on the extension at maximum load (mm) of stretched Gluten-Free dough compared to wheat flour dough…………………………...……… 56 Figure 11: Effect of xanthan gum (0-5%) on the stress at yield point (mPa) applied on Gluten- Free dough compared to wheat flour dough………………………………………….. 57 Figure 12: Effect of xanthan gum (0-5%) on the puncture force at maximum load (mN) exerted on Gluten-Free dough compared to wheat flour dough………………………………. 59 Figure 13: Effect of xanthan gum (0-5%) on the stress at yield point (mPa) exerted on Gluten- Free dough compared to wheat flour dough….………………………………….…… 60 Figure 14: Effect of xanthan gum addition (0-5%) on adhesiveness (mJ) of GF dough compared to wheat flour dough……………………………………………………………….…. 63 Figure 15: Effect of xanthan gum addition (0-5%) on cohesiveness of GF dough compared to wheat flour dough…………………………………………………..…………………. 64 Figure 16: Effect of xanthan gum addition (0-5%) on hardness (N) of GF dough compared to wheat flour dough…………………………………………….………………………. 65 Figure 17: Effect of xanthan gum addition (0-5%) on springiness (mm) of GF dough compared to wheat flour dough………………………………………………………………….. 66

9
Figure 18: Effect of xanthan gum addition (0-5%) on chewiness (mJ) of GF dough compared to wheat flour dough…………………………..………………………………………… 67 Figure 19: Effect of xanthan gum addition (0-5%) on gumminess (N) of GF dough compared to wheat four dough……………………………………………………………..…….…69 Figure 20: Effect of whey protein (1-3%) on the elongation force at maximum load (mN) applied on Gluten-Free dough containing 2% xanthan gum………………………………...... 70 Figure 21: Effect of whey protein (1-3%) on the extension at maximum load (mm) of stretched Gluten-Free dough containing 2% xanthan gum………...……………………………71 Figure 22: Effect of whey protein (1-3%) on the stress at yield point (mPa) applied on Gluten- Free dough containing 2% xanthan gum……………………………………………...72 Figure 23: Effect of whey protein (1-3%) on the puncture force at maximum load (mN) exerted on Gluten-Free dough containing 2% xanthan gum..…………………………………74 Figure 24: Effect of whey protein (1-3%) on the stress at yield point (mPa) applied on Gluten- Free dough containing 2% xanthan gum…………………………….………………..75 Figure 25: Effect of whey protein (1-3%) on adhesiveness (mJ) of GF dough containing 2% xanthan gum…………………………………………………………………………..78 Figure 26: Effect of whey protein (1-3%) on cohesiveness of GF dough containing 2% xanthan gum…………………………………..…………………………………………….…. 79 Figure 27: Effect of whey protein (1-3%) on hardness (N) of GF dough containing 2% xanthan gum………………………...…………………………………………………….…… 80 Figure 28: Effect of whey protein (1-3%) on gumminess (N) of GF dough containing 2% xanthan gum……………………………………...…..………………………………. 81 Figure 29: Effect of NFDM (5-15%) on the elongation force at maximum load (mN) applied on Gluten-Free dough containing 2% xanthan gum…………….……………….………. 82 Figure 30: Effect of NFDM (5-15%) on the extension at maximum load (mm) of stretched Gluten-Free dough containing 2% xanthan gum…………….……………………….. 83 Figure 31: Effect of NFDM (5-15%) on the stress at yield point (mPa) applied on Gluten-Free dough containing 2% xanthan gum………………………………………...………… 84 Figure 32: Effect of NFDM (5-15%) on the Force at maximum (mN) exerted on Gluten-Free dough containing 2% xanthan gum………………………………………………….. 86
10
Figure 33: Effect of NFDM (5-15%) on the stress at yield point (mPa) exerted on Gluten-Free dough containing 2% xanthan gum…………………………………………………... 87 Figure 34: Effect of NFDM (5-15%) on adhesiveness (mJ) of GF dough containing 2% xanthan gum…………………………………………………………………………………… 90 Figure 35: Effect of NFDM (5-15%) on cohesiveness of GF dough containing 2% xanthan gum…….……………………………………………………………………………… 91 Figure 36: Effect of NFDM (5-15%) on hardness (N) of GF dough containing 2% xanthan gum……………………………………………………………………………………. 92 Figure 37: Effect of NFDM (5-15%) on springiness (mm) of GF dough containing 2% xanthan gum……………………………………………………………………………………93 Figure 38: Effect of NFDM (5-15%) on chewiness (mJ) of GF dough containing 2% xanthan gum……………………………………………………………………………………94 Figure 39: Effect of NFDM (5-15%) on gumminess (N) of GF dough containing 2% xanthan gum………....………………………………………………………………………… 96

11
Chapter l: Introduction
Pizza is a universally popular and important food product with its origins traced to the
Naples region in Italy (Ensminger, Ensminger, Konlande, & Robson, 1995). The Webster's new
world college dictionary (2010) defines Pizza as a baked Italian dish made of flattened bread
dough topped with various herbs, fresh vegetables and meats. In the United States, pizza is
typically topped with tomato sauce, grated cheese, and, often includes toppings such as sausage,
mushrooms, and pepperoni. According to Mama Deluca’s pizza (2011), Americans eat
approximately 100 acres of pizza each day, or about 350 slices per second and approximately
three billion pizzas are sold in the United States each year. Pizza consumption has increased
150% between 1977-78 and 1994. Total pizza sales increased 25% from 1991–1995 with a
market value of $22.2 billion in 1995 (Progressive Grocer, 1996). According to USDA (2000),
pizza consumption has more than tripled since the late 1970’s and is likely responsible for the
most significant share of sauces and cheese used and purchased in fast food restaurants.
Traditionally, the flattened bread dough of pizza crust is made from wheat flour. Wheat
is also popularly used to make other baked products such as pasta, bagels, breakfast cereals, and
bread. Wheat is a preferred ingredient in baked goods, including leavened breads and pizza
bread, because of its ability to form a cohesive dough with the ability to trap gas and allow for
mechanical sheeting (Landillon, Cassan, Morel, & Cuq, 2008; Letang, Piau, & Verdier, 1999).
Wheat gluten is responsible for the formation of gas pockets and allowing for sheeting. This
unique property of gluten makes wheat essential for the commercial production of light and
leavened products such as bread and pastry (Belton, Colquhoun, Field, Grant, Shewry, Tatham,
& Wellner, 1995; Schober, Messerschmidt, Bean, Park, & Arendt, 2008; Sivam, Sun-
Waterhouse, Quek, & Perera, 2010).

12
Gluten is a protein present in wheat, and triticale grains. Wheat dough properties of
molding as a loaf or sheeting are dependent on these gluten proteins which form a continuous
proteinaceous network or matrix in the dough (Huebner & Wall, 1976; Payne, Corfield and
Blackman, 1979). Gluten protein in wheat starch, upon hydration, forms a continuous
viscoelastic network during dough development (Shewry, Popineau, Lafiandra and Belton, 2001;
Juliano, 1985) that confer wheat dough its characteristic mechanical properties.
Gluten-containing products have been associated with Celiac disease, a type of food
sensitivity, in humans (Mayo Clinic, 2010; Wieser & Koehler, 2008). Celiac disease is
characterized by the destruction of the inner epithelial lining of the lumen (Raymond et al., 2006)
and severely affects intestinal absorption leading to extensive malnutrition (Davidson & Bridges,
1987). Ingestion of gluten containing foods induces an immune response which includes binding
of gluten peptides to human leukocyte antigens of presenting cells and the subsequent
stimulation of T-cells accompanied by the release of proinflammatory cytokines such as
interferon-γ and the activation of matrix metalloproteinases. This eventually results in mucosal
destruction and epithelial apoptosis (Wieser & Koehler, 2008). Celiac disease affects at least 3
million people in the United States. The University of Chicago Celiac Disease Center (2011),
estimates that 97% of the Celiac disease population in the United States currently remains
undiagnosed. Celiac disease sufferers manage the conditions by avoiding foods containing
gluten proteins and may have to adopt a strictly gluten-free protein diet.
There is an emerging need to develop gluten-free baked foods to enhance food choice of
celiac-sufferers as well as consumers that demand gluten-free foods to address personal choices.
According to Sloan (2011), gluten-free foods are a fast-emerging market and sales of gluten-free
food products reached $2.9 billion in 2010. However, a technical challenge that presents in the

13
development of gluten-free food products is the loss of material properties such as sheeting and
leavened characteristics that are expectations among processors and consumers.
There are many sources of gluten-free starches (flours) such as potato, tapioca, sorghum,
chickpea, quinoa, corn, and rice. However, each of these gluten-free flours lacks the protein
(specifically gluten) necessary for the viscoelastic characteristic of the developed dough.
Simulation of gluten functionalities in this gluten-free dough is achieved by addition of
alternative proteins and hydrocolloids in order to attain a gluten-free dough with increased
elasticity and improved gas retention (Christianson et al., 1974; Collar et al., 1999; Sánchez et
al., 1996).
In bread making, there is a direct correlation between dough handling ability and final
loaf quality (Shewry, Tatham, Barro, Barcelo, & Lazzeri, 1995). However, the predictability of
baking performance in gluten-free dough related to sheeting has not been studied previously.
Also, most of the gluten-free studies relating to textural properties have been on bread loaf
quality after replacing gluten with hydrocolloids and proteins (Clelici & El-Dash, 2006; Huang
& Preston, 1998; Kadan & Phillippi, 2007; Kulp, Hepburn, & Lehmann, 1974; Nishita, Roberts,
& Bean, 1976; Ohtsubo, Toyoshima, & Okadome, 2009). There is sparse scientific and
published literature on the effect of hydrocolloids and proteins on the textural properties of
gluten-free flat breads that are sheeted during commercial manufacturing. Textural properties
information on dough elongation and the ability to hold together while spreading is important for
gaining insight into sheeting characteristics in the product and process development stages.
The basis of this study was to characterize physical properties of Cassava, Sorghum, and
Chickpea (CSC) dough system by understanding dough textural behavior as related to sheeting
process in pizza crust preparation before baking. Textural behavior was characterized by use of

14
an Instron machine (model 3342, Instron EXTRA, Norwood, MA) to perform Textural Profile
Analysis (TPA), elongation and puncture tests. The performance of gluten-free dough was
compared to wheat dough because consumer expectations of the final pizza crust would be
greatly influenced by conventional wheat pizza crust attributes.
Problem Statement
The effect of hydrocolloids and proteins on the textural properties of gluten-free flat
breads is not understood very well and the predictability of gluten-free dough related to sheeting
has not been studied previously. The main flaw in gluten-free doughs is that they are soft and
batter-like which typically requires baking in pans (Cauvain, 1998), whereas pizza dough is
rolled to sheets before baking, making it a critical step in dough handling and final product
quality. Hence, the goal of this study was to characterize the textural properties of the CSC
dough system by understanding dough textural behavior as related to sheeting process in pizza
crust preparation before baking.
Purpose of the Study
The purpose of this study was to determine the effect of Xanthan Gum addition (1, 2, 3
and 5% by weight of ingredients excluding water) on the textural characteristics of gluten-free
pizza dough made from Cassava, Sorghum and Chickpea (CSC) flour blends. Two percent
xanthan gum in CSC dough was used to determine the effect of ingredients (whey protein at 1, 2
and 3% or dried skimmed milk powder at 5, 10 and 15% by weight of dry ingredients excluding
water) on the textural characteristics on gluten-free pizza crust containing xanthan; at the Food
and Nutrition Department, University of Wisconsin-Stout during the spring and summer
semesters, 2011.

15
Assumptions of the Study
The major assumptions were:
That xanthan gum together with dairy proteins could replace gluten in a gluten-free
pizza crust.
The physical properties tested were conducted on the raw gluten- free dough and it
was assumed that the acquired quality attributes due to use of xanthan gum and dairy
proteins were transferable to the final cooked product.
Yeast was not used in preparation of samples due to lack of control of dough rise
between different sample measurements. Therefore, it was assumed that excluding
yeast from the ingredients would not interfere with the final product quality in scale
up product processing where yeast would eventually be used.
Finally, it was assumed that differences due lag time between sample measurements
were not large enough to be expressed in the measured outcomes.
Objectives
The objectives of the study were to:
Determine the effect of Xanthan Gum addition (1, 2, 3, 5% weight of total ingredients
excluding water) on the textural characteristics of gluten-free pizza dough made from
Cassava, Sorghum and Chickpea (CSC) flour blends.
Determine the effect of added ingredients (whey protein at 1, 2 and 3%
concentrations or dried skimmed milk powder at 5, 10 and 15% concentrations,
weight of total ingredients excluding water) on the textural characteristics of gluten-
free pizza crust containing 2% xanthan.

16
Hypotheses
The hypotheses of the study were:
There is no significant difference in dough elongation, puncture and Texture Profile
Analysis between CSC gluten-free dough at different Xanthan gum concentrations.
There is no significant difference in dough elongation, puncture and Texture profile
Analysis of CSC gluten-free dough containing 2% Xanthan gum with added whey
protein (1, 2 and 3% concentrations, total weight excluding water) or dried skimmed
milk powder (5, 10 and 15% concentrations, total weight excluding water).
Definition of Terms
Adhesiveness. Is the work required to overcome the attractive forces between the
surface of the food and the surface of other materials in contact with the food.
Celiac disease or celiac sprue. Is an inflammatory disorder of the upper small intestine
that prevents it from absorbing essential nutrients and is triggered by the ingestion of wheat, rye,
barley, oat and other products (Wieser & Koehler, 2008).
Chewiness. Is the energy required to chew a solid food to the state required for safely
swallowing it.
Cohesiveness. Is the strength of internal bonds making up the food product.
Gluten. Is a composite protein that is present in foods processed from wheat and related
grains such as rye and barley. This composite protein is made of two fractions, glutenin and
gliadin (Khan & Bushuk, 1979).
Gluten-free. Refers to diets or foods that exclude gluten containing sources.
Gumminess. Is the energy required to disintegrate a semi-solid food to a point ready for
safely swallowing it.

17
Hardness. Is the force required to compress a food between the molars.
Hydrocolloids. Commonly named as gums are diverse range of biopolymers derived
from natural sources that form a gel with water (Rosell et al., 2007).
Symbols and Acronyms
CMC - CarboxyMethyl Cellulose
CSC - Cassava, Sorghum and Chickpea
GF - Gluten Free
HPMC - HydroxyPropyl MethylCellulose
IgE - Immunoglobulin E
NFDM - Non Fat Dried Milk
SDS-PAGE - Sodium Dodecyl Sulfate-PolyacrylAmide Gel Electrophoresis
TPA - Texture Profile Analysis
C1 - Control 1
C2 - Control 2
C3 - Control 3
E1 - 1% xanthan Gum
E2 - 2% xanthan gum
E3 - 3% xanthan gum
E4 - 5% xanthan gum
W1- 1% whey protein
W2 - 2% whey protein
W3 - 3% whey protein
NFDM1 - 5% nonfat dry milk
18
NFDM2 - 10% nonfat dry milk
NFDM3 - 15% nonfat dry milk
Limitations
The major limitations of the study were:
The timing of four months was not adequate to study the effects of xanthan gum and
added proteins on both raw gluten-free dough and finished baked product. Therefore,
only unbaked gluten-free dough was studied.
Gluten-free dough was very fragile therefore giving difficulties in physical
measurements and therefore needed longer measurement times and a lot of practice in
order to minimize equipment measurement errors.

19
Chapter II: Literature Review
In this chapter, gluten, xanthan gum, gluten-free products and dairy ingredients are
discussed to give an overview of past, current and future trends on the topic of this dissertation.
Gluten
Origin. Wheat gluten was isolated and first described by Jacopo Beccari in 1745. He
reported that gluten could be prepared by washing the starch and water-soluble components of
flour from wheat dough by kneading the dough under a gentle stream of water (Khan & Bushuk,
1979; Hargreaves, Popineau, Marion, Lefebvre, & Le Meste, 1995; Bloksma & Bushuk, 1998).
The gluten preparation process also showed that wheat flour could be divided into two fractions,
one which was water insoluble and similar to substances of animal origin and the other water
soluble with characteristics similar to sugars (Shewry et al., 1995).These fractions were named
amylo and glutinis, and correspond to what we presently call starch and gluten respectively. The
insoluble residual (gluten) viscoelastic mass was later shown to contain about 80% of total
protein of the wheat flour. Approximately two thirds of the mass of gluten is water of hydration.
Dry solids contain 75-85% proteins and 5-10% lipids. Occluded starch makes up the rest of the
dry matter (Khan & Bushuk, 1979).
As early as the 1750’s, Gluten’s importance in bread making was well established and
recognized due to its contribution to the functional properties to wheat dough (Shewry et al.,
1995). The historical importance of gluten is also evidenced in leavened bread making which is
one of humankind’s oldest forms of biotechnology established in ancient Egypt before 2000
BCE (Shewry et al., 1995). Other historical forms of gluten-based breads that have been made
from wheat flour include flat breads (e.g., Indian origin) and pocket breads (Middle East), noodle
(China and S.E Asia) and pasta (Shewry et al., 1995).

20
Figure 1. Schematic procedure for the preparation of gluten and its major components
Molecular properties. Gluten proteins are the major storage proteins in cereal grains
and are stored in the starchy endosperm to provide amino acids for seed germination. Gluten
proteins are synthesized on the rough endoplasmic reticulum and then directed into the lumen of
the plant cell via a standard signal peptide-mediated mechanism (Shewry et al., 1995). They are
then deposited in protein bodies which may be derived from direct accumulation within the
endoplasmic reticulum lumen or transport via the Golgi apparatus to the vacuole (Shewry et al.,
Wheat
Mill
Flour
Mix with water
Dough
Wash with water
Gliadin
-low mol wt
-soluble in aqueous ethanol
-high extensibility
-low elasticity
Glutenin
-high mol wt
-soluble in acids and bases
-low extensibility
-high elasticity
Gluten

21
1995). The protein bodies’ diameter ranges up to about 20 µm but as the endosperm cells fill
with starch the protein bodies become disrupted and coalesce to form a matrix of storage proteins
surrounding the starch granules in the mature dry tissue (Shewry et al., 1995). It is this matrix
that forms a continuous network called gluten when the endosperm is milled and the flour mixed
with water and kneaded.
Gluten is made up of two proteins, glutenin and gliadin (Figure 1), as described below.
Gliadin. Gliadin is the portion of the gluten proteins that is 70% soluble in aqueous
ethanol and comprises of 35-40% of wheat flour proteins (Figure 1) (Khan & Bushuk 1979).
Gliadin imparts the viscous component to the viscoelastic properties of gluten. In human
physiology, gliadin, on ingestion, initiates the autoimmune response in Celiac disease (Mendoza
2005).
Gliadin contains approximately fifty components as identified by a two-dimensional
electrofocusing-electrophoresis technique (Khan & Bushuk, 1979). The molecular weights of
these components are identified by sodium dodecyl sulfate-polyacrylamide gel electrophoresis
(SDS-PAGE) and they range from approximately 12,000 to 80,000 daltons, with majority of the
components having a molecular weight of approximately 36,000 daltons (Khan & Bushuk,
1979).
Most gliadin components contain single chains containing intra-polypeptide disulfide
bonds. The disulfide bonds are mainly due to total amino acid residues containing
approximately 35% glutamic acid (Table 1) (Khan & Bushuk, 1979). Gliadin also contains
about 15% proline in relation to the total amino acid residues (Table 1).

22
Table 1
Amino Acid Composition of Wheat Flour Components per 100,000g of Wheat Flour
Amino Acid Gliadin Glutenin Gluten Flour
Lysine 5 12.5 9 16
Histidine 14.5 13 15 19
Arginine 15 20 20 29
Aspartic acid 20 23 22 33
Threonine 18 26 21 22
Serine 38 50 40 42
Glutamic acid 317 278 290 318
Proline 148 114 137 107
Glycine 25 78 47 27
Alanine 25 34 30 25
Cysteine 10 10 14 18
Valine 43 41 45 37
Methionine 12 12 12 13
Isoleucine 37 28 33 33
Leucine 62 57 59 58
Tyrosine 16 25 20 24
Phenylalanine 38 27 32 44
Tryptophan 5 8 6 7
Amide 301 240 298 230
(Khan & Bushuk, 1979)

23
Proline disrupts the regular secondary structure of a polypeptide chain due to its ability to
create bends wherever it occurs in the polypeptide chain. Also, gliadin contains low levels of
basic amino acids and low levels of free carbonyl groups, a property that makes gliadin among
the least charged proteins (Table 1) (Khan & Bushuk, 1979). Contrary to expectations of a
structure that is quite different (disrupted structure due to proline) from globular proteins relative
to its unique amino acids composition, gliadin proteins contain compact tertiary structures
similar to those of globular proteins.
Glutenin. Glutenin is that fraction of the gluten protein that is insoluble in 70% aqueous
ethanol but soluble in dilute acid and alkali (Figure 1) (Weiser, 2007). Glutenin comprises about
35-45% of wheat endosperm protein (Khan & Bushuk, 1979). They impart the elastic
component to the viscoelastic property of gluten. It is mainly glutenin that undergoes extensive
changes during dough mixing and the development of optimum rheological properties for
maximization of bread-making potential of a specific flour (Khan & Bushuk, 1979; Tatham et
al., 1990a; Shewry, 1995).
The functional behavior of glutenin in bread making is dependent on its physical
(molecular shape and size) and chemical (amino acid composition, sequence and tendency to
aggregate) properties. Using SDS-PAGE on reduced glutenin shows that hexaploid wheats
(bread wheats) contain about 17 polypeptide subunits ranging in molecular weight from 12,000
to 134,000 daltons (Khan & Bushuk, 1979). These polypeptide units are joined to one another
by interpolypeptide disulfide bonds to form long concatenated structures or joined by
hydrophobic interactions and hydrogen bonds to form highly stable micelles. Tetraploid wheats
lack three of largest subunits (90,000, 132,000 and 134,000 daltons) present in glutenin of bread
wheats. These three large molecular weight glutenin subunits play a key role in the function of

24
this protein in dough formation and stability during baking (Khan & Bushuk, 1979). Alkylated
subunits of glutenin have been fractionated by gel filtration into three subunits based on
molecular weights, lowest (68,000 to 12,000), largest (134,000 to 60,000) and those with same
mobility (35,000 and 45,000). These three groups also play an important role in exhibiting
glutenin’s unique properties to influence the overall functional properties of glutenin in gluten
and the resultant dough (Khan & Bushuk, 1979).
Glutenin amino acid composition (Table 1) reflects a high glutamic acid content that is all
present as glutamine. This provides numerous amides groups that can form intra and inter-
molecular hydrogen bonds; a very important rheological feature in hydrated gluten (Khan &
Bushuk, 1979). Glutenin contains a high proportion of hydrophobic amino acids such as leucine
which interact with each other at the non-polar side of the chain in aqueous environments as in
dough to form hydrophobic bonds. In lager numbers, these weak bonds help in stabilizing
glutenin aggregates. Glutenin is insoluble in aqueous solvent due to having less amino acids
with acidic and basic side groups (Khan & Bushuk, 1979).
Glutenin appears as asymmetrical molecule with a low α helix content (10-15). It
contains more α helix structure in hydrochloric acid, less in urea solutions (Khan & Bushuk,
1979) and the amount of α helix structure is also influenced by changes in the ionic strength.
Secondary, tertiary and quaternary structures of glutenin can be modified by oxidizing agents,
reducing agents and mechanical development to produce bread of optimum loaf volume and
crumb structure (Khan & Bushuk, 1979).
Functionality in Food
Functionality in cereal products. Wheat flour is the major ingredient in almost all
breads, pizza crust, rolls, chapaties, crackers, cookies, biscuits, cakes, doughnuts, muffins,

25
pancakes, waffles, noodles, macaroni, and spaghetti (Inglett, 1977; Belton et al., 1995; Schober,
et al., 2008; Sivam et al., 2010). In baking process of these wheat-based products, gluten
proteins require adequate hydration and shear to promote protein cross-linkages between
glutenin and gliadin (Figure 2) (Shewry et al., 2001; Juliano, 1985). This is desired so as to form
an interconnected protein film capable of trapping expanding gas bubbles in the dough to provide
leavening in baked goods (Figure 3) (Huebner & Wall, 1976; Inglett, 1977; Landillon et al.,
2008; Letang et al., 1999). Shear/kneading is required to break down disulfide bonds between
adjacent chains and realign them to form a continuous protein sheet (Stauffer, 1998). Other
grains and starches lack the mechanism promoting gas retention, flexibility, and enhanced water
retention (Wieser & Koehler, 2008).
Gluten matrix is a major determinant of the important properties of dough (extensibility,
resistance to stretch, mixing tolerance, gas holding ability). In a dough network, gluten encloses
the starch granules and fiber fragments (Figure 3) (Gan et al., 1995; Gallagher et al., 2004). It is
important that gluten should have a precise balance between elasticity and extensibility because
excessive elasticity would limit expansion during gas retention and insufficient elasticity would
fail to retain carbon dioxide/gas (Shewry et al., 1995). Gluten elasticity is often referred to as
dough strength, and strong doughs are required for products such as bread, pasta, noodles,
chapati, and pizza. In contrast weaker (less elastic) doughs are required for making cakes and
cookies (Shewry et al., 1995).
Absence of gluten often results in a liquid batter rather than a dough, and can result in
baked bread with a crumbling texture, poor color and other quality defects after baking (Huebner
& Wall, 1976; Payne et al., 1979). Rotsch (1954) concluded from his findings that bread doughs
without gluten can only retain gas if another gel replaces the gluten.

26
Figure 2. Schematic drawing of gliadin and glutenin association and disulfide linkages that form
gluten (Crockett 2009)
Preparation of gluten-free flat breads and pasta is difficult, as the gluten contributes to a
strong protein network that prevents dissolution of the pasta during cooking or breaking of pizza
crust dough during sheeting. The diversification of gluten-free raw materials sometimes
necessitates modifications to the traditional production process (Marconi & Careca, 2001). Such
problems are rarely encountered during the manufacture of gluten-free cookies, as the
development of a gluten network in cookie dough is minimal and undesirable; the texture of
baked cookies is primarily attributable to starch gelatinization and sugar rather than a
protein/starch structure (Gallagher, 2002).

27
Figure 3. Schematic representation of wheat dough foam (Gan et al., 1995)
Many different products are made from gluten proteins which demonstrate the versatility
of these proteins. Therefore, better understanding of the structure of these proteins would lead to
taking further advantage of enormous industrial potential these proteins possess (Khan &
Bushuk, 1979).
Functionality in pizza dough. Pizza industry growth has been with unprecedented
momentum in recent decades (Sun & Brosnan, 2003), and the increase in demand has made
companies show increased interest in the industrial production of pizza dough (Arendt & Bello,
2008). There are two types of pizza; deep pan and thin and crispy pizza. Deep pan pizza needs
high protein wheat flour, and is fermented with yeast to produce a bread-like base. Thin and
crispy pizza uses lower protein wheat flour than deep pan and can be fermented or gas aerated to
produce a biscuit-type base (Gallagher, 2008). Pizza dough preparation process is straight
forward (Figure 4). There are varied ingredients used along with wheat flour. They are salt,
water, and baker’s yeast as a leavening agent. Different types of lactic acid bacteria and yeast
are reported to be involved in the leavening process (Coppola et al., 1998).

28
Figure 4. Schematic representation of pizza production (Gallagher, 2008)
The overall quality of a pizza depends mainly on the gluten dough, whose properties are
affected by the leavening process, in addition to the flour type and preparation procedure. For a
good-quality pizza, the dough has to be sheetable, to rise on proving, hold the gas produced by
the yeast, as well as to have good textural and sensory attributes (Gallagher, 2008). Larsen et al.
(1993) reported that pizza crust’s appearance, taste and texture are important factors for
consumer identification and acceptance. As for bread, hard wheat flour is the principal
ingredient of pizza crust (Gallagher, 2008). Hard wheat flour yield strong gluten dough with
high elasticity.
The quality of gluten present in the flour must yield balance between elasticity and
extension such that once the flour is hydrated, a cohesive, extensible dough is formed, and as
Mix and divide dough
Shape using blocking equipment / pizza press or sheeting apparatus
Apply toppings
Weigh: Flour, water, salt, fat, and yeast
Prove (30–40 °C, 80–90% RH)
Bake
Cool / Freeze & Package

29
mentioned earlier should be able to rise during proofing and retain its shape during the sheeting
process.
Comparing pizza with other baked products, pizza quality, and in particular gluten-free
pizza crust quality remains a less researched area (Arendt & Bello, 2008).
Food Sensitivity Associated with Gluten
Food sensitivities and allergy. Consumption of certain foods may result to death due to
related sensitivities and food allergies. In the United States, approximately 30,000 people
require emergency care and 150 people die each year due to food sensitivities; around 2% of
adults and 5% of children suffer from food allergies (U.S. Food and Drug Administration, 2004).
Health-care and other economic costs due to food sensitivities are estimated to be approximately
$7 billion per year (Asthma and Allergy Foundation of America).
Food sensitivity and allergy are individualistic adverse reactions to foods; most people
eat the same food without ill effects (Taylor, 1987). As illustrated in Figure 5, these adverse
reactions can be categorized as immunological sensitivities, non-immunological food
intolerances and secondary sensitivities.
A true food allergy is a heightened reaction of the immune system to components of
certain foods that are otherwise harmless to most people (Asthma and Allergy Foundation of
America). The food components that educe these abnormal immune responses are typically
naturally-occurring proteins in foods. According to Lemke and Taylor (1984), true food
allergies are categorized into immediate hypersensitivity reactions and delayed hypersensitivity
reactions (Figure 5). Immediate hypersensitivity reactions are due to abnormal response of the
immune system with the allergen-specific Immunoglobulin E (IgE) antibodies (Mekori, 1996).
Whereas, delayed hypersensitivity reactions are caused by abnormal response of the cellular

30
immune system with the sensitized T cells (Lemke & Taylor, 1994). Celiac disease is a form of
delayed hypersensitivity reaction which involves abnormal immunological response to wheat and
related cereals (Ferguson, 1997).
Figure 5. Schematic representation of relationships among various types of food sensitivities
(Taylor & Hefle 2001)
Food intolerances do not involve immune system. Food intolerances are metabolic food
disorders, anaphylactic reactions which are rapidly progressing and life-threatening allergic
reaction and idiosyncratic reactions which are drug reactions that are rare and unpredictable
Primary Food Sensitivity Secondary Food Sensitivity
- Secondary to drug treatment
-Secondary to GI
Immunological
Immunological
Immunological
Food Sensitivity
Non-IgE-cell-mediated
-Delayed hypersensitivity reaction
Food Allergy
Immunoglobulin E
(IgE)-mediated
- Immediate
hypersensitivity
reactions
Food Intolerances
Food Intolerances
-Non immunological
-Anaphylactic reactions, e.g. strawberry
reaction
-Metabolic reactions, e.g. lactose intolerance
-Idiosyncratic reactions, e.g. sulfite-induced
asthma
Food anaphylaxis
Exercise-induced
Other

31
(Figure 5) (Taylor, 1987). Kocian (1988) reported lactose intolerance as a metabolic food
disorder.
Secondary sensitivities include adverse reactions that may occur with or after the effects
of other conditions (Taylor & Hefle, 2001). According to Metcalfe (1984a), lactose intolerance
can be secondary to gastrointestinal disorders such as Crohn’s disease.
Non-IgE-mediated food allergies are disorders mediated by T cells (Sampson, 2000).
Symptoms of these disorders start to appear 24 hours or longer after the ingestion of specific
foods and reach a peak at 48 hours (Lemke & Taylor, 1994). The reaction eventually subsides
over 72-96 hours (Taylor & Hefle, 2001). According to Strober (1986), celiac disease occurs
through a T cell-mediated mechanism.
Celiac disease. Celiac disease is also known as celiac sprue or gluten-sensitive
enteropathy (Taylor & Hefle, 2001; Collin et al., 2002). Celiac disease is an inflammatory
disorder of the upper small intestine triggered by the ingestion of wheat, rye, barley, oat and
other products (Wieser & Koehler, 2008). Celiac disease is clinically characterized by a flat
intestinal mucosa with the absence of normal villi, resulting in a generalized malabsorption of
nutrients (Figure 6) (Collin et al., 2002; Davidson & Bridges, 1987; Raymond et al., 2006).
Ingestion of gluten containing foods induces an immune response which includes binding
of gluten peptides to human leukocyte antigens of presenting cells and the subsequent
stimulation of T-cells accompanied by the release of proinflammatory cytokines such as
interferon-γ and the activation of matrix metalloproteinases. This eventually results in mucosal
destruction and epithelial apoptosis (Wieser & Koehler, 2008). The intestinal mucosal lesion
recovers with a gluten-free diet and deteriorates further if the patient resumes a gluten-containing
diet (Trier, 1991).

32
Figure 6. Top, normal small-bowel biopsy with finger-like villi. Bottom, small-bowel biopsy
from a patient with celiac disease showing villous atrophy and hypertrophy of crypts (Collin et
al., 2002)
Celiac disease affects at least 3 million people in the United States, with 97% of the
celiac disease population currently remaining undiagnosed (University of Chicago Celiac
Disease Center, 2011). Prevalence of celiac disease among Caucasians is now thought to be in a
range of 1:100–300.
Celiac disease is not only frequent in developed countries, it is increasingly found in
developing world, such as North of Sahara (Bdioui et al., 2006), Middle East (Shahbazkhani et
33
al., 2003), and India (Sood et al., 2006). This disorder contributes substantially to childhood
morbidity and mortality in many developing countries (Arendt & Bello, 2008). The highest
celiac disease prevalence in the world has been described in the Saharawi, an African Arab-
Berber origin (Catassi et al., 1999).
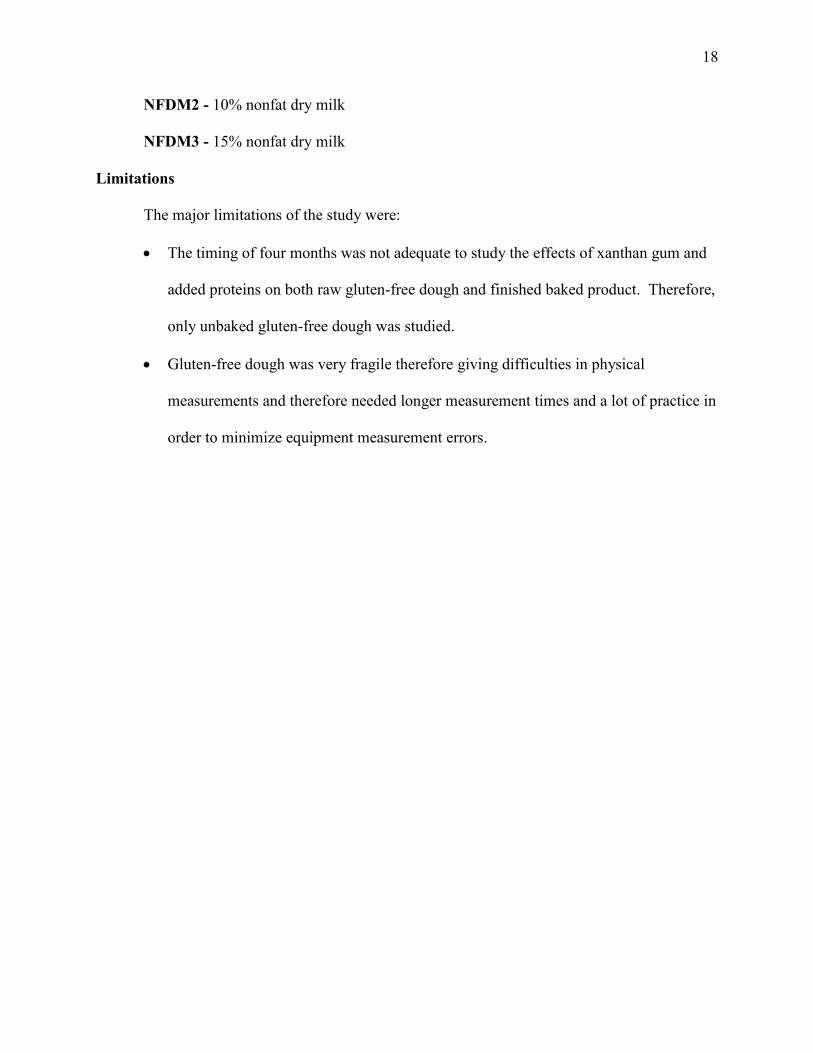
The prevalence of celiac disease is efficiently conceptualised by the iceberg model
(Figure 7) (Fasano & Catassi, 2001; Arendt & Bello, 2008). The tip of the iceberg represents
individuals with clinically recognized celiac disease. The majority of individuals are made up of
those with undiagnosed cases or those that will develop the sensitivity in later life. Diagnoses
occur at any age and symptoms vary from mild to extremely severe (Arendt & Bello, 2008).
Figure 7. Iceberg model: Area A represents the percentage of patients with clinically diagnosed
celiac disease. Area B represents the percentage of patients with undiagnosed or silent celiac
disease. Area C represents the percentage of patients with a potential to develop celiac disease.
Susceptibility to celiac disease is significantly determined by genetic factors. Liability to
the disease runs in families, and concordance for celiac disease in first-degree relatives ranges
between 10–15% and reaches up to 80% in monozygotic twins (Collin et al., 2002). The genetic

34
association is with human leukocyte antigens (HLA-) DQ2 and DQ8 and currently unknown
non-HLA genes (Wieser & Koehler, 2008).
Celiac disease symptoms include weight loss, diarrhea, ataxia, steatorrhea, anemia,
lethargy and constipation (Mendoza, 2005). In some cases, individuals do not know they suffer
from celiac disease until they are diagnosed and notice a slight improvement with dietary
modifications (Mendoza, 2005). The only form of treatment is a strict life-long adherence to a
gluten-free lifestyle (Mendoza, 2005; Raymond et al., 2006). This requirement eliminates the
choice of many wheat-based products, including the traditional pizza and wheat bread, and
thereby severely restricts food choice.
Gluten-Free
Consumer demand and economic potential. There are a wide range of gluten free
products in the market. They include pizza, pasta, bagels, cake mixes, waffles, even beer and
gum. The increased national demand for gluten-free products is fueling a robust market for
foods and drinks made without gluten (New York Daily News, 2010). This increase in demand
of gluten-free products has been largely due to improved diagnostic procedures of celiac disease
and changes in eating habits (Gallagher, 2009; Medeiros et al., 2011). In addition, Catassi et al.
(2010) reports that the increase of gluten-product demand is due to a trend towards a loss of
immunological tolerance to celiac disease throughout adulthood.
Historically, consumers have looked to natural foods retailers or the internet for these
gluten-free food options. However, with the growth of demand for gluten-free foods,
conventional markets account for 63% of gluten free products purchased (Gallagher, 2009). For
example, in 2006, the number of gluten-free products increased to over 2,400 in natural

35
supermarkets/food stores and to over 1,400 in conventional supermarkets/food stores (Rourke &
Tirone, 2007).
Sales of gluten-free products increased 74 percent from 2004 to 2009 and were projected
to grow from 15 to 25 percent a year by 2013 (Kuntz, 2006). Reporting on food trends, Sloan
(2011) highlighted that sales of gluten-free products reached 2.9 billion dollars in 2010. This has
been a rapid rise in sales of gluten-free products growing from a modest $210 million in 2001
(Kuntz, 2006).
In 2009, sales of products such as wheat-free breads and cakes had already enjoyed sales
growth of over 120% in the last three years alone (Gallagher, 2009). This reached $65 million
with the most interest in snack foods and bakery items (Table 2).
Table 2
New Products Claiming ‘Gluten-Free’ in the United States by Year
Year Number of new food and beverage products
2004 202
2005 232
2006 610
2007 636
(Gallagher, 2009)
Medeiros et al. (2011) reported that although gluten-free products are viewed as a niche
market, recognizing the possibility that this niche may be larger than expected and may continue
to grow is important. With the estimate that 10% of the general population is being affected by
some type of wheat product or protein, then potential to serve this segment of the population
with gluten free food is no longer relegated to niche market (Medeiros et al., 2011).
36
Gluten-free pizza crust. Commercially available gluten-free pizza crusts exist
(Gallagher, 2008). These are based on ingredients such as wheat starch, maize starch, potato
starch, cassava starch, sorghum flour, rice flour, corn flour, gums, and emulsifiers. However, the
topic still remains a little-researched area (Arendt & Bello, 2008).
O’Brien et al (2002) reported on gluten-free pizza crust research at University College
Cork, Ireland based on formulation, rheological aspects and baking properties. In this research,
combining a variety of gluten-free flours and starches, protein sources (egg, soy), or
hydrocolloids (guar gum) and a microencapsulated high-fat powder, it was possible to fulfill
consumer acceptance and requirements based on appearance, taste and texture (Gallagher, 2008).
Tests such as dough hardness, texture (pizza crust hardness), color, and pizza volume confirmed
that it is possible to produce a gluten-free pizza product with similar attributes to the wheat-
based control.
Hydrocolloids
Hydrocolloids are diverse range of biopolymers (e.g. proteins and polysaccharides)
derived from natural sources (e.g. plants, animals, seaweed or microbial origin) that form a gel
with water (Rosell et al., 2007; Gallagher, 2009). Hydrocolloids are commonly named as gums,
are capable of controlling both the rheology and texture of aqueous systems through the
stabilization of emulsions, suspensions and foams (Diezak, 1991; Gallagher, 2009). Also, they
are used to slow down retrodegradation, increase moisture retention and increase overall quality
of products during storage time (Rojas et al., 1999). Based on their functionality in food
systems, they could be classified in three main categories: thickeners, gelling agents and
emulsifiers (Table 3).

37
Structural properties of hydrocolloids and their influences by processing variables (e.g.
heat, pH and shearing) determine their functionality (Gallagher, 2009). The structure-functional
relationships of hydrocolloids and their roles in foods have been extensively investigated
(Funami et al., 2005b; Casier et al., 1977; Lazaridou et al., 2007).
Various investigations on the effect of supplementing gluten-free doughs with
hydrocolloids on standard farinograph curves have been conducted (Gujral et al., 2003a;
Sivaramakrishnan et al., 2004; Lazaridou et al., 2007). In these studies, Lazaridou et al. (2007)
reported that water absorption of gluten-free doughs based on rice flour, corn starch and milk
proteins increased following the addition of various hydrocolloids, such as pectin, agarose, CMC
and xanthan gum due to the hydrophilic nature of these biopolymers. They found out that the
water absorption of formulations containing hydrocolloids at 2% level (rice flour basis) varied in
range 63.4% - 67%. Also, the dough development time farinograph parameter increased with the
addition of hydrocolloids from 4 minutes for the control to the range of 7.5-26.5 minutes, with
exception of xanthan, which decreased the dough development time to 2 minutes. The dough
elasticity and cohesiveness when 500BU of consistency is reached, was differently affected by
each hydrocolloid with xanthan gum resulting to the highest elasticity values (100BU). Xanthan
gum farinograph curve resembled that of a standard farinograph curve typically obtained by
wheat flour (Gallagher, 2009).

38
Table 3
Common Hydrocolloids and Their Functionality in Food Products
Source Hydrocolloid Functionality
Plant pectin Gelling, thickening
Β-Glucan Gelling
Gum Arabic Thickening
Guar gum Thickening
Locust bean gum Thickening
Arabinoxylan Gelling
Seaweed Agar Gelling
Alginate Gelling, thickening
Carrageenan Gelling
Animal Milk proteins Gelling, emulsification
Egg proteins Gelling, emulsification
Gelatin Gelling, emulsification
Microbial Xanthan gum Thickening
(Gallagher, 2009)
Gallagher (2009) reports that fundamental rheometry conducted on gluten-free doughs
revealed an improvement in the viscoelastic properties of gluten-free doughs after supplementing
the formulations with hydrocolloids. Addition of various hydrocolloids at 1% and 2% levels
(rice flour basis) resulted in rise of elastic modulus, G’ as well as an increase in the resistance to
deformation (Lazaridou et al., 2007). Xanthan gum, β-glucan and pectin addition resulted to
firmer doughs (higher G’ values) with increasing hydrocolloid concentration. The firming of the

39
dough indicated that the rise of the biopolymer level affected the rheological properties more
than the increasing content of water (Gallagher, 2009).
Lazaridou et al. (2007) found that the elasticity and resistance to deformation of doughs
followed the order of xanthan >CMC>pectin>agarose> oat β-glucan. The elasticity of the
gluten-free doughs depended on water and hydrocolloid and increased by 65-75%, 45-50%, 35-
40%, 25% and 8-15% when xanthan, pectin, agarose and oat β-glucan, respectively, were added.
Apart from the concentration effect, the magnitude of influence of hydrocolloids on rheological
properties of gluten-free doughs seems to be related to the molecular structure and chain
conformation of the polysaccharide that determine the physical intermolecular associations of the
polymeric chain (Gallagher, 2009). The highest elasticity of dough formulations supplemented
by xanthan gum could be explained by the weak gel properties and high viscosity values at low
shear rates of aqueous xanthan gum dispersions due to its rigid, ordered chain conformation
(Doublier & Cuvelier, 1996; Rodd et al., 2000; Gallagher, 2009).
Xanthan Gum
Properties. Xanthan gum is produced by aerobic fermentation of a pure culture of the
bacterium Xanthomonas campestris (Borges & Vendruscolo, 2007; Ben Salah et al., 2009). It is
an anionic polysaccharide which possesses a cellulosic backbone of (1,4)-b-D-glucose residues,
and a trisaccharide side chain consisting of b-D-mannose-(1,4)-b-D-glucuronic acid-(1,2)-b-D
mannose attached at C-3 to alternate glucose residues of the main chain (Figure 8) (Garcia-
Ochoa et al., 2000; Rosalan & England, 2006; Ben Salah et al., 2009). Xanthan from different
suppliers are very similar. They are made up of rigid helix rods and xanthan polymers can pack
closely to each other forming strong gels with a high yield stress point (Whitecomb & Macosko,

40
1978). Once the stress applied overcomes the yield stress point, xanthan shears readily
(Whitecomb & Macosko, 1978).
Xanthan is a biopolymer most widely accepted commercially with application in
numerous industrial segments due mainly to its rheological properties that allow the formation of
viscous solutions at low concentration (0.05–2%), and a wide range of pH and temperature
stability, characteristics resulting from xanthan’s ramified structure and high molecular weight
(Silva et al., 2009; Ben Salah et al., 2009). Xanthan can be used in foods and other segments as
a thickening, stabilizing and emulsifying agent and, in synergism with other gums, can act as a
gelling agent (Lopez et al., 2001).
An important property when using xanthan gum as food additive in food formulation or
cosmetics is the viscosity of the resultant solution, which is a function of shear rate and depends
on the molecular weights and the polymer concentration (Ben Salah et al., 2009). The molecular
weight of xanthan gum has been reported to be in the order of 1.5–7 106 Dalton (Lopez et al.,
2004).
Figure 8. Xanthan gum monomer (Whitecomb & Macosko, 1978)

41
Functionality in food. Hydrocolloids are added to baked goods for additional water-
binding to a moister softer baked good (Ahlborn et al., 2005). In gluten-free products studies
they are found to improve baked bread quality by increasing gas retention, specifically increasing
loaf volume in bread (Arendt & Bello, 2008; Gallagher et al., 2003a; Lee et al., 2002). All
hydrocolloids are able to modify starch gelatinization (Rojas et al., 1999) and some studies have
reported the use of hydrocolloids as fat replacements (Lucca & Trepper, 1994). In a study by
Ahlborn et al. (2005), they determined that a blend of xanthan and HPMC improved moistness
and overall freshness of rice bread over that of the control rice bread and wheat bread.
Xanthan gum forms high-viscosity pseudoplastic material and is very common in
commercial gluten free products (e.g., loaves). This behavior of xanthan gum is important in
bakery products during dough preparation, i.e., pumping, kneading and rolling (Lorenzo et al.,
2008). Xanthan is never used alone but in combination with alternative proteins, hydrocolloids,
or even supplemented with amino acids (Ahlborn et al., 2005; Lazaridou et al., 2007; Gambuś et
al., 2007). Also as mentioned earlier in xanthan gum properties section, it can be used in foods
and other segments as a thickening, stabilizing and emulsifying agent and, in synergism with
other gums, can act as a gelling agent (Lopez et al., 2001).
Functionality in cereal dough including pizza crust. Rotsch (1954) demonstrated the
potential of substances that swell in water to mimic the gluten properties in dough. Kulp et al.
(1974) reported the incorporation of xanthan gum in the production of a pure wheat-starch bread.
Since then, the use of hydrocolloids in gluten-free products has been increasing (Table 4).

42
Table 4
Summary of Studies Involving Gluten-Free Breads and Xanthan Gum
Bread main ingredients Hydrocolloids Reference
Wheat starch Xanthan gum Kulp et al. (1974)
Rice flour HPMC, locust bean gum, guar gum,
carageenan, xanthan gum
Kang et al. (1997)
Rice flour, corn starch,
cassava starch
Xanthan gum Lopez et al. (2004)
Rice flour,
dairy-based proteins
Xanthan gum, konjac gum Moore et al. (2004)
Rice flour, milk proteins,
egg proteins
Xanthan gum, HPMC Ahlborn et al.(2005)
Sorghum Xanthan Schober et al. (2005)
Rice flour, potato starch,
corn flour
Xanthan gum Moore et al. (2006)
Rice flour, corn starch, CMC, pectin, agarose, Lazaridou et al. (2007)
sodium caseinate xanthan gum, b-glucan
In 1976, Nishita et al. reported the development of a yeast-leavened rice bread formula
using different additives. In this study, hydrocolloids provided the dough with the viscosity
necessary to trap fermentation gases, and the ‘water-release’ effect necessary for starch
gelatinization during baking.

43
When xanthan, guar gum, locust bean gum and tragant were added as binding agents and
gluten substitutes in bread made from corn starch (Acs et al., 1997), these agents efficiently
substituted the technological effect of gluten in gluten-free systems, resulting in a highly
significant increase in bread volume and loosening of the crumb. Individually, evaluation of the
effect of the gums showed that the highest quality bread was the one containing xanthan.
The textural comparisons of gluten-free and wheat-based doughs, batters and breads
containing xanthan gum (1.25%) or xanthan (0.9%) plus konjac gum (1.5%) have been
performed (Moore et al., 2004; Anton & Artfield, 2008). Regardless of the addition of
hydrocolloids, all gluten-free breads were brittle after two days of storage, detectable by the
occurrence of fracture, and the decrease in springiness, cohesiveness and resilience derived from
texture profile analysis.
Schober et al. (2005) did a study that tested the quality differences among sorghum
hybrids in the quality parameters of gluten-free breads made from this cereal. Using xanthan
gum (0.3-1.2%) and response surface methodology, they observed that increasing hydrocolloid
levels would cause a decrease in the loaf specific volumes. Consequently, they attested that
xanthan gum had negative effects on crumb structure of sorghum breads and that, with the
addition of corn starches, their textural aspects could possibly be better improved. The
microstructure analysis of gluten-free breads regarding the staling process and its correlation
with sensory and mechanical properties showed beneficial effects of hydrocolloids (Ahlborn et
al., 2005; Anton & Artfield, 2008). This study demonstrated that the formulation containing
rice, egg and milk proteins, xanthan gum, and HPMC created a continuous matrix with starch
fragments. Hence, the addition of these hydrocolloids resulted in a structure similar to gluten.

44
Moreover, the gluten-free rice bread had the highest sensory scores for both moistness and
freshness, which was probably due to the xanthan and HPMC water-retention properties.
Dairy Ingredients in Baking
Dairy products such as dairy proteins (whey, casein) and non-fat dry milk powder have
been popularly used as ingredients in the dairy industry (Stahel, 1983; Zadow & Hardham,
1981). Dairy proteins are highly functional ingredients and due to their versatility can be readily
incorporated into many food products (Gallagher et al., 2004). These proteins are used in bakery
products for their nutritional properties, functional benefits including flavor and texture
enhancement, and better handling and storage improvements (Cocup & Sanderson, 1987; Arendt
et al., 2001; Mannie & Asp, 1999). When used in gluten-free product formulas dairy proteins
increase water absorption and, therefore, enhance the handling properties of the dough
(Gallagher et al., 2004). However, supplementation of gluten-free breads with the high lactose-
content dairy powders is not suitable for celiac disease people who have significant damage to
their intestinal villi as they may be intolerant of lactose due to the absence of the lactase enzyme
which is generated by the villi (Ortolani & Pastorello, 1997). When incorporated into gluten-free
breads, dairy powders with high protein/low lactose content (sodium caseinate, milk protein
isolate) give breads with an improved overall shape and volume, and a firmer crumb texture
(Gallagher et al., 2003). The added dairy proteins give appealing dark crust and white crumb
appearance to the breads, and receive good acceptability scores in sensory tests (Gallagher et al.,
2003). Supplementing the gluten free formulation with high protein-content dairy powders
increases protein content of these breads (Gallagher et al., 2003). When incorporated in other
products (e.g. sausages) dairy proteins form gels upon heating and cooling and increase the
firmness of the products (Pearson & Gillett, 1996).
45
Whey protein. Whey is the liquid that originates from coagulation of milk and is
generated from cheese making (Onwulata & Huth, 2008). There are different types of whey: (1)
sweet whey, with a pH of at least 5.6, originates from rennet coagulated cheese production such
as cheddar. (2) Acid whey, with a pH not higher than 5.1, comes from acid-coagulated cheeses
manufacture such as cottage cheese (Tunick, 2008). About 9 liters of whey is generated for
every kilogram of cheese manufactured and a large cheese-making plant can generate over a
million liters of whey daily (Jelen, 2003).
Whey protein is commercialized as liquid or powder, where whey powder is the most
common in the market. The powered whey is generated from either drum drying, concentration,
or isolation with the latter two forms being termed as whey protein concentrate and whey protein
isolate, respectively. The mode of protein concentration and isolation is through ultra-filtration,
electrodialysis, microfiltration, nanofiltration or reverse osmosis followed by spray drying
(Onwulata & Huth, 2008).
Whey protein is used in many food applications because of its functionality and nutritive
value. Whey protein creates and stabilizes air bubbles in a liquid and has good foaming capacity
(Renner & Abdi El-Salam, 1991). Ice creams, soufflés, frothed drinks, and other food foams and
emulsions are stabilized by surface active agents for which whey protein products are frequently
selected (Foegeding et al., 2002). Acid whey powder improves the crust color and enhances
flavor in bread, biscuits, crackers, and snack foods by providing a golden surface on baking
(Kosikowski, 1979). Upon heating, whey protein unfolds and aggregate and are capable of
binding large amounts of water depending on the pH, ionic strength, and thermal conditions
(Hudson et al., 2000).

46
Whey acts as a tenderizer in those foods where a soft or tender structure is desired
(Gillies, 1974). The tenderizing properties are generally noticeable in the cake-like texture of
baked goods, mild brittleness of cookies and the delicate gel structure of starch pudding mixes
(Gillies, 1974).
Addition of 4% whey protein concentrate increases extensibility; milk proteins cause
increase in protein network while untreated whey protein concentrate appears to interfere with
the gluten network when compared to the control (Kenny et al., 2001).
Non Fat Dry Milk Powder
Nonfat dry milk (NFDM) and other dairy ingredients are widely used in the preparation
of bakery products. They are used to improve nutritional, organoleptic, and some functional
properties of the baked product (Eedogdu-Arnoczky et al., 1996). Use of NFDM increase water
absorption, reduce staling rate, and increase crust color in bread baking (Dubois & Dreese,
1984).
The complexity of the bread making system, including several stages of processing and
interaction among the components, makes it difficult to predict the performance of a particular
dairy product based on its behavior in a model system. The performance of a NFDM may vary
with flour composition and strength, presence of additives, bread making system and tested
parameter (Eedogdu-Arnoczky et al., 1996). In the NFDM studies conducted towards this
dissertation, the effects of other proteins from the flours were assumed to be minimal, and that
only NFDM had main effects on dough texture.
Rheological Properties of Doughs
Rheology is the study of the manner in which materials respond to strain or stress, the
science of deformation and flow of matter (Mirsaeedghazi et al., 2008).

47
During the product development and process development of industrial manufacturing of
food products, it is critical to understand the rheological characteristics of food materials,
including the product of interest in this work, gluten-free pizza crust dough. Rheological studies
are among the most convenient methods for measuring process performance and shelf indicators
of quality of food products, including cereal doughs. Rheological characterization can describe
how the doughs would respond (flow, rupture, deform) during processing (sheeting, pressing)
when stress is applied. Characterization can therefore be used as a tool in the selection and
specification of raw materials/ingredients and processing conditions.
Knowledge of fundamental rheological properties of any dough could indicate how the
dough is going behave under various processing conditions. This knowledge is import in terms
of product formulation and optimization, quality control, machining properties of the dough,
scale-up of the process and automation (Bushuk, 1985; Hamann & Macdonald, 1992). Shear
behavior can be a predictor of baking performance (Dobraszczyk et al., 2001). This is because
bread dough undergoes rigorous stress during mixing and expansion of gases during proofing
and baking. The final bread volume and crumb texture is directly correlated with dough
handling ability (Dobraszczyk et al., 2001).
Dough Elongation Method
The method used in this dissertation involved an Intsron (model 3342, Instron EXTRA,
Norwood, MA) machine mounted with probes that hold the dough and stretch it with a constant
speed. Since dough properties change rapidly after sheeting, studying the effect of sheeting on
dough properties requires rapid measurement.
Gujral and Pathak (2002) used the Instron Universal Testing Machine to determine the
tensile properties of chapaties prepared from composite flours (wheat and black gram). Also,

48
Stiffness, breaking strength and deformation of rectangular strips of chapaties were measured by
a tensile test performed using an Instron by Waniska (1990). In another study, Rizley and Suter
(1977) used tensile test to evaluate textural properties of tortillas made from different varieties of
sorghum.
In this study, dough elongation measurements are used to determine the dough resistance
to deformation, breaking strength and stiffness in various processing conditions; handling
(sheeting). This because in baking the final product texture is directly correlated with dough
handling ability (Dobraszczyk et al., 2001).
Dough Puncture Test
Puncture test measures the force that is required to push a probe into food. The puncture
test apparatus were attached to the Instron machine where the probe penetrated the food to
constant depth causing irreversible crushing. Simultaneously, the maximum force exerted to the
food was measured.
Lorenzo et al. (2008) conducted a study to determine the behavior of empanadas to
rupture using the puncture test. Also, puncture test has been used to determine rheological
behavior of papad dough for the purpose of sheeting and rolling (Bhattacharya & Narasimha,
2007). It’s the same basis that we used puncture test in this dissertation to study resistance of
gluten-free pizza dough to puncture force.
Texture Profile Analysis
The rheological properties of dough in relation to its texture measurements could help
understand the behavior of dough during processing. TPA has been used for the textural
evaluation of a wide range of foods. It was originally developed for the General Foods
Texturometer (Szczesniak, 1963; Szczesniak et al., 1963). Bourne (1968, 1974 and 1978) has

49
demonstrated a method to evaluate texture profile parameters from the force-deformation curves
obtained by the Instron - Universal Testing Machine (UTM). The food sample is compressed
twice, successively, between two parallel plates and the force-time curves are plotted. Some of
the textural parameters derived from these curves are defined (Bourne, 1968a) as: (1) Hardness -
the peak force during the first compression cycle. (2) Cohesiveness - the ratio of the positive
force area during the second compression to that during the first compression. (3) Adhesiveness
- the negative force area for the first compression, representing the work necessary to pull the
compressing plunger away from the sample. (4) Springiness or elasticity - the height that the
food recovers during the time that elapses between the end of the first compression and the start
of the second compression. (5) Gumminess - the product of hardness and cohesiveness. (6)
Chewiness - the product of gumminess and springiness.
Stickiness of a food product depends on both the cohesive forces in the food and the
adhesive forces between the food and with whatever it comes into contact (Sherman, 1969). By
pulling two parallel plates apart at a constant rate, a measure of stickiness could be obtained
(Kumar et al., 1976).
50
Chapter III: Methodology
Ingredients and Additives
Gluten-free pizza dough formulations were made with cassava starch/Tapioca flour
(Bob’s Red Mill, Milwaukie, Oregon), sorghum flour (Bob’s Red Mill, Milwaukie, Oregon) and
chickpea/garbanzo bean flour (Bob’s Red Mill, Milwaukie, Oregon), sugar (Great Value,
Bentonville, Arkansas), salt (Great Value, Bentonville, Arkansas), instant dry yeast-quick rise
(Red Star, Milwaukee, Wisconsin), apple cider vinegar (Heinz, Pittsburg, Pennsylvania) and
sunflower oil (Flora, Burnaby, BA, Canada) . The variable hydrocolloid added to the gluten-free
dough was xanthan gum obtained from Bob’s Red Mill (Milwaukie, Oregon). Other additives to
the formulation were dairy ingredients: unflavored whey protein (Natural factors, Everett,
Washington) and nonfat milk powder (Great Value, Bentonville, Arkansas). The control whole
wheat flour was obtained from great valley organic milling (Fountain City, Wisconsin).
Dough Making Process
Solid ingredients: cassava starch, sorghum flour, and chickpea flour (ratio of 2:1:1) or
wheat flour, salt, sugar and additives (added gum or dairy ingredients), formulations on Table 5
and 6, were mixed in a Hobart mixer at speed #2 for four minutes. Vinegar, sunflower oil and
water (43.5% and 41.6% total solids for gluten free dough and wheat dough respectively) were
added and mixed in a Hobart mixer at speed #2 for five more minutes. The dough was then
rolled over a platform to give sheets of desired thickness for textural analysis.
Gluten-Free Pizza Dough Formulations
Xanthan gum addition. All gluten-free pizza dough formulations contained cassava
starch, sorghum, chickpea flour, salt, sugar, sunflower oil, vinegar, and water (Table 5).

51
Table 5
Gluten-Free Pizza Dough and Controls Formulations With Their Symbols
Ingredient C1
(%)
C2
(%)
E1
(%)
E2
(%)
E3
(%)
E4
(%)
Salt 0.8 0.8 0.8 0.8 0.8 0.8
Sugar 2.7 2.7 2.7 2.7 2.7 2.7
Xanthan 1% 0 0 1 0 0 0
2% 0 0 0 2 0 0
3% 0 0 0 0 3 0
5% 0 0 0 0 0 5
Wheat Flour 0 86 0 0 0 0
Yeast 2 2 2 2 2 2
Cider vinegar 4 4 4 4 4 4
Sunflower oil 4.5 4.5 4.5 4.5 4.5 4.5
Tapioca 43.6 0 43 42.4 41.8 40.6
Sorghum 21.2 0 21 20.8 20.6 20.2
Chickpea 21.2 0 21 20.8 20.6 20.2
Total 100 100 100 100 100 100
There were two controls composed of (by total weight excluding water): (i) cassava
starch (43.6%), sorghum flour (21.2), chickpea flour (21.2), yeast (2%), sugar (2.7%), salt
(0.8%), vinegar (4%) and sunflower oil (4.5%) in 300g batches. (ii) Wheat flour (86%), yeast
(2%), sugar (2.7%), salt (0.8%), vinegar (4%) and sunflower oil (4.5%) in 300g batches. Xanthan

52
gum was added to the gluten-free dough at 1%, 2%, 3%, and 5% by total weight excluding
water. The percent water added depended on the formulations, 43.5% and 41.6% (total
ingredients weight) for gluten-free and wheat doughs respectively (Table 5).
Dairy ingredients (Whey, NFDM) addition. All gluten-free pizza dough formulations
contained xanthan gum, cassava starch, sorghum, chickpea flour, salt, sugar, sunflower oil,
vinegar, and water (table 6).
Table 6
A Summary of 2% Xanthan Gum Gluten Formulations With Their Control
Ingredient C3
(%)
W1
(%)
W2
(%)
W3
(%)
NFDM1
(%)
NFDM2
(%)
NFDM
(3%)
Whey 0 1 2 3 0 0 0
Nonfat milk powder 0 0 0 0 5 10 15
Salt 0.8 0.8 0.8 0.8 0.8 0.8 0.8
Sugar 2.7 2.7 2.7 2.7 2.7 2.7 2.7
Xanthan gum 2 2 2 2 2 2 2
Yeast 2 2 2 2 2 2 2
Cider vinegar 4 4 4 4 4 4 4
Sunflower oil 4.5 4.5 4.5 4.5 4.5 4.5 4.5
Tapioca 42.4 41.8 41.2 40.6 39.8 37.2 34.6
Sorghum 20.8 20.6 20.4 20.2 19.6 18.4 17.2
Chickpea 20.8 20.6 20.4 20.2 19.6 18.4 17.2
Total 100 100 100 100 100 100 100
There was one control formulation composed of (by total weight excluding water):
Xanthan gum (2%), cassava starch (42.4%), sorghum flour (20.8), chickpea flour (20.8), yeast

53
(2%), sugar (2.7%), salt (0.8%), vinegar (4%) and sunflower oil (4.5%) in 300g batches. Dairy
ingredients were added (total weight excluding water): Whey protein at 1%, 2% and 3%, and
nonfat milk powder at 5%, 10% and 15% (Table 6). The water added (43.5%) was based on
total ingredients.
Texture Analyses
Dough strength (elongation, puncture), and texture profile analysis (TPA) characteristics
of the treatment samples were studied using an Instron texture analyzer (model 3342, Instron
EXTRA, Norwood, Massachusetts) with a load cell of 500N interfaced with Bluehill 2 software
(Illinois Tool Works Inc., Glenview, Illinois).
Treatments were at least triplicated with five repeated measures from each triplicate
taken. Mean values of breaking force and extension at maximum load were used to conduct
statistical analysis to determine dough strength differences between treatments. Mean values of
TPA parameter were statistically analyzed to determine textural differences between treatments.
Elongation test. Elongation tests were performed on dog bone shaped dough specimens
(42mm long, 22.5mm wide and 4.1mm thick) using a tension grip system. Crosshead speed was
set at 0.5mm/s, and maximum breaking force (N) and deformation at break (extension at the
moment of rupture, mm) were obtained.
Puncture tests. A 3 mm diameter cylindrical probe moving at a constant rate of
0.05mm/s was used to determine maximum breaking force (mN). Tests were performed on
cylindrical samples (52mm diameter and 4.1mm thickness) from each dough treatment.
TPA. The treatments were evaluated for their TPA properties with the Instron machine.
TPA assessment parameters included adhesiveness, cohesiveness, hardness, springiness,
chewiness, and gumminess measured using the method of Bourne (1978). A brief explanation

54
of each of the terms and the metrics used to perform statistical analysis is highlighted below: (1)
Hardness - the peak force during the first compression cycle. (2) Cohesiveness - the ratio of the
positive force area during the second compression to that during the first compression. (3)
Adhesiveness - the negative force area for the first compression, representing the work necessary
to pull the compressing plunger away from the sample. (4) Springiness or elasticity - the height
that the food recovers during the time that elapses between the end of the first compression and
the start of the second compression. (5) Gumminess - the product of hardness and cohesiveness.
(6) Chewiness - the product of gumminess and springiness.
Treatment samples were cut with a cylindrical die to a uniform size of 25mm width and
9.7mm height. A round disk probe (30mm diameter) was used to exert force on each dough
sample. The dough samples were tested in TPA mode consisting of two cycles with a recovery
time of 10 seconds. The probe speed was 100mm/minute and the distance of the probe
compression was 85% of the sample height (9.7 mm).
Statistical Analysis
Differences between treatments (elongation, puncture, TPA) for the Gum, WP, and
NFDM experiments were analyzed by Analysis of variance (ANOVA) using the force (mN)
measurements at point of rupture, TPA characteristics and length measurements (mm).
Significant differences among treatment means were analyzed using Tukey's HSD at 95% level
of significance. All statistical procedures (analysis of variance and Tukey's HSD) were
computed using the SPSS 17.0 software (SPSS Inc., Chicago, Illinois).

55
Chapter IV: Results
Gluten-Free Pizza Dough Formulations
Xanthan gum addition.
Elongation. Results demonstrated that the addition of xanthan gum had a significant
effect (p < 0.05) on the mean elongation force (at maximum load), maximum extension length,
and stress at yield point (at break) (Table 7, Figure 9, 10, and 11 respectively).
Figure 9. Effect of xanthan gum (0-5%) on the elongation force at maximum load (mN) applied
on Gluten-Free dough compared to wheat flour dough

56
Figure 10. Effect of xanthan gum (0-5%) on the extension at maximum load (mm) of stretched
Gluten-Free dough compared to wheat flour dough
Treatment means separation using Tukey’s Honest Significant Difference (HSD)
demonstrated that increasing levels of xanthan gum in the dough had a significant effect on
increasing elongation force, extension length, and stress at yield point (Table 7, Figure 9, Figure
10, and 11). There was no significant difference in elongation force (at break point) of GF
dough (0% xanthan control) and whole wheat flour dough (Table 7). When compared with
wheat dough, the increase in extension length between xanthan gum treatments was not large
enough to be separated by the Tukey’s HSD.

57
Figure 11. Effect of xanthan gum (0-5%) on the stress at yield point (mPa) applied on Gluten-
Free dough compared to wheat flour dough

58
Table 7
Mean Elongation Parameter Values of Pizza Dough Treatments With Increasing Levels of
Xanthan Gum Concentrations (0 - 5%; wheat flour control). Different Superscripts From the
Same Parameter are Statistically Significant as Measured Using Tukey’s HSD
Elongation Parameters Treatments Mean SD
Force at max. load (mN) Wheat Flour (Control 1) 697.47 a 20.53
0% Xanthan gum (control 2) 548.21 a 18.48
1% Xanthan gum 766.54 a 79.63
2% Xanthan gum 1566.43b 40.39
3% Xanthan gum 2220.65 c 190.91
5% Xanthan gum 2671.79 d 81.33
Extension at max. load
(mm)
Wheat Flour (Control 1) 65e 8.98
0% Xanthan gum (control 2) 1.92a 0.30
1% Xanthan gum 4.68b 0.56
2% Xanthan gum 9.61c 1.19
3% Xanthan gum 11.92d 1.12
5% Xanthan gum 10.27cd 0.58
Stress at yield point (mPa) Wheat Flour (Control 1) * *
0% Xanthan gum (control 2) 0.01a 0.00
1% Xanthan gum 0.01b 0.00
2% Xanthan gum 0.02c 0.00
3% Xanthan gum 0.02d 0.00
5% Xanthan gum 0.03e 0.00
* Yield point was not reached, N=18, n=3, P < 0.05

59
Puncture. Results demonstrated that addition of xanthan gum had a significant effect (p<
0.05) on the mean compression force (maximum load) and stress at yield point (at break) for the
treatments tested (Table 8, Figure 12 and 13).
Figure 12. Effect of xanthan gum (0-5%) on the puncture force at maximum load (mN) exerted
on Gluten-Free dough compared to wheat flour dough

60
Figure 13. Effect of xanthan gum (0-5%) on the stress at yield point (mPa) exerted on Gluten-
Free dough compared to wheat flour dough
Tukey’s HSD showed that increasing levels of xanthan gum in the dough had a
significant effect on increasing the compression force and stress at yield point (Table 8, Figure
12 and 13). There was no significant difference between wheat flour dough and 1% xanthan
gum dough for both puncture force and stress at yield point. Also, addition of xanthan gum at
1% and 2% did not show any significant difference on stress at yield point during puncture
(Table 8).

61
Table 8
Mean Puncture Parameter Values of Pizza Dough Treatments With Increasing Levels of Xanthan
Gum Concentrations (0 - 5%; wheat flour control). Different Superscripts From the Same
Parameter are Statistically Significant as Measured Using Tukey’s HSD.
Puncture Parameters Treatments Mean SD
Force at maximum load
(mN)
Wheat Flour (Control 1) 412.62b 43.25
0% Xanthan gum (control 2) 216.29a 28.47
1% Xanthan gum 401.01b 29.83
2% Xanthan gum 541.61c 32.33
3% Xanthan gum 901.18d 24.49
5% Xanthan gum 2303.21e 172.09
Stress at yield point (mPa) Wheat Flour (Control 1) * *
0% Xanthan gum (control 2) 0.0001a 0.00
1% Xanthan gum 0.0002b 0.00
2% Xanthan gum 0.0003b 0.00
3% Xanthan gum 0.0004c 0.00
5% Xanthan gum 0.0011d 0.00
*Yield point not reached, N=30, n=5, P < 0
TPA. Results demonstrated xanthan gum addition had a significant effect (p< 0.05) on
the mean TPA parameters (adhesives, cohesiveness, hardness, springiness, chewiness and
gumminess) for the tested treatments (Table 9a&b, Figure 14, 15, 16, 17, 18 and 19).

62
Table 9
Mean TPA Parameter Values of Pizza Dough Treatments With Increasing Levels of Xanthan
Gum Concentrations (0 - 5%; wheat flour control). Different Superscripts From the Same
Parameter are Statistically Significant as Measured Using Tukey’s HSD
TPA Parameters Treatments Mean SD
Adhesiveness (mJ) Wheat Flour (Control 1) 2.35b 1.09
0% Xanthan gum (Control 2) 0.17a 0.03
1% Xanthan gum 0.91a 0.03
2% Xanthan gum 1.21a 0.52
3% Xanthan gum 0.02a 0.01
5% Xanthan gum 0.22a 0.20
Cohesiveness Wheat Flour (Control 1) 0.29e 0.02
0% Xanthan (Control 2) 0.08b 0.00
1% Xanthan gum 0.05a 0.00
2% Xanthan gum 0.14c 0.01
3% Xanthan gum 0.14c 0.02
5% Xanthan gum 0.18d 0.01
Hardness (N) Wheat Flour (Control 1) 61.48a 2.85
0% Xanthan gum (Control 2) 69.15a 1.12
1% Xanthan gum 123.11b 3.33
2% Xanthan gum 136.03b 11.19
3% Xanthan gum 193.90c 11.65
5% Xanthan gum 301.58d 9.57
N=18, n=3, P < 0.05

63
Tukey’s HSD for the TPA measurements showed that increasing levels of xanthan gum
had the following effects on the GF dough:
Adhesiveness. GF dough (0% xanthan) and wheat dough had significantly different
adhesiveness (Table 9). There was no significant difference in adhesiveness (mJ) in GF with
increasing levels of xanthan gum (Table 9 and Figure 14).
Figure 14. Effect of xanthan gum addition (0-5%) on adhesiveness (mJ) of GF dough compared
to wheat flour dough

64
Cohesiveness. GF dough with increasing levels of xanthan gum showed significantly
increasing cohesiveness values. There was no significant difference in cohesiveness of GF
dough with 2 and 3% added xanthan gum (Table 9 and Figure 15).
Figure 15. Effect of xanthan gum addition (0-5%) on cohesiveness of GF dough compared to
wheat flour dough
Hardness. GF dough with increasing levels of xanthan gum showed significantly
increasing hardness values. However, increasing xanthan gum levels between 1% and 2% had

65
no significant difference in the GF dough. Also, wheat flour dough and 0% xanthan gum dough
had no significant difference (Table 9 and Figure 16).
Figure 16. Effect of xanthan gum addition (0-5%) on hardness (N) of GF dough compared to
wheat flour dough
Springiness. GF dough with increasing levels of xanthan gum showed significantly
increasing springiness values. However, adding 1%, 2% and 3% xanthan gum to the GF doughs
did not show any significantly difference (Table 10 and Figure 17).

66
Figure 17. Effect of xanthan gum addition (0-5%) on springiness (mm) of GF dough compared
to wheat flour dough
Chewiness. Addition of xanthan gum to the GF dough significantly increased chewiness.
However, addition of 0%, 1% and 2% xanthan gum to the GF doughs did not show significantly
difference in chewiness. Also, there was no significant difference between wheat dough, 2%,
and 3% xanthan gum GF doughs (Table 10 and Figure 18).

67
Figure 18. Effect of xanthan gum addition (0-5%) on chewiness (mJ) of GF dough compared to
wheat flour dough

68
Table 10
Mean TPA Parameter Values of Pizza Dough Treatments With Increasing Levels of Xanthan
Gum Concentrations (0 - 5%; wheat flour control) Continued. Different Superscripts From the
Same Parameter are Statistically Significant as Measured Using Tukey’s HSD
TPA parameters Treatments Mean S.D
Springiness (mm) Wheat Flour (Control 1) 1.30c 0.20
0% Xanthan gum (Control 2) 0.37a 0.06
1% Xanthan gum 0.80b 0.10
2% Xanthan gum 0.80b 0.10
3% Xanthan gum 0.73b 0.06
5% Xanthan gum 1.89c 0.10
Chewiness (mJ) Wheat Flour (Control 1) 23.07b 4.21
0% Xanthan gum (Control 2) 2.03a 0.30
1% Xanthan gum 5.14a 0.56
2% xanthan gum 15.12ab 3.10
3% Xanthan gum 20.51b 4.90
5% Xanthan gum 105.38c 11.55
Gumminess (N) Wheat Flour (Control 1) 17.70b 0.90
0% Xanthan gum (Control 2) 5.54a 0.24
1% Xanthan gum 6.44a 0.11
2% Xanthan gum 18.86b 2.40
3% Xanthan gum 27.75c 4.42
5% Xanthan gum 55.66d 3.61
N=18, n=3, P < 0.05

69
Gumminess. Addition of xanthan gum significantly increased gumminess of the GF
dough. The authors observed no significant difference between 0% and 1% xanthan gum GF
doughs, and between wheat dough and 2% xanthan gum GF dough (Table 10 and Figure 19).
Figure 19. Effect of xanthan gum addition (0-5%) on gumminess (N) of GF dough compared to
wheat four dough

70
Dairy Ingredients
Whey addition.
Elongation. Results demonstrated that increasing whey protein had significant effect
(p< 0.05) on the mean elongation force (at maximum load), maximum extension length, and
stress at yield point (at break) for the treatments tested (Table 11, Figure 20, 21 and 22).
Figure 20. Effect of whey protein (1-3%) on the elongation force at maximum load (mN)
applied on Gluten-Free dough containing 2% xanthan gum

71
Figure 21. Effect of whey protein (1-3%) on the extension at maximum load (mm) of stretched
Gluten-Free dough containing 2% xanthan gum

72
Figure 22. Effect of whey protein (1-3%) on the stress at yield point (mPa) applied on Gluten-
Free dough containing 2% xanthan gum

73
Table 11
Mean Elongation Parameter Values of Pizza Dough Treatments With Increasing Levels of Whey
Protein Concentrations (1 - 3%; 2% xanthan gum control). Different Superscripts From the
Same Parameter are Statistically Significant as Measured Using Tukey’s HSD
Elongation Parameters Treatments Mean S.D
Force at max. load (mN) 2% Xanthan gum (Control) 1566.43c 40.39
1% Whey 1169.66b 45.36
2% Whey 1146.53b 16.00
3% Whey 778.66a 57.37
Extension at max. load (mm) 2% Xanthan gum (Control) 9.61a 1.19
1% Whey 14.64b 0.24
2% Whey 15.39b 0.33
3% Whey 19.06c 1.37
Stress at yield point (mPa) 2% Xanthan gum (Control) 0.02c 0.00
1% Whey 0.01b 0.00
2% Whey 0.01b 0.00
3% Whey 0.01a 0.00
N=12, n=3, P < 0.05
Tukey’s HSD demonstrated that increasing of whey proteins led to subsequent reduction
in elongation force and stress at yield point of the GF dough. On the other hand, increasing
whey protein resulted in increase of extension length of the GF dough (Table 11, Figure 20,
Figure 21 and Figure 22). Samples with 1% and 2% whey protein had no significant difference

74
in terms of elongation force required to stretch the GF dough to break point, extension at
maximum load and stress at yield point (Table 11).
Puncture. Results demonstrated that increasing whey protein had a significant effect (p
< 0.05) on the mean compression force (maximum load) and stress at yield point (at break) for
the treatments tested (Table 12, Figure 23 and 24).
Figure 23. Effect of whey protein (1-3%) on the puncture force at maximum load (mN) exerted
on Gluten-Free dough containing 2% xanthan gum

75
Figure 24. Effect of whey protein (1-3%) on the stress at yield point (mPa) applied on Gluten-
Free dough containing 2% xanthan gum
Tukey’s HSD indicated that addition of whey protein in the dough had a significant effect
on reducing the compression force and stress at yield point of the GF dough (Table 12, Figure 23
and Figure 24). However, beyond a threshold of 2% whey protein addition compression force
started to increase. The force required to puncture dough with whey protein added at 2% was not
statistically different from that of 2% xanthan gum (control). Also, there was no statistically
significant difference in stress at yield point between dough added with 0% (control), 2% and
that with 3% whey (Table 12).

76
Table 12
Mean Puncture Parameter Values of Pizza Dough Treatments With Increasing Levels of Whey
Protein Concentrations (1 - 3%; 2% xanthan gum control). Different Superscripts From the
Same Parameter are Statistically Significant as Measured Using Tukey’s HSD
Puncture Parameters Treatments Mean S.D
Force at maximum load (mN) 2% Xanthan (Control) 541.61b 32.33
1% Whey 455.97a 11.91
2 %whey 538.97b 28.24
3% Whey 686.66c 21.62
Stress at yield point (mPa) 2% Xanthan (Control) 0.0003b 0.00
1% Whey 0.0002a 0.00
2 %whey 0.0003b 0.00
3% Whey 0.0003b 0.00
N=20, n=5, P < 0. 05
TPA. Results demonstrated that addition of whey protein had a significant effect (p <
0.05) on the mean TPA parameters (adhesives, cohesiveness, hardness and gumminess) for the
tested treatments. However, springiness and chewiness were not statistically significant (Table
13, Figure 25, Figure 26, Figure 27 and Figure 28).
Tukey’s HSD for the TPA measurements showed that increasing levels of whey protein
had the following effects on the GF dough:

77
Table 13
Mean TPA Parameter Values of Pizza Dough Treatments With Increasing Levels of Whey
Protein Concentrations (1 - 3%; 2% xanthan gum control). Different Superscripts From the
Same Parameter are Statistically Significant as Measured Using Tukey’s HSD
TPA Parameters Treatments Mean S.D
Adhesiveness (mJ) 2% Xanthan gum (control) 1.21a 0.52
1% Whey 1.59a 0.20
2% Whey 1.10a 0.23
3% Whey 8.56b 1.23
Cohesiveness 2% Xanthan gum (control) 0.14ab 0.01
1% Whey 0.13ab 0.015
2% Whey 0.11a 0.00
3% Whey 0.15b 0.02
Hardness (N) 2% Xanthan gum (control) 136.03b 11.19
1% Whey 105.27a 3.31
2% Whey 135.19b 5.53
3% Whey 144.86b 12.64
Gumminess (N) 2% Xanthan gum (control) 18.86b 2.40
1% Whey 14.13a 2.10
2% Whey 15.07a 0.43
3% Whey 22.51b 0.82
N=12, n=3, P < 0. 05

78
Adhesiveness.
Figure 25. Effect of whey protein (1-3%) on adhesiveness (mJ) of GF dough containing 2%
xanthan gum
Addition of whey proteins significantly increased adhesiveness of the dough. There was
no significant difference between GF doughs with 2% xanthan gum (control), 1% and 2% whey
proteins (Table 13 and Figure 25).
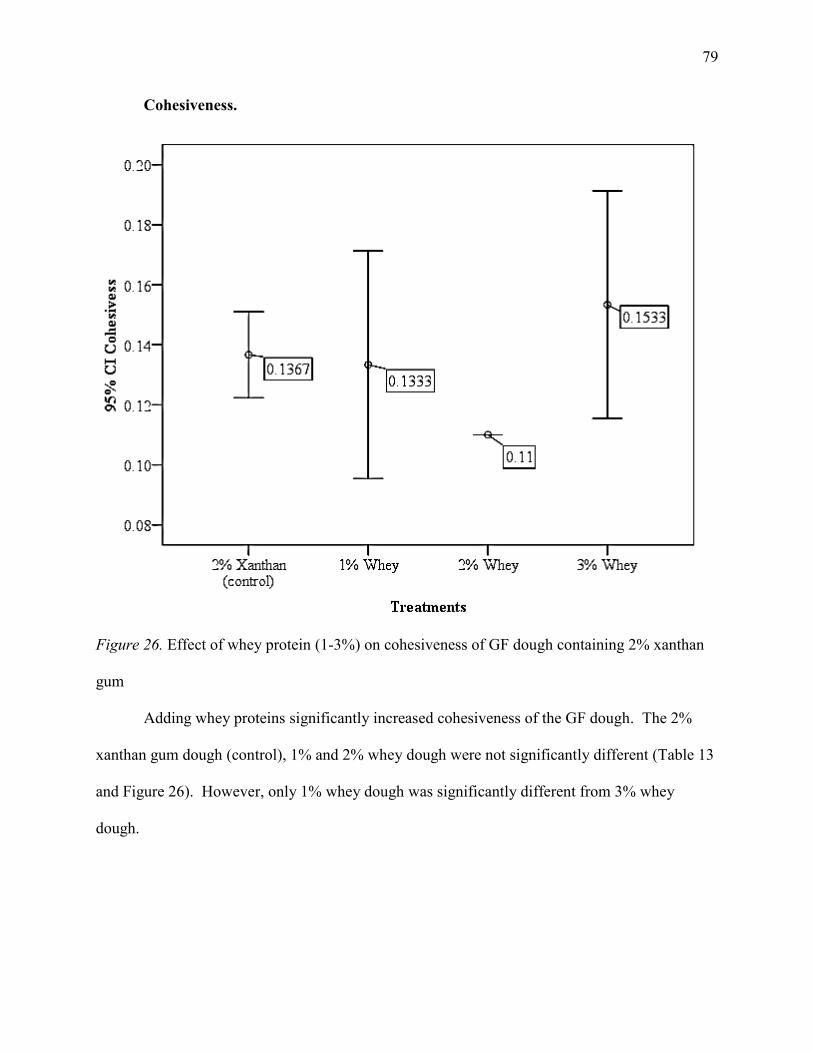
79
Cohesiveness.
Figure 26. Effect of whey protein (1-3%) on cohesiveness of GF dough containing 2% xanthan
gum
Adding whey proteins significantly increased cohesiveness of the GF dough. The 2%
xanthan gum dough (control), 1% and 2% whey dough were not significantly different (Table 13
and Figure 26). However, only 1% whey dough was significantly different from 3% whey
dough.

80
Hardness.
Figure 27. Effect of whey protein (1-3%) on hardness (N) of GF dough containing 2% xanthan
gum
Addition of whey protein significantly reduced hardness of the GF dough. There was no
significant difference between 2% xanthan gum (control), 2% and 3% added whey dough (Table
13 and Figure 27).

81
Gumminess.
Figure 28. Effect of whey protein (1-3%) on gumminess (N) of GF dough containing 2%
xanthan gum
Addition of whey protein significantly increased gumminess of the GF dough. However,
addition of 1% whey protein had no significant difference from the 2% whey protein. Also,
increasing whey protein to 3% had no significant difference from 2% xanthan gum (control)
(Table 13 and Figure 28).

82
NFDM addition.
Elongation. Addition of NFDM had a significant effect (p < 0.05) on the mean
elongation force (at maximum load), maximum extension length, and stress at yield point (at
break) for the treatments tested (Table 14 Figure 29, 30, and 31).
Figure 29. Effect of NFDM (5-15%) on the elongation force at maximum load (mN) applied on
Gluten-Free dough containing 2% xanthan gum

83
Figure 30. Effect of NFDM (5-15%) on the extension at maximum load (mm) of stretched
Gluten-Free dough containing 2% xanthan gum

84
Figure 31. Effect of NFDM (5-15%) on the stress at yield point (mPa) applied on Gluten-Free
dough containing 2% xanthan gum

85
Table 14
Mean Elongation Parameter Values of Pizza Dough Treatments With Increasing Levels of
NFDM Concentrations (5 - 15%; 2% Xanthan Gum Control). Different Superscripts From the
Same Parameter are Statistically Significant as Measured Using Tukey’s HSD
Elongation Parameters Treatments Mean SD
Force at max. load (mN) 2% Xanthan (Control) 1566.43c 40.39
5% NFDM 1144.12b 161.25
10% NFDM 499.99a 12.31
15% NFDM 409.20a 8.08
Extension at max. load (mm) 2% Xanthan (Control) 9.61a 1.19
5% NFDM 18.76c 2.07
10% NFDM 15.06b 0.97
15% NFDM 14.45b 1.93
Stress at yield point (mPa) 2% Xanthan (Control) 0.02c 0.00
5% NFDM 0.01b 0.00
10% NFDM 0.01a 0.00
15% NFDM 0.00a 0.00
N=12, n=3, P < 0. 05
Tukey’s HSD results demonstrated that increasing levels of NFDM in the GF dough had
a significant effect in reducing the elongation force and stress at yield point, whereas, increasing
extension length of the GF dough (Table 14, Figure 29, 30 and 31). Gluten-free dough with 10%
and 15% NFDM had no significant difference on all elongation test parameters (elongation force
at maximum load, extension at maximum load and stress at yield point).

86
Puncture. Adding NFDM to the GF dough had significant effect (p < 0.05) on the mean
compression force (maximum load) and stress at yield point (at break) for the treatments tested
(Table 15, Figure 32 and 33).
Figure 32. Effect of NFDM (5-15%) on the Force at maximum (mN) exerted on Gluten-Free
dough containing 2% xanthan gum

87
Figure 33. Effect of NFDM (5-15%) on the stress at yield point (mPa) exerted on Gluten-Free
dough containing 2% xanthan gum

88
Table 15
Mean Puncture Parameter Values of Pizza Dough Treatments With Increasing Levels of NFDM
Concentration (5 - 15%; 2% Xanthan Gum Control). Different Superscripts From the Same
Parameter are Statistically Significant as Measured Using Tukey’s HSD
Puncture Parameters Treatments Mean SD
Force at max. load (mN) 2% Xanthan gum (Control) 541.81c 37.33
5% NFDM 467.42b 24.53
10% NFDM 217.19a 17.84
15% NFDM 212.75a 4.95
Stress at yield point (mPa) 2% Xanthan gum (Control) 0.00b 0.00
5% NFDM 0.00b 0.00
10% NFDM 0.00a 0.00
15% NFDM 0.00a 0.00
N=16, n=4, P < 0. 05
Tukey’s HSD indicated that increasing levels of NFDM in the dough had a significant
effect on reducing the compression force and stress at yield point (Table 15, Figure 32, and 33).
Gluten-Free dough with 10% and 15% NFDM had no significant difference in compression force
used to rupture the dough and the stress at yield point.
TPA. Addition of NFDM to the GF dough had significant effect (p< 0.05) on the mean
TPA characteristics (adhesives, cohesiveness, hardness, springiness, chewiness and gumminess)
for the tested treatments (Table 16 and Table 17, Figure 34, 35, 36, 37, 38 and 39).

89
Table 16
Mean TPA Parameter Values of Pizza Dough Treatments With Increasing Levels of NFDM
Concentrations (5 - 15%; 2% Xanthan Gum Control). Different Superscripts From the Same
Parameter are Statistically Significant as Measured Using Tukey’s HSD
TPA Parameters Treatments Mean SD
Adhesiveness (mJ) 2% Xanthan (control) 1.21a 0.52
5% DMP 22.13b 1.35
10% DMP 23.05b 6.01
15% DMP 25.42b 3.23
Cohesiveness 2% Xanthan (control) 0.14a 0.01
5% DMP 0.38b 0.01
10% DMP 0.53bc 0.13
15% DMP 0.64c 0.10
Hardness (N) 2% Xanthan (control) 136.03c 11.19
5% DMP 83.91b 0.46
10% DMP 50.73a 2.45
15% DMP 43.24a 0.65
N=12, n=3, P < 0.05
Tukey’s HSD for the TPA measurements showed that increasing levels of NFDM had the
following effects:

90
Adhesiveness.
Figure 34. Effect of NFDM (5-15%) on adhesiveness (mJ) of GF dough containing 2% xanthan
gum
Addition of NFDM to the GF dough significantly increased adhesiveness. However, GF
doughs with 5%, 10% and 15% NFDM were not statistically significant (Table 16 and Figure
34).

91
Cohesiveness.
Figure 35. Effect of NFDM (5-15%) on cohesiveness of GF dough containing 2% xanthan gum
Adding NFDM to the GF dough significantly increased cohesiveness. There was no
significant difference between 5% and 10% NFDM added dough, and between 10% and 15%
NFDM added GF dough (Table 16 and Figure 35).

92
Hardness.
Figure 36. Effect of NFDM (5-15%) on hardness (N) of GF dough containing 2% xanthan gum.
Addition of NFDM to the GF dough significantly decreased hardness. There was no
significant difference between 10% and 15% NFDM added GF dough (Table 16 and 36).

93
Springiness.
Figure 37. Effect of NFDM (5-15%) on springiness (mm) of GF dough containing 2% xanthan
gum
Addition of NFDM significantly increased springiness in the GF dough. However, 5%,
10% and 15% NFDM added dough were not significantly different (Table 17 and Figure 37).

94
Chewiness.
Figure 38. Effect of NFDM (5-15%) on chewiness (mJ) of GF dough containing 2% xanthan
gum
Addition of NFDM to the GF dough significantly increased chewiness. However,
addition of NFDM to the GF dough beyond 5% did not significantly increase work performed on
biting the GF dough (Table 17 and Figure 38).

95
Table 17
Mean TPA Parameter Values of Pizza Dough Treatments With Increasing Levels of NFDM
Concentrations (5 - 15%; 2% Xanthan Gum Control) Continued. Different Superscripts From
the Same Parameter are Statistically Significant as Measured Using Tukey’s HSD
PTA Parameters Treatments Mean S.D
Springiness (mm) 2% Xanthan gum (control) 0.80a 0.10
5% DMP 4.15b 1.26
10% DMP 4.61b 1.65
15% DMP 5.71b 0.12
Chewiness (mJ) 2% Xanthan gum (control) 15.12 a 3.10
5% DMP 130.60b 38.60
10% DMP 129.28b 65.00
15% DMP 157.27b 23.77
Gumminess (N) 2% Xanthan gum (control) 18.86a 2.40
5% DMP 31.53b 0.92
10% DMP 26.82b 5.10
15% DMP 27.48b 3.68
N=12, n=3, P < 0. 05

96
Gumminess.
Figure 39. Effect of NFDM (5-15%) on gumminess (N) of GF dough containing 2% xanthan
gum
Addition of NFDM significantly increased GF dough gumminess. There was no
significant difference between 5%, 10% and 15 NFDM added doughs (Table 17 and Figure 39).

97
Chapter V: Discussion
Effect of Xanthan Gum Addition on GF Dough Texture Characteristics
The overall quality of a pizza depends on the gluten dough, whose properties are affected
by the leavening process, flour type and preparation procedure. For a good quality pizza, the
dough has to be sheetable, to rise on proving, hold the gas produced by the yeast, as well as to
have good textural and sensory attributes (Gallagher, 2008). Otherwise, pizza crust appearance,
taste and texture are critical for consumer identification and acceptance. Other grains and
starches lack the mechanism promoting gas retention, flexibility and enhanced water retention
(Wieser & Koehler, 2008). In Tables 7, 8, 9 and 10, different levels of xanthan (0 - 5%) gum
were applied to the CSC dough to mimic the functionalities of gluten in pizza making with an
aim of producing a GF free dough that could be sheetable and extensible.
The parameters obtained were dough elongation force (mN), extension (mm), stress at
yield point (mPa), puncture force (mN), adhesiveness (mJ), cohesiveness, hardness (N),
springiness (mm), chewiness (mJ) and gumminess (N). All these factors were used to correlate
the ability of xanthan gum to replace gluten in pizza crust making.
In Table 7, elongation parameters are reported and they are used as indicators of dough
strength (force used to pull the dough strips apart at maximum load) and extensibility without
breaking (extension length at maximum load). It can be seen that increasing the level of xanthan
gum increased elongation force, extension length and stress at yield point. This was expected
since hydrocolloids especially xanthan gum has been reported to be elastic and resistant to
deformation (Lazaridou et al., 2007). In Lazaridou’s study, the elasticity and resistance to
deformation of the hydrocolloids followed the order of xanthan > CMC > pectin > agarose > oat
β – glucan. Therefore, the increase in the elongation parameters in this study could be attributed
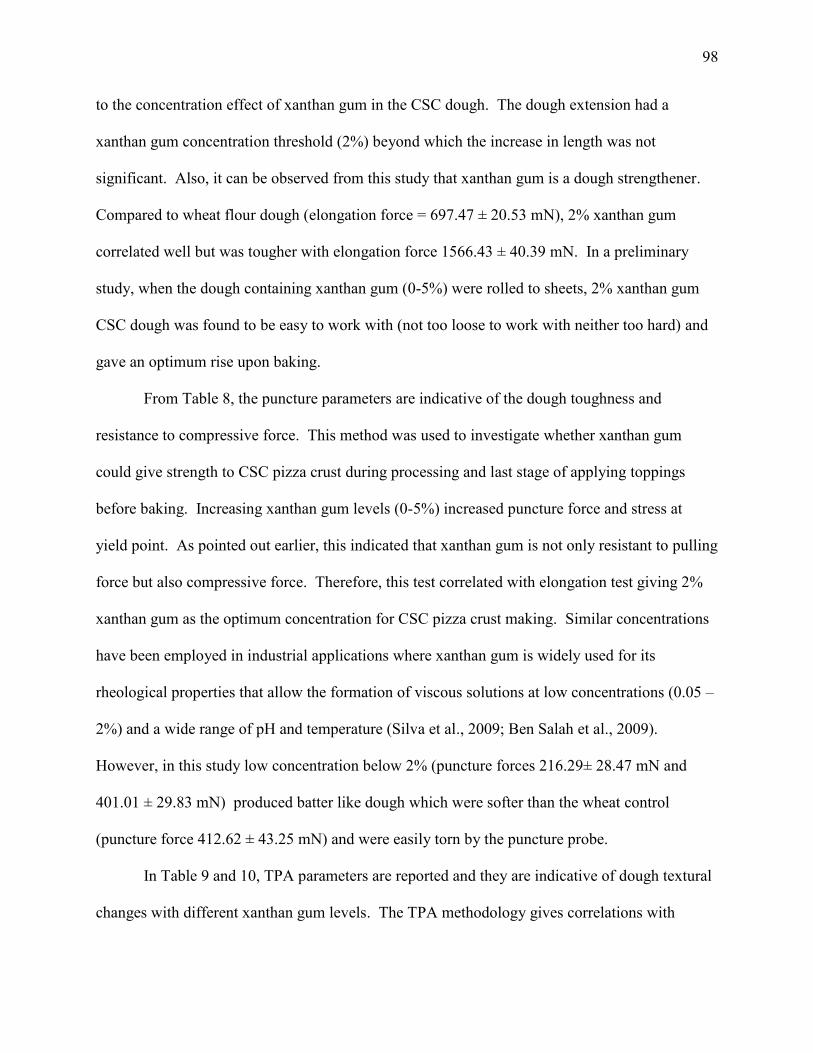
98
to the concentration effect of xanthan gum in the CSC dough. The dough extension had a
xanthan gum concentration threshold (2%) beyond which the increase in length was not
significant. Also, it can be observed from this study that xanthan gum is a dough strengthener.
Compared to wheat flour dough (elongation force = 697.47 ± 20.53 mN), 2% xanthan gum
correlated well but was tougher with elongation force 1566.43 ± 40.39 mN. In a preliminary
study, when the dough containing xanthan gum (0-5%) were rolled to sheets, 2% xanthan gum
CSC dough was found to be easy to work with (not too loose to work with neither too hard) and
gave an optimum rise upon baking.
From Table 8, the puncture parameters are indicative of the dough toughness and
resistance to compressive force. This method was used to investigate whether xanthan gum
could give strength to CSC pizza crust during processing and last stage of applying toppings
before baking. Increasing xanthan gum levels (0-5%) increased puncture force and stress at
yield point. As pointed out earlier, this indicated that xanthan gum is not only resistant to pulling
force but also compressive force. Therefore, this test correlated with elongation test giving 2%
xanthan gum as the optimum concentration for CSC pizza crust making. Similar concentrations
have been employed in industrial applications where xanthan gum is widely used for its
rheological properties that allow the formation of viscous solutions at low concentrations (0.05 –
2%) and a wide range of pH and temperature (Silva et al., 2009; Ben Salah et al., 2009).
However, in this study low concentration below 2% (puncture forces 216.29± 28.47 mN and
401.01 ± 29.83 mN) produced batter like dough which were softer than the wheat control
(puncture force 412.62 ± 43.25 mN) and were easily torn by the puncture probe.
In Table 9 and 10, TPA parameters are reported and they are indicative of dough textural
changes with different xanthan gum levels. The TPA methodology gives correlations with

99
organoleptic analysis (Bourne, 2002). In this study raw dough was used and sensory analysis
was not included. In order to better describe eating action by humans TPA as presented by Peleg
(1976) performs two bites; every bite comprise of compression and decompression cycles.
Addition of xanthan gum to the CSC dough had no effect to adhesiveness, this is important
because less adhesive dough is easy to work with during sheeting. This observation disagrees
with findings by Ghodke (2009) who reported that increasing guar gum concentration in wheat
dough increased stickiness by absorbing water necessary for gluten cross linking. Also,
Cohesiveness increased with increase in xanthan gum concentration which could be explained by
the behavior (swelling) of xanthan gum upon hydration (Kulp et al., 1974; Lopez et al., 2001;
Nishita et al., 1976). Cohesiveness and hardness better illustrated that the dough toughened with
increase in xanthan gum and this correlated with the other parameters (springiness, gumminess
and chewiness). Compared to wheat flour dough, 2% xanthan gum had closer similarities to
those of wheat dough. This confirms to studies by Lazaridou et al. (2007).
Overall, elongation methodology, puncture test and TPA methodology had a correlation
in determining the CSC dough textural characteristics during handling and processing. Two
percent (2%) xanthan gum performed optimum with an easy to work with texture in terms of
sheetability and extensibility.
Effect of Dairy Ingredients Addition on GF Dough Texture Characteristics
After selection of 2% xanthan gum CSC pizza dough as the optimum, it was treated with
dairy ingredients (whey protein and NFDM) and analyzed for textural changes. This was
intended to add functional benefits and nutritional properties to the CSC pizza crust.
When incorporated into GF breads, dairy ingredients improve overall shape and volume,
and a firmer crumb structure (Gallagher et al., 2003). They give appealing dark crust and white

100
crumb to the breads and receive good acceptability in sensory tests (Gallagher et al., 2003). It
was with this assumption that these benefits could be transferred to the baked CSC pizza crust
that the authors of this dissertation chose to use these dairy ingredients. Also, it was assumed
that the effects of other proteins were minimal and that only whey protein and NFDM had main
effects on the CSC dough texture.
Effect of Whey Protein Addition on GF Dough Texture Characteristics
Whey protein creates and stabilizes air bubbles in a liquid and has good foaming capacity
(Renner & Abdi El-Salam, 1991). This is important in creation of air bubble nuclei during
baking that aids in rising of bread and in our case GF pizza crust. Acid whey powder improves
the crust color (golden surface) and enhances flavor in dairy products (Kosikowski, 1979).
These characteristics are assumed to be transferred to the final baked product.
In Tables 11, 12 and 13, different levels of whey protein (1-3%) were applied to the 2%
xanthan gum CSC dough to investigate their effect on the dough sheetability and extensibility.
Same parameters as in the effect of xanthan gum were evaluated and had striking revelations.
From Table 11, the elongation parameters indicated that increasing whey proteins led to
subsequent reduction in elongation force and stress at yield point. This is due to the softening
effect of whey protein to the GF dough which could be attributed to competition for hydration
water with xanthan gum. Hudson et al. (2000) observed that upon heating whey proteins unfolds
and aggregates and are capable of binding large amounts of water depending on the pH, ionic
strength and thermal conditions. In this study, heat could have been from the water used during
mixing of the dough in the Hobart mixer, the temperature of the water was not controlled. Also,
increasing whey proteins resulted to increase extension at maximum load which could be
attributed to increase in protein network (Kenny et al., 2001). Gillies (1974) reported that whey

101
acts as a tenderizer in those foods where a soft and tender structure is desired. In terms of
performance, 3% whey protein GF dough was softest and stretched most (778.86 ± 57.37mN and
19.06 ± 1.37mm, mean elongation force and mean extension at maximum load respectively) but
was hard to work with while 1% and 2% whey GF dough had the same performance. Two
percent (2%) whey protein was chosen as optimum based on preliminary study sensory attributes
by the authors (not reported).
From Table 12, data indicated that a threshold concentration of whey protein existed
beyond which increasing the levels of whey in the CSC GF dough increased the compressive
force. The same observation was seen from data on hardness (Table 13). This was desired since
the increase in resistance to compressive deformation ensured non-compromise to the handling
ability of dough during processing and holding of toppings. However, this behavior of whey
protein and xanthan gum could not be explained as the study design was not set to detect
interaction effects. As in elongation parameter, 2% whey performed optimum in resisting
compressive deformation and correlated to a better golden and risen CSC pizza crust in a
preliminary baking study.
From Table 13, TPA parameters were used and they correlated with both elongation and
puncture tests. Adhesiveness increased with increase in whey protein concentration and this
could be attributed to high absorption of water resulting to less-network of the CSC flour
components that become sticky. Ghodke (2009) reported that water absorption was generally
accepted to be of main importance in dough stickiness and the higher the water absorption the
more sticky dough it gives. Regardless, 2% whey CSC GF dough had stickiness that was not
significantly different from that of the control (2% xanthan gum). Cohesiveness, hardness and

102
gumminess correlated with the data from Tables 11 and 12, with 2% whey protein as the
concentration of choice with good performance and less sticky on rolling.
Effect of NFDM Addition on GF Dough Texture Characteristics
Nonfat dry milk like other dairy ingredients is used to increase nutritional, organoleptic
and functional properties to dairy products (Eedogdu-Arnoczky et al., 1996). In this study,
textural changes of the CSC dough with various levels of NFDM were evaluated to investigate
its performance on handling and processing (rolling and sheeting).
Tables 14, 15, 16 and 17 are indicative of 2% CSC dough response to deformation with
increase in the levels of NFDM (5-15%). The response was similar to whey protein with slight
differences which are discussed below.
From Table 14, data indicated that increasing NFDM concentration in the 2% CSC dough
decreased elongation force and stress at break point. This suggests that NFDM like whey
proteins are dough softeners. This softening behavior can be attributed to the formation of a
continuous NFDM protein network in the dough that makes the dough soft (Gillies, 1974). On
the other hand, increasing NFDM in the GF dough increased the extension length of the GF
dough upon stretching. This conformed to observations made in a study by Kenny et al. (2001).
In all the elongation parameters evaluated, increasing the concentration of NFDM beyond 10%
had no significant effect. Dough with 5% NFDM performed better on handling and processing
with substantial strength to deformation and good baking behavior.
From Table 15, puncture parameters correlated with elongation data; the dough resistance
to both pulling and compressive deformation reduced with increase in NFDM concentration.
However, 5% NFDM (puncture force at maximum load = 467.42 ± 24.53 mN) dough resistance
to puncture was close to the control (puncture force at maximum load = 541.81 ± 37.33 mN).

103
The softening behavior of NFDM was strikingly different compared to whey proteins that at a
threshold concentration puncture force increased with increase in whey. The reduced resistance
to puncture force could be speculated to result from extensive absorption of water by NFDM
resulting to a soft proteinous matrix that is not stiff enough to resist compressive force. Use of
NFDM was found to increase water absorption as reported by Dubois and Dreese (1984).
In Table 16 and 17, data for TPA parameters correlated with findings on Tables 14 and
15. Addition of NFDM reduced hardness similar to Table 15 and this could be attributed to
NFDM hydration behavior (Dubois & Dreese, 1984). On the other hand, addition of NFDM
increased cohesiveness, springiness, chewiness, and gumminess. These parameter values
suggested that 5% was optimum in handling and processing performance because beyond 5%
most of the treatment effects were not significant.

104
Chapter VI: Conclusions and Recommendations
The study revealed that sheetable GF pizza crusts could be made from a cassava,
sorghum and chickpea composite flour by adding 2% xanthan gum and dairy ingredients (either
2% whey or 5% NFDM) to improve textural characteristics of the dough. The GF pizza crusts
made possessed excellent softness and pliability, resistance to puncture during processing and
good elongation length. Further, a detailed study on interaction between xanthan gum and whey
proteins is required.
105
References
Acs, E., Kovacs, Z., & Matuz, J. (1997). Possibilities of producing low-protein, gluten-free
bread. 1. Structure formation. Novenytermeles, 46, 227-234.
Ahlborn, G. J., Pike, O. A., Hendrix, S. B., Hess, W. M., & Huber, C. S. (2005). Sensory,
mechanical, and microscopic evaluation of staling in low-protein and gluten-free breads.
Journal of Cereal Chemistry, 82, 328-335.
Anton, A. A., & Artfield, D. S. (2008). Hydrocolloids in gluten-free breads: A review.
International Journal of Food Sciences and Nutrition, 59(1), 11-23.
Arendt, E. K., & Bello, F. D. (2008). Gluten-free cereal products and beverages. London, UK:
Elsevier Inc.
Arendt, E. K., & Bello, F. D. (2008). Functional cereal products for those with gluten
intolerance. In Hamaker, R. B. (Ed.), Technology of functional cereal products. (pp. 446-
475). New York: CRC Press.
Asthma and Allergy Foundation of America (2011). Facts and figures. Retrieved February,
2011, from http://www.aafa.org/display.cfm?id=9&sub=30
Bdioui, F., Sakly, N., Hassine, M., & Saffar, H. (2006). Prevalence of celiac disease in Tunisian
blood donors. Gastroenterology Clinical Biology Journal, 30, 33–36.
Beccari, J. B. (1745). De Frumento. De Bononiensi Scienterium et Artium. (pp. 122-127).
Bologna: Instituto atque Academia Commentarii.
Belton, P. S. (1999). On the elasticity of wheat gluten. Journal of Cereal Science, 29, 103-107.
Belton, P. S., Colquhoun, I. J., Field, J. M., Grant, A., Shewry, P. R., Tatham, A. S., & Wellner,
N. (1995). FTIR and NMR studies on the hydration of a high-Mr subunit of glutenin.
International Journal of Biological Macromolecules, 17, 74-80.

106
Ben Salah, R., Besbes, S., Chaari, K., Rhouma, A., Attia, H., Deroanne, C., & Blecker, C.
(2010). Rheological and physical properties of date juice palm by-product (Phoenix
Dactyliferal) and commercial Xanthan gums. Journal of Texture Studies, 41, 125–138.
Bhattacharya, S., & Narasimha, H. V. (2007). Puncture and stress relaxation behavior of
blackgram (Phaseolus Mungo) flour based papad dough. Journal of Food Process
Engineering, 20(4), 1745-4530.
Bloksma, A. H., & Bushuk, W. (1998). Rheology and chemistry of dough. In Pomeranz (Ed.),
Wheat: Chemistry and technology (pp. 131–200). St. Paul, MN: American Association of
Cereal Chemists.
Borges, C. D., & Vendruscolo, C. T. (2007). Xanthan synthesized by strains of Xanthomonas
campestris pv pruni: Production, viscosity and chemical composition. Biosciences
Journal, 23, 67-73.
Bourne, M. C. (1978). Texture profile analysis. Food Technology, 32, 62-66, 72.
Bourne, M. C. (1974). Textural changes in ripening peaches. Canadian Institute of Food Science
and Technology Journal, 7(1), 11-15.
Bourne, M. C. (1968). Texture profile of ripening pears. Journal of Food Science, 33(2), 223-
226.
Bushuk, W. (1998). Interactions in wheat doughs. In R. J. Hamer & R. C. Hoseney (Eds),
Interactions the keys to cereal quality. (pp. 1–14). St. Paul, MN: American Association of
Cereal Chemists.
Bushuk, W. (1985). Rheology: Theory and applications to wheat flour dough. In Faridi, H (Ed.),
Rheology of wheat products (pp.1-26). St. Paul, MN: American Association of Cereal
Chemistry.

107
Casier, J. P. J., de Paepe, G., Willems, H., Goffings, G., & Noppen, H. (1977). Bread from
starchy tropical crops. II. Bread production from pure millet and sorghum flours, using
cereal endosperm–cell wall pentosan as a universal baking factor. In Dendy, D. A. V.
(Ed.), Proceedings of symposium on sorghum and millets for human food (pp. 127-131).
London, UK: Tropical Products Institute.
Catassi, C., Kryszak, D., Bhatti, B., Sturgeon, C., Helzlsouer, K., Clipp, S. L., Gelfond,
D., Puppa, E., Sferruzza, A., & Fasano, A. (2010). Natural history of celiac disease
autoimmunity in a USA cohort followed since 1974. Annals of Medicine; Early Online,
1–9.
Catassi, C., Rätsch, I. M., Gandolfi, L., Pratesi, R., Fabiani, E., El Asmar, R., Frijia, M., Bearzi,
I., & Vizzoni, L. (1999). Why is coeliac disease endemic in the people of Sahara? Lancet,
354, 647–648.
Cauvain, S. P. (1998). Other cereals in breadmaking. In Cauvain, S. P. and Young, L. S. (Eds),
The technology of breadmaking (pp. 330-346) London, U.K.: Blackie Academic &
Professional.
Christianson, D., Gardner, H. W., Warner, K., Boundy, B. K., & Inglett, G. E. (1974). Xanthan
gum in protein-fortified starch bread. Food Technology, 28, 23-29.
Clelici, M. T., & El-Dash, A. A. (2006). Extruded rice flour as a gluten substitute in the
production of rice bread. Arch Latinoam Nutrition Journal, 56, 288–94.
Cocup, R. O. & Sanderson, W. B. (1987). Functionality of dairy ingredients in bakery products.
Food Technology, 41, 86–90.

108
Collar, C., Andreu, P., Martínez, J. C., & Armero, E. (1999). Optimization of hydrocolloid
addition to improve wheat bread dough functionality: a response surface methodology
study. Food Hydrocolloids, 13(6), 467- 475.
Collin, P., Kaukinen, K., Va-Lima-Ki, M., & Salmi, J. (2002). Endocrinological disorders and
celiac disease. Endocrine Review, 23(4), 464–483.
Coppola, S., Pepe, O., & Mauriello, G. (1998). Effect of leavening microflora on pizza dough
properties. Journal of Applied Microbiology, 85, 891–897.
Crockett, R. L. (2009). The physicochemical properties of gluten-free dough with the addition of
hydrocolloids and proteins. (Master’s thesis). Department of Food Technology, Ohio
State University, Ohio, USA.
Davison, A. G. F., & Bridges, M. (1987). Coeliac disease. Clinica Chimica Acta, 163, 1-40.
Diezak, J. D. (1991). A focus on gums. Food Technology, 45, 116-132.
Dobraszczyk, B. J., & Morgenstern, M. P. (2003). Rheology and the breadmaking process.
Journal of Cereal Science, 38, 229–245.
Doublier, J. L., & Cuvelier, G. (1996). Gums and hydrocolloids: Functional aspects. In Eliasson,
A. C. (Ed.), Carbohydrates in food (2nd Ed.) (pp. 283-318). New York, NY: Marcel
Dekker.
Dubois, D. K., & Dreese, P. (1984). Functionality of non-fat dry milk in bakery products. In
Vetter, J. L. (Ed), Dairy products for cereal processing industry (pp. 91-105). St. Paul,
MN: American Association Cereal Chemistry.
Dreese, P. C., Faubion, J. M., & Hoseney, R.C. (1988). Dynamic rheological properties of flour,
gluten, and gluten-starch doughs. II. Effect of various processing and ingredient changes.
Cereal Chemistry, 65, 354–359.

109
Ensminger, A. H., Ensminger, M. E., Konlande, J. E., & Robson, J. R. K. (1995). The concise
encyclopedia of foods and nutrition. Boca Raton, FL: CRC Press.
Erdogdu-Arnoczky, N., Czuchajowska, Z. I., & Pomeranz, Y. (1996). Functionality of whey and
casein in fermentation and in bread-baking by fixed and optimized procedures. Cereal
Chemistry, 73(3), 309-316.
Fasano, A., & Catassi, C. (2001). Current approaches to diagnosis and treatment of celiac
disease: an evolving spectrum. Gastroenterology, 120, 636–651.
Ferguson, A. (1997). Gluten-sensitive enteropathy (celiac disease). In Metcalfe, D. D., Sampson,
H. A., & Simon, R. A. (Eds.), Food allergy: Adverse reactions to foods and food
additives (2nd ed.) (pp. 287-301). Cambridge, MA: Blackwell Scientific.
Foegeding, E. A., Davis, J. P., Doucet, D., & McGuffey, M. K. (2002). Advances in modifying
and understanding whey protein functionality. Trends in Food Science and Technology,
5(9), 151-159.
Funami, T., Kataoka, Y., Omoto, T., Goto, Y., Asai, I., & Nishinari, K. (2005b). Food
hydrocolloids control the gelatinization and retrogradation behavior of starch. 2b.
Functions of guar gums with different molecular weights on the retrogradation behavior
of corn starch. Food Hydrocolloids, 19(1), 25-36.
Gallagher, E. (2008). Formulation and nutritional aspects of gluten-free cereal products and
infant foods. In Arendt and Bello (Eds.), Gluten-free cereal products and beverages (pp.
321-346). London, UK: Elsevier Inc.
Gallagher, E. (2009). Gluten-free food science and technology. Oxford, UK: Wiley-Blackwell.
Gallagher, E. (2002). The application of functional ingredients in short dough biscuits. (Master’s
thesis). Department of Food Technology, University College Cork, Cork, Ireland.

110
Gallagher, E., Gormley, R. T., & Arendt, E. K. (2003a). Crust and crumb characteristics of
gluten free breads. Journal of Food Engineering, 56, 153–161.
Gallagher, E., Gormley, R. T., & Arendt, E. K. (2004). Recent advances in the formulation of
gluten-free cereal-based products. Trends in Food Science & Technology, 15, 143–152.
Gallagher, E., Kunkel, A., Gormley, T. R., & Arendt, E. K. (2003). The effect of dairy and rice
powder addition on loaf and crumb characteristics, and on shelf life (intermediate and
long term) of gluten-free breads stored in a modified atmosphere. European Journal of
Food Research, 218, 44–48.
Gambuś, H., Sikora, M., & Ziobro, R. (2007). The effects of composition of hydrocolloids on
properties of gluten-free bread. Acta Scientiarum Polonorum Technologia Alimentaria,
6(3), 61-74.
Gan, Z., Ellis, P. R., & Schofield, J. D. (1995). Mini review- gas cell stabilization and gas
retention in wheat bread dough. Journal of Cereal Science, 21, 215-230.
Garcia-Ochoa, F., Santos, V. E., Casas, J. A., & Gomez, E. (2000). Xanthan gum: Production,
recovery and properties. Biotechnology Advances, 18, 549–579.
Ghodke, K. S. (2009). Effect of guar gum on dough stickiness and staling in chapatti–An Indian
unleavened flat bread. Journal of Engineering, 5(3), article 7.
Gillies, M. T. (1974). Whey processing and utilization - economic and technical aspects (pp. 97-
106). Park Ridge, NJ: Noyes Data Corporation.
Gujral, H.S., Guardiola, I., Carbonell, J. V. and Rosell, C.M. (2003a). Effect of cyclodextrin
glycoxyl transferase on dough rheology and bread quality from rice flour. Journal of
Agricultural and Food Chemistry, 51, 3814-3818.

111
Gujral, H. S., & Pathak, A. (2002). Effect of composite flours and additives on the texture of
chapati. Journal of Food Engineering, 55(2), 173-179.
Hamann, D. D., & MacDonald, G. A. (1992). Rheology and texture properties of surimi and
surimi-based foods. In Lanier, T. C., & Lee, C. M. (Eds.), Surimi technology (pp. 429-
500). New York: Marcel Dekker.
Hargreaves, J., Popineau, Y., Marion, D., Lefebvre, J., & Le Meste, M. (1995). Gluten
viscoelasticity is not lipid-mediated. A rheological and molecular flexibility study on
lipid and non-prolamin protein depleted glutens. Journal of Agricultural and Food
Chemistry, 43(5), 1170–1176.
Harper, W. J. & Zadow, J. G. (1984). Heat induced changes in whey protein concentrates as
related to bread manufacture. New Zealand Journal Dairy Science and Technology, 19,
229–237.
Huang, S., & Preston, K. R. (1998). Breads of the Pacific region. In Blakeney, A. B., & O’Brien,
L. (Eds.), Pacific people and their food. (pp. 143–70) St. Paul, MN: The American
Association of Cereal Chemists Inc.
Hudson, H. M., Daubert, C. R., & Foegeding, E. A. (2000). Rheological and physical properties
of derivitized whey protein isolate powders. Journal of Agricultural and Food
Chemistry, 48(8), 3112–3119.
Huerber, R. F., & Wall, S. J. (1976). Fractionation and quantitative difference of glutenin from
wheat varieties varying in baking quality. Journal of Cereal Chemistry, 53(2), 258-269.
Inglett, G. E. (1977, May). Food proteins from unconventional cereals. Food Technology,
180- 181.

112
Jelen, P. (2003). Whey processing utilization and products. In Roginsky, H., Fuquay, J., & Fox,
W. (Eds.), Encyclopedia of dairy sciences (pp. 2739-2743). New York: Academic Press.
Kadan, R. S., & Phillippi, B. Q. (2007). Effects of yeast and bran on phytate degradation and
minerals in rice bread. Journal of Food Science, 72, C208–C211.
Kang, M. Y., Choi, Y. H., & Choi, H. C. (1997). Effects of gums, fats and glutens adding on
processing and quality of milled rice bread. Korean Journal of Food Science Technology,
29, 700-704.
Kenny, S., Wehrle, K., Auty, M., & Arendt, E. (2001). Influence of sodium caseinate and whey
protein on baking properties and rheology of frozen dough. Journal of Cereal Chemistry,
78, 458–463.
Khan, K., & Bushuk (1979). Structure of wheat gluten in relation to functionality in
breadmaking. In Pour-El, A. (Ed.), Functionality and protein structure (pp. 191–206).
Washington, DC: American Chemical Society.
Kocian, J. (1988). Lactose intolerance. International Journal of Biochemistry, 20, 1-5.
Kosikowski, F. V. (1979). Whey utilization and whey products. Journal of Dairy Science, 62,
1149-1160.
Kulp, K., Hepburn, F. N., & Lehmann, T. A. (1974). Preparation of bread without gluten. The
Baker’s Digest, 48(3), 34-37.
Kumar, B. M., Upadhyay, J. K., & Bhattacharya, K. R. (1976). Objective test for the stickiness
of rice. Journal of Texture Studies, 7, 271-278.
Kuntz, L. (2006). Gluten-free market poised for growth. Retrieved from
http://www.foodproductdesign.com/news/2006/07/gluten-free-market-poised-for-
growth.aspx
113
Landillon, V., Cassan, D., Morel, M. H., & Cuq, B. (2008). Flowability, cohesive, and
granulation properties of wheat powders. Journal of Food Engineering, 86(2), 178–193.
Larsen, D. M., Setser, C. S., & Faubion, J. M. (1993). Effects of flour type and dough retardation
time on the sensory characteristics of pizza crust. Journal of Cereal Chemistry, 70, 647–
650.
Lazaridou, A., Duta, D., Papageorgiou, M., Belc, N., & Biliaderis, C. G. (2007). Effects of
hydrocolloids on dough rheology and bread quality parameters in gluten-free
formulations. Journal of Food Engineering, 79, 1033-1047.
Lee, M. H., Baek, M. H., Cha, D. S., Park, H. J., and Lim, S. T. (2002). Freeze-thaw stabilization
of sweet potato starch gel by polysaccharide gums. Food Hydrocolloids, 16, 345–352.
Lemke, P. J., & Taylor, S. L. (1994). Allergic reactions and food intolerances. In Kotsonis, F. N.,
Mackey, M., & J. Hjelle (Eds.), Nutritional toxicology (pp. 117-137). New York: Raven
Press.
Létang, C., Piau, M., & Verdier, C. (1999). Characterization of wheat flour–water doughs
(1999). Part I: Rheometry and microstructure. Journal of Engineering, 41(2), 121-132.
Lopez, A. C. B., Pereira, A. J. G., & Junqueira, R. G. (2004). Flour mixture of rice flour, corn
and cassava starch in the production of gluten-free white bread. Brazilian Archives of
Biology Technology, 47, 63-70.
Lopez, M. J., Moreno, J. & Ramos-Cormenzana, A. (2001). Xanthomonas campestris strain
selection for xanthan production from olive mill waste waters. Water Research, 35,
1828–1830.

114
Lorenzo, G., Zaritzky, N., & Califano, A. (2008). Optimization of non-fermented gluten-free
dough composition based on rheological behavior for industrial production of
‘‘empanadas’’ and pie-crusts. Journal of Cereal Science, 48, 224–231.
Lucca, P. A, Trepper, B. J. (1994). Fat replacers and the functionality of fat in foods. Trends in
Food Science and Technology, 5, 12-19.
Mama Deluca’s Pizza. (2011). All about pizza. Retrieved from
http://www.mamadelucaspizza.com/AllAboutPizza/tabid/221/Default.aspx
Mannie, E., & Asp, E. H. (1999). Dairy ingredients in bread baking. Cereal Foods World, 44,
143–146.
Marconi, E., & Careca, M. (2001). Pasta from nontraditional raw materials. Cereal Foods World,
46, 522–530.
Mayo Clinic. (2010). Celiac disease – definition. Retrieved September, 2010 from
http://www.mayoclinic.com/health/celiac-disease/DS00319
Medeiros, D., Vazquez-Araujo, L. & Chambers IV, E. (2011). Sorghum: The forgotten grain.
Food Technology, 65(6), 52-60.
Mekori, Y. A. (1996). Introduction to allergic diseases. Critical Reviews in Food Science and
Nutrition Journal, 36S, S1-S18.
Mendoza, N. (2005). Coeliac disease and overview of the diagnosis, treatment and management.
British Nutrition Bulletin, 30, 231-236.
Metcalfe, D. D. (1984a). Food hypersensitivity. Journal of Allergy and Clinical Immunology, 63,
749-762.

115
Mirsaeedghazi, H., Emam-Djomeh, Z., & Mousavi, S. M. A. (2008). Rheometric measurement
of dough rheological characteristics and factors affecting it. International Journal of
Agriculture & Biology, 10, 112-119.
Moore, M. M., Heinbockel, M., Dockery, P., Ulmer, H. M., & Arendt, E. K. (2006). Network
formation in gluten-free bread with application of transglutaminase. Journal of Cereal
Chemistry, 83, 28-36.
Moore, M. M., Schober, T. J., Dockery, P., & Arendt, E. K. (2004). Textural comparisons of
gluten-free and wheat-based doughs, batters, and breads. Journal of Cereal Science, 81,
567–575.
Nakamura, S., Suzuki, K., & Ohtsubo, K. (2009). Characteristics of bread prepared from wheat
flours blended with various kinds of newly developed rice flours. Journal of Food
Science, 74(3), E121–E130.
New York Daily News. (2010). As more cases of celiac disease are diagnosed, the market for
gluten-free foods is booming. Retrieved May 11, 2010, from
http://articles.nydailynews.com/2010-05-11/entertainment/27064107_1_gluten-free-
foods-gluten-free-products-gluten-intolerance
Nishita, K. D., Roberts, R. L., & Bean, M. M. (1976). Development of a yeast leavened rice
bread formula. Journal of Cereal Chemistry, 53(5), 626-635.
O’Brien, C. M., Von Lehmden, S., & Arendt, E. K. (2002a). Development of gluten free pizzas.
Irish Journal of Agricultural and Food Research, 42, 134-137.
Ohtsubo, K., Toyoshima, H., & Okadome, H. (1998). Quality assay of rice using traditional and
novel tools. Cereal Foods World, 43, 203–205.

116
Onwulata, C. I., & Huth, P. J. (2008). Whey processing, functionality and health benefits. Ames,
IA: Blackwell Publishing and IFT Press.
Ortolani, C., & Pastorello, E. A. (1997). Symptoms of food allergy and food intolerance. Study of
Nutritional Factors in Food Allergies and Food Intolerance. Luxemburg: CEC.
Payne, P. I., Corfield, K. G., & Blackman, J. A. (1979). Identification of a high-molecular-
weight subunit and glutenin whose presence correlated with bread-making quality in
wheats of related pedigree. Theoretical and Applied Genetics, 55, 153.
Pearson, A. M. & Gillett, T. A. (1996). Processed meats (3rd ed.) (pp. 291-310). New York, NY:
Chapman and Hall.
Peleg, M. (1976). Texture profile analysis parameters obtained by an Instron universal testing
machine. Journal Food Science, 41, 721-722.
Progressive Grocer. (1996, April). Fast-food facts. Sales of pizza and health.
Raymond, N., Heap, J., & Case, S. (2006). The gluten-free diet: An update for health
professionals. Practical Gastroenterology, 67-92.
Renner, E., & El-Salam, A. (1991). Application of ultrafiltration in the dairy industry (pp. 158-
161). London: Elsevier Applied Sciences.
Rizley, N. F., & Suter, D. A. (1977). Sorghum tortillas - process and product attributes. Journal
of Food Science, 42(6), 1435-1438.
Rodd, A. B., Dunstan, D. E., & Boger, D. V. (2000). Characterization of xanthan gum solutions
using dynamic light scattering and rheology. Carbohydrate Polymers, 42, 159–174.
Rojas, J. A., Rosell, C. M., & de Barber, C. B. (1999). Pasting properties of different wheat
flour-hydrocolloid systems. Food Hydrocolloids, 13, 27-33.

117
Rosalan, S., & England, R. (2006). Review of xanthan gum production from unmodified starches
by Xanthomonas comprestris sp. Enzyme and Microbial Technology, 39, 197–207.
Rosell, C. M., Collar, C., & Haros, M. (2007). Assessment of hydrocolloid effects on thermo-
mechanical properties of wheat using the Mixolab. Food Hydrocolloids, 21, 452-462.
Rotsch, A. (1954). Chemical and baking - technological investigation with artificial doughs. Brot
Gebeck, 8, 129-130.
Rourke, K., & Tirone, A. (2007). Celiac disease: Continuing awareness and market growth.
Retrieved from www.naturalproductsinsider.com.
Sampson, H. A. (1990). Food allergy. Current Opinion in Immunology, 2, 542-547.
Sánchez, H. D., Osella, C. A., & De La Torre, M. A. (1996). Desarrollo de una fórmula para Pan
sin gluten. Información Tecnológica, 7(2), 35-42.
Sanchez, H. D., Osella, C. A., & De La Torre, M. A. (2002). Optimization of gluten-free bread
prepared from cornstarch, rice flour, and cassava starch. Journal of Food Science, 67(1),
416-419.
Schober, T. J., Bean, R. S., Boyle, L. D., & Park S-H. (2008). Improved viscoelastic zein–starch
doughs for leavened gluten-free breads: Their rheology and microstructure. Journal of
Cereal Science, 48, 755–767.
Schober, T. J., Messerschmidt, M., Bean, S. R., Park, S., & Arendt, E. K. (2005). Gluten-free
bread from sorghum: Quality differences among hybrids. Journal of Cereal Chemistry
82, 394-404.
Shahbazkhani, B., Malekzadeh, R., Sotoudeh, M., Moghadam, K. F., Farhadi, M., Ansari,
R., Elahyfar, A., & Rostami, K. (2003). High prevalence of celiac disease in apparently

118
healthy Iranian blood donors. European Journal of Gastroenterology and Hepatology,
15, 475–478.
Sherman, P. (1969). A texture profile of food stuffs based on well-defined rheological properties.
Journal of Food Science, 34, 458-462.
Shewry, P. R, Halford, N. G., Belton, P. S., & Tatham, A. S. (2002). The structure and properties
of gluten: An elastic protein from wheat grain. Philosophical Transactions of the Royal
Society, 357, 133–42.
Shewry, P. R., Popineau, Y., Lafiandra, D., & Belton, P., (2001). Wheat glutenin subunits and
dough elasticity: findings of the EUROWHEAT project. Trends Food Science and
Technology, 11, 433–41.
Shewry, P. R., Tatham, A. S., Barro, F., Barcelo, P., & Lazzeri, P. (1995). Biotechnology of
breadmaking: Unravelling and manipulating the multi-protein gluten complex.
Biotechnology Journal, 13, 1185–1190.
Silva, M. F., Fornari, R. C. G., Mazutti, M. A., Olivera, D., Padilha, F. F., Cichoski, A. J.,
Cansian, R. L., Diluccio, M., & Treichel, H. (2009). Production and characterization of
xantham gum by Xanthomonas campestris using cheese whey as sole carbon source.
Journal of Food Engineering, 90, 119–123.
Sivam, S. A., Sun-Waterhouse, D., Quek, Y, S., & Perera, O. C. (2010). Properties of bread
dough with added fiber polysaccharides and phenolic antioxidants: A review. Journal of
food science, 75(8), 163-174.
Sivaramakrishnan, H. P., Senge, B., & Chattopadhyay, P. K. (2004). Rheological properties of
rice dough for making rice bread. Journal of Food Engineering, 62, 37-45.

119
Sloan, E. (2011). A move to three square meals a day, more home cooking, and an all-out cry to
‘get real’ are among the major trends reshaping the food industry in 2011 and beyond-
Food trends. Food Technology, 65(4), 24-41.
Sood, A., Midha, V., Sood, N., Avasthi, G., & Sehgal, A. (2006). Prevalence of celiac disease
among school children in Punjab, North India. Journal of Gastroenterology and
Hepatology, 21, 1622–1625.
Stahel, N. (1983). Dairy proteins for the cereal foods industry: Functions, selection, and usage.
Cereal Foods World, 28, 453–455.
Stauffer C. (1998). Principles of dough formation. In Cauvain, S. P, & Young, L. S. (Eds.),
Technology of breadmaking. (pp. 262-295). Gaithersburg, ML: Aspen Publications.
Steve, L. T., & Susan, L. H. (2001). Food allergies and other food sensitivities. Food
Technology, 55(9), 68-83.
Strober, W. (1986). Gluten-sensitive enteropathy: A nonallergic immune hypersensitivity of the
gastrointestinal tract. Journal of Allergy and Clinical Immunology, 78, 202-211.
Szczesniak, A. S. (1963). Classification of textural characteristics. Journal of Food Science,
28(4), 385-389.
Szczesniak, A. S., Brandt, M. A., & Friedman, H. H. (1963). Development of standard rating
scales for mechanical parameters of texture and correlation between the objective and
sensory methods of texture evaluation. Journal of Food Science, 28, 397- 403.
Tatham, A. S., Drake, A. F. & Shewry, P. R. (1990). Conformational studies of peptides
corresponding to the repetitive regions of the high molecular weight (HMW) glutenin
subunits of wheat. Journal of Cereal Science, 11, 189–200.

120
Taylor, S. L. (1987). Allergic and sensitivity reactions to food components. In Hathcock, J. N.
(Ed.), Nutritional toxicology (2nd Ed.) (pp. 173-198). Academic Press, New York:
Academic Press.
Trier, J. S. (1991). Celiac sprue. New England Journal of Medicine, 325, 1709–1719.
Tunick, M. H. (2008). Whey protein production and utilization. In Onwulata, C.I., & Huth, P.J.,
(Eds.), Whey processing, functionality and health benefits (pp. 169-184). Ames, IA:
Blackwell Publishing and IFT Press.
University of Chicago Celiac Disease Center (2011). Jump start your gluten-free diet! Living
with celiac/coeliac disease & gluten intolerance. Retrieved May 20, 2011, from
http://www.cureceliacdisease.org/wp-content/uploads/2011/09/Jump_Start_Your_Gluten-
Free_Diet_5_20_2011-3.pdf
USDA. (2000, November). Factors affecting tomato consumption in the United States. In USDA
vegetables and specialties/VGS-282.
U. S. Food and Drug Administration. (2004). Food allergen labeling and consumer protection
act. Retrieved from
http://www.fda.gov/food/labelingnutrition/FoodAllergensLabeling/GuidanceCompliance
RegulatoryInformation/ucm106187.htm
Waniska, R. A. (1990). Methods to assess quality of boiled sorghum, gruel and chapaties from
sorghums with different kernel characteristics. (Master’s thesis). Texas A&M University.
College Station, TX.
Webster's new world college dictionary (2010). Definition of pizza. Retrieved from
http://www.merriam-webster.com/dictionary/pizza
Wieser, H. (2007). Chemistry of gluten proteins. Food Microbiology, 24(2), 115-119.

121
Wieser, H., & Koehler, P. (2008). The biochemical basis of celiac disease. Journal of Cereal
Chemistry, 85(1), 1–13.
Whitcomb, P. J., & Macosko, C. W. (1978). Rheology of xanthan gum. Journal of Rheology,
22(5), 493-505.

122
Appendix A
Exported SPSS raw data for xanthan gum addition TPA
Factor Adhesiveness cohesiveness Hardness springiness Chewiness Gumminess
1 2.45 0.29 64.5 1.30 24.13 18.56
1 1.22 0.27 61.11 1.10 18.44 16.76
1 3.39 0.30 58.84 1.50 26.65 17.77
2 0.20 0.08 69.74 0.40 2.28 5.69
2 0.18 0.08 67.85 0.40 2.10 5.26
2 0.14 0.08 69.85 0.30 1.70 5.67
3 0.88 0.05 126.56 0.70 4.58 6.55
3 0.94 0.05 119.92 0.90 5.70 6.33
3 0.91 0.05 122.86 0.80 5.15 6.44
4 1.22 0.14 140.29 0.70 13.77 19.66
4 0.68 0.13 123.33 0.80 12.93 16.16
4 1.72 0.14 144.46 0.90 18.67 20.75
5 0.02 0.14 197.09 0.70 18.83 26.90
5 0.01 0.16 203.62 0.80 26.03 32.53
5 0.02 0.13 180.99 0.70 16.67 23.81
6 0.40 0.19 292.45 1.84 103.87 56.45
6 0.24 0.17 300.75 1.83 94.65 51.72
6 0.01 0.19 311.53 2.00 117.60 58.80
Note: These are averages, number of times a factor appears represents replications. 1 = wheat
flour, 2 = 0% xanthan, 3 = 1% xanthan, 4 = 2% xanthan, 5 = 3% xanthan and 6 = 5% xanthan.

123
Exported SPSS raw data for xanthan gum addition Puncture test
Factor Maximum load Stress at yield point
1 347.42 0.0001
1 402.22 0
1 409.52 0
1 449.21 0
1 454.74 0
2 196.55 0.0001
2 197.30 0.0001
2 206.66 0.0001
2 215.66 0.0001
2 265.26 0.0001
3 366.52 0.0002
3 386.31 0.0002
3 391.13 0.0002
3 418.03 0.0002
3 443.04 0.0002
4 511.35 0.0002
4 519.09 0.0002
4 540.81 0.0003
4 542.67 0.0003
4 594.12 0.0003
5 876.61 0.0004

124
5 878.61 0.0004
5 901.37 0.0004
5 915.03 0.0004
5 934.26 0.0004
6 2162.90 0.0010
6 2163.11 0.0010
6 2210.92 0.0010
6 2465.47 0.0012
6 2513.67 0.0012
Note: These are averages and the number of times a factor appears represents
replications. 1 = wheat flour, 2 = 0% xanthan, 3 = 1% xanthan, 4 = 2%
xanthan, 5 = 3% xanthan and 6 = 5% xanthan.

125
Exported SPSS raw data for xanthan gum addition Elongation test
Factor Maximum load Extension at maximum loan Stress at yield point
1 721.01 68.38 0
1 683.27 54.83 0
1 688.14 71.81 0
2 526.88 2.26 0.006
2 559.32 1.77 0.006
2 558.44 1.73 0.006
3 731.37 4.16 0.008
3 710.54 4.61 0.008
3 857.70 5.27 0.009
4 1610.81 9.99 0.017
4 1556.64 8.28 0.017
4 1531.84 10.56 0.017
5 2393.94 12.27 0.026
5 2016.00 10.66 0.022
5 2252.00 12.82 0.024
6 2670.99 10.78 0.029
6 2590.87 9.65 0.0281
6 2753.52 10.40 0.0299
Note: The number of times a factor appears represents replications. 1 = wheat flour, 2
= 0% xanthan, 3 = 1% xanthan, 4 = 2% xanthan, 5 = 3% xanthan and 6 = 5% xanthan.

126
Appendix B
Exported SPSS raw data for whey protein addition TPA
Factor Adhesiveness cohesiveness Hardness springiness Chewiness Gumminess
1 1.22 0.14 140.29 0.70 13.77 19.66
1 0.68 0.13 123.33 0.80 12.93 16.16
1 1.72 0.14 144.46 0.90 18.67 20.75
2 1.46 0.15 106.29 1.38 22.51 16.31
2 1.82 0.13 107.95 1.08 15.08 13.96
2 1.49 0.12 101.57 0.88 10.67 12.13
3 1.31 0.11 129.61 0.78 11.38 14.58
3 1.13 0.11 135.28 1.38 21.03 15.24
3 0.86 0.11 140.67 0.78 12.00 15.38
4 9.80 0.17 133.10 1.18 27.19 23.04
4 8.53 0.14 158.22 1.18 27.05 22.93
4 7.35 0.15 143.27 1.08 23.28 21.56
Note: These are averages and the number of times a factor appears represents replications. 1 = 2%
xanthan gum, 2 = 1% whey, 3 = 2% whey, and 4 = 3% whey.

127
Exported SPSS raw data for whey protein addition elongation test
Factor Maximum load Extension at maximum loan Stress at yield point
1 1610.81 9.99 0.0175
1 1556.64 8.28 0.0169
1 1531.84 10.56 0.0166
2 1183.84 14.37 0.013
2 1118.90 14.82 0.012
2 1206.24 14.72 0.012
3 1140.89 15.41 0.012
3 1134.11 15.71 0.012
3 1164.59 15.06 0.011
4 812.59 17.70 0.009
4 810.97 20.44 0.009
4 712.42 19.04 0.008
Note: These are averages and the number of times a factor appears represents
replications. 1 = 2% xanthan gum, 2 = 1% whey, 3 = 2% whey, and 4 = 3% whey

128
Exported SPSS raw data for whey protein addition puncture test
Factor Maximum load Stress at yield point 1 594.12 0.0003 1 511.35 0.0002 1 542.67 0.0003 1 519.09 0.0002 1 540.81 0.0003 2 468.72 0.0002 2 442.12 0.0002 2 462.39 0.0002 2 462.19 0.0002 2 444.43 0.0002 3 525.62 0.0003 3 574.10 0.0003 3 562.58 0.0003 3 525.98 0.0003 3 506.55 0.0002 4 655.51 0.0003 4 679.69 0.0003 4 713.60 0.0003 4 697.84 0.0003 4 686.66 0.0003
Note: These are averages and the number of times a factor appears represents replications. 1 = 2% xanthan gum, 2 = 1% whey, 3 = 2% whey, and 4 = 3% whey.

129
Appendix C Exported SPSS raw data for NFDM addition TPA.
Factor Adhesiveness cohesiveness Hardness springiness Chewiness Gumminess
1 1.22 0.14 140.29 0.70 13.77 19.66
1 0.68 0.13 123.33 0.80 12.93 16.16
1 1.72 0.14 144.46 0.90 18.67 20.75
2 23.36 0.37 84.15 5.48 169.65 30.96
2 22.33 0.39 83.38 3.98 129.70 32.59
2 20.69 0.37 84.20 2.98 92.46 31.03
3 28.60 0.65 48.09 5.98 187.76 31.40
3 16.66 0.40 52.93 2.78 59.30 21.33
3 23.89 0.54 51.16 5.08 140.79 27.72
4 26.62 0.64 43.58 5.78 161.13 27.88
4 27.87 0.73 42.49 5.78 178.87 30.95
4 21.76 0.54 43.65 5.58 131.81 23.62
Note: These are averages and the number of times a factor appears represents replications. 1
= 2% xanthan gum, 2 = 5% NFDM, 3 = 10% NFDM, and 4 = 15% NFDM.

130
Exported SPSS raw data for NFDM addition puncture test
Factor Maximum load Stress at yield point
1 594.12 0.0003
1 511.35 0.0002
1 542.67 0.0003
1 519.09 0.0002
2 434.12 0.0002
2 493.16 0.0002
2 469.61 0.0002
2 472.78 0.0002
3 201.91 0.0001
3 234.86 0.0001
3 201.74 0.0001
3 230.26 0.0001
4 212.14 0.0001
4 216.94 0.0001
4 206.00 0.0001
4 215.90 0.0002
Note: These are averages and the number of times a factor appears represents replications.
1 = 2% xanthan gum, 2 = 5% NFDM, 3 = 10% NFDM, and 4 = 15% NFDM.

131
Exported SPSS raw data for NFDM addition elongation test
Factor Maximum load Extension at maximum loan Stress at yield point
1 1610.81 9.99 0.0175
1 1556.64 8.28 0.0169
1 1531.84 10.56 0.0166
2 1047.83 20.66 0.011
2 1054.25 16.55 0.011
2 1330.28 19.06 0.014
3 489.57 15.24 0.0053
3 496.82 14.02 0.0054
3 513.57 15.93 0.0056
4 410.00 14.90 0.004
4 400.75 12.33 0.004
4 416.86 16.12 0.005
Note: These are averages and the number of times a factor appears represents replications. 1 =
2% xanthan gum, 2 = 5% NFDM, 3 = 10% NFDM, and 4 = 15% NFDM.