Embed Size (px)
Citation preview
Mustafa Melih Tecer / The International Journal of Materials and Engineering Technology 003 (2020) 131-149
131
TIJMET, Vol. 003 (2020) 131-149
The International Journal of
Materials and Engineering Technology
ISSN: 2667-4033
TIJMET ID: 200302008 (19 pages) Type of the Paper: Article
Received 12.07.2020 Revised: 10.12.2020 Accepted: 14.12.2020 Published (Online): 30.12.2020
Journal homepage: http://dergipark.gov.tr/tijmet
EFFECTS OF VARIOUS HEAT TREATMENT PROCEDURES ON THE
TOUGHNESS OF AISI 4140 LOW ALLOY STEEL
MUSTAFA MELIH TECER*
Middle East Technical University, Engineering Faculty, Metallurgical and Materials Engineering Department,
Ankara, TURKEY.
Abstract
In this paper, through literature search, effects of various heat treatment procedures on
toughness of commercially available AISI 4140 low alloy steel were investigated. Variables
affecting a material’s mechanical properties were discussed briefly and details of AISI 4140
steel were delivered. Different heat-treating routes and approaches from various reports were
considered and compared. Utilizing a materials properties database, a number of reported
results were gathered and discussed. An effort has been put into keeping all the variables
affecting the results constant other than heat treatment procedures for the purpose of
observing only the effects of those procedures. Double quenching and tempering in the range
of 600-900℃ as well as full annealing at around 860℃ were found to be resulting with the
highest toughness values. A proposal was also made for furtherly improving the toughness
values of these heat-treated samples.
Keyword: Maximum toughness, heat treatment, AISI 4140 steel.
1.Introduction
1.1. Variables Affecting a Material’s
Mechanical Properties
For many years the influence of materials’
microstructures on mechanical properties
has been extensively researched; engineers
have been pressed to enhance the
properties of alloys to develop stronger and
lightweight materials. By designing with
stresses which are below the yield strength
of a high ductility material, designers can
generally avoid failure. However, the same
practice does not properly function on
newly developed high strength and low
ductility alloys as there were a lot of
catastrophic failures reported. For this
exact reason, a material’s toughness came
forward in design parameters.
Mustafa Melih Tecer / The International Journal of Materials and Engineering Technology 003 (2020) 131-149
132
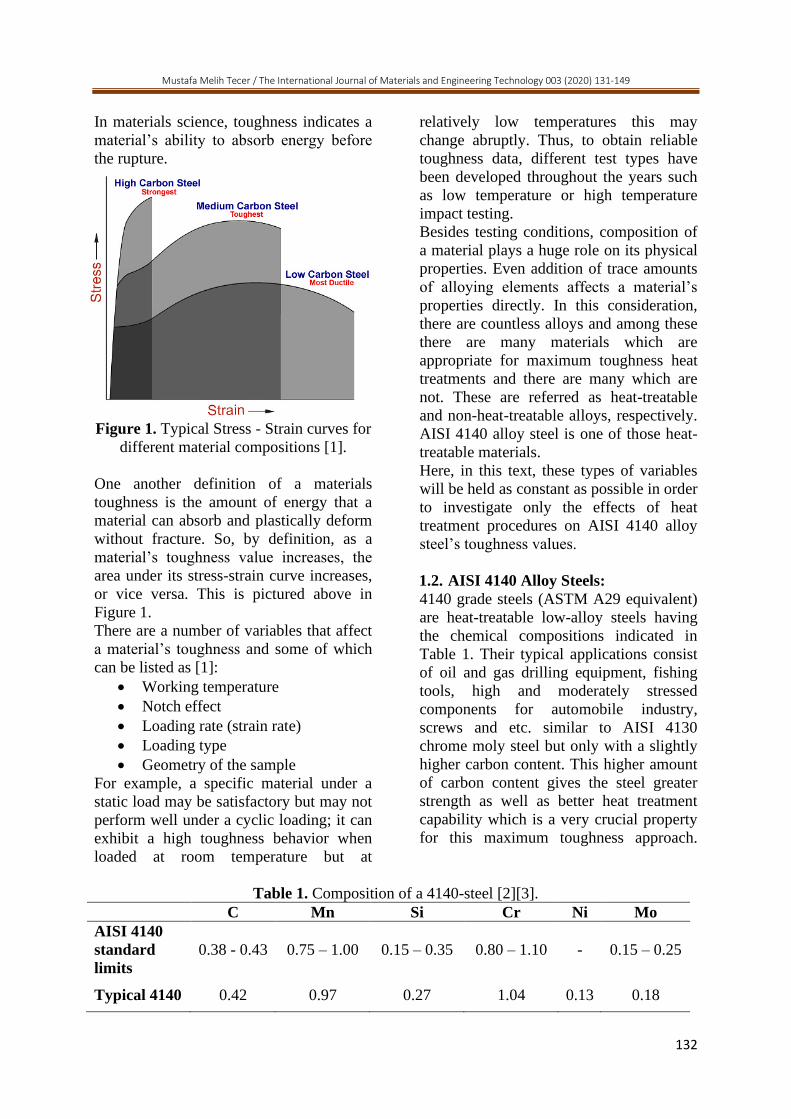
In materials science, toughness indicates a
material’s ability to absorb energy before
the rupture.
Figure 1. Typical Stress - Strain curves for
different material compositions [1].
One another definition of a materials
toughness is the amount of energy that a
material can absorb and plastically deform
without fracture. So, by definition, as a
material’s toughness value increases, the
area under its stress-strain curve increases,
or vice versa. This is pictured above in
Figure 1.
There are a number of variables that affect
a material’s toughness and some of which
can be listed as [1]:
• Working temperature
• Notch effect
• Loading rate (strain rate)
• Loading type
• Geometry of the sample
For example, a specific material under a
static load may be satisfactory but may not
perform well under a cyclic loading; it can
exhibit a high toughness behavior when
loaded at room temperature but at
relatively low temperatures this may
change abruptly. Thus, to obtain reliable
toughness data, different test types have
been developed throughout the years such
as low temperature or high temperature
impact testing.
Besides testing conditions, composition of
a material plays a huge role on its physical
properties. Even addition of trace amounts
of alloying elements affects a material’s
properties directly. In this consideration,
there are countless alloys and among these
there are many materials which are
appropriate for maximum toughness heat
treatments and there are many which are
not. These are referred as heat-treatable
and non-heat-treatable alloys, respectively.
AISI 4140 alloy steel is one of those heat-
treatable materials.
Here, in this text, these types of variables
will be held as constant as possible in order
to investigate only the effects of heat
treatment procedures on AISI 4140 alloy
steel’s toughness values.
1.2. AISI 4140 Alloy Steels:
4140 grade steels (ASTM A29 equivalent)
are heat-treatable low-alloy steels having
the chemical compositions indicated in
Table 1. Their typical applications consist
of oil and gas drilling equipment, fishing
tools, high and moderately stressed
components for automobile industry,
screws and etc. similar to AISI 4130
chrome moly steel but only with a slightly
higher carbon content. This higher amount
of carbon content gives the steel greater
strength as well as better heat treatment
capability which is a very crucial property
for this maximum toughness approach.
Table 1. Composition of a 4140-steel [2][3].
C Mn Si Cr Ni Mo
AISI 4140
standard
limits
0.38 - 0.43 0.75 – 1.00 0.15 – 0.35 0.80 – 1.10 - 0.15 – 0.25
Typical 4140 0.42 0.97 0.27 1.04 0.13 0.18
Mustafa Melih Tecer / The International Journal of Materials and Engineering Technology 003 (2020) 131-149
133
To shed some light on the properties of this alloy, Table 2 was constructed and given below.
Here, these values were obtained from the test results of a standard 4140 steel after its
production without a special heat treatment procedure and may vary with applied treatments.
Table 2. Various properties and their values of AISI 4140 standard alloy steel [4].
Properties Values
Density 7.85 g/cm3
Melting point 1416°C
Tensile strength 655 MPa
Yield strength 415 MPa
Bulk modulus (typical for steel) 140 GPa
Shear modulus (typical for steel) 80 GPa
Elastic modulus 190-210 GPa
Poisson's ratio 0.27-0.30
Elongation at break (in 50 mm) 25.70%
Hardness, Brinell 197
Hardness, Knoop (converted from Brinell hardness) 219
Hardness, Rockwell B (converted from Brinell hardness) 92
Hardness, Rockwell C (converted from Brinell hardness. Value below
normal HRC range, for comparison purposes only) 13
Hardness, Vickers (converted from Brinell hardness) 207
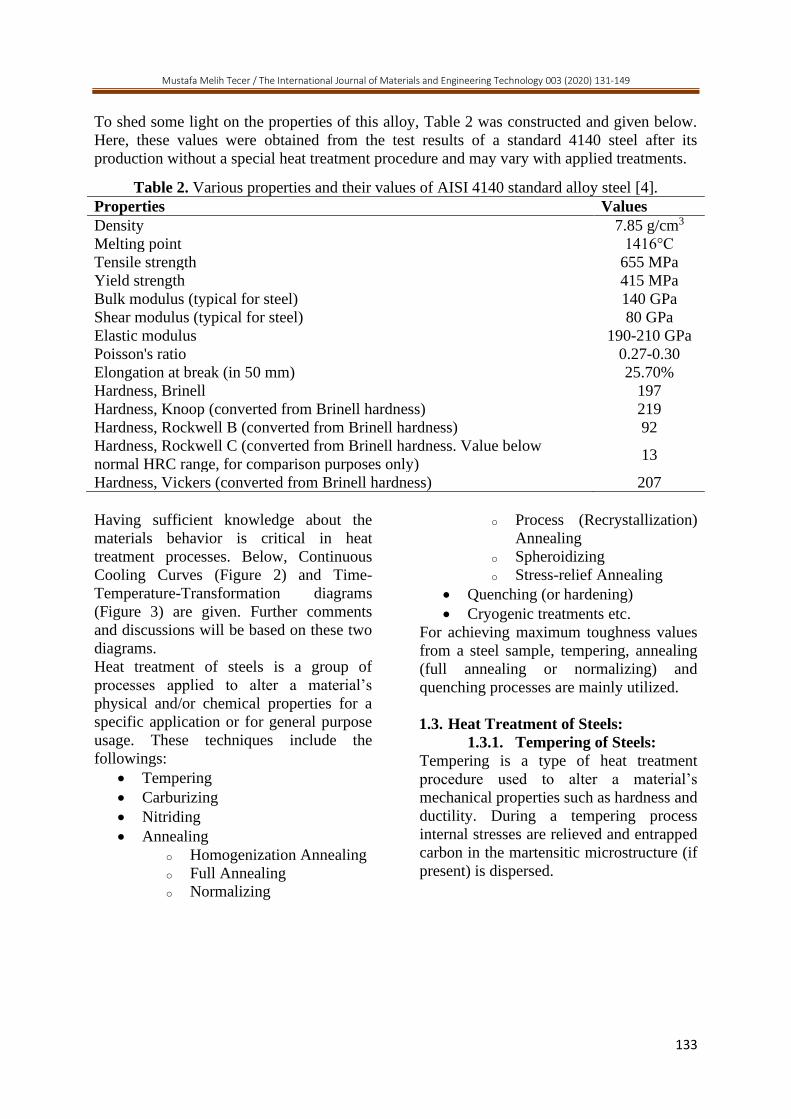
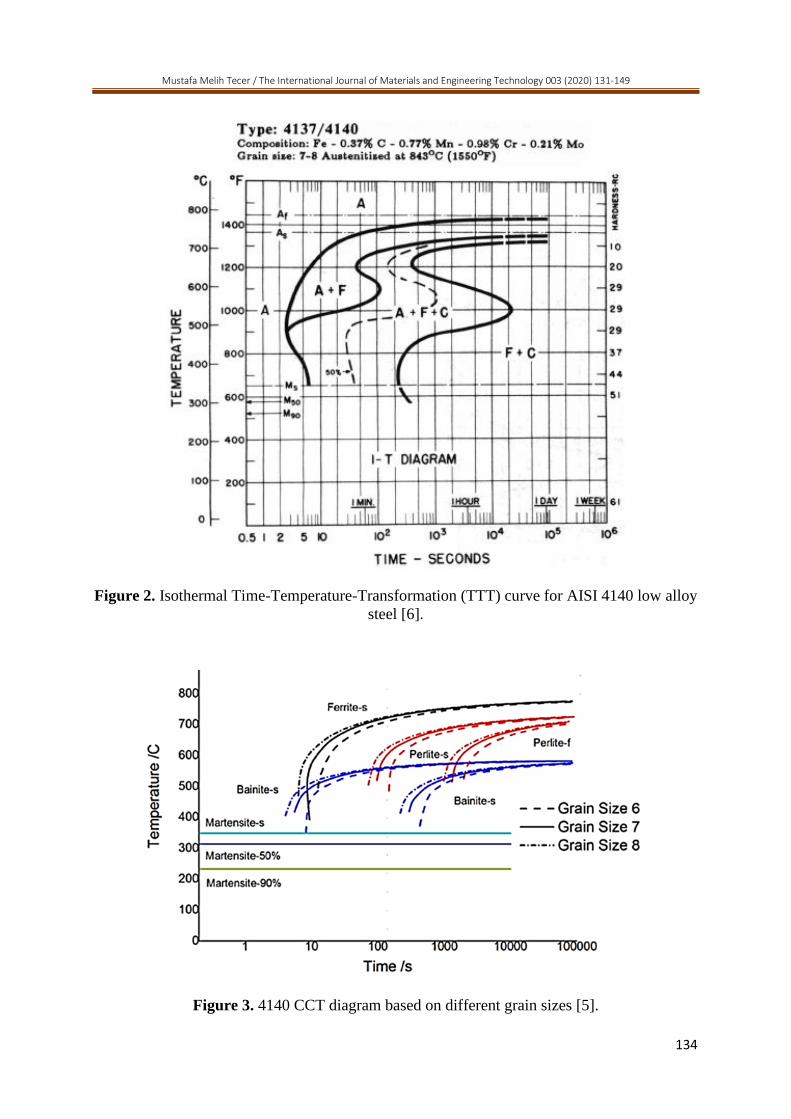
Having sufficient knowledge about the
materials behavior is critical in heat
treatment processes. Below, Continuous
Cooling Curves (Figure 2) and Time-
Temperature-Transformation diagrams
(Figure 3) are given. Further comments
and discussions will be based on these two
diagrams.
Heat treatment of steels is a group of
processes applied to alter a material’s
physical and/or chemical properties for a
specific application or for general purpose
usage. These techniques include the
followings:
• Tempering
• Carburizing
• Nitriding
• Annealing
o Homogenization Annealing
o Full Annealing
o Normalizing
o Process (Recrystallization)
Annealing
o Spheroidizing
o Stress-relief Annealing
• Quenching (or hardening)
• Cryogenic treatments etc.
For achieving maximum toughness values
from a steel sample, tempering, annealing
(full annealing or normalizing) and
quenching processes are mainly utilized.
1.3. Heat Treatment of Steels:
1.3.1. Tempering of Steels:
Tempering is a type of heat treatment
procedure used to alter a material’s
mechanical properties such as hardness and
ductility. During a tempering process
internal stresses are relieved and entrapped
carbon in the martensitic microstructure (if
present) is dispersed.
Mustafa Melih Tecer / The International Journal of Materials and Engineering Technology 003 (2020) 131-149
134
Figure 2. Isothermal Time-Temperature-Transformation (TTT) curve for AISI 4140 low alloy
steel [6].
Figure 3. 4140 CCT diagram based on different grain sizes [5].
Mustafa Melih Tecer / The International Journal of Materials and Engineering Technology 003 (2020) 131-149
135
Tempering is performed by basically
heating the steel part below its lower
critical temperature, holding it at this
temperature for a sufficient time (depends
on the type of the metal and the expected
properties) and then cooling at a specific
rate down to a specific temperature. While
diffusion of alloying elements and carbon
is time and temperature dependent, during
tempering, holding temperature is more
critical than holding time.
As stated earlier tempering process is done
to relieve internal stresses and increasing
ductility of a component. However, for
alloys having some specific impurities
such as S, Sb, P, Sn and As, toughness
values may drop drastically and the
material exhibits brittle fracture behavior.
This is due to a phenomenon called temper
embrittlement which stems from impurity
segregation into grain boundaries during
the process. While the best way of
avoiding this phenomenon is reducing the
amount of impurities, this effect can also
be inhibited by the addition of Mo and W
elements or by heating the part above
600°C and quenching below 300°C [7].
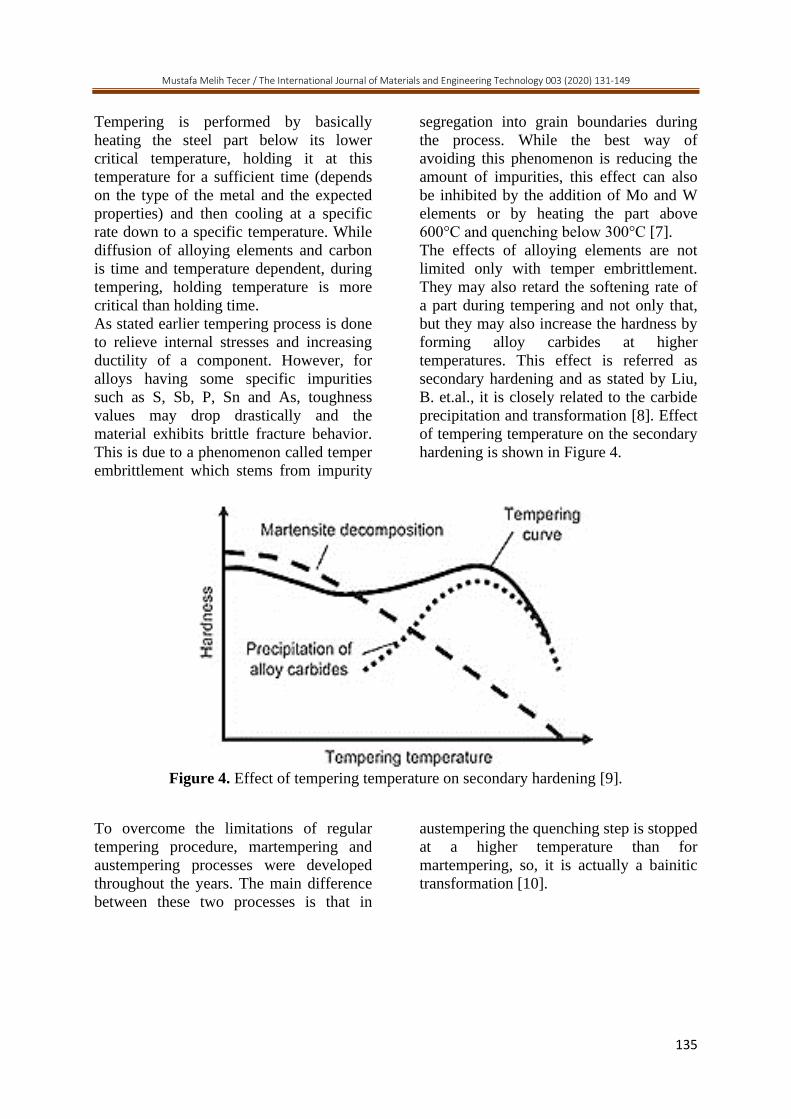
The effects of alloying elements are not
limited only with temper embrittlement.
They may also retard the softening rate of
a part during tempering and not only that,
but they may also increase the hardness by
forming alloy carbides at higher
temperatures. This effect is referred as
secondary hardening and as stated by Liu,
B. et.al., it is closely related to the carbide
precipitation and transformation [8]. Effect
of tempering temperature on the secondary
hardening is shown in Figure 4.
Figure 4. Effect of tempering temperature on secondary hardening [9].
To overcome the limitations of regular
tempering procedure, martempering and
austempering processes were developed
throughout the years. The main difference
between these two processes is that in
austempering the quenching step is stopped
at a higher temperature than for
martempering, so, it is actually a bainitic
transformation [10].
Mustafa Melih Tecer / The International Journal of Materials and Engineering Technology 003 (2020) 131-149
136
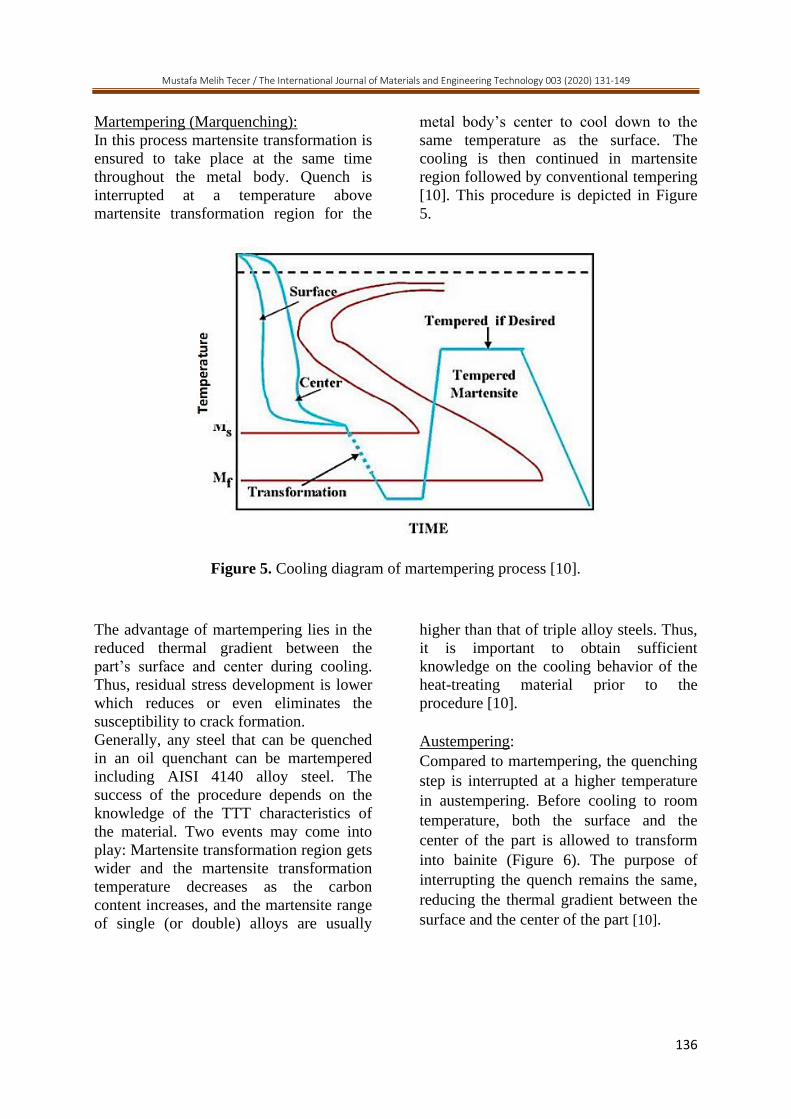
Martempering (Marquenching):
In this process martensite transformation is
ensured to take place at the same time
throughout the metal body. Quench is
interrupted at a temperature above
martensite transformation region for the
metal body’s center to cool down to the
same temperature as the surface. The
cooling is then continued in martensite
region followed by conventional tempering
[10]. This procedure is depicted in Figure
5.
The advantage of martempering lies in the
reduced thermal gradient between the
part’s surface and center during cooling.
Thus, residual stress development is lower
which reduces or even eliminates the
susceptibility to crack formation.
Generally, any steel that can be quenched
in an oil quenchant can be martempered
including AISI 4140 alloy steel. The
success of the procedure depends on the
knowledge of the TTT characteristics of
the material. Two events may come into
play: Martensite transformation region gets
wider and the martensite transformation
temperature decreases as the carbon
content increases, and the martensite range
of single (or double) alloys are usually
higher than that of triple alloy steels. Thus,
it is important to obtain sufficient
knowledge on the cooling behavior of the
heat-treating material prior to the
procedure [10].
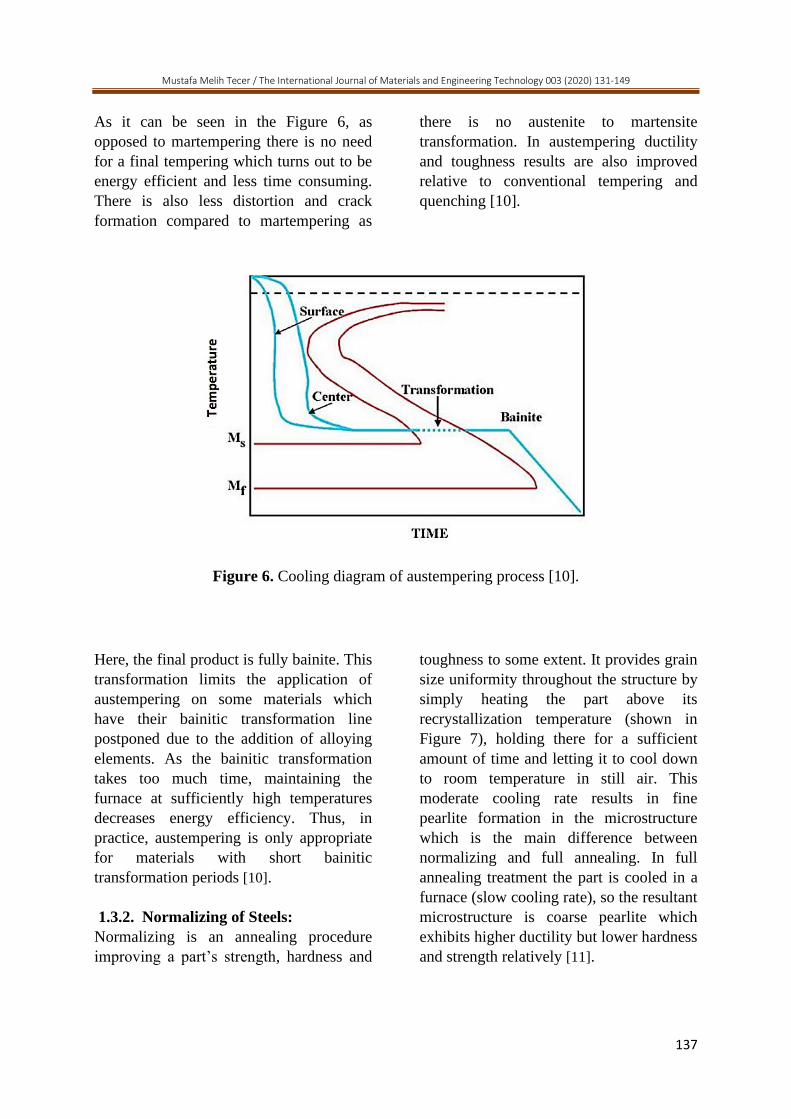
Austempering:
Compared to martempering, the quenching
step is interrupted at a higher temperature
in austempering. Before cooling to room
temperature, both the surface and the
center of the part is allowed to transform
into bainite (Figure 6). The purpose of
interrupting the quench remains the same,
reducing the thermal gradient between the
surface and the center of the part [10].
Figure 5. Cooling diagram of martempering process [10].
Mustafa Melih Tecer / The International Journal of Materials and Engineering Technology 003 (2020) 131-149
137
As it can be seen in the Figure 6, as
opposed to martempering there is no need
for a final tempering which turns out to be
energy efficient and less time consuming.
There is also less distortion and crack
formation compared to martempering as
there is no austenite to martensite
transformation. In austempering ductility
and toughness results are also improved
relative to conventional tempering and
quenching [10].
Here, the final product is fully bainite. This
transformation limits the application of
austempering on some materials which
have their bainitic transformation line
postponed due to the addition of alloying
elements. As the bainitic transformation
takes too much time, maintaining the
furnace at sufficiently high temperatures
decreases energy efficiency. Thus, in
practice, austempering is only appropriate
for materials with short bainitic
transformation periods [10].
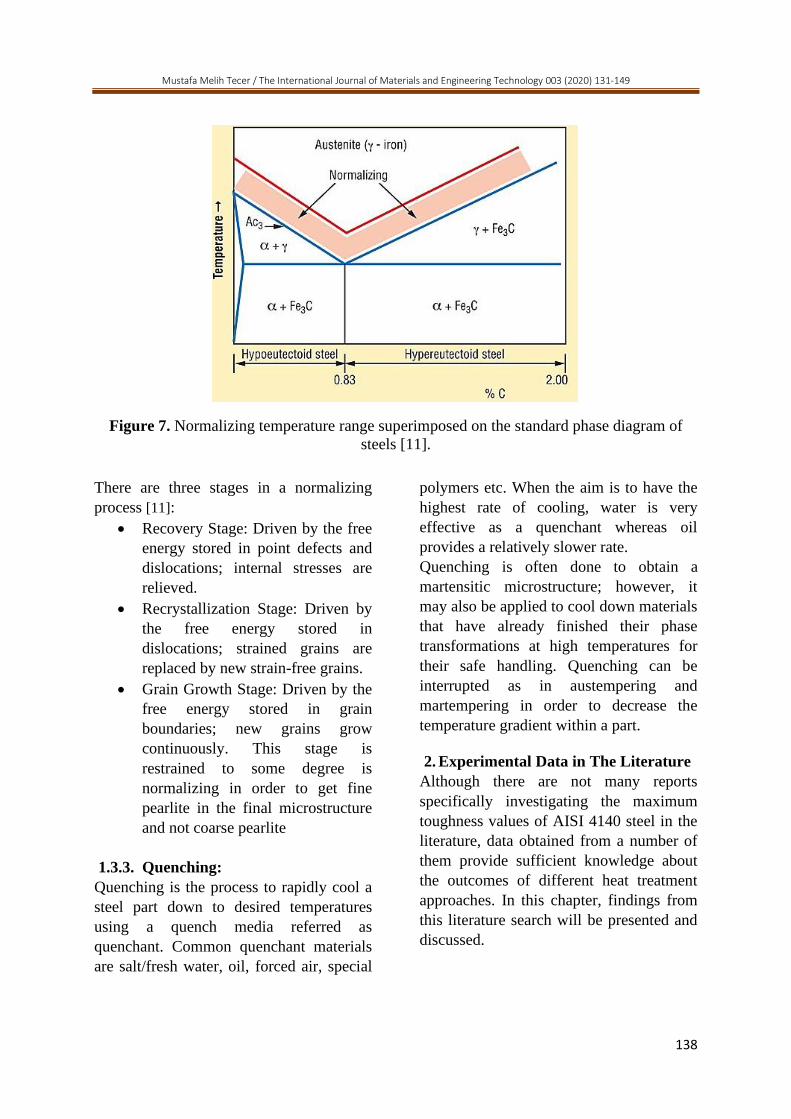
1.3.2. Normalizing of Steels:
Normalizing is an annealing procedure
improving a part’s strength, hardness and
toughness to some extent. It provides grain
size uniformity throughout the structure by
simply heating the part above its
recrystallization temperature (shown in
Figure 7), holding there for a sufficient
amount of time and letting it to cool down
to room temperature in still air. This
moderate cooling rate results in fine
pearlite formation in the microstructure
which is the main difference between
normalizing and full annealing. In full
annealing treatment the part is cooled in a
furnace (slow cooling rate), so the resultant
microstructure is coarse pearlite which
exhibits higher ductility but lower hardness
and strength relatively [11].
Figure 6. Cooling diagram of austempering process [10].
Mustafa Melih Tecer / The International Journal of Materials and Engineering Technology 003 (2020) 131-149
138
There are three stages in a normalizing
process [11]:
• Recovery Stage: Driven by the free
energy stored in point defects and
dislocations; internal stresses are
relieved.
• Recrystallization Stage: Driven by
the free energy stored in
dislocations; strained grains are
replaced by new strain-free grains.
• Grain Growth Stage: Driven by the
free energy stored in grain
boundaries; new grains grow
continuously. This stage is
restrained to some degree is
normalizing in order to get fine
pearlite in the final microstructure
and not coarse pearlite
1.3.3. Quenching:
Quenching is the process to rapidly cool a
steel part down to desired temperatures
using a quench media referred as
quenchant. Common quenchant materials
are salt/fresh water, oil, forced air, special
polymers etc. When the aim is to have the
highest rate of cooling, water is very
effective as a quenchant whereas oil
provides a relatively slower rate.
Quenching is often done to obtain a
martensitic microstructure; however, it
may also be applied to cool down materials
that have already finished their phase
transformations at high temperatures for
their safe handling. Quenching can be
interrupted as in austempering and
martempering in order to decrease the
temperature gradient within a part.
2. Experimental Data in The Literature
Although there are not many reports
specifically investigating the maximum
toughness values of AISI 4140 steel in the
literature, data obtained from a number of
them provide sufficient knowledge about
the outcomes of different heat treatment
approaches. In this chapter, findings from
this literature search will be presented and
discussed.
Figure 7. Normalizing temperature range superimposed on the standard phase diagram of
steels [11].
Mustafa Melih Tecer / The International Journal of Materials and Engineering Technology 003 (2020) 131-149
139
As mentioned earlier, to obtain maximum
toughness values from a steel part
conventional normalizing, tempering and
quenching heat treatment processes are
usually applied. To investigate further,
Sanij, K. et. al. proposed a double
quenching and tempering procedure [12].
In their paper, effects of conventional
quenching and tempering (denoted as
CQT) and double quenching and tempering
(denoted as DQT) processes on 4140 steel
are evaluated. Heat treatment procedures
are given below [12]:
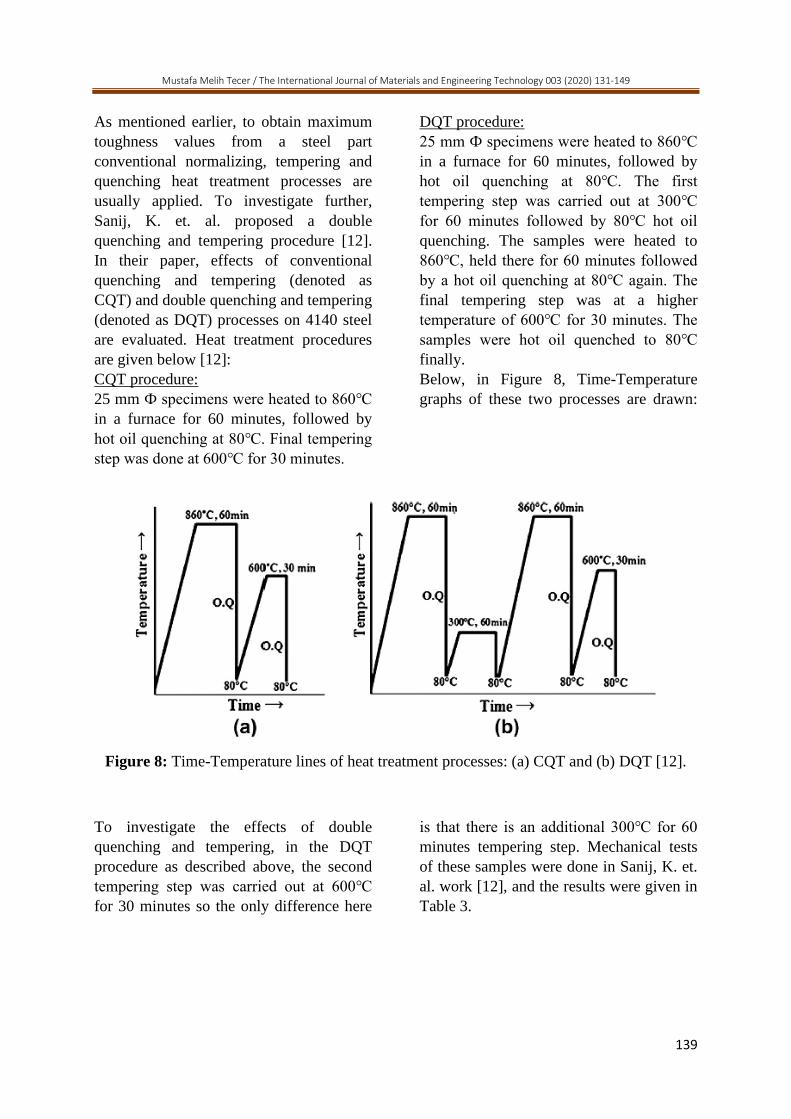
CQT procedure:
25 mm Ф specimens were heated to 860℃
in a furnace for 60 minutes, followed by
hot oil quenching at 80℃. Final tempering
step was done at 600℃ for 30 minutes.
DQT procedure:
25 mm Ф specimens were heated to 860℃
in a furnace for 60 minutes, followed by
hot oil quenching at 80℃. The first
tempering step was carried out at 300℃
for 60 minutes followed by 80℃ hot oil
quenching. The samples were heated to
860℃, held there for 60 minutes followed
by a hot oil quenching at 80℃ again. The
final tempering step was at a higher
temperature of 600℃ for 30 minutes. The
samples were hot oil quenched to 80℃
finally.
Below, in Figure 8, Time-Temperature
graphs of these two processes are drawn:
To investigate the effects of double
quenching and tempering, in the DQT
procedure as described above, the second
tempering step was carried out at 600℃
for 30 minutes so the only difference here
is that there is an additional 300℃ for 60
minutes tempering step. Mechanical tests
of these samples were done in Sanij, K. et.
al. work [12], and the results were given in
Table 3.
Figure 8: Time-Temperature lines of heat treatment processes: (a) CQT and (b) DQT [12].
Mustafa Melih Tecer / The International Journal of Materials and Engineering Technology 003 (2020) 131-149
140
Table 3. Variation in mechanical properties and prior austenite grain size as a function of heat
treatment processes [12].
Heat
Treatment
0.2%
yield
strength
(MPa)
Ultimate
tensile
strength
(MPa)
Elongation
(%)
Reduction
in area (%)
Impact
Energy
(J)
Hardness
(RC)
Grain
size
(µm)
CQT 975 1136 12.8 47 61 33 11.4
DQT 1000 1185 17 54 79 32.25 5.8
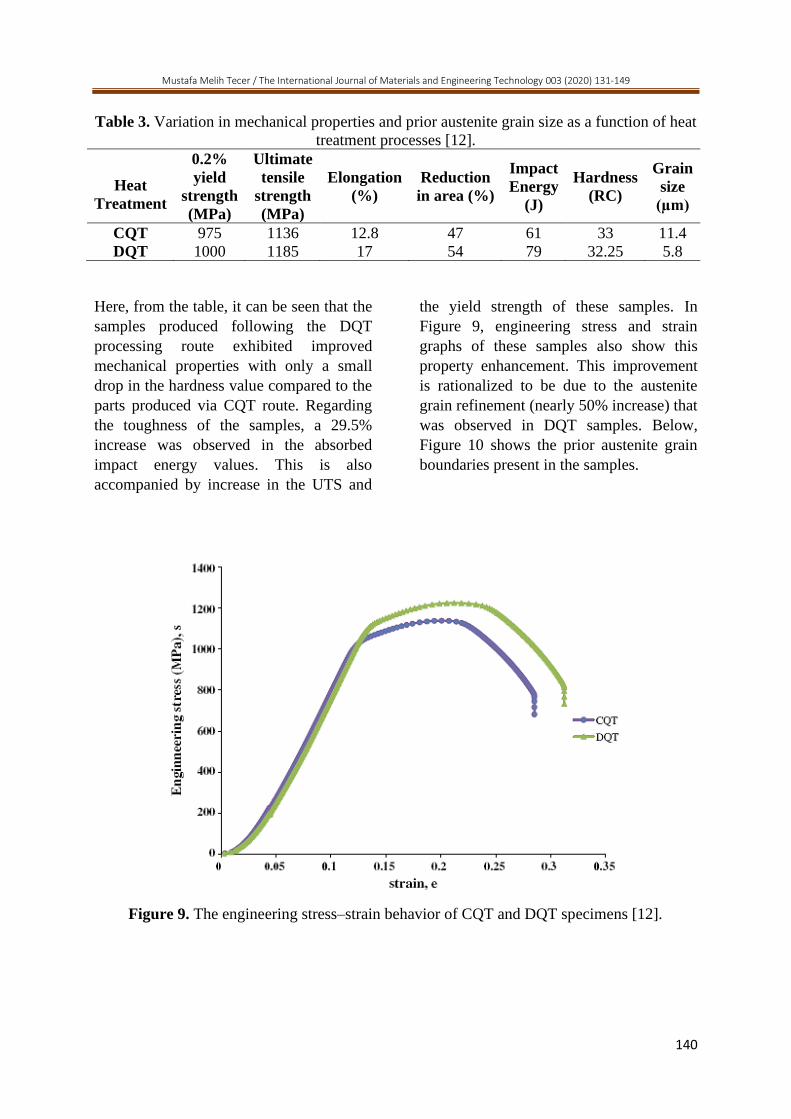
Here, from the table, it can be seen that the
samples produced following the DQT
processing route exhibited improved
mechanical properties with only a small
drop in the hardness value compared to the
parts produced via CQT route. Regarding
the toughness of the samples, a 29.5%
increase was observed in the absorbed
impact energy values. This is also
accompanied by increase in the UTS and
the yield strength of these samples. In
Figure 9, engineering stress and strain
graphs of these samples also show this
property enhancement. This improvement
is rationalized to be due to the austenite
grain refinement (nearly 50% increase) that
was observed in DQT samples. Below,
Figure 10 shows the prior austenite grain
boundaries present in the samples.
Figure 9. The engineering stress–strain behavior of CQT and DQT specimens [12].
Mustafa Melih Tecer / The International Journal of Materials and Engineering Technology 003 (2020) 131-149
141
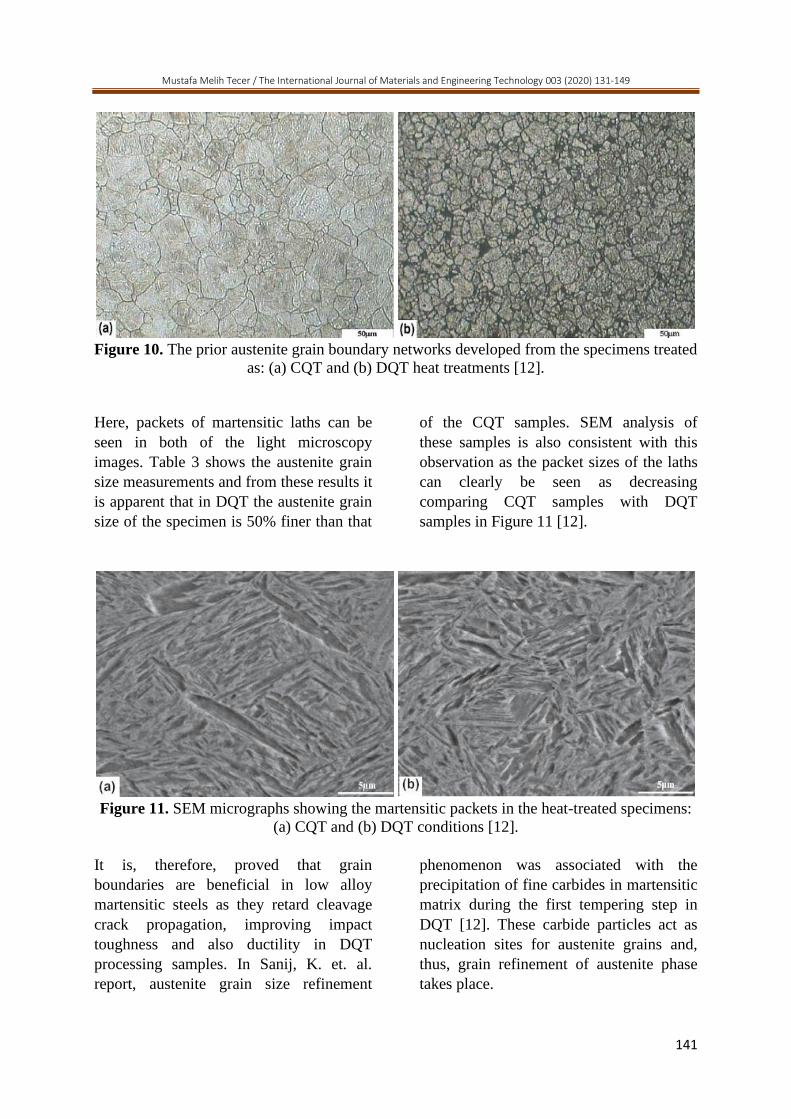
Figure 10. The prior austenite grain boundary networks developed from the specimens treated
as: (a) CQT and (b) DQT heat treatments [12].
Here, packets of martensitic laths can be
seen in both of the light microscopy
images. Table 3 shows the austenite grain
size measurements and from these results it
is apparent that in DQT the austenite grain
size of the specimen is 50% finer than that
of the CQT samples. SEM analysis of
these samples is also consistent with this
observation as the packet sizes of the laths
can clearly be seen as decreasing
comparing CQT samples with DQT
samples in Figure 11 [12].
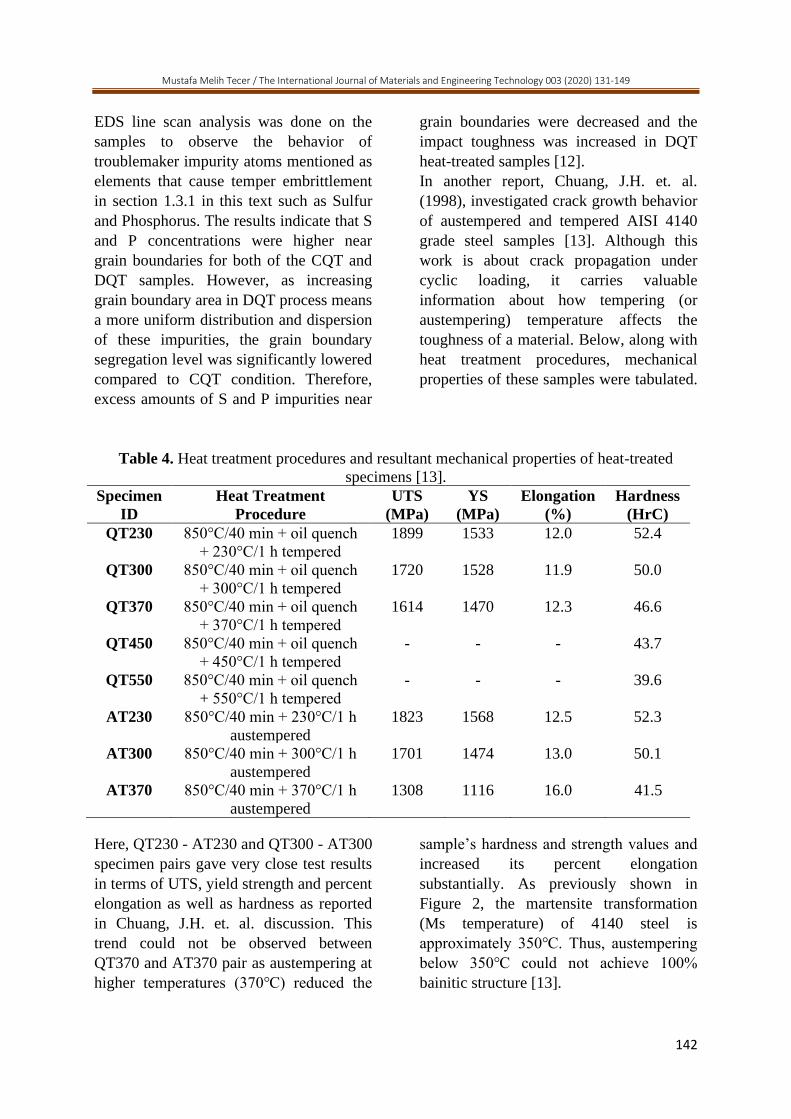
Figure 11. SEM micrographs showing the martensitic packets in the heat-treated specimens:
(a) CQT and (b) DQT conditions [12].
It is, therefore, proved that grain
boundaries are beneficial in low alloy
martensitic steels as they retard cleavage
crack propagation, improving impact
toughness and also ductility in DQT
processing samples. In Sanij, K. et. al.
report, austenite grain size refinement
phenomenon was associated with the
precipitation of fine carbides in martensitic
matrix during the first tempering step in
DQT [12]. These carbide particles act as
nucleation sites for austenite grains and,
thus, grain refinement of austenite phase
takes place.
Mustafa Melih Tecer / The International Journal of Materials and Engineering Technology 003 (2020) 131-149
142
EDS line scan analysis was done on the
samples to observe the behavior of
troublemaker impurity atoms mentioned as
elements that cause temper embrittlement
in section 1.3.1 in this text such as Sulfur
and Phosphorus. The results indicate that S
and P concentrations were higher near
grain boundaries for both of the CQT and
DQT samples. However, as increasing
grain boundary area in DQT process means
a more uniform distribution and dispersion
of these impurities, the grain boundary
segregation level was significantly lowered
compared to CQT condition. Therefore,
excess amounts of S and P impurities near
grain boundaries were decreased and the
impact toughness was increased in DQT
heat-treated samples [12].
In another report, Chuang, J.H. et. al.
(1998), investigated crack growth behavior
of austempered and tempered AISI 4140
grade steel samples [13]. Although this
work is about crack propagation under
cyclic loading, it carries valuable
information about how tempering (or
austempering) temperature affects the
toughness of a material. Below, along with
heat treatment procedures, mechanical
properties of these samples were tabulated.
Table 4. Heat treatment procedures and resultant mechanical properties of heat-treated
specimens [13].
Specimen
ID
Heat Treatment
Procedure
UTS
(MPa)
YS
(MPa)
Elongation
(%)
Hardness
(HrC)
QT230 850°C/40 min + oil quench
+ 230°C/1 h tempered
1899 1533 12.0 52.4
QT300 850°C/40 min + oil quench
+ 300°C/1 h tempered
1720 1528 11.9 50.0
QT370 850°C/40 min + oil quench
+ 370°C/1 h tempered
1614 1470 12.3 46.6
QT450 850°C/40 min + oil quench
+ 450°C/1 h tempered
- - - 43.7
QT550 850°C/40 min + oil quench
+ 550°C/1 h tempered
- - - 39.6
AT230 850°C/40 min + 230°C/1 h
austempered
1823 1568 12.5 52.3
AT300 850°C/40 min + 300°C/1 h
austempered
1701 1474 13.0 50.1
AT370 850°C/40 min + 370°C/1 h
austempered
1308 1116 16.0 41.5
Here, QT230 - AT230 and QT300 - AT300
specimen pairs gave very close test results
in terms of UTS, yield strength and percent
elongation as well as hardness as reported
in Chuang, J.H. et. al. discussion. This
trend could not be observed between
QT370 and AT370 pair as austempering at
higher temperatures (370℃) reduced the
sample’s hardness and strength values and
increased its percent elongation
substantially. As previously shown in
Figure 2, the martensite transformation
(Ms temperature) of 4140 steel is
approximately 350℃. Thus, austempering
below 350℃ could not achieve 100%
bainitic structure [13].
Mustafa Melih Tecer / The International Journal of Materials and Engineering Technology 003 (2020) 131-149
143
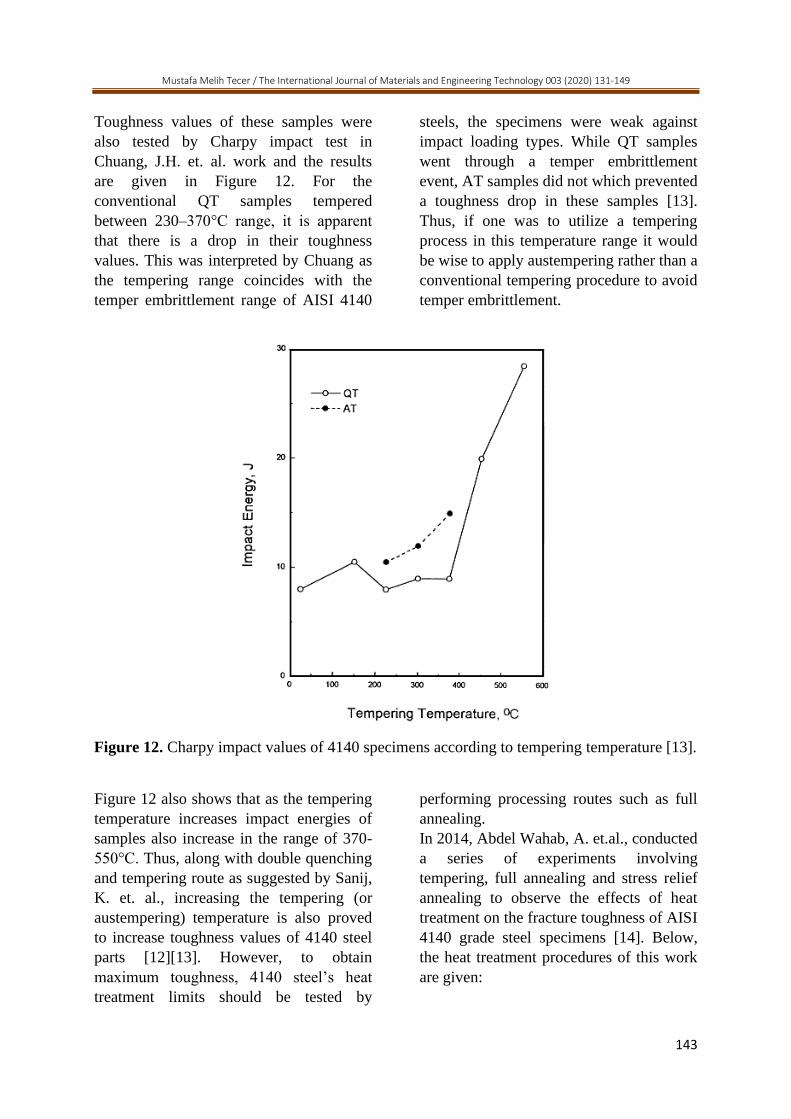
Toughness values of these samples were
also tested by Charpy impact test in
Chuang, J.H. et. al. work and the results
are given in Figure 12. For the
conventional QT samples tempered
between 230–370°C range, it is apparent
that there is a drop in their toughness
values. This was interpreted by Chuang as
the tempering range coincides with the
temper embrittlement range of AISI 4140
steels, the specimens were weak against
impact loading types. While QT samples
went through a temper embrittlement
event, AT samples did not which prevented
a toughness drop in these samples [13].
Thus, if one was to utilize a tempering
process in this temperature range it would
be wise to apply austempering rather than a
conventional tempering procedure to avoid
temper embrittlement.
Figure 12 also shows that as the tempering
temperature increases impact energies of
samples also increase in the range of 370-
550°C. Thus, along with double quenching
and tempering route as suggested by Sanij,
K. et. al., increasing the tempering (or
austempering) temperature is also proved
to increase toughness values of 4140 steel
parts [12][13]. However, to obtain
maximum toughness, 4140 steel’s heat
treatment limits should be tested by
performing processing routes such as full
annealing.
In 2014, Abdel Wahab, A. et.al., conducted
a series of experiments involving
tempering, full annealing and stress relief
annealing to observe the effects of heat
treatment on the fracture toughness of AISI
4140 grade steel specimens [14]. Below,
the heat treatment procedures of this work
are given:
Figure 12. Charpy impact values of 4140 specimens according to tempering temperature [13].
Mustafa Melih Tecer / The International Journal of Materials and Engineering Technology 003 (2020) 131-149
144
• A: Stress relief at 500, 600 and
660℃ for 30 minutes; air cooling.
• B: Full annealing at 800, 860 and
900℃ for 30 minutes; furnace
cooling.
• C: Austenitizing at 850-870℃ for
30 minutes followed by oil
quenching; tempering at 200, 370
and 540℃ for 1 hour; air cooling.
Heat treated specimens were tested only by
tensile testing and their fracture toughness
values were calculated from these results
employing a semi-empirical relationship
developed by Hahn-Rosenfield. The
equation was given as:
𝐾𝐼𝐶 = √0.05
3𝐸𝜎𝑌𝑆𝜖𝐹𝑛2 (1)
where E is the modulus of elasticity, 𝜎𝑌𝑆 is
the yield stress, 𝜖𝐹 is true strain at fracture
of a smooth tensile bar and n is the strain
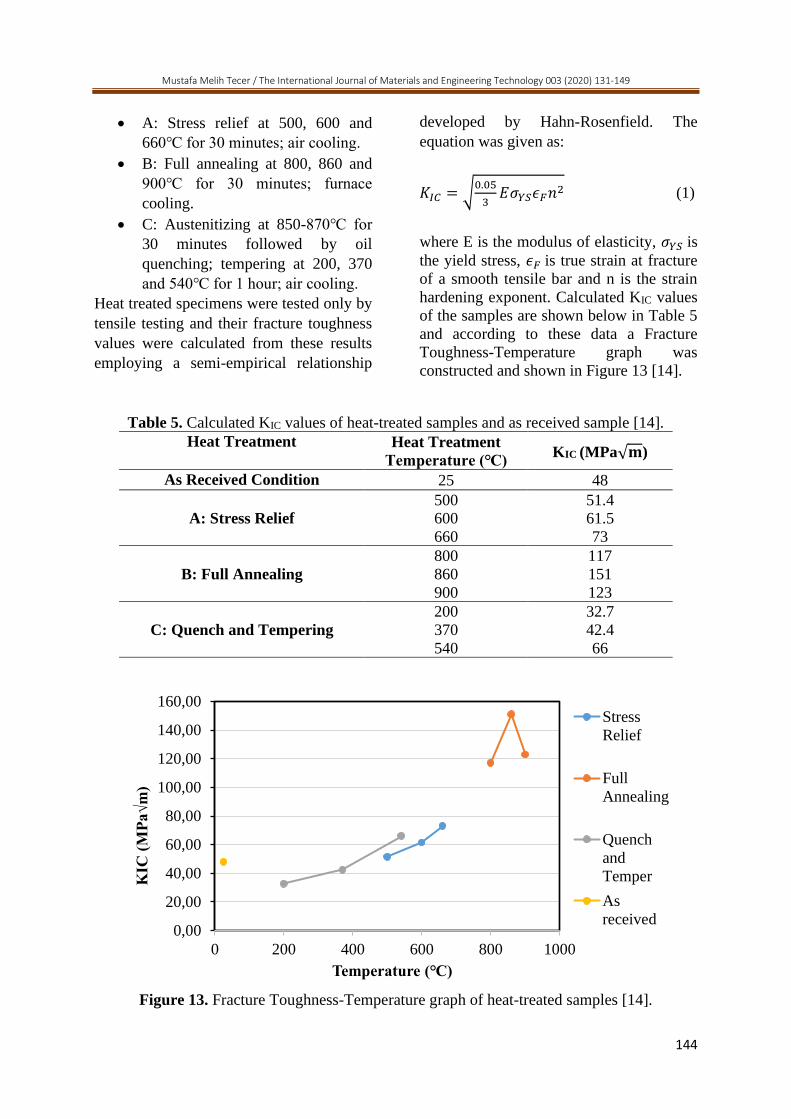
hardening exponent. Calculated KIC values
of the samples are shown below in Table 5
and according to these data a Fracture
Toughness-Temperature graph was
constructed and shown in Figure 13 [14].
Table 5. Calculated KIC values of heat-treated samples and as received sample [14].
Heat Treatment Heat Treatment
Temperature (℃) KIC (MPa√𝐦)
As Received Condition 25 48
A: Stress Relief
500 51.4
600 61.5
660 73
B: Full Annealing
800 117
860 151
900 123
C: Quench and Tempering
200 32.7
370 42.4
540 66
Figure 13. Fracture Toughness-Temperature graph of heat-treated samples [14].
0,00
20,00
40,00
60,00
80,00
100,00
120,00
140,00
160,00
0 200 400 600 800 1000
KIC
(M
Pa√
m)
Temperature (℃)
Stress
Relief
Full
Annealing
Quench
and
Temper
As
received
Mustafa Melih Tecer / The International Journal of Materials and Engineering Technology 003 (2020) 131-149
145
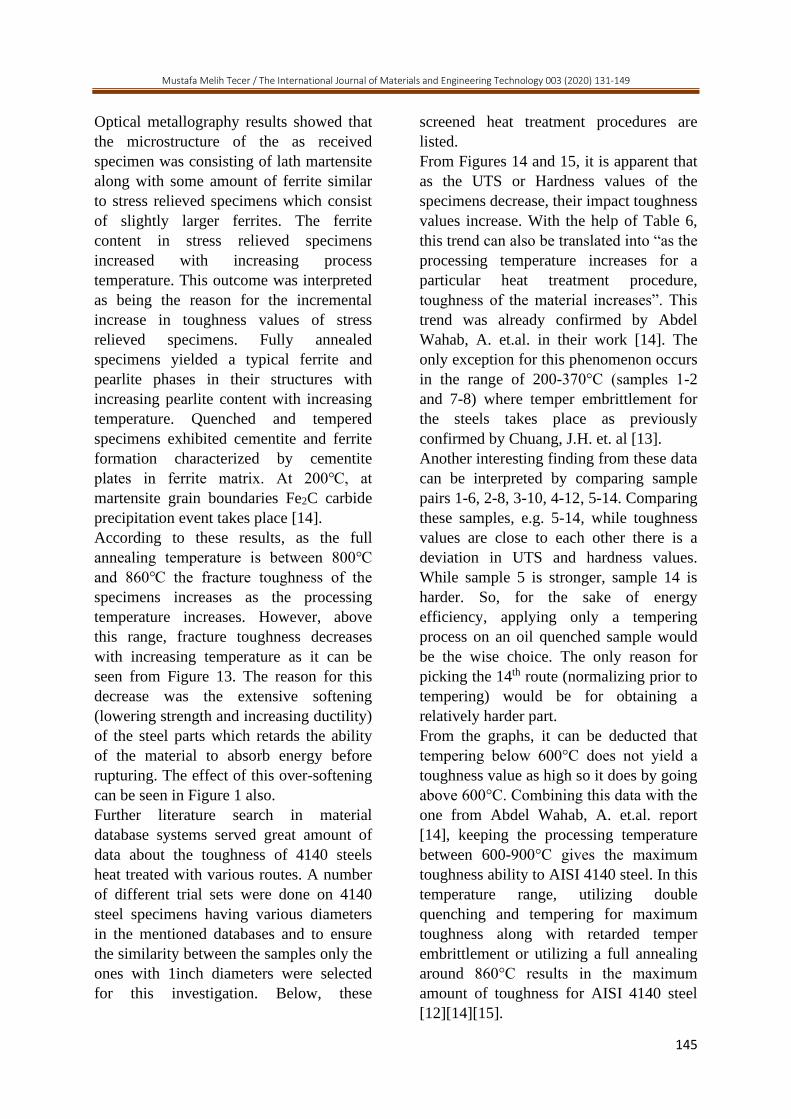
Optical metallography results showed that
the microstructure of the as received
specimen was consisting of lath martensite
along with some amount of ferrite similar
to stress relieved specimens which consist
of slightly larger ferrites. The ferrite
content in stress relieved specimens
increased with increasing process
temperature. This outcome was interpreted
as being the reason for the incremental
increase in toughness values of stress
relieved specimens. Fully annealed
specimens yielded a typical ferrite and
pearlite phases in their structures with
increasing pearlite content with increasing
temperature. Quenched and tempered
specimens exhibited cementite and ferrite
formation characterized by cementite
plates in ferrite matrix. At 200℃, at
martensite grain boundaries Fe2C carbide
precipitation event takes place [14].
According to these results, as the full
annealing temperature is between 800℃
and 860℃ the fracture toughness of the
specimens increases as the processing
temperature increases. However, above
this range, fracture toughness decreases
with increasing temperature as it can be
seen from Figure 13. The reason for this
decrease was the extensive softening
(lowering strength and increasing ductility)
of the steel parts which retards the ability
of the material to absorb energy before
rupturing. The effect of this over-softening
can be seen in Figure 1 also.
Further literature search in material
database systems served great amount of
data about the toughness of 4140 steels
heat treated with various routes. A number
of different trial sets were done on 4140
steel specimens having various diameters
in the mentioned databases and to ensure
the similarity between the samples only the
ones with 1inch diameters were selected
for this investigation. Below, these
screened heat treatment procedures are
listed.
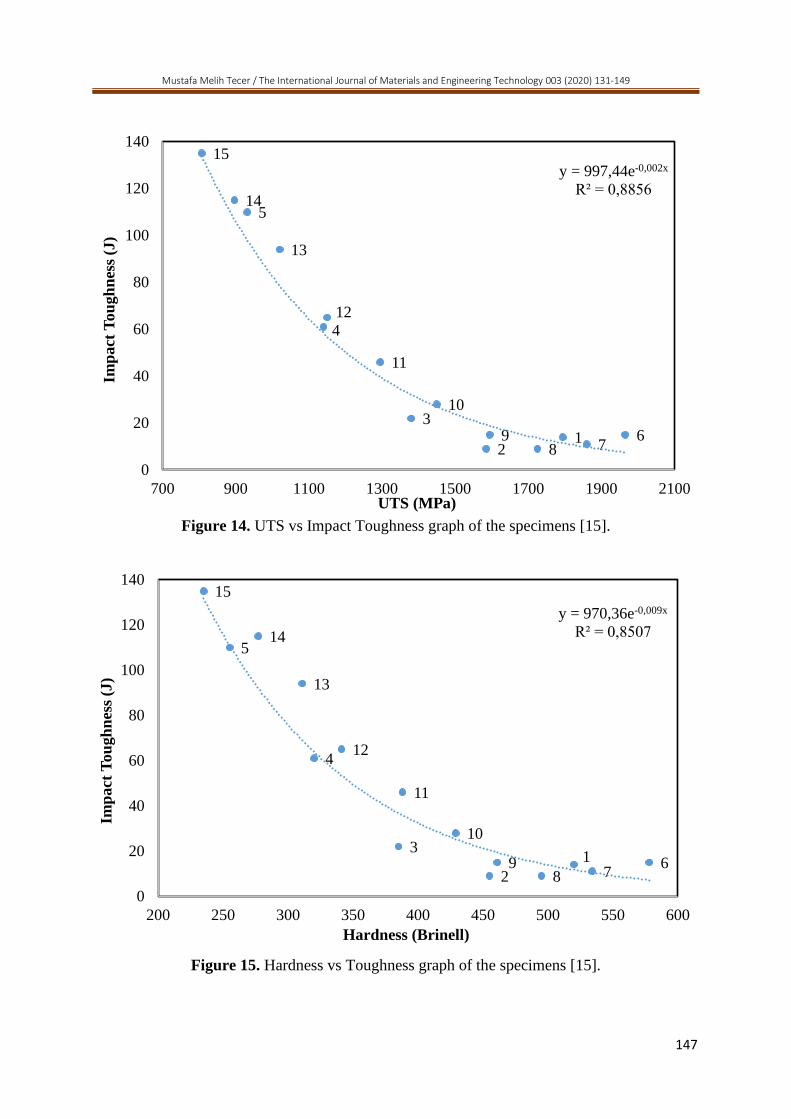
From Figures 14 and 15, it is apparent that
as the UTS or Hardness values of the
specimens decrease, their impact toughness
values increase. With the help of Table 6,
this trend can also be translated into “as the
processing temperature increases for a
particular heat treatment procedure,
toughness of the material increases”. This
trend was already confirmed by Abdel
Wahab, A. et.al. in their work [14]. The
only exception for this phenomenon occurs
in the range of 200-370°C (samples 1-2
and 7-8) where temper embrittlement for
the steels takes place as previously
confirmed by Chuang, J.H. et. al [13].
Another interesting finding from these data
can be interpreted by comparing sample
pairs 1-6, 2-8, 3-10, 4-12, 5-14. Comparing
these samples, e.g. 5-14, while toughness
values are close to each other there is a
deviation in UTS and hardness values.
While sample 5 is stronger, sample 14 is
harder. So, for the sake of energy
efficiency, applying only a tempering
process on an oil quenched sample would
be the wise choice. The only reason for
picking the 14th route (normalizing prior to
tempering) would be for obtaining a
relatively harder part.
From the graphs, it can be deducted that
tempering below 600°C does not yield a
toughness value as high so it does by going
above 600°C. Combining this data with the
one from Abdel Wahab, A. et.al. report
[14], keeping the processing temperature
between 600-900°C gives the maximum
toughness ability to AISI 4140 steel. In this
temperature range, utilizing double
quenching and tempering for maximum
toughness along with retarded temper
embrittlement or utilizing a full annealing
around 860°C results in the maximum
amount of toughness for AISI 4140 steel
[12][14][15].
Mustafa Melih Tecer / The International Journal of Materials and Engineering Technology 003 (2020) 131-149
146
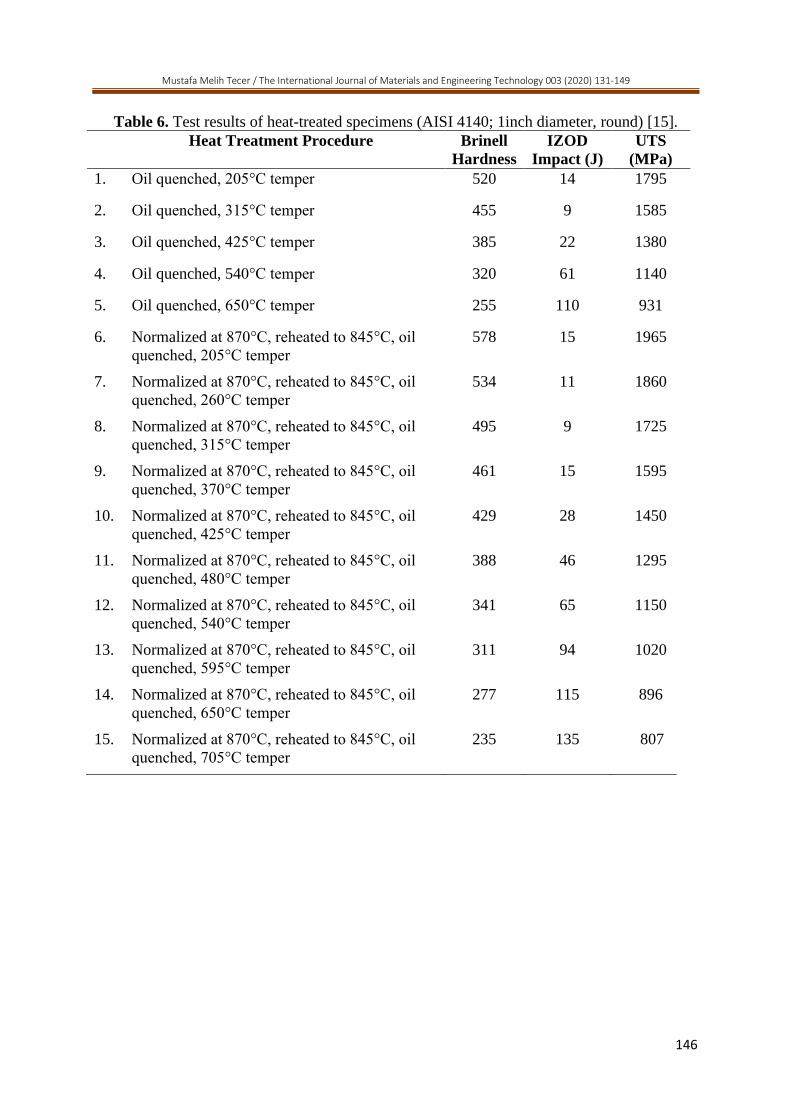
Table 6. Test results of heat-treated specimens (AISI 4140; 1inch diameter, round) [15].
Heat Treatment Procedure Brinell
Hardness
IZOD
Impact (J)
UTS
(MPa)
1. Oil quenched, 205°C temper 520 14 1795
2. Oil quenched, 315°C temper 455 9 1585
3. Oil quenched, 425°C temper 385 22 1380
4. Oil quenched, 540°C temper 320 61 1140
5. Oil quenched, 650°C temper 255 110 931
6. Normalized at 870°C, reheated to 845°C, oil
quenched, 205°C temper
578 15 1965
7. Normalized at 870°C, reheated to 845°C, oil
quenched, 260°C temper
534 11 1860
8. Normalized at 870°C, reheated to 845°C, oil
quenched, 315°C temper
495 9 1725
9. Normalized at 870°C, reheated to 845°C, oil
quenched, 370°C temper
461 15 1595
10. Normalized at 870°C, reheated to 845°C, oil
quenched, 425°C temper
429 28 1450
11. Normalized at 870°C, reheated to 845°C, oil
quenched, 480°C temper
388 46 1295
12. Normalized at 870°C, reheated to 845°C, oil
quenched, 540°C temper
341 65 1150
13. Normalized at 870°C, reheated to 845°C, oil
quenched, 595°C temper
311 94 1020
14. Normalized at 870°C, reheated to 845°C, oil
quenched, 650°C temper
277 115 896
15. Normalized at 870°C, reheated to 845°C, oil
quenched, 705°C temper
235 135 807
Mustafa Melih Tecer / The International Journal of Materials and Engineering Technology 003 (2020) 131-149
147
Figure 14. UTS vs Impact Toughness graph of the specimens [15].
Figure 15. Hardness vs Toughness graph of the specimens [15].
1
2
3
4
5
678
9
10
11
12
13
14
15
y = 970,36e-0,009x
R² = 0,8507
0
20
40
60
80
100
120
140
200 250 300 350 400 450 500 550 600
Imp
act
Tou
gh
nes
s (J
)
Hardness (Brinell)
12
3
4
5
678
9
10
11
12
13
14
15y = 997,44e-0,002x
R² = 0,8856
0
20
40
60
80
100
120
140
700 900 1100 1300 1500 1700 1900 2100
Imp
act
Tou
gh
nes
s (J
)
UTS (MPa)
Mustafa Melih Tecer / The International Journal of Materials and Engineering Technology 003 (2020) 131-149
148
3. Conclusion & Procedure Proposal to
Achieve Maximum Toughness
In this writing, a number of reports were
investigated to observe and compare the
effects of various heat treatment
procedures on toughness of commercially
available AISI 4140 low alloy steel. In
Sanij, K. et. al. study, double quenching
and tempering technique was found to be
improving the materials toughness by
29.5% compared to conventional
quenching and tempering process [12]. In
Chuang, J.H. et. al. work, increasing
tempering temperature and employing
austempering process were found to be
beneficial in order to increase toughness
and decrease temper embrittlement [13]. In
Abdel Wahab, A. et.al. report, increasing
processing temperature was once again
proved to be beneficial up to a point.
Especially in full annealing heat treatment
process the test samples yielded the highest
toughness values when treated in the range
of 800-870℃. However, going above this
range, due to over softening, resulted in a
decrease in the toughness of the samples
[14]. The data obtained from a materials
properties database showed that there is no
significant toughness change between
applying a normalizing step prior to
tempering and utilizing only a tempering
process on an as received specimen (when
the tempering temperatures are the same)
[15]. While making these points, an effort
has been put into keeping all the variables
affecting the results constant other than
heat treatment procedures for the purpose
of observing only the effects of these
procedures. Double quenching and
tempering in the range of 600-900℃ as
well as full annealing at around 860℃
were found to be resulting with the highest
toughness values.
In this text, combining all the reports
investigated, a proposal can be made by
employing the maximum toughness
approach: Double quenching and
tempering process with an increased
secondary temper temperature alongside
with a decreased tempering time. As
mentioned earlier, double quenching and
tempering method proved itself in
increasing toughness and decreasing the
susceptibility to temper embrittlement by
grain refinement mechanism. Increasing
the second tempering step’s holding
temperature may increase the toughness
even more by increasing ductility as
observed in both Abdel Wahab, A. et.al.
work, in Chuang, J.H. et. al. report and in
the data obtained from the material
database. However, the working principle
of this double quenching and tempering
process is based on the grain refinement
event and this would be inhibited by the
increase in temperature as the rate of grain
growth increases. Additionally, the
mobility of the impurities would increase
and their segregation to grain boundaries
would be faster/easier. These two negative
effects of increasing tempering
temperature may be avoided by decreasing
the holding time without affecting this
step’s advantages because as it was already
mentioned in Chapter 1.3.1., in tempering,
holding temperature is much more critical
than holding time. Thus, while ductility
increases as a result of the higher holding
temperature, there is no sufficient time for
excessive grain growth and impurity
segregation to the grain boundaries. As a
result, the toughness increases without
promoting temper embrittlement or
excessive grain growth. To see if this
proposed method would yield higher
toughness values than full annealing at
around 860℃, however, a series of
experiments should be done with varying
second temper holding temperature and
time.
Mustafa Melih Tecer / The International Journal of Materials and Engineering Technology 003 (2020) 131-149
149
References
1. Toughness. (n.d.). NDT Resource
Center. Retrieved June 25, 2020,
from https://www.nde-ed.org/
2. ASTM Standard A29/A29M.
Standard Specification for General
Requirements for Steel Bars, Carbon
and Alloy, Hot-Wrought. s.l.: ASTM
International, 2017.
3. 4140HW Alloy Steel Technical Data.
(2015, April). Retrieved April 25,
2020. Timken Steel.
http://www.timkensteel.com/~/media
/4140HW_Brochure_July2015_Upda
te
4. AZoM. (2019, December 18). AISI
4140 Alloy Steel (UNS G41400).
https://www.azom.com/article.aspx?
ArticleID=6769
5. Lu, Y. (2017). Heat Transfer,
Hardenability and Steel Phase
Transformations during Gas
Quenching. Retrieved from
https://digitalcommons.wpi.edu/etd-
dissertations/399
6. McPherson, O. (2008, April). Grain
Growth in AISI 4140. Worcester
Polytechnic Institute.
https://digitalcommons.wpi.edu/mqp-
all/832/
7. Temper Embrittlement. (2003, May).
Retrieved June 25, 2020. Total
Materia.
https://www.totalmateria.com/page.a
spx?ID=CheckArticle&site=kts&N
M=102
8. Liu, B., Qin, T., Xu, W., Jia, C., Wu,
Q., Chen, M., & Liu, Z. (2019).
Effect of Tempering Conditions on
Secondary Hardening of Carbides
and Retained Austenite in Spray-
Formed M42 High-Speed Steel.
Materials (Basel, Switzerland),
12(22), 3714.
9. One Minute Mentor: Secondary
Hardening in Tool Steels - Heat
Treating Society. (2016, January 22).
Retrieved June 25, 2020. ASM
International Heat Treating Society.
https://www.asminternational.org
10. R., Habarakada H. M. Martempering
and Austempering of Steel. 2007.
060150L.
11. Herring, D. H. (2012, November 6).
The Importance of Normalizing.
Forge Magazine.
https://www.forgemag.com/articles/8
3798-the-importance-of-normalizing
12. M.H. Khani Sanij, S.S. Ghasemi
Banadkouki, A.R. Mashreghi, M.
Moshrefifar. The effect of single and
double quenching and tempering heat
treatments on the microstructure and
mechanical properties of AISI 4140
steel, Materials & Design, Volume
42, 2012, Pages 339-346.
13. J.H Chuang, L.W Tsay, C. Chen.
Crack growth behaviour of heat-
treated 4140 steel in air and gaseous
hydrogen. International Journal of
Fatigue, Volume 20, Issue 7, 1998,
Pages 531-536,
14. Abdel Wahab, Alaa, El-Guishi
Mokhtar and Mazen, Asaad. Effect
of Heat Treatment on the Fracture
Toughness of AISI 4140 Steel.
Department of Production
Engineering & Design Faculty of
Engineering, Minia University. s.l.:
Minia Journal of Engineering and
Technology, 2014.
15. MatWeb Database. MatWeb 4140
Property Database. MatWeb Material
Property Data.