Embed Size (px)
Citation preview
EFFECTS OF VARIETAL DIFFERENCES, PLANT SPACING AND
WEEDING REGIMES ON WEED DENSITY AND YIELDS OF UPLAND
RICE IN UGANDA
By
Anyang Robert Tabot (HND, PGD.)
A144/22358/2011
A Thesis Submitted in Partial Fulfillment of the Requirements for the Award
of Degree of Master of Science (Agronomy) in the School of Agriculture and
Enterprise Development, Kenyatta University.
FEBRUARY, 2015
ii
DECLARATION
I, Anyang Robert Tabot declare that this thesis is my original work and
has not been presented for award of a degree in any other university or any other
award.
Name: Anyang Robert Tabot
Reg. No.: A144/22358/2011
Signature: ………………………
Date: ……………………….
Supervisors’ Approval
We confirm that the work reported in this thesis was carried out by the
candidate under our supervision and has been submitted with our approval as
university supervisors.
Dr. Joseph Onyango Gweyi, Department of Agricultural Science and
Technology, Kenyatta University
Signature ………………………… Date …………………….
Dr. Wilson Thagana, Department of Agricultural Science and Technology,
Kenyatta University
Signature ………………………… Date …………………….

iii
DEDICATION
This project is dedicated to smallholder rice farmers in the world trying to make a
living and to my Late Father Pa Abel Anyang alias “Abelity” that believed
nothing is never too late to achieve or do as long as you focus and believe in the
Almighty God.

iv
ACKNOWLEDGEMENT
First of all, I would like to thank the Almighty God for giving me the
aptitude, endurance, determination and guidance throughout the ups and downs of
life. With your light, I saw my way!
Several people have assisted me during my research work. Although it is
not possible to mention all in a few sentences I would like to thank those who
have been particularly important to my work. I feel great pleasure to express my
special thanks to my supervisors, Dr. Joseph Onyango Gweyi and Dr. Wilson
Thagana, of the Department of Agricultural Science and Technology, for their
critical and valuable comments in the course of this study. Their insightful
comments for the betterment of the whole work were appreciable. Without
unlimited support and guidance of my supervisors throughout the research work,
this thesis would not be in this format.
I would also want to acknowledge the support of Mr. Michael Dondi and
the teaching staff of postgraduate school of agriculture and enterprise
development for the valuable training, support and encouragement towards my
studies
My particular gratitude goes to the Mukono Agricultural Research
(MUZARDI ) for providing research site and staff to assist in decoding weeds
species and data collection especially to Assistant Station Manager, Mr.
Sentogo, for overseeing the trial site in Mukono on my behalf.

v
My great appreciation also goes to the Amuru district farmers association
and especially Mr. Kolo Emanuel from Amuru district farmers Association for
providing me necessary information, coordination of the visits to farmers and
assistance in primary data collection. Finally, I extend my sincere thanks to host
farmer in the Pabbo parish sites for his fruitful cooperation.
I also would like to thank my wife, Adenike Olufunmilayo, for the
emotional, physical and spiritually support. Thank you for believing in me.
My sincere thanks also go to my colleagues from Kenyatta University
(James, Awa, Faith, Peter and Tom) for the good time we had during our class
and field work. Both the academic and non-academic discussions we had are very
important for me. Thank you for your understanding and friendliness.
May the Almighty Father bless you all in abundance.
vi
Table of Contents
DECLARATION ..................................................................................................... ii
DEDICATION ....................................................................................................... iii
ACKNOWLEDGEMENT ...................................................................................... iv
LIST OF TABLES .................................................................................................. xi
LIST OF FIGURES ............................................................................................... xii
ABBREVIATIONS AND ACRONYMS .............................................................. xv
ABSTRACT .......................................................................................................... xvi
CHAPTER ONE: INTRODUCTION ...................................................................... 1
1.1 Background to the study ................................................................................... 1
1.2 Statement of the Problem .................................................................................. 8
1.3 Significance of the Study ................................................................................ 10
1.4 Objectives of the Study ................................................................................... 11
1.4.1 General objectives ........................................................................................ 11
1.4.2 Specific objectives ....................................................................................... 11
1.5 Hypotheses. ..................................................................................................... 12
1.6 Conceptual and theoretical Framework .......................................................... 12
CHAPTER TWO: LITERATURE REVIEW ........................................................ 16
2.1 Introduction ..................................................................................................... 16
2.2 Rice Production in Uganda ............................................................................. 19
2.3 Rice Varietal Development for Improved Weed Control ............................... 21
2.4 Weeding Regimes and Rice Performance ....................................................... 25
2.5 Effects of Spacing and Weeds Management on Rice Crop Yield .................. 27
2.5. 1 Influence of seed rate on weeds control in rice ........................................... 27
2.5.2 Influence of plant spacing on weeds control in rice .................................... 29
CHAPTER THREE: MATERIALS AND METHODS ........................................ 31
3.1 Description of Locations ................................................................................. 31
vii
3.1.1 Mukono Zonal Agricultural Research and Development Institute (Mukono
ZARDI) ................................................................................................................. 31
3.1.2 Amuru District ............................................................................................. 31
3.2 Experimental Design and Field Layout .......................................................... 32
3.3 Plot Layout ...................................................................................................... 33
3.4 Plot Layout Description .................................................................................. 33
3.4 Field Establishment and management Practices ............................................. 34
3.4.1 Seedbed preparation and agronomic practices ............................................. 34
3.4.2 Fertilizer application .................................................................................... 35
3.5 Parameters Determined and Procedure ........................................................... 35
3.6 Tiller Counts ................................................................................................... 36
3.7 Plant Height and Growth Pattern .................................................................... 36
3.6 Leaf Area Index (LAI) .................................................................................... 36
3.7 Weed Species Identification ........................................................................... 37
3.8 Weed Dry Matter Determination .................................................................... 37
3.9 Yield and Yield Components of NERICA rice............................................... 38
3.10 Relative Yield Loss (RYL) ........................................................................... 38
3.11 Data Analysis ................................................................................................ 38
CHAPTER FOUR: RESULTS AND DISCUSSION ............................................ 40
4.1 Composition and dominance of weed flora .................................................... 40
4.2 Weed Density .................................................................................................. 43
4.2.1 Effect of weed control regimes on weed biomass ....................................... 43
4.2.2 Effect of Spacing on Weed Biomass ........................................................... 45
4.2.3 Effect of Variety on Weed Biomass ............................................................ 47
viii
4.3 Interaction Effect of Variety and Weeding Regime on Weed Biomass ......... 50
4.4 Interaction Effect of Variety and Different Spacing on Weed Biomass ......... 53
4.5 Combined effects of rice varieties, weeding regime and spacing on weed
biomass ................................................................................................................. 55
4.6 Plant Height .................................................................................................... 61
4.6.1 Effect of Weeding Regimes on Plant Height ............................................... 61
4.6. 2 Variety and Weeding Regime Interactions on Plant Height ....................... 63
4.6.3 Effect of Spacing on Plant Height ............................................................... 63
4.6.4 Influence of Variety and Spacing on Plant Height ...................................... 65
4.7 Interaction effects of variety, spacing and weeding regime on Plant Height . 65
4.8 Tillering........................................................................................................... 68
4.8.1 Effects of Weeding Regime on Tillering ..................................................... 68
4.8.2 Influence of Variety and Weeding Regime on Tillers/m2 ........................... 70
4.8.3 Effects of Spacing on Tillering .................................................................... 70
4.8.4 Effect of variety on number of Tillers per m2 .............................................. 72
4.8.5 Interaction effect of variety and spacing on Tillers/m2 ................................ 73
4.9 Interaction effects of varietal, spacing and weeding Regime on Tiller/m2 ..... 74
4.10 Panicle per Square Meter ............................................................................ 80
4.10.1 Effects of Weeding Regime on Number of Panicle/ m2 ............................ 80
4.10.2 Influence of Variety and Weeding Regime on Number of Panicle/m2 .. 81
4.10.3 Effects of Spacing on Number of Panicle/ M2 ........................................... 82
4.10.4 Effect of Variety on Number of Panicle per Square Meter ....................... 83
4.10.5 Influence of Variety and Spacing on Number of Panicle /m2 .................... 84
ix
4.11 Interaction effect of Spacing, Weeding and Variety on Number of Panicle
/m2 ......................................................................................................................... 86
4.12 Panicle Length .............................................................................................. 88
4.12.1 Effect of Weeding Regime on Panicle Length .......................................... 88
4.12.2 Effect of Spacing on Panicle Length ......................................................... 88
4.12.3 Effect of Variety on Panicle Length (CM) ................................................ 90
4.12.4 Influence of Variety and Weeding Regime on Panicle Length (CM) ....... 90
4.12.6 Influence of Variety and Spacing on Panicle Length (cm) ........................ 92
4.13 Combined Effects of Varietal, Spacing and Weeding Regimes on Panicles
Length (cm) ........................................................................................................... 92
4. 14 Leaf Area Index ........................................................................................... 94
4.14.1 Effect of weed control, spacing and Variety on leaf area index ................ 94
4.14.2 Combined effect of Variety, spacing and weeding regime on Leaf Area
Index ..................................................................................................................... 94
4.15 Yield and Yield Components ........................................................................ 97
4.15.1 Effect of Weeding Regimes on Number of Grains per Panicle ................. 97
4.15.2 Influence of Variety and Weeding on Number of Grains per Panicle ....... 97
4.15.3 Effect of Spacing on Number of Grains per Panicle ................................ 100
4.15.3 Influence of variety and spacing on number of grains per panicle .......... 100
4.15. 4 Effect of variety on number of grains per panicle .................................. 100
4.16 Combined effect of spacing, weeding and variety on number grains per
panicle ................................................................................................................. 101
4.17 Effect of Weeding Regime on Weight of 1000 Grains ............................... 104
4.17.1 Effect of Spacing on Weight of 1000 Grains ........................................... 104
x
4.17.2 Effect of Variety on Weight of 1000 Grains ............................................ 104
4.18 Grain Yield .................................................................................................. 105
4.18.1 Effect of Weed Regime on Grain Yield of Rice (Kg/ha) ......................... 105
4.18.2 Influence of Variety and Weeding Regime on Grain Yield of Rice ........ 105
4.18.3 Effect of Variety on Grain Yield of Rice ................................................. 106
4.18.4 Effect of Spacing on Grain Yield of Rice ................................................ 107
4.18.4 Influence of Variety and Spacing on Grain Yield of Rice ....................... 107
4.18.5 Combined effect of varietal, different spacing and weeding regimes on
grain yield. 109
4.19 Relative Yield Loss (RYL) ......................................................................... 114
4.20 Straw Yield ................................................................................................. 115
4.20.1 Effect of weed control on straw yield of rice ........................................... 115
4.20.2 Effect of Different Spacing on Straw Yield of Rice ................................ 116
4.20.3 Effect of Variety on Straw Yield of Rice ................................................. 116
4.20.4 Influence of Variety and Spacing on Straw Yield of Rice ....................... 116
4.20.4 Effects of Variety, Spacing Differences and Weeding Regime of Rice
Straw Yield ......................................................................................................... 118
CHAPTER FIVE: CONCLUSION AND RECOMMENDATIONS .................. 120
6.1 Recommendation .......................................................................................... 121
REFERENCES .................................................................................................... 123
xi
LIST OF TABLES
TABLE 1.0: The experimental treatments showing main plot, subplot and sub-
sub plot arrangements ................................................................................... 34
TABLE 2.1: Characteristics of upland rice varieties used for trials ..................... 35
TABLE 3.2: Interaction effect of varietal, spacing and weeding regime on yield
and yield components of rice in amuru and mukono .................................... 58
TABLE 4.4: Combined effects of rice varieties, weeding regimes and spacing on
weed control efficiency in two locations (amuru and mukono districts) ...... 60
TABLE 4.5: Effects of spacing, varietal influence and weeding on yield
parameters measured amuru and mukono ..................................................... 89
TABLE 4.6 Interaction effect of variety and spacing on yield and yield
contributing characters of rice in amuru and mukono ................................ 91
TABLE 4.7: Effect of varietal, different spacing and weeding regimes on average
leaf area index across two sites (amuru and mukono) .................................. 96
TABLE 4.8: Interaction effect of variety and weeding regime on yield and yield
contributing characters of rice in amuru and mukono ................................ 99
xii
LIST OF FIGURES
FIGURE 1.1: Conceptual framework ................................................................... 15
FIGURE 3.1: Location of experimental sites ....................................................... 32
FIGURE 4.1: Effects of weed control regimes on weed biomass/m2 in amuru and
mukono sites ................................................................................................. 44
FIGURE 4.2: Effects of different spacing on weed biomass/m2 at amuru and
mukono sites ................................................................................................. 46
FIGURE 4.3: Effect of variety on weed biomass in two different locations of
amuru and mukono ....................................................................................... 48
FIGURE 4.4 A: Influence of weeding regime and variety on weed biomass/m2 in
rice grown at amuru site ................................................................................ 51
FIGURE 4.4 B. Influence of weeding regime and variety on weed biomass/m2 in
rice: mukono ................................................................................................. 51
FIGURE 4.5 A: Influence of different spacing and variety on weed biomass/m2 in
rice: amuru .................................................................................................... 54
FIGURE 4.5 B. Influence of different spacing and variety on weed biomass/m2 in
rice: mukono ................................................................................................. 54
FIGURE 4.5 A: Effects of weeding regimes on plant height at amuru site .......... 62
FIGURE 4.6 B: Effects of weeding regimes on plant height at mukono site ....... 62
FIGURE 4.7 A: Effect of spacing on plant height in amuru site. ........................ 64
FIGURE 4.7 B: Effect of spacing on plant height in mukono site ....................... 64

xiii
FIGURE 4.8: Effect of weeding regimes on number of tillers/plant ................... 69
FIGURE 4.9 Influence of variety and weeding regime on tillers/m2 ................... 70
FIGURE 4.10: Effect of spacing on rice tillering ability in amuru and mukono
respectively at 25das, 40 das and 60 das. ...................................................... 71
FIGURE 4.11: Effect of spacing on rice tillering ability/m2 in amuru and mukono
....................................................................................................................... 72
FIGURE 4.12: Effect of varity on tiller/m2 in amuru and mukono site respectively
....................................................................................................................... 73
FIGURE 4.13 A: Influence of variety and different spacing on tillers/m2 amuru 74
FIGURE 4.13 B. Influence of variety and different spacing on tillers/m2 mukono
....................................................................................................................... 74
FIGURE 4.14: Effects of weeding regime on number of panicle per square meter
....................................................................................................................... 80
FIGURE 4.15 A: Influence of weeding regime and varieties on number of
panicle/ m2 (amuru)....................................................................................... 81
FIGURE 4.15 B: Influence of weeding regime and varieties on number of panicle/
m2 (mukono) ................................................................................................. 82
FIGURE 4.16 Effects of spacing on number of panicle/m2 in amuru and mukono
respectively ................................................................................................... 83
FIGURE 4.17: Influence of variety performance on number of panicle /m2 ....... 84

xiv
FIGURE 4.18 A: Influence of spacing and varieties on number of panicle/ m2
(amuru) .......................................................................................................... 85
FIGURE 4.18 B: Influence of spacing and varieties on number of panicle/ m2
(mukono) ....................................................................................................... 85
FIGURE 4.19 A: Combined effect of varietal, different spacing and weeding
regimes on panicle/m2 in amuru ................................................................... 86
FIGURE 4.19 B: Combined effect of variety different spacing and weeding
regimes on panicle/m2 mukono ..................................................................... 87
FIGURE 4.21 A. Influence of varieties and weeding regime on rice yields kg/ha
(amuru) ........................................................................................................ 106
FIGURE 4.21 B. Influence of varieties and weeding regime on rice yields kg/ha -
1 (mukono) .................................................................................................. 106
FIGURE 4.22 A: Influence of variety and spacing on rice yields (kg/ha) inamuru
..................................................................................................................... 108
FIGURE 4.22 B: Influence of variety and spacing on rice yields (kg/ha) in
mukono ....................................................................................................... 108
FIGURE 4.23 A: Combined effect of varietal, different spacing and weeding
regimes on grain yield (kg/ha) (amuru). ..................................................... 110
FIGURE 4.23 B: Combined effect of varietal, different spacing and weeding
regimes on grain yield (kg/ha) (mukono) ................................................... 110
xv
ABBREVIATIONS AND ACRONYMS
GDI: Gross Domestic Income
NERICA: New Rice for Africa
FAO: Food and Agricultural Organization
CO2: Carbon dioxide
SSA: Sub-Saharan Africa
CPWC: Critical period of weed control
HYVs: High Yielding Varieties
SLA: Specific leaf area
xvi
ABSTRACT
Rice is relatively new to Uganda, yet consumption is outstripping production; and
with a growing population, demand is likely to increase. NERICA (New Rice for
Africa) rice – with high yields and ability to withstand dry conditions is being
planted in most part of the country. However, weed infestation is becoming one of
the biggest hindrances affecting rice production. The objective of the current work
was therefore to investigate the effects of varietal differences, plant spacing and
weeding regime on weed density and yields of upland rice in Uganda. A study
was carried out during the 2013 cropping season in Mukono agricultural research
station and a farmer’s field in Amuru District to evaluate the effects of varietal
differences, plant spacing and weeding regimes on weed density and yields of
upland rice. The experiment was laid in a Randomized Complete Block Design
(RCBD) with Split-split plot arrangement and replicated three times. The weeding
regime was the main plot treatment; row spacing constituted the sub-plot while
varieties were sub–sub plot. In both sites, the average weed coverage was higher
in NERICA-10 (87.8%) followed by NERICA-1 (58.2%) and lowest in NERICA
-4 (22.5%). At both sites weed competition reduced rice plant height in NERICA-
10 (52%) while, NERICA-1 and NERICA-4 had 27% and 15% reduction
respectively. Integration of row spacing and weeding reduced weed biomass, with
NERICA-4 having highest weed reduction of 89.2% under row spacing of 25cm
by 10 cm and 2 hoe-weeding regime(2 and 3 weeks interval), while NERICA-1
and NERICA-10 under same treatment had weed reduction of (67%) and (48%)
respectively. Weed competition significantly reduced productive tillers of rice
varieties. NERICA-4 produced higher number of productive tiller (84.5%) under
row spacing 30 cm by 10 cm and 2 hoe-weeding followed by NERICA-1 (68%)
under 25cm and 2 hoe weeding and NERICA-10 (65%) under row spacing of 15
cm by 10 cm and 2 hoe weeding. The data showed that NERICA 4 was more
tolerant to weed pressure than the other varieties. Spacing of 25 cm x 10 cm had
less weed biomass though 15cm X 10 cm also reduce the weed biomass but had
negative result in terms of yield. If farmers were to explore one hoe weeding to
control weeds in rice; NERICA-1 should be recommend at a spacing of 30cm x
10 cm to attain an average yield of (2.93tha1) which is still above the national
average of 1.7t ha-1. NERICA -4 at single hoe weeding out-yielded other varieties
and its yield at two hoe weeding regimes tended to approach optimum.. Its
superior yield advantage at single hoe weeding was consistent across locations
and is of importance since most farmers are known to avoid a second weeding due
to insufficient time and high cost of labor.
1
CHAPTER ONE: INTRODUCTION
1.1 Background to the study
Rice (Oryza sativa L. var. Indica) is the second most important
cereal crops in agriculture and economy of Uganda. Rice production in Uganda
started in 1942 mainly to feed the World War II soldiers. However, due to a
number of constraints, production remained minimal until 1974, when farmers
appealed to the government for assistance to improve its production. In response,
Government identified the Doho swamps and constructed the Doho Rice
Irrigation Scheme (DRS) with the help of Chinese experts and later Kibimba Rice
Scheme (Africa Rice Center- Africa Rice), (2008). Both schemes, which were
based on modern technologies (irrigation), changed the agronomic practices of the
people and the productivity of the area.
Despite rice production having been introduced in Uganda, many farmers
are not familiar with its cultivation or the required agronomical practices. About
80% of the rice produced is grown by small-scale farmers with acreage of less
than 2 ha, using simple technologies and little or no application of fertilizer, use
of poor quality seed with little or no irrigation and poor water management
practices among others (ADC, 2001). About 15 % of the growers are medium-
scale farmers with acreages ranging from 2 – 6 ha, applying more or less same
practices as the small-scale farmers, with a few using non-motorized tools such as
line markers (Kijima and Sserunkuuma 2008). The major difference between the

2
medium- and small-scale farmers is the acreage. There is also a small group of
large-scale farmers (about 5%), with land under cultivation ranging from 6 to
1,000 hectares (Kijima, Sserunkuuma and Otsuka, 2006)).
Due to government intervention in promoting domestic rice production,
Uganda’s rice production has increased significantly over the last five years. By
some accounts it has doubled and was expected to more than double by 2011
because of the new varieties which can be grown in rain-fed land instead of
swampy paddies that dominate world production (Pender, Laca, Mackill,
Fernandez and Fischer, 2004). Uganda adopted the New Rice for Africa
(NERICA) 1, 4 and 10 varieties, locally known as “Upland Rice”, in addition to
the old lowland varieties which have helped the country to improve its food
production and security. From the earlier releases of three upland rice varieties in
Uganda in 2002, farmers were able to earn about US$9 million in 2005 (UBOS,
2003). The introduction of NERICA in Uganda is one of the government’s
strategies for poverty reduction and achieving food security. The demand for the
commodity has been increasing relatively fast and gaining importance in the diet
of the urbanites (Imanywoha, 2001). Domestic rice production has not been able
to keep up with the demand, which is growing because of rapid urbanization and
changing food habits. Uganda resorts to about $90 million-rice imports (the third
largest import in the country) every year to meet the demand (UBOS, 2003).
3
Upland environments are highly variable, with climates ranging from
humid to sub-humid soils from relatively fertile to highly infertile,
and topography from flat to steeply sloping (Dingkuhn, Jones, Johnson and Sow;
1998.). The low grain yields estimated at 1,500 kg ha-1 (Imanywoha, 2001)
undermines the status of the rice as an important food security and income crop in
Uganda. Surprisingly, the actual grain yield of rice from farmers’ estimates in the
Central and Northern Uganda is much below the national average of 1,500 kgha-1.
The constraints to improved rice yields are among others, weeds and low soil
fertility which is caused by traditional production practices of the farmers.
Weeds are a major constraint to increased rice production and farmers
spend many hours hoe-weeding (Akobundu 1987); and this puts more strain on
labour which is scarce as reported by Tollens (2006). Weeds interfere with rice
growth and development by reducing the light intensity, nutrient, water, CO2 and
compete with crop for space; secrete toxic exudates into the soil that depress
growth and development of rice. In addition, they may harbor various pests and
pathogens (Moody, 1994, FAO, 1996).The longer the weed-rice association
remains, the greater the negative effects on rice productivity (Akobundu 1987,
Moody, 1994). Understanding “how long” weed-rice could associate without
damaging effect on rice is key to formulation of sustainable integrated weed
management alternatives.
4
Integrated weed management is considered one of the most attractive
options for crop protection, whereby a suitable choice of compatible measures
(cultural, mechanical, biological and chemical) keeps the weed population at
manageable levels. To be effective, integrated weed management should build on
knowledge of weed biology and ecology. A lack of awareness, timely information
and knowledge of the weeds limits the actual implementation of integrated weed
management at the farmers’ level (Labrada et al 2003). Farmers in Uganda have
frequently cited notorious weeds such as Commelina benghelensis, Digitaria spp.,
and Imperatus cylindrica as some of the major constraints to increased rice
productivity (Imanywoha, 2001).
It can be hypothesized that delayed weeding per se does not decrease
yields and it may also help farmers save the scarce labor resources required for
other operations (Alou, 2012). Therefore, it is imperative to quantify rice yields
under weeding regimes that represent a range of farmers’ practices in order to
determine the optimum dates for effective weed control.
Weed control is largely based on herbicide application; however, chemical
herbicides are often toxic and cause environmental problems. Use of aggressive
cultivars can be effective cultural practice for weed growth control where growth
is substantially suppressed. According to various authors (Akobundu et al., 1987;
Africa Rice Center/FAO/SAA 2000; Diagne 2006; Kijima, 2008), the competitive
ability of crop can be expressed in two ways. First is the ability of the crop to
5
compete with weeds, reducing weed seed and biomass production. The second
possibility is having crop tolerate competition from weeds, while maintaining
high yields. An improved weed management system within the context of
integrated weed management with emphasis on the use of weed competitive rice
cultivars is therefore needed for sustainable upland rice production in smallholder
farms in Uganda.
Although some studies of cultivar differences in competitiveness of rice
exist, including attempts to relate rice traits to weed competitiveness and yield
(Fischer et al., 2001; Gibson et al., 2003; Zhao et al., 2006; Johnson et al., 1998;
Jones et al., 1996; Koarai and Morita, 2003) reported, only a limited number of
cultivars have been evaluated especially in Guinea and Sudan Savannas of West
Africa. For example the inter-specific hybrids called New Rice for Africa
“NERICAs” have not been evaluated extensively for weed competitiveness. The
use of weed competitive varieties is unlikely to be feasible as a stand-alone
technology but rather it may be a valuable component of integrated measures.
Suitable varieties should, in addition to weed competitiveness, also possess other
traits (Dingkuhn et al., 1999) like resistance or tolerance to other biotic and
abiotic stresses. Furthermore, a suitable variety needs to be well adapted to the
environment and should preferably have the specific characteristics desired by
farmers and consumers. The development and integration of more competitive
6
rice cultivars into upland rice production system may be a viable option for
attaining optimum yields in smallholder farms.
All rice cultivars have an optimum seeding rate that varies, depending on
growth characteristics. The ‘‘plasticity’’ of plants with respect to the available
resources implies that there is a wide range of planting densities with more or less
constant crop yield levels (Harper, 1977; Radosevich, 1987). Increasing the plant
density within this range would in theory, only increase crop’s competitive
advantage over weeds with no concomitant negative consequences for crop yield.
This is the case with rice, and varying the plant population density is an option for
improving its competitiveness. Many reports have indicated that increased
seeding rates have been shown to be an important component for improved weed
management (Akobundu and Ahissou, 1985; Cousens, 1985; Fagade and Ojo,
1977; Kristensen et al., 2008).
Row spacing can also influence the critical period of weed control in
crops. It is hypothesized that narrow row spacing may decrease the interval of
critical weed competition periods (Chauhan and Johnson 2011). And according to
these authors, the critical weed-free periods for rice planted at the 30-cm rows
were up to 8 days longer than the other two rows spacing (15-cm and 10–20–10-
cm rows). Moreover, several studies have documented the reduced competitive
ability of short-stature cultivars (Harker et al., 2009; O’Donovan et al., 2000) and
improvements in the competitive ability of shorter varieties could be derived from
7
narrower row spacing (Drews et al., 2004). In general, the higher weed densities
typical in low-input and organic systems may make narrow row spacing and
higher planting density particularly attractive.
The practice of increasing crop plant density by using higher seeding rates
associated with narrower row spacing can lead to earlier canopy closure, thus
shading weeds in their early developmental stages (Vera et al. 2006). Sharma and
Angiras (1996) and Angiras and Sharma (1996) found that reduced row spacing
increased light interception by crops and reduced weed biomass, increasing crop
yield. The studies conducted on barley (Hordeum vulgare L.) have shown that
higher seeding rates using cultivars with differing competitive abilities enhanced
crop competitiveness against wild oat (Avena fatua L.) (Harker et al., 2009;
Watson et al., 2006; O’Donovan et al., 2000).
Research conducted in Louisiana (Eric 2001) indicates that cultivars
planted at the optimum seeding rate tend to be more competitive with weeds than
when planted at low seeding rates. High seeding rates can be competitive with
weeds, but intra-specific competition occurs at excessive seeding rates and yields
are reduced. Establishing a good stand of rice and providing an environment that
promotes rapid growth help to minimize weed interference. It was therefore very
necessary to investigate the available treatment of rice weed control in Uganda to
discover the best local option for smallholder farmers
8
1.2 Statement of the Problem
The rice-cropping systems are rain-fed upland and irrigated lowland.
Weeds constitute a big constraint to the production of rice in the upland ecology
and rank only second to drought stress in reducing its grain yield and quality. It
also hosts insect pests and diseases, require expensive labor and energy to control,
reduce harvesting and processing efficiency, and sometimes are poisonous
(Gupta, 1983).
The limited increase in production is due to ineffective control of weeds in
upland rice, for which it is imperative that an effective weed control mechanism
and its effective adoption result in better productivity and in an increase of net
rice production. This in turn will ensure food security in the region (Pender et al.,
2004). The weed flora of rice is as variable as the conditions under which it is
grown. Many important rice weeds of the tropic and sub-tropics are present in
East Africa, including Uganda: - Echinochloa crus-gulli, E. colona, Rottboellia
exaltata and Oryza punctata are common grass weeds and some important sedges
are: Cypresus difformis, C. tuberosus (C. rotundus var tuberosus), Scirpus
maritimus, Pycreus macrostachyos and Fimbristystis littoralis (Kijima, 2008)).
Some of these are extremely competitive, especially E. crus-galli has been known
to cause yield reduction of up to 25% in seeded rice when present at a density of
11 plants /m2 (Adeosun, 2008). The occurrence of weeds as constant component
of the ecosystem in comparison to the epidemic nature of other pests makes
farmers unaware of the significant losses they incur from weed infestation.
9
Ukungwu and Abo (2004) reported that weed is the greatest bottleneck to
increased yields and quality of rice. Development of competitive rice varieties as
a means of effective weed control by weed suppression have been proposed by
various authors and easy to adopt by farmers. In view of this, weed-competitive
Upland rice varieties known as NERICA (New Rice for Africa) have been
developed in West Africa for areas where herbicides are too expensive or
unavailable. Differences in competitiveness amongst varieties have long been
established. In Sierra Leone, Harding (2012) found up to 66% differences in weed
suppression among upland rice varieties. Fisher (1997) observed yield losses
ranging from 27 to 60% among Latin American irrigated rice varieties growing in
competition with Jungle rice. Gibson (2001) found that the more competitive
water-seeded rice varieties required lower herbicide rates to achieve the same
level of control of late water grass (Echinochloa oryzoides) than the less
competitive varieties. The development of competitive rice varieties requires the
identification of key plant parameters conferring competitive ability that can be
used as selection criteria by breeders (Pester, 1999). Plant traits such as tiller
number and leaf area index have shown to confer competiveness and could be
used in breeding programs to enhance competiveness of high yielding varieties
that are not competitive. The current experiment therefore aimed to address the
above pertinent issues raised regarding the weed-crop interactions, with emphasis
on keen attention on cultural practices and other integrated approaches, with
10
ultimate goal of increasing the competitive ability of the rice crop and final yield
and yield components.
1.3 Significance of the Study
Weeds compete with crops for moisture, light and nutrients. Yield losses
may be small if only a few weeds were present, but heavy infestations may cause
complete crop failures, and in some cases when perennial weeds get established,
the land cannot be used for crop production until the infestation has been
controlled. Weed species in rice exhibit highly diverse growth habits and
characteristics, and as such more than one control method is commonly applied to
maintain weed population below the economic threshold. The best methods most
often results from use of multiple practices, such as planting as early as possible
to give crops competitive edge over weeds that appear later are well known,
however the procedure alone does not provide enough weed control to allow
satisfactory crop yield.
Effective weed control in rice cannot be achieved by single method, but
requires an integrated agronomic practice. Despite considerable research, there is
much to be learnt about weed control in rice. Many trials have been site specific,
often producing results at variance with those from other locations. It was
therefore very necessary to investigate the available treatment of weed control in
Uganda to discover the best local option.
11
Keeping these in view, a field research was be carried out to evaluate the
effects of different spacing and weeding regimes in relation to three newly
released rice varieties with a view to educating farmers on the best integrated
weed management methods to boost the rice yields using the NERICA varieties in
Central and Northern Uganda and help influence government policy on rice
production.
1.4 Objectives of the Study
1.4.1 General objectives
The study sought to assess the: Effects of varietal differences of newly
released NERICA rice varieties under different plant spacing and weeding
regimes on weed density and yields of upland rice in Central and Northern
Uganda
1.4.2 Specific objectives
The study focused on the following specific objectives:
i. To determine weed suppressive ability of popular first generation
upland NERICA varieties (NERICA 1, 4 &10).
ii. To evaluate the performance of upland NERICA cultivars under
different weeding regimes that is commonly practiced by famers in
Central and Northern Uganda.

12
iii. To determine the appropriate rice spacing of newly released upland
rice varieties that provides competitive ability against noxious
weeds
1.5 Hypotheses.
The following hypotheses were used to guide the study:
i. That there exists varietal abilities to suppress weed depending on
key morphological, phonological traits and growth parameters
ii. That there is optimum yield potential of a variety that significantly
depends on the number of weeding regimes
iii. It was hypothesized that narrow row spacing would significantly
decrease the interval of critical weed competition periods and
hence less yield loss.
1.6 Conceptual and theoretical Framework
The impact of weeds upon a production system can be demonstrated using
the basic concept of production function. The quantity of rice output is
determined by the quantity of fixed and variable inputs into the production
process, represented algebraically by production function; Y = f (V, F) (1) where
Y is yield, V and F are variable and fixed inputs in rice production, respectively.
The variable and fixed production inputs include such factors as rice variety, soil
type, soil fertility, rainfall, temperature, among others. Weed infestation affects
the parameters of this relationship and reduce output for any given level of input.
13
The yield loss associated with weeds can be expressed as a reduction in output
resources (excluding expenditure on weed control) to neutralize the effects of
weeds, or any combination of consequent output and revenue adjustments
between the extremes. Introducing input variables specifically for weed control
extends the production function framework as follows: Y = f (V, H, F) where H is
weed control input such as varietal ability to suppress weeds , weeding times ,
influence of spacing and population on weeds and herbicide in rice production.
Increasing the weed control input variable will reduce losses and result in a higher
level of outputs V and F.
The above framework avoids comparison of the benefits of a weed control
technology to a hypothetical and usually unattainable weed-free scenario. Crop
losses resulting from weeds (L) are defined as the losses resulting from yield
reduction due to residual weeds after control, in addition to price. It has been
conceptualized in this study that integrated weed control can be achieved by
varietal differences coupled with the appropriate spacing which can greatly
influence or improve upland rice yields. Beside varietal and appropriate spacing
yield performance of NERICA can also be improved by timely weeding when
carried out by smallholder farmers to reduce the negative influence on crop–weed
interaction. The critical period of weed control (CPWC) is an important principal
of an integrated weed management program. It is a period in the crop growth
cycle during which weeds must be controlled to prevent yield losses (Knezevic et
14
al., 2002). Weeds that are present before or emerge after this period do not cause
significant yield loss. Studies on the critical period of weed control are important
in making weed control recommendations. The optimum time for implementing
and maintaining weed control and reduce cost of weed control practices (Hall et
al., 1992; Van Acker et al., 1993). The development of competitive crop cultivars
is an important aspect of integrated weed management and can reduce reliance on
herbicides (McDonald, 2003). The ideal weed competitive cultivars are high-
yielding under both weed-free and weedy conditions and have strong weed-
suppressive ability. Weed-suppressive ability is the ability to suppress weed
growth and reduce weed seed production and, hence, benefit weed management in
the subsequent growing season (Jannink et al., 2000; Zhao et al., 2006). An
integrated weed management approach should employ multiple control .strategies.

15
Figure 1.1: Conceptual framework
INDEPENDENT
VARIABLES
INTERVENING
VARIABLES
DEPENDABLE
VARIABLES
1. SPACING
2. WEEDING
REGIMES
3. VARIETAL
COMPETITIVENESS
WEED DENSITY
INCREASED YIELD
AND IMPROVED
FOOD SECURITY

16
CHAPTER TWO: LITERATURE REVIEW
2.1 Introduction
Worldwide, weeds are estimated to account for 32% of potential and 9%
of actual yield losses in rice (Oerke & Dehne, 2004). The nature and severity of
weed problems, however, vary according to the rice ecosystem. Likewise, weed
management practices and the available options are often a function of
biophysical and socioeconomic factors which, in turn, are determined by the agro-
ecosystem. Uncontrolled weed growth is reported to cause yield losses in the
range of 28–74% in transplanted lowland rice. The economic importance of weed
competition with rice account for yield losses estimated to be at least 2.2 million
tons per year in sub-Saharan Africa, valued at $1.45 billion, and equated to
approximately half the current total imports of rice to this region (Rodenburg et
al., 2009). Throughout Africa; from Senegal to Madagascar, weeds are cited
among the main production constraints in any of the rice producing agro-
ecosystems (Adesina et al.1994; Ampong-Nyarko, 1996; Becker and Johnson,
1999a; Diallo and Johnson, 1997). Weed problem has been ranked second to
drought stress in reducing its grain yield and quality. Weeds also, host insect pests
and diseases, require expensive labor and energy to control, reduce harvesting and
processing efficiency, and sometimes are poisonous. Common agronomic factors
that contribute to weed problems are inadequate land preparation (soil tillage, soil
leveling in lowland areas), rice seed contamination with weed seeds, use of poor
17
quality rice seeds, broadcast seeding in lowlands, use of old rice seedlings for
transplanting, inadequate water management, inadequate fertilizer management,
mono-cropping, labor shortages for hoe weeding and delayed herbicide
applications and other interventions (Becker & Johnson,1999a, 2001b; Diallo &
Johnson, 1997). Each rice production system harbors weed species well adapted
to the environment and management practices. While the weed flora of a specific
production system (e.g., lowland or upland) may be similar across different agro
ecological zones, the abundance of individual species can differ substantially
(Akobundu & Fagade, 1978). A review of the literature on weeds in rice-based
cropping systems in Africa yielded 130 different weed species (upland: 61;
hydromorphic: 31; lowland: 74), 57 of which were reported more than once
(upland: 26; hydromorphic: 13; lowland: 30), and 12 were observed in more than
one rice ecosystem (Africa Rice Center, 2008).
In rain fed rice, yield losses can reach up to 84%, depending on the weed
species, rice varieties and the soil moisture regime (Akintayo et al., 2008). Yield
losses of 40% have been reported under hydromorphic conditions (Dogbé and
Aboa, 2004) compared to 8 to 30% for transplanted rice under rain fed lowland
and irrigated conditions (WARDA, 2000). In exceptional circumstances, lack of
weed control may cause total crop loss (Johnson et al., 1997). Weed infestation
and development result from a complex interaction of many factors, such as
18
competition, allelopathy or other cultural practices and prevailing environmental
conditions (Caussanel, 1989).
Similarly, deep-water rice systems along the major rivers can be severely
affected by weeds prior to flooding as the crop is direct-seeded and farmers rely
on hoe weeding and use relatively little herbicides (Akobundu, 1987; Ampong-
Nyarko & De Datta, 1991). Some problematic weeds in rice are annuals with
short growth cycles such as Cyperus difformis and Digitaria horizontalis (40–80
days) and are able to reproduce before rice harvest even when they emerge after
the first weeding operation (Johnson, 1997). Such species, if not controlled, are
able to build up populations very rapidly. Annual weeds causing problems in
upland rice production are Euphorbia heterophylla (L.), Digitaria horizontalis
and the parasitic weeds Striga spp. (Striga hermonthica [Del.] Benth.and Striga
asiatica [L.] Kuntze) and perennials such Cyperus rotundus and Cyperus
esculentus in as addition to the annuals. In lowland rice the perennial weeds:
Cyperus rotundus, Cyperus esculentus and Oryza longistaminata and annual
weeds Sphenoclea zeylanica, Echinochloa spp. Cyperus difformis, Cyperus iria,
Fimbristylis littoralis, Ischaemum rugosum, and Oryza barthii cause serious
losses as concluded by Diagne (2006). Common weed management practices in
rice-based cropping systems include soil tillage, clearance by fire, hoe- or hoe-
weeding, herbicides, flooding, fallow and crop rotations, and these are often used
in combination.
19
Weed populations of upland rice are reported to be more dynamic than those of
lowland rice areas (Johnson and Kent, 2002). According to these authors,
perennial species accounted for more than 45% of the weed species of lowland
rice and only 31% in the upland or hydromorphic rice ecosystems .Weed control
in upland rice involve a lot of human resource to carry out. Idem and
Showemimo (2004) reported that hoe weeding, which is the common weed
control practice among peasant farmers, can consume as many as between 250
and 780 man-days ha-1, depending on frequency of weeding, ecosystem, and
environmental conditions during cropping. For weed control technology to be
acceptable by upland rice farmers, it must be effective and economically feasible.
Economic feasibility depends upon the relative cost of weed control in relation to
yield obtained.
2.2 Rice Production in Uganda
Before New Rice for Africa (NERICA) was introduced in Uganda, upland
rice cultivation was not common in most of Central and Western regions of
Uganda, though the consumption of rice has been growing due to the rapid
urbanization (UBOS, 2003. According to Kijima and Sserunkuuma (2008) who
relied heavily national representative survey conducted in 2003, observed that the
percent of households who grew upland rice in 2004 was 6.3% and was higher in
Eastern region (12.6%) and in Central (2.2%) while on the other hoe Western
region constituted 0.5% and those who grew lowland rice were located only in
20
Eastern region. The NERICA rice varieties that were developed by the Africa
Rice Center (Africa Rice, ex-WARDA) and partners in Africa and have gained
popularity among African rice farmers in a relatively short period of time. The
NERICA varieties have good agronomic performance and resistance to Africa’s
harsh growth conditions, especially short growth duration, and varieties are much
appreciated by farmers (Kijima and Sserunkuuma, 2008).
These new group of high-yielding and stress-tolerant upland rice varieties
were developed in Africa for Africa so as to address the continental-wide rice
cereal challenge, poverty and food insecurity (Africa Rice Center/FAO/SAA
2008). As such, it has been described as a ‘boom’, a ‘miracle’, and a ‘revolution’;
some even believing it can become a similar locomotive in Africa’s ‘Green
Revolution’ as the new rice High Yielding Varieties (HYVs) were for Asia
(Diagne 2006; Afrol News, 2002). NERICA or the New Rice for Africa was
introduced in 2002. Since then, Uganda’s rice production has risen from 123,000
metric tons to about 180,000 metric tons to date, according to the agriculture
ministry (Fornasari, 2003). It is a cross between an ancient, hardy African rice
variety and a high-yielding Asian variety. It combines features of both resistance
to drought and pests, higher yields even with little irrigation or fertilizers, and
more protein content than other types of rice as reported by Pender et al. (2004).
21
2.3 Rice Varietal Development for Improved Weed Control
In rice systems where farmers have scarce resources and use few external
inputs, as often found in Africa, rice varieties that suppress weeds maintain high
yields under weedy conditions and are well adapted to the local conditions, and
therefore would bring considerable advantages to resource-poor farmers (Johnson
et al., 1998a). Rice cultivar has tremendous impact on the growth and infestation
of weed in the rice field. Usually short stature cultivars face more weed
infestation than the taller ones (Sarker, 1979). So, to avoid the weed competition
and to get maximum yield from rice, appropriate cultivar should be selected.
Weed-free during the critical period of competition is essential for optimum rice
yield.
In morphological terms, weed competitive rice varieties are suggested to
be those that are tall and have a high tillering ability, a high specific leaf area
(SLA = leaf area per leaf dry weight), erect to droopy leaves and relative long
crop durations to compensate from losses suffered during early weed competition
(Asch et al., 1999; Dingkuhn et al., 1998, 1999; Fofana and Rauber, 2000).
Cultivars of the African rice species, Oryza glaberrima have shown yield
advantages under weedy conditions compared to the Asian Oryza sativa varieties
(Johnson et al., 1998a). There are possible trade-offs between various competitive
characteristics (Dingkuhn et al., 1999; Perez de Vida et al., 2006) or between
competitive traits and yield potential (Jannink et al., 2000; Jennings and Aquino,
1968; Kropff et al., 1997). Although some studies showed that such trade-offs are
22
no general phenomena (Garrity et al., 1992; Haefele et al., 2004;Pernito et al.,
1986), many desirable morphological characteristics with respect to weed
competitiveness may have negative effects on yield potential. For instance,
characteristics associated with high yielding modern varieties, such as short
stature and erect leaves, are considered to be unfavorable for weed suppression
(Johnson et al., 1998a).
Droopy leaves, on the other hoe, may shade out weeds but limit light
penetration to lower rice leaves, while tall rice plants may compete for light more
effectively than shorter plants but these may be more prone to lodging (Bastiaans
et al., 1997). While Oryza glaberrima can be competitive with weeds, they have
low yield potentials and yield losses are incurred due to lodging and grain
shattering (Dingkuhn et al., 1998; Jones et al., 1997; Koffi, 1980). Interspecific
hybrids of O. sativa and O. glaberrima were developed with higher yield
potential and without the seed shattering characteristic. Varieties derived from
these interspecific crosses were named New Rice for Africa (NERICA) and
currently comprise 18 upland and 60 lowland varieties (Rodenburg et al., 2006b),
of which 17 upland and 11 lowland varieties have been released in Sub Saharan
Africa (Akintayo) . Early observations on these varieties, developed for the
upland areas, have shown that some putative traits of the O. glaberrima parent,
contributing to weed suppressiveness, and traits of the O. sativa parent,
23
contributing to yielding ability, are heritable (Dingkuhn et al., 1999; Johnson et
al., 1998a; Jones et al., 1997).
In a recent study carried out in two upland environments in Nigeria,
compared to the popular check variety ITA150 and the NERICA parents
(WAB56-104 and CG14), NERICA-1, -2, and -4 generally had slightly higher
weed infestation levels and relative yields losses due to weed competition
(Ekeleme et al., 2009). In the same study, however, all three NERICA varieties
had higher yields than CG14 and ITA150 when the crops were weeded one or two
times. Another recent study carried out in a lowland environment in Benin
showed that nine lowland varieties of NERICA (NERICA-L-6, -32, -35, -37, -42,
-53, -55, -58, and 60) had significant higher yields than both lowland NERICA
parents under weedy and weed-free conditions, and comparable yield
performances as the high yielding and weed competitive check variety, Jaya
(Rodenburg et al.,2009).
Even though varietal differences in weed competitiveness have been found in rice
(Fischer et al., 2001; Garrity et al., 1992; Zhao et al., 2006a), so far, only a limited
number of varieties are confirmed to combine superior weed competitiveness with
good adaptation to African rice ecosystems. In upland fields in Cote d’Ivoire, O.
glaberrima varieties IG10 (Fofana and Rauber, 2000), CG14, and CG20 (Jones et
al., 1996) were found to be superior in suppressing weeds but also had low yield
potential. On hydromorphic soils in Nigeria, the tall variety OS6, incurred 24%
24
less yield reductions from weed competition than the semi-dwarf cultivar
ANDNY11 (Akobundu and Ahissou, 1985). In Senegal, Haefele et al. (2004)
reported that lowland rice variety Jaya was weed competitive and high yielding
compared to a range of varieties. Jaya incurred lower yield losses due to weeds
(<20%) compared to popular Sahel 108 (>40%).
Gibson et al. (2001) observed that the use of rice cultivars to suppress
weeds is an important tool in weed management in rice; however, research on
competitive cultivars of rice has been limited. They further noted that the use of
competitive cultivars in an integrated weed management program may also be a
cost-effective approach for reducing the selective pressure for resistance as
competitive cultivars allow lower herbicide rates to be used. Various authors have
observed that crop competition is one of the most important, but often one of the
overlooked tools in weed control. Cultivar weed competitiveness is a function of
weed tolerance, or the ability to maintain high yields despite weed competition,
and weed suppression ability, is the ability to reduce weed growth through
competition (Jannink et al., 2000). Haefele et al. (2004) observed rice cultivar
differences in weed competitiveness and the cultivars that compete well against
weeds are often thought to be tall, rapid early growth, droopy leaves and high
specific leaf area. Kolo (2011) also was in concurrence after observing weed
suppression ability of NERICA 1 (inter- specific) variety over the local check
FARO 46.

25
Previous study shows that drooping leaves and higher tillering ability of
NERICA 1 resulted in good canopy formation which contributed to its weed
suppressing ability which translated into greater grain yield. In the East, Central
and Southern Africa (ECSA) county of Tanzania, Ageratum conyzoides,
Galinsoga pariflora, Clotalaria incana and Rottboellia cochinensis are cited
among the principal weed species encountered in the upland rice ecology (Jannink
et al., 2000). Although O. glaberrima has been shown to be competitive against
weeds (Johnson et al., 1998; Fofana and Rauber, 2000), NERICA varieties cannot
thrive in an un-weeded field.
2.4 Weeding Regimes and Rice Performance
Minimizing weed competition during the early stages of the crop, before it
has formed a closed leaf canopy, is particularly important. In upland rice, this
critical period is approximately 15-40 days after seeding, while in transplanted
rice, the crop can form a canopy more rapidly. Where a crop is exposed to
prolonged weed competition during this critical period, it is not usually able to
recover sufficiently to give a good yield
Mechanical weed control using the hoe or hoe is the most common
method used by upland rice farmers which has several disadvantages. Hoe
weeding is more complicated by the morphological similarity between rice and
grass weed seedlings. Cultural methods of weed control such as crop spacing and
26
use of competitive varieties, to suppress weeds might substantially reduce
herbicide use and labor costs.
When weed pressure is minimal in the field, only one weeding within 15–
21 days after sowing (DAS) is sufficient for NERICA rice plants to grow well.
But when weed pressure is high, a second weeding at panicle initiation stage
(about 42–50 DAS) have often been applied. A third weeding may be done
depending on weed situation in the field. In Uganda the trials on station at
NaCRRI showed that weeding rice thrice at 28, 56 and 84 days after emergence
increases NERICA 4 yields by 2,023 kg over weeding twice on the same dates
(JICA, 2010). To prevent weed-induced yield losses, two to three weeding
operations are required for upland and three for hydromorphic and flooded rice
(Ampong-Nyarko and De Datta, 1991).
Despite recommendations to the contrary however, weeding is frequently
inadequate or delayed, often due to labor shortages or conflicts between on- and
off-farm activities (Johnson et al., 1998a). Indeed, hoe weeding can be relatively
ineffective, particularly in controlling many of the perennial weeds (Cyperus spp.)
that have underground tubers and rhizomes from which they can rapidly re-
establish.
27
2.5 Effects of Spacing and Weeds Management on Rice Crop Yield
2.5. 1 Influence of seed rate on weeds control in rice
High seeding density of a crop develops canopy rapidly and consequently,
suppresses weeds more effectively and in contrast, reduced seeding rates result in
sparse stands and encourage weed growth (Guillermo et al.2009). Phuong et al.
(2005) reported from their study with lowland rice that, higher seeding rates favor
crop to compete with weeds and at the same time increase yield under weedy
conditions. Ottis and Talbert (2005) opined that, seeding rate higher than
recommendations can be suggested to compensate unforeseen biotic and abiotic
stresses, especially under aerobic conditions where it is often felt that there is a
higher risk of poor seedling establishment associated with lower seeding rates.
Zhao et al. (2007) emphasized on the need for combination of a weed-suppressive
rice cultivar with proper seeding rate for effective weed control in aerobic rice.
They also reported that, under aerobic condition, seeding rate as high as 500
seeds/m2 reduced weed growth and increased crop yield to some extent compared
with a low seeding rate of 300 seeds/m2. According to Kristensen et al. (2008),
increased crop density and spatial uniformity can play an important role in weed
management and a strategy based on increased crop density and spatial uniformity
can reduce or eliminate herbicide application in conventional cereal production.
Crop spatial uniformity decreases competition within the crop population early in
the growing season (Olsen and Weiner 2007) and maximizes the total shade cast
by the crop by reducing self-shading (Weiner et al. 2001).
28
In a study in the presence of weeds, the highest yields were obtained with
high crop density and high spatial uniformity (Kristensen et al. 2008). However,
the early size advantage of the crop was the theoretical basis for the prediction of
positive effects of increased density and spatial uniformity on weed suppression
as reported by Weiner et al. (2001). Therefore, it can be concluded that increased
crop density and uniformity may not lead to effective weed suppression when
weeds have the initial size advantage (e.g., perennial weeds), or are able to catch
up in size with the crop before competition becomes intense (Kristensen et al.
2008). Moreover, one might expect the effects of high crop density and spatial
uniformity on weeds to be more pronounced at low soil nitrogen levels because
weeds grow more slowly at low fertilization levels (Blackshaw et al. 2003).
Moreover, economic benefit of using higher seeding rate should also be taken into
account because cost of extra seed may be higher than the benefits in weed
suppression (Nice et al., 2001) and therefore, high seed density should be
reconsidered within the context of economic feasibility and compatibility with
other aspects of cropping for successful rice production, timely planting,
appropriate control of vegetative growth throughout the duration of the crop,
suitable transplanting densities for optimum tillering and control of leaf growth by
controlling water, fertilizer and chemical inputs are essential for improving the
growth variables responsible high yield (Ghosh and Singh, 1998).
29
In contrast, Kirkland et al. (2000) reported from their study with different upland
crops that, crop yield and weed growth were not influenced by higher seed rates
up to 150% of recommended rate. Gibson et al. (2001) also observed no influence
of rice seeding rate on weed growth in direct -seeded lowland rice. Several studies
reveal that, high seed rate may bring about problems of mutual shading and intra-
specific competition for below-ground resources. Despite improvement in weed
management, higher seeding rate may exacerbate problems like lodging (Bond et
al., 2005), insect and disease infestation (Tan et al., 2000) and rat damage (Castin
and Moody, 1989) that harm crop yield.
2.5.2 Influence of plant spacing on weeds control in rice
Various workers (Estorninos & Moody 1976, Manuel et al 1979, Kim and
Moody 1980) have shown that, as the planting distance between hills of
transplanted rice is reduced, the crop becomes more competitive against weeds,
and yield losses due to weeds are reduced. Rao et al (1977) reported that, in
addition to reducing weed weight and weed competition, closer plant spacing
resulted in more options from which a farmer could select a suitable weed control
practice. The number of weed control treatments to ensure that the yield was not
significantly less than that from the weed-free check decreased from seven at 15-
× 15-cm spacing to three when plant spacing was 25 × 25 cm. However, Kim and
Moody (1980) concluded that even though the highest net benefits were obtained
when rice was transplanted at a 10- × 10-cm spacing, a farmer would probably

30
plant at a wider spacing (20 × 20 cm) and weed chemically or by hoe because of
the greater benefit-cost ratio at the wider plant spacing. Phuong et al. (2005)
confirmed that seeding method influence of rice on weed growth and row seeding
in East-West direction resulted in lowest rice yield loss under weedy condition.
Planting uniformity also shows a positive impact on the competitive
ability of a crop (Boyd et al., 2009). Weiner et al. (2001) emphasized on the
combination of increased crop density and more uniform planting to enable crops
to compete more efficiently with weeds. Karaye and Yakubu (2006) also
confirmed planting density in terms of intra-row spacing effect of crop on weed
growth.
31
CHAPTER THREE: MATERIALS AND METHODS
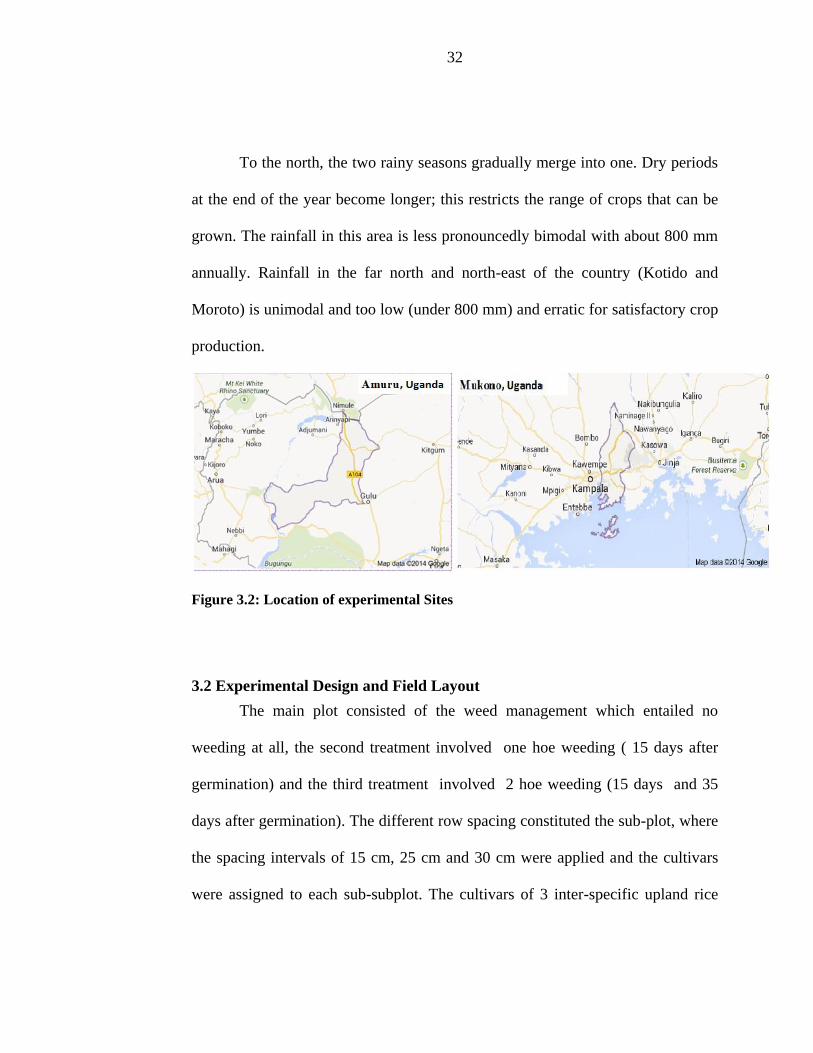
3.1 Description of Locations
3.1.1 Mukono Zonal Agricultural Research and Development Institute
(Mukono ZARDI)
Mukono Zonal Agricultural Research and Development Institute (Mukono
ZARDI) is one of the nine Public Zonal Agricultural Research and Development
Institutes (ZARDIs) which were established through the National Agricultural
research (NARS) Act of 2005. The Institute is responsible for carrying out applied
and adaptive research in the Lake Victoria Crescent Agro-ecological Zone. It
covers 21 districts of Central Uganda which include: Mubende, Mityana, Luwero,
Kyankwanzi, Mukono, Kayunga, Nakasongola, Nakaseke, Masaka, Kalangala,
Buikwe, Kalungu, Lwengo, Mpigi, Kampala, Bukomansimbi, Gomba,
Butambala, Buvuma, Wakiso and Kiboga. Mukono is located approximately 27
kilometers (17 miles), by road, East of Kampala, the capital of Uganda. The
coordinates of the district are: 00 20N, 32 45E
3.1.2 Amuru District
The second Location of the trials was in Amuru district of Northern
Uganda, average rainfall of 1150 mm with a unimodal transition to bimodal due
to breaks in June, has high variability, from about 600 mm over the north and
northeastern parts to about 1000 mm over the southern and western parts.
Temperature ranges 12.5 – 32.5 °C, altitude ranges from 351 – 1,524 m ASL.
32
To the north, the two rainy seasons gradually merge into one. Dry periods
at the end of the year become longer; this restricts the range of crops that can be
grown. The rainfall in this area is less pronouncedly bimodal with about 800 mm
annually. Rainfall in the far north and north-east of the country (Kotido and
Moroto) is unimodal and too low (under 800 mm) and erratic for satisfactory crop
production.
Figure 3.2: Location of experimental Sites
3.2 Experimental Design and Field Layout
The main plot consisted of the weed management which entailed no
weeding at all, the second treatment involved one hoe weeding ( 15 days after
germination) and the third treatment involved 2 hoe weeding (15 days and 35
days after germination). The different row spacing constituted the sub-plot, where
the spacing intervals of 15 cm, 25 cm and 30 cm were applied and the cultivars
were assigned to each sub-subplot. The cultivars of 3 inter-specific upland rice
33
newly released cultivars in 2004 (NERICA 1, NERICA 10 and NERICA 4 were
used in the trials. The experiment was therefore laid in Randomized Complete
Block Design (RCBD) design with split-split plot arrangements and the
treatments were randomly assigned and replicated three times.
The designs had a nested blocking structure: split plots were nested within
whole plots, which were nested within blocks. Split-plot designs were originally
developed by Fisher (1925) for use in agricultural experiments. The current study
was carried out in Central and Northern Uganda in Northern Uganda in Amuru in
farmer’s field. One site was based at the Mukono agricultural research station
(NARO) in central Uganda.
3.3 Plot Layout
The trial was laid out as Randomized Complete Block Design with a split-
split plot arrangement and the treatments were randomly assigned and replicated
three times.
3.4 Plot Layout Description
The experiments was laid in a Split-split plot design with weeding (0, 2
and 3 weeks respectively after germination) as the main plot; three row spacing
were evaluated (15 cm; 25cm and 30cm and the three varieties of upland rice
(NERICA 1, 4, and 10) as Sub–sub plot.
34
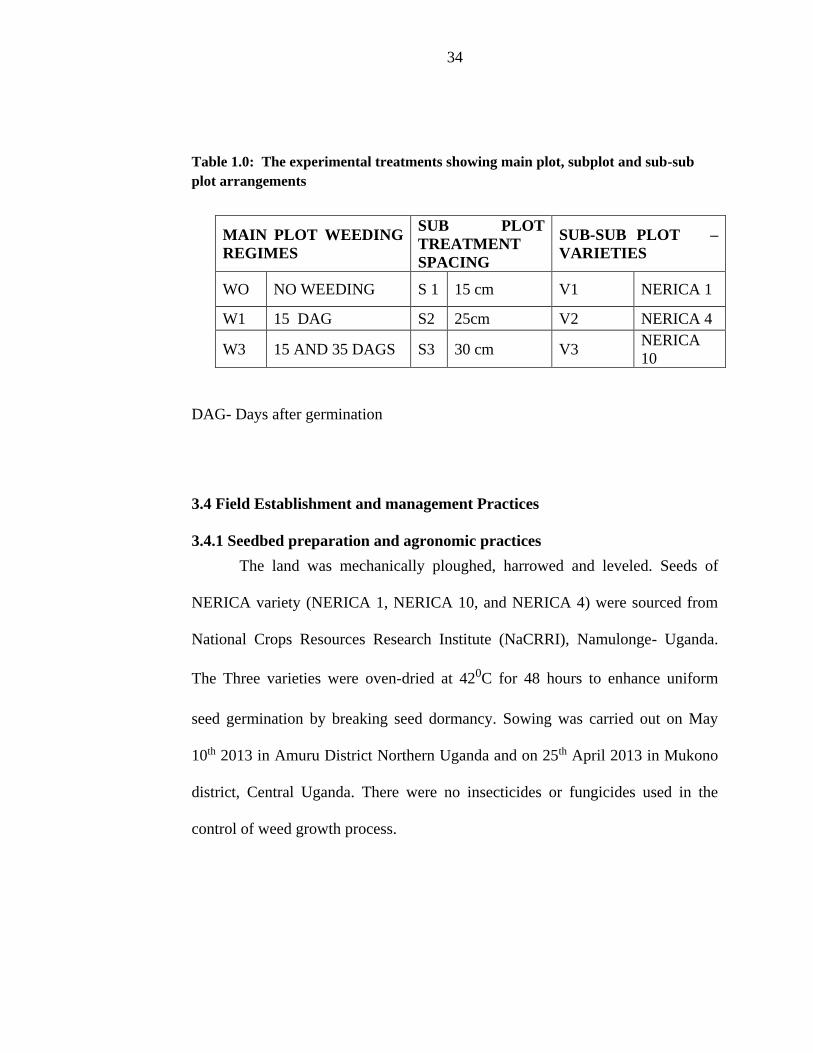
Table 1.0: The experimental treatments showing main plot, subplot and sub-sub
plot arrangements
DAG- Days after germination
3.4 Field Establishment and management Practices
3.4.1 Seedbed preparation and agronomic practices
The land was mechanically ploughed, harrowed and leveled. Seeds of
NERICA variety (NERICA 1, NERICA 10, and NERICA 4) were sourced from
National Crops Resources Research Institute (NaCRRI), Namulonge- Uganda.
The Three varieties were oven-dried at 420C for 48 hours to enhance uniform
seed germination by breaking seed dormancy. Sowing was carried out on May
10th 2013 in Amuru District Northern Uganda and on 25th April 2013 in Mukono
district, Central Uganda. There were no insecticides or fungicides used in the
control of weed growth process.
MAIN PLOT WEEDING
REGIMES
SUB PLOT
TREATMENT
SPACING
SUB-SUB PLOT –
VARIETIES
WO NO WEEDING S 1 15 cm V1 NERICA 1
W1 15 DAG S2 25cm V2 NERICA 4
W3 15 AND 35 DAGS S3 30 cm V3 NERICA
10

35
Table 2.1: Characteristics of upland rice varieties used for trials
Variety Species Plant height Cycle
NERICA 1
(Interspecific) O. sativa O.
glaberrima 100 cm 95 - 100 days
NERICA10
(Interspecific) O. sativa O.
glaberrima 90 cm 85 -90 days
NERICA 4
(Interspecific) O. sativa O.
glaberrima 100 cm 95- 100 days
National Crops Resources Research Institute (NaCRRI), Namulonge- Uganda
3.4.2 Fertilizer application
The fertilizers were applied based the recommended rate of application for
upland rice by NARO. All plots were fertilized with 20 kg of TSP per acre and 50
Kg of Urea per acre as normal recommendations for fertilization of upland rice in
Uganda. Urea was applied in split doses; applied as basal, while the second doses
were applied at panicle initiation stage. Phosphorus was applied at planting. Side
placement of fertilizer between rows was used when applying the second dose of
Urea.
3.5 Parameters Determined and Procedure
Using a similar procedure by Parvez et al., (2011), several vegetative and
physiological traits along with the yield components and yield of rice in both
weedy and weed-free conditions were investigated for the better understanding of
36
the role of different spacing and weeding intervals as well as cultivars in
suppressing weeds for yield production under upland rice conditions. The
following parameters were measured:
3.6 Tiller Counts
Tiller count was carried out at 25, 40 60, after planting and at 75 days the
number of productive tillers per plot was recorded by the use of 1m2 quadrant.
3.7 Plant Height and Growth Pattern
Plant height (distance from ground level to the tip of the panicle) was
measured in centimeters (cm) from 5 randomly selected plants at harvest (PHH).
To study the growth pattern, height growth rate (HGR), which is increase in plant
height per day (cm/day) was calculated/computed based on the height measured at
different 25, 40 and 60 days. Height growth rate emergence panicle initiation
(HGR E-PI), Height growth rate panicle initiation heading and harvesting (HGR
PI-HG) and Height growth rate heading growth and harvesting (HGR HG-H)
represent height growth rates between emergence and panicle initiation, panicle
initiation and heading and heading and harvesting, respectively.
3.6 Leaf Area Index (LAI)
For the determination of Leaf area index (LAI), five plants per plot were
used. The length and width of the first, middle and last leaves were measured and
their averages used for the calculation of leaf area index. The relationship LAI=
Lx WxNx0.72/A, where L=length of leaves, W=width of leaves, N=number of
37
leaves per plant, A=area covered per plant and, 0.72=constant for the
determination of leaf area index of rice was used (Watson, 1995). Leaf area index
was obtained for the purpose of determining the performance of rice plants
against the weed-free and weed-infested plots and understand the radiation
capture along the plant stand and canopy under different spacing and variety.
3.7 Weed Species Identification
A 1m2 plot of land was used for weed identification and dominance data
collected. The density and frequency was recorded for the calculation of summed
dominance ratio (SDR) of weeds, determined by using the relationship:
1/2(F/∑F+D/∑D), where F= frequency of occurrence of a weed species within the
field, D= density of occurrence of a weed species on the scale of 0-4, where 0=
zero occurrence of a weed species per 1m2 and 4= 20 stands of the weed species.
3.8 Weed Dry Matter Determination
This was done at four intervals (25, 45, 65 and 95 DAS) by throwing 1m2
quadrant in each plot, and the weeds inside it were uprooted and dried for weed
dry matter. Percentage weed reductions (PWR) was determined by subtracting the
total weed density from each plot from that obtained from the control (W0-no
weeding), then multiply by 100 and divide by check. PWR = WD – W7 X 100
W0 WD =Weed density obtained from each plot.
38
3.9 Yield and Yield Components of NERICA rice
Panicles (PN) from each plot sizes of 1m x 1m were counted. At maturity,
10 panicles from each replicate were randomly collected and hoe- threshed; filled
grains were separated from unfilled grains and counted to calculate average grains
/panicle(filled grains + unfilled grains), filled grains/panicle(FGN) and grain
filling percentage(GF) (filled grains/(filled grains + unfilled grains) × 100). Filled
grains were weighed in grams to measure thousand-seed weight (TSW). Panicle
length (PL) was measured in cm. Grain yield (GY) was calculated after harvesting
the whole plot and transformed to Kg/ha .Panicle weight, thousand-seed weight
and grain yield were adjusted to 14% moisture content. Flowering (DF) and
maturity dates (DUR) was recorded when 50% plants of the rice started to flower
and more than 80% grains turned golden yellow color, respectively.
3.10 Relative Yield Loss (RYL)
This parameter was calculated as: Relative yield loss (%) =100((weed
free yield - weedy yield)/ weed free yield); where, weed-free yield refers to rice
grain yield at 14% moisture content grown under weed-free conditions; weedy
yield refers to rice grain yield at 14% moisture content grown under weedy
conditions.
3.11 Data Analysis
Data recorded for different parameters were compiled and tabulated for
statistical analysis. "Analysis of Variance" was done as per randomized complete

39
block design with the help of computer package SPSS. Where possible the mean
differences among the treatments were tested with Duncan’s Multiple Range test
(Gomez and Gomez, 1994).
40
CHAPTER FOUR: RESULTS AND DISCUSSION
4.1 Composition and dominance of weed flora
The data collected from un-weeded plots at 40, 60 DAS shows different
species of weeds with their families which were identified on two sites i.e.
Amuru and Mukono. Based on their reproductive mode, the following groups
were distinguished: - Grasses, broadleaved species and sedges. Eighteen (18)
weed species comprising nine broadleaved, five grasses and four sedges were
identified in weedy plots by grouping weeds according to their methods of
reproduction (Table 4.1). Broad-leaved weeds constituted about 58% of the total
dry matter and 48 % of total density, followed by grasses (34 and 40% total dry
matter and density, respectively) and sedges (5.8 and 2%, respectively). The
dominant broadleaved species were Amarathus spp (L.), Bidens pilosa (L) and
Galinsoga parifilora (L) and grasses were Eluisne indica (L) and Echinochloa
colonum (L.) while sedges were Cyperus difformis.

41
Table 4.1: Relative density (%) of different weed species in the unweeded plots at
two different stages in Amuru and Mukono district Uganda in 2013
SITES Amuru Mukono
Infestation
rate (%)
Infestation
rate (%)
Infestation rate (%)
Infestation
rate (%)
Weeds Type 40 DAS 60 DAS 40 DAS 60 DAS
Bidens Pilosa Broadleaved 10.8 12.2 13.5 2.4
Amaranthus viridis Broadleaved 9.5 7.5 24.1 6.6
Chenopodium spp Broadleaved 8.7 1.5 7.7 3.4
Desmodium tortosum Broadleaved 8.2 5.2 6.3 4.3
Echinochloa colona Grasses 6.3 10.4 5.3 8.6
Ageratum connyzoids Broad leaves 8.9 5.5 7.9 5.6
Camalina. benghalensis Broadleaves 2.6 3.7 2.6 2.8
Chromolaena odorata Broad leaves 1.2 10.4 2.1 9.5
Clotalaria incana Broad leaves 1.8 0.0 2.0 8.2
Galinsoga paviflora Broad leaves 4.3 10.6 3.3 9.7
Digitaria ciliaris Grasses 2.3 4.3 1.3 3.4
Eleusine indica Grasses 13.6 12.7 2.3 11.8
Vernonia pauciflora broad leaves 1.2 0.0 3.0 1.6
Rotlobellia exacltata Grass 2.9 6.8 1.9 5.9
Cynodon dactylon Grasses 3.5 5.9 2.5 5.0
Cyperus esculentus sedge s 7.3 1.0 6.3 3.5
Cyperus sphacelatus sedge s 0.0 1.1 3.2 2.6
Cyperus rotundus L sedge s 1.3 0.0 4.3 1.8
Cyperus iria L. sedges 5.6 1.2 0.0 3.4
100 100 100 100
42
Monocot weed species appeared along the early stage while dicot weed species
were most dominant at later stages. At 40 DAS Amaranthus L. was dominant
weed species (33%) followed by Bidens pilosa, but at 60 DAS Elusine indica (L)
was the most dominant weed species (12.2%) followed by Galinsoga pauilflora
(L) as the next dominant weed species (9.8 %) across both sites.(Table 4.1). Such
diversity in weed population has been previously reported by Hakim, Juraimi,
Ismail, Hanafi and Selamat (2013) in rice fields in Malaysia. Weed succession
and distribution patterns in rice fields are dynamic in nature. The composition of
the weed flora may differ depending on location (Begum, Juraimi, Azmi, Syed
and Rajan 2008; Uddin, Juraimi, Ismail and Brosnan, 2010). It was apparent that
higher weed species were recorded in Amuru than in Mukono. This species
dominance pattern variation between districts were mostly likely due to the
differences in rainfall and soil moisture according Juraimi, Begum, Sherif and
Rajan (2009) who reported that rice weed community was strongly influenced by
soil moisture conditions.
Based on summed dominance ratio (SDR), averaged over sites, the most
dominant weed species could be arranged in the order of .Amarathus (L.) >
Galinsoga parifilora (L) Eluisne indica >, Echinochloa colonum > Cyperus
difformis. The weed community was mostly dominated by broadleaf weeds
followed by sedges and grasses, (Table 4.1). Results have revealed variation in
43
SDR in different weeds in rice as reported by Juraimi, Saifu, Uddin, Anuar and
Azmi (2011).
4.2 Weed Density
4.2.1 Effect of weed control regimes on weed biomass
In Amuru (Fig 4.1; Table 4.5) the lowest amount of weed biomass was
recorded in 2-hoe/hand-weeding treatments (156.4gms) followed by one hoe-
weeding treatments (244.3gms) (which were statistically significant at p≤0.05).
The highest biomass (452gms) was observed in no weeding treatments. Similar
trends were also observed in Mukono with the lowest amount of weed biomass
recorded at two hoe-weeding (143.7gms) followed by one hoe weeding (200 gms)
and the highest one (432gms) per meter sq. was observed in no weeding
treatments. These were all statistically significant at p≤0.05. Result indicates that
proper weed management significantly reduced weed biomass.
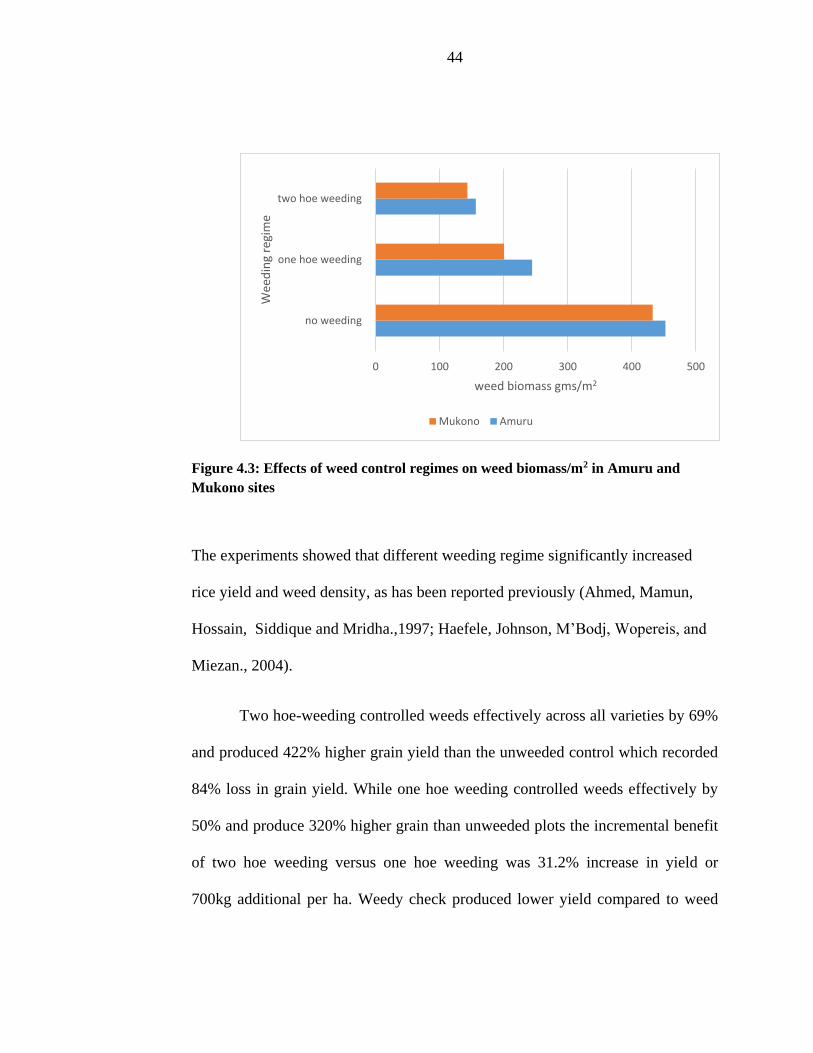
44
Figure 4.3: Effects of weed control regimes on weed biomass/m2 in Amuru and
Mukono sites
The experiments showed that different weeding regime significantly increased
rice yield and weed density, as has been reported previously (Ahmed, Mamun,
Hossain, Siddique and Mridha.,1997; Haefele, Johnson, M’Bodj, Wopereis, and
Miezan., 2004).
Two hoe-weeding controlled weeds effectively across all varieties by 69%
and produced 422% higher grain yield than the unweeded control which recorded
84% loss in grain yield. While one hoe weeding controlled weeds effectively by
50% and produce 320% higher grain than unweeded plots the incremental benefit
of two hoe weeding versus one hoe weeding was 31.2% increase in yield or
700kg additional per ha. Weedy check produced lower yield compared to weed
0 100 200 300 400 500
no weeding
one hoe weeding
two hoe weeding
weed biomass gms/m2
Wee
din
g re
gim
e
Mukono Amuru
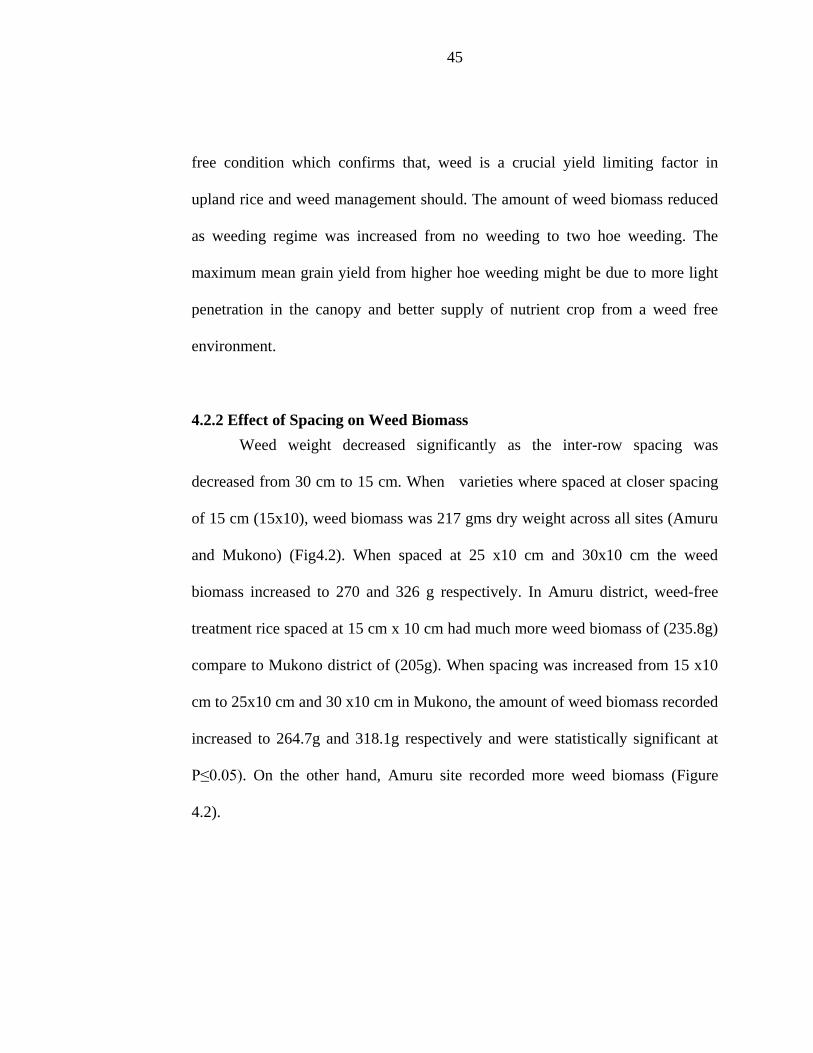
45
free condition which confirms that, weed is a crucial yield limiting factor in
upland rice and weed management should. The amount of weed biomass reduced
as weeding regime was increased from no weeding to two hoe weeding. The
maximum mean grain yield from higher hoe weeding might be due to more light
penetration in the canopy and better supply of nutrient crop from a weed free
environment.
4.2.2 Effect of Spacing on Weed Biomass
Weed weight decreased significantly as the inter-row spacing was
decreased from 30 cm to 15 cm. When varieties where spaced at closer spacing
of 15 cm (15x10), weed biomass was 217 gms dry weight across all sites (Amuru
and Mukono) (Fig4.2). When spaced at 25 x10 cm and 30x10 cm the weed
biomass increased to 270 and 326 g respectively. In Amuru district, weed-free
treatment rice spaced at 15 cm x 10 cm had much more weed biomass of (235.8g)
compare to Mukono district of (205g). When spacing was increased from 15 x10
cm to 25x10 cm and 30 x10 cm in Mukono, the amount of weed biomass recorded
increased to 264.7g and 318.1g respectively and were statistically significant at
P≤0.05). On the other hand, Amuru site recorded more weed biomass (Figure
4.2).
46
Figure 4.2: Effects of different spacing on weed biomass/m2 at Amuru and Mukono
sites
The effect of spacing showed significant variation in respect of almost all yield
contributing characters viz., total tillers hill-1, number of panicles per meter ,
number of total grains panicle, grain yield, leaf area index straw yield and panicle
length whereas weight of 1000 grains were not significantly influenced by effect
of spacing. Highest numbers of total tillers per meter (174) (164) and panicles per
meter (155) (143) were obtained from 25cm × 10cm spacing and grain yield of
(1957 kg/ha) (1877 kg /ha) but the highest yield was obtained from 30cm × 10cm
spacing (2176 kg/ha) (2106 kg/ha) (Table 4.5). The highest straw yield (3609
kg/ha) (3495 kg/ha) was also obtained from 25cm × 10cm spacing and the lowest
straw yield (2811 kg/ha) (2691 kg/ha) was observed in 15cm × 10cm spacing.
The highest plant height was (96.7cm ) was found in 30cm × 10 cm spacing
0
50
100
150
200
250
300
350
400
15 cm X 10 cm 25 cm X 10 cm 30 cm X 10 cm
wee
d b
iom
ass/
m2
spacing
Amuru Mukono
47
which was followed by (91.3cm) with spacing of 25cm × 10cm. The lowest plant
height (90.4 cm) was found from 15cm × 10cm spacing. Mobasser, Delarestaghi,
Khorgami, Tari and Pourkalhor (2007) showed that plant height was decreased
significantly with increase of planting density, which supports the present results.
The finding indicated that under increased plant density, intra- specific
competition for light and nutrient leads to reduction in grain yield and plant
height. Similar results were reported in several studies that reveal that, high seed
rate may bring about problems of mutual shading and intra-specific competition
for below-ground resources (Bond, Walker, Bollich, Koger and Gerard., 2005)
that harm crop yield and growth. This could also have effect on weeds. Estorninos
and Moody (1976) and Kim and Moody (1989) have shown that, as the planting
distance between hills of transplanted rice is reduced, the crop becomes more
competitive against weeds, and yield losses due to weeds are reduced. Rao,
Johnson, Sivaprasad, Ladha and Mortimer (2007) reported that, in addition to
reducing weed weight and weed competition, closer plant spacing resulted in
more options from which a farmer could select a suitable weed control practice.
4.2.3 Effect of Variety on Weed Biomass
The effect of variety on weed biomass showed significant variation in
respect to weed biomass in both sites per meter square. (Table 4.5) The highest
mean weight of weed biomass was recorded under NERICA 10 (413g), while
NERICA 1 and NERICA 4 had (231.1g) and (208.8 g) respectively under the
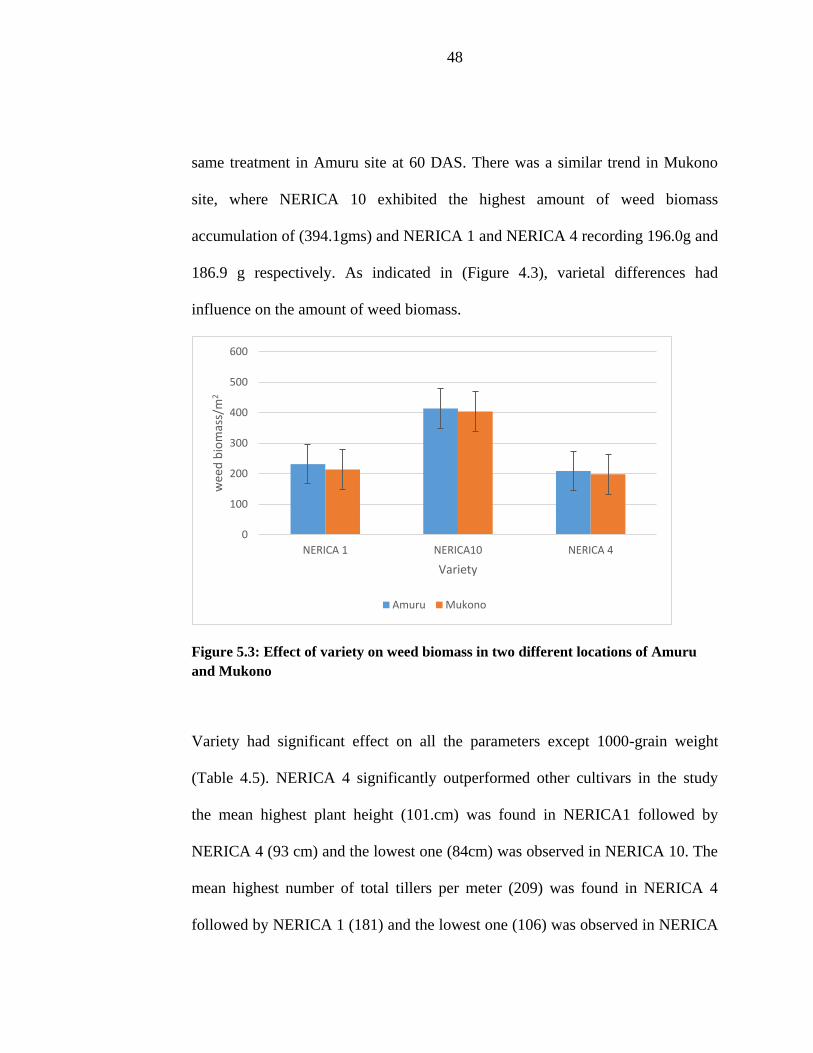
48
same treatment in Amuru site at 60 DAS. There was a similar trend in Mukono
site, where NERICA 10 exhibited the highest amount of weed biomass
accumulation of (394.1gms) and NERICA 1 and NERICA 4 recording 196.0g and
186.9 g respectively. As indicated in (Figure 4.3), varietal differences had
influence on the amount of weed biomass.
Figure 5.3: Effect of variety on weed biomass in two different locations of Amuru
and Mukono
Variety had significant effect on all the parameters except 1000-grain weight
(Table 4.5). NERICA 4 significantly outperformed other cultivars in the study
the mean highest plant height (101.cm) was found in NERICA1 followed by
NERICA 4 (93 cm) and the lowest one (84cm) was observed in NERICA 10. The
mean highest number of total tillers per meter (209) was found in NERICA 4
followed by NERICA 1 (181) and the lowest one (106) was observed in NERICA
0
100
200
300
400
500
600
NERICA 1 NERICA10 NERICA 4
wee
d b
iom
ass/
m2
Variety
Amuru Mukono
49
10. The highest number of panicle per meter (169) was obtained from NERICA 4
followed by NERICA 1(150) and the lowest one (85) in NERICA 10. Number of
grains panicle-1 was found the highest (120.2) from NERICA 4 followed by
NERICA 1 (115.6) and the lowest number of grains panicle-1 (86.7) was found in
NERICA 10.
The longest panicle length was observed in (22.4cm) in NERICA 4 closely
followed by NERICA 1 (20.8cm) and the shortest length (16.4cm) was observed
in NERICA 10. Among the varieties, NERICA 4 produced the highest grain yield
(2139 kg/ha), closely followed by NERICA 1 (2086 kg/ha) while the lowest grain
yield (1671 kg/ha) was obtained from NERICA 10.The highest straw yield (3990
kg/ha) was found from NERICA 4 The lowest straw yield (2510 kg/ha) was
obtained from NERICA 10. The highest Leaf area index (2.0) was found in
NERICA 1 which was similar in NERICA 4 and the lowest Leaf area index (1.86)
was found from in NERICA 10. Increase in grain yields of NERICA 4 is not a
deviation of genotypic differences in relation to varietal characteristics. This
cultivar consistently produced higher yields even under no weeding treatment
suggesting genotypic based response vis-à-vis grain yield increase due to weeding
density. Result indicates that the differential growth with respect to parameters
measured and observed among the varieties may be attributed to differences in
genetic characteristics of the individual varieties, including rapid growth rates,
LAI, tallness or shortness of species. This is similar to the findings of previous
50
work of several workers (Majambu, Ogunlella, and Ahmed., 1996; Ibrahim,
Amans, and Abubakar., 2000) who attributed the differences in growth indices of
crops to genetic constitution and proper weed management that eventually
contributed increased plant height, yield and the number of total tillers per meter.
This was further confirmed by other studies (Power and Alessi, 1978) that grain
yield of cereals is highly dependent upon the number of effective tillers per
produced by each plant which is controlled by genotype and environmental
interaction.
4.3 Interaction Effect of Variety and Weeding Regime on Weed Biomass
The variety x weeding interaction was statistically significant at P≤0.05
(Figures 4.4a and 4.4 b,). Under no weeding treatment, NERICA 1 had the lowest
weed biomass (366gms), closely followed by NERICA 4 (372 grams) while
NERICA 10 had the highest weed biomass (593gms) across both sites. This was
the same trend when the varieties were subjected to one hoe weeding(15DAGS)
NERICA 1(186gms)(138 gms) had the lowest weed biomass closely followed by
NERICA 4(197gms)(141 gms) and the highest weed biomass was found in
NERICA 10 (350gms)(323 gms) in Amuru and Mukono respectively .But when
the Varieties was subjected to 2 hoe weeding treatment(15 and 35 DAGS)
NERICA 4 had the lowest weed biomass of (56 gms) (48 gms) in Amuru and
Mukono respectively while NERICA 1 under the same treatment recorded
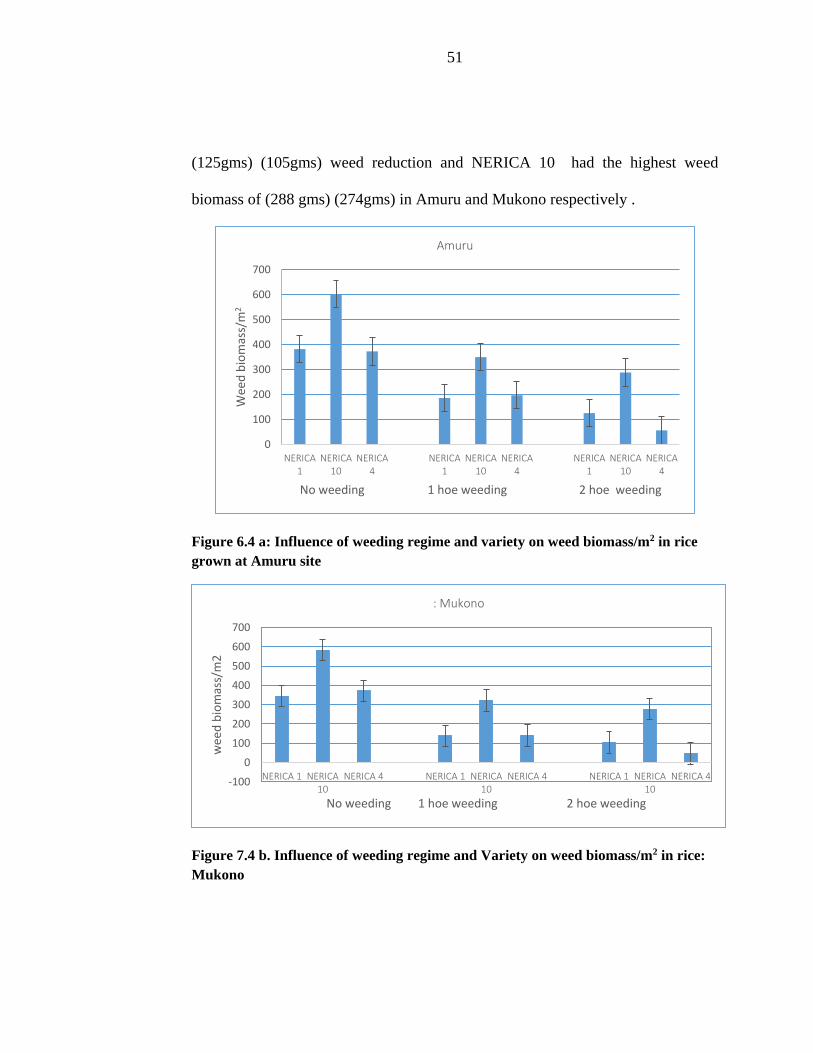
51
(125gms) (105gms) weed reduction and NERICA 10 had the highest weed
biomass of (288 gms) (274gms) in Amuru and Mukono respectively .
Figure 6.4 a: Influence of weeding regime and variety on weed biomass/m2 in rice
grown at Amuru site
Figure 7.4 b. Influence of weeding regime and Variety on weed biomass/m2 in rice:
Mukono
0
100
200
300
400
500
600
700
NERICA1
NERICA10
NERICA4
NERICA1
NERICA10
NERICA4
NERICA1
NERICA10
NERICA4
Wee
d b
iom
ass/
m2
No weeding 1 hoe weeding 2 hoe weeding
Amuru
-100
0
100
200
300
400
500
600
700
NERICA 1 NERICA10
NERICA 4 NERICA 1 NERICA10
NERICA 4 NERICA 1 NERICA10
NERICA 4
wee
d b
iom
ass/
m2
No weeding 1 hoe weeding 2 hoe weeding
: Mukono
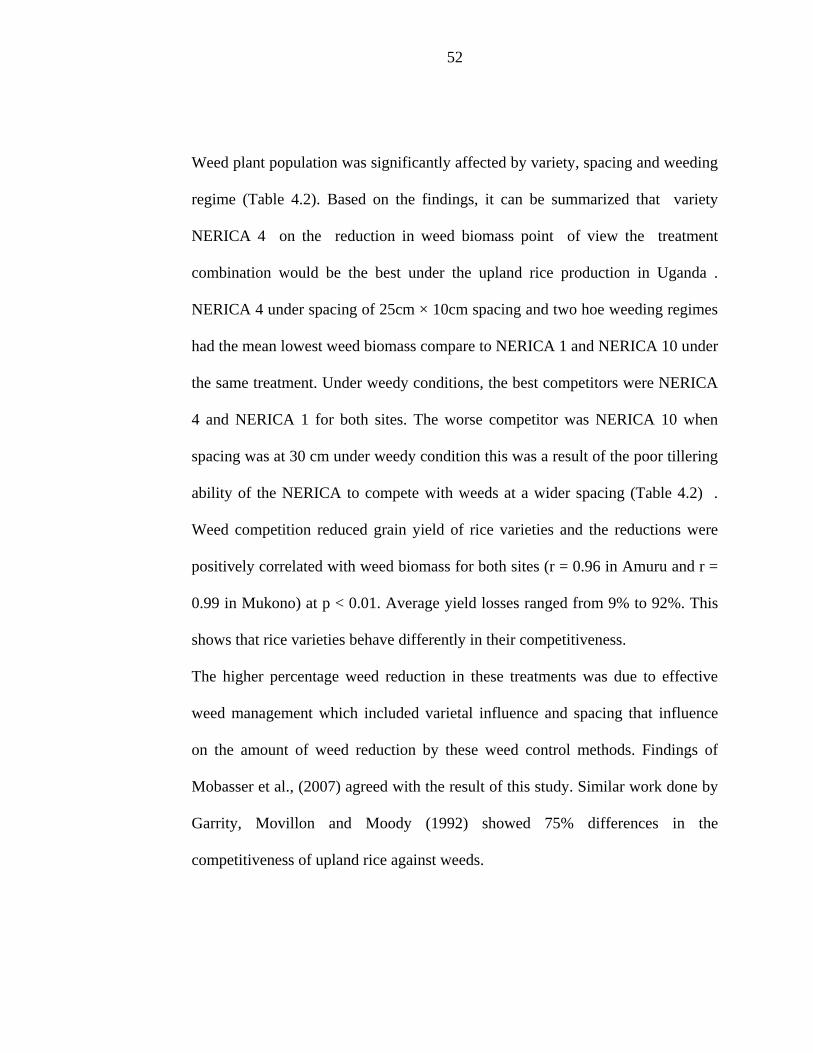
52
Weed plant population was significantly affected by variety, spacing and weeding
regime (Table 4.2). Based on the findings, it can be summarized that variety
NERICA 4 on the reduction in weed biomass point of view the treatment
combination would be the best under the upland rice production in Uganda .
NERICA 4 under spacing of 25cm × 10cm spacing and two hoe weeding regimes
had the mean lowest weed biomass compare to NERICA 1 and NERICA 10 under
the same treatment. Under weedy conditions, the best competitors were NERICA
4 and NERICA 1 for both sites. The worse competitor was NERICA 10 when
spacing was at 30 cm under weedy condition this was a result of the poor tillering
ability of the NERICA to compete with weeds at a wider spacing (Table 4.2) .
Weed competition reduced grain yield of rice varieties and the reductions were
positively correlated with weed biomass for both sites (r = 0.96 in Amuru and r =
0.99 in Mukono) at p < 0.01. Average yield losses ranged from 9% to 92%. This
shows that rice varieties behave differently in their competitiveness.
The higher percentage weed reduction in these treatments was due to effective
weed management which included varietal influence and spacing that influence
on the amount of weed reduction by these weed control methods. Findings of
Mobasser et al., (2007) agreed with the result of this study. Similar work done by
Garrity, Movillon and Moody (1992) showed 75% differences in the
competitiveness of upland rice against weeds.
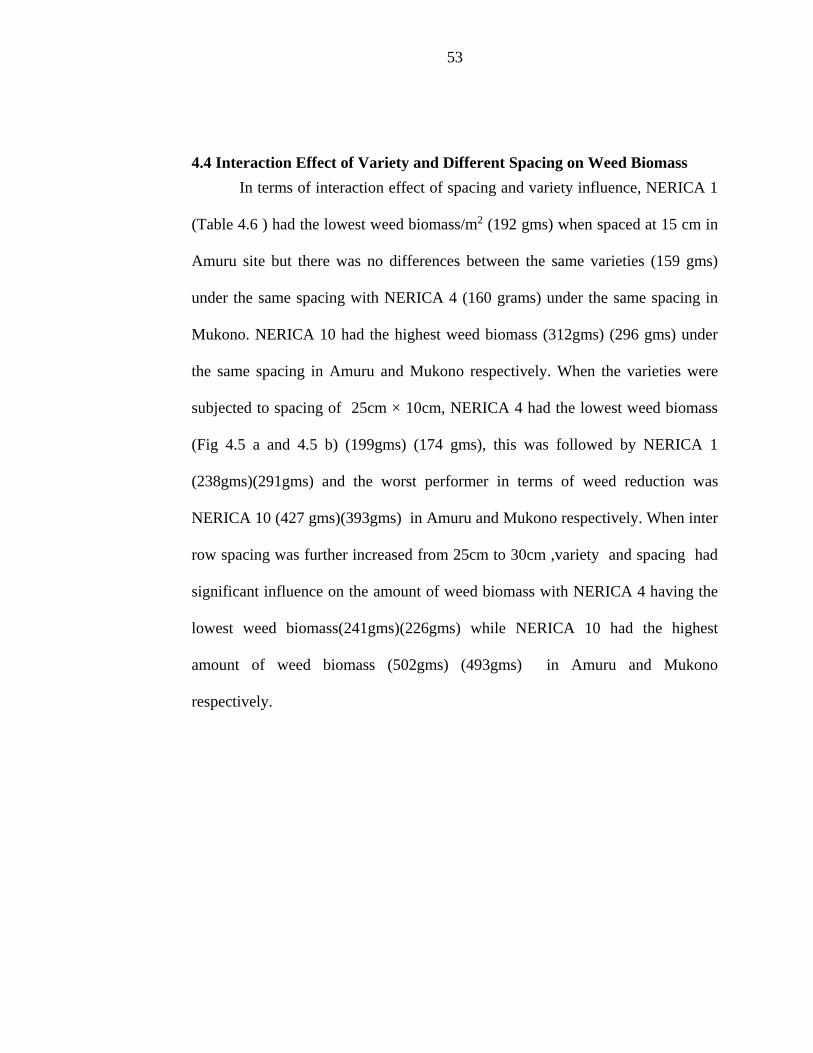
53
4.4 Interaction Effect of Variety and Different Spacing on Weed Biomass
In terms of interaction effect of spacing and variety influence, NERICA 1
(Table 4.6 ) had the lowest weed biomass/m2 (192 gms) when spaced at 15 cm in
Amuru site but there was no differences between the same varieties (159 gms)
under the same spacing with NERICA 4 (160 grams) under the same spacing in
Mukono. NERICA 10 had the highest weed biomass (312gms) (296 gms) under
the same spacing in Amuru and Mukono respectively. When the varieties were
subjected to spacing of 25cm × 10cm, NERICA 4 had the lowest weed biomass
(Fig 4.5 a and 4.5 b) (199gms) (174 gms), this was followed by NERICA 1
(238gms)(291gms) and the worst performer in terms of weed reduction was
NERICA 10 (427 gms)(393gms) in Amuru and Mukono respectively. When inter
row spacing was further increased from 25cm to 30cm ,variety and spacing had
significant influence on the amount of weed biomass with NERICA 4 having the
lowest weed biomass(241gms)(226gms) while NERICA 10 had the highest
amount of weed biomass (502gms) (493gms) in Amuru and Mukono
respectively.
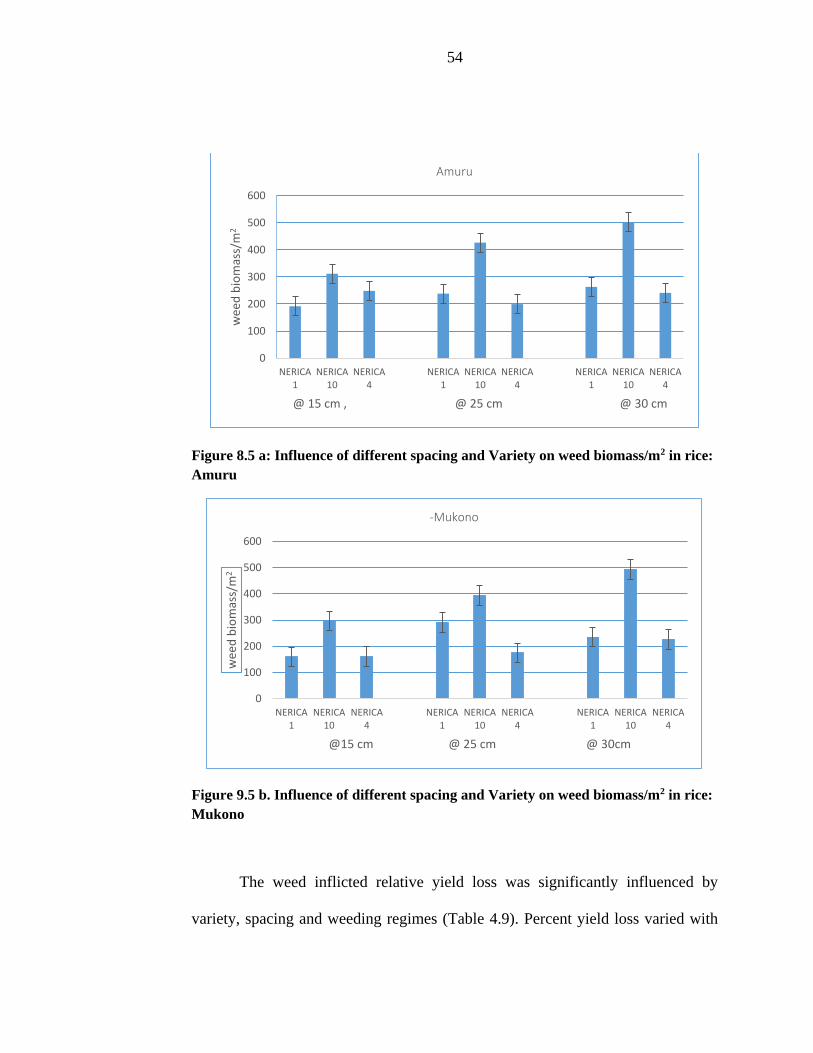
54
Figure 8.5 a: Influence of different spacing and Variety on weed biomass/m2 in rice:
Amuru
Figure 9.5 b. Influence of different spacing and Variety on weed biomass/m2 in rice:
Mukono
The weed inflicted relative yield loss was significantly influenced by
variety, spacing and weeding regimes (Table 4.9). Percent yield loss varied with
0
100
200
300
400
500
600
NERICA1
NERICA10
NERICA4
NERICA1
NERICA10
NERICA4
NERICA1
NERICA10
NERICA4
wee
d b
iom
ass/
m2
@ 15 cm , @ 25 cm @ 30 cm
Amuru
0
100
200
300
400
500
600
NERICA1
NERICA10
NERICA4
NERICA1
NERICA10
NERICA4
NERICA1
NERICA10
NERICA4
wee
d b
iom
ass/
m2
@15 cm @ 25 cm @ 30cm
-Mukono
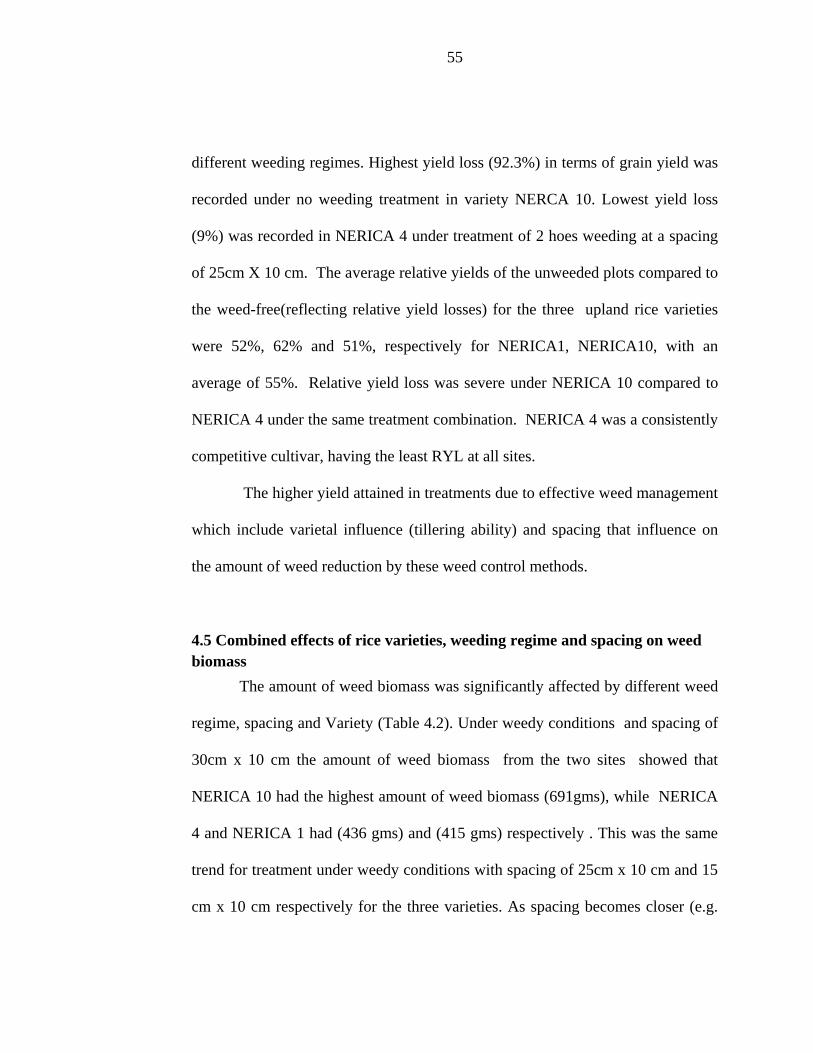
55
different weeding regimes. Highest yield loss (92.3%) in terms of grain yield was
recorded under no weeding treatment in variety NERCA 10. Lowest yield loss
(9%) was recorded in NERICA 4 under treatment of 2 hoes weeding at a spacing
of 25cm X 10 cm. The average relative yields of the unweeded plots compared to
the weed-free(reflecting relative yield losses) for the three upland rice varieties
were 52%, 62% and 51%, respectively for NERICA1, NERICA10, with an
average of 55%. Relative yield loss was severe under NERICA 10 compared to
NERICA 4 under the same treatment combination. NERICA 4 was a consistently
competitive cultivar, having the least RYL at all sites.
The higher yield attained in treatments due to effective weed management
which include varietal influence (tillering ability) and spacing that influence on
the amount of weed reduction by these weed control methods.
4.5 Combined effects of rice varieties, weeding regime and spacing on weed
biomass
The amount of weed biomass was significantly affected by different weed
regime, spacing and Variety (Table 4.2). Under weedy conditions and spacing of
30cm x 10 cm the amount of weed biomass from the two sites showed that
NERICA 10 had the highest amount of weed biomass (691gms), while NERICA
4 and NERICA 1 had (436 gms) and (415 gms) respectively . This was the same
trend for treatment under weedy conditions with spacing of 25cm x 10 cm and 15
cm x 10 cm respectively for the three varieties. As spacing becomes closer (e.g.
56
15cm x10 cm) the varieties tend to reduce the weed biomass as a result higher
seed density and tillering ability of specific varieties to compete with weeds but
when spacing was increased further to 25 cm and 30 cm, NERICA 10 recorded
the highest weed biomass, probably as a result of poor tillering ability, while
NERICA 1 and NERICA 4 had reduced weed biomass. At 60DAS under single
hoe weeding, couple with spacing of 15cm x 10cm.
NERICA 4 exhibited the low (172gms) (98 gms) amount of weed biomass and
this was closely followed by NERICA 1 (169gms) (117 gms) while NERICA 10
still recorded the highest amount of biomass of (283 gms) (278 gms) in Amuru
and Mukono site respectively
The results revealed a weed biomass reduction of 40 % as a result of one hoe
weeding against no weeding treatments with NERICA 10. There was a similar
observable trend among the varieties under this treatment (Table 4.2). When the
crop was hoe-weeded twice at 15 and 35 DAGS , coupled with a spacing of 15 cm
x 10 cm, the amount of weed biomass was the lowest in NERICA 4 (56 gms)(43
gms) , NERICA 1 (82 gms) (69 gms) and the highest NERICA 10 (145gms) (138
gms) in Amuru and Mukono respectively.
When weed control efficiency was compared among treatments (Table
4.3.) NERICA 4 with 2 hoe-weeding under row spacing of 25 cm gave highest
weed reduction of (91%) (87%) while NERICA 10 (50%) (46%) and NERICA 1
(65%) (69%) under same treatment in Amuru and Mukono respectively. When
57
treatment of two hoe weeding with closely spacing of 15 x10 cm, NERICA 4 still
performed better (86%) (86%) than NERICA 1(79%) (71%) while NERICA 10
under same treatment had (73%) (71%) and the lowest was recorded in unweeded
check plot (0.00 %) (Table 4.3). In general the e highest average weed control
efficiency (72.2%) was recorded with variety NERICA 4 and the lowest with the
variety NERICA 10 (49.2%).
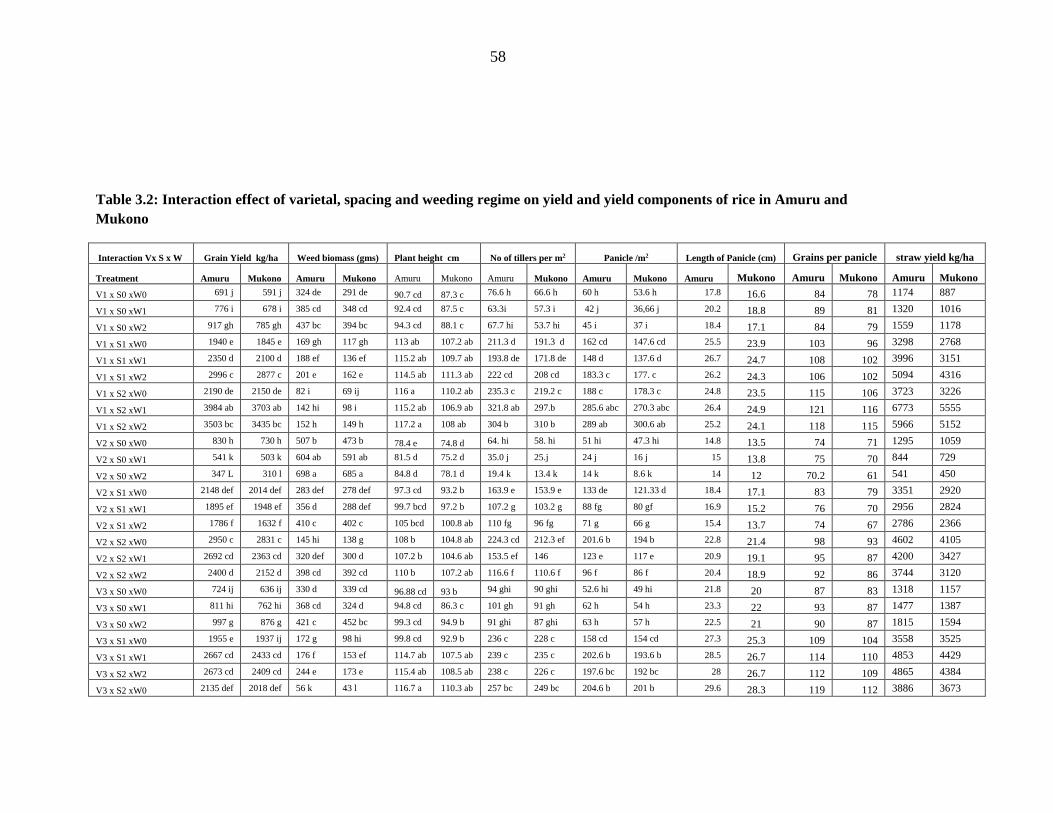
58
Table 3.2: Interaction effect of varietal, spacing and weeding regime on yield and yield components of rice in Amuru and
Mukono
Interaction Vx S x W Grain Yield kg/ha Weed biomass (gms) Plant height cm No of tillers per m2 Panicle /m2 Length of Panicle (cm) Grains per panicle straw yield kg/ha
Treatment Amuru Mukono Amuru Mukono Amuru Mukono Amuru Mukono Amuru Mukono Amuru Mukono Amuru Mukono Amuru Mukono
V1 x S0 xW0 691 j 591 j 324 de 291 de 90.7 cd 87.3 c 76.6 h 66.6 h 60 h 53.6 h 17.8 16.6 84 78 1174 887
V1 x S0 xW1 776 i 678 i 385 cd 348 cd 92.4 cd 87.5 c 63.3i 57.3 i 42 j 36,66 j 20.2 18.8 89 81 1320 1016
V1 x S0 xW2 917 gh 785 gh 437 bc 394 bc 94.3 cd 88.1 c 67.7 hi 53.7 hi 45 i 37 i 18.4 17.1 84 79 1559 1178
V1 x S1 xW0 1940 e 1845 e 169 gh 117 gh 113 ab 107.2 ab 211.3 d 191.3 d 162 cd 147.6 cd 25.5 23.9 103 96 3298 2768
V1 x S1 xW1 2350 d 2100 d 188 ef 136 ef 115.2 ab 109.7 ab 193.8 de 171.8 de 148 d 137.6 d 26.7 24.7 108 102 3996 3151
V1 x S1 xW2 2996 c 2877 c 201 e 162 e 114.5 ab 111.3 ab 222 cd 208 cd 183.3 c 177. c 26.2 24.3 106 102 5094 4316
V1 x S2 xW0 2190 de 2150 de 82 i 69 ij 116 a 110.2 ab 235.3 c 219.2 c 188 c 178.3 c 24.8 23.5 115 106 3723 3226
V1 x S2 xW1 3984 ab 3703 ab 142 hi 98 i 115.2 ab 106.9 ab 321.8 ab 297.b 285.6 abc 270.3 abc 26.4 24.9 121 116 6773 5555
V1 x S2 xW2 3503 bc 3435 bc 152 h 149 h 117.2 a 108 ab 304 b 310 b 289 ab 300.6 ab 25.2 24.1 118 115 5966 5152
V2 x S0 xW0 830 h 730 h 507 b 473 b 78.4 e 74.8 d 64. hi 58. hi 51 hi 47.3 hi 14.8 13.5 74 71 1295 1059
V2 x S0 xW1 541 k 503 k 604 ab 591 ab 81.5 d 75.2 d 35.0 j 25.j 24 j 16 j 15 13.8 75 70 844 729
V2 x S0 xW2 347 L 310 l 698 a 685 a 84.8 d 78.1 d 19.4 k 13.4 k 14 k 8.6 k 14 12 70.2 61 541 450
V2 x S1 xW0 2148 def 2014 def 283 def 278 def 97.3 cd 93.2 b 163.9 e 153.9 e 133 de 121.33 d 18.4 17.1 83 79 3351 2920
V2 x S1 xW1 1895 ef 1948 ef 356 d 288 def 99.7 bcd 97.2 b 107.2 g 103.2 g 88 fg 80 gf 16.9 15.2 76 70 2956 2824
V2 x S1 xW2 1786 f 1632 f 410 c 402 c 105 bcd 100.8 ab 110 fg 96 fg 71 g 66 g 15.4 13.7 74 67 2786 2366
V2 x S2 xW0 2950 c 2831 c 145 hi 138 g 108 b 104.8 ab 224.3 cd 212.3 ef 201.6 b 194 b 22.8 21.4 98 93 4602 4105
V2 x S2 xW1 2692 cd 2363 cd 320 def 300 d 107.2 b 104.6 ab 153.5 ef 146 123 e 117 e 20.9 19.1 95 87 4200 3427
V2 x S2 xW2 2400 d 2152 d 398 cd 392 cd 110 b 107.2 ab 116.6 f 110.6 f 96 f 86 f 20.4 18.9 92 86 3744 3120
V3 x S0 xW0 724 ij 636 ij 330 d 339 cd 96.88 cd 93 b 94 ghi 90 ghi 52.6 hi 49 hi 21.8 20 87 83 1318 1157
V3 x S0 xW1 811 hi 762 hi 368 cd 324 d 94.8 cd 86.3 c 101 gh 91 gh 62 h 54 h 23.3 22 93 87 1477 1387
V3 x S0 xW2 997 g 876 g 421 c 452 bc 99.3 cd 94.9 b 91 ghi 87 ghi 63 h 57 h 22.5 21 90 87 1815 1594
V3 x S1 xW0 1955 e 1937 ij 172 g 98 hi 99.8 cd 92.9 b 236 c 228 c 158 cd 154 cd 27.3 25.3 109 104 3558 3525
V3 x S1 xW1 2667 cd 2433 cd 176 f 153 ef 114.7 ab 107.5 ab 239 c 235 c 202.6 b 193.6 b 28.5 26.7 114 110 4853 4429
V3 x S2 xW2 2673 cd 2409 cd 244 e 173 e 115.4 ab 108.5 ab 238 c 226 c 197.6 bc 192 bc 28 26.7 112 109 4865 4384
V3 x S2 xW0 2135 def 2018 def 56 k 43 l 116.7 a 110.3 ab 257 bc 249 bc 204.6 b 201 b 29.6 28.3 119 112 3886 3673
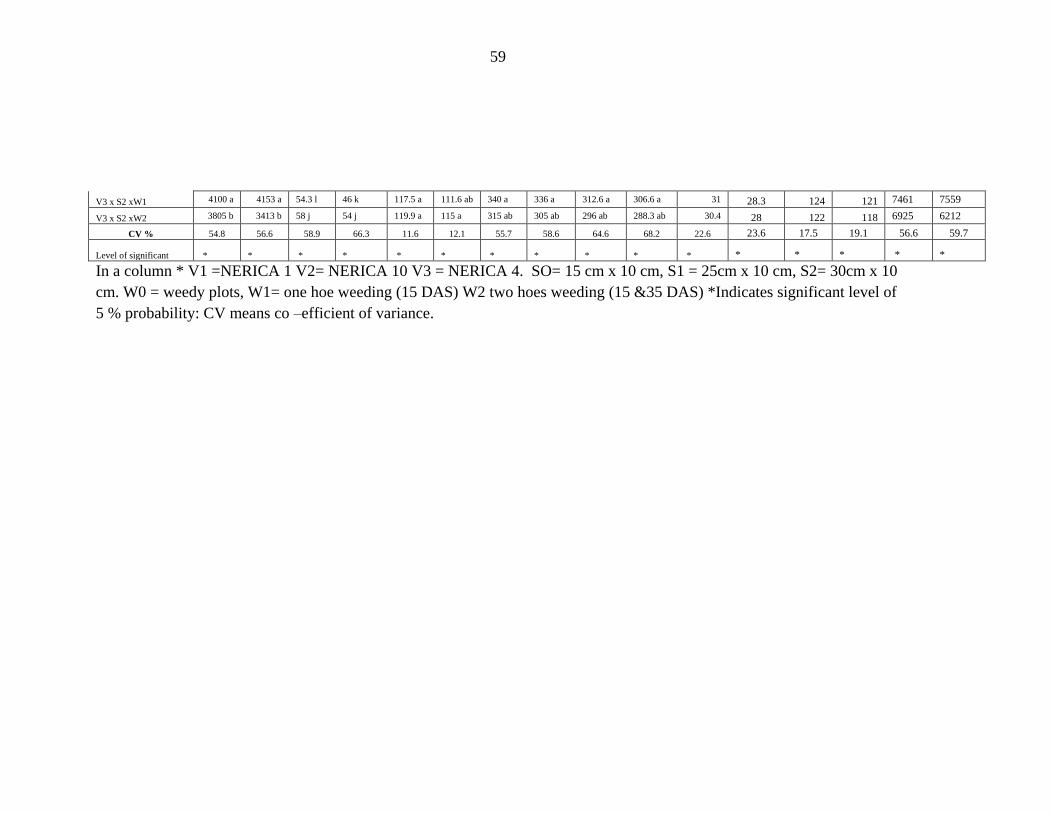
59
V3 x S2 xW1 4100 a 4153 a 54.3 l 46 k 117.5 a 111.6 ab 340 a 336 a 312.6 a 306.6 a 31 28.3 124 121 7461 7559
V3 x S2 xW2 3805 b 3413 b 58 j 54 j 119.9 a 115 a 315 ab 305 ab 296 ab 288.3 ab 30.4 28 122 118 6925 6212
CV % 54.8 56.6 58.9 66.3 11.6 12.1 55.7 58.6 64.6 68.2 22.6 23.6 17.5 19.1 56.6 59.7
Level of significant * * * * * * * * * * * * * * * *
In a column * V1 =NERICA 1 V2= NERICA 10 V3 = NERICA 4. SO= 15 cm x 10 cm, S1 = 25cm x 10 cm, S2= 30cm x 10
cm. W0 = weedy plots, W1= one hoe weeding (15 DAS) W2 two hoes weeding (15 &35 DAS) *Indicates significant level of
5 % probability: CV means co –efficient of variance.
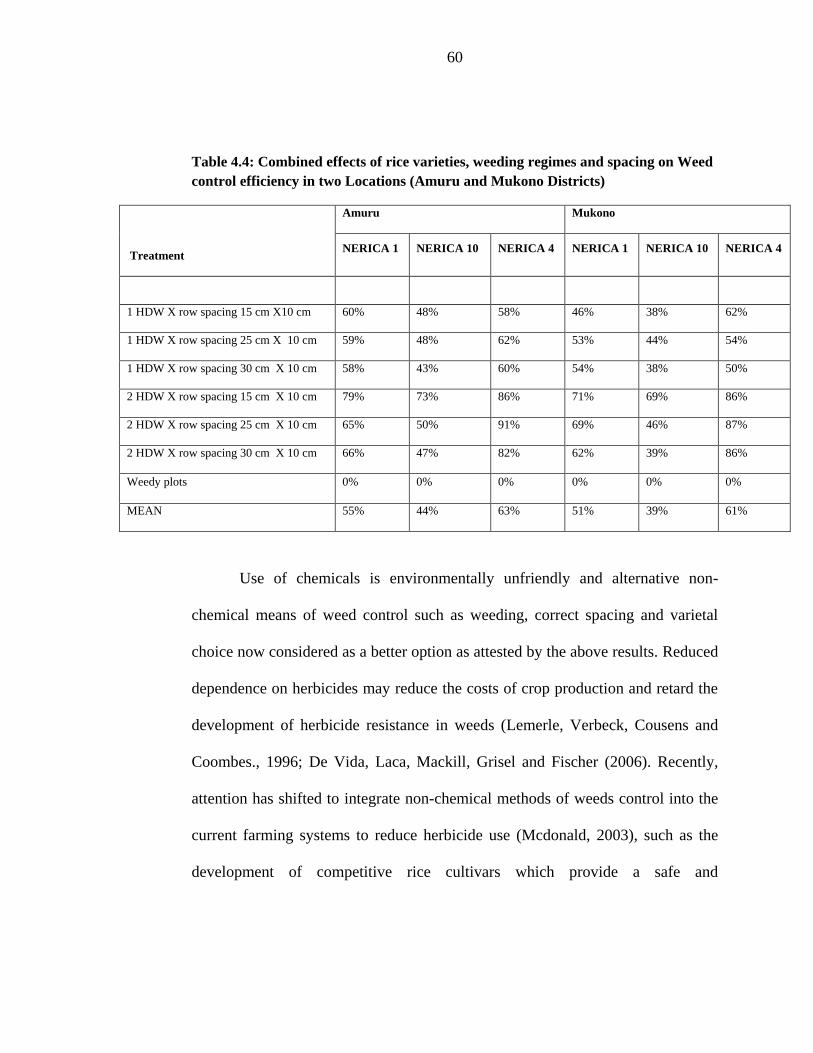
60
Table 4.4: Combined effects of rice varieties, weeding regimes and spacing on Weed
control efficiency in two Locations (Amuru and Mukono Districts)
Treatment
Amuru Mukono
NERICA 1 NERICA 10 NERICA 4 NERICA 1 NERICA 10 NERICA 4
1 HDW X row spacing 15 cm X10 cm 60% 48% 58% 46% 38% 62%
1 HDW X row spacing 25 cm X 10 cm 59% 48% 62% 53% 44% 54%
1 HDW X row spacing 30 cm X 10 cm 58% 43% 60% 54% 38% 50%
2 HDW X row spacing 15 cm X 10 cm 79% 73% 86% 71% 69% 86%
2 HDW X row spacing 25 cm X 10 cm 65% 50% 91% 69% 46% 87%
2 HDW X row spacing 30 cm X 10 cm 66% 47% 82% 62% 39% 86%
Weedy plots 0% 0% 0% 0% 0% 0%
MEAN 55% 44% 63% 51% 39% 61%
Use of chemicals is environmentally unfriendly and alternative non-
chemical means of weed control such as weeding, correct spacing and varietal
choice now considered as a better option as attested by the above results. Reduced
dependence on herbicides may reduce the costs of crop production and retard the
development of herbicide resistance in weeds (Lemerle, Verbeck, Cousens and
Coombes., 1996; De Vida, Laca, Mackill, Grisel and Fischer (2006). Recently,
attention has shifted to integrate non-chemical methods of weeds control into the
current farming systems to reduce herbicide use (Mcdonald, 2003), such as the
development of competitive rice cultivars which provide a safe and
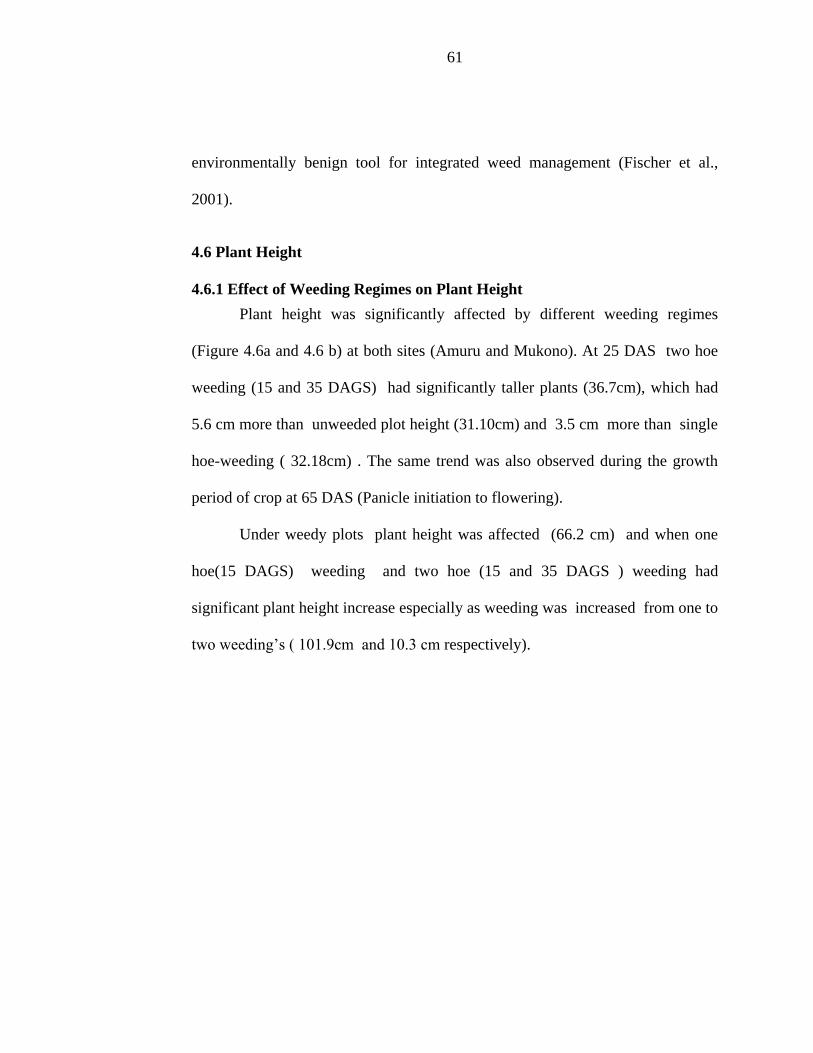
61
environmentally benign tool for integrated weed management (Fischer et al.,
2001).
4.6 Plant Height
4.6.1 Effect of Weeding Regimes on Plant Height
Plant height was significantly affected by different weeding regimes
(Figure 4.6a and 4.6 b) at both sites (Amuru and Mukono). At 25 DAS two hoe
weeding (15 and 35 DAGS) had significantly taller plants (36.7cm), which had
5.6 cm more than unweeded plot height (31.10cm) and 3.5 cm more than single
hoe-weeding ( 32.18cm) . The same trend was also observed during the growth
period of crop at 65 DAS (Panicle initiation to flowering).
Under weedy plots plant height was affected (66.2 cm) and when one
hoe(15 DAGS) weeding and two hoe (15 and 35 DAGS ) weeding had
significant plant height increase especially as weeding was increased from one to
two weeding’s ( 101.9cm and 10.3 cm respectively).
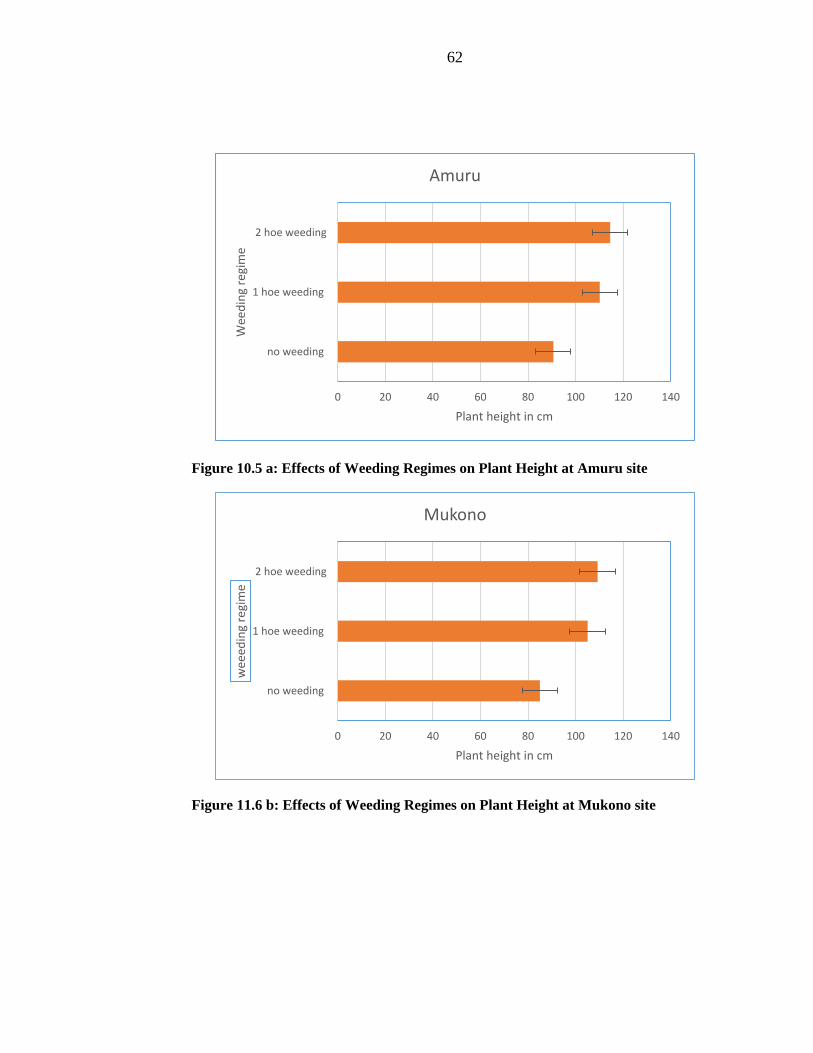
62
Figure 10.5 a: Effects of Weeding Regimes on Plant Height at Amuru site
Figure 11.6 b: Effects of Weeding Regimes on Plant Height at Mukono site
0 20 40 60 80 100 120 140
no weeding
1 hoe weeding
2 hoe weeding
Plant height in cm
Wee
din
g re
gim
e
Amuru
0 20 40 60 80 100 120 140
no weeding
1 hoe weeding
2 hoe weeding
Plant height in cm
wee
edin
g re
gim
e
Mukono
63
4.6. 2 Variety and Weeding Regime Interactions on Plant Height
The interaction between variety and weeding had significant effect on
plant height (Table 4.7). The highest plant height was (105 cm), exhibited by
NERICA4 under weed free (W2) condition and the lowest (82 cm) in NERICA 10
under no weeding (W0) condition. In Amuru. It was the same trend in Mukono as
the highest plant height was (100 cm) found in NERICA4 under weed free (W2)
condition and the lowest (76 cm) in NERICA 10 under no weeding (W0)
condition.
4.6.3 Effect of Spacing on Plant Height
In Amuru site at 25 DAS (Figure 4.7 a.), there was no significant
differences in plant height as influenced by spacing, however plant spacing of 25
cm X 10 cm attained a height of (36.97 cm) closely followed by spacing of 15cm
x 10 cm having a height of 35.69cm and spacing of 30 cm X 10 cm recording
the lowest height ( 35.31cm ) . At 60 DAS, plant spacing of 30cm x 10 cm
exhibited a height of 83.76cm which was superior to a spacing of 25cm x 10 cm
(78.73cm) and 15cm x 10 cm (77.19 cm). The same pattern was observed at 90
DAS with a spacing of 30 x 10 cm, which led to significantly taller plants
(96.67cm), while there was no significant different between row spacing 15 cm
(90.67 cm) and 25 cm (91.33 cm).
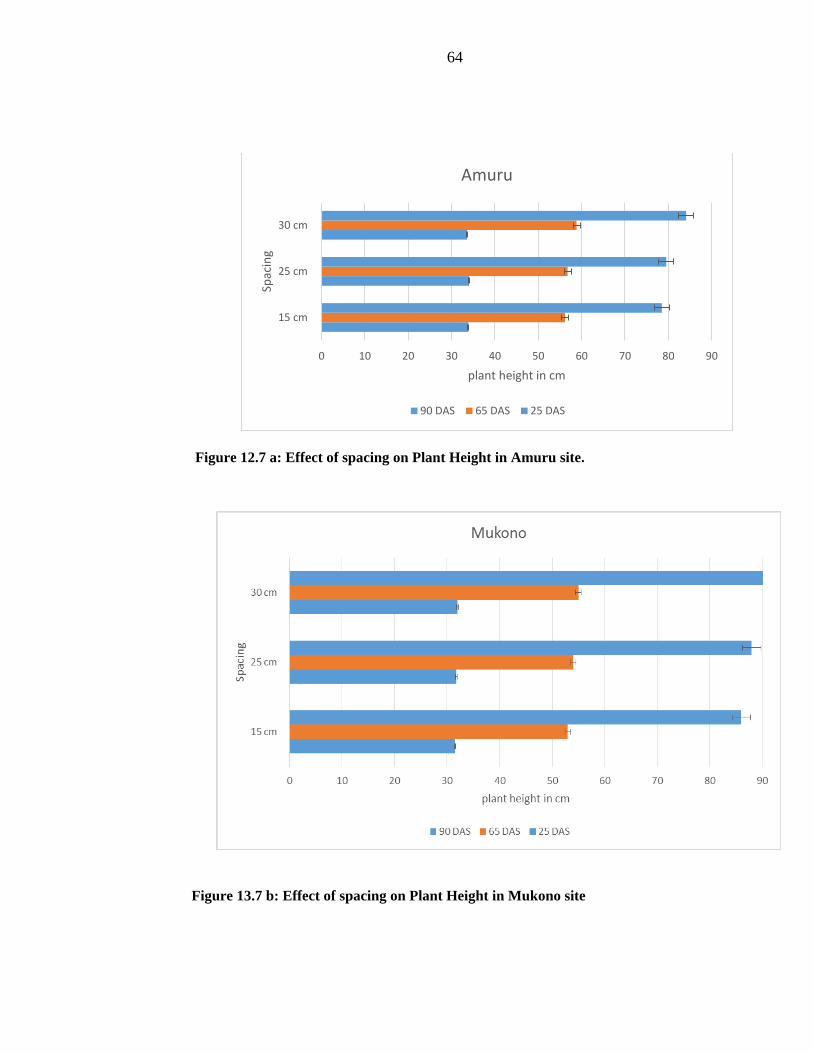
64
Figure 12.7 a: Effect of spacing on Plant Height in Amuru site.
Figure 13.7 b: Effect of spacing on Plant Height in Mukono site
0 10 20 30 40 50 60 70 80 90
15 cm
25 cm
30 cm
plant height in cm
Spac
ing
Amuru
90 DAS 65 DAS 25 DAS
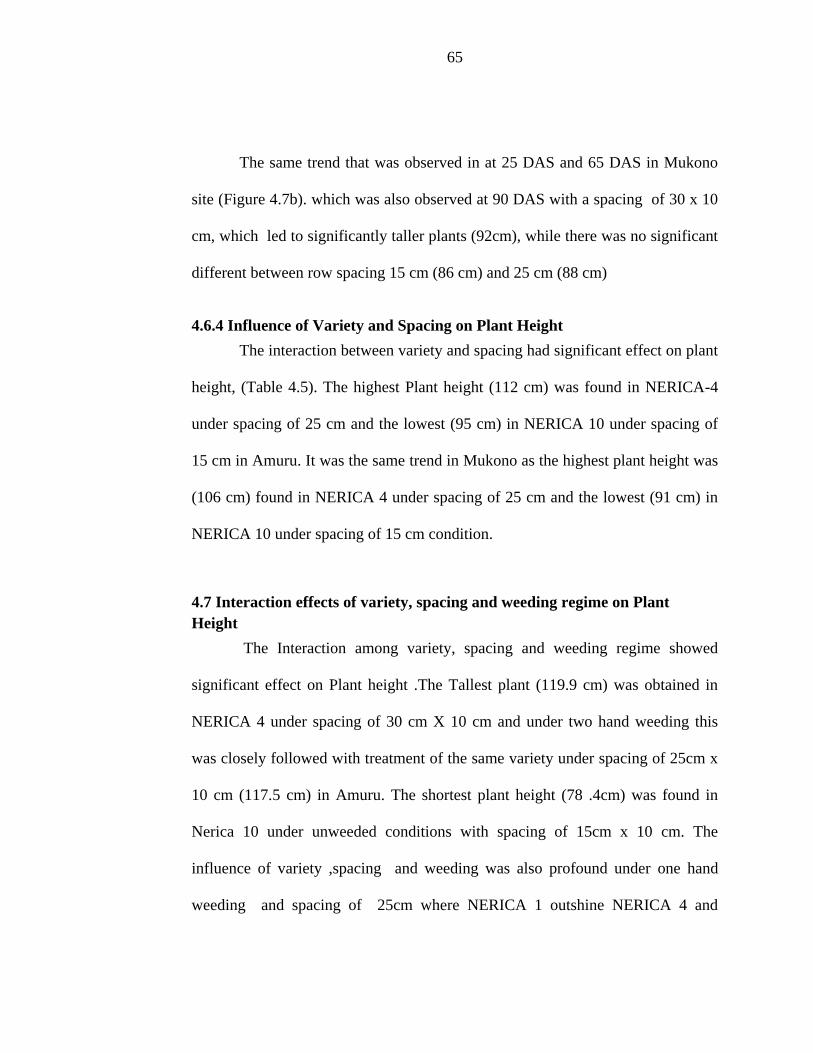
65
The same trend that was observed in at 25 DAS and 65 DAS in Mukono
site (Figure 4.7b). which was also observed at 90 DAS with a spacing of 30 x 10
cm, which led to significantly taller plants (92cm), while there was no significant
different between row spacing 15 cm (86 cm) and 25 cm (88 cm)
4.6.4 Influence of Variety and Spacing on Plant Height
The interaction between variety and spacing had significant effect on plant
height, (Table 4.5). The highest Plant height (112 cm) was found in NERICA-4
under spacing of 25 cm and the lowest (95 cm) in NERICA 10 under spacing of
15 cm in Amuru. It was the same trend in Mukono as the highest plant height was
(106 cm) found in NERICA 4 under spacing of 25 cm and the lowest (91 cm) in
NERICA 10 under spacing of 15 cm condition.
4.7 Interaction effects of variety, spacing and weeding regime on Plant
Height
The Interaction among variety, spacing and weeding regime showed
significant effect on Plant height .The Tallest plant (119.9 cm) was obtained in
NERICA 4 under spacing of 30 cm X 10 cm and under two hand weeding this
was closely followed with treatment of the same variety under spacing of 25cm x
10 cm (117.5 cm) in Amuru. The shortest plant height (78 .4cm) was found in
Nerica 10 under unweeded conditions with spacing of 15cm x 10 cm. The
influence of variety ,spacing and weeding was also profound under one hand
weeding and spacing of 25cm where NERICA 1 outshine NERICA 4 and
66
NERICA 10 with plant height of (115.2) cm compare to 114.7 cm and 99.7 cm
of NERICA4 and NERICA 10 respectively in Amuru district
When NERICA 10 was subjected to plant spacing of 15cm and one hoe
weeding plant height attain was 75.8 cm in Mukono but have positive influence
when under the same weeding regime spacing was increased to 25 cm and 30 cm
it plant height increased to 97.2cm and 104.8 cm respectively. This was a similar
trend in Amuru as indicated in Table 4.2
Plant height is one of the important growth parameters of any crop plant as
it determines or modifies the yield contributing characters and finally shapes the
grain yield. For instance, characteristics associated with high yielding modern
varieties, such as short stature and erect leaves, are considered to be unfavorable
for weed suppression (Johnson, Dingkuhn, Jones and Mahamane (1998a). From
the current findings plant height increased up to 95 DAS and its value mean
ranged from 25.63cm to 101.63 cm (Table 4.6), depending on weed control
method, spacing and variety used. The increment in plant height was most
intensive (58.2%) between 40 and 60 DAS. The interaction effect between weed
control method spacing and variety was significant at 40, 60 and 95 DAS. (Table
4.4). When NERICA 10 was subjected to plant spacing of 15cm plant height
attain was 69.8 cm across treatment when further subject to plant spacing of 25
cm and 30 cm it had negative response as planting height reduce to 67.3cm and
68.0 cm respectively. Results revealed that plant height was greater in all weeded
67
plots than in unweeded plot indicating weeding at any growth stages of rice has
positive effect on growth and development of rice.
This may be as a result of low tillering ability for variety to compete with
weeds at wider spacing this subjected the varietal to high weed density as reported
in Table 4.2. and Table 4.3 when NERICA 1 was subjected to the same
treatment plant height grew at average increment of 8.6 cm at 30 cm and 2.1 cm at
25 cm showing linear increase as spacing was increased. This was also in par
when NERICA 4 which gain plant height increment of 3.5cm at 25cm plant
spacing and 10cm increment at 30 cm plant spacing. NERICA 1 and NERICA4
were the tallest variety and the advantage of height was seen as a morphological
advantage for competition with weeds which resulted to less weed biomass (Table
4.2). Similar findings by various authors confirmed this result (De Vida et al.,
2006; Zhao et al., 2006; Moukoumbi et al., 2011). (This is similar to the findings
of Teasdale (1995), Widdicombe and Thelen (2002), and Dalley et al. (2006) who
attributed the increased growth rates and earlier canopy closure of narrow row
spaced crops to quest for increased light interception as well as increased
availability of soil moisture.
Mean results indicates that spacing in terms of reducing weed competition
between rice crop and weed is directly influence by tillering ability and plant
height of the variety which directly related to varietal characteristic. Contrasting
reports exists on whether plant height contributes to weed suppression in weed-

68
rice competition. Jennings and Aquino (1968), and Garrity, Movillon and Moody,
(1992) reported significant correlation between plant height and competitive
ability. Similar studies conducted by Fischer, Ramirez, Gibson, and Da Silviers-
Pinheiro (2001). revealed similar studies and attributed this to modern rice plant
types which have erect leaves that allow good light penetration deep into the
canopy. Plant to plant competition is common but not universal in natural
ecosystems. However, weed-crop competition is abundant, natural and
undesirable in agricultural plant communities (Zimdahl, 2004). Therefore,
choosing a competitive crop as revealed by the three NERICAs can be a way to
potentially suppress weed growth without sacrificing crop yield. However, crop
cultivars often differ in competitive ability against weeds. Cultivars may also
perform differently in different regions and growing conditions (Mason and
Spaner, 2006). It is also important to note that the most competitive cultivars are
not always the highest yielding cultivars. All these factors may influence the
choice of crop cultivars for weed use reduction.
4.8 Tillering
Tillering plays a vital role in determining rice grain yield since it is closely
related to number of panicle per unit ground area.
4.8.1 Effects of Weeding Regime on Tillering
From data showing effects of weeding regime are presented on Figure 4.8,
rice tillering ability was significantly affected by different weed control methods
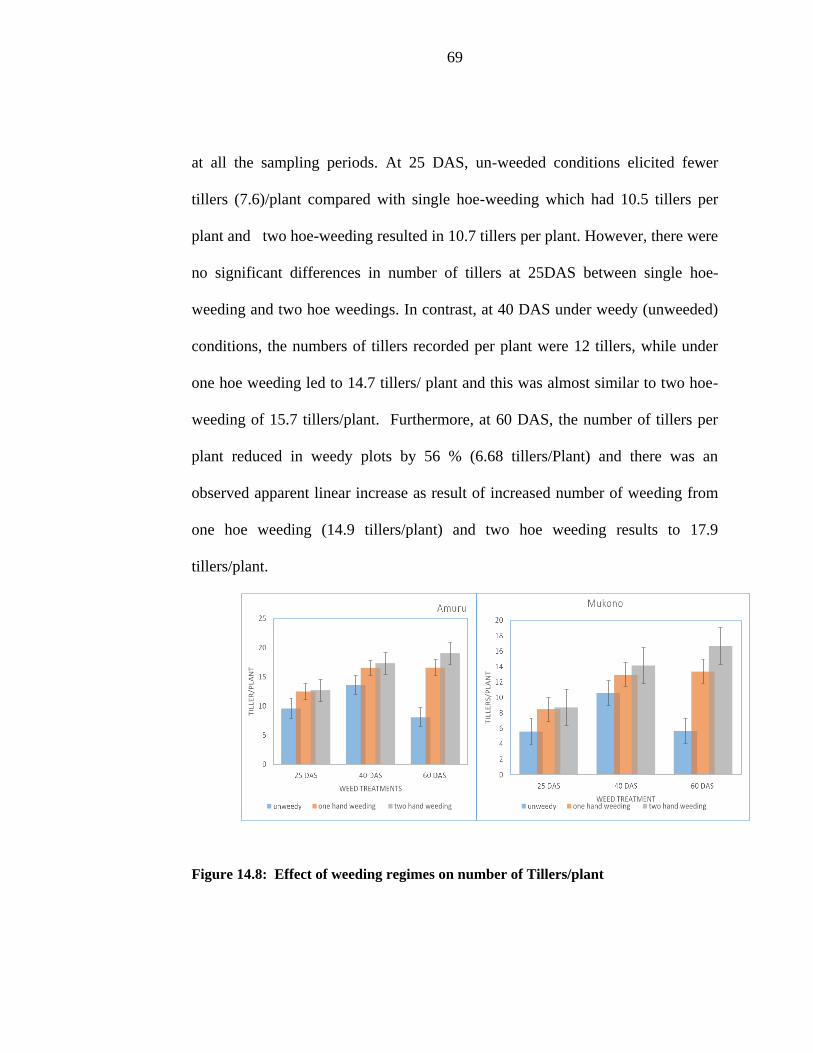
69
at all the sampling periods. At 25 DAS, un-weeded conditions elicited fewer
tillers (7.6)/plant compared with single hoe-weeding which had 10.5 tillers per
plant and two hoe-weeding resulted in 10.7 tillers per plant. However, there were
no significant differences in number of tillers at 25DAS between single hoe-
weeding and two hoe weedings. In contrast, at 40 DAS under weedy (unweeded)
conditions, the numbers of tillers recorded per plant were 12 tillers, while under
one hoe weeding led to 14.7 tillers/ plant and this was almost similar to two hoe-
weeding of 15.7 tillers/plant. Furthermore, at 60 DAS, the number of tillers per
plant reduced in weedy plots by 56 % (6.68 tillers/Plant) and there was an
observed apparent linear increase as result of increased number of weeding from
one hoe weeding (14.9 tillers/plant) and two hoe weeding results to 17.9
tillers/plant.
Figure 14.8: Effect of weeding regimes on number of Tillers/plant

70
4.8.2 Influence of Variety and Weeding Regime on Tillers/m2
Rice tillering ability was significantly affected (p=0.004) by influence of
variety and weeding regime in both sites Amuru and Mukono (Table 4.7) (Figure
4.9). Under no weeding treatment NERICA 4 produces more tillers
(89)(95),followed by NERICA 1(59)(68) and lowest tiller per meter was recorded
in NERICA 10 (32)(40).in Amuru and Mukono respectively .When Varieties
were subjected to one hoe weeding@ 15 DAS ,NERICA 4 produces the highest
number of tillers/m2 (230)(238) compare to NERICA 10 with the lowest tillers/
m2 (118)(127) in Amuru and Mukono respectively .This was in the same trend.
Figure 15.9 Influence of variety and weeding regime on tillers/m2
4.8.3 Effects of Spacing on Tillering
Effect of spacing on tillering at 25 DAS (Figure 4.10) with 30 cm x 10 cm
spacing gave higher average number of tillers per plant in both sites (10.3)
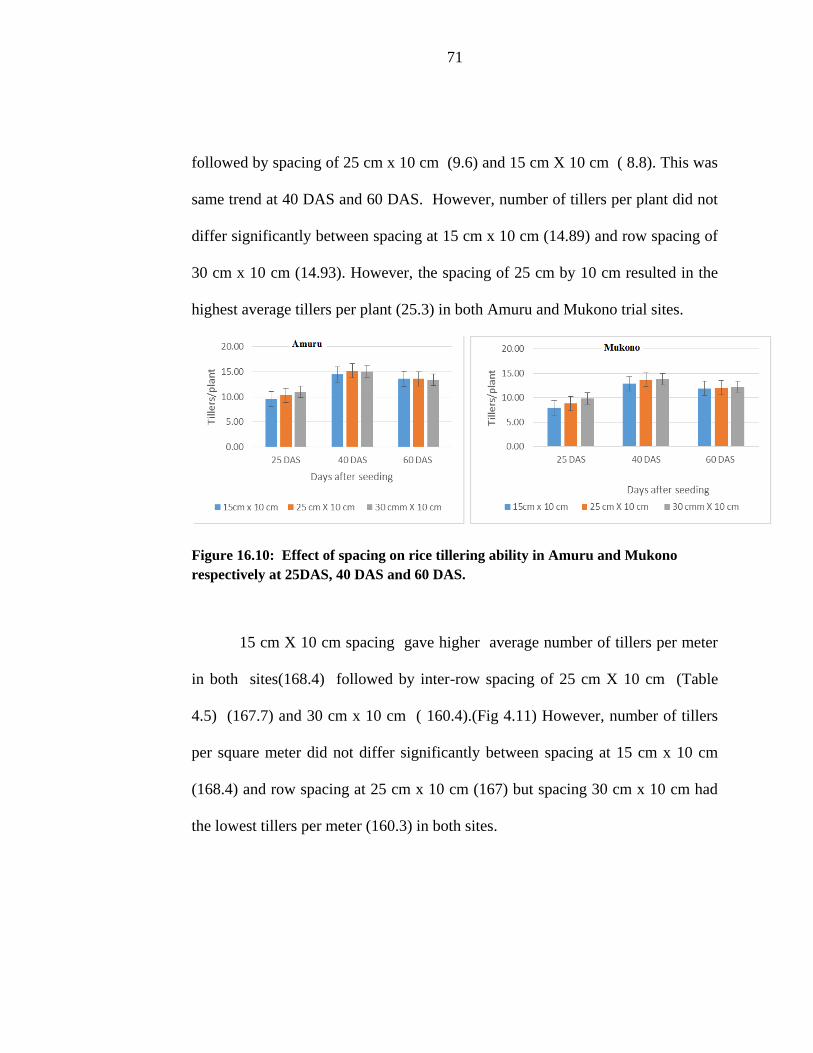
71
followed by spacing of 25 cm x 10 cm (9.6) and 15 cm X 10 cm ( 8.8). This was
same trend at 40 DAS and 60 DAS. However, number of tillers per plant did not
differ significantly between spacing at 15 cm x 10 cm (14.89) and row spacing of
30 cm x 10 cm (14.93). However, the spacing of 25 cm by 10 cm resulted in the
highest average tillers per plant (25.3) in both Amuru and Mukono trial sites.
Figure 16.10: Effect of spacing on rice tillering ability in Amuru and Mukono
respectively at 25DAS, 40 DAS and 60 DAS.
15 cm X 10 cm spacing gave higher average number of tillers per meter
in both sites(168.4) followed by inter-row spacing of 25 cm X 10 cm (Table
4.5) (167.7) and 30 cm x 10 cm ( 160.4).(Fig 4.11) However, number of tillers
per square meter did not differ significantly between spacing at 15 cm x 10 cm
(168.4) and row spacing at 25 cm x 10 cm (167) but spacing 30 cm x 10 cm had
the lowest tillers per meter (160.3) in both sites.
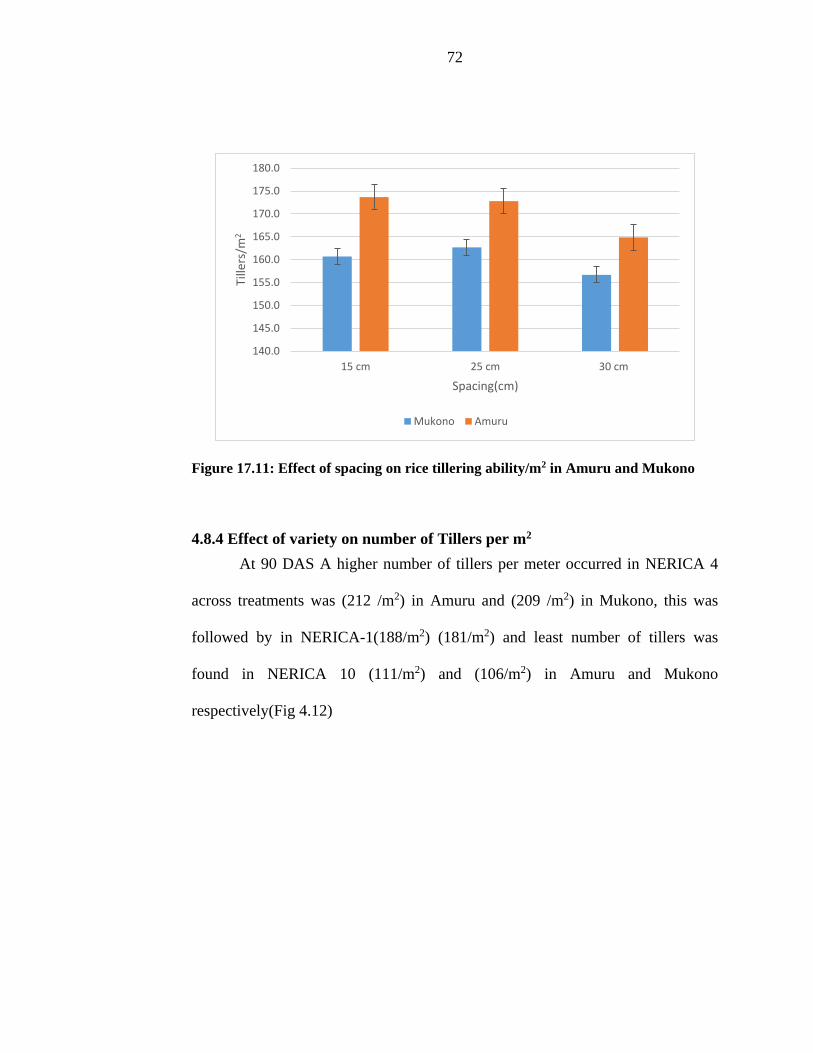
72
Figure 17.11: Effect of spacing on rice tillering ability/m2 in Amuru and Mukono
4.8.4 Effect of variety on number of Tillers per m2
At 90 DAS A higher number of tillers per meter occurred in NERICA 4
across treatments was (212 /m2) in Amuru and (209 /m2) in Mukono, this was
followed by in NERICA-1(188/m2) (181/m2) and least number of tillers was
found in NERICA 10 (111/m2) and (106/m2) in Amuru and Mukono
respectively(Fig 4.12)
140.0
145.0
150.0
155.0
160.0
165.0
170.0
175.0
180.0
15 cm 25 cm 30 cm
Tille
rs/m
2
Spacing(cm)
Mukono Amuru
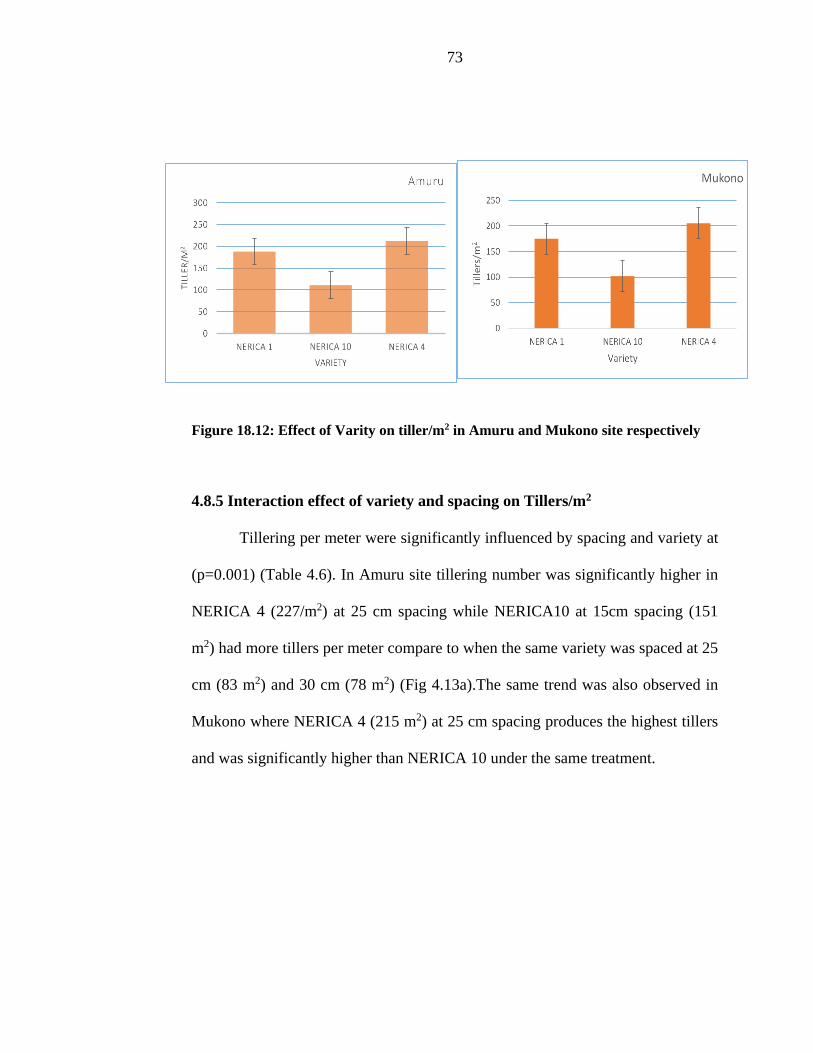
73
Figure 18.12: Effect of Varity on tiller/m2 in Amuru and Mukono site respectively
4.8.5 Interaction effect of variety and spacing on Tillers/m2
Tillering per meter were significantly influenced by spacing and variety at
(p=0.001) (Table 4.6). In Amuru site tillering number was significantly higher in
NERICA 4 (227/m2) at 25 cm spacing while NERICA10 at 15cm spacing (151
m2) had more tillers per meter compare to when the same variety was spaced at 25
cm (83 m2) and 30 cm (78 m2) (Fig 4.13a).The same trend was also observed in
Mukono where NERICA 4 (215 m2) at 25 cm spacing produces the highest tillers
and was significantly higher than NERICA 10 under the same treatment.
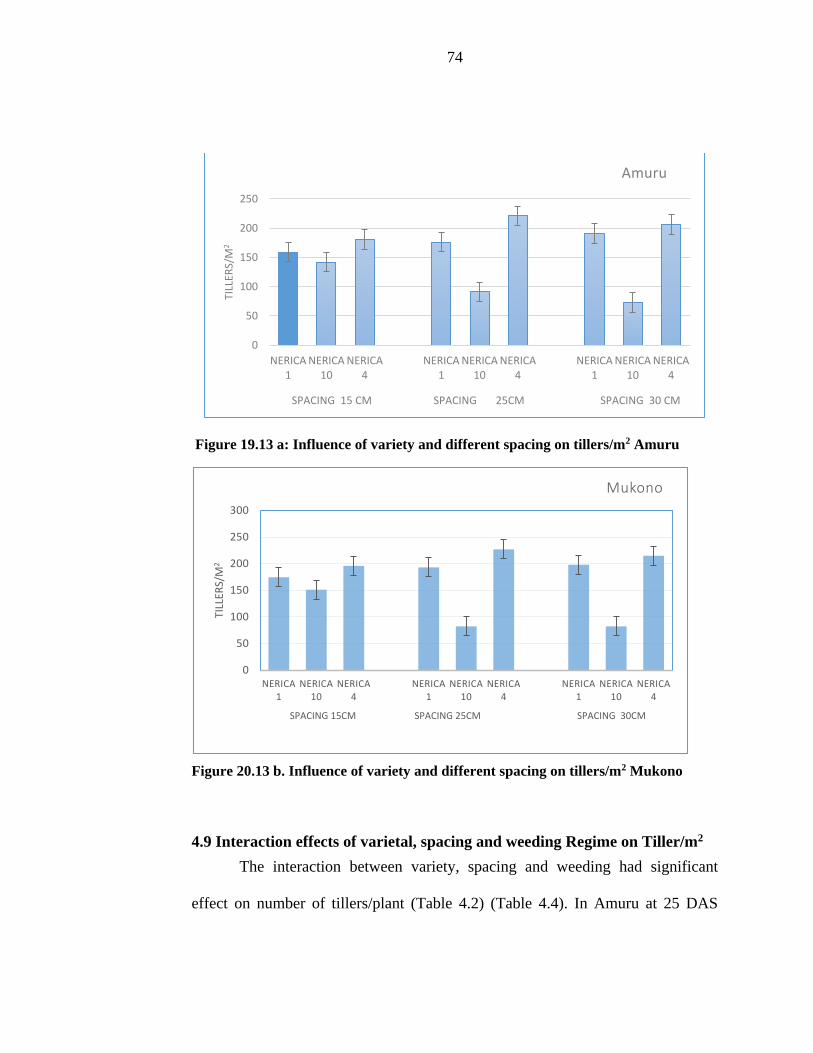
74
0
50
100
150
200
250
300
NERICA 1
NERICA 10
NERICA 4
NERICA 1
NERICA 10
NERICA 4
NERICA 1
NERICA 10
NERICA 4
TILL
ERS/
M2
SPACING 15CM SPACING 25CM SPACING 30CM
Mukono
Figure 19.13 a: Influence of variety and different spacing on tillers/m2 Amuru
Figure 20.13 b. Influence of variety and different spacing on tillers/m2 Mukono
4.9 Interaction effects of varietal, spacing and weeding Regime on Tiller/m2
The interaction between variety, spacing and weeding had significant
effect on number of tillers/plant (Table 4.2) (Table 4.4). In Amuru at 25 DAS
0
50
100
150
200
250
NERICA1
NERICA10
NERICA4
NERICA1
NERICA10
NERICA4
NERICA1
NERICA10
NERICA4
TILL
ERS/
M2
SPACING 15 CM SPACING 25CM SPACING 30 CM
Amuru
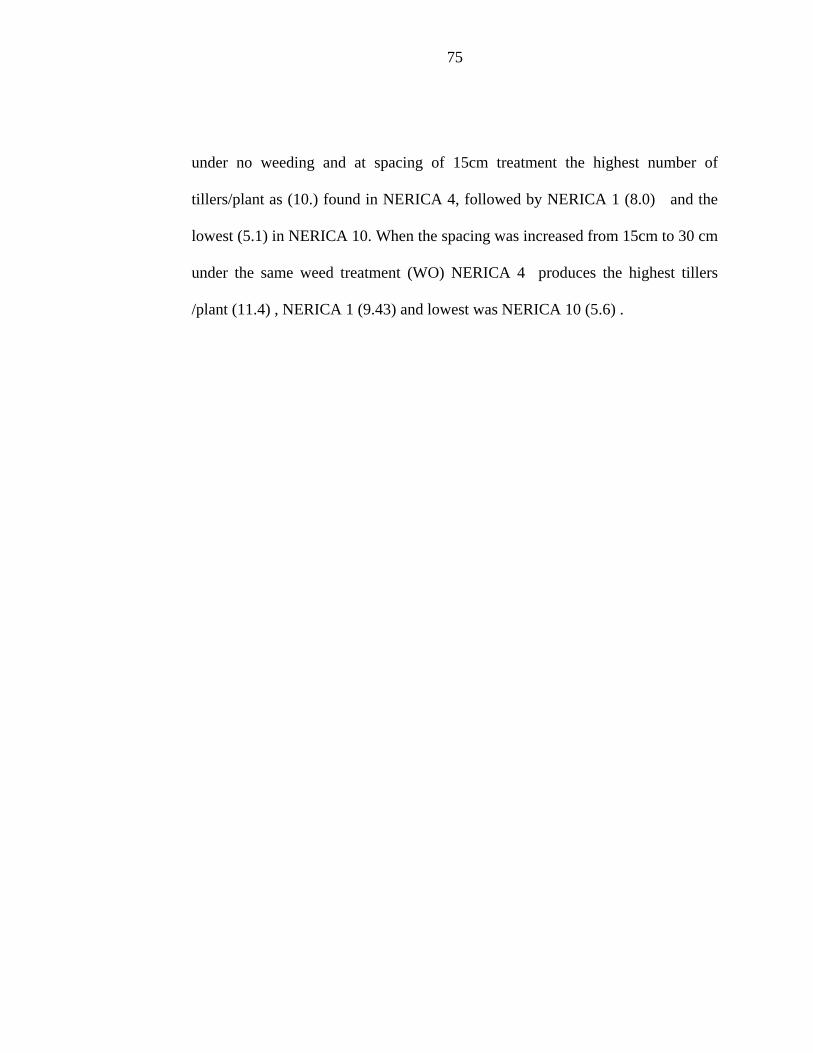
75
under no weeding and at spacing of 15cm treatment the highest number of
tillers/plant as (10.) found in NERICA 4, followed by NERICA 1 (8.0) and the
lowest (5.1) in NERICA 10. When the spacing was increased from 15cm to 30 cm
under the same weed treatment (WO) NERICA 4 produces the highest tillers
/plant (11.4) , NERICA 1 (9.43) and lowest was NERICA 10 (5.6) .
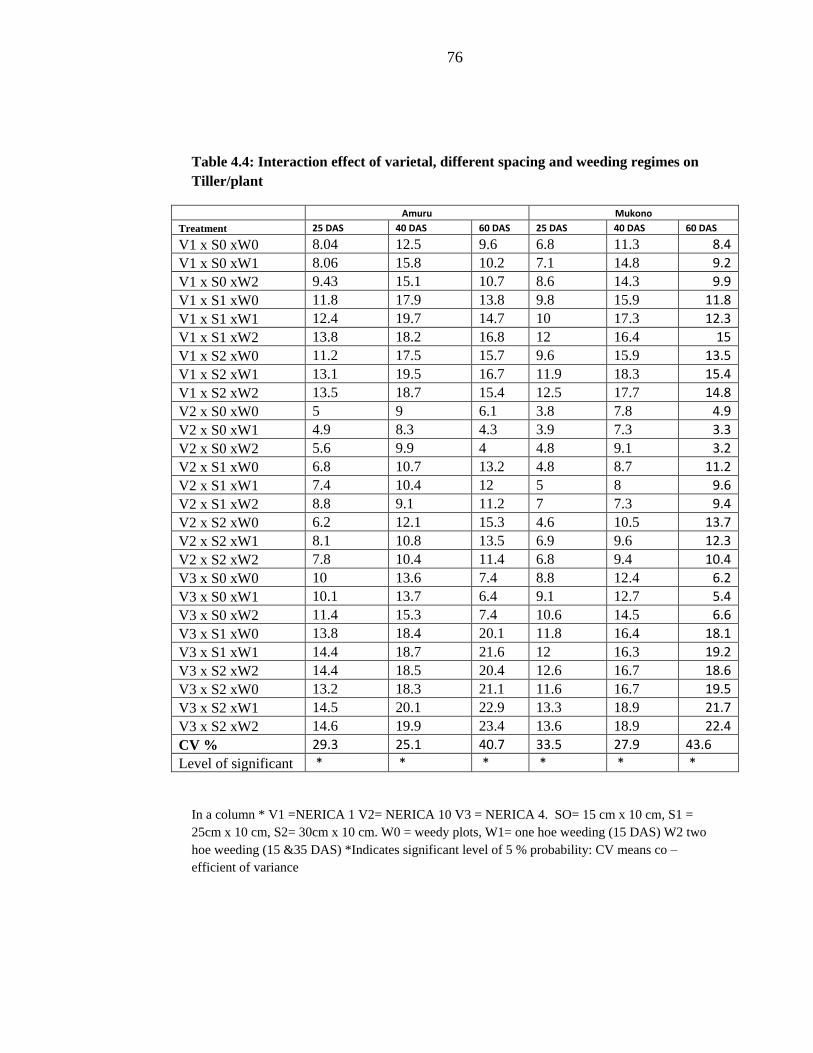
76
Table 4.4: Interaction effect of varietal, different spacing and weeding regimes on
Tiller/plant
Amuru Mukono
Treatment 25 DAS 40 DAS 60 DAS 25 DAS 40 DAS 60 DAS
V1 x S0 xW0 8.04 12.5 9.6 6.8 11.3 8.4 V1 x S0 xW1 8.06 15.8 10.2 7.1 14.8 9.2 V1 x S0 xW2 9.43 15.1 10.7 8.6 14.3 9.9 V1 x S1 xW0 11.8 17.9 13.8 9.8 15.9 11.8 V1 x S1 xW1 12.4 19.7 14.7 10 17.3 12.3 V1 x S1 xW2 13.8 18.2 16.8 12 16.4 15 V1 x S2 xW0 11.2 17.5 15.7 9.6 15.9 13.5 V1 x S2 xW1 13.1 19.5 16.7 11.9 18.3 15.4 V1 x S2 xW2 13.5 18.7 15.4 12.5 17.7 14.8 V2 x S0 xW0 5 9 6.1 3.8 7.8 4.9 V2 x S0 xW1 4.9 8.3 4.3 3.9 7.3 3.3 V2 x S0 xW2 5.6 9.9 4 4.8 9.1 3.2 V2 x S1 xW0 6.8 10.7 13.2 4.8 8.7 11.2 V2 x S1 xW1 7.4 10.4 12 5 8 9.6 V2 x S1 xW2 8.8 9.1 11.2 7 7.3 9.4 V2 x S2 xW0 6.2 12.1 15.3 4.6 10.5 13.7 V2 x S2 xW1 8.1 10.8 13.5 6.9 9.6 12.3 V2 x S2 xW2 7.8 10.4 11.4 6.8 9.4 10.4 V3 x S0 xW0 10 13.6 7.4 8.8 12.4 6.2 V3 x S0 xW1 10.1 13.7 6.4 9.1 12.7 5.4 V3 x S0 xW2 11.4 15.3 7.4 10.6 14.5 6.6 V3 x S1 xW0 13.8 18.4 20.1 11.8 16.4 18.1 V3 x S1 xW1 14.4 18.7 21.6 12 16.3 19.2 V3 x S2 xW2 14.4 18.5 20.4 12.6 16.7 18.6 V3 x S2 xW0 13.2 18.3 21.1 11.6 16.7 19.5 V3 x S2 xW1 14.5 20.1 22.9 13.3 18.9 21.7 V3 x S2 xW2 14.6 19.9 23.4 13.6 18.9 22.4 CV % 29.3 25.1 40.7 33.5 27.9 43.6 Level of significant * * * * * *
In a column * V1 =NERICA 1 V2= NERICA 10 V3 = NERICA 4. SO= 15 cm x 10 cm, S1 =
25cm x 10 cm, S2= 30cm x 10 cm. W0 = weedy plots, W1= one hoe weeding (15 DAS) W2 two
hoe weeding (15 &35 DAS) *Indicates significant level of 5 % probability: CV means co –
efficient of variance
77
This was the same trend in Mukono (Table 4.4). At 25 DAS under 1 hoe
(15DAS) weeding treatment and at spacing of 15cm treatment the highest number
of tillers/plant was (13.8.) found in NERICA 4, followed by NERICA 1 (11.8)
and the lowest (6.8) in NERICA 10 .When the spacing was increased from 15cm
to 30 cm under the same weed treatment (W1) NERICA 4 produces the highest
tillers /plant (14.4), NERICA 1 (13.8) and lowest was NERICA 10 (8.8).
At 25 DAS under 2 hoe (15 and 35 DAS) weeding treatment and at
spacing of 15cm treatment the highest number of tillers /plant was (13.2.) found
in NERICA 4, followed by NERICA 1 (11.2) and the lowest (6.2) in NERICA 10.
When the spacing was increased from 15cm to 30 cm under the same weed
treatment (W1) NERICA 4 produces the highest tillers /plant (14.6) , NERICA 1
(13.5) and lowest was NERICA 10 (7.8).
At 40 DAS (Table 4.4 ) (maximum tillering stage) in Mukono under no
weeding and at spacing of 15cm treatment the highest number of tillers /plant
was (12.4) found in NERICA 4, followed by NERICA 1 (11.3) and the
lowest(7.8) in NERICA 10. When the spacing was increased from 15cm to 30 cm
under the same weed treatment (WO) NERICA 4 produces the highest tillers
/plant (14.5) closely followed by NERICA 1 (14.3) and lowest was NERICA 10
(9.1). This was the same trend in Amuru (Table 4.4).
At 40 DAS under 1 hoe (15 DAS) weeding treatment and at spacing of
15cm treatment the highest number of tillers /plant was (16.4.) found in NERICA
78
4, followed by NERICA 1 (15.9) and the lowest(8.7) in NERICA 10 . When the
spacing was increased from 15cm to 30 cm under the same weed treatment (W1)
NERICA 4 produces the highest tillers /plant (16.7) closely followed by NERICA
1 (16.4) and lowest was NERICA 10 (7.3) .This was the same trend in Amuru site
(Table 4.4). At 40 DAS under 2 hoe (15 and 35DAS ) weeding treatment and at
spacing of 15cm treatment the highest number of tillers /plant was (16.7.) found
in NERICA 4, closely followed by NERICA 1 (15.9) and the lowest (10.5) in
NERICA 10 in Mukono (Table 4.9 b). When the spacing was increased from
15cm to 30 cm under the same weed treatment (W1) NERICA 4 produces the
highest tillers /plant (18.9) followed by NERICA 1 (17.7) and lowest was
NERICA 10 (9.4). This was the same trend in Amuru site (Table 4.4). The same
trend was observed at 60 DAS as a result of varietal differences, spacing and
weeding regime of number of tillers /plant but in contrast, at 60 DAS, the amount
of tillers reduced for NERICA 1, NERICA 10 and NERICA 4 by 16%, 6% and
2% respectively.
Under treatment combination the highest number of tillers was observed in
NERICA 4 (340/ m2) under two hoe (15 &35 DAS) weeding at a spacing of 25cm
while the lowest was recorded under NERICA 10 (19/ m2) under no weeding but
at a spacing of 30cm in Amuru. This was also a similar pattern in Mukono site
where NERICA4 recorded the highest tiller/ m2 (336) and NERICA 10 recorded
the lowest (13 / m2) under no weeding and at a row spacing of 30 cm.
79
As per findings from this study the number of tillers per plant was
significantly influenced by weeding regimes, spacing and variety (Table 4.2). The
potential of tillers production differs with variety because it is genetically
controlled behavior but when combined with different spacing and weeding
regimes this lead to a more reduction in competition between rice plant and weeds
thereby leading to high tillers in these treatments as observed with NERICA 4
At 25 DAS and 45 DAS the highest number of tillers per plant was
produced by NERICA 4 at treatment combination of two hoe weeding (13.9) and
( 19.5 ) respectively and this was also similar to when the variety was subjected
to one hoe weeding at 30 cm row spacing (14.1 )and (19.4) respectively these
were significantly higher than unweeded check plots (7.36). At 95 DAS, treatment
combination of two hoe weedings (247.1) (Table 4.2.) produced significantly
higher number of tillers per meter than unweeded check (64.2). The consistent
significant higher tiller production obtained from 2 hoe weeding in both sites
might be attributed to the fact that the treatments controlled weeds most
effectively. This is in line with the work of Mitra, Karim, Haque, Ahmed and
Bari, (2005) who observed higher number of tillers in weed - free treatment which
was similar to two hoe weeding treatment and lowest in unweeded treatment. A
number of studies also identify plant traits responsible for superior competitive
ability of rice cultivars against weeds such as height, leaf canopy, tillering ability
and root development (De Vida et al., 2006; Dingkuhn, Jones, Johnson and Sow
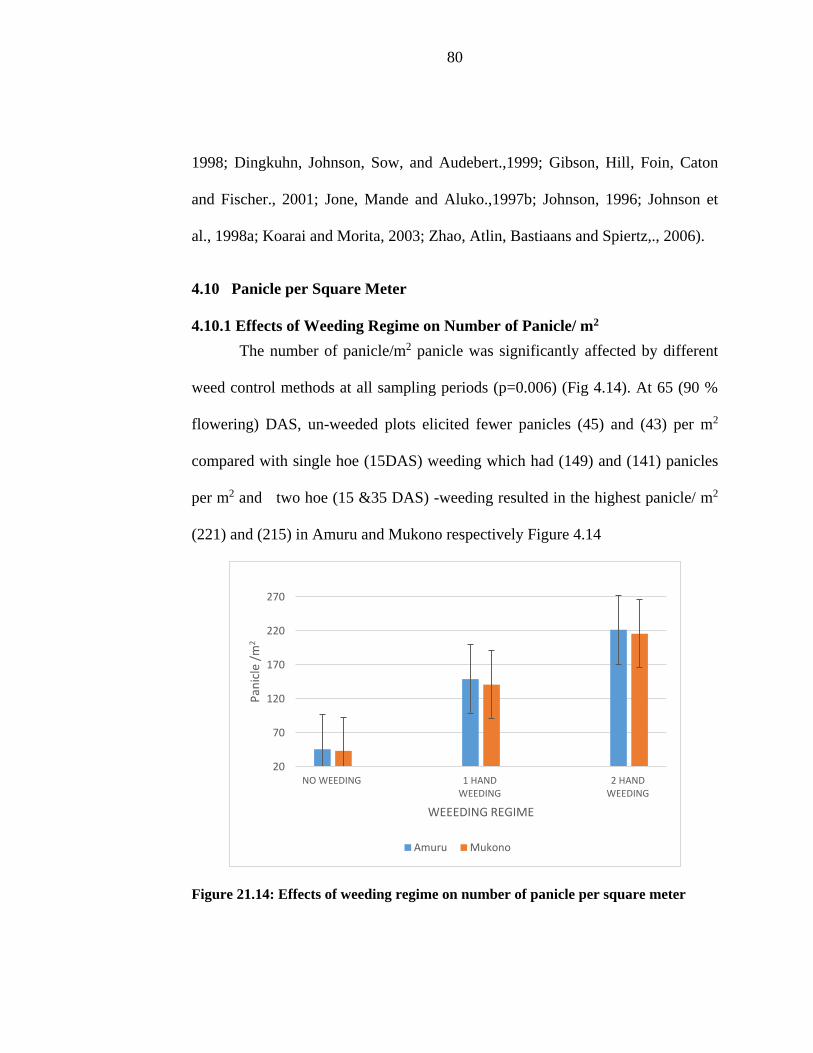
80
1998; Dingkuhn, Johnson, Sow, and Audebert.,1999; Gibson, Hill, Foin, Caton
and Fischer., 2001; Jone, Mande and Aluko.,1997b; Johnson, 1996; Johnson et
al., 1998a; Koarai and Morita, 2003; Zhao, Atlin, Bastiaans and Spiertz,., 2006).
4.10 Panicle per Square Meter
4.10.1 Effects of Weeding Regime on Number of Panicle/ m2
The number of panicle/m2 panicle was significantly affected by different
weed control methods at all sampling periods (p=0.006) (Fig 4.14). At 65 (90 %
flowering) DAS, un-weeded plots elicited fewer panicles (45) and (43) per m2
compared with single hoe (15DAS) weeding which had (149) and (141) panicles
per m2 and two hoe (15 &35 DAS) -weeding resulted in the highest panicle/ m2
(221) and (215) in Amuru and Mukono respectively Figure 4.14
Figure 21.14: Effects of weeding regime on number of panicle per square meter
20
70
120
170
220
270
NO WEEDING 1 HANDWEEDING
2 HANDWEEDING
Pan
icle
/m
2
WEEEDING REGIME
Amuru Mukono
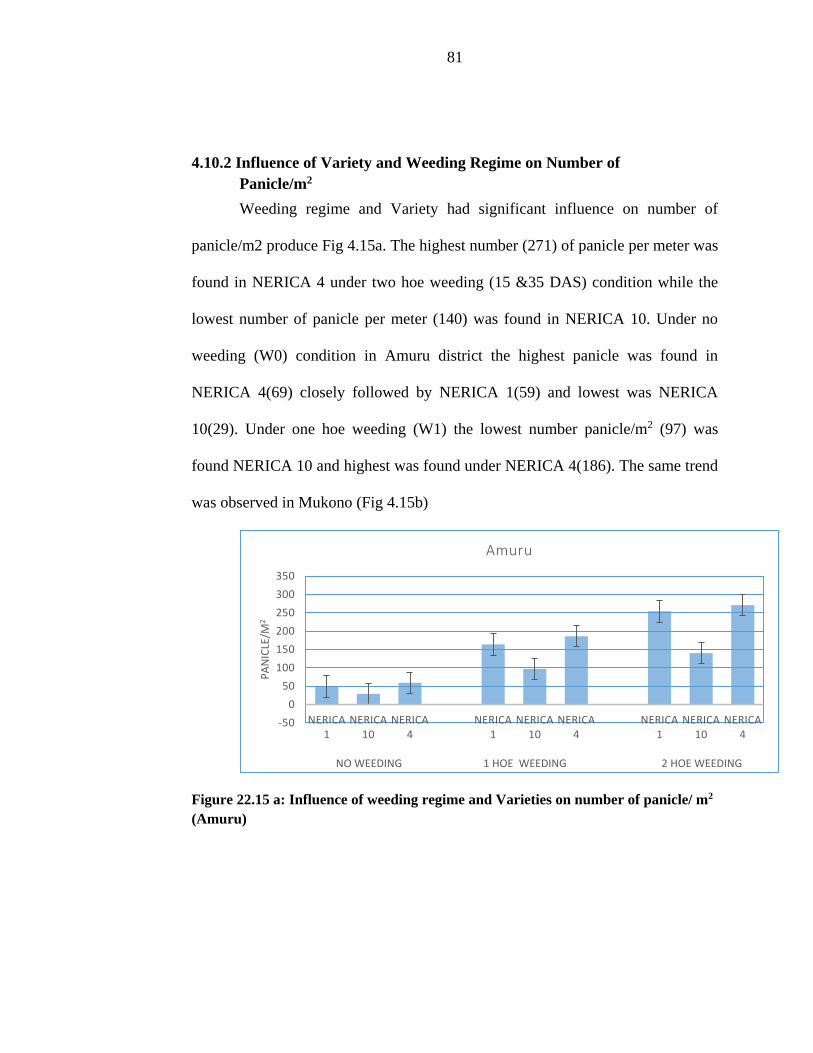
81
4.10.2 Influence of Variety and Weeding Regime on Number of
Panicle/m2
Weeding regime and Variety had significant influence on number of
panicle/m2 produce Fig 4.15a. The highest number (271) of panicle per meter was
found in NERICA 4 under two hoe weeding (15 &35 DAS) condition while the
lowest number of panicle per meter (140) was found in NERICA 10. Under no
weeding (W0) condition in Amuru district the highest panicle was found in
NERICA 4(69) closely followed by NERICA 1(59) and lowest was NERICA
10(29). Under one hoe weeding (W1) the lowest number panicle/m2 (97) was
found NERICA 10 and highest was found under NERICA 4(186). The same trend
was observed in Mukono (Fig 4.15b)
Figure 22.15 a: Influence of weeding regime and Varieties on number of panicle/ m2
(Amuru)
-50
0
50
100
150
200
250
300
350
NERICA 1
NERICA 10
NERICA 4
NERICA 1
NERICA 10
NERICA 4
NERICA 1
NERICA 10
NERICA 4
PA
NIC
LE/M
2
NO WEEDING 1 HOE WEEDING 2 HOE WEEDING
Amuru
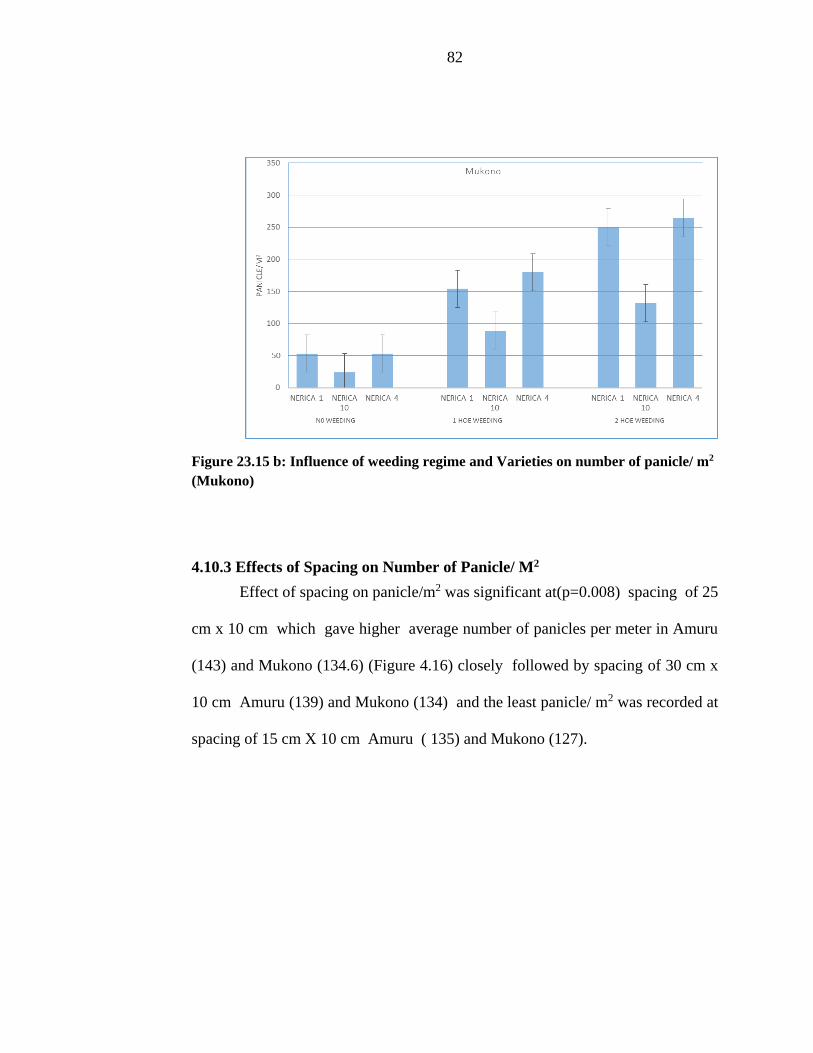
82
Figure 23.15 b: Influence of weeding regime and Varieties on number of panicle/ m2
(Mukono)
4.10.3 Effects of Spacing on Number of Panicle/ M2
Effect of spacing on panicle/m2 was significant at(p=0.008) spacing of 25
cm x 10 cm which gave higher average number of panicles per meter in Amuru
(143) and Mukono (134.6) (Figure 4.16) closely followed by spacing of 30 cm x
10 cm Amuru (139) and Mukono (134) and the least panicle/ m2 was recorded at
spacing of 15 cm X 10 cm Amuru ( 135) and Mukono (127).
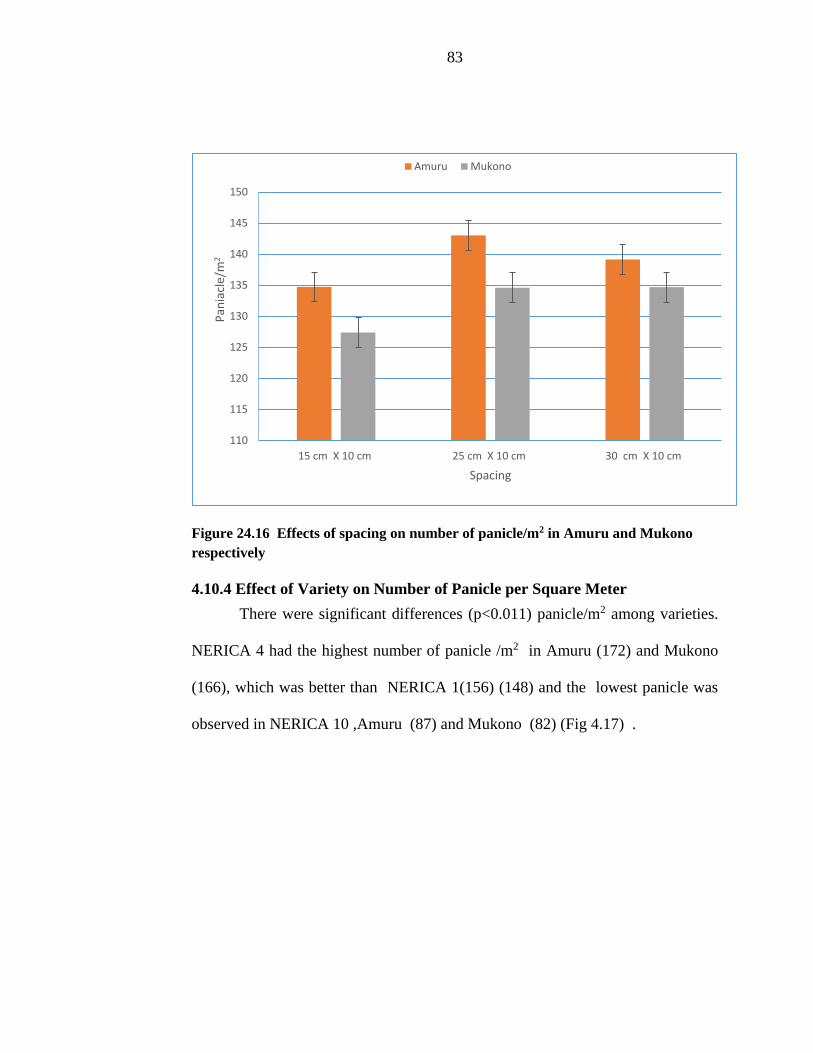
83
Figure 24.16 Effects of spacing on number of panicle/m2 in Amuru and Mukono
respectively
4.10.4 Effect of Variety on Number of Panicle per Square Meter
There were significant differences (p<0.011) panicle/m2 among varieties.
NERICA 4 had the highest number of panicle /m2 in Amuru (172) and Mukono
(166), which was better than NERICA 1(156) (148) and the lowest panicle was
observed in NERICA 10 ,Amuru (87) and Mukono (82) (Fig 4.17) .
110
115
120
125
130
135
140
145
150
15 cm X 10 cm 25 cm X 10 cm 30 cm X 10 cm
Pan
iacl
e/m
2
Spacing
Amuru Mukono
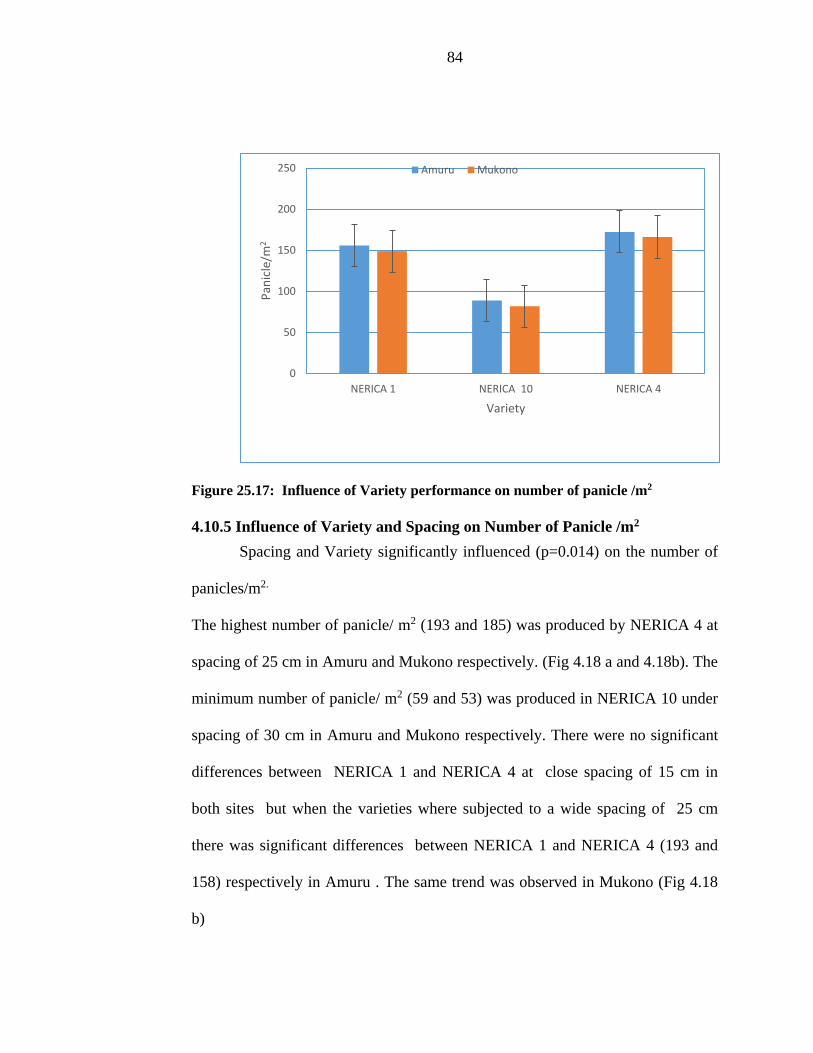
84
Figure 25.17: Influence of Variety performance on number of panicle /m2
4.10.5 Influence of Variety and Spacing on Number of Panicle /m2
Spacing and Variety significantly influenced (p=0.014) on the number of
panicles/m2.
The highest number of panicle/ m2 (193 and 185) was produced by NERICA 4 at
spacing of 25 cm in Amuru and Mukono respectively. (Fig 4.18 a and 4.18b). The
minimum number of panicle/ m2 (59 and 53) was produced in NERICA 10 under
spacing of 30 cm in Amuru and Mukono respectively. There were no significant
differences between NERICA 1 and NERICA 4 at close spacing of 15 cm in
both sites but when the varieties where subjected to a wide spacing of 25 cm
there was significant differences between NERICA 1 and NERICA 4 (193 and
158) respectively in Amuru . The same trend was observed in Mukono (Fig 4.18
b)
0
50
100
150
200
250
NERICA 1 NERICA 10 NERICA 4
Pan
icle
/m2
Variety
Amuru Mukono
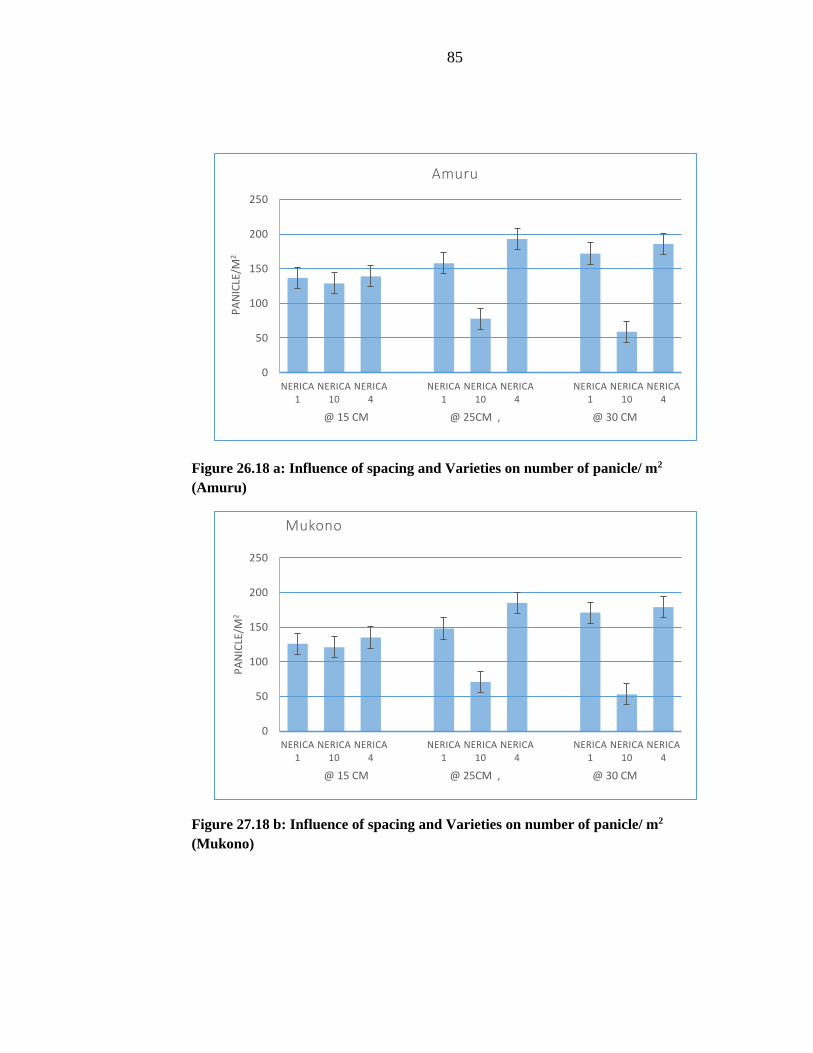
85
Figure 26.18 a: Influence of spacing and Varieties on number of panicle/ m2
(Amuru)
Figure 27.18 b: Influence of spacing and Varieties on number of panicle/ m2
(Mukono)
0
50
100
150
200
250
NERICA 1
NERICA 10
NERICA 4
NERICA 1
NERICA 10
NERICA 4
NERICA 1
NERICA 10
NERICA 4
PA
NIC
LE/M
2
@ 15 CM @ 25CM , @ 30 CM
Amuru
0
50
100
150
200
250
NERICA 1
NERICA 10
NERICA 4
NERICA 1
NERICA 10
NERICA 4
NERICA 1
NERICA 10
NERICA 4
PA
NIC
LE/M
2
@ 15 CM @ 25CM , @ 30 CM
Mukono
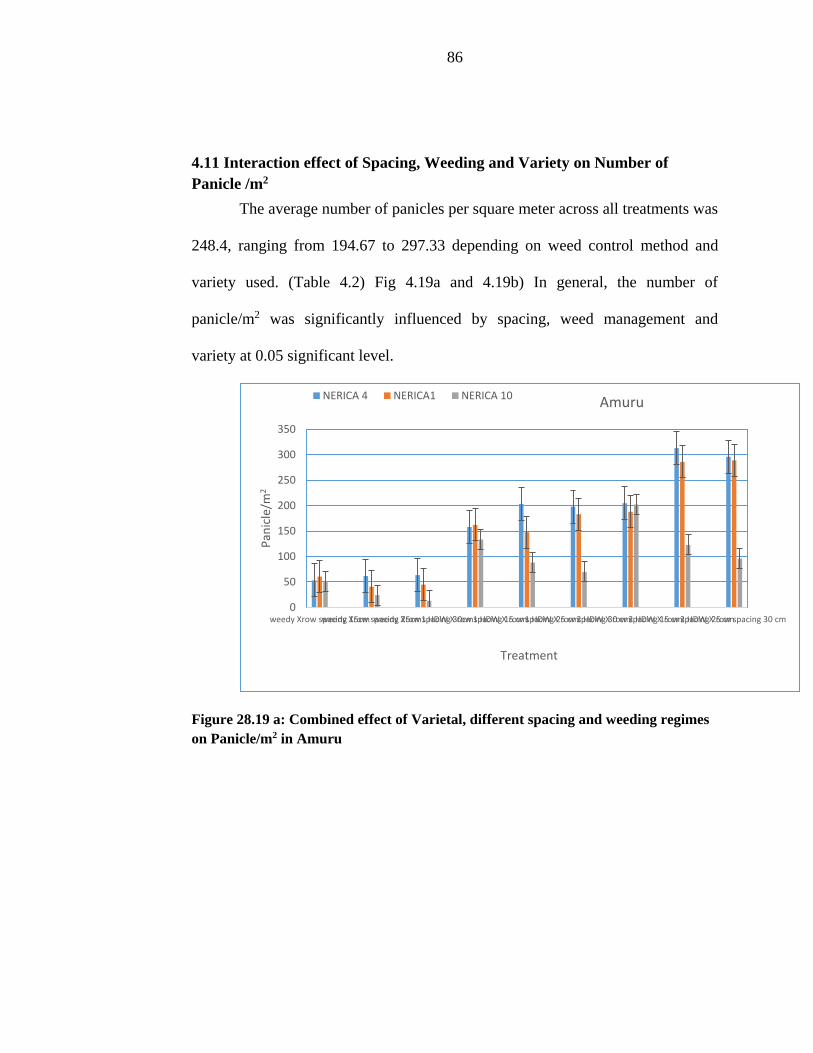
86
4.11 Interaction effect of Spacing, Weeding and Variety on Number of
Panicle /m2
The average number of panicles per square meter across all treatments was
248.4, ranging from 194.67 to 297.33 depending on weed control method and
variety used. (Table 4.2) Fig 4.19a and 4.19b) In general, the number of
panicle/m2 was significantly influenced by spacing, weed management and
variety at 0.05 significant level.
Figure 28.19 a: Combined effect of Varietal, different spacing and weeding regimes
on Panicle/m2 in Amuru
0
50
100
150
200
250
300
350
weedy Xrow spacing 15cmweedy Xrow spacing 25cmweedy Xrow spacing 30cm1 HDW X row spacing 15 cm1 HDW X row spacing 25 cm1 HDW X row spacing 30 cm2 HDW X row spacing 15 cm2 HDW X row spacing 25 cm2 HDW X row spacing 30 cm
Pan
icle
/m2
Treatment
AmuruNERICA 4 NERICA1 NERICA 10
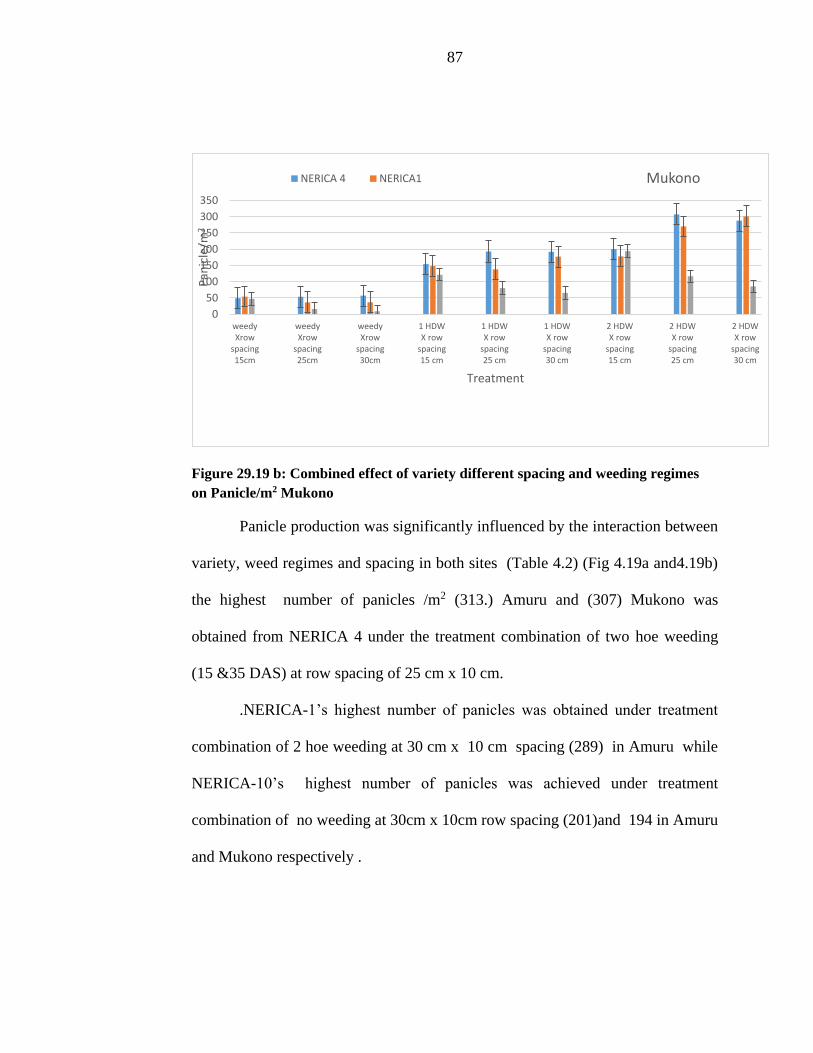
87
Figure 29.19 b: Combined effect of variety different spacing and weeding regimes
on Panicle/m2 Mukono
Panicle production was significantly influenced by the interaction between
variety, weed regimes and spacing in both sites (Table 4.2) (Fig 4.19a and4.19b)
the highest number of panicles /m2 (313.) Amuru and (307) Mukono was
obtained from NERICA 4 under the treatment combination of two hoe weeding
(15 &35 DAS) at row spacing of 25 cm x 10 cm.
.NERICA-1’s highest number of panicles was obtained under treatment
combination of 2 hoe weeding at 30 cm x 10 cm spacing (289) in Amuru while
NERICA-10’s highest number of panicles was achieved under treatment
combination of no weeding at 30cm x 10cm row spacing (201)and 194 in Amuru
and Mukono respectively .
0
50
100
150
200
250
300
350
weedyXrow
spacing15cm
weedyXrow
spacing25cm
weedyXrow
spacing30cm
1 HDWX row
spacing15 cm
1 HDWX row
spacing25 cm
1 HDWX row
spacing30 cm
2 HDWX row
spacing15 cm
2 HDWX row
spacing25 cm
2 HDWX row
spacing30 cm
Pan
icle
/m2
Treatment
MukonoNERICA 4 NERICA1
88
4.12 Panicle Length
4.12.1 Effect of Weeding Regime on Panicle Length
The results on main effects of weeding regime showed that different
weeding regime had significant effect on panicle length (Table 4.5). In Amuru
two hoe-weeding gave the maximum panicle length (28 cm) and no weeding
condition gave the minimum (18.35 cm) .This was also observed in Mukono
where two hoe-weeding gave the maximum panicle length (18.22 cm) and no
weeding condition gave the minimum (12.15 cm).
4.12.2 Effect of Spacing on Panicle Length
The length of panicle was also significantly influenced by different plant
spacing (Table 4.5). In Amuru the 25cm spacing gave the longest panicle length
(27.06 cm). On the other spacing at 15 cm gave the shortest (20.10 cm) panicle
length. This was also the trend in Mukono where 25cm spacing gave the longest
panicle length (16.06 cm). On the other spacing at 15 cm gave the shortest
(12.10cm). Across the two sites there was no significant difference between
spacing at 25 cm and 30cm.
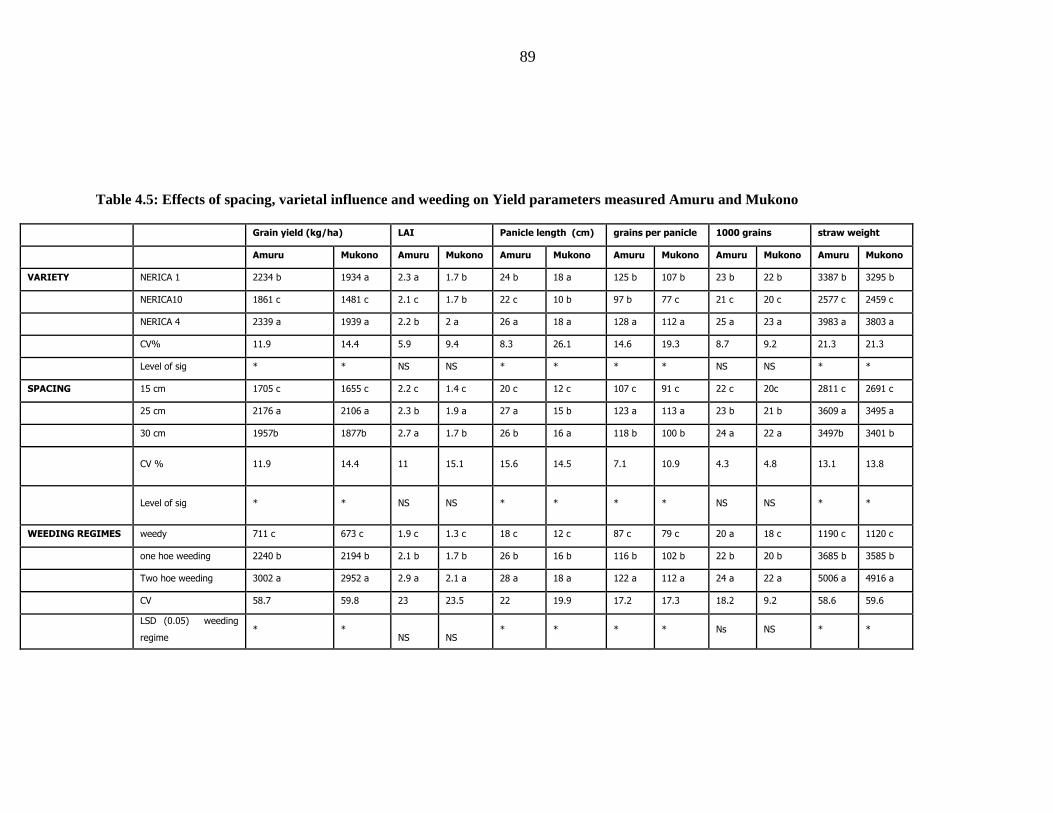
89
Table 4.5: Effects of spacing, varietal influence and weeding on Yield parameters measured Amuru and Mukono
Grain yield (kg/ha) LAI Panicle length (cm) grains per panicle 1000 grains straw weight
Amuru Mukono Amuru Mukono Amuru Mukono Amuru Mukono Amuru Mukono Amuru Mukono
VARIETY NERICA 1 2234 b 1934 a 2.3 a 1.7 b 24 b 18 a 125 b 107 b 23 b 22 b 3387 b 3295 b
NERICA10 1861 c 1481 c 2.1 c 1.7 b 22 c 10 b 97 b 77 c 21 c 20 c 2577 c 2459 c
NERICA 4 2339 a 1939 a 2.2 b 2 a 26 a 18 a 128 a 112 a 25 a 23 a 3983 a 3803 a
CV% 11.9 14.4 5.9 9.4 8.3 26.1 14.6 19.3 8.7 9.2 21.3 21.3
Level of sig * * NS NS * * * * NS NS * *
SPACING 15 cm 1705 c 1655 c 2.2 c 1.4 c 20 c 12 c 107 c 91 c 22 c 20c 2811 c 2691 c
25 cm 2176 a 2106 a 2.3 b 1.9 a 27 a 15 b 123 a 113 a 23 b 21 b 3609 a 3495 a
30 cm 1957b 1877b 2.7 a 1.7 b 26 b 16 a 118 b 100 b 24 a 22 a 3497b 3401 b
CV % 11.9 14.4 11 15.1 15.6 14.5 7.1 10.9 4.3 4.8 13.1 13.8
Level of sig * * NS NS * * * * NS NS * *
WEEDING REGIMES weedy 711 c 673 c 1.9 c 1.3 c 18 c 12 c 87 c 79 c 20 a 18 c 1190 c 1120 c
one hoe weeding 2240 b 2194 b 2.1 b 1.7 b 26 b 16 b 116 b 102 b 22 b 20 b 3685 b 3585 b
Two hoe weeding 3002 a 2952 a 2.9 a 2.1 a 28 a 18 a 122 a 112 a 24 a 22 a 5006 a 4916 a
CV 58.7 59.8 23 23.5 22 19.9 17.2 17.3 18.2 9.2 58.6 59.6
LSD (0.05) weeding
regime * *
NS NS * * * * Ns NS * *
90
4.12.3 Effect of Variety on Panicle Length (CM)
The length of panicle was also significantly influenced by variety. In
Amuru the longest panicle length was observed (26.4cm) (Table 4.5) in NERICA
4 closely followed by NERICA 1 (24.8cm) and the shortest length (22.4cm) was
observed in NERICA 10.This also was observed in Mukono site where the
longest panicle length was observed in (18.6cm) in NERICA 4 closely followed
by NERICA 1 (18.2.8cm) and the shortest length (10.2cm) was observed in
NERICA 10.
4.12.4 Influence of Variety and Weeding Regime on Panicle Length (CM)
From results in (Table 4.6) weeding regime and Variety had significant
influence on panicle length (cm) the average panicle length was (24 cm) in
Amuru and (15.2 cm) in Mukono. From results (Table 4.14 b) NERICA 4 had
longer panicle (27 cm) under 1 hoe weeding than NERICA 1 (26 cm) and
NERICA 10 (25 cm) but are statistically similar. Significantly shorter panicle was
observed under NERICA 10 (20 cm) (11 cm) under no weeding treatment in
Amuru and Mukono respectively. Under two hoe weeding (W2) the longer
panicle (26 cm) was found under NERICA 4 closely followed by NERICA 1(25
cm) and NERICA 10 (24 cm) in Amuru site . This was the same trend in
Mukono (Table.4.6).
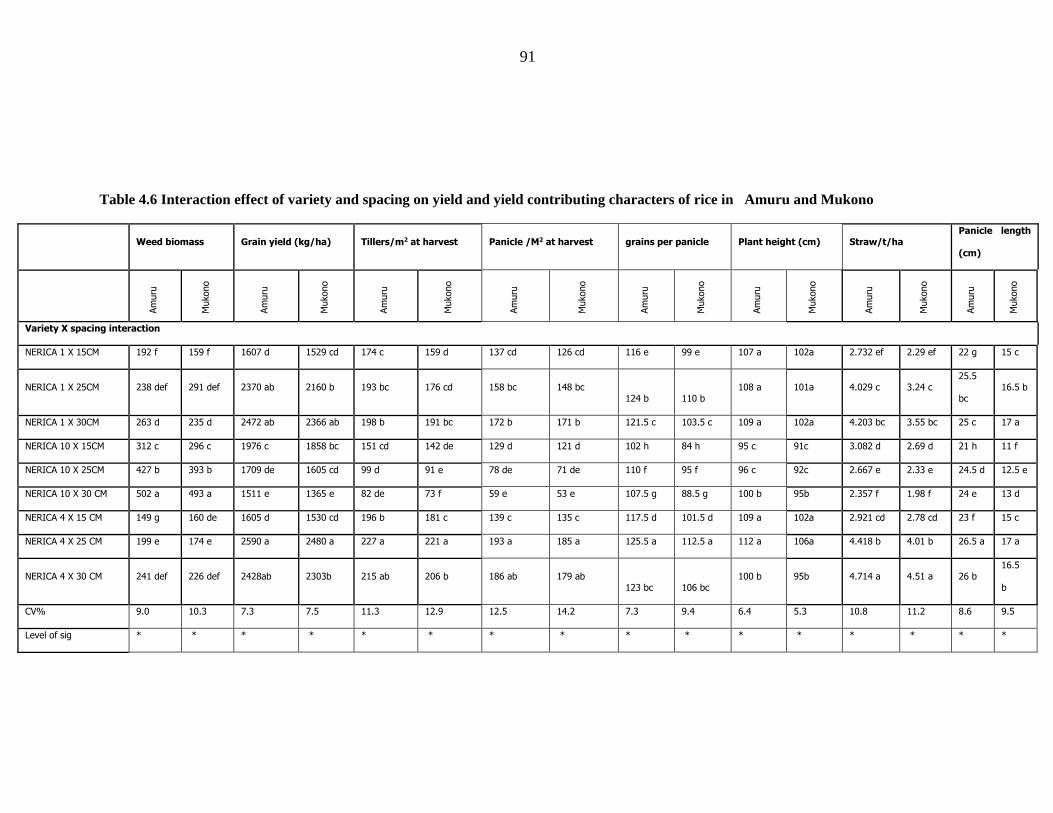
91
Table 4.6 Interaction effect of variety and spacing on yield and yield contributing characters of rice in Amuru and Mukono
Weed biomass Grain yield (kg/ha) Tillers/m2 at harvest Panicle /M2 at harvest grains per panicle Plant height (cm) Straw/t/ha Panicle length
(cm)
Am
uru
Mukono
Am
uru
Mukono
Am
uru
Mukono
Am
uru
Mukono
Am
uru
Mukono
Am
uru
Mukono
Am
uru
Mukono
Am
uru
Mukono
Variety X spacing interaction
NERICA 1 X 15CM 192 f 159 f 1607 d 1529 cd 174 c 159 d 137 cd 126 cd 116 e 99 e 107 a 102a 2.732 ef 2.29 ef 22 g 15 c
NERICA 1 X 25CM 238 def 291 def 2370 ab 2160 b 193 bc 176 cd 158 bc 148 bc 124 b 110 b
108 a 101a 4.029 c 3.24 c 25.5
bc 16.5 b
NERICA 1 X 30CM 263 d 235 d 2472 ab 2366 ab 198 b 191 bc 172 b 171 b 121.5 c 103.5 c 109 a 102a 4.203 bc 3.55 bc 25 c 17 a
NERICA 10 X 15CM 312 c 296 c 1976 c 1858 bc 151 cd 142 de 129 d 121 d 102 h 84 h 95 c 91c 3.082 d 2.69 d 21 h 11 f
NERICA 10 X 25CM 427 b 393 b 1709 de 1605 cd 99 d 91 e 78 de 71 de 110 f 95 f 96 c 92c 2.667 e 2.33 e 24.5 d 12.5 e
NERICA 10 X 30 CM 502 a 493 a 1511 e 1365 e 82 de 73 f 59 e 53 e 107.5 g 88.5 g 100 b 95b 2.357 f 1.98 f 24 e 13 d
NERICA 4 X 15 CM 149 g 160 de 1605 d 1530 cd 196 b 181 c 139 c 135 c 117.5 d 101.5 d 109 a 102a 2.921 cd 2.78 cd 23 f 15 c
NERICA 4 X 25 CM 199 e 174 e 2590 a 2480 a 227 a 221 a 193 a 185 a 125.5 a 112.5 a 112 a 106a 4.418 b 4.01 b 26.5 a 17 a
NERICA 4 X 30 CM 241 def 226 def 2428ab 2303b 215 ab 206 b 186 ab 179 ab 123 bc 106 bc
100 b 95b 4.714 a 4.51 a 26 b 16.5
b
CV% 9.0 10.3 7.3 7.5 11.3 12.9 12.5 14.2 7.3 9.4 6.4 5.3 10.8 11.2 8.6 9.5
Level of sig * * * * * * * * * * * * * * * *
92
4.12.6 Influence of Variety and Spacing on Panicle Length (cm)
The interaction effect of variety and spacing on panicle length (cm) (Table
4.6) was significantly. The longest panicle length (26.3 cm) was obtained from
row spacing of 25cm with Variety NERICA4 while the lowest (21) was observed
with NERICA 10 under spacing of 15 cm in Amuru. The same trend was
observed in Mukono where the longest panicle length (17 cm) was obtained from
row spacing of 25cm with Variety NERICA4 while the lowest (11cm) was
observed with NERICA 10 under spacing of 15 cm.
4.13 Combined Effects of Varietal, Spacing and Weeding Regimes on
Panicles Length (cm)
The interaction effect of varietal weeding regime and plant spacing had
significant influence on the panicle length (Table 4.2). The highest length of
panicle (31.0cm) was obtained from the treatment combination of 2 hoe weeding
with spacing of 25cm X 10 cm under NERICA 4, though it was similar (30.4
cm) to the treatment of two hoe weeding with spacing at 30 cm and the lowest
(14.0 cm) panicle length was obtained from the treatment no weeding at 30 cm
X 10 cm by NERICA 10. There was a decreasing trend of panicle length with the
increasing plant population.
The interaction effect of weeding regime and plant spacing had significant
influence on the panicle length (Table 4.6). The highest length of panicle (31.0
cm) was obtained from the treatment combination of 2 hoe weeding with spacing
93
of 25cm X 10 cm under NERICA 4, though it was similar (30.4 cm) to the
treatment of two hoe weeding with spacing at 30 cm. The lowest (14.0 cm)
panicle length was obtained from the treatment no weeding at 30 cm X 10 cm by
NERICA 10. There was a decreasing trend of panicle length with the increasing
plant population. Results revealed that panicle length is influenced by variety,
spacing and weeding regimes especially in all weeded plots than in unweeded
plot indicating that weeding and variety played a significant role in determining
panicle length rather than spacing.

94
4. 14 Leaf Area Index
4.14.1 Effect of weed control, spacing and Variety on leaf area index
Weeding had no significant difference on leaf area index (LAI) (Table 4.5)
but two hoe-weeding had produced higher LAI (2.9) followed by one hoe
weeding (2.1) while unweeded check plot produced the lowest LAI (1.9). This
was a similar pattern in Mukono site where the highest LAI was obtained under
two hoe weeding (2.1) followed by one hoe weed treatment (1.7) and lowest
under no weeding treatment (1.3) .Spacing had significant influence on LAI at
(0.05) (Table 4.12a) At row spacing of 30 cm x 10cm (1.71) was higher in leaf
area index as compared to row spacing of 15cm x 10 cm (1.44). Leaf area index
was not significantly influenced by variety but numerically the highest LAI (2.3
cm) was obtained from the variety NERICA 1 (Table 4.5) in Amuru while
NERICA 4 was the highest in Mukono (2.0cm) NERICA 10 had the lowest
average across both sites.
4.14.2 Combined effect of Variety, spacing and weeding regime on Leaf Area
Index
The Influence of weeding regime and spacing on leaf area when combined
was significant at (0.05) during the growth period of crop (Table 4.8) at 25, 40
and 60 DAS. At 25 DAS, NERICA 4 at two hoe weeding’s, spacing of 30 cm
(2.07) was higher in leaf area index as compared to NERICA 10 under the same
treatment (1.91). The same trend of LAI was also observed from 40 to 60 DAS
for the NERICA 4 recorded the highest. At 60 DAS leaf area index was higher at
95
2 hoe weeding spacing of 30 cm (2.9) and the lowest leaf area index was recorded
by NERICA 10 under the same treatment. In unweeded treatment at 25 DAS
NERICA 4 recorded the highest LAI under spacing of 30 cm closely followed by
NERICA 1 (1.44) and lowest was NERICA 10 (1.27) similar trend at both 40 and
60 DAS. Under 1 hoe weeding treatment at 25 DAS NERICA 4 (1.8) produces
the highest LAI at spacing of 30 cm and the lowest was NERICA 10 (1.57).
Similar trend was observed at 40 and 60 DAS.
Leaf area index is the efficiency of photosynthetic process and
photosynthetic surface (Lockhart and Wiseman, 1988) and thus, it is an important
determinant of plant productivity. In rice, the optimum leaf areas for seedlings,
optimum leaf shapes to maximize photosynthetic efficiency, deep, well-developed
root systems, leaf area index (LAI) at flowering and crop growth rate (CGR)
during panicle initiation have been identified as the major determinants of yield
(Sun, Xiao, Huang, Jiao, Chen and Zhou (2005). A combination of these growth
variables explains variations in yield better than any individual growth variable
(Ghosh and Singh, 1998). From the result obtained in this study (Table 4.12) the
differences in LAI at both panicle initiation and heading stages was due to variety,
spacing and weeding regimes influence. NERICA 4 under two hoe weeding and
spacing of 25cm X10 cm produces the highest LAI.(2.56) The minimum LAI
(1.17) were found with no weeding and spacing of 15 cm X 10 cm for NERICA
10 .
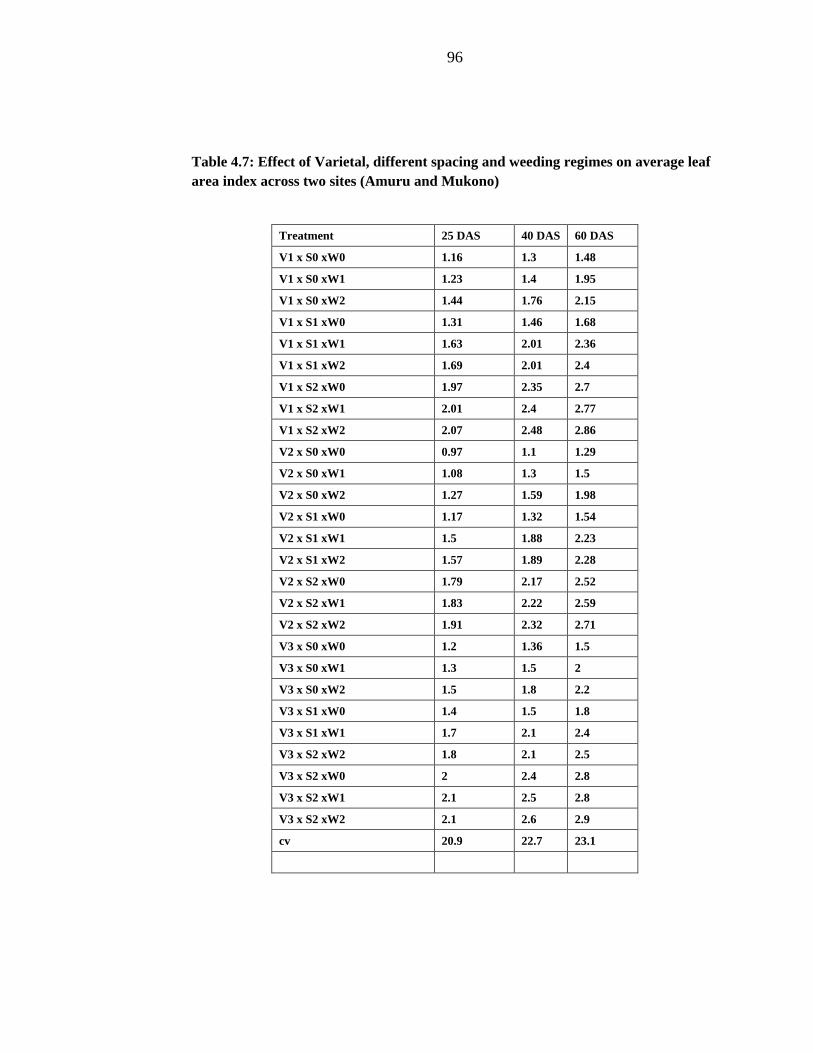
96
Table 4.7: Effect of Varietal, different spacing and weeding regimes on average leaf
area index across two sites (Amuru and Mukono)
Treatment 25 DAS 40 DAS 60 DAS
V1 x S0 xW0 1.16 1.3 1.48
V1 x S0 xW1 1.23 1.4 1.95
V1 x S0 xW2 1.44 1.76 2.15
V1 x S1 xW0 1.31 1.46 1.68
V1 x S1 xW1 1.63 2.01 2.36
V1 x S1 xW2 1.69 2.01 2.4
V1 x S2 xW0 1.97 2.35 2.7
V1 x S2 xW1 2.01 2.4 2.77
V1 x S2 xW2 2.07 2.48 2.86
V2 x S0 xW0 0.97 1.1 1.29
V2 x S0 xW1 1.08 1.3 1.5
V2 x S0 xW2 1.27 1.59 1.98
V2 x S1 xW0 1.17 1.32 1.54
V2 x S1 xW1 1.5 1.88 2.23
V2 x S1 xW2 1.57 1.89 2.28
V2 x S2 xW0 1.79 2.17 2.52
V2 x S2 xW1 1.83 2.22 2.59
V2 x S2 xW2 1.91 2.32 2.71
V3 x S0 xW0 1.2 1.36 1.5
V3 x S0 xW1 1.3 1.5 2
V3 x S0 xW2 1.5 1.8 2.2
V3 x S1 xW0 1.4 1.5 1.8
V3 x S1 xW1 1.7 2.1 2.4
V3 x S2 xW2 1.8 2.1 2.5
V3 x S2 xW0 2 2.4 2.8
V3 x S2 xW1 2.1 2.5 2.8
V3 x S2 xW2 2.1 2.6 2.9
cv 20.9 22.7 23.1
97
4.15 Yield and Yield Components
4.15.1 Effect of Weeding Regimes on Number of Grains per Panicle
Present study showed that the number of grains per panicle significantly
differed (p≤0.05) among the different weeding regimes (Table 4.5.). In Amuru the
highest number of grains per panicle (122.1) were found in two hoe weeding
which was followed by one hoe weeding regime (116), while the minimum
number of grains (87.6) were recorded from where weeds were not controlled at
all (unweeded treatment). In Mukono the highest number of grains per panicle
(112) were found in two hoe weeding which was followed by one hoe weeding
regime (102), while the minimum number of grains (79.6) were recorded from
where weeds were not controlled at all (unweeded treatment).
According to Smith and Shaw (1968), weed depresses the normal yield of
grains panicle-1 and grain weight. However, yield loss due to weeds depends upon
some variables like magnitude of weed infestation, type of weed species and time
of association with crop (Moody and De Datta, 1998).
4.15.2 Influence of Variety and Weeding on Number of Grains per Panicle
From data showing (Table 4.7) weeding regime and variety had significant
influence on number of grains produce per panicle. The highest number (121) of
grains per panicle was found in NERICA 4 under weed free (W2-two hoe
weeding) condition while the lowest number of grains per panicle (73) was found
in NERICA 10. Under no weeding (W0) condition in Amuru district the highest
grains per panicle was found in NERICA 4(90) closely followed by NERICA
98
1(86) and lowest was NERICA 10(73). With one hoe weeding (W1) the lowest
number grains per panicle (78) was found NERICA 10 and highest was found
under NERICA 4(112). This was the same trend as indicated in Mukono (Table
4.7)
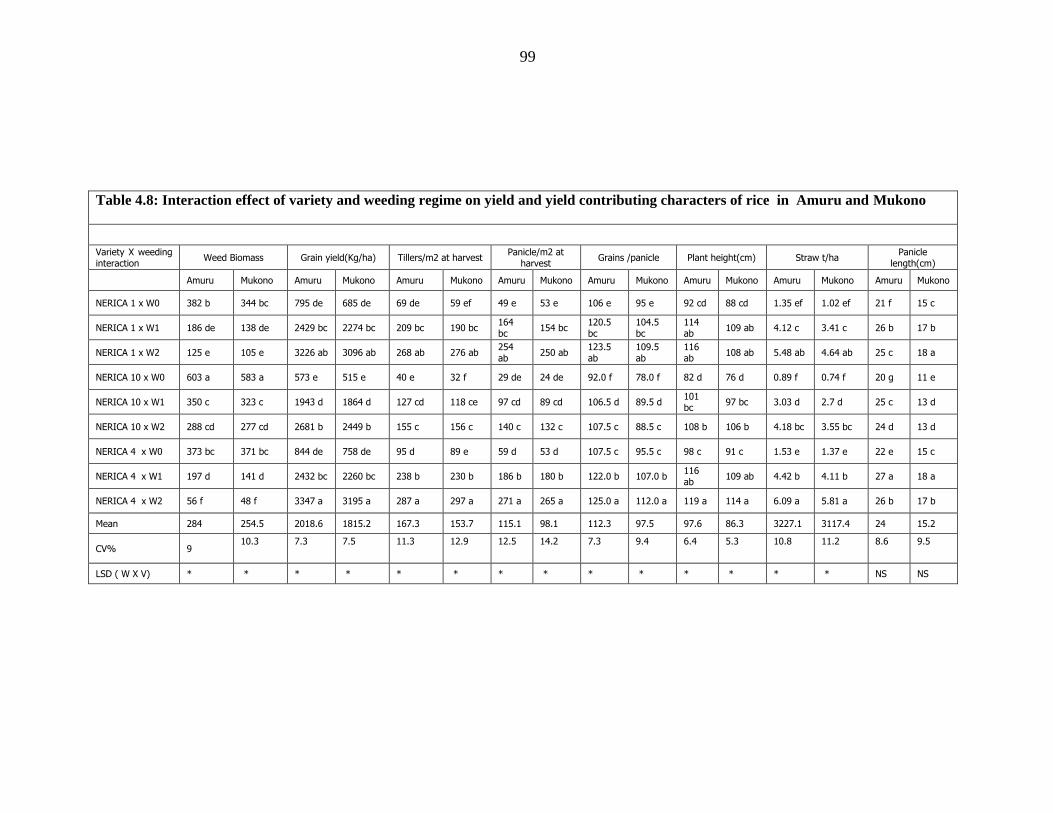
99
Table 4.8: Interaction effect of variety and weeding regime on yield and yield contributing characters of rice in Amuru and Mukono
Variety X weeding interaction
Weed Biomass Grain yield(Kg/ha) Tillers/m2 at harvest Panicle/m2 at
harvest Grains /panicle Plant height(cm) Straw t/ha
Panicle length(cm)
Amuru Mukono Amuru Mukono Amuru Mukono Amuru Mukono Amuru Mukono Amuru Mukono Amuru Mukono Amuru Mukono
NERICA 1 x W0 382 b 344 bc 795 de 685 de 69 de 59 ef 49 e 53 e 106 e 95 e 92 cd 88 cd 1.35 ef 1.02 ef 21 f 15 c
NERICA 1 x W1 186 de 138 de 2429 bc 2274 bc 209 bc 190 bc 164 bc
154 bc 120.5 bc
104.5 bc
114 ab
109 ab 4.12 c 3.41 c 26 b 17 b
NERICA 1 x W2 125 e 105 e 3226 ab 3096 ab 268 ab 276 ab 254 ab
250 ab 123.5 ab
109.5 ab
116 ab
108 ab 5.48 ab 4.64 ab 25 c 18 a
NERICA 10 x W0 603 a 583 a 573 e 515 e 40 e 32 f 29 de 24 de 92.0 f 78.0 f 82 d 76 d 0.89 f 0.74 f 20 g 11 e
NERICA 10 x W1 350 c 323 c 1943 d 1864 d 127 cd 118 ce 97 cd 89 cd 106.5 d 89.5 d 101 bc
97 bc 3.03 d 2.7 d 25 c 13 d
NERICA 10 x W2 288 cd 277 cd 2681 b 2449 b 155 c 156 c 140 c 132 c 107.5 c 88.5 c 108 b 106 b 4.18 bc 3.55 bc 24 d 13 d
NERICA 4 x W0 373 bc 371 bc 844 de 758 de 95 d 89 e 59 d 53 d 107.5 c 95.5 c 98 c 91 c 1.53 e 1.37 e 22 e 15 c
NERICA 4 x W1 197 d 141 d 2432 bc 2260 bc 238 b 230 b 186 b 180 b 122.0 b 107.0 b 116 ab
109 ab 4.42 b 4.11 b 27 a 18 a
NERICA 4 x W2 56 f 48 f 3347 a 3195 a 287 a 297 a 271 a 265 a 125.0 a 112.0 a 119 a 114 a 6.09 a 5.81 a 26 b 17 b
Mean 284 254.5 2018.6 1815.2 167.3 153.7 115.1 98.1 112.3 97.5 97.6 86.3 3227.1 3117.4 24 15.2
CV% 9 10.3 7.3 7.5 11.3 12.9 12.5 14.2 7.3 9.4 6.4 5.3 10.8 11.2 8.6 9.5
LSD ( W X V) * * * * * * * * * * * * * * NS NS
100
4.15.3 Effect of Spacing on Number of Grains per Panicle
Plant spacing significantly contributed to the number of grains per panicle
(Table 4.5). In Amuru the highest number of grains per panicle (123) were
obtained from row spacing of 25 cmx10cm while 30 x10 cm was (118) and the
lowest grain numbers (107) were from row spacing of 15x10 cm. A similar trend
was observed in Mukono site where the highest number of total grains (113) were
obtained from row spacing of 25 cmx10, while 30 x10 cm was (100) and the
lowest grain numbers (91) were from row spacing of 15x10 cm
4.15.3 Influence of variety and spacing on number of grains per panicle
Spacing and Variety significantly influenced the number of grains per
panicles Table 4.6) ) The highest number of grains per panicle (125.5 and
112.5) was produced by NERICA 4 at spacing of 25 cm in Amuru and Mukono
respectively while NERICA 10 produces the highest grain per panicle at spacing
of 30 cm (107.5 and 88.5) but when the variety was subjected to a closer spacing
of 15cm cm the number of grains per panicle reduce there was (102 and 84) in
Amuru and Mukono respectively . There were no significant differences between
NERICA 1 and NERICA 4 at spacing of 15 cm and 30 cm in both sites between
NERICA 1 and NERICA 4.
4.15. 4 Effect of variety on number of grains per panicle
Variety significantly influenced the number of grains per panicle (0.05)
(Figure 4.5). In Amuru the highest grains/panicle were obtained by NERICA 4
101
(128), which were closely followed by NERICA 1 (125) and the lowest grain
numbers (97.3) were from NERICA 10. This was also observed in Mukono with
the highest number of total grains were obtained by NERICA 4 (112) closely
followed by NERICA 1 (107) and the lowest grain numbers (77) were from
NERICA 10 (Table 4.5)
4.16 Combined effect of spacing, weeding and variety on number grains per
panicle
Grains per panicle were significantly influenced by the interaction
between variety, weed regimes and spacing in both sites at the 5% level of
probability (Table 4.2). Mean comparison results showed that the maximum
average number of grains per panicles (124 and 121.) in NERICA 4 under the
treatment combination of two hoe weeding with row spacing of 25 cm x 10 cm
Amuru and Mukono respectively. This was also closely followed with the same
variety under treatment combination 2 hoe weeding with row spacing of 30 by 10
cm (122 and 118) .NERICA-1’s highest number of grains per panicles was
obtained under treatment combination of 2 hoe weeding at 25 cm x 10 cm
spacing (121 and 116) while NERICA-10’s highest number of panicles was
achieved under treatment combination of 2 hoe weeding at 15cm X 10cm row
spacing (98 and 93) in Amuru and Mukono respectively . The average minimum
number of grains per panicle (70.2 and 61) were found with treatment
combination of un weeding and at 30 cm x 10 cm row spacing with NERICA-10
variety, followed by NERICA-1 and NERICA-4 with (84 and 79) and (90 and 87)
102
grains per panicle respectively. This was not surprising since previous finding by
Garba, Mahmoud BA , Adamu Y and U Ibrahim (2013) showed that NERICA-1
variety grew taller in the two-year study than another variery, Ex-China.
Panicle production was significantly influenced by the interaction between
variety, weed regimes and spacing in both sites (Fig 4.19 a and 4.19 b).
The number of tillers produced which ascertains panicle number is the
most important factor in high grain yield (garba et al., 2013). However, this
characteristic does not seem to be the causal factor in this study because
NERICA-1 which had the highest tillers didn’t not produce the highest yield.
.Thus, the rate of fertile tillers was a factor that could justify this, because high
tillering associated with high sterility rate reduces panicle number; meanwhile
high tillering associated with low sterility rate increases panicle number. Similar
results on genetic differences among crops producing characters like plant height
were also advanced earlier in peanut (Omran, Deheran and Abdel, 1980; Seaton,
Coffelt and Scoyoc 1992). Production of tillers is one of the yield-determining
characters in rice. Growth and development of tillers in rice depend partly on
environmental factors, especially radiation, temperature and nutritional
conditions. Varietal characteristic is of major significance in the tillering ability of
the crop. In the same environment, two varieties of rice can differ so markedly in
their tillering ability that the characteristic is considered (Yoshida, 1978). Plant
type could result from a set of morpho–physiological characteristics associated
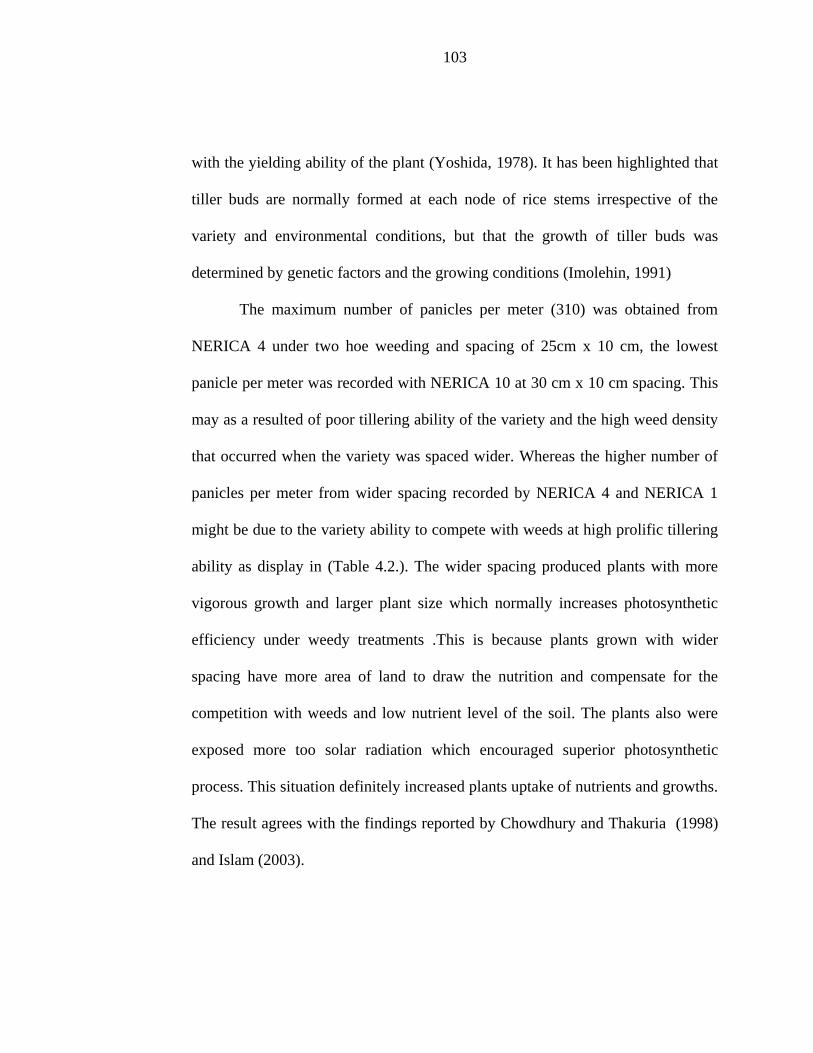
103
with the yielding ability of the plant (Yoshida, 1978). It has been highlighted that
tiller buds are normally formed at each node of rice stems irrespective of the
variety and environmental conditions, but that the growth of tiller buds was
determined by genetic factors and the growing conditions (Imolehin, 1991)
The maximum number of panicles per meter (310) was obtained from
NERICA 4 under two hoe weeding and spacing of 25cm x 10 cm, the lowest
panicle per meter was recorded with NERICA 10 at 30 cm x 10 cm spacing. This
may as a resulted of poor tillering ability of the variety and the high weed density
that occurred when the variety was spaced wider. Whereas the higher number of
panicles per meter from wider spacing recorded by NERICA 4 and NERICA 1
might be due to the variety ability to compete with weeds at high prolific tillering
ability as display in (Table 4.2.). The wider spacing produced plants with more
vigorous growth and larger plant size which normally increases photosynthetic
efficiency under weedy treatments .This is because plants grown with wider
spacing have more area of land to draw the nutrition and compensate for the
competition with weeds and low nutrient level of the soil. The plants also were
exposed more too solar radiation which encouraged superior photosynthetic
process. This situation definitely increased plants uptake of nutrients and growths.
The result agrees with the findings reported by Chowdhury and Thakuria (1998)
and Islam (2003).
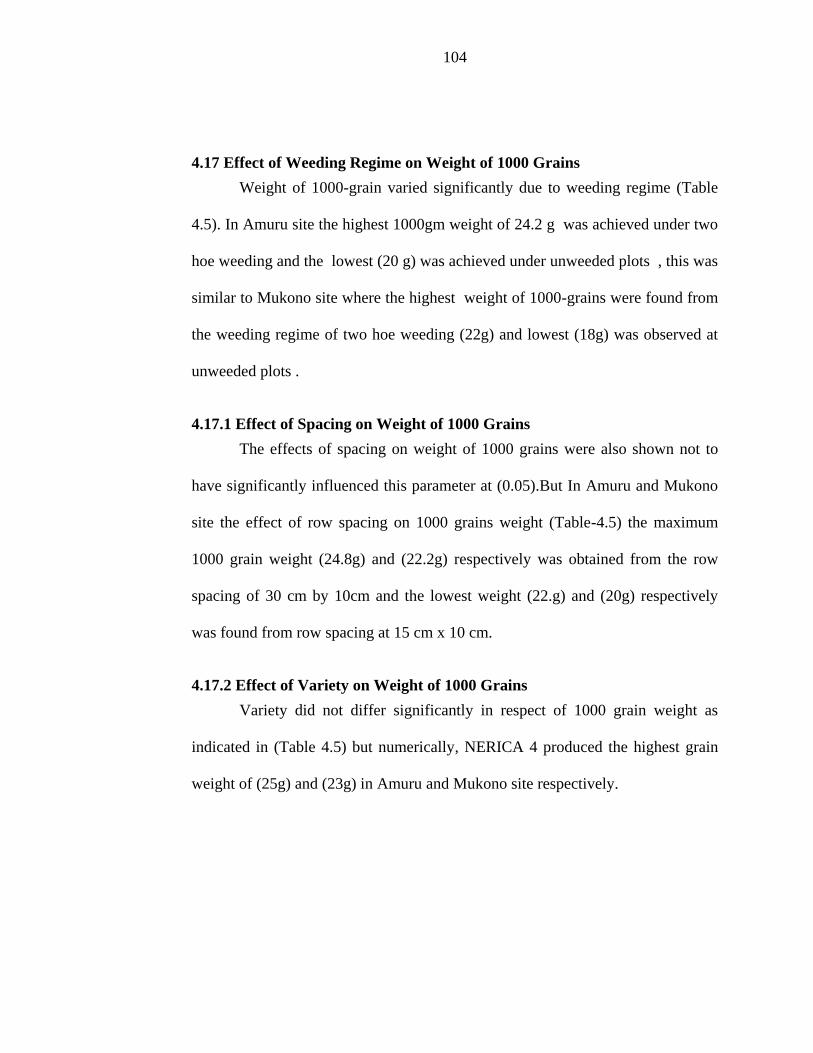
104
4.17 Effect of Weeding Regime on Weight of 1000 Grains
Weight of 1000-grain varied significantly due to weeding regime (Table
4.5). In Amuru site the highest 1000gm weight of 24.2 g was achieved under two
hoe weeding and the lowest (20 g) was achieved under unweeded plots , this was
similar to Mukono site where the highest weight of 1000-grains were found from
the weeding regime of two hoe weeding (22g) and lowest (18g) was observed at
unweeded plots .
4.17.1 Effect of Spacing on Weight of 1000 Grains
The effects of spacing on weight of 1000 grains were also shown not to
have significantly influenced this parameter at (0.05).But In Amuru and Mukono
site the effect of row spacing on 1000 grains weight (Table-4.5) the maximum
1000 grain weight (24.8g) and (22.2g) respectively was obtained from the row
spacing of 30 cm by 10cm and the lowest weight (22.g) and (20g) respectively
was found from row spacing at 15 cm x 10 cm.
4.17.2 Effect of Variety on Weight of 1000 Grains
Variety did not differ significantly in respect of 1000 grain weight as
indicated in (Table 4.5) but numerically, NERICA 4 produced the highest grain
weight of (25g) and (23g) in Amuru and Mukono site respectively.
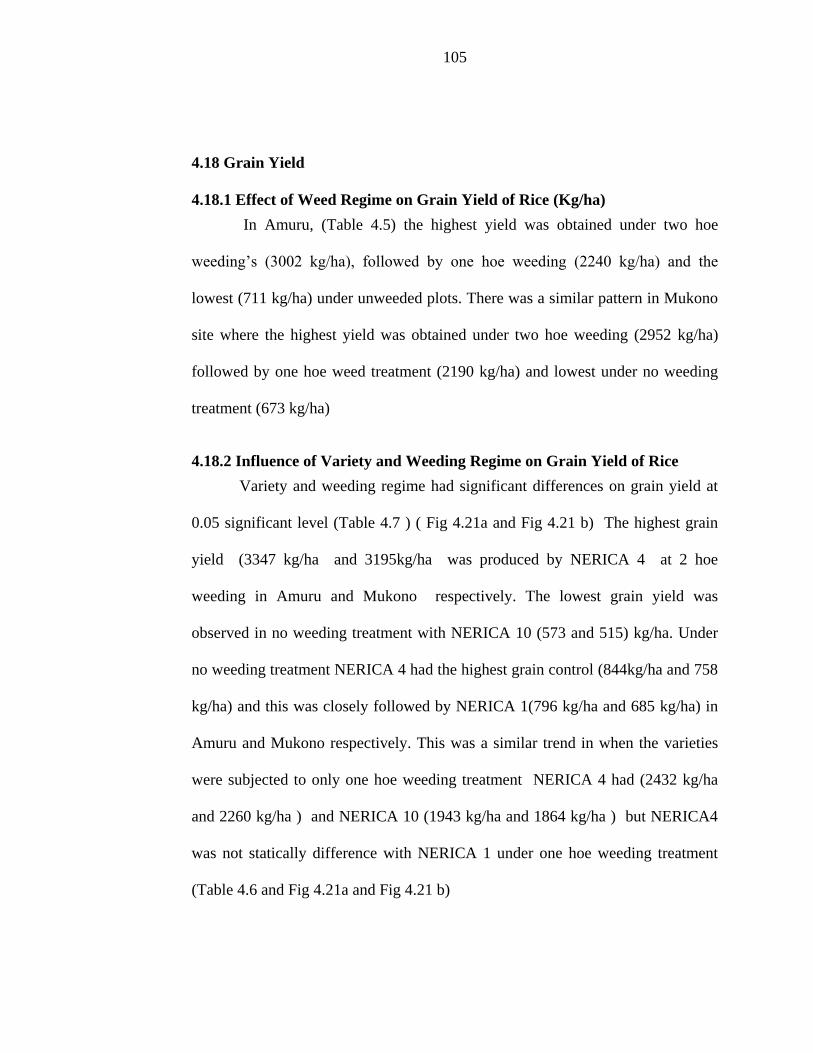
105
4.18 Grain Yield
4.18.1 Effect of Weed Regime on Grain Yield of Rice (Kg/ha)
In Amuru, (Table 4.5) the highest yield was obtained under two hoe
weeding’s (3002 kg/ha), followed by one hoe weeding (2240 kg/ha) and the
lowest (711 kg/ha) under unweeded plots. There was a similar pattern in Mukono
site where the highest yield was obtained under two hoe weeding (2952 kg/ha)
followed by one hoe weed treatment (2190 kg/ha) and lowest under no weeding
treatment (673 kg/ha)
4.18.2 Influence of Variety and Weeding Regime on Grain Yield of Rice
Variety and weeding regime had significant differences on grain yield at
0.05 significant level (Table 4.7 ) ( Fig 4.21a and Fig 4.21 b) The highest grain
yield (3347 kg/ha and 3195kg/ha was produced by NERICA 4 at 2 hoe
weeding in Amuru and Mukono respectively. The lowest grain yield was
observed in no weeding treatment with NERICA 10 (573 and 515) kg/ha. Under
no weeding treatment NERICA 4 had the highest grain control (844kg/ha and 758
kg/ha) and this was closely followed by NERICA 1(796 kg/ha and 685 kg/ha) in
Amuru and Mukono respectively. This was a similar trend in when the varieties
were subjected to only one hoe weeding treatment NERICA 4 had (2432 kg/ha
and 2260 kg/ha ) and NERICA 10 (1943 kg/ha and 1864 kg/ha ) but NERICA4
was not statically difference with NERICA 1 under one hoe weeding treatment
(Table 4.6 and Fig 4.21a and Fig 4.21 b)
106
Figure 30. Influence of Varieties and Weeding regime on rice yields kg/ha (Amuru)
Figure 31.21 b. Influence of Varieties and Weeding regime on rice yields kg/ha -1
(Mukono)
4.18.3 Effect of Variety on Grain Yield of Rice
In Amuru the variety NERICA-4 and NERICA-1 produced significantly
higher grain yield (p≤0.05) (2339 kg/ha) and (2234 kg/ha) respectively as shown
in Table 4.5 compared to the variety NERICA-10 (1861 kg/ha) with the lowest
0500
1000150020002500300035004000
NERICA1
NERICA10
NERICA4
NERICA1
NERICA10
NERICA4
NERICA1
NERICA10
NERICA4
Yiel
d k
g/h
a
No weeding , 1 Hand weeding , 2 hand weeding
Location : Amuru
0
500
1000
1500
2000
2500
3000
NERICA 1NERICA 10NERICA 4 NERICA 1NERICA 10NERICA 4 NERICA 1NERICA 10NERICA 4
Yiel
d k
g/h
a
@ 15 cm @ 25cm , @ 30cm cm
Location Mukono
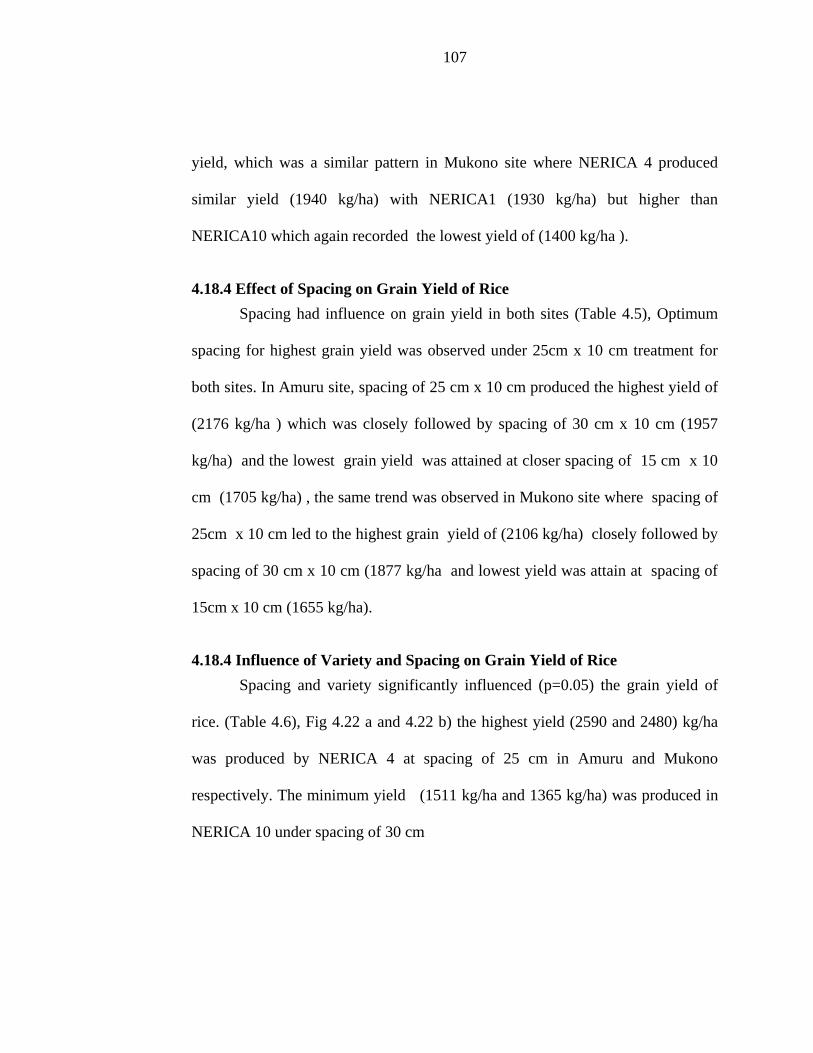
107
yield, which was a similar pattern in Mukono site where NERICA 4 produced
similar yield (1940 kg/ha) with NERICA1 (1930 kg/ha) but higher than
NERICA10 which again recorded the lowest yield of (1400 kg/ha ).
4.18.4 Effect of Spacing on Grain Yield of Rice
Spacing had influence on grain yield in both sites (Table 4.5), Optimum
spacing for highest grain yield was observed under 25cm x 10 cm treatment for
both sites. In Amuru site, spacing of 25 cm x 10 cm produced the highest yield of
(2176 kg/ha ) which was closely followed by spacing of 30 cm x 10 cm (1957
kg/ha) and the lowest grain yield was attained at closer spacing of 15 cm x 10
cm (1705 kg/ha) , the same trend was observed in Mukono site where spacing of
25cm x 10 cm led to the highest grain yield of (2106 kg/ha) closely followed by
spacing of 30 cm x 10 cm (1877 kg/ha and lowest yield was attain at spacing of
15cm x 10 cm (1655 kg/ha).
4.18.4 Influence of Variety and Spacing on Grain Yield of Rice
Spacing and variety significantly influenced (p=0.05) the grain yield of
rice. (Table 4.6), Fig 4.22 a and 4.22 b) the highest yield (2590 and 2480) kg/ha
was produced by NERICA 4 at spacing of 25 cm in Amuru and Mukono
respectively. The minimum yield (1511 kg/ha and 1365 kg/ha) was produced in
NERICA 10 under spacing of 30 cm
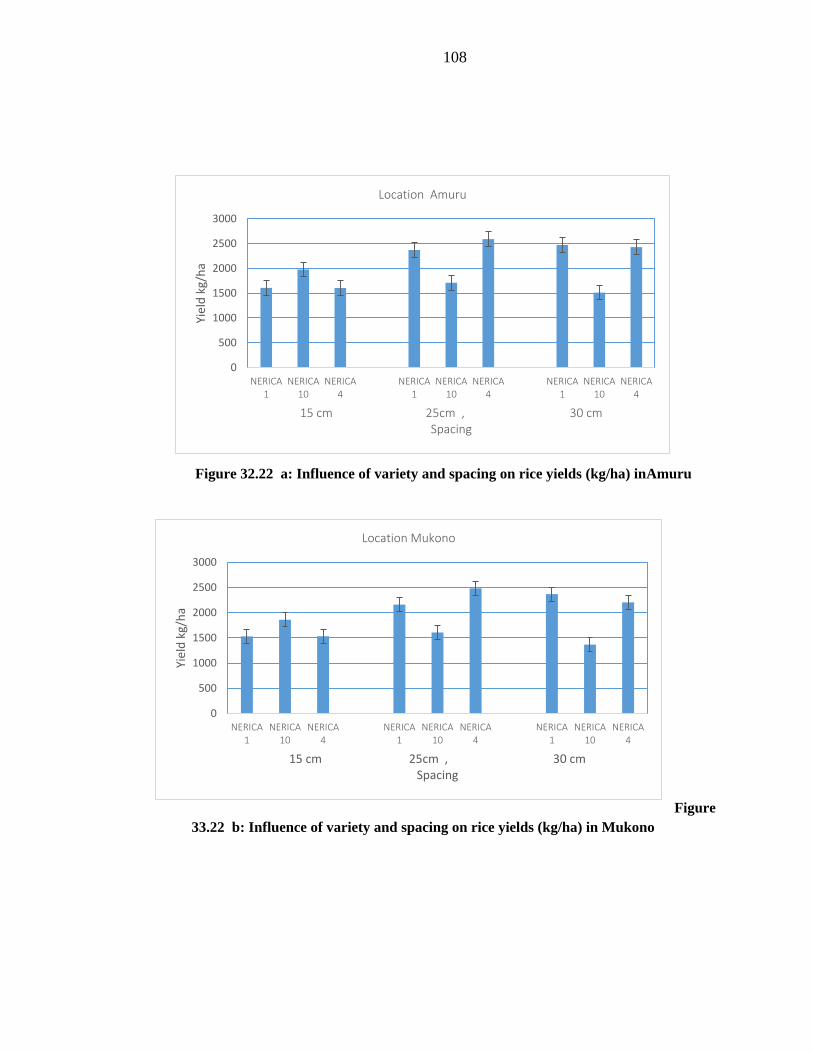
108
Figure 32.22 a: Influence of variety and spacing on rice yields (kg/ha) inAmuru
Figure
33.22 b: Influence of variety and spacing on rice yields (kg/ha) in Mukono
0
500
1000
1500
2000
2500
3000
NERICA1
NERICA10
NERICA4
NERICA1
NERICA10
NERICA4
NERICA1
NERICA10
NERICA4
Yiel
d k
g/h
a
15 cm 25cm , 30 cmSpacing
Location Amuru
0
500
1000
1500
2000
2500
3000
NERICA1
NERICA10
NERICA4
NERICA1
NERICA10
NERICA4
NERICA1
NERICA10
NERICA4
Yiel
d k
g/h
a
15 cm 25cm , 30 cm Spacing
Location Mukono
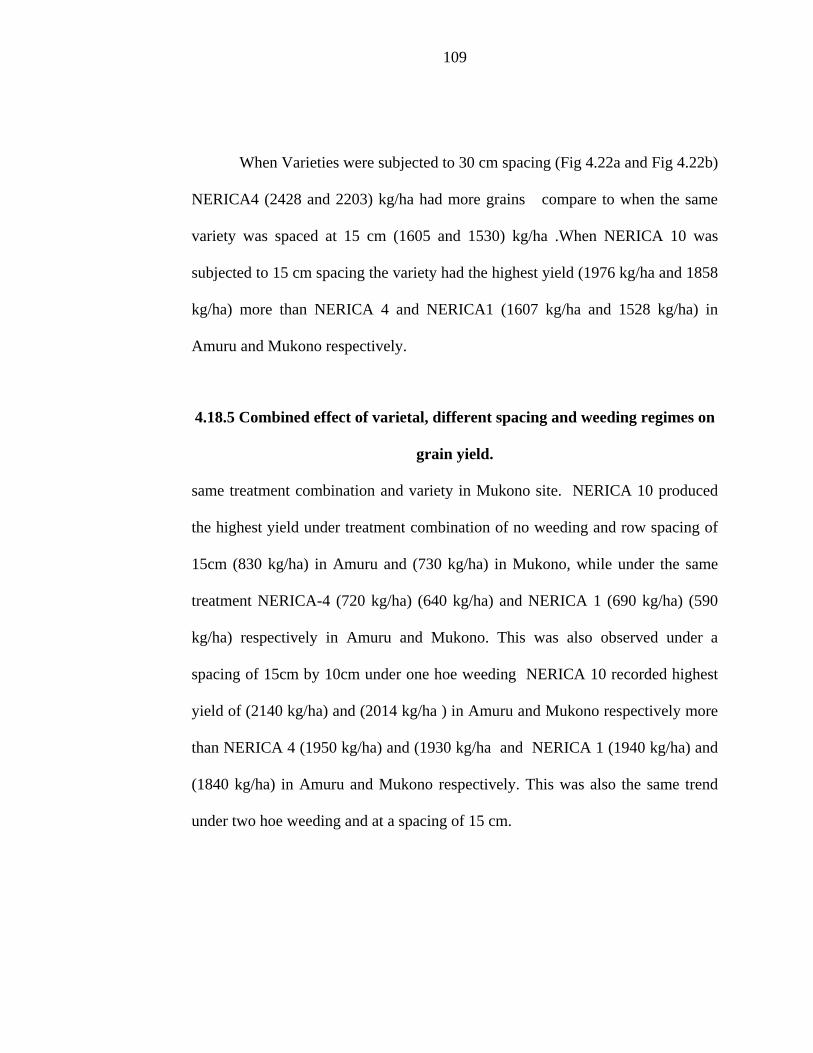
109
When Varieties were subjected to 30 cm spacing (Fig 4.22a and Fig 4.22b)
NERICA4 (2428 and 2203) kg/ha had more grains compare to when the same
variety was spaced at 15 cm (1605 and 1530) kg/ha .When NERICA 10 was
subjected to 15 cm spacing the variety had the highest yield (1976 kg/ha and 1858
kg/ha) more than NERICA 4 and NERICA1 (1607 kg/ha and 1528 kg/ha) in
Amuru and Mukono respectively.
4.18.5 Combined effect of varietal, different spacing and weeding regimes on
grain yield.
same treatment combination and variety in Mukono site. NERICA 10 produced
the highest yield under treatment combination of no weeding and row spacing of
15cm (830 kg/ha) in Amuru and (730 kg/ha) in Mukono, while under the same
treatment NERICA-4 (720 kg/ha) (640 kg/ha) and NERICA 1 (690 kg/ha) (590
kg/ha) respectively in Amuru and Mukono. This was also observed under a
spacing of 15cm by 10cm under one hoe weeding NERICA 10 recorded highest
yield of (2140 kg/ha) and (2014 kg/ha ) in Amuru and Mukono respectively more
than NERICA 4 (1950 kg/ha) and (1930 kg/ha and NERICA 1 (1940 kg/ha) and
(1840 kg/ha) in Amuru and Mukono respectively. This was also the same trend
under two hoe weeding and at a spacing of 15 cm.
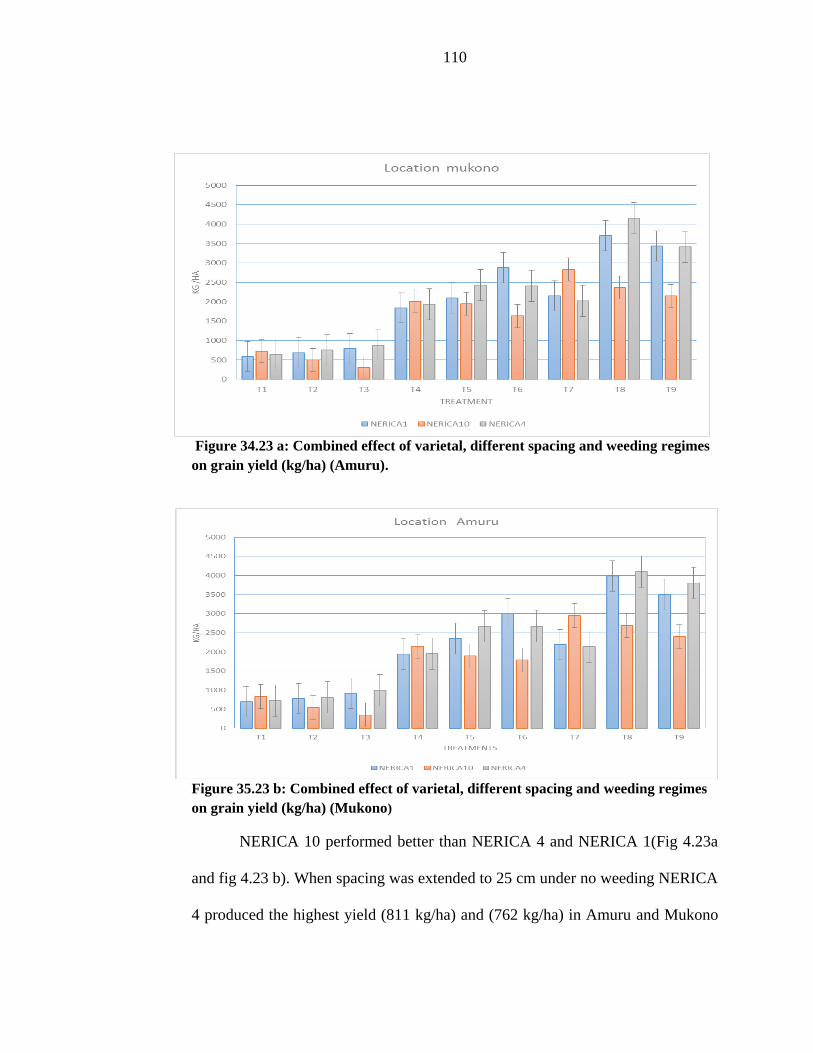
110
Figure 34.23 a: Combined effect of varietal, different spacing and weeding regimes
on grain yield (kg/ha) (Amuru).
Figure 35.23 b: Combined effect of varietal, different spacing and weeding regimes
on grain yield (kg/ha) (Mukono)
NERICA 10 performed better than NERICA 4 and NERICA 1(Fig 4.23a
and fig 4.23 b). When spacing was extended to 25 cm under no weeding NERICA
4 produced the highest yield (811 kg/ha) and (762 kg/ha) in Amuru and Mukono
111
respectively and NERICA 10 produces the lowest of (541 kg/ha) and (503 kg/ha)
in Amuru and Mukono respectively. This was the same trends under the same
treatment but at a spacing of 30 cm.
When the Varieties was subject to one hoe weeding and at a spacing of
25cm NERICA 4 performed better (2667 kg/ha) closely followed by NERICA-1
(2350 kg/ha) and lowest was NERICA10 ( 1895 kg/ha). This was the same trend
in Mukono site but when the varieties was further subject to spacing of 30 cm
with one hoe weeding NERICA 1 performed highest (2996 kg/ha) followed by
NERICA 4 ( 2673 kg/ha ) and lowest was NERICA 10 (1786 kg/ha ) . This was
also observed in Mukono site .Under two hoe weeding with spacing combination
of 25 cm NERICA 4 performed better with a two hoe weeding regime (4100
kg/ha ) ,NERICA 1 ( 3984kg/ha) and NERICA 10 (2692 kg/ha) .In Mukono
NERICA 4 still attained the highest yield(4153 kg/ha) ,NERICA 1 (3703 kg/ha)
and NERICA 10 (2152 kg/ha ) under the same treatment combination .When
varieties were subjected to a spacing of 30cm and two hoe weeding NERICA4
recorded the highest yield of (3805 kg/ha ), NERICA 1(3503 kg/ha) and lowest
NERICA 10 (2400 kg/ha).
Significant variety spacing and weeding interactions in the two sites indicated that
(Table 4.2) among the improved varieties some varieties responded better to
spacing and weeding regimes than others. At spacing of 25 cm x 10 cm and two
hoe weeding, NERICA 4 mean yield of 4126 kg out yielded others consistently-
112
NERICA 1 (3843 kg/ha ) and NERICA 10 (2527 kg/ha) . The significant higher
grain yield recorded in the interaction between NERICA 4, inter-row 25 cm and 2
hoe weeding might be due to fewer crops - weed competition that ensured
sufficient supply of plant nutrients for rice plant growth and the variety tillering
ability. This result is also in accordance with the findings of Moynul, Hossain,
Rezaul, Khalequzzaman, karim (2003), who recorded higher grain yield from
weed-free regimes, which was identical to two weeding regimes.
However, under closer spacing 15 cm x 10 cm and two hoe weeding NERICA 10
(2890 kg/ha) out yielded NERICA 4 (2076 kg/ha) and NERICA 1 (2170 kg/ha)
respectively. It was a similar trend when the three varieties were subject to the
spacing of 15 cm x 10 cm but unweeded and one hoe weeding and spacing of 15
cm x 10 cm in NERICA 10
In relation to treatment combination (Fig 4.23a b),NERICA 4 (4100kg)
and (4153kg )outperformed NERICA 10 (2400 kg/ha) (2152 kg/ha) and
NERICA 1 (3503 kg/ha) (3703 kg/ha) respectively under treatment combination
of two hoe weeding and row spacing of 30 cm the highest yield in both sites
.When varieties were subjected to row spacing of 25 cm under two hoe weeding
in Amuru and Mukono NERICA1 produces the highest grain of (3984kg/ha)
(3703 kg/ha) compare to NERICA4 (3803 kg/ha) (3413 kg/ha) and NERICA 10
(2692 kg/ha) (2363 kg/ha) respectively in both sites .When varieties where
subjected to closer spacing of 15 cm in Amuru and Mukono under two hoe
113
weeding NERICA 10 outperformed better with (2950 kg/ha) (2831/kg/ha)
Respectively while NERICA 1 (2190 kg/ha) (2150 kg/ha) and NERICA 4
(2135kg/ha) (2018 kg/ha) . The pattern of grain yield production was similar to
the treatment combination of one hoe weeding and 25cm row spacing. Under
treatment combination of unweeded plots and 15cm spacing NERICA 10
performed better (780 kg/ha) compare to NERICA1 (640 kg/ha) and NERICA
4(680 kg/ha) but when the variety was subjected to a wider spacing of 25 cm and
30 cm yield reduction of 33.2% and 57.8 % respectively was recorded while
NERICA 4 and NERICA 1 under the same wider spacing had yield increment of
37.2%, 19.2% and 33% , 13% respectively .
This might be due to severe weed infestation in no weeding that caused
higher competition between the weeds and the rice plant for the growth essentials.
Which affected yield contributing characters like number of tillers hill-1 and grain
panicle-1. Chowdhury and Thakuria (1998) reported that the weed free regime
gave the highest yield than no weeding regime. Similar results were also observed
by Gogoi, Rajkhowa and Kandali., (2000) Islam (2001) and Attalla and Kholosy
(2002). Results from research with Soybean showed similar responses as the
current outcome (Rezvani, Ahangari and Zaeferian., 2012) where varietal
differences with weeding resulted in differences in yield containers. As per their
findings, it can be assumed that two hoe weeding were more effective in weed
control. In two weeding regime, 1000 grain weight was higher than no and one
114
weeding regimes. Weed competition caused shading and also decreasing resource
availability and photosynthesis. As there is compensation relationship between
yields components (Carson Karimi and Show 1982) with decreasing grain per
pod, 1000 grain weight increased.
4.19 Relative Yield Loss (RYL)
Percent yield loss varied with different weeding regimes and spacing
(Table 4.9.). Highest yield loss (92.3%) in terms of grain yield was recorded
under no weeding treatment in NERCA 10 variety. The lowest yield loss (9%)
was recorded in NERICA 4 under treatment of two- hoes weeding at a spacing of
30cm x 10 cm. The average relative yields of the unweeded plots compared to the
weed-free (reflecting relative yield losses) for the three upland rice varieties were
52%, 62% and 51%, respectively for NERICA1, NERICA10, with an average of
55%.
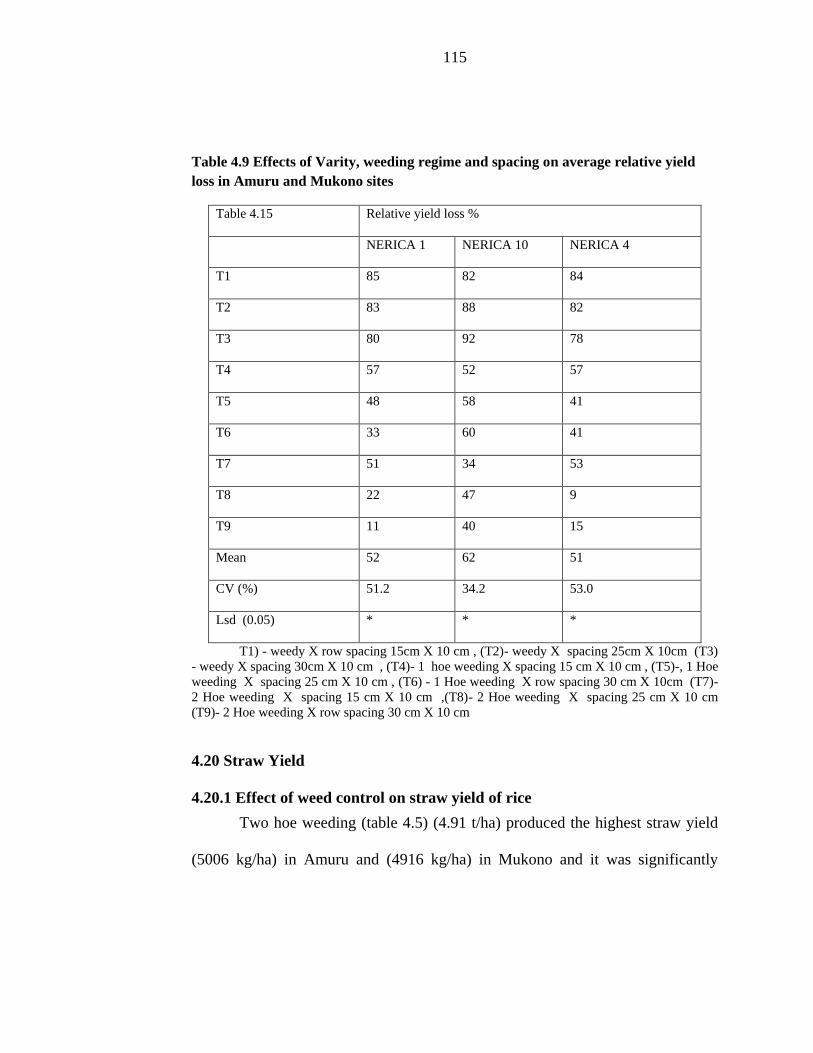
115
Table 4.9 Effects of Varity, weeding regime and spacing on average relative yield
loss in Amuru and Mukono sites
Table 4.15 Relative yield loss %
NERICA 1 NERICA 10 NERICA 4
T1 85 82 84
T2 83 88 82
T3 80 92 78
T4 57 52 57
T5 48 58 41
T6 33 60 41
T7 51 34 53
T8 22 47 9
T9 11 40 15
Mean 52 62 51
CV (%) 51.2 34.2 53.0
Lsd (0.05) * * *
T1) - weedy X row spacing 15cm X 10 cm , (T2)- weedy X spacing 25cm X 10cm (T3)
- weedy X spacing 30cm X 10 cm , (T4)- 1 hoe weeding X spacing 15 cm X 10 cm , (T5)-, 1 Hoe
weeding X spacing 25 cm X 10 cm , (T6) - 1 Hoe weeding X row spacing 30 cm X 10cm (T7)-
2 Hoe weeding X spacing 15 cm X 10 cm ,(T8)- 2 Hoe weeding X spacing 25 cm X 10 cm
(T9)- 2 Hoe weeding X row spacing 30 cm X 10 cm
4.20 Straw Yield
4.20.1 Effect of weed control on straw yield of rice
Two hoe weeding (table 4.5) (4.91 t/ha) produced the highest straw yield
(5006 kg/ha) in Amuru and (4916 kg/ha) in Mukono and it was significantly

116
superior to one hoe weeding (3685 kg/ha) Amuru, (3585 kg/ha) and unweeded
check (1190 kg/ha) (1120 kg/ha) in Amuru and Mukono respectively.
4.20.2 Effect of Different Spacing on Straw Yield of Rice
There was no significant difference between the spacing at 25 cm x10xm (3609
kg/ha ), (3495 kg/ha ) (Table 4.5) and spacing of 30 cm x 10cm (3497 kg/ha ) and
(3401 kg /ha ) respectively in Amuru and Mukono in terms of straw yield but
spacing of 25cm x 10xm (3.55 t/ha) produced 3% higher straw yield than spacing
of 30 cm x 10cm. and better than spacing of 15cm x 10cm which produced the
lowest of average of (2811 kg/ha) and (2691 kg/ha ) in Amuru and Mukono
respectively. Studies have also confirmed that grain and straw yields decreased
with increase in weed competition duration (Ahmed et al., 1997).
4.20.3 Effect of Variety on Straw Yield of Rice
In terms of variety, NERICA-4 (Table 4.5) produced the highest straw
yield (3983 kg/ha), (3803 kg/ha) over NERICA 1 (3387 kg/ha) (3295 kg /ha), and
NERICA 10 (2577 kg /ha) (2459 kg/ha) in Amuru and Mukono respectively
4.20.4 Influence of Variety and Spacing on Straw Yield of Rice
From the result shows (Table 4.6) (Fig 4.25a and 4.25 b) Spacing and
varieties have influence on the straw yield produce. NERICA 4 under 30 cm
spacing produced the highest straw yield (4714 kg/ha) and the lowest straw yield
(2357 kg/ha) was found in 30cm x 10 cm under NERICA-10. Which indicated
that when NERICA-10 was put under wider spacing the straw yield reduces

117
which was the reverse for the NERICA-4 and NERICA-1 were straw yield
increases as spacing becomes wider.
Figure 4.25 a. Influence of variety and spacing on straw yield of rice in Amuru.
0
1000
2000
3000
4000
5000
6000
NERICA 1
NERICA 10
NERICA 4
NERICA 1
NERICA 10
NERICA 4
NERICA 1
NERICA 10
NERICA 4
KG
/HA
15 CM 2 5CM 30CM
SPACING
Location Amuru
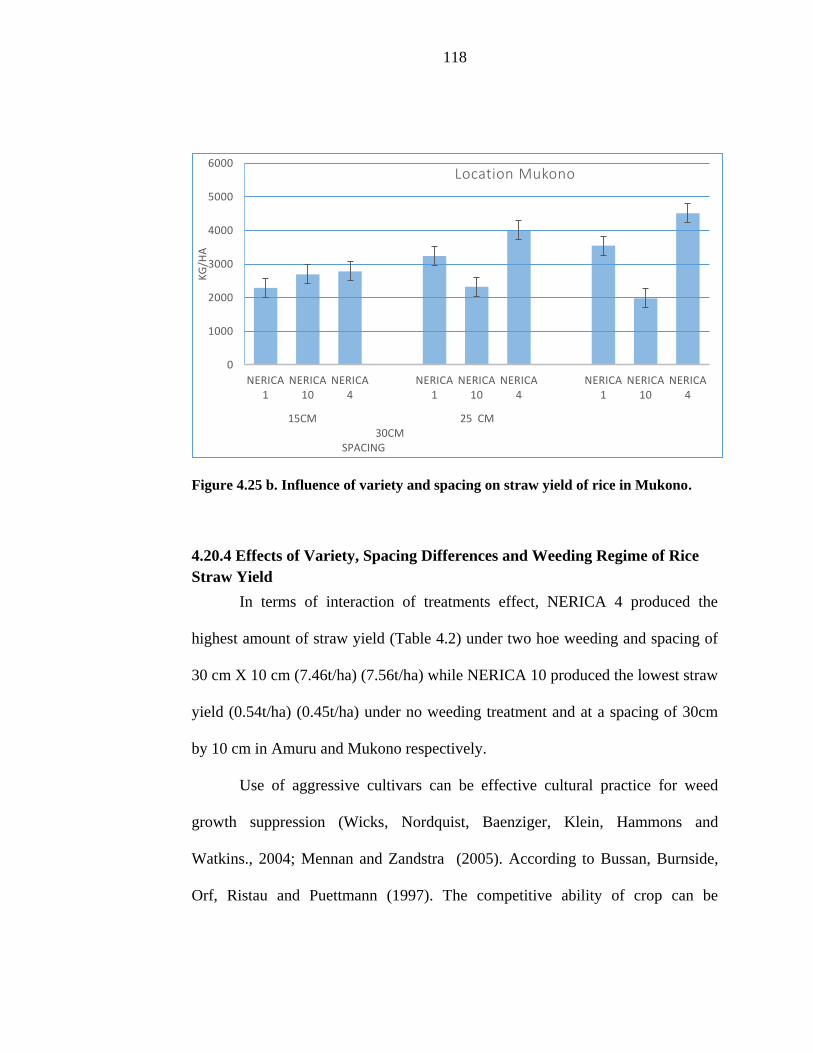
118
Figure 4.25 b. Influence of variety and spacing on straw yield of rice in Mukono.
4.20.4 Effects of Variety, Spacing Differences and Weeding Regime of Rice
Straw Yield
In terms of interaction of treatments effect, NERICA 4 produced the
highest amount of straw yield (Table 4.2) under two hoe weeding and spacing of
30 cm X 10 cm (7.46t/ha) (7.56t/ha) while NERICA 10 produced the lowest straw
yield (0.54t/ha) (0.45t/ha) under no weeding treatment and at a spacing of 30cm
by 10 cm in Amuru and Mukono respectively.
Use of aggressive cultivars can be effective cultural practice for weed
growth suppression (Wicks, Nordquist, Baenziger, Klein, Hammons and
Watkins., 2004; Mennan and Zandstra (2005). According to Bussan, Burnside,
Orf, Ristau and Puettmann (1997). The competitive ability of crop can be
0
1000
2000
3000
4000
5000
6000
NERICA 1
NERICA 10
NERICA 4
NERICA 1
NERICA 10
NERICA 4
NERICA 1
NERICA 10
NERICA 4
KG
/HA
15CM 25 CM30CM
SPACING
Location Mukono
119
expressed in two ways. First is the ability of the crop to compete to weeds,
reducing weed seed and biomass production. The second possibility is having
crop tolerate competition from weeds, while maintaining high yields (Bussan et
al., (1997).
120
CHAPTER FIVE: CONCLUSION AND RECOMMENDATIONS
The results of the trial are summed up as follows based on the objective of
the experiment and the derived hypothesis that hypothesized -that narrow row
spacing’s decreased the interval of critical weed competition periods, that there
were varieties with potential abilities to suppress weed depending on key
morphological, phonological traits and growth parameters and that optimum yield
potential of a variety depends on the number of weeding regimes. From the
findings of the present research it was clear that weed management practices such
as weeding regimes, spacing and varietal influence improved the growth and yield
of rice as compared to weedy check. In weedy check plots, there was an intense
competition between crop plants and weeds for soil and climatic resources. In
general morphological, phonological traits and growth parameters such as plant
height , tillering ability, number of productive tillers and leaf are index plays a
critical role in determine the final yield and rice competitiveness against weeds.
The study has shown that rice varieties differ in their weed suppressing
ability. The taller plant and higher tillering ability of NERICA 4 resulted in good
canopy formation which contributed to its weed suppressing ability which
translated into greater grain yield. The results also suggest that different weed
control treatments greatly affected the weed control efficacy, yield contributing
characters and grain yield of upland rice. Spacing of 25 cm x 10 cm resulted in
less weeds biomass but 15cm x 10 cm also reduce the weed biomass but had
121
negative result in terms of yield apart from NERICA 10 which adapts to such
spacing. Higher grain yield was obtained from two hoe weedings and spacing of
25cm x 10 cm under NERICA 4 .NERICA4 variety had significantly higher yield
than the other varieties, implying a better weed competitiveness of this variety in
Uganda the variety NERICA 4 should be planted at spacing 25cm × 10cm with
two hoe weedings at 15 and 35 DAS to have the effective and economic weed
control as well as the highest grain yield in the crop (4127 kg/ha). While
NERICA-1 should be spaced at 25cm x 10 cm and two hoe weeding to attain a
yield of (3844 kg/ha) if NERICA 10 is to be adopted as means of early maturing
variety by farmers in Uganda this variety should be spaced at 15 cm x 10 cm with
two hoe weeding to attain a yield of (2890 kg/ha).
6.1 Recommendation
If farmers are to implore one hoe weeding to control weeds in rice
NERICA-1 should be recommend at a spacing of 30cm x 10 cm to attain an
average yield of ( 2930 kg/ha ) which is still above the national average of 1.7t
ha-1. The data showed that NERICA 4 was more tolerant to weed pressure than the
other varieties. At single hoe weeding it out-yielded other varieties and its yield at
two hoe weeding regimes tended to approach optimum.
This variety could be recommended to farmers in the study area and other
areas with similar environmental conditions as a first choice variety in relation to
the other varieties studied. Its superior yield advantage at single hoe weeding was
122
consistent across locations and is of importance since most farmers are known to
avoid a second weeding due to insufficient time and high cost of labor.
A further experiment may be conducted with NERICA-4 to find out the
main strategy employed by it in weed suppression and this may include
allelopathy and rooting depth as well as its net assimilation rate.
123
REFERENCES
Adesina, A. A., Johnson, D. E., & Heinrichs, E. A. (1994). Rice pests in the
Ivory Coast, West Africa—Farmers perceptions and management
strategies. Int. J. Pest Mang. 40(4), 293–299.
Africa Rice Center (Africa Rice), (2008)
www.africarice.org/publications/com/nec-2008.pdf
Ahmed, G. J. U., Mamun, A. A. S., Hossain, M. A., Siddique, S. B., &
Mridha, A. J. (1997). Effect of Basagran and raking combined with hoe
weeding to control weeds in Aus rice. Bangladesh Agron. J. 7: 31-32.
Ahmed, G.J.U. & Bhuiyan, M.K.A. (2010). Performance of weed management
practices for different establishment methods of rice (Oryza sativa L.)
in dry season. Pak. J. Weed Sci. Res. 16: 393-402.
Akobundu, I. O., & Fagade, S. O. (1978). Weed problems of African rice
lands. In ‘‘Rice in Africa’’ (I. W. Buddenhagen and G. J. Persley,
Eds.), pp. 181–192. Academic Press, London.
Akobundu, I. O., & Ahissou, A. (1985). Effect of interrow spacing and
weeding frequency on the performance of selected rice cultivars on
hydromorphic soils of West Africa. Crop Prot. 4(1), 71–76.
Akobundu, I. O. (1987). Weed Science in the Tropics—Principles and
Practices. Wiley, Chichester.
124
Afrol News. 2002. ‘Green Revolution’ with New African Rice
Types?http://www.afrol.com/News2002/afr008_rice_varieties.htm
Almimi, A. A., Kulahci, M., & Montgomery, D. C. (2008). “Follow-Up
Designs to Resolve Confounding in Split-Plot Experiments”. Journal of
Quality Technology 40, pp.154–166.
Alessi, J. & Power, J. F. (2004). Effect of plant population, row spacing and
relative maturity on dry land corn in the Northern plans. Agronomy
Journal 66(2): 316-319
Alou, K., & Akio. (2012), Effect of weeding regimes on yields of Nerica 4
rice in an acidic ferralsol in Lake Albertine crescent. American Journal
of Experimental Agriculture, 1(4): 174-186, 2011,176
Ampong-Nyarko, K. (1996). Weed management in rice in Africa. In ‘‘Weed
Management in Rice’’ (B. A. Auld and K. U. Kim, Eds.), pp. 183–191.
FAO, Rome.
Angiras, N. & V. Sharma. 1996. Influence of row orientation, row spacing and
weed-control methods on physiological performance of irrigated wheat
(Triticum aestivum). Indian J. Agron. 41:41–47
Ampong-Nyarko, K., & De Datta, S. K. (1991). A Hand book for Weed
Control in Rice. IRRI, Los Banos. J 31-32

125
Asch, F., Sow, A., & Dingkuhn, M. (1999). Reserve mobilization, dry matter
partitioning and specific leaf area in seedlings of African rice cultivars
differing in early vigor. Field Crops Res. 62(2–3), 191–202
Attalla S.I., & Kholosy A.S. (2002). Effect of weed control treatments
transplanted rice. Bull Fac Agric 53(4): 531-538
Bastiaans, L., Kropff, M. J., Kempuchetty, N., Rajan, A., & Migo, T. R.
(1997). Cansimulation models help design rice cultivars that are more
competitive against weeds? Field Crops Res. 51(1–2), 101–111.
Baloch, A.W., Soomro, M.A., Javad, M, Ahmed, M, Bughio, H.R., Bughio,
M.S., & Mastoi, N.N. (2002). Optimum plant density for high yield in
rice. Asian J. Plant Sci. 1: 25-27.
Bond, J.A., Walker, T.W., Bollich, P.K., Koger, C.H., & Gerard, P. (2005).
Seeding rates for stale seedbed rice production in the mid southern
United States. Agron. J. 97: 1560–1563
Bouman, B.A.M. (2003a). Rice and weeds: the coming crisis. Weed Science.
14(2): 1-6.
Becker, M., & Johnson, D. E. (1999a). Rice yield and productivity gaps in
irrigated systems of the forest zone of Cote d’Ivoire. Field Crops Res.
60(3), 201–208.
126
Becker, M., & Johnson, D. E. (1999b). The role of legume fallows in
intensified upland rice-based systems of West Africa. Nutr. Cycl.
Agroecosys. 53(1), 71–81.
Becker, M., & Johnson, D. E. (2001a). Cropping intensity effects on upland
rice yield and sustainability in West Africa. Nutr. Cycl. Agroecosys.
59(2), 107–117.
Becker, M., & Johnson, D. E. (2001b). Improved water control and crop
management. Effects on lowland rice productivity in West Africa. Nutr.
Cycl. Agroecosys. 59(2), 119–127.
Begum, M., Juraimi, A. S, Azmi, M., Syed, S. R. O & Rajan A. (2008). Weed
flora of different farm blocks in block-1 of muda rice granary in
peninsular Malaysia. J. Biosci. 19: 33–43.
Blackshaw, R.E., Brandt, R.N., Janzen, H.H., Entz, T., Grant, C.A., &
Derksen, D.A., (2003). Differential response of weed species to added
nitrogen. Weed Sci. 51: 532–539.
Brown, H., Cussans, G. W., Devine, M.D., Duke, S.O., Fernandez-Quintanilla,
C., Helweg, A., Labrada, R., Landes, M., Kudsk, P. & Streibig, J. C.
eds. Rice-Wheat Consortium for the Indo-Genetic Plains & CIMMYT
(2003). Tillage and Crop Establishment. (Available at URL:
http://www.rwc-prism.cgiar.org/rwc/tce.asp).
127
Bussan, A. J., Burnside, O. C., Orf, J. H., Ristau, E. A & Puettmann K. J
(1997). Field evaluation of soybean (Glycine max) genotype for weed
competitiveness. Weed Sci. 45:31-37.
Carson R. E., Karimi M., & Show R. H (1982). Comparison of the nodal
distribution of yield components of indeterminate soybeans under
irrigated and rainfed conditions. Agron J. 47: 531-535.
Carney, J. &Watts, M. (1991). Disciplining Women? Rice, Mechanization and
the Evolution of Mandinka Gender Relations in Senegambia. Signs:
Journal of Women in Culture and Society 16: 651–681.
Caussanel, J.P. (1989). Injury and Injury levels of weeds in annual crops:
specific concurrence condition. Agronomy, 9: 219-240.
Chowdhury, J.K., & Thakuria, R.K., (1998). Evaluation of herbicides in seeded
late Sali rice in Assam. Indian J Agron 43(2): 291-264
Cousens, R. (1985). An empirical model relating crop yield to weed and crop
density and statistical comparison with other models. J. Agric. Sci. 105,
513–521.
Dalley, C. D., M. L. Bernards, & J. J. Kells (2006). Effect of weed removal
timing and row spacing on soil moisture in corn (Zea mays). Weed
Technol. 20:399-409.
128
Dalley, C. D., Bernards, M. I. & Kells, J. J. (2006). Effect of Weed removal
timing and row spacing on soil moisture in corn (Zea mays). Weed
Technology, 20: 399– 409.
Das Gupta, D. K. (1983). Upland rice in West Africa: its importance, problems
and research. Lecture.
De Vida, F B P, Laca E A Mackill D J Grisel M & Fischer A J (2006). Relating
rice traits to weed competitiveness and yield: a path analysis. Weed
Sci., 54: 1122‒1131
Dey J. (1981). Gambian Women: Unequal Partners in Rice Development
Projects. p. 109 – 22. In: Nelson N ed. African Women in the
Development Process. London: Frank Cass.
Diagne A. (2006). The Diffusion and Adoption of NERICA Rice Varieties in
Côte d’Ivoire. The Developing Economies 44(2): 208–
231.http://icosamp.ecoport.org/archives/mpw/P05.pdf
Diallo, S., & Johnson, D. E. (1997). Les adventices du riz irrigue´ au Sahel et
leur controlˆ le. In ‘‘Irrigated Rice in the Sahel: Prospects for
Sustainable Development’’ (K. M. Mie´zan, M. C. S. Wopereis, M.
Dingkuhn, J. Deckers, and T. F. Randolph, Eds.), pp. 311–
323.WARDA, Dakar.
129
Dingkuhn, M., Jones, M. P., Johnson, D. E., & Sow, A. (1998). Growth and
yield potential of Oryza sativa and O. glaberrima upland rice cultivars
and their interspecific progenies. Field Crops Res. 57(1), 57–69.
Dingkuhn, M., Johnson, D. E., Sow, A., & Audebert, A. Y. (1999).
Relationships between upland rice canopy characteristics and weed
competitiveness. Field Crops Res. 61(1), 79–95.
Dogbé S.Y, & Aboa A (2004).Inter and intraspecific hybrids assessment of rice
for weed competitiveness in lowlands. Proceedings of the second
regional review of rice research 2002, pp. 41-45
Dzomeku, I. K., Dogbé, W. & Agawu E. T. (2007). Response of NERICA rice
varieties to weed interference in the Guinea savannah uplands. J.
Agron. 6:262–269. (mimeo. unpubl.), first upland rice training course,
August 1983.
Ekeleme, F., Kamara, A. Y., Oikeh, S. O., Omoigui, L. O., Amaza, P.,
Abdoulaye, T., & Chikoye, D. (2009).
Eric Webster & Ron Levy (2001). Weed management in rice Louisiana rice
hoe book .pg. 46-47
Estorninos, L. E., Jr., & K. Moody. (1976). The effect of plant density and
weed control in transplanted rice. Paper presented at the 7th Annual
Conference of the Pest Control Council, Philippines, Cagayan de Oro
City, and 5-7 May 1976
130
Fagade, S. O., & Ojo, A. A. (1977). Influence of plant density and nitrogen on
yield and milling quality of lowland rice in Nigeria. Exp. Agric. 13(1),
17–24.
Fofana, B., & Rauber, R. (2000). Weed suppression ability of upland rice
under low-input conditions in West Africa. Weed Res. 40(3), 271–280.
FAO. (1999). Report of the global workshop on red rice control- Taller global
decontrol de arroz rojo. 30 August- 3 September 1999, Varadero, Cuba.
FAO, Rome, 158 p.
FAO. (2000). Workshop on Echinochloa Control, 27 May 2001, Institute of
Plant Protection, Beijing, China. Available at
http://www.fao.org/ag/AGp/agpp/IPM/Weeds/.
FAO. (1996). Production year book, Vol. 50. Rome.
Ferrell, J. A., MacDonald, G. E., & Brecke, B. J. (2006). Weed management in
soybean. FAS Extension. University of Florida,
http//edis.iFas.UFhedv/bodywgolo pp. 1 – 14 (Accessed 23: 06: 2010).
Fischer, A.J., Ramirez, H.V., & Lozano, J. Suppression of Jungle rice
[Echinochloa colona (L) Link] by irrigated rice cultivars in Latin
America. Agronomy Journal. 1997; 89:516:521.6.
Fischer, A. J., Ramirez, H. V., Gibson, K. D., & Da Silviers Pinheiro, B.
(2001). Competitiveness of semi dwarf upland rice cultivars against
131
Palisade grass (Brachiaria brizantha) and Signal grass (B. decumbens).
Agron. J. 93(5), 967–973.
Fisher, R. A. (1925). Statistical Methods for Research Workers. Edinburgh:
Oliver and Boyd.
Garba, A.A., Mahmoud, B.A., Adamu, Y. & Ibrahim, U. (2013). Effect of
variety, seed rate and row spacing on the growth and yield of rice in
Bauchi, Nigeria. African J Food, Agric, Nutr and Dev 13 (4) 1855-1866
Garrity, D. P., Movillon, M., & Moody, K. (1992). Differential weed
suppression ability in upland rice cultivars. Agron. J. 84(4), 586–591.
Ghosh DC, Singh BP (1998). Crop growth modeling for wetland rice
management. Environ and Ecol. 16(2):446–449
Gibson, K. D., Hill, J. E., Foin, T. C., Caton, B. P., & Fischer, A. J. (2001).
Water-seeded rice cultivars differ in ability to interfere with water
grass. Agron. J. 93(2), 326–332.
Gogoi, A.K., Rajkhowa, DJ, Kandali R. (2000). Effect of varieties and weed
control practices on rice productivity and weed growth. Indian J Agron
45(3): 580-585
Grichar, W.J., Bessler, B.A., & Brewer, K.D. (2004). Effect of row spacing
and herbicide dose on weed control and grain sorghum yield. Crop
Prot. 23: 263-267.
132
Hakim, M. A, Juraimi, A. S, Ismail, M., Hanafi, M. M., & Selamat A (2013). A
survey on weed diversity in Coastal rice fields of Sebarang Perak in
Peninsular Malaysia. The Journal of Animal and Plant Sciences. 23(2)
534-542.
Hasanuzzaman, M., Nahar, K., & Karim, M.R. (2007). Effectiveness of
different weed control methods on the performance of transplanted rice.
Pakistan J. Weed Sci. Res. 13(1-2), 17-25.
Hasan, R. & G. Sarker (2002). System of Rice Intensification: how a beacon
kindled among the resources of poor farmers of Bangladesh LIFE-
NOPEST-II Project, CARE-Bangladesh. pp. 1-6.
Harker, K.N., J.T. O’Donovan, R.B. Irvine, T.K. Turkington, & G.W. Clayton.
(2009). Integrating cropping systems with cultural techniques augments
wild oat (Avena fatua) management in barley. Weed Sci. 57:326–337.
Haefele S.M, Johnson D E, M’Bodj D, Wopereis M.C.S, & Miezan K M
(2004). Field screening of diverse rice genotypes for weed
competitiveness in irrigated lowland ecosystems
Harding SS, Taylor DR, Jalloh AB, Mahmood N, Dixon CA, & Johnson SD
(2012). Evaluation of the Efficacy of Different Rates of Herbicides on
Weed Growth and Grain Yield of Two Rice Varieties in Two Rice
Ecologies in Sierra Leone. American Journal of Experimental
Agriculture. 2(4):607-615.

133
Hall, M.R, Swaton, & C.J Anderson (1992). The Critical weed control in
grain corn. Weed Science 40, 441- 442.
Mennan, H & Zandstra B. H. (2005). Effect of wheat (Triticum aestivum)
cultivars and seeding rate on yield loss from Galium aparine (cleavers).
Crop Protection. 24: 1061-1067.
Harper, J. L. (1977). Population Biology of Plants. Academic Press, New
York.
Ibrahim, K. Amans, A. & Abubakar, I. U. (2000). Growth indices and yield of
Tomato (Lycopesicon esculentum karest) varieties as influenced by
crop spacing at samaru. Proceedings of the 18th HORTSON
Conference Proceedings (1): 40-47.
Imolehin, E. D. (1991) Rice Improvement and Production in Nigeria. Paper
presented at WARDA upland Breeding Task-Force Workshop, Baliake
Cote d’ivoire 1991; 4 Oct.
Imanywoha, J.B. (2001). Rice. In: Agriculture in Uganda, Vol. 2 Crops.
Mukiibi, J. K. (Ed.), Fountain publishers/CTA/NARO. 70 pp.
Islam, M. Z. (2003). Effect of weeding regime on the growth and yield of
BRRI dhan31 under varying spacing. M.S. Thesis, Dep. Agron.,
Bangladesh Agricultural University, Mymensingh, pp 70-72
Jannink, J. L., Orf, J. H., Jordan, N. R., & Shaw, R. G. (2000). Index selection
for weed suppressive ability in soybean. Crop Sci. 40(4), 1087–1094.

134
Jennings, P. R., & Aquino, R. C. (1968). Studies on competition in rice. III.
The mechanism of competition among phenotypes. Evolution 22(3),
529–542.
Johnson, D. E. (1995). Weed management strategies for smallholder rice
production. In ‘‘Brighton Crop protection Conference: Weeds.
Proceedings of an International Conference’’, pp. 1171–1180, British
Crop Protection Council, Farnham, UK.
Jennings, P.R. & Aquino, R.C. (1968). Studies on competition in rice. II. The
mechanism of competition among phenotypes. Evolution, 22, 529-542.
Johnson, D.E. (1996). Weed management in smallholder rice production in the
tropics; In: Radcliffés IPM
Johnson, D. E. (1997). Weeds of rice in West Africa. WARDA. Bouaké, Côte
d’Ivoire, p. 312.
Johnson, D. E. (1997). Weeds of Rice in West Africa. WARDA, Bouake´.
Johnson, D. E., & Kent, R. J. (2002). The impact of cropping on weed species
composition in rice after fallow across a hydrological gradient in West
Africa. Weed Res. 42(2), 89–99.
Johnson, D. E., Riches, C. R., Diallo, R., & Jones, M. J. (1997). Striga on rice
in West Africa; Crop host range and the potential of host resistance.
Crop Prot. 16(2), 153–157.
135
Johnson, D. E., Dingkuhn, M., Jones, M. P., & Mahamane, M. C. (1998a). The
influence of rice plant type on the effect of weed competition on Oryza
sativa and Oryza glaberrima. Weed Res. 38(3), 207–216.
Johnson, D. E., Riches, C., Camara, M., & Mbwaga, A. M. (1998b).
Rhamphicarpa fistulosa on rice in Africa. Parasite. Plants News,
Haustorium, 33.
Jone, M.P., Mande, S. & Aluko, K. (1997b). Diversity and potential of Oryza
glaberrima Steud. In upland rice breeding, Breeding Science, 47, 395-
Jones, M. P., Dingkuhn, M., Aluko, G. K., and Semon, M. (1997). Interspecific
Oryza sativa L.O. glaberrima Steud. Progenies in upland rice
improvement. Euphytica 94(2), 237–246
JICA. (2010). NERICA Rice promotion Project. Rice cultivation Hand book, 46
p. 398.
Juraimi, A.S, Begum, M, Sherif, A.M., & Rajan A (2009). Effects of sowing
date and nut sedge removal time on plant growth and yield of tef
[Eragrostis tef (Zucc.)Trotter]. (2009). Afr. J. Biotechnol. 8(22):6162-
6167.
Juraimi, A. S, Saifu, A H M, Uddin M K, Anuar A R & Azmi M (2011).
Diversity of weed communities under different water regimes in bertam
irrigated direct seeded rice field. Australian Journal of Crop Science
5(5): 595-604

136
Kehinde JK (2002). Influence of seed rate and weed management control and
performance of upland rice. Nigerian J. Weed Sci., 15: 1–6.
Kherallah, M., Delgado, C., Gabre-Madhin, E., Minot, N., & Johnson, M.
(2000) “The Road Half Traveled: Agricultural Market Reform in Sub-
Saharan Africa,” Food Policy Report, International. Food Policy
Research Institute.
Kijima, Y. (2008). New Technology and Emergence of Markets: Evidence
from NERICA Rice in Uganda. Graduate School of International
Development (GSID) Discussion Paper No. 165. March 2008. Nagoya
University, Japan. 28 p. http://ir.nul.nagoya-
u.ac.jp/dspace/bitstream/2237/10936/1/165.pdf
Kijima, Y., Sserunkuuma, D., & Otsuka, K. (2006) “How Revolutionary is the
“NERICA Revolution”? Evidence from Uganda, Developing
Economies 44(2): 252-67. http://www.acp-st.eu/content/african-weeds-
rice. http://www.eoearth.org/article/Climate_of_Uganda
Kijima, Y, & Sserunkuuma, D. (2008) “The Adoption of NERICA Rice
Varieties at the Initial Stage of the Diffusion Process in Uganda,” East
African Journal of Rural Development (forthcoming).
Kim, S. C., & Moody, K. (1989). Germination of two rice cultivars and several
weed species. Korean J. Weed Sci. 9(116), 122.

137
Koffi, G. (1980). Collection and conservation of existing rice species and
varieties of Africa. Agron. Trop. 34, 228–237
Koarai, A. & Morita H, (2003). Evaluation of the suppression ability of rice
(Oryza sativa) on Monochoria vaginalis by measuring photosynthetic
photon flux density below rice canopy.
Kolo M. G. M & I. Umaru 2011, Weed competiveness and yield of intra and
inter specific upland rice variety (Orzya sativa) under different weed
control practices in Badeggi – Niger state
Kropff, M. J., Bastiaans, L., & Lotz, L. A. P. (1997). Systems approaches in
weed management and the design of weed suppressing crop varieties.
In ‘‘Expert Consultation on Weed Ecology and Management’’ (R.
Labrada, Ed.), pp. 73–85. FAO, Rome.
Knezevic S. Z. (2002). Use of herbicide tolerant crops as a component of an
integrated weed management program. NebGuide, UNL-Extension
Publication. G02-148-A
Kristensen, L., Olsen, J., & Weiner, J. (2008). Crop density, sowing pattern,
and nitrogen fertilization effects on weed suppression and yield in
spring wheat. Weed Sci. 56, 97–102.
Labrada R. & Fornasari L. (2003). Management of problematic aquatic weeds
in Africa, FAO efforts and achievements during the period of 1991-
2001. FAO, Rome, 28 p.
138
Lemerle, D Verbeck B Cousens R D & Coombes N E (1996). The potential for
selecting wheat varieties strongly competitive against weeds. Weed
Res., 36: 505‒513
Lodin, J. B. (2005). An Assessment of Suparica 2 Upland Rice Cultivation and
its Impacts on Food Security and Incomes in Hoima District, Uganda.
72 p.
Lockhart JAR, & Wiseman AJL (1988). Introduction to crop husbandry.
Wheaton & Co. Ltd. Pergamum Press, Oxford, UK, pp. 70-180.
.
Mahajan G, Gill MS, & Singh K (2010). Optimizing seed rate to suppress
weeds and to increase yield in aerobic direct-seeded rice in
northwestern indo-gangetic plains. J. New Seeds.11: 225-238
Mahajan G & Chauhan BS. (2011b). Effects of planting pattern and cultivar on
weed and crop growth in aerobic rice system. Weed Technology 25:
521–525
Majambu, I. S., Ogunlella, V. B. & Ahmed, M. K. (1996). Responses of Two
Okro (Abelmoschus esculentus (L) Moench) varieties to fertilizer
growth and nutrient concentration as influenced by nitrogen and
phosphorus applications. Fertilizer Research, 8(3):297-306.
Mason, H E & Spaner D (2006). Competitive ability of wheat in conventional
and organic management systems. Can. J. Plant Sci., 86: 333‒343
139
Mcdonald, G.K. 2003. Competitiveness against grass weeds in field pea
genotypes. Weed Res. 43, 48–58
Mitra, A.J.M.S. Karim, M.M. Haque, G.J.U. Ahmed & M.N. Bari, 2005. Effect
of Weed Management Practices on Transplanted Amman Rice. Journal
of Agronomy, 4: 238-241
Mobasser, H.R., M.M. Delarestaghi, A. Khorgami, B.D. Tari & H. Pourkalhor.
2007. Effect of planting density on agronomical characteristics of rice
(Oryza sativa L.) varieties in North of Iran. Pakistan J. Biological Sci.
10(18): 3205-3209
Moddy, K. (1998). Priorities for weed science research. In: R.E. Evenson,
R.W. Herdt and M. Hussain (eds.) Rice Research in Asia progress and
priorities. CAB International and International Rice Research Institute,
Los Banos, Philippines. pp. 277-290
Mohler CL (1996). Ecological bases for the cultural control of annual weeds. J.
Prod. Agric. 9: 468-474.
Moody K, & De Detta SK (1998) Integrated control of weeds in rice. Paper
presented at the 7th Session of FAO Panel of Expert on Integrated Pest
Control and Resistance Breeding, 21-28 April, 1977, Rome, Italy.
Moukoumbi YD, Sie M, Vodouhe R, N’dri B, Toulou B, Ogunbayo SA, &
Ahanchede A. (2011). Assessing phenotypic diversity of interspecific

140
rice varieties using agro-morphological characterization. J. Plant
Breed. Crop Sci., 3: 74-86.
Moynul MDH, Hossain MDM, Rezaul MD, Khalequzzaman HR, & karim
SMR (2003). Effect of varieties of rice and weeding on weed growth
and yield of transplant among rice. Asian J. Plant Sci., 2: 993 – 998.
Omran AO Deheran K R & Abdel I H (1980). Flowering and fruiting Patterns
in prostate and semi prostate types of peanut. Agricultural Research.
Review. 58 (8): 107-116.
Oerke, E.-C., & Dehne, H.-W. (2004). Safeguarding production-losses in major
crops and the role of crop protection. Crop Prot. 23, 275–285.
Ottis BV, Talbert RE (2005). Rice yield components as affected by cultivar
and seeding rate. Agron. J. 97: 1622-1625.
Payman G, & Singh S (2008). Effect of seed rate, spacing and herbicide use on
weed management in direct seeded upland rice (Oryza sativa L.).
Indian J. Weed Sci. 40(1 &2): 11-15.
Pender (2004) http://www.fao.org/docrep/015/i2744e/i2744e02.pdfPerez de
Vida, F. B., Laca, E. A., Mackill, D. J., Ferna´ndez, G. M., and Fischer,
A. J. (2006).Relating rice traits to weed competitiveness and yield: A
path analysis. Weed Sci. 54(6), 1122–1131
141
Pernito, R. G., Edillo, N. A., Baquiran, V. A., & Garrity, D. P. (1986).
Differential weed suppression ability in rain fed lowland rice. Philipp.
J. Crop Sci. 11(Suppl. 1), Abst. 3D–3a.
Pester TA, Burnside OC, & Orf JH (1999). Increasing crop competitiveness to
weeds through breeding. In D.D Buhler (ed.) Expanding the context of
weed management. Food production Press, Binghamton, NY : 59-76
Phuhong LT, Denich M, Vlek PLG, & Balasubramanian V (2005).
Suppressing weeds in direct seeded lowland rice: effects of methods
and rates of seeding. J. Agron. Crop Sci. 191: 185-194
Perez de Vida, F. B., Laca, E. A., Mackill, D. J., Ferna´ndez, G. M., & Fischer,
A. J. (2006).Relating rice traits to weed competitiveness and yield: A
path analysis. Weed Sci. 54(6), 1122–1131
Power J F & Alessi J (1978) Tiller development and yield of standard and
semidwarf spring wheat varieties as affected by nitrogen fertiliser.
Journal of Agricultural Science, Cambridge 90, 97–108. doi: 10.1017/
S0021859600048632
Radosevich, S. R. (1987). Methods to study interactions among crops and
weeds. Weed Technol. 1, 190–198.
Ransom, J. K. (1996). Integrated management of Striga spp. in the agriculture
of sub-Saharan Africa. Proc. of the Second Int. Weed Control
Congress, Copenhagen, and 25-28 June 1996: Vol. 1-4, pp: 623-628.
142
Rao, A. N., & Moody, K. (1987). Rice grain yield loss caused by transplanted
Echinochloa glabrescens and possible control measures. In.
‘‘Proceedings of 11th Asian Pacific Weed Sciences Society
Conference,’’ pp. 203–210. Taipei, Republic of China.
Rao, A.N., & Moody, K. (1990). Weed seed contamination in rice seed.
SeedSci.Technol.18, 139–146.
Rao, A. N., & Moody, K. (1992). Competition between Echinochloa
glabrescens and rice (Oryza sativa). Trop. Pest Manage.38, 25–29.
Rao, A. N., & Moody, K. (1994). ‘‘Ecology and Management of Weeds in
Farmers’ Direct Seeded Rice (Oryza sativa L.) Fields.’’ International
Rice Research Institute, Los Banos, Philippines.
Rao, A.N., Johnson, D.E, Sivaprasad, B.,Ladha,J.K. & Mortimer, A.M. (2007).
Weed management in direct seeded rice. Advances in Agronomy 93,
153–255.
Rao, A.N. & Moody, K. (1990). Weed seed contamination in rice seed. Seed
Science and Technology18, 139–146.
Rezvani M, Ahangari M & Zaeferian F (2012). Effects of cultivars and
weeding regimes on yield soybean yields. Internal. Journal. Biol. Food,
Vet and Agric Eng. 6(9) 125-127.
Rodenburg, J., Diagne, A., Oikeh, S., Futakuchi, K., Kormawa, P. M., Semon,
M., Akintayo, I., Cisse´, B., Sie´, M., Narteh, L., Nwilene, F., Diatta,
143
S., et al. (2006b). Achievements and impact of NERICA on sustainable
rice production in sub-Saharan Africa. Int. Rice Comm. Newsl. 55, 45–
58.
Rodenburg, J., Saito, K., Glele, R., Toure´, A., Mariko, M., & Kiepe, P. (2009).
Weeding competitiveness of the lowland rice varieties of NERICA in
the southern Guinea Savanna. Field Crops Res. under review.
Roder W (2001). Slash-and-burn rice systems in the hills of northern Lao PDR.
In: Description, canopy temperature and productivity of wheat
(Triticum aestivum). Indian J. Agron. 41:390–396
Seaton, ML Coffelt, TA & SW Scoyoc (1992). Comparison of vegetative and
reproductive traits of 14 peanut cultivars. Oleagineux . 47(7): 471-478.
Savithri, P., R. Perumal, & R. Nagarajan (1999). Soil and Crop Management
Technologies for Enhancing Rice Production under Micronutrient
Constraints. Nutrient Cycling in Agro ecosystems (53): Pp 83-93.
Sharma, V. & N. N. Angiras. (1996a). Effect of row orientations, row spacing
and weed-control methods on light interception
Siddiqui, M. R. H., R. Lakple & R. S. Tripathi. (1999). Effect of spacing and
fertilizer on medium duration rice (Oryza sativa) varieties. Indian
Journal of Agronomy 44 (2): 310-312.
Smith, R. J. & Shaw, W. C. (1968). Weeds and their control in rice production. Agric.
Res. Service, USDA. Agric. Handbook No. 292. pp.12-19.
144
Sun J D, Xiao Y C, Huang X F, Jiao W C, Chen J C, & Zhou Y Y (2005).
Primary 487 study on occurrence and control of weedy rice in japonica
rice fields. Weed Science China 2, 21-23. (In Chinese).
Teasdale, I. R. (1995). Influence of narrow now/high population corn (Zea
mays) on weed control and light transmittance. Weed Technology, 9:
113-118.
Tollens (2006). Markets and Institutions for Promoting Rice as a Tool for
Food Security and Poverty Reduction in Sub-Sahara Africa." Working
Paper, n° 95, Centre for Agricultural and Food Economics, Katholieke
Universiteit Leuven, 2006. UBOS2008
http://www.ubos.org/onlinefiles/uploads/ubos/pdf%20documents/abstra
cts/2008%20Statistical %20Abstract.pdf
Uddin, M K Juraimi A S Ismail M R & Brosnan J T (2010). Characterizing
weed populations in different turfgrass sites throughout the klang valley
of western peninsular Malaysia. Weed Technol. 24:173–181.
Van Acker, R, C, Swanton C.J & Weise S.F, (1993). The Critical period of
weed control in soybean (Glycine max(L) merr). Weed scie 41, 194-200
Vera C.L., Woods S.M. & Raney J.P. 2006. Seeding rate and row spacing
effect on weed competition, yield and quality of hemp in the Parkland
region of Saskatchewan. Can. J. Plant Sci. 86: 911-915.

145
WARDA (West Africa Rice Development Association) (1984). Upland rice in
West Africa An overview of upland rice research. Proceedings of the
1982 Bouake, Ivory Coast upland rice workshop. IRRI Los Baunos
Philippines. pp. 21–43.
Watson, P.R., D.A. Derksen, & R.C. Van Acker. 2006. The ability of 29 barley
cultivars to compete and withstand competition. Weed Sci. 54:783–792.
Wells BR, Faw WF (1978). Short-statures rice response to seeding and N rates.
Agron. J. 70: 477-480.
Weiner, J., (1986). How competition for light and nutrients affects size
variability in ipomoea-tricolor populations. Ecology 67, 1425–1427.
Weiner, J., H... Griepentrog W, & Kristensen, L (2001). Suppression of weeds
by spring wheat Triticum aestivum World Bank 2003.
https://ieg.worldbankgroup.org/Data/reports/arde_2003.pdf
Widdicombe, W. D. & Thelen, K. D. (2002). Row width and plant density
effects on corn grain production in the northern Corn Belt. Agronomy
Journal, 94: 1020 – 1024.
Wicks G A,. Nordquist P T, Baenziger P S, Klein R N, Hammons R. &
Watkins H, J E (2004). Winter wheat cultivar characteristics affect
annual weed suppression. Weed Tech. 18: 988-998.
146
Yoshida S (1978). Wetland characterization and classification for sustainable
Agricultural development. International Rice Research Institute (IRRI).
Manila Phillipines.260- 267.
Yoshida S Rice (1983). Potential Productivity of field crops under difference
environments. In: IRRI. Los Banes, Philippines 103-127.
Zhao, D. L., Atlin, G. N., Bastiaans, L., & Spiertz, J. H. J. (2006a). Cultivar
weed competitiveness in aerobic rice: Heritability, correlated traits, and
the potential for indirect selection in weed-free environments. Crop Sci.
46(1), 372–380. Variable herbicide rates. Weed Sci. 49: 746-754.
Zimdahl, R L (2004). Weed Crop Competition: A Review. Blackwell
Publishing Ltd


![Characterization of the Geographical and Varietal Origin ... · particular, Armanino et al. [1] found differences for the species and for the origin of wheat samples by chemical analysis](https://img.pdfslide.us/doc/110x75/5f0cc7fa7e708231d4371980/characterization-of-the-geographical-and-varietal-origin-particular-armanino.jpg)