Embed Size (px)
Citation preview
T E C H N I C A L R E P O R T 0 3 2
2 0 0 6
Ministry of Forests and Range Forest Science Program
Effects of Variable Aspen Retention on StandDevelopment, Aspen Sucker Production, andGrowth of Lodgepole Pine in the SBSdw1 Variant of South-central British Columbia
Ministry of Forests and RangeForest Science Program
Effects of Variable Aspen Retention on Stand Development, Aspen Sucker Production, and Growth of Lodgepole Pine in the SBSdw1 Variant of South-central British Columbia
Teresa A. Newsome, Jean L. Heineman, andAmanda F. Linnell Nemec
The use of trade, firm, or corporation names in this publication is for the information andconvenience of the reader. Such use does not constitute an official endorsement orapproval by the Government of British Columbia of any product or service to the exclusionof any others that may also be suitable. Contents of this report are presented for discussionpurposes only. Funding assistance does not imply endorsement of any statements or informationcontained herein by the Government of British Columbia. Uniform Resource Locators (),addresses, and contact information contained in this document are current at the time ofprinting unless otherwise noted.
CitationNewsome, T.A., J.L. Heineman, and A.F. Linnell Nemec. Effects of variable aspen retention on stand development, aspen sucker production, and growth of lodgepolepine in the SBSdw1 variant of south-central British Columbia. B.C. Min. For. Range,Res. Br., Victoria, B.C. Tech. Rep. 032.<http://www.for.gov.bc.ca/hfd/pubs/Docs/Tr/Tr032.htm>
Prepared byTeresa A. NewsomeMinistry of Forests and Range, Southern Interior Region200 – 640 Borland Street, Williams Lake, BC
andJean L. HeinemanJ. Heineman Forestry Consulting2125 East 5th Avenue, Vancouver, BC
andAmanda F. Linnell NemecInternational Statistics and Research Corp.PO Box 496, Brentwood Bay, BC
for
B.C. Ministry of Forests and RangeForest Science Program722 Johnson Street, Victoria, BC
© 2006 Province of British Columbia
Copies of this report may be obtained, depending upon supply, from:Government PublicationsPO Box 9452 Stn Prov Govt, Victoria, BC
1-800-663-6105http://www.publications.gov.bc.ca
For more information on Forest Science Program publications, visit our web site at: http://www.for.gov.bc.ca/scripts/hfd/pubs/hfdcatalog/index.asp
Library and Archives Canada Cataloguing in Publication DataNewsome, T. A. (Teresa A.), 1957-
Effects of variable aspen retention on stand development, aspen sucker productionand growth of lodgepole pine in the SBSdw1 variant of south-central British Columbia
(Technical report ; 032)
Includes bibliographical references: p. ---
1. Lodgepole pine - British Columbia - Growth. 2. Populus tremuloides - Thinning -British Columbia. 3. Populus tremuloides - British Columbia - Growth. I. Heineman,Jean. II. Nemec, Amanda F. Linnell (Amanda Frances Linnell) III. British Columbia.Forest Science Program. IV. Title. V. Series: Technical report (British Columbia. For-est Science Program) ; 32.
. . --
ABSTRACT
In 1999, an experiment was established to examine the effects of reducingaspen density on stand-level lodgepole pine and aspen growth in the SBSdw1biogeoclimatic variant of the Cariboo–Chilcotin. Aspen retention treatmentsof 0, 500–800, 1000–1500, and 2000–2800 stems ha-1 were applied in an 11-year-old mixed-species stand of aspen and lodgepole pine. One year aftercutting, aspen basal area in these retention treatments was 0, 1.25, 3.05, and2.89 m2 ha-1, respectively, compared with 5.36 m2 ha-1 in the control. Fouryears after treatment, based on stand-level measurements taken in perma-nent measurement plots, pine vigour tended to be better in treatments where<1000 aspen stems ha-1 had been retained but there were no significant dif-ferences in mean stand-level lodgepole pine height, stem diameter, quadraticmean diameter, or basal area as a result of the aspen retention treatments.
Aspen suckering was assessed 2 and 4 years after cutting. Sucker densitiesdiffered significantly between aspen retention treatments after 2 years, rang-ing from 28 187 stems ha-1 in the complete aspen removal treatment to 344stems ha-1 in the 2000–2800 stems ha-1 treatment. Sucker densities appear tohave declined naturally by approximately 35% between years 2 and 4 aftercutting; however, this apparent decline may be partly due to a change in thesampling method. There were no significant differences between treatmentsin sucker height in either year 2 or 4 after cutting.
In addition to stand-level measurements, the ongoing performance of target lodgepole pine that had, or had not, met existing British ColumbiaMinistry of Forests free-growing requirements at a stand age of 12 years wasassessed. By 2003, pine in the free-growing group were larger than those inthe not free-growing group according to all measurement criteria. Regressionanalysis showed that tall aspen (i.e., aspen at least as tall as the target pine)within a 1.78-m radius were more important competitors with the target pinethan aspen that were further away. When the stand was 13 years old, tallbroadleaf basal area explained 25.7% of the variation in 2000–2003 lodgepolepine stem diameter increment.
iii
ACKNOWLEDGEMENTS
We thank Jian Wang and Tony Letchford of the B.C. Ministry of Forests andAlbert Vandenberg of Weldwood of Canada Ltd. for establishing this study,completing the original assessments, and providing input and advice whenthe study was adopted by the Silvicultural Systems Research Group of theSouthern Interior Forest Region. Treatments were installed by Weldwood of Canada Ltd. Field assessments since 2003 were completed by contractorsScott and Janet Zimonick. Valuable advice regarding adaptation of perma-nent measurement plots for the collection of growth and yield data wasprovided by Abdel-Azim Zumrawi. Ongoing support from Ken Soneff isgreatly appreciated. Valuable review comments regarding this report wereprovided by Wendy Bergerud, Jacob Boateng, George Harper, ChrisHawkins, Jennifer Lange, and Rod Negrave. Funding for this project wasprovided by the B.C. Ministry of Forests, Forest Renewal British Columbia,and the Forest Science Program under the Forest Investment Account.
iv
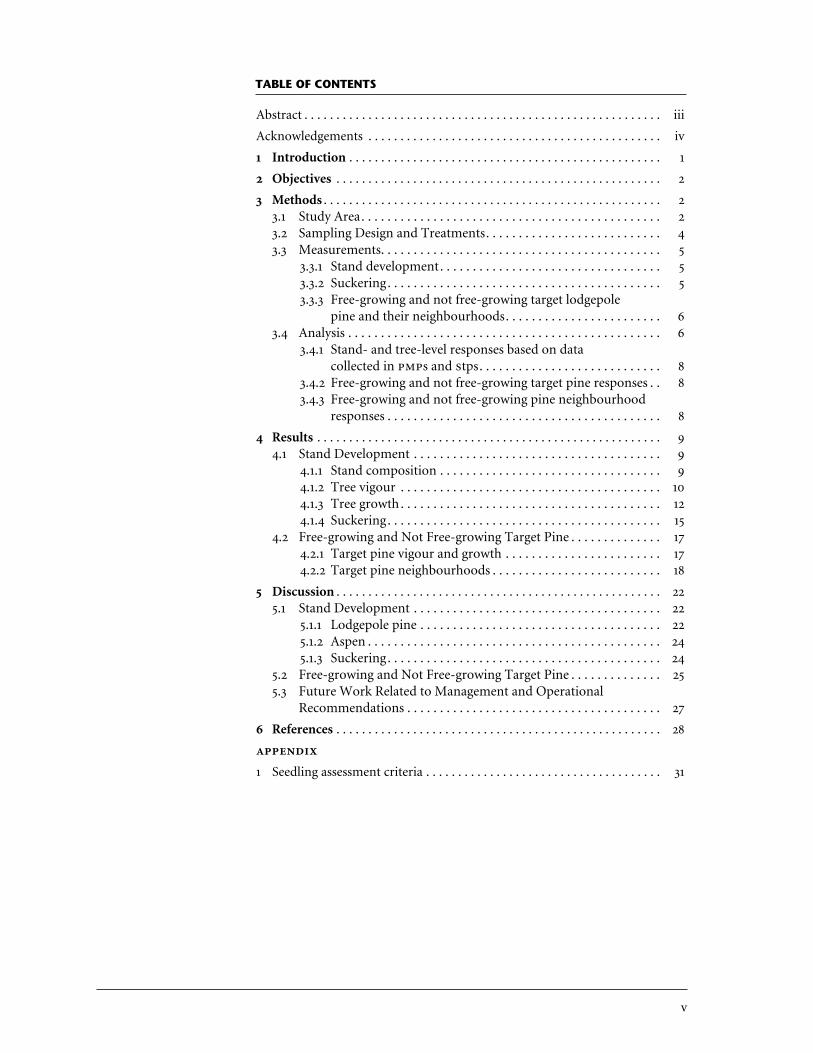
TABLE OF CONTENTS
v
Abstract . . . . . . . . . . . . . . . . . . . . . . . . . . . . . . . . . . . . . . . . . . . . . . . . . . . . . . . . iii
Acknowledgements . . . . . . . . . . . . . . . . . . . . . . . . . . . . . . . . . . . . . . . . . . . . . . iv
1 Introduction . . . . . . . . . . . . . . . . . . . . . . . . . . . . . . . . . . . . . . . . . . . . . . . . . 1
2 Objectives . . . . . . . . . . . . . . . . . . . . . . . . . . . . . . . . . . . . . . . . . . . . . . . . . . . 2
3 Methods . . . . . . . . . . . . . . . . . . . . . . . . . . . . . . . . . . . . . . . . . . . . . . . . . . . . . 23.1 Study Area. . . . . . . . . . . . . . . . . . . . . . . . . . . . . . . . . . . . . . . . . . . . . . 23.2 Sampling Design and Treatments. . . . . . . . . . . . . . . . . . . . . . . . . . . 43.3 Measurements. . . . . . . . . . . . . . . . . . . . . . . . . . . . . . . . . . . . . . . . . . . 5
3.3.1 Stand development. . . . . . . . . . . . . . . . . . . . . . . . . . . . . . . . . . 53.3.2 Suckering. . . . . . . . . . . . . . . . . . . . . . . . . . . . . . . . . . . . . . . . . . 53.3.3 Free-growing and not free-growing target lodgepole
pine and their neighbourhoods. . . . . . . . . . . . . . . . . . . . . . . . 63.4 Analysis . . . . . . . . . . . . . . . . . . . . . . . . . . . . . . . . . . . . . . . . . . . . . . . . 6
3.4.1 Stand- and tree-level responses based on data collected in s and tps. . . . . . . . . . . . . . . . . . . . . . . . . . . . 8
3.4.2 Free-growing and not free-growing target pine responses . . 83.4.3 Free-growing and not free-growing pine neighbourhood
responses . . . . . . . . . . . . . . . . . . . . . . . . . . . . . . . . . . . . . . . . . . 8
4 Results . . . . . . . . . . . . . . . . . . . . . . . . . . . . . . . . . . . . . . . . . . . . . . . . . . . . . . 94.1 Stand Development . . . . . . . . . . . . . . . . . . . . . . . . . . . . . . . . . . . . . . 9
4.1.1 Stand composition . . . . . . . . . . . . . . . . . . . . . . . . . . . . . . . . . . 94.1.2 Tree vigour . . . . . . . . . . . . . . . . . . . . . . . . . . . . . . . . . . . . . . . . 104.1.3 Tree growth. . . . . . . . . . . . . . . . . . . . . . . . . . . . . . . . . . . . . . . . 124.1.4 Suckering. . . . . . . . . . . . . . . . . . . . . . . . . . . . . . . . . . . . . . . . . . 15
4.2 Free-growing and Not Free-growing Target Pine . . . . . . . . . . . . . . 174.2.1 Target pine vigour and growth . . . . . . . . . . . . . . . . . . . . . . . . 174.2.2 Target pine neighbourhoods . . . . . . . . . . . . . . . . . . . . . . . . . . 18
5 Discussion . . . . . . . . . . . . . . . . . . . . . . . . . . . . . . . . . . . . . . . . . . . . . . . . . . . 225.1 Stand Development . . . . . . . . . . . . . . . . . . . . . . . . . . . . . . . . . . . . . . 22
5.1.1 Lodgepole pine . . . . . . . . . . . . . . . . . . . . . . . . . . . . . . . . . . . . . 225.1.2 Aspen . . . . . . . . . . . . . . . . . . . . . . . . . . . . . . . . . . . . . . . . . . . . . 245.1.3 Suckering. . . . . . . . . . . . . . . . . . . . . . . . . . . . . . . . . . . . . . . . . . 24
5.2 Free-growing and Not Free-growing Target Pine . . . . . . . . . . . . . . 255.3 Future Work Related to Management and Operational
Recommendations . . . . . . . . . . . . . . . . . . . . . . . . . . . . . . . . . . . . . . . 27
6 References . . . . . . . . . . . . . . . . . . . . . . . . . . . . . . . . . . . . . . . . . . . . . . . . . . . 28
1 Seedling assessment criteria . . . . . . . . . . . . . . . . . . . . . . . . . . . . . . . . . . . . . 31
vi
1 Sources of variation for examining the effects of aspen retention treatments on lodgepole pine and aspen height and diameter growth in s . . . . . . . . . . . . . . . . . . . . . . . . . . . . . . . . . . . . . . . . . . . . . . 7
2 Sources of variation for analyzing the effects of aspen retention treatments on lodgepole pine and aspen quadratic mean diameter and basal area per hectare . . . . . . . . . . . . . . . . . . . . . . . . . . . . . . 7
3 Sources of variation for examining the effects of aspen retention treatments on aspen sucker density. . . . . . . . . . . . . . . . . . . . . . 7
4 2003 stand composition in aspen retention treatments at the McKinley Lake site . . . . . . . . . . . . . . . . . . . . . . . . . . . . . . . . . . . . . . 10
5 Mean 2003 vigour of trees taller than 1.3 m in aspen removal treatments . . . . . . . . . . . . . . . . . . . . . . . . . . . . . . . . . . . . . . . . . . . 11
6 Means and 95% confidence limits for basal area of lodgepole pine and aspen in 2000 and 2003 . . . . . . . . . . . . . . . . . . . . . . . . . . . . . . . . 13
7 2003 mean height, stem diameter, height:diameter ratio, and quadratic mean diameter of lodgepole pine and aspen in aspen retention treatments . . . . . . . . . . . . . . . . . . . . . . . . . . . . . . . . . . . . . . . . . . 15
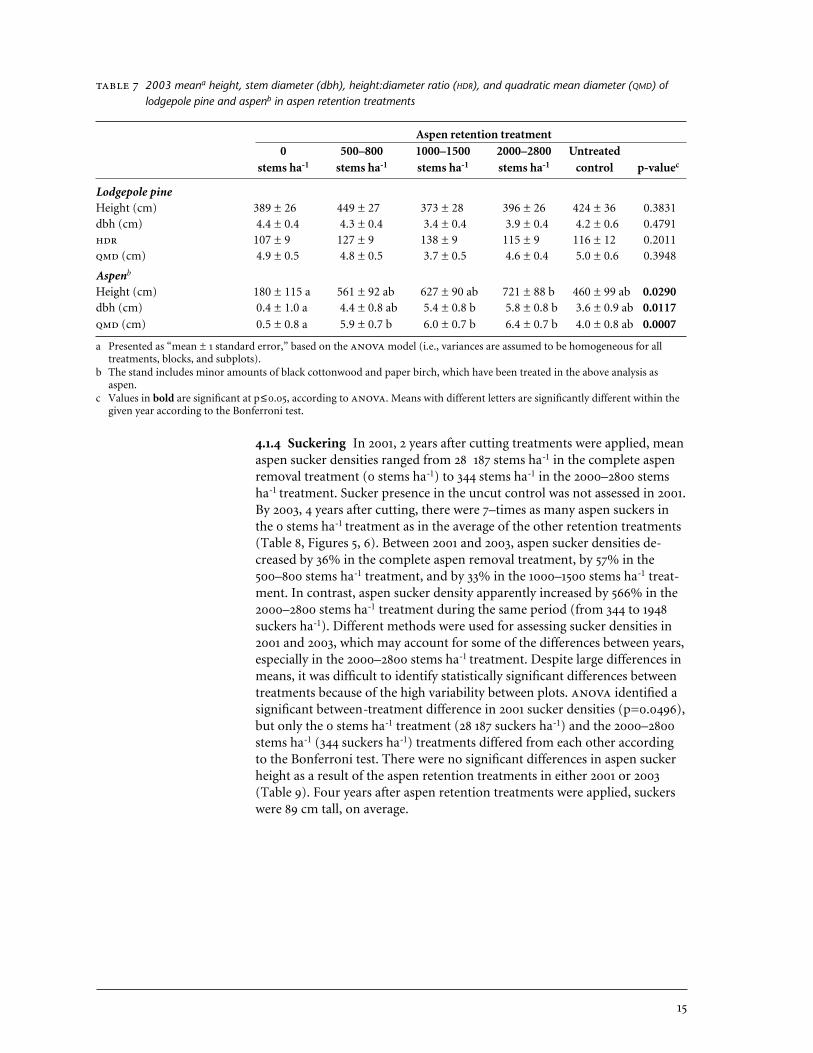
8 Means and 95% confidence limits for sucker density responses to aspen retention treatments in 2001 and 2003 . . . . . . . . . . . . . . . . . . . . 16
9 2003 mean sucker height responses to aspen retention treatments . . . . 17
10 2003 vigour of free-growing and not free-growing target lodgepole pine . . . . . . . . . . . . . . . . . . . . . . . . . . . . . . . . . . . . . . . . . . . . . . . 18
11 Mean size of free-growing and not free-growing target lodgepole pine from 2000 to 2003 . . . . . . . . . . . . . . . . . . . . . . . . . . . . . . . 18
12 Spearman’s rank correlation coefficients for pairings of lodgepole pine height and diameter growth with aspen basal area and broadleaf density . . . . . . . . . . . . . . . . . . . . . . . . . . . . . . . . . . . . . 20
13 Regression equation parameters and coefficients of determination values for predicting lodgepole pine growth . . . . . . . . . . . . . . . . . . . . . . . 21
vii
1 Location of the McKinley Lake study site. . . . . . . . . . . . . . . . . . . . . . . . . 3
2 2003 stand composition in aspen retention treatments at the McKinley Lake site. . . . . . . . . . . . . . . . . . . . . . . . . . . . . . . . . . . . . . 10
3 Comparison of lodgepole pine and aspen vigour in aspen retention treatments in 2003 . . . . . . . . . . . . . . . . . . . . . . . . . . . . . . . . . . . 12
4 Comparison of 2000 and 2003 stand-level lodgepole pine and aspen basal area in aspen retention treatments. . . . . . . . . . . . . . . . . 14
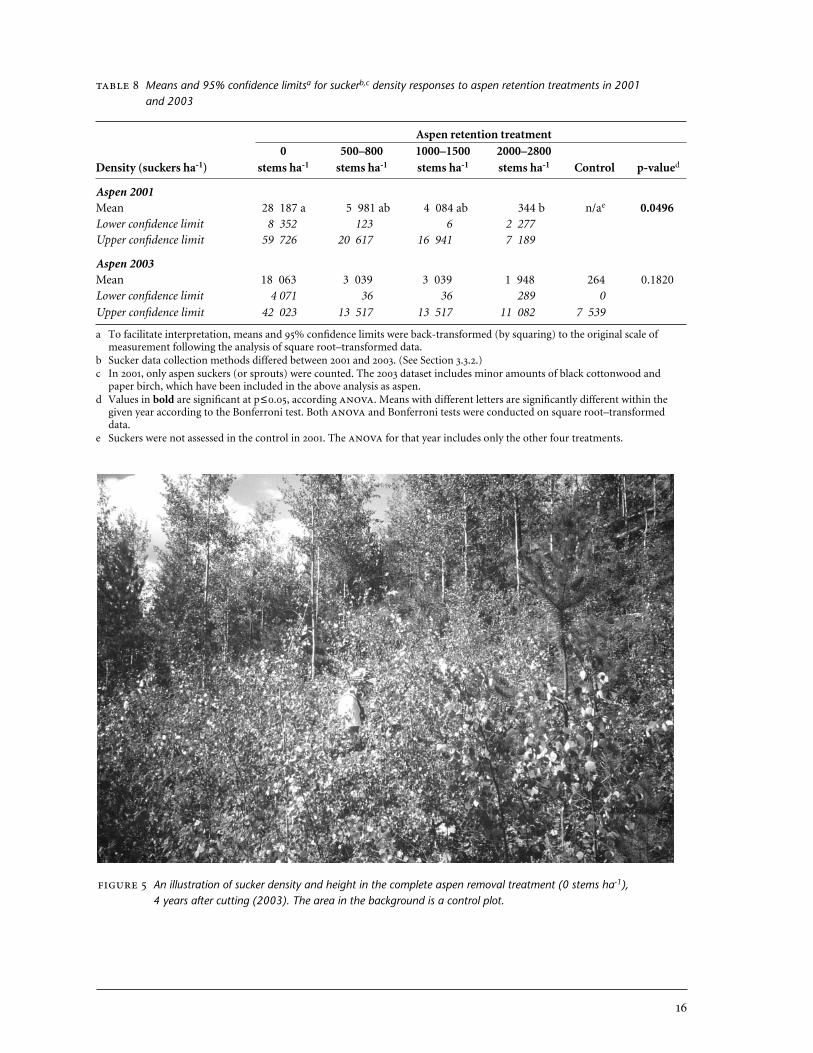
5 An illustration of sucker density and height in the complete aspen removal treatment, 4 years after cutting . . . . . . . . . . . . . . . . . . . . 16
6 2001 and 2003 aspen sucker densities in aspen retention treatments . . 17
7 A comparison of 2003 basal area in free-growing and not free-growing lodgepole pine neighbourhoods . . . . . . . . . . . . . . . . . . . . 19
8 Scatter plots with fitted non-linear regression lines showing the relationship between 2000–2003 lodgepole pine stem diameter increment and 2003 tall broadleaf density or 2003 tall broadleaf basal area . . . . . . . . . . . . . . . . . . . . . . . . . . . . . . . . . . . 21
1 INTRODUCTION
Mixtures of trembling aspen (Populus tremuloides Michx.) and naturally regenerated or planted lodgepole pine (Pinus contorta var. latifolia Engelm.ex S. Wats.) occur throughout interior British Columbia. In the Cariboo–Chilcotin, they are especially common in the Sub-Boreal Spruce (SBS), Interior Douglas-fir (IDF), Sub-Boreal Pine–Spruce (SBPS), and InteriorCedar–Hemlock (ICH) biogeoclimatic zones (Meidinger and Pojar 1991). Juvenile pine–aspen stands may require management because fast-growingaspen often compete with shade-intolerant lodgepole pine for many years(Newsome et al. 2003). At low densities, however, aspen confers advantagesto both individual conifers and the site as a whole.
Aspen benefits overall site quality by retaining nutrients, especially calci-um, within the ecosystem (Pastor 1990). Aspen presence also slows thespread of Armillaria and Phellinus root rots on infected sites because it ismore resistant to these diseases than most conifers (Morrison et al. 1991; Peterson and Peterson 1995; Gerlach et al. 1997). The communal, sucker-derived root system of aspen (Strong and La Roi 1983) may also reduce windthrow among neighbouring conifers (Frivold 1985; Yang 1989). Matureaspen canopies provide protection from frost damage to understorey coniferseedlings by decreasing nighttime radiative heat loss (Stathers 1989; DeLong2000), although this is a more important consideration for white spruce thanfor lodgepole pine because of differences in frost tolerance (Farnden 1994).
Despite the beneficial role of aspen, at high densities it can reduce bothlight and soil water to levels that are limiting to conifer growth for at leastpart of the growing season (DeLong and Tanner 1996). Light availability isparticularly important in pine–aspen stands because both species are veryshade-intolerant (Klinka and Scagel 1984a, 1984b). In low-light environments,lodgepole pine will allocate more growth to terminal than lateral shoots, andreduce its branch production (Chen et al. 1996). Studies in young standshave shown that lodgepole pine growth is negatively affected by the presenceof abundant broadleaves (e.g., Simard et al. 2001). Mechanical “whipping”damage to conifer leaders is also common in aspen stands (Lees 1966).
To develop effective management stategies for mixed stands where soft-wood timber production is the primary objective, silviculturists needinformation about levels of broadleaves that can be retained without serious-ly reducing conifer performance. They also require practical guidance onusing this information to develop cost-effective treatment prescriptions. Toaddress this topic in the Cariboo–Chilcotin, a pine–aspen competition pro-ject that includes studies in a variety of ecosystems is currently under way.The retrospective portion of the study, which was conducted in naturally regenerated pine–aspen stands from 1992 to 1999, suggested that 1000 tallaspen stems ha-1 (i.e., 1000 aspen stems at least as tall as the target pine) is an appropriate threshold for ensuring acceptable pine growth in 17- to 18-year-old stands in the SBSdw subzone. Above that density, diameter growthtended to decrease (Newsome et al. 2003). Longer-term information is cur-rently being gathered because the study also indicated that the apparentthreshold decreases with stand age.
Managers also require guidance regarding the degree of aspen suckeringthat can be anticipated under various aspen retention regimes. This is impor-tant for the management of juvenile pine–aspen stands because of thepotential need for additional stand entries following abundant suckering.
Sucker production increases with the level of aspen that is removed (e.g.,Huffman et al. 1999), a phenomenon that is currently being assessed as partof the Cariboo–Chilcotin pine–aspen competition project (Newsome et al.2004a, 2006). The mechanisms governing aspen sucker production are not completely understood, but contributing factors appear to include: (a) changes to hormonal balances following cutting treatments (suckering isstimulated by the loss of apical dominance); (b) soil temperature, moisture,and nutrient conditions; (c) aspen basal area prior to harvesting (presumablybecause aspen root density increases with basal area); (d) genetic characteris-tics of individual aspen clones; (e) site disturbance; and (f) season of cutting(Frey et al. 2003).
In 1999, an operational trial to study the effects of variable aspen retentionon stand-level lodgepole pine performance and aspen sucker production wasestablished near McKinley Lake in the SBSdw1 variant of the Central CaribooForest District. The study, which was also intended to test the appropriate-ness of free-growing guidelines that were current at the time (B.C. Ministryof Forests 2002) was a co-operative undertaking by the B.C. Ministry ofForests and Weldwood of Canada, Ltd. In 2002, the study was adopted by theSilvicultural Systems Research Group of the Southern Interior Forest Regionas part of the pine–aspen competition project, and objectives and methodswere subsequently adapted to include the collection of long-term growth andyield and stand development data. This report summarizes fourth-year pineand aspen responses to aspen retention treatments, and provides baselinestand development information.
2 OBJECTIVES
The objectives of the study are:
1. To examine the effects of different aspen retention levels on the growth of residual lodgepole pine and aspen.
2. To examine the effects of different aspen retention levels on aspen suckering.
3. To test the effectiveness of the free-growing criterion which specifies thatthe target conifer must be free of overtopping vegetation in three of fourquadrants within a 1-m cylinder (B.C. Ministry of Forests 2002) by com-paring ongoing growth of lodgepole pine that did and did not meet thatspecific criterion immediately following treatment.
4. To study the effects of aspen density treatments on growth and yield andstand development.
3 METHODS
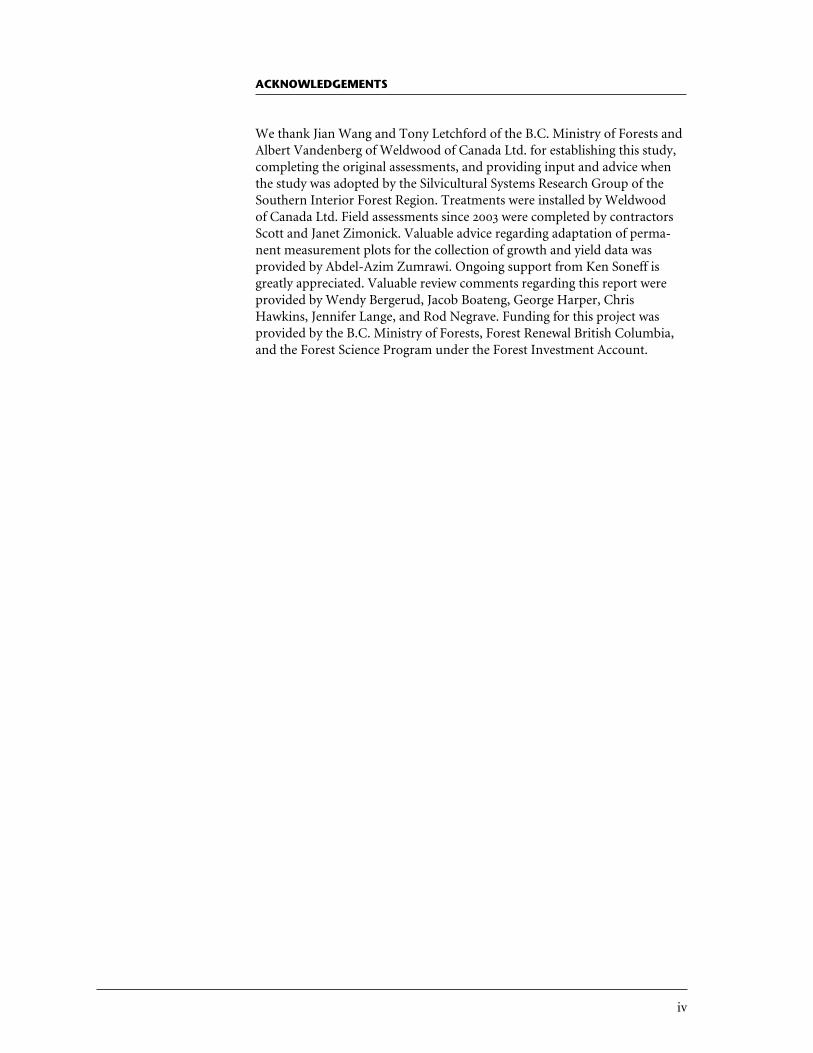
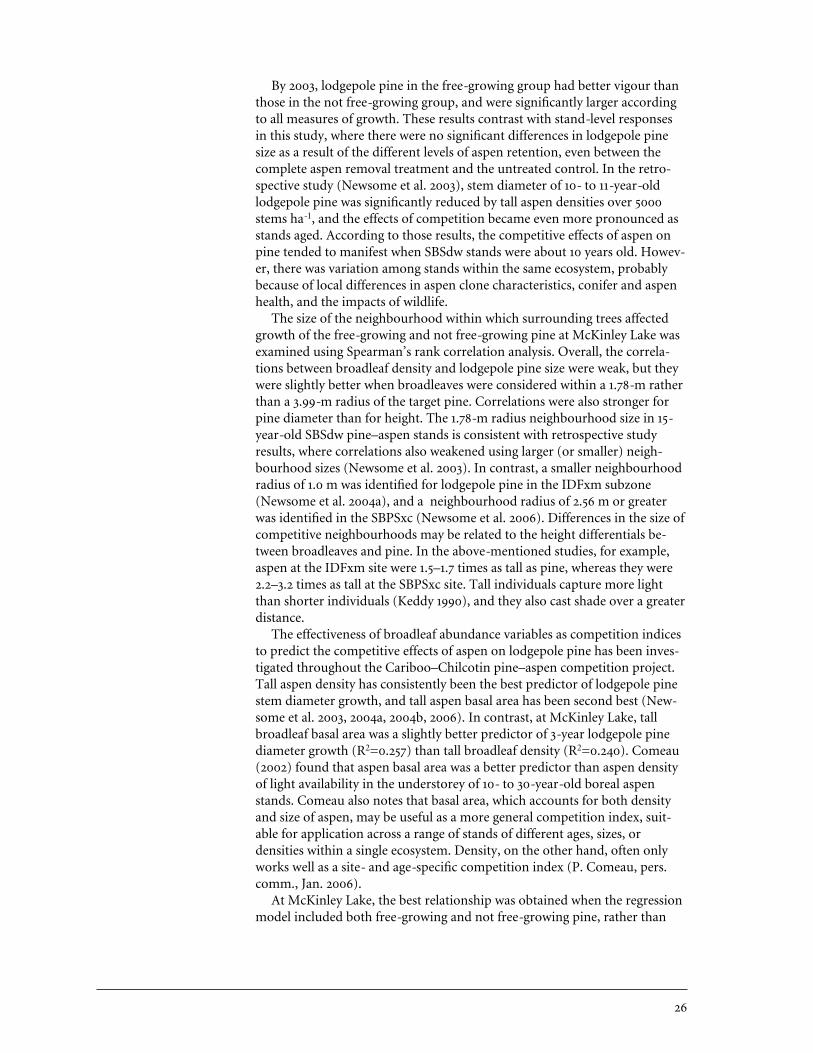
The McKinley Lake study site is located approximately 37 km southeast ofHorsefly, B.C. (52º 13' , 120º 56' ), at an elevation of 1000 m (Figure 1). The site, which has a southwesterly aspect and a slope of 10–40%, is in theSBSdw1 variant (Sub-Boreal Spruce dry warm subzone, Horsefly variant),site series 01/04. The SBSdw1 has mean annual precipitation of 585 mm, a
3.1 Study Area
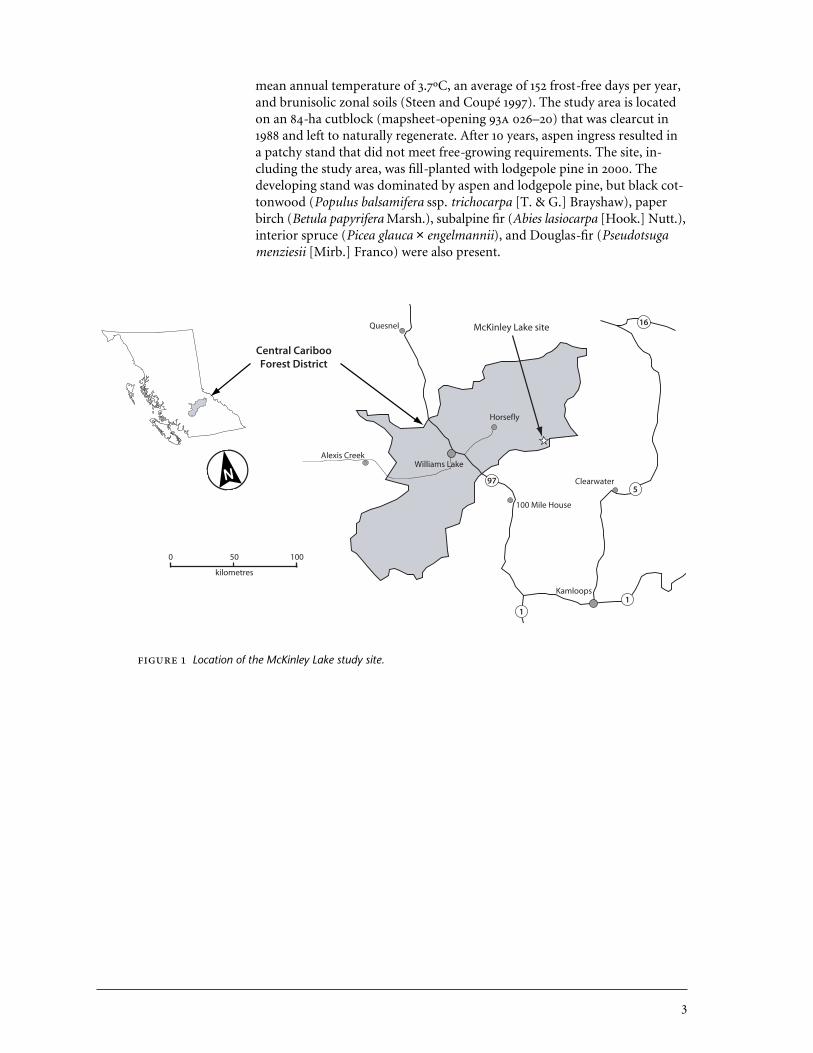
mean annual temperature of 3.7ºC, an average of 152 frost-free days per year,and brunisolic zonal soils (Steen and Coupé 1997). The study area is locatedon an 84-ha cutblock (mapsheet-opening 93 026–20) that was clearcut in1988 and left to naturally regenerate. After 10 years, aspen ingress resulted ina patchy stand that did not meet free-growing requirements. The site, in-cluding the study area, was fill-planted with lodgepole pine in 2000. Thedeveloping stand was dominated by aspen and lodgepole pine, but black cot-tonwood (Populus balsamifera ssp. trichocarpa [T. & G.] Brayshaw), paperbirch (Betula papyrifera Marsh.), subalpine fir (Abies lasiocarpa [Hook.] Nutt.),interior spruce (Picea glauca × engelmannii), and Douglas-fir (Pseudotsugamenziesii [Mirb.] Franco) were also present.
97
16
5
1
1
Quesnel
Clearwater
Horsefly
Alexis Creek
100 Mile House
Kamloops
Williams Lake
Central CaribooForest District
0 50 100
kilometres
McKinley Lake site
Location of the McKinley Lake study site.
The McKinley Lake study originally used a completely randomized design() with each of six density treatments replicated three times. Target den-sities for the treatments were 0, 600, 1200, 2500, and 5000 stems ha-1 plus the untreated control. These treatments were randomly assigned to eighteen50 × 50-m treatment plots prior to cutting. Chainsaws were used to apply the treatments in July 1999, at the same time that the rest of the cutblock was operationally brushed to reduce aspen density to 600–1000 stems ha-1.Crews were instructed regarding the appropriate spacing of aspen within in-dividual treatment plots, but were hindered in their ability to achieve targetdensities by the patchy distribution of aspen and the fact that leave aspenwere not marked. As a result, the densities achieved in most plots differedfrom the target densities, and the highest target density of 5000 stems ha-1
was not attained in any of the plots. After baseline data were further reviewed,the following aspen retention treatments were defined:
1. 0 stems ha-1 (three replicates)2. 500–800 stems ha-1 (four replicates)3. 1000–1500 stems ha-1 (four replicates)4. 2000–2800 stems ha-1 (four replicates)5. Untreated control (three replicates)
In 2000, one circular 5.64-m radius (0.01 ha) permanent measurementplot () was established in the aspen patch nearest to the centre of eachtreatment plot. Ten aspen and 10 pine stems were randomly selected in each and were tagged for periodic measurement. The original intention hadbeen to install 17.84-m radius s, but it became apparent during installa-tion of the first in plot 1 that aspen densities were too high for this sizeto be practical. Consequently, in 2000, data were collected in a larger-radius in plot 1 than in other plots. In 2003, the size of the in plot 1 was re-duced to 5.64 m. Also in 2003, s were adapted for the periodic collectionof growth and yield and stand development data by tagging all conifer andbroadleaf stems ≥ 1.3 m tall. An exception was made for two of the three plotsthat had received the complete aspen removal (0 stems ha-1) treatment be-cause, by 2003, they included high densities of sucker-origin aspen that hadgrown taller than 1.3 m. In those two plots (15 and 17), broadleaves ≥ 1.3 m tallwere tagged only within the four 1.78-m radius (0.001 ha) “small tree plots”(s—described below) that were established in 2003.
Different methods were used to assess aspen suckering in 2001 and 2003.In 2001, suckers were counted and measured within 10 randomly located 1 × 1-m quadrats within each treatment plot. In 2003, to facilitate repeatedmeasures at the same location, four permanent 1.78-m radius (0.001 ha) smalltree plots (s) were established in each to assess sucker densities andgrowth, and to quantify trees of all species that were shorter than 1.3 m. Thes were located 3 m from each centre in the four cardinal directions.
A set of 60 target lodgepole pine was selected following treatment in 2000to examine the ongoing performance of pine that, at age 12, had or had notmet the free-growing criterion for overtopping (i.e., the target pine was tallerthan surrounding vegetation in three of four quadrants within a 1-m cylin-der). Thirty pairs of target pine were selected: one that met the free-growingcriterion, and one that did not. These pine were tagged and permanently assigned to either the free-growing or the not free-growing class for the duration of the study, regardless of whether their actual free-growing status
3.2 Sampling Designand Treatments
changed. Pairs were selected so that the two stems were growing in closeproximity and were of similar height. Efforts were made to select two pinepairs in each aspen density treatment (except in the complete aspen removaltreatment), but this proved impossible because free-growing pine were rarein some treatment plots.
Assessments were done in either May or September. For the May assess-ments, total height was measured to the base of the previous year’s growthbecause current year leader elongation was incomplete. For the Septemberassessments, the current year leader was included in total height.
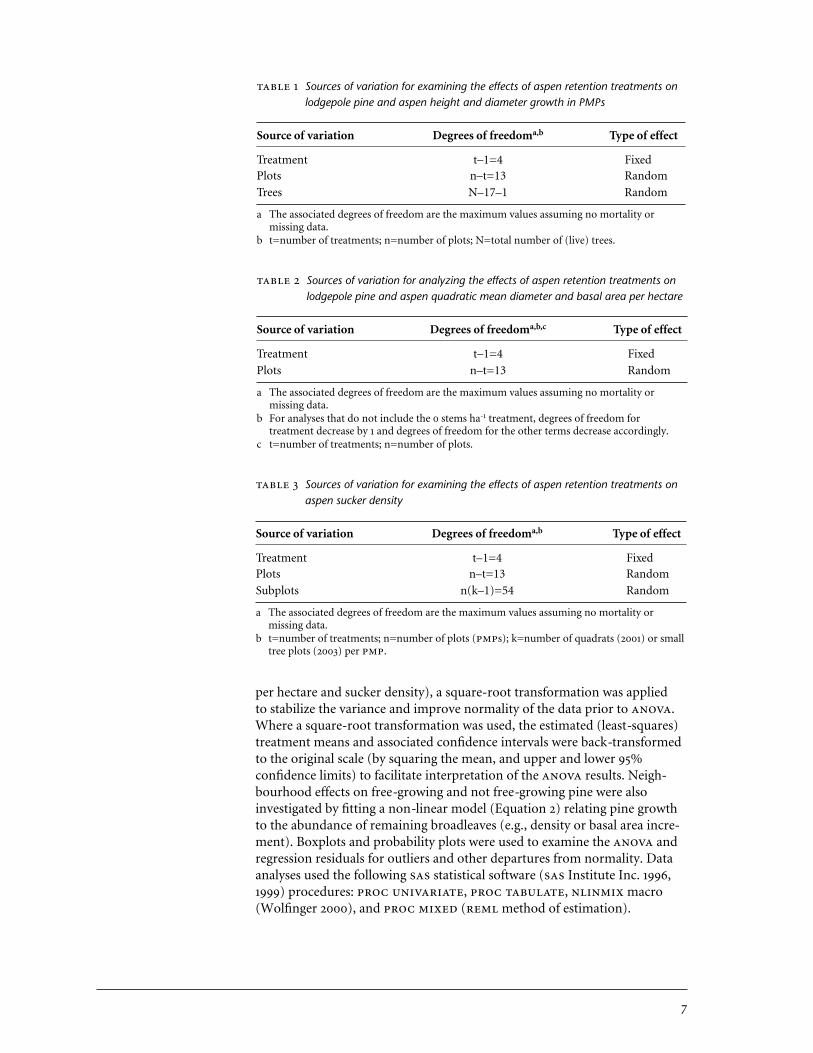
3.3.1 Stand development In May 2000, dbh of all trees within the 5.64-ms was measured, and height was measured for the 10 pine and 10 aspensample trees. In September 2003, all tagged trees (broadleaves and conifers)within each were assessed for:
• Species• dbh• Total height• Crown length• Crown width (average of – and –)• Vigour• Damage and damage cause• Height:diameter ratio () calculated from total height and dbh
Lodgepole pine survival, vigour, damage, and damage cause were assessedaccording to a standard research protocol (Appendix 1).
Quadratic mean diameter () was calculated from dbh for aspen andpine using Equation 1.
QMD = ([∑ dbhi2]/n)- 1⁄2 (1)
where is quadratic mean diameter, dbhi is diameter at 1.3 m of an indi-vidual aspen or pine tree, and n is the number of aspen or pine trees in the.
3.3.2 Suckering In July 2001, aspen suckers were counted within each of ten 1 × 1-m quadrats that were randomly located in each . Height and ground-level diameter were measured for the 10 tallest suckers in eachquadrat. In 2003, aspen suckers were counted in the four 0.001-ha s thathad been newly established in each . The few black cottonwood or birchsprouts that were present were also counted in the 2003 assessment, and weretreated as aspen for purposes of analysis (the presence of these species was sominor that it was judged unnecessary to distinguish them from aspen). Start-ing from due north from the centre to the edge of each , and travellingclockwise, height was measured for the first 15 suckers. Of these, ground-leveldiameter was measured for three representative (small, medium, large) suck-ers. Conifers between 0.3 and 1.3 m tall in the s were also counted.
3.3 Measurements
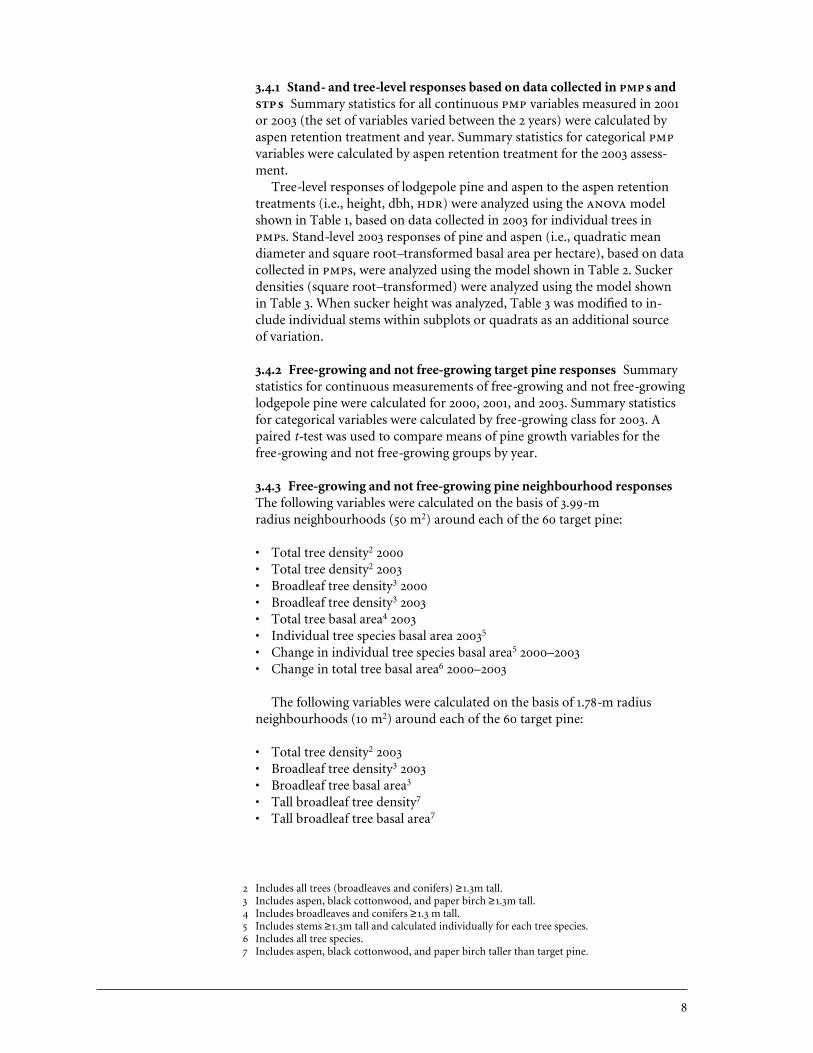
3.3.3 Free-growing and not free-growing target lodgepole pine and theirneighbourhoods In May 2000 and September 2001, target lodgepole pine inthe free-growing and not free-growing classes were measured for:
• dbh• Total height• (calculated)
In September 2003, the target pine were assessed for:
• dbh• Total height• Crown length• Crown width (average of – and –)• Vigour• Damage and damage cause• Free-growing status• (calculated)
Target pine survival, vigour, damage, and damage cause were assessed according to a standard research protocol (Appendix 1).
Also in May 2000, free-growing and not free-growing target pine neigh-bourhoods were assessed by measuring dbh of all neighbouring trees within a3.99-m radius of each target pine. In 2003, to more closely investigate neigh-bourhood size and compare results with other studies, neighbourhood treeswere assessed within 1.78-m and 3.99-m radii around each target lodgepolepine. Diameter (dbh) was measured for all stems at least 1.3 m tall, andheight was measured for stems at least as tall as the target pine. Basal areaand the change in basal area from 2000 to 2003 were calculated for all neigh-bourhood species. Densities were calculated on a per-hectare basis for alltrees and for broadleaves. Additional information about 1999–2003 establish-ment and measurement activities at the McKinley Lake site is presented inNewsome and Heineman1 (2006, unpublished report).
Summary statistics including mean, standard deviation, and standard errorwere compiled for all continuous variables of interest (e.g., height, diameter,density, and basal area of pine and aspen). For categorical variables such asvigour and survival, numbers and percentages of trees in each class were cal-culated. One-way analysis of variance () models (Tables 1, 2, 3) werefitted, and an F-test, with the error degrees of freedom calculated using Sat-terthwaite’s method, was used to test the treatment effect on pine and aspen.All models include a fixed treatment effect and a random plot effect, whichrepresents the variation among the experimental units to which treatmentswere randomly assigned. Where plots were subsampled there is an extra ran-dom factor to account for variation among the sampling units (i.e., trees orsubplots) within plots (Tables 1, 3). The statistical significance of differencesbetween all pairs of treatment means was assessed with the Bonferroni multi-ple comparison test (α=0.05). In some cases (i.e., aspen and pine basal area
3.4 Analysis
1 Newsome, T.A. and J.L. Heineman. 2006. Effects of variable aspen retention on stand development, aspen sucker production, and growth of lodgepole pine in the SBSdw1 variant of south-central British Columbia (EP1269.02). Updated working plan/establishment report.B.C. Min. For. Range, Victoria, B.C. Unpublished report.
per hectare and sucker density), a square-root transformation was applied to stabilize the variance and improve normality of the data prior to .Where a square-root transformation was used, the estimated (least-squares)treatment means and associated confidence intervals were back-transformedto the original scale (by squaring the mean, and upper and lower 95%confidence limits) to facilitate interpretation of the results. Neigh-bourhood effects on free-growing and not free-growing pine were alsoinvestigated by fitting a non-linear model (Equation 2) relating pine growthto the abundance of remaining broadleaves (e.g., density or basal area incre-ment). Boxplots and probability plots were used to examine the andregression residuals for outliers and other departures from normality. Dataanalyses used the following statistical software ( Institute Inc. 1996,1999) procedures: , , macro(Wolfinger 2000), and ( method of estimation).
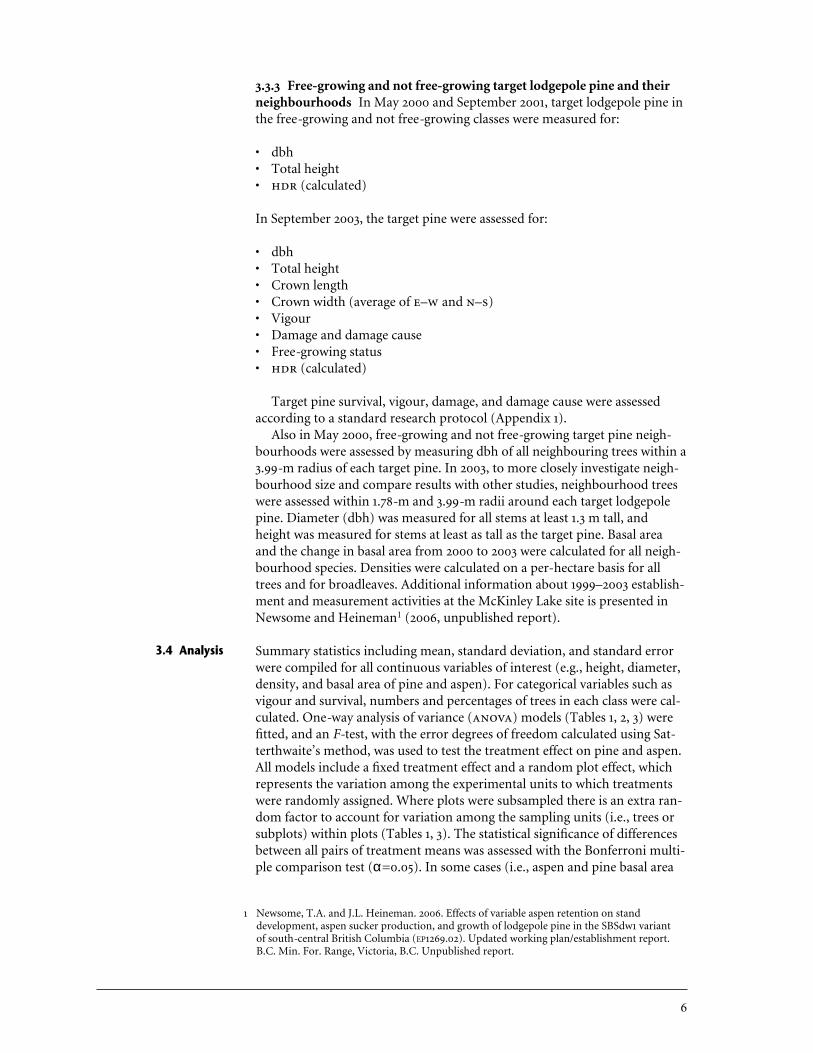
Sources of variation for examining the effects of aspen retention treatments onlodgepole pine and aspen height and diameter growth in PMPs
Source of variation Degrees of freedoma,b Type of effect
Treatment t–1=4 FixedPlots n–t=13 Random
Trees N–17–1 Random
a The associated degrees of freedom are the maximum values assuming no mortality or missing data.
b t=number of treatments; n=number of plots; N=total number of (live) trees.
Sources of variation for analyzing the effects of aspen retention treatments onlodgepole pine and aspen quadratic mean diameter and basal area per hectare
Source of variation Degrees of freedoma,b,c Type of effect
Treatment t–1=4 Fixed
Plots n–t=13 Random
a The associated degrees of freedom are the maximum values assuming no mortality or missing data.
b For analyses that do not include the 0 stems ha-1 treatment, degrees of freedom for treatment decrease by 1 and degrees of freedom for the other terms decrease accordingly.
c t=number of treatments; n=number of plots.
Sources of variation for examining the effects of aspen retention treatments onaspen sucker density
Source of variation Degrees of freedoma,b Type of effect
Treatment t–1=4 FixedPlots n–t=13 Random
Subplots n(k–1)=54 Random
a The associated degrees of freedom are the maximum values assuming no mortality or missing data.
b t=number of treatments; n=number of plots (s); k=number of quadrats (2001) or smalltree plots (2003) per .
3.4.1 Stand- and tree-level responses based on data collected in s and s Summary statistics for all continuous variables measured in 2001or 2003 (the set of variables varied between the 2 years) were calculated byaspen retention treatment and year. Summary statistics for categorical variables were calculated by aspen retention treatment for the 2003 assess-ment.
Tree-level responses of lodgepole pine and aspen to the aspen retentiontreatments (i.e., height, dbh, ) were analyzed using the modelshown in Table 1, based on data collected in 2003 for individual trees ins. Stand-level 2003 responses of pine and aspen (i.e., quadratic mean diameter and square root–transformed basal area per hectare), based on datacollected in s, were analyzed using the model shown in Table 2. Suckerdensities (square root–transformed) were analyzed using the model shown in Table 3. When sucker height was analyzed, Table 3 was modified to in-clude individual stems within subplots or quadrats as an additional source of variation.
3.4.2 Free-growing and not free-growing target pine responses Summarystatistics for continuous measurements of free-growing and not free-growinglodgepole pine were calculated for 2000, 2001, and 2003. Summary statisticsfor categorical variables were calculated by free-growing class for 2003. Apaired t-test was used to compare means of pine growth variables for thefree-growing and not free-growing groups by year.
3.4.3 Free-growing and not free-growing pine neighbourhood responsesThe following variables were calculated on the basis of 3.99-m radius neighbourhoods (50 m2) around each of the 60 target pine:
• Total tree density2 2000 • Total tree density2 2003 • Broadleaf tree density3 2000 • Broadleaf tree density3 2003 • Total tree basal area4 2003• Individual tree species basal area 20035
• Change in individual tree species basal area5 2000–2003• Change in total tree basal area6 2000–2003
The following variables were calculated on the basis of 1.78-m radiusneighbourhoods (10 m2) around each of the 60 target pine:
• Total tree density2 2003• Broadleaf tree density3 2003• Broadleaf tree basal area3
• Tall broadleaf tree density7
• Tall broadleaf tree basal area7
2 Includes all trees (broadleaves and conifers) ≥1.3m tall.3 Includes aspen, black cottonwood, and paper birch ≥1.3m tall.4 Includes broadleaves and conifers ≥1.3 m tall.5 Includes stems ≥1.3m tall and calculated individually for each tree species.6 Includes all tree species.7 Includes aspen, black cottonwood, and paper birch taller than target pine.
Spearman’s rank correlation coefficient was used to assess the degree ofassociation between the above neighbourhood competition variables and theheight, diameter, and 2000–2003 increments of the target lodgepole pine.Correlations were calculated separately for the free-growing and not free-growing pine, and for both groups combined. Relationships were furtherexamined using scatter plots of pine size and growth versus the competitionvariables. Based on initial screenings, the neighbourhood abundance vari-ables that showed the strongest relationships with pine height and diametergrowth were (a) 2003 tall broadleaf basal area, (b) 2000–2003 tall aspen basalarea increment, and (c) total 2003 tall broadleaf density based on a 1.78-m radius neighbourhood. These relationships were described by fitting regres-sion models. Scatter plots indicated that the relationships were not linear, sothe following exponential model (Equation 2) was selected to allow compari-son of McKinley results with previously reported results for pine–aspenstands in other Cariboo–Chilcotin ecosystems (Newsome et al. 2003, 2004a,2004b, 2006):
y = aebx + δpair + εtree (2)
where: y is pine height or diameter increment, x is the neighbourhood com-petition variable, δpair is the error due to random variation among pairs ofpine, εtree is the error due to variation between trees in individual pairs (anderror due to lack of fit), a and b are model parameters estimated by the (non-linear) least-squares method, and e is the base of the natural log (ln) equal to2.71828….. Both error terms were assumed to be mutually independent andnormally distributed with constant variances.
4 RESULTS
Stand development results are based on data collected in both s ands (see Section 3.3.1), and include information about stems retained at thetime of treatment and new suckers.
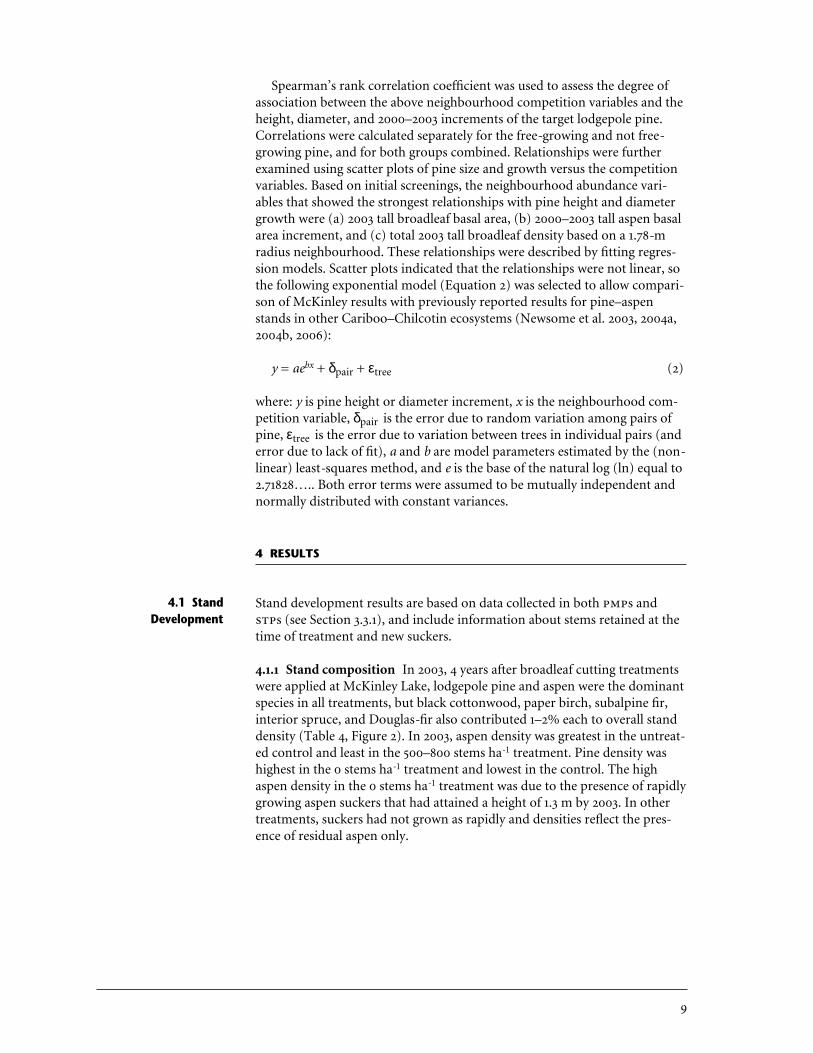
4.1.1 Stand composition In 2003, 4 years after broadleaf cutting treatmentswere applied at McKinley Lake, lodgepole pine and aspen were the dominantspecies in all treatments, but black cottonwood, paper birch, subalpine fir,interior spruce, and Douglas-fir also contributed 1–2% each to overall standdensity (Table 4, Figure 2). In 2003, aspen density was greatest in the untreat-ed control and least in the 500–800 stems ha-1 treatment. Pine density washighest in the 0 stems ha-1 treatment and lowest in the control. The highaspen density in the 0 stems ha-1 treatment was due to the presence of rapidlygrowing aspen suckers that had attained a height of 1.3 m by 2003. In othertreatments, suckers had not grown as rapidly and densities reflect the pres-ence of residual aspen only.
4.1 StandDevelopment
2003 stand composition (by stem density) in aspen retention treatmentsa,b at the McKinley Lake site
Aspen retention treament0 500–800 1000–1500 2000–2800
stems ha-1 stems ha-1 stems ha-1 stems ha-1 Control
Aspen 2930 ± 1551 776 ± 193 1251 ± 119 1951 ± 65 4737 ± 884Black cottonwood 0 ± 0 350 ± 350 50 ± 29 25 ± 25 0 ± 0Paper birch 33 ± 33 75 ± 75 100 ± 100 0 ± 0 0 ± 0Lodgepole pine 2902 ± 265 2202 ± 963 2502 ± 1519 1601 ± 329 1334 ± 883Interior spruce 100 ± 100 150 ± 119 175 ± 175 50 ± 29 33 ± 33Subalpine fir 100 ± 58 75 ± 48 0 ± 0 200 ± 142 0 ± 0
Douglas-fir 133 ± 133 50 ± 29 0 ± 0 25 ± 25 133 ± 67
a Presented as “mean ± 1 standard error.” b Densities are based on stems ≥1.3 m tall. Broadleaf stems in the 0 stems ha-1 treatment were mainly of sucker or sprout origin,
and were relatively small compared with those in other treatments.
100
80
60
40
20
0
Prop
ortio
n of
ste
ms
(%)
0 500–800 1000–1500 2000–2800 Controlstems ha-1 stems ha-1 stems ha-1 stems ha-1
Subalpine fir Douglas-fir Spruce Pine
Cottonwood Birch Aspen
2003 stand composition (by density of stems ≥1.3 m tall) in aspen retentiontreatments at the McKinley Lake site.
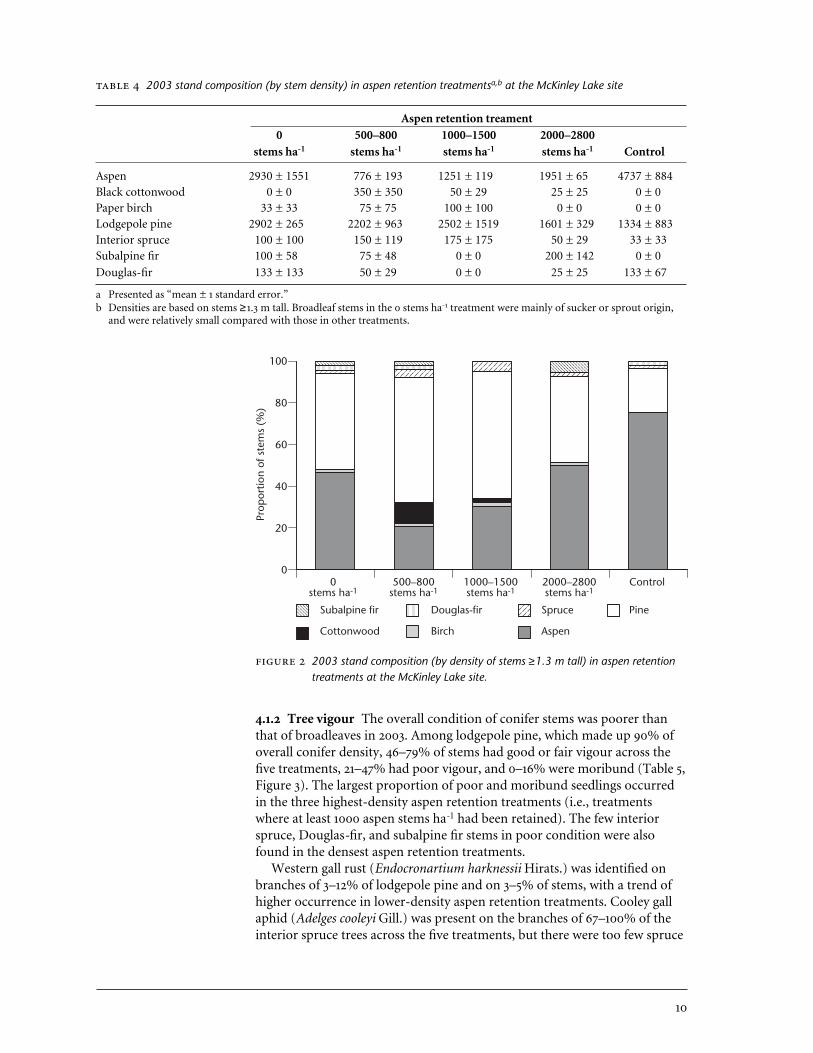
4.1.2 Tree vigour The overall condition of conifer stems was poorer thanthat of broadleaves in 2003. Among lodgepole pine, which made up 90% ofoverall conifer density, 46–79% of stems had good or fair vigour across thefive treatments, 21–47% had poor vigour, and 0–16% were moribund (Table 5,Figure 3). The largest proportion of poor and moribund seedlings occurredin the three highest-density aspen retention treatments (i.e., treatmentswhere at least 1000 aspen stems ha-1 had been retained). The few interiorspruce, Douglas-fir, and subalpine fir stems in poor condition were alsofound in the densest aspen retention treatments.
Western gall rust (Endocronartium harknessii Hirats.) was identified onbranches of 3–12% of lodgepole pine and on 3–5% of stems, with a trend ofhigher occurrence in lower-density aspen retention treatments. Cooley gallaphid (Adelges cooleyi Gill.) was present on the branches of 67–100% of theinterior spruce trees across the five treatments, but there were too few spruce
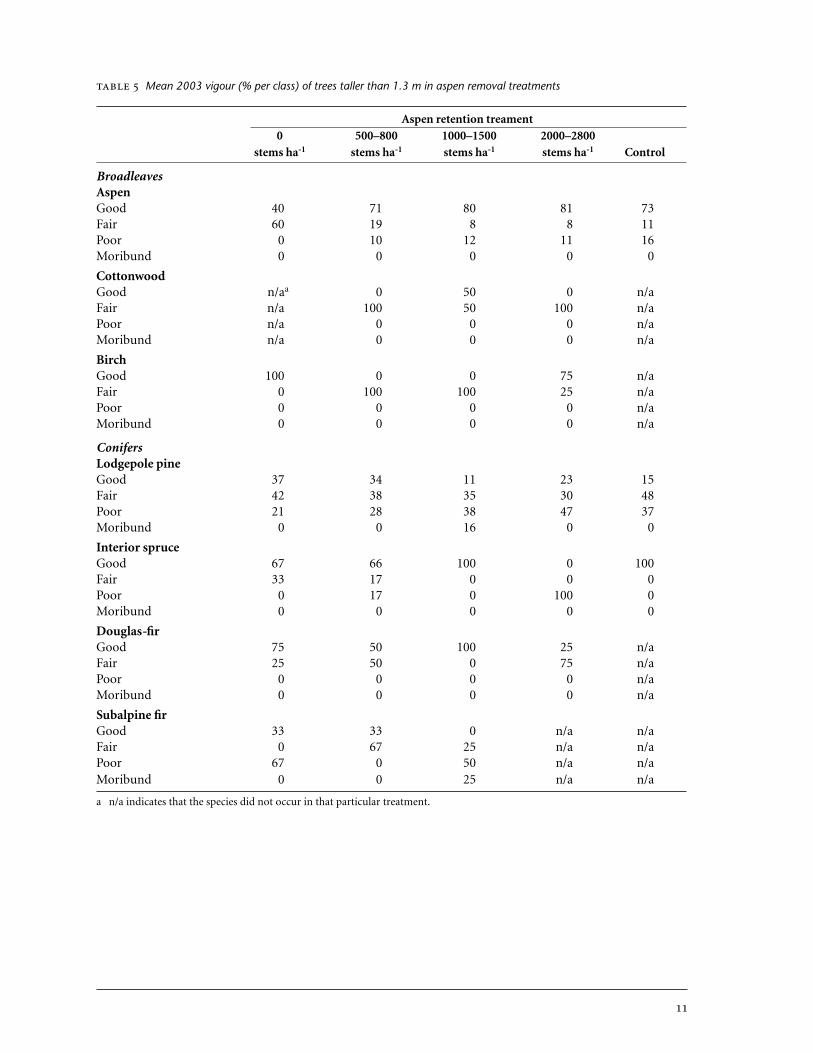
Mean 2003 vigour (% per class) of trees taller than 1.3 m in aspen removal treatments
Aspen retention treament0 500–800 1000–1500 2000–2800
stems ha-1 stems ha-1 stems ha-1 stems ha-1 Control
BroadleavesAspenGood 40 71 80 81 73Fair 60 19 8 8 11Poor 0 10 12 11 16Moribund 0 0 0 0 0
CottonwoodGood n/aa 0 50 0 n/aFair n/a 100 50 100 n/aPoor n/a 0 0 0 n/aMoribund n/a 0 0 0 n/a
BirchGood 100 0 0 75 n/aFair 0 100 100 25 n/aPoor 0 0 0 0 n/aMoribund 0 0 0 0 n/a
ConifersLodgepole pineGood 37 34 11 23 15Fair 42 38 35 30 48Poor 21 28 38 47 37Moribund 0 0 16 0 0
Interior spruceGood 67 66 100 0 100Fair 33 17 0 0 0Poor 0 17 0 100 0Moribund 0 0 0 0 0
Douglas-firGood 75 50 100 25 n/aFair 25 50 0 75 n/aPoor 0 0 0 0 n/aMoribund 0 0 0 0 n/a
Subalpine firGood 33 33 0 n/a n/aFair 0 67 25 n/a n/aPoor 67 0 50 n/a n/aMoribund 0 0 25 n/a n/a
a n/a indicates that the species did not occur in that particular treatment.
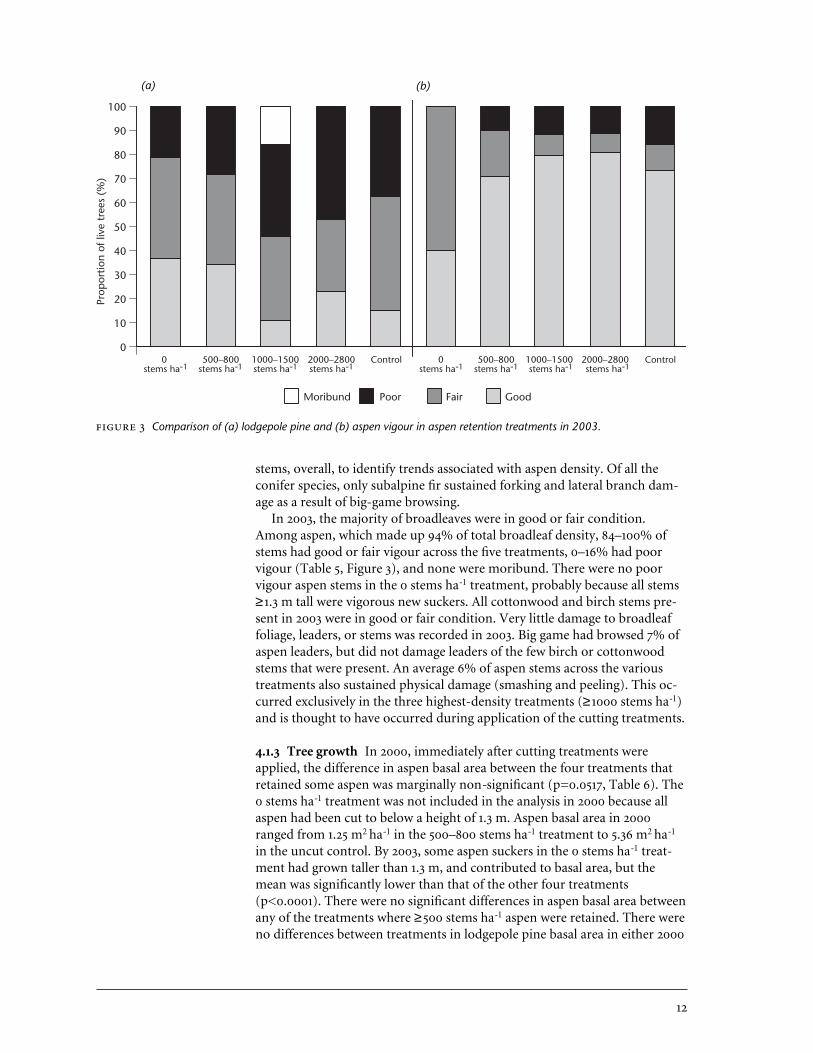
stems, overall, to identify trends associated with aspen density. Of all theconifer species, only subalpine fir sustained forking and lateral branch dam-age as a result of big-game browsing.
In 2003, the majority of broadleaves were in good or fair condition.Among aspen, which made up 94% of total broadleaf density, 84–100% ofstems had good or fair vigour across the five treatments, 0–16% had poorvigour (Table 5, Figure 3), and none were moribund. There were no poorvigour aspen stems in the 0 stems ha-1 treatment, probably because all stems≥1.3 m tall were vigorous new suckers. All cottonwood and birch stems pre-sent in 2003 were in good or fair condition. Very little damage to broadleaffoliage, leaders, or stems was recorded in 2003. Big game had browsed 7% ofaspen leaders, but did not damage leaders of the few birch or cottonwoodstems that were present. An average 6% of aspen stems across the varioustreatments also sustained physical damage (smashing and peeling). This oc-curred exclusively in the three highest-density treatments (≥1000 stems ha-1)and is thought to have occurred during application of the cutting treatments.
4.1.3 Tree growth In 2000, immediately after cutting treatments were applied, the difference in aspen basal area between the four treatments thatretained some aspen was marginally non-significant (p=0.0517, Table 6). The0 stems ha-1 treatment was not included in the analysis in 2000 because allaspen had been cut to below a height of 1.3 m. Aspen basal area in 2000ranged from 1.25 m2 ha-1 in the 500–800 stems ha-1 treatment to 5.36 m2 ha-1
in the uncut control. By 2003, some aspen suckers in the 0 stems ha-1 treat-ment had grown taller than 1.3 m, and contributed to basal area, but themean was significantly lower than that of the other four treatments(p<0.0001). There were no significant differences in aspen basal area betweenany of the treatments where ≥500 stems ha-1 aspen were retained. There wereno differences between treatments in lodgepole pine basal area in either 2000
100
90
80
70
60
50
40
30
20
10
0
Prop
ortio
n of
live
tre
es (
%)
0 500–800 1000–1500 2000–2800 Control 0 500–800 1000–1500 2000–2800 Controlstems ha-1 stems ha-1 stems ha-1 stems ha-1 stems ha-1 stems ha-1 stems ha-1 stems ha-1
Moribund Poor Fair Good
Comparison of (a) lodgepole pine and (b) aspen vigour in aspen retention treatments in 2003.
(a) (b)
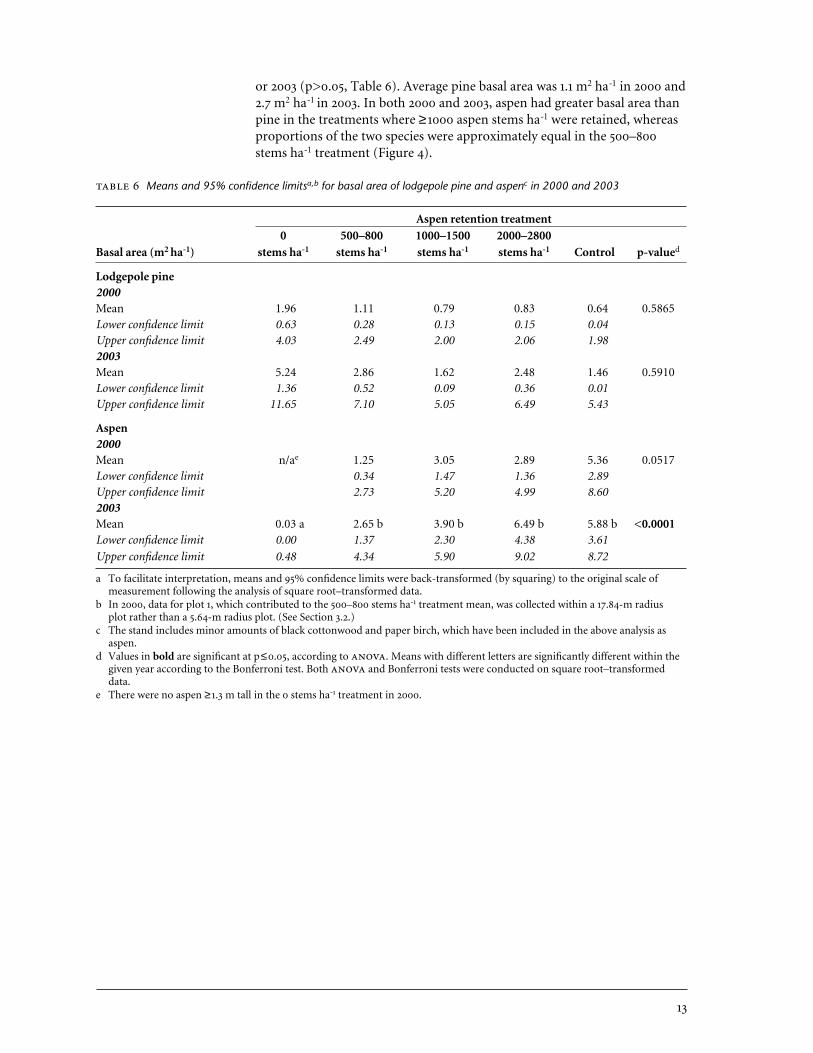
or 2003 (p>0.05, Table 6). Average pine basal area was 1.1 m2 ha-1 in 2000 and2.7 m2 ha-1 in 2003. In both 2000 and 2003, aspen had greater basal area thanpine in the treatments where ≥1000 aspen stems ha-1 were retained, whereasproportions of the two species were approximately equal in the 500–800stems ha-1 treatment (Figure 4).
Means and 95% confidence limitsa,b for basal area of lodgepole pine and aspenc in 2000 and 2003
Aspen retention treatment0 500–800 1000–1500 2000–2800
Basal area (m2 ha-1) stems ha-1 stems ha-1 stems ha-1 stems ha-1 Control p-valued
Lodgepole pine2000Mean 1.96 1.11 0.79 0.83 0.64 0.5865Lower confidence limit 0.63 0.28 0.13 0.15 0.04Upper confidence limit 4.03 2.49 2.00 2.06 1.982003Mean 5.24 2.86 1.62 2.48 1.46 0.5910Lower confidence limit 1.36 0.52 0.09 0.36 0.01Upper confidence limit 11.65 7.10 5.05 6.49 5.43
Aspen2000Mean n/ae 1.25 3.05 2.89 5.36 0.0517Lower confidence limit 0.34 1.47 1.36 2.89Upper confidence limit 2.73 5.20 4.99 8.602003Mean 0.03 a 2.65 b 3.90 b 6.49 b 5.88 b <0.0001Lower confidence limit 0.00 1.37 2.30 4.38 3.61
Upper confidence limit 0.48 4.34 5.90 9.02 8.72
a To facilitate interpretation, means and 95% confidence limits were back-transformed (by squaring) to the original scale of measurement following the analysis of square root–transformed data.
b In 2000, data for plot 1, which contributed to the 500–800 stems ha-1 treatment mean, was collected within a 17.84-m radius plot rather than a 5.64-m radius plot. (See Section 3.2.)
c The stand includes minor amounts of black cottonwood and paper birch, which have been included in the above analysis asaspen.
d Values in bold are significant at p≤0.05, according to . Means with different letters are significantly different within thegiven year according to the Bonferroni test. Both and Bonferroni tests were conducted on square root–transformeddata.
e There were no aspen ≥1.3 m tall in the 0 stems ha-1 treatment in 2000.
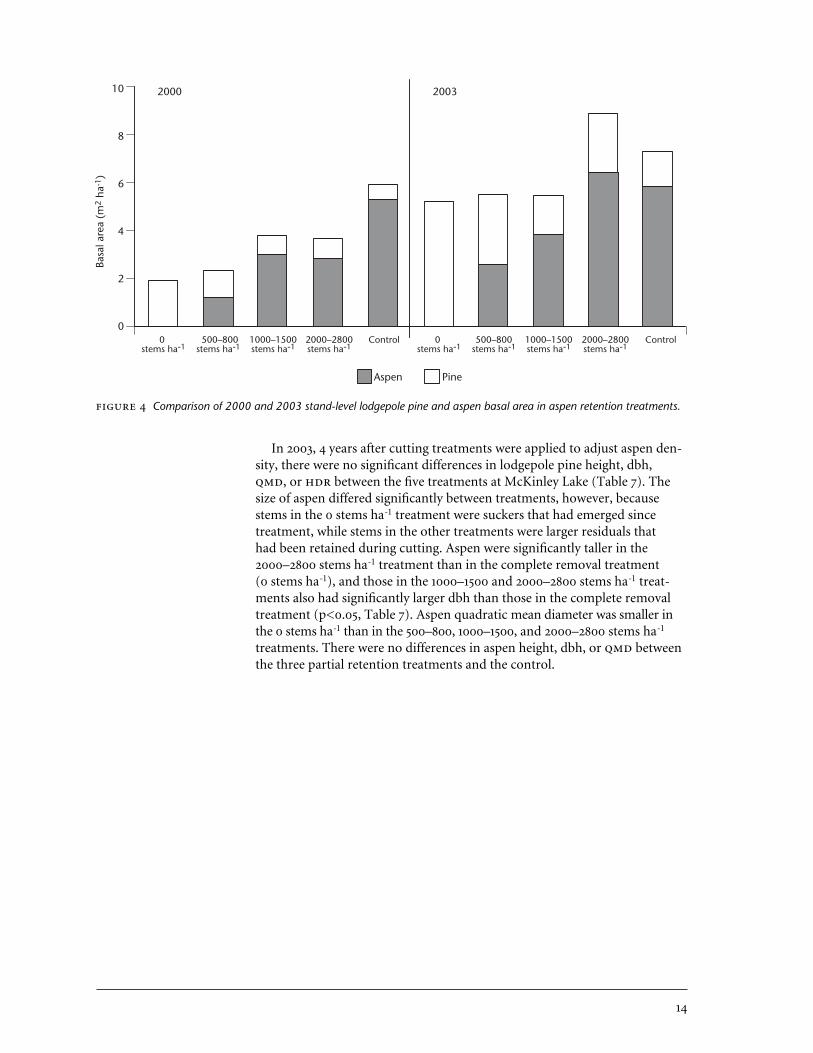
In 2003, 4 years after cutting treatments were applied to adjust aspen den-sity, there were no significant differences in lodgepole pine height, dbh,, or between the five treatments at McKinley Lake (Table 7). Thesize of aspen differed significantly between treatments, however, becausestems in the 0 stems ha-1 treatment were suckers that had emerged sincetreatment, while stems in the other treatments were larger residuals that had been retained during cutting. Aspen were significantly taller in the2000–2800 stems ha-1 treatment than in the complete removal treatment (0 stems ha-1), and those in the 1000–1500 and 2000–2800 stems ha-1 treat-ments also had significantly larger dbh than those in the complete removaltreatment (p<0.05, Table 7). Aspen quadratic mean diameter was smaller inthe 0 stems ha-1 than in the 500–800, 1000–1500, and 2000–2800 stems ha-1
treatments. There were no differences in aspen height, dbh, or betweenthe three partial retention treatments and the control.
10
8
6
4
2
0
Basa
l are
a (m
2 ha
-1)
0 500–800 1000–1500 2000–2800 Control 0 500–800 1000–1500 2000–2800 Controlstems ha-1 stems ha-1 stems ha-1 stems ha-1 stems ha-1 stems ha-1 stems ha-1 stems ha-1
Aspen Pine
2000 2003
Comparison of 2000 and 2003 stand-level lodgepole pine and aspen basal area in aspen retention treatments.
2003 meana height, stem diameter (dbh), height:diameter ratio (HDR), and quadratic mean diameter (QMD) oflodgepole pine and aspenb in aspen retention treatments
Aspen retention treatment0 500–800 1000–1500 2000–2800 Untreated
stems ha-1 stems ha-1 stems ha-1 stems ha-1 control p-valuec
Lodgepole pineHeight (cm) 389 ± 26 449 ± 27 373 ± 28 396 ± 26 424 ± 36 0.3831dbh (cm) 4.4 ± 0.4 4.3 ± 0.4 3.4 ± 0.4 3.9 ± 0.4 4.2 ± 0.6 0.4791 107 ± 9 127 ± 9 138 ± 9 115 ± 9 116 ± 12 0.2011 (cm) 4.9 ± 0.5 4.8 ± 0.5 3.7 ± 0.5 4.6 ± 0.4 5.0 ± 0.6 0.3948
Aspenb
Height (cm) 180 ± 115 a 561 ± 92 ab 627 ± 90 ab 721 ± 88 b 460 ± 99 ab 0.0290dbh (cm) 0.4 ± 1.0 a 4.4 ± 0.8 ab 5.4 ± 0.8 b 5.8 ± 0.8 b 3.6 ± 0.9 ab 0.0117 (cm) 0.5 ± 0.8 a 5.9 ± 0.7 b 6.0 ± 0.7 b 6.4 ± 0.7 b 4.0 ± 0.8 ab 0.0007
a Presented as “mean ± 1 standard error,” based on the model (i.e., variances are assumed to be homogeneous for alltreatments, blocks, and subplots).
b The stand includes minor amounts of black cottonwood and paper birch, which have been treated in the above analysis asaspen.
c Values in bold are significant at p≤0.05, according to . Means with different letters are significantly different within thegiven year according to the Bonferroni test.
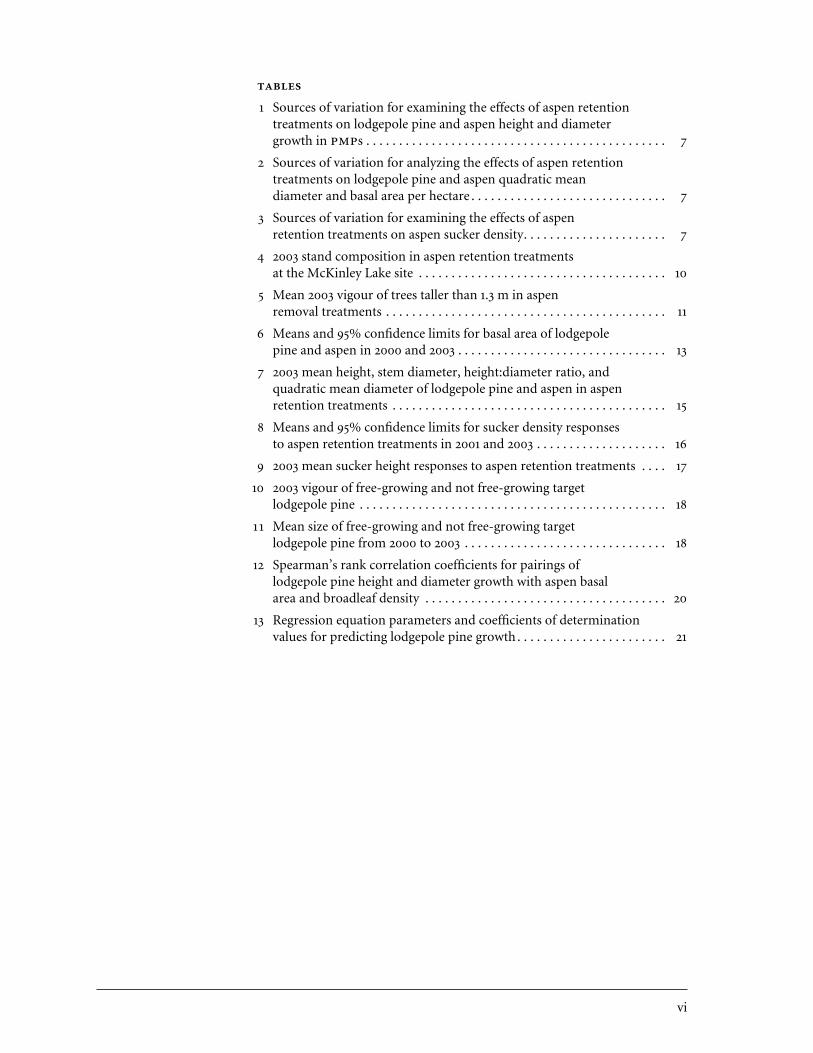
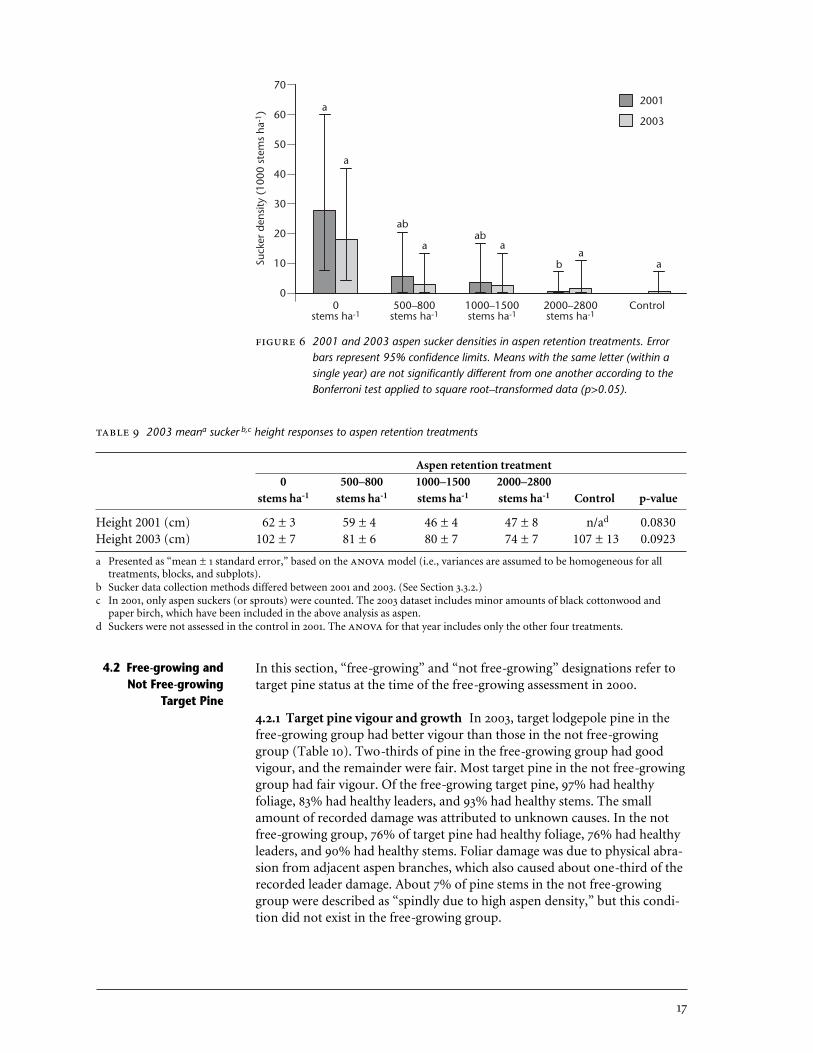
4.1.4 Suckering In 2001, 2 years after cutting treatments were applied, meanaspen sucker densities ranged from 28 187 stems ha-1 in the complete aspenremoval treatment (0 stems ha-1) to 344 stems ha-1 in the 2000–2800 stemsha-1 treatment. Sucker presence in the uncut control was not assessed in 2001.By 2003, 4 years after cutting, there were 7–times as many aspen suckers inthe 0 stems ha-1 treatment as in the average of the other retention treatments(Table 8, Figures 5, 6). Between 2001 and 2003, aspen sucker densities de-creased by 36% in the complete aspen removal treatment, by 57% in the500–800 stems ha-1 treatment, and by 33% in the 1000–1500 stems ha-1 treat-ment. In contrast, aspen sucker density apparently increased by 566% in the2000–2800 stems ha-1 treatment during the same period (from 344 to 1948suckers ha-1). Different methods were used for assessing sucker densities in2001 and 2003, which may account for some of the differences between years,especially in the 2000–2800 stems ha-1 treatment. Despite large differences inmeans, it was difficult to identify statistically significant differences betweentreatments because of the high variability between plots. identified asignificant between-treatment difference in 2001 sucker densities (p=0.0496),but only the 0 stems ha-1 treatment (28 187 suckers ha-1) and the 2000–2800stems ha-1 (344 suckers ha-1) treatments differed from each other accordingto the Bonferroni test. There were no significant differences in aspen suckerheight as a result of the aspen retention treatments in either 2001 or 2003(Table 9). Four years after aspen retention treatments were applied, suckerswere 89 cm tall, on average.
Means and 95% confidence limitsa for suckerb,c density responses to aspen retention treatments in 2001 and 2003
Aspen retention treatment0 500–800 1000–1500 2000–2800
Density (suckers ha-1) stems ha-1 stems ha-1 stems ha-1 stems ha-1 Control p-valued
Aspen 2001Mean 28 187 a 5 981 ab 4 084 ab 344 b n/ae 0.0496Lower confidence limit 8 352 123 6 2 277Upper confidence limit 59 726 20 617 16 941 7 189
Aspen 2003Mean 18 063 3 039 3 039 1 948 264 0.1820Lower confidence limit 4 071 36 36 289 0
Upper confidence limit 42 023 13 517 13 517 11 082 7 539
a To facilitate interpretation, means and 95% confidence limits were back-transformed (by squaring) to the original scale of measurement following the analysis of square root–transformed data.
b Sucker data collection methods differed between 2001 and 2003. (See Section 3.3.2.)c In 2001, only aspen suckers (or sprouts) were counted. The 2003 dataset includes minor amounts of black cottonwood and
paper birch, which have been included in the above analysis as aspen. d Values in bold are significant at p≤0.05, according . Means with different letters are significantly different within the
given year according to the Bonferroni test. Both and Bonferroni tests were conducted on square root–transformeddata.
e Suckers were not assessed in the control in 2001. The for that year includes only the other four treatments.
An illustration of sucker density and height in the complete aspen removal treatment (0 stems ha-1), 4 years after cutting (2003). The area in the background is a control plot.
2003 meana sucker b,c height responses to aspen retention treatments
Aspen retention treatment0 500–800 1000–1500 2000–2800
stems ha-1 stems ha-1 stems ha-1 stems ha-1 Control p-value
Height 2001 (cm) 62 ± 3 59 ± 4 46 ± 4 47 ± 8 n/ad 0.0830Height 2003 (cm) 102 ± 7 81 ± 6 80 ± 7 74 ± 7 107 ± 13 0.0923
a Presented as “mean ± 1 standard error,” based on the model (i.e., variances are assumed to be homogeneous for all treatments, blocks, and subplots).
b Sucker data collection methods differed between 2001 and 2003. (See Section 3.3.2.)c In 2001, only aspen suckers (or sprouts) were counted. The 2003 dataset includes minor amounts of black cottonwood and
paper birch, which have been included in the above analysis as aspen. d Suckers were not assessed in the control in 2001. The for that year includes only the other four treatments.
In this section, “free-growing” and “not free-growing” designations refer totarget pine status at the time of the free-growing assessment in 2000.
4.2.1 Target pine vigour and growth In 2003, target lodgepole pine in thefree-growing group had better vigour than those in the not free-growinggroup (Table 10). Two-thirds of pine in the free-growing group had goodvigour, and the remainder were fair. Most target pine in the not free-growinggroup had fair vigour. Of the free-growing target pine, 97% had healthy foliage, 83% had healthy leaders, and 93% had healthy stems. The smallamount of recorded damage was attributed to unknown causes. In the notfree-growing group, 76% of target pine had healthy foliage, 76% had healthyleaders, and 90% had healthy stems. Foliar damage was due to physical abra-sion from adjacent aspen branches, which also caused about one-third of therecorded leader damage. About 7% of pine stems in the not free-growinggroup were described as “spindly due to high aspen density,” but this condi-tion did not exist in the free-growing group.
4.2 Free-growing andNot Free-growing
Target Pine
70
60
50
40
30
20
10
0
Suck
er d
ensi
ty (
1000
ste
ms
ha-1
)
0 500–800 1000–1500 2000–2800 Controlstems ha-1 stems ha-1 stems ha-1 stems ha-1
2001
2003a
a
abab
a aa
ab
2001 and 2003 aspen sucker densities in aspen retention treatments. Errorbars represent 95% confidence limits. Means with the same letter (within asingle year) are not significantly different from one another according to theBonferroni test applied to square root–transformed data (p>0.05).
2003 vigour (% per class) of free-growing and not free-growing targetlodgepole pine
Free-growing Not free-growing
Good 66 14Fair 34 79Poor 0 7Moribund 0 0
At the time of the free-growing assessment in 2000, target lodgepole pinein the free-growing group had significantly larger dbh, were significantlytaller, and had significantly lower than those in the not free-growinggroup (p≤0.05, Table 11). Differences continued to be significant through2003, when target pine in the free-growing group were still significantly larger according to all assessed growth attributes, including crown length and width and leader length, which were not assessed previously (p≤0.05,Table 11).
Meana size of free-growing and not free-growing target lodgepole pine from 2000 to 2003
Free-growing Not free-growingn Mean ± n Mean ± p-valueb
2000Height (cm) 29 364 ± 12 29 333 ± 13 0.0162dbh (cm) 29 3.7 ± 0.2 29 3.0 ± 0.2 0.0002 29 102 ± 3 29 117 ± 3 0.0003
2001Height (cm) 29 428 ± 13 29 390 ± 15 0.0122dbh (cm) 29 5.2 ± 0.2 29 4.1 ± 0.2 <0.00012000–2001 height increment (cm) 29 65 ± 3 29 57 ± 3 0.08732000–2001 diameter increment (cm) 29 1.5 ± 0.1 29 1.1 ± 0.1 <0.0001 29 84 ± 2 29 97 ± 2 <0.0001
2003Height (cm) 28 523 ± 16 29 464 ± 16 0.0028Leader length (cm) 28 49 ± 2 29 39 ± 2 0.00352000–2003 height increment (cm) 28 156 ± 7 29 130 ± 7 0.0082dbh (cm) 29 6.7 ± 0.2 29 5.2 ± 0.2 <0.00012000–2003 diameter increment (cm) 29 3.0 ± 0.1 29 2.2 ± 0.1 <0.0001Crown length (cm) 28 415 ± 15 29 324 ± 15 <0.0001Crown width (cm) 29 209 ± 8 29 169 ± 8 0.0003 28 79 ± 3 29 91 ± 3 0.0007
a Presented as “mean ± 1 standard error,” assuming equal variances for free-growing and not free-growing pine.b Values in bold are significant at p≤0.05.
4.2.2 Target pine neighbourhoods In 2003, when the McKinley Lake standwas approximately 15 years old, free-growing target lodgepole pine weregrowing in neighbourhoods where lodgepole pine and aspen basal area wereapproximately equal, and where total neighbourhood basal area averaged 6.8 m2 ha-1, based on measurements within a 3.99-m radius around pine. In
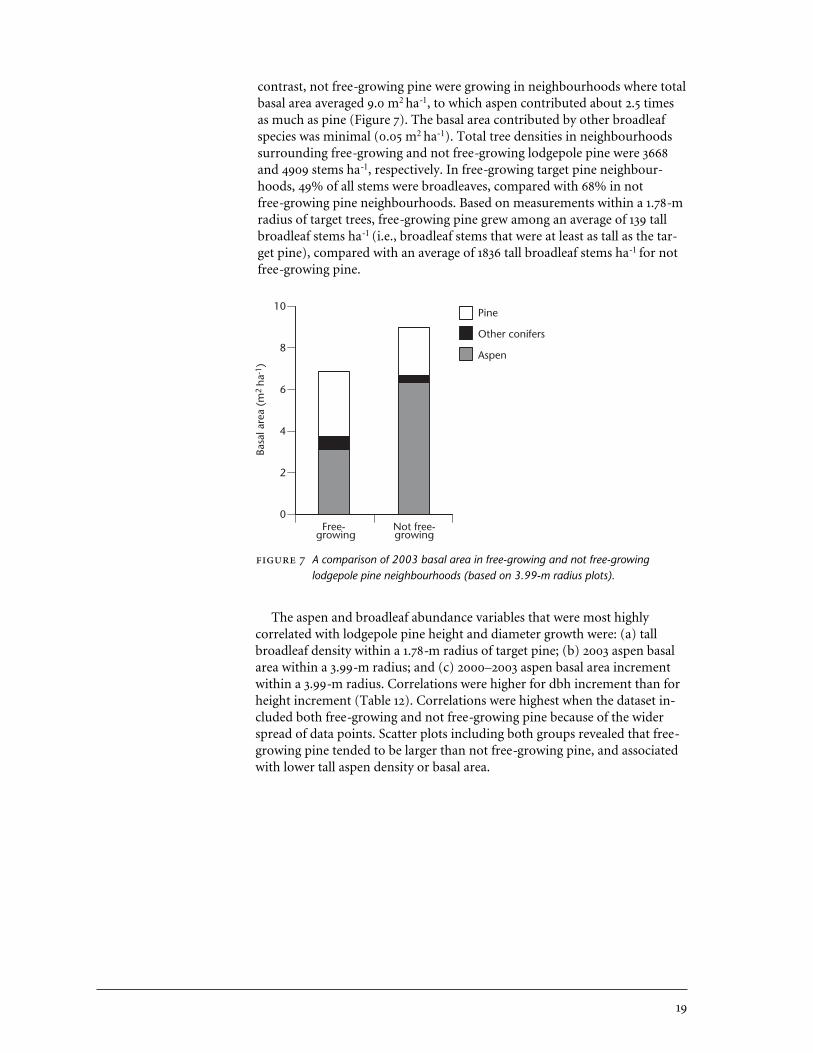
contrast, not free-growing pine were growing in neighbourhoods where totalbasal area averaged 9.0 m2 ha-1, to which aspen contributed about 2.5 timesas much as pine (Figure 7). The basal area contributed by other broadleafspecies was minimal (0.05 m2 ha-1). Total tree densities in neighbourhoodssurrounding free-growing and not free-growing lodgepole pine were 3668and 4909 stems ha-1, respectively. In free-growing target pine neighbour-hoods, 49% of all stems were broadleaves, compared with 68% in notfree-growing pine neighbourhoods. Based on measurements within a 1.78-mradius of target trees, free-growing pine grew among an average of 139 tallbroadleaf stems ha-1 (i.e., broadleaf stems that were at least as tall as the tar-get pine), compared with an average of 1836 tall broadleaf stems ha-1 for notfree-growing pine.
10
8
6
4
2
0
Basa
l are
a (m
2 ha
-1)
Free- Not free-growing growing
Pine
Other conifers
Aspen
A comparison of 2003 basal area in free-growing and not free-growinglodgepole pine neighbourhoods (based on 3.99-m radius plots).
The aspen and broadleaf abundance variables that were most highly correlated with lodgepole pine height and diameter growth were: (a) tallbroadleaf density within a 1.78-m radius of target pine; (b) 2003 aspen basalarea within a 3.99-m radius; and (c) 2000–2003 aspen basal area incrementwithin a 3.99-m radius. Correlations were higher for dbh increment than forheight increment (Table 12). Correlations were highest when the dataset in-cluded both free-growing and not free-growing pine because of the widerspread of data points. Scatter plots including both groups revealed that free-growing pine tended to be larger than not free-growing pine, and associatedwith lower tall aspen density or basal area.
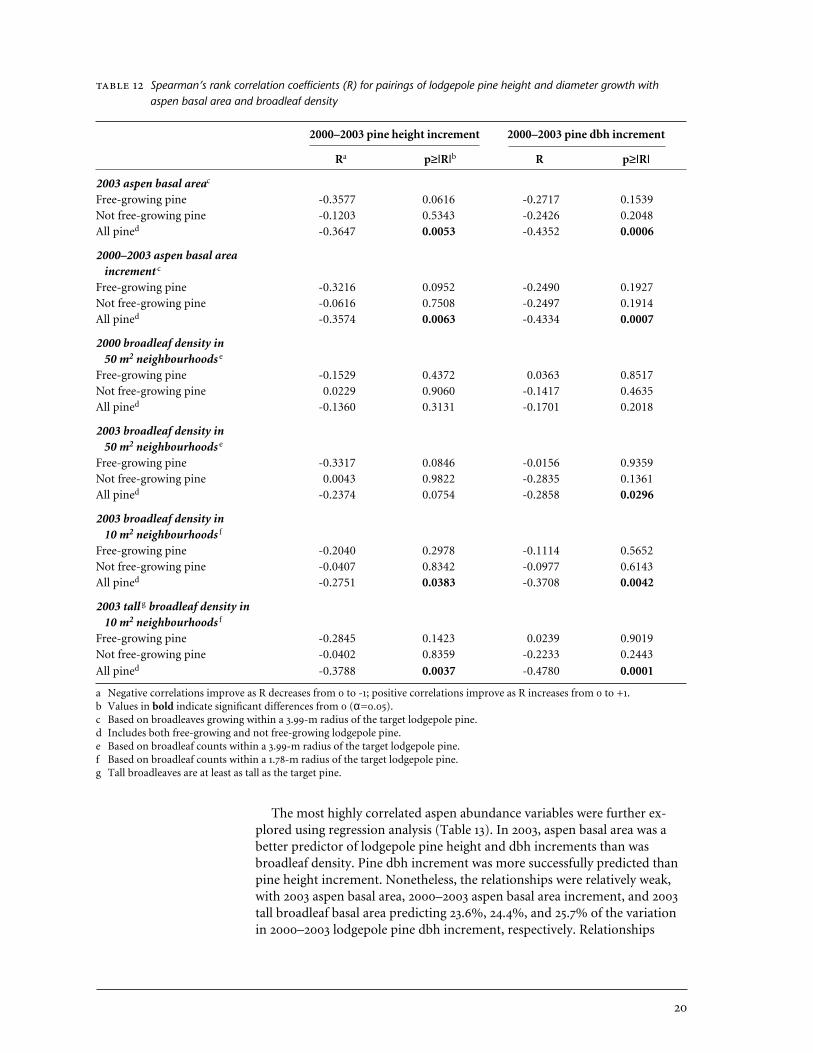
Spearman’s rank correlation coefficients (R) for pairings of lodgepole pine height and diameter growth withaspen basal area and broadleaf density
2000–2003 pine height increment 2000–2003 pine dbh increment
Ra p≥|R|b R p≥|R|
2003 aspen basal areac
Free-growing pine -0.3577 0.0616 -0.2717 0.1539Not free-growing pine -0.1203 0.5343 -0.2426 0.2048All pined -0.3647 0.0053 -0.4352 0.0006
2000–2003 aspen basal area increment c
Free-growing pine -0.3216 0.0952 -0.2490 0.1927Not free-growing pine -0.0616 0.7508 -0.2497 0.1914All pined -0.3574 0.0063 -0.4334 0.0007
2000 broadleaf density in 50 m2 neighbourhoods e
Free-growing pine -0.1529 0.4372 0.0363 0.8517Not free-growing pine 0.0229 0.9060 -0.1417 0.4635All pined -0.1360 0.3131 -0.1701 0.2018
2003 broadleaf density in 50 m2 neighbourhoods e
Free-growing pine -0.3317 0.0846 -0.0156 0.9359Not free-growing pine 0.0043 0.9822 -0.2835 0.1361All pined -0.2374 0.0754 -0.2858 0.0296
2003 broadleaf density in 10 m2 neighbourhoods f
Free-growing pine -0.2040 0.2978 -0.1114 0.5652Not free-growing pine -0.0407 0.8342 -0.0977 0.6143All pined -0.2751 0.0383 -0.3708 0.0042
2003 tall g broadleaf density in 10 m2 neighbourhoods f
Free-growing pine -0.2845 0.1423 0.0239 0.9019Not free-growing pine -0.0402 0.8359 -0.2233 0.2443
All pined -0.3788 0.0037 -0.4780 0.0001
a Negative correlations improve as R decreases from 0 to -1; positive correlations improve as R increases from 0 to +1.b Values in bold indicate significant differences from 0 (α=0.05).c Based on broadleaves growing within a 3.99-m radius of the target lodgepole pine. d Includes both free-growing and not free-growing lodgepole pine.e Based on broadleaf counts within a 3.99-m radius of the target lodgepole pine.f Based on broadleaf counts within a 1.78-m radius of the target lodgepole pine.g Tall broadleaves are at least as tall as the target pine.
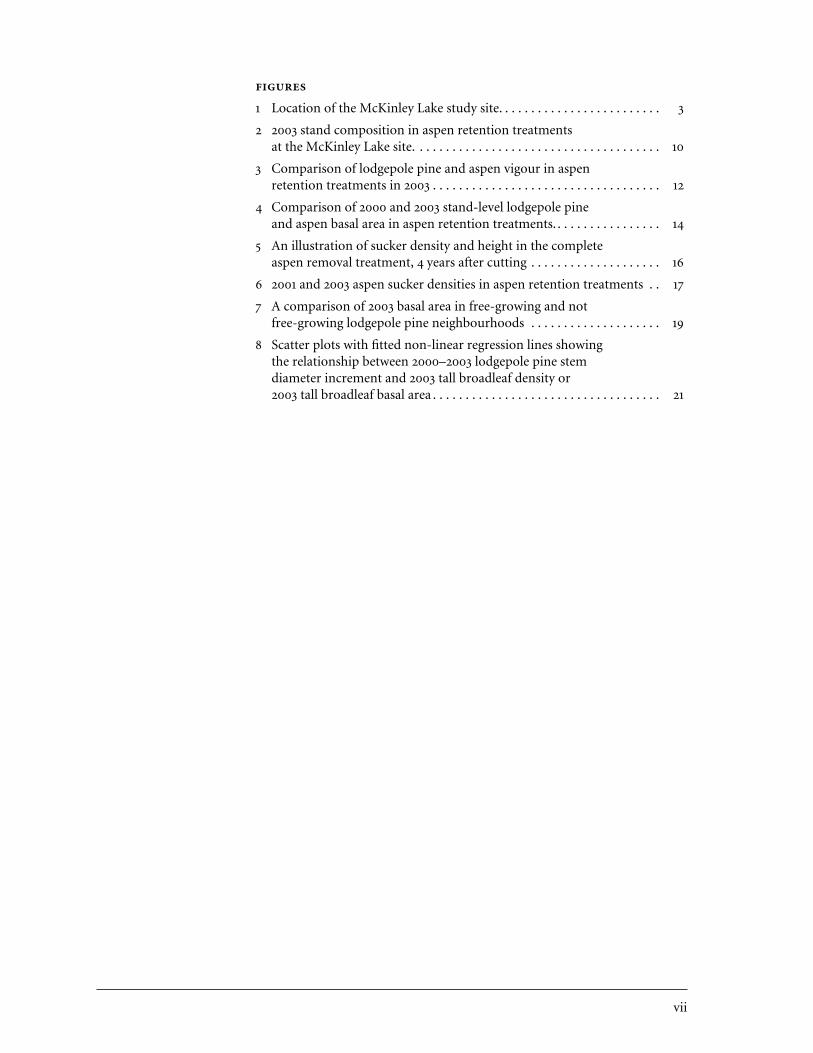
The most highly correlated aspen abundance variables were further ex-plored using regression analysis (Table 13). In 2003, aspen basal area was abetter predictor of lodgepole pine height and dbh increments than wasbroadleaf density. Pine dbh increment was more successfully predicted thanpine height increment. Nonetheless, the relationships were relatively weak,with 2003 aspen basal area, 2000–2003 aspen basal area increment, and 2003tall broadleaf basal area predicting 23.6%, 24.4%, and 25.7% of the variation in 2000–2003 lodgepole pine dbh increment, respectively. Relationships
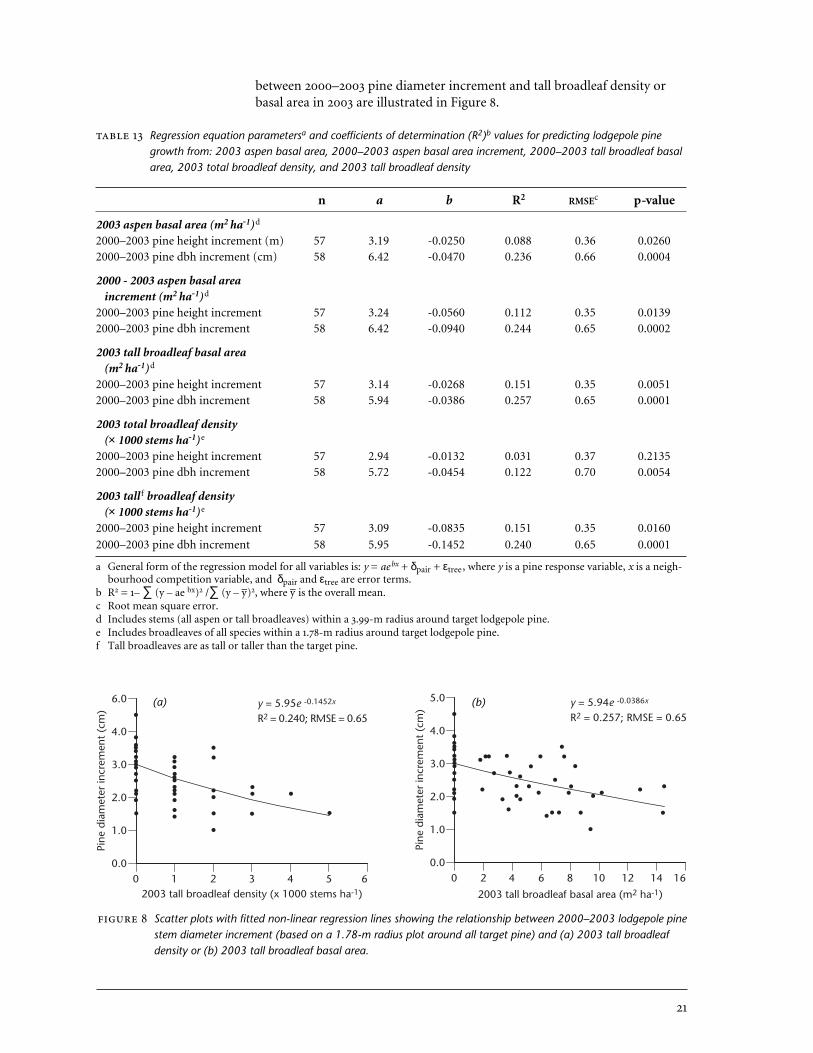
between 2000–2003 pine diameter increment and tall broadleaf density orbasal area in 2003 are illustrated in Figure 8.
Regression equation parametersa and coefficients of determination (R2)b values for predicting lodgepole pinegrowth from: 2003 aspen basal area, 2000–2003 aspen basal area increment, 2000–2003 tall broadleaf basalarea, 2003 total broadleaf density, and 2003 tall broadleaf density
n a b R2 RMSEc p-value
2003 aspen basal area (m2 ha-1) d
2000–2003 pine height increment (m) 57 3.19 -0.0250 0.088 0.36 0.02602000–2003 pine dbh increment (cm) 58 6.42 -0.0470 0.236 0.66 0.0004
2000 - 2003 aspen basal area increment (m2 ha-1) d
2000–2003 pine height increment 57 3.24 -0.0560 0.112 0.35 0.01392000–2003 pine dbh increment 58 6.42 -0.0940 0.244 0.65 0.0002
2003 tall broadleaf basal area (m2 ha-1) d
2000–2003 pine height increment 57 3.14 -0.0268 0.151 0.35 0.00512000–2003 pine dbh increment 58 5.94 -0.0386 0.257 0.65 0.0001
2003 total broadleaf density (× 1000 stems ha-1) e
2000–2003 pine height increment 57 2.94 -0.0132 0.031 0.37 0.21352000–2003 pine dbh increment 58 5.72 -0.0454 0.122 0.70 0.0054
2003 tall f broadleaf density (× 1000 stems ha-1) e
2000–2003 pine height increment 57 3.09 -0.0835 0.151 0.35 0.0160
2000–2003 pine dbh increment 58 5.95 -0.1452 0.240 0.65 0.0001
a General form of the regression model for all variables is: y = aebx + δpair + εtree, where y is a pine response variable, x is a neigh-bourhood competition variable, and δpair and εtree are error terms.
b R2 = 1– ∑ (y – ae bx)2 /∑ (y – y–)2, where y– is the overall mean.c Root mean square error.d Includes stems (all aspen or tall broadleaves) within a 3.99-m radius around target lodgepole pine.e Includes broadleaves of all species within a 1.78-m radius around target lodgepole pine. f Tall broadleaves are as tall or taller than the target pine.
Scatter plots with fitted non-linear regression lines showing the relationship between 2000–2003 lodgepole pinestem diameter increment (based on a 1.78-m radius plot around all target pine) and (a) 2003 tall broadleafdensity or (b) 2003 tall broadleaf basal area.
6.0
4.0
3.0
2.0
1.0
0.0
2003 tall broadleaf density (x 1000 stems ha-1)0 1 2 3 4 5 6
y = 5.95e -0.1452x
R2 = 0.240; RMSE = 0.65
Pine
dia
met
er in
crem
ent
(cm
)
5.0
4.0
3.0
2.0
1.0
0.0
2003 tall broadleaf basal area (m2 ha-1)
0 2 4 6 8 10 12 14 16
y = 5.94e -0.0386x
R2 = 0.257; RMSE = 0.65
Pine
dia
met
er in
crem
ent
(cm
)
(a) (b)

5 DISCUSSION
The McKinley Lake study was co-operatively established in 1999 by the B.C.Ministry of Forests and Weldwood of Canada, Ltd. to investigate the effectsof variable aspen retention on lodgepole pine and aspen growth and onaspen suckering. In 2002, it was incorporated into a larger project that is currently under way to study pine–aspen interactions across a range ofecosystems in the Cariboo–Chilcotin. In 2003, s at McKinley Lake were modified for the collection of growth and yield data, and the originalmethodologies were revised to more closely resemble those in the relatedstudies. Consequently, there are some differences in the methodologies ap-plied before and after 2003. For some variables, the 2003 dataset will serve asthe baseline for future measurements. The focus of the McKinley Lake studyalso differs somewhat from that of other studies in the pine–aspen competi-tion project because it does not measure the responses of individual targetlodgepole pine to the aspen retention treatments.
The McKinley Lake stand (based on stand-level data collected in s) wasdominated by aspen and lodgepole pine, but black cottonwood, paper birch,subalpine fir, interior spruce, and Douglas-fir also contributed 1–2% each tooverall density. The minor presence of other mixed species in juvenile standsdominated by pine and aspen is typical of the SBSdw1 variant (Steen andCoupé 1997).
5.1.1 Lodgepole pine In 2003, lodgepole pine vigour tended to be higher intreatments where aspen density was ≤ 800 stems ha-1 than in treatments withgreater aspen retention. This agrees with retrospective study results for theSBSdw, where 17- to 18-year-old lodgepole pine vigour declined steeply inneighbourhoods where the density of tall aspen (i.e., aspen as tall as or tallerthan the target pine) exceeded 1000 stems ha-1 (Newsome et al. 2003). In that study, declining vigour in neighbourhoods with high aspen density became more apparent as stands aged. At McKinley Lake, vigour data werecollected for the first time in 2003, so it is not possible to comment onchanges that may have occurred since treatments were applied. Summarystatistics regarding the presence of various damaging agents at the McKinleyLake site suggested that western gall rust was most common in treatmentsthat retained the fewest aspen. This is consistent with information presentedby Finck et al. (1989) that vigorously growing trees are more vulnerable togall rust infection than those that are growing poorly. In general, mixed-speciesstands are reported to have lower incidence of disease than single-speciesstands (e.g., Comeau et al. 2005). These issues will be investigated more fullyin subsequent assessments.
Four years after aspen retention treatments were applied at the McKinleyLake site, there were no significant differences in stand-level lodgepole pineheight, dbh, , or basal area among the five treatments. Conifer stem diameter commonly responds more quickly than height to reductions in veg-etation competition (e.g., Lanner 1985; Lanini and Radosevich 1986; Simardet al. 2001), but no trends were apparent at McKinley Lake to suggest thatpine dbh or were responding to the treatments. Pine basal area tendedto be larger in the treatment where all aspen were removed, but the differ-
5.1 StandDevelopment
ence was not significant in either 2000 or 2003. Four years after treatment,pine had higher basal area than aspen only in those treatments where aspendensity was ≤800 stems ha-1.
Early lodgepole pine responses to aspen retention treatments have variedin Cariboo–Chilcotin studies. In a study in the SBSdw2, growth of plantedlodgepole pine did not increase significantly during a 9-year period whereaspen were removed annually from within 0.5 or 1.0 m of the target pine(Newsome et al. 2004b). In the IDFxm subzone, target planted lodgepolepine growth also failed to improve within 4 years of aspen removal treat-ments that reduced aspen density from the control level of 23 483 stems ha-1
to 0–4000 stems ha-1 (Newsome et al. 2004a). Contrary to these findings, diameter growth of naturally regenerated lodgepole pine in the SBPSxc increased significantly within 2 years of treatments that reduced aspen densi-ty from control levels of 14 185 stems ha-1 to 0–2500 stems ha-1 (Newsome etal. 2006).
Significant treatment responses are more difficult to discern for pine atthe stand level, where means include all stems regardless of size or condition,than for individual target pine that were initially selected according tospecific health and vigour criteria. For example, in the above-mentionedSBPSxc study (Newsome et al. 2006), overall diameter increases for lodge-pole pine at the stand level were not statistically significant after 2 years(p>0.05), despite the significant response of target pine. At McKinley Lake,the difficulty of detecting significant growth responses at the stand level iscompounded by the inclusion of a range of densities in each treatmentgrouping.
Lodgepole pine in the 15-year-old stand at McKinley Lake may not havesignificantly responded to treatments that reduced aspen density because, incomparison, pine in the untreated control had not yet been substantially af-fected by competition. Retrospective study results for the SBSdw (Newsomeet al. 2003) showed that competition effects between aspen and pine were not pronounced until stands were 17–18 years old. When those stands wereyounger (age 10–11), significant differences in diameter were found only be-tween those pine growing in neighbourhoods with no aspen and thosegrowing in neighbourhoods with over 5000 tall aspen stems ha-1 (i.e., aspenat least as tall as the target pine). At McKinley Lake, total aspen density in theuntreated control averaged only 4737 stems ha-1 in 2003.
The relatively small height differential between aspen and pine at McKin-ley Lake also suggests that pine were not experiencing strong competition forlight. Light availability increases rapidly from the base to the top of aspencanopies (Comeau 2002; Comeau et al. 2006). In 2003, lodgepole pine in theuntreated control at McKinley Lake were approximately three-quarters as tall as aspen. Based on the Comeau et al. (2006) models, light availabilitybeneath the canopy was approximately 52% of full sunlight. However, pinegrowing among these aspen were receiving 65–80% full sunlight by virtue of their canopy positions. Lodgepole pine is very shade-intolerant, and its diameter growth may be reduced by 50% at 60% light availability (Wright et al. 1998).
5.1.2 Aspen In 2003, 4 years after aspen retention treatments were applied, aspen basal area and quadratic mean diameter were larger in treat-ments that retained aspen than in the complete removal treatment. However,there were no differences among the treatments that retained aspen (includ-ing the untreated control). In related studies in the IDFxm and SBPSxcsubzones, reducing aspen density to 1000–4000 stems ha-1 immediately reduced basal area of (at least) the lowest-density treatments in comparisonwith the untreated control (Newsome et al. 2004a, 2006). At McKinley Lake,the difference in aspen density between treatments was marginally non-significant (p=0.0517) immediately after cutting, mainly because of the rangeof densities within each treatment class.
By 2003, nearly 3000 aspen suckers ha-1 in the complete removal treatmenthad grown tall enough (≥1.3 m) to be included in basal area calculations, butthis was not yet the case in any of the treatments that retained residual aspen.Although these young suckers contributed only minor basal area to the standin 2003, they are expected to account for a larger component as the standages.
Other studies associated with the Cariboo–Chilcotin pine–aspen competi-tion project have shown that aspen diameter distributions immediatelychanged following aspen removal treatments because the largest and mostvigorous aspen stems were selectively retained. Stems in the low-densitytreatments tended to move into larger diameter classes more quickly thanthose in the untreated control (Newsome et al. 2004a). Although enhancingsoftwood timber production is currently the main objective when managing juvenile pine–aspen stands, Peterson and Peterson (1995) note that aspensawlog production may also be enhanced by such treatments.
5.1.3 Suckering One of the anticipated benefits of retaining residual aspenstems during manual cutting treatments is a reduction in the abundance andvigour of aspen suckers. This phenomenon has been documented in a varietyof studies (e.g., Huffman et al. 1999; Prévost and Pothier 2003), and has beensubjectively observed on Cariboo–Chilcotin sites. Sucker abundance andgrowth at varying levels of aspen retention are currently being studied for arange of Cariboo–Chilcotin ecosystems.
At McKinley Lake, there was a clear downward trend in sucker productionwith increasing density of retained aspen, which supports the findings ofHuffman et al. (1999). Although differences in sucker counts between the retention treatments were large at McKinley Lake, it was difficult to identifysignificant differences due to the high variability between subplots. Significantdifferences in sucker densities were found only in 2001, and only between thecomplete removal and 2000–2800 aspen stems ha-1 treatments (28 187 versus344 suckers ha-1). A similar lack of significance, in spite of definite trends,was also observed in the IDFxm subzone of the Cariboo–Chilcotin (New-some et al. 2004a). In contrast, a study in the SBPSxc subzone found the firstyear post-treatment sucker density of approximately 100 000 suckers ha-1
in the complete removal treatment was significantly higher than that of anytreatment where aspen was retained (Newsome et al. 2006).
The density of suckers that appeared within 2 years of complete aspen re-moval (0 stems ha-1) at McKinley Lake was similar to the density thatdeveloped at the above-mentioned IDFxm site (Newsome et al. 2004a), butless than one-third of the density that developed at the SBPSxc site (New-some et al. 2006). A combination of factors may contribute to differences in
sucker production at different sites. The literature, summarized by Frey et al.(2003), suggests that sucker initiation is governed mainly by growth regula-tors (e.g., hormones and carbohydrates) that affect the expression of apicaldominance, and is further influenced by soil temperature, moisture, and nu-trient conditions. Genetic differences between aspen clones also play a role.Hence, retaining residual aspen stems discourages sucker initiation throughthe expression of apical dominance, and through the creation of shade that restricts soil warming.
Following the initiation of aspen suckers, their survival and growth areinfluenced by the availability of light, nutrients, and warm soil conditions.The presence of residual aspen lessens the availability of these resources. AtMcKinley Lake, aspen suckers increased in height at an average rate of ap-proximately 20 cm year-1. Sucker height did not differ significantly betweenthe various aspen retention treatments applied at McKinley Lake, whichagrees with other Cariboo–Chilcotin studies (Newsome et al. 2004a, 2006),but contrasts with studies in the boreal where sucker height was more re-sponsive than sucker density to variation in the level of aspen retention (P.Comeau, pers. comm., Jan. 2006). Despite the lack of significant differencesin sucker height between aspen retention treatments at McKinley Lake, atleast some suckers in the complete removal treatment had grown to ≥1.3 mwithin 4 years of cutting (i.e., tall enough to be included in measure-ments). The presence of even moderate densities of faster-growing suckerscould influence the need for additional vegetation management treatmentsfollowing complete aspen removal.
The literature also suggests that sucker initiation, survival, and growth canbe influenced to some extent by treatment timing and soil disturbance. Re-moving aspen early in the growing season will stimulate earlier initiation ofsuckers, increasing their exposure to warm soil conditions during the grow-ing season (Frey et al. 2003). Cutting treatments at McKinley Lake andrelated Cariboo–Chilcotin studies (Newsome et al. 2004a, 2006) were appliedduring early summer (usually July), which is optimal for minimizing sucker-ing (Hart and Comeau 1992). Fraser et al. (2004) also found that woundingaspen roots during harvesting or site preparation increases sucker initiationand growth rates. No site preparation treatments were applied at McKinleyLake, which helps account for the relatively low densities of aspen in the 15-year-old stand.
Target lodgepole pine were selected at the McKinley Lake site to allow peri-odic monitoring of the performance of pine that had been determined, at age 12, to be either “free-growing” or “not free-growing” with regard to thepresence of overtopping vegetation. The free-growing assessment was madeaccording to newly revised guidelines that allowed tall vegetation to be pre-sent within one quadrant of a 1-m cylinder (B.C. Ministry of Forests 2002).Although efforts were made to select pairs of free-growing and not free-growing pine that were of similar height, baseline data revealed thatfree-growing pine were significantly taller than not free-growing pine, andalso had larger dbh and smaller . This reflects that, prior to treatment, atleast some of the free-growing pine had already been growing in less compet-itive neighbourhoods, and had benefitted from greater resource availability.
5.2 Free-growing andNot Free-growing
Target Pine
By 2003, lodgepole pine in the free-growing group had better vigour thanthose in the not free-growing group, and were significantly larger accordingto all measures of growth. These results contrast with stand-level responsesin this study, where there were no significant differences in lodgepole pinesize as a result of the different levels of aspen retention, even between thecomplete aspen removal treatment and the untreated control. In the retro-spective study (Newsome et al. 2003), stem diameter of 10- to 11-year-oldlodgepole pine was significantly reduced by tall aspen densities over 5000stems ha-1, and the effects of competition became even more pronounced asstands aged. According to those results, the competitive effects of aspen onpine tended to manifest when SBSdw stands were about 10 years old. Howev-er, there was variation among stands within the same ecosystem, probablybecause of local differences in aspen clone characteristics, conifer and aspenhealth, and the impacts of wildlife.
The size of the neighbourhood within which surrounding trees affectedgrowth of the free-growing and not free-growing pine at McKinley Lake wasexamined using Spearman’s rank correlation analysis. Overall, the correla-tions between broadleaf density and lodgepole pine size were weak, but theywere slightly better when broadleaves were considered within a 1.78-m ratherthan a 3.99-m radius of the target pine. Correlations were also stronger forpine diameter than for height. The 1.78-m radius neighbourhood size in 15-year-old SBSdw pine–aspen stands is consistent with retrospective studyresults, where correlations also weakened using larger (or smaller) neigh-bourhood sizes (Newsome et al. 2003). In contrast, a smaller neighbourhoodradius of 1.0 m was identified for lodgepole pine in the IDFxm subzone(Newsome et al. 2004a), and a neighbourhood radius of 2.56 m or greaterwas identified in the SBPSxc (Newsome et al. 2006). Differences in the size ofcompetitive neighbourhoods may be related to the height differentials be-tween broadleaves and pine. In the above-mentioned studies, for example,aspen at the IDFxm site were 1.5–1.7 times as tall as pine, whereas they were2.2–3.2 times as tall at the SBPSxc site. Tall individuals capture more lightthan shorter individuals (Keddy 1990), and they also cast shade over a greater distance.
The effectiveness of broadleaf abundance variables as competition indicesto predict the competitive effects of aspen on lodgepole pine has been inves-tigated throughout the Cariboo–Chilcotin pine–aspen competition project.Tall aspen density has consistently been the best predictor of lodgepole pinestem diameter growth, and tall aspen basal area has been second best (New-some et al. 2003, 2004a, 2004b, 2006). In contrast, at McKinley Lake, tallbroadleaf basal area was a slightly better predictor of 3-year lodgepole pinediameter growth (R2=0.257) than tall broadleaf density (R2=0.240). Comeau(2002) found that aspen basal area was a better predictor than aspen densityof light availability in the understorey of 10- to 30-year-old boreal aspenstands. Comeau also notes that basal area, which accounts for both densityand size of aspen, may be useful as a more general competition index, suit-able for application across a range of stands of different ages, sizes, ordensities within a single ecosystem. Density, on the other hand, often onlyworks well as a site- and age-specific competition index (P. Comeau, pers.comm., Jan. 2006).
At McKinley Lake, the best relationship was obtained when the regressionmodel included both free-growing and not free-growing pine, rather than
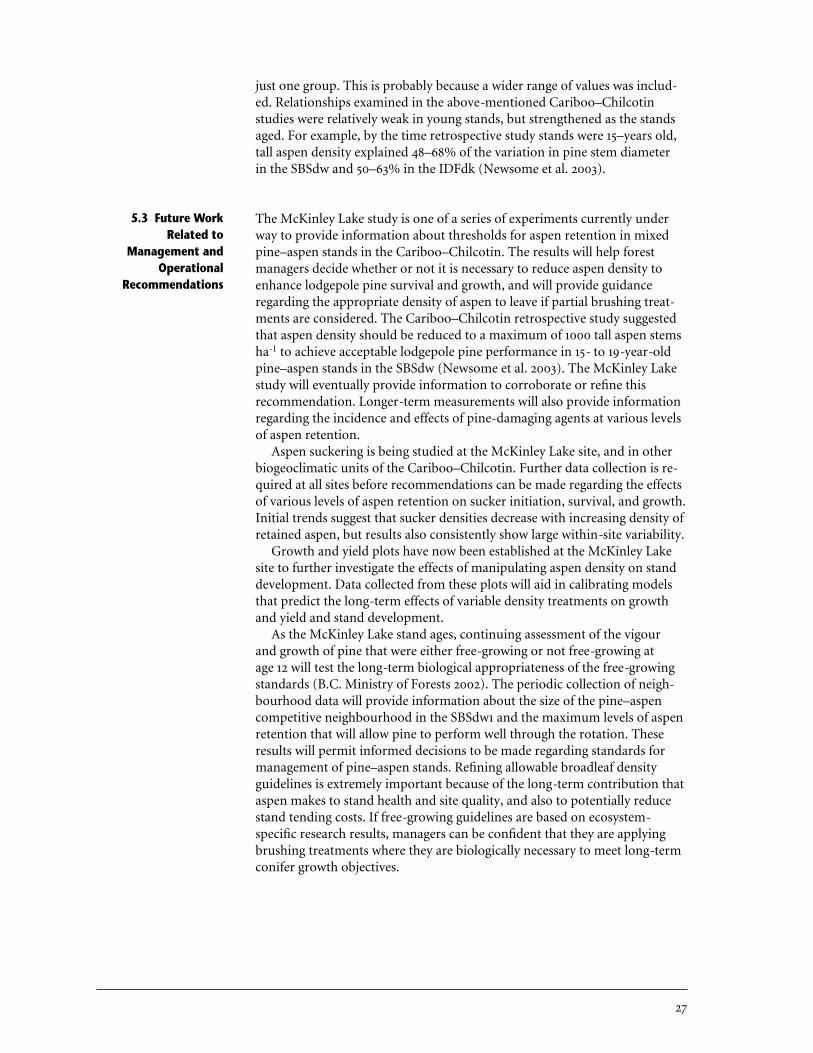
just one group. This is probably because a wider range of values was includ-ed. Relationships examined in the above-mentioned Cariboo–Chilcotinstudies were relatively weak in young stands, but strengthened as the standsaged. For example, by the time retrospective study stands were 15–years old,tall aspen density explained 48–68% of the variation in pine stem diameter in the SBSdw and 50–63% in the IDFdk (Newsome et al. 2003).
The McKinley Lake study is one of a series of experiments currently underway to provide information about thresholds for aspen retention in mixedpine–aspen stands in the Cariboo–Chilcotin. The results will help forestmanagers decide whether or not it is necessary to reduce aspen density to enhance lodgepole pine survival and growth, and will provide guidance regarding the appropriate density of aspen to leave if partial brushing treat-ments are considered. The Cariboo–Chilcotin retrospective study suggestedthat aspen density should be reduced to a maximum of 1000 tall aspen stemsha-1 to achieve acceptable lodgepole pine performance in 15- to 19-year-oldpine–aspen stands in the SBSdw (Newsome et al. 2003). The McKinley Lakestudy will eventually provide information to corroborate or refine this recommendation. Longer-term measurements will also provide information regarding the incidence and effects of pine-damaging agents at various levelsof aspen retention.
Aspen suckering is being studied at the McKinley Lake site, and in otherbiogeoclimatic units of the Cariboo–Chilcotin. Further data collection is re-quired at all sites before recommendations can be made regarding the effectsof various levels of aspen retention on sucker initiation, survival, and growth.Initial trends suggest that sucker densities decrease with increasing density ofretained aspen, but results also consistently show large within-site variability.
Growth and yield plots have now been established at the McKinley Lakesite to further investigate the effects of manipulating aspen density on standdevelopment. Data collected from these plots will aid in calibrating modelsthat predict the long-term effects of variable density treatments on growthand yield and stand development.
As the McKinley Lake stand ages, continuing assessment of the vigour and growth of pine that were either free-growing or not free-growing at age 12 will test the long-term biological appropriateness of the free-growingstandards (B.C. Ministry of Forests 2002). The periodic collection of neigh-bourhood data will provide information about the size of the pine–aspencompetitive neighbourhood in the SBSdw1 and the maximum levels of aspenretention that will allow pine to perform well through the rotation. These results will permit informed decisions to be made regarding standards formanagement of pine–aspen stands. Refining allowable broadleaf densityguidelines is extremely important because of the long-term contribution thataspen makes to stand health and site quality, and also to potentially reducestand tending costs. If free-growing guidelines are based on ecosystem-specific research results, managers can be confident that they are applyingbrushing treatments where they are biologically necessary to meet long-termconifer growth objectives.
5.3 Future WorkRelated to
Management andOperational
Recommendations
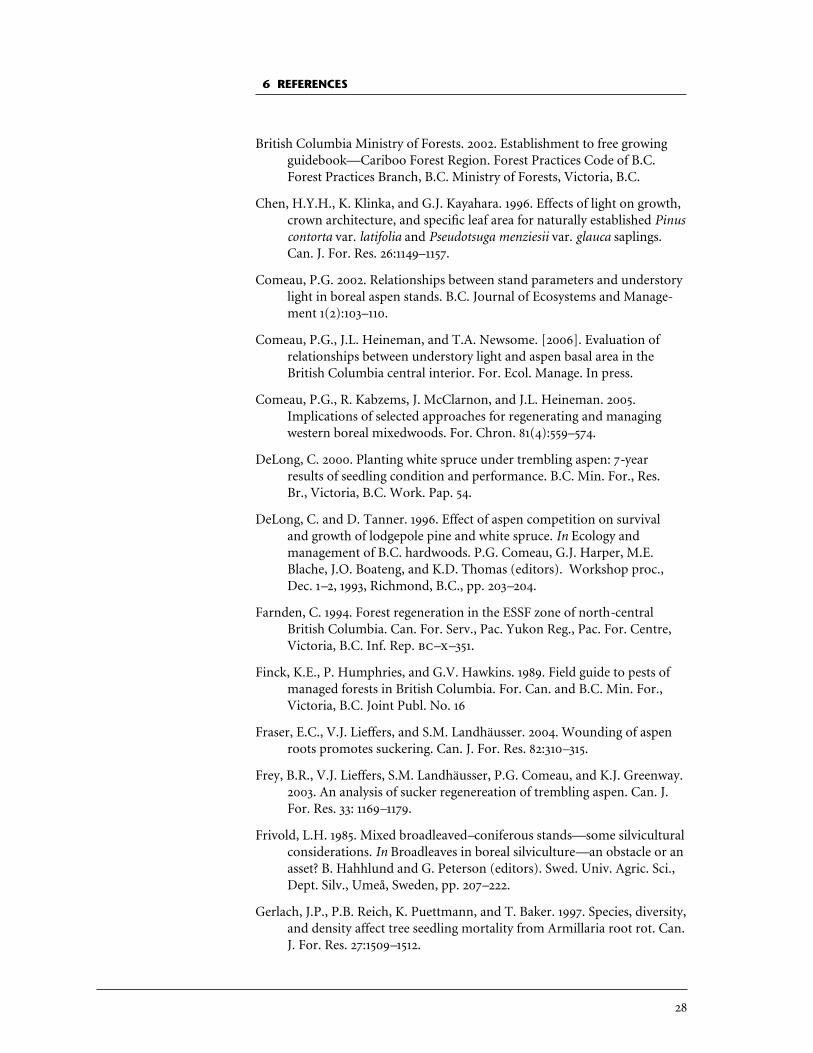
6 REFERENCES
British Columbia Ministry of Forests. 2002. Establishment to free growingguidebook—Cariboo Forest Region. Forest Practices Code of B.C. Forest Practices Branch, B.C. Ministry of Forests, Victoria, B.C.
Chen, H.Y.H., K. Klinka, and G.J. Kayahara. 1996. Effects of light on growth,crown architecture, and specific leaf area for naturally established Pinuscontorta var. latifolia and Pseudotsuga menziesii var. glauca saplings.Can. J. For. Res. 26:1149–1157.
Comeau, P.G. 2002. Relationships between stand parameters and understorylight in boreal aspen stands. B.C. Journal of Ecosystems and Manage-ment 1(2):103–110.
Comeau, P.G., J.L. Heineman, and T.A. Newsome. [2006]. Evaluation of relationships between understory light and aspen basal area in theBritish Columbia central interior. For. Ecol. Manage. In press.
Comeau, P.G., R. Kabzems, J. McClarnon, and J.L. Heineman. 2005. Implications of selected approaches for regenerating and managingwestern boreal mixedwoods. For. Chron. 81(4):559–574.
DeLong, C. 2000. Planting white spruce under trembling aspen: 7-year results of seedling condition and performance. B.C. Min. For., Res. Br., Victoria, B.C. Work. Pap. 54.
DeLong, C. and D. Tanner. 1996. Effect of aspen competition on survival and growth of lodgepole pine and white spruce. In Ecology and management of B.C. hardwoods. P.G. Comeau, G.J. Harper, M.E.Blache, J.O. Boateng, and K.D. Thomas (editors). Workshop proc.,Dec. 1–2, 1993, Richmond, B.C., pp. 203–204.
Farnden, C. 1994. Forest regeneration in the ESSF zone of north-centralBritish Columbia. Can. For. Serv., Pac. Yukon Reg., Pac. For. Centre,Victoria, B.C. Inf. Rep. ––351.
Finck, K.E., P. Humphries, and G.V. Hawkins. 1989. Field guide to pests ofmanaged forests in British Columbia. For. Can. and B.C. Min. For.,Victoria, B.C. Joint Publ. No. 16
Fraser, E.C., V.J. Lieffers, and S.M. Landhäusser. 2004. Wounding of aspenroots promotes suckering. Can. J. For. Res. 82:310–315.
Frey, B.R., V.J. Lieffers, S.M. Landhäusser, P.G. Comeau, and K.J. Greenway.2003. An analysis of sucker regenereation of trembling aspen. Can. J.For. Res. 33: 1169–1179.
Frivold, L.H. 1985. Mixed broadleaved–coniferous stands—some silviculturalconsiderations. In Broadleaves in boreal silviculture—an obstacle or anasset? B. Hahhlund and G. Peterson (editors). Swed. Univ. Agric. Sci.,Dept. Silv., Umeå, Sweden, pp. 207–222.
Gerlach, J.P., P.B. Reich, K. Puettmann, and T. Baker. 1997. Species, diversity,and density affect tree seedling mortality from Armillaria root rot. Can.J. For. Res. 27:1509–1512.
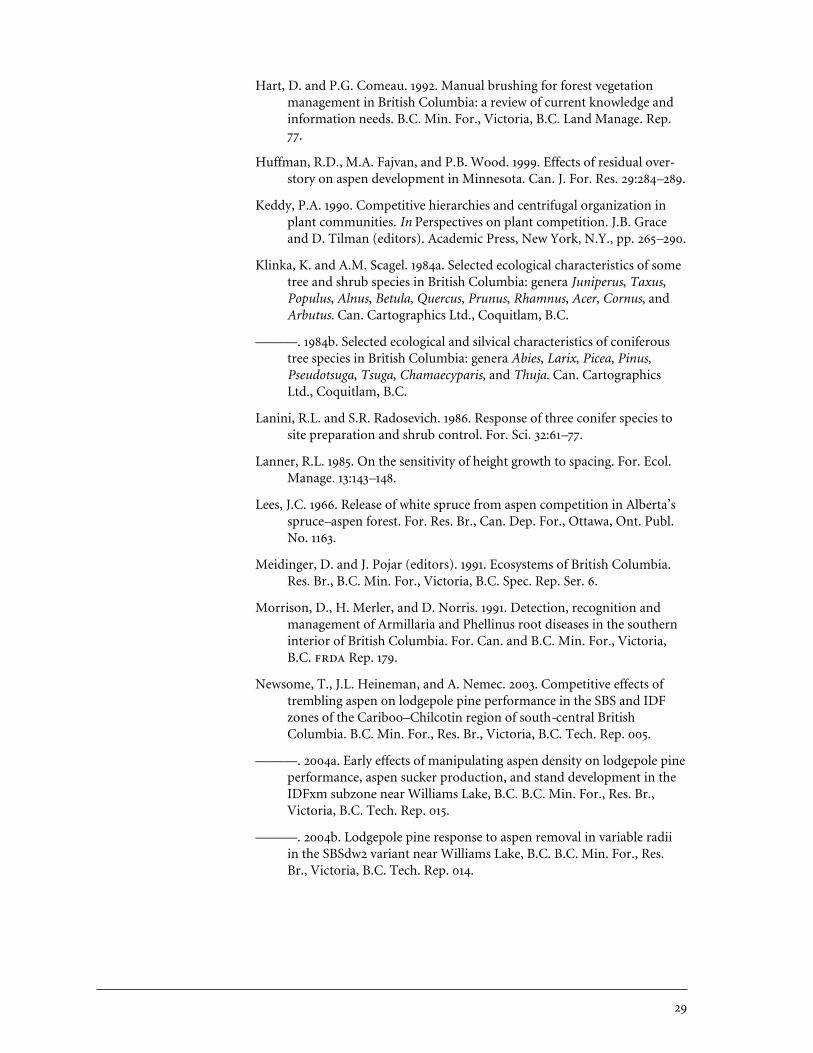
Hart, D. and P.G. Comeau. 1992. Manual brushing for forest vegetationmanagement in British Columbia: a review of current knowledge andinformation needs. B.C. Min. For., Victoria, B.C. Land Manage. Rep.77.
Huffman, R.D., M.A. Fajvan, and P.B. Wood. 1999. Effects of residual over-story on aspen development in Minnesota. Can. J. For. Res. 29:284–289.
Keddy, P.A. 1990. Competitive hierarchies and centrifugal organization inplant communities. In Perspectives on plant competition. J.B. Graceand D. Tilman (editors). Academic Press, New York, N.Y., pp. 265–290.
Klinka, K. and A.M. Scagel. 1984a. Selected ecological characteristics of sometree and shrub species in British Columbia: genera Juniperus, Taxus,Populus, Alnus, Betula, Quercus, Prunus, Rhamnus, Acer, Cornus, andArbutus. Can. Cartographics Ltd., Coquitlam, B.C.
———. 1984b. Selected ecological and silvical characteristics of coniferoustree species in British Columbia: genera Abies, Larix, Picea, Pinus,Pseudotsuga, Tsuga, Chamaecyparis, and Thuja. Can. CartographicsLtd., Coquitlam, B.C.
Lanini, R.L. and S.R. Radosevich. 1986. Response of three conifer species tosite preparation and shrub control. For. Sci. 32:61–77.
Lanner, R.L. 1985. On the sensitivity of height growth to spacing. For. Ecol.Manage. 13:143–148.
Lees, J.C. 1966. Release of white spruce from aspen competition in Alberta’sspruce–aspen forest. For. Res. Br., Can. Dep. For., Ottawa, Ont. Publ.No. 1163.
Meidinger, D. and J. Pojar (editors). 1991. Ecosystems of British Columbia.Res. Br., B.C. Min. For., Victoria, B.C. Spec. Rep. Ser. 6.
Morrison, D., H. Merler, and D. Norris. 1991. Detection, recognition andmanagement of Armillaria and Phellinus root diseases in the southerninterior of British Columbia. For. Can. and B.C. Min. For., Victoria,B.C. Rep. 179.
Newsome, T., J.L. Heineman, and A. Nemec. 2003. Competitive effects oftrembling aspen on lodgepole pine performance in the SBS and IDFzones of the Cariboo–Chilcotin region of south-central British Columbia. B.C. Min. For., Res. Br., Victoria, B.C. Tech. Rep. 005.
———. 2004a. Early effects of manipulating aspen density on lodgepole pineperformance, aspen sucker production, and stand development in theIDFxm subzone near Williams Lake, B.C. B.C. Min. For., Res. Br., Victoria, B.C. Tech. Rep. 015.
———. 2004b. Lodgepole pine response to aspen removal in variable radiiin the SBSdw2 variant near Williams Lake, B.C. B.C. Min. For., Res.Br., Victoria, B.C. Tech. Rep. 014.
———. 2006. Early effects of manipulating aspen density and spatialarrangement on lodgepole pine performance, aspen sucker production,and stand development in an 11-year-old stand in the SBPSxc subzoneof south-central British Columbia. B.C. Min. For. Range, Res. Br., Victoria, B.C. Tech. Rep. 029.
Pastor, J. 1990. Nutrent cycling in aspen ecosystems. In Aspen symp. ’89,proc. U.S. Dep. Agric. For. Serv., N. Central For. Exp. Sta., Gen. Tech.Rep. –140.
Peterson, E.B. and N. M. Peterson. 1995. Aspen managers’ handbook forBritish Columbia. For. Can. and B.C. Min. For., Victoria, B.C. Rep. 230.
Prévost, M. and D. Pothier. 2003. Partial cuts in a trembling aspen–coniferstand: effects on microenvironmental conditions and regeneration dynamics. Can. J. For. Res. 33:1–15.
Institute, Inc. 1996. / software: changes and enhancementsthrough release 6.11. Institute Inc., Cary, N.C.
———. 1999. user’s guide: statistics. Institute Inc., Cary, N.C.
Simard, S.W., J.L. Heineman, W.J. Mather, D.L. Sachs, and A. Vyse. 2001. Effects of operational brushing on conifers and plant communities in the southern interior of British Columbia: results from 1991–2000. B.C. Min. For., Res. Br., Victoria, B.C. Land Manage.Handb. 48.
Stathers, R.J. 1989. Summer frost in young forest plantations. For. Can. andB.C. Min. For., Victoria, B.C. Rep. 73.
Steen, O.A. and R.A. Coupé. 1997. A field guide to forest site identificationand interpretation for the Cariboo Forest Region. B.C. Min. For., Victoria, B.C. Land Manage. Handb. 39.
Strong, W.L. and G.H. La Roi. 1983. Root-system morphology of commonboreal forest trees in Alberta, Canada. Can. J. For. Res. 13:1164–1173.
Wolfinger, R. 2000. : a macro for fitting nonlinear mixed models using and . Institute Inc., Cary,N.C.
Wright, E.F., K.D. Coates, C.D. Canham, and P. Bartemucci. 1998. Speciesvariability in growth response to light across climatic regions in northwestern British Columbia. Can. J. For. Res. 28:871–886.
Yang, R.C. 1989. Growth response of white spruce to release from tremblingaspen. For. Can., Northern For. Centre, Edmonton, Alta. Inf. Rep.––302.
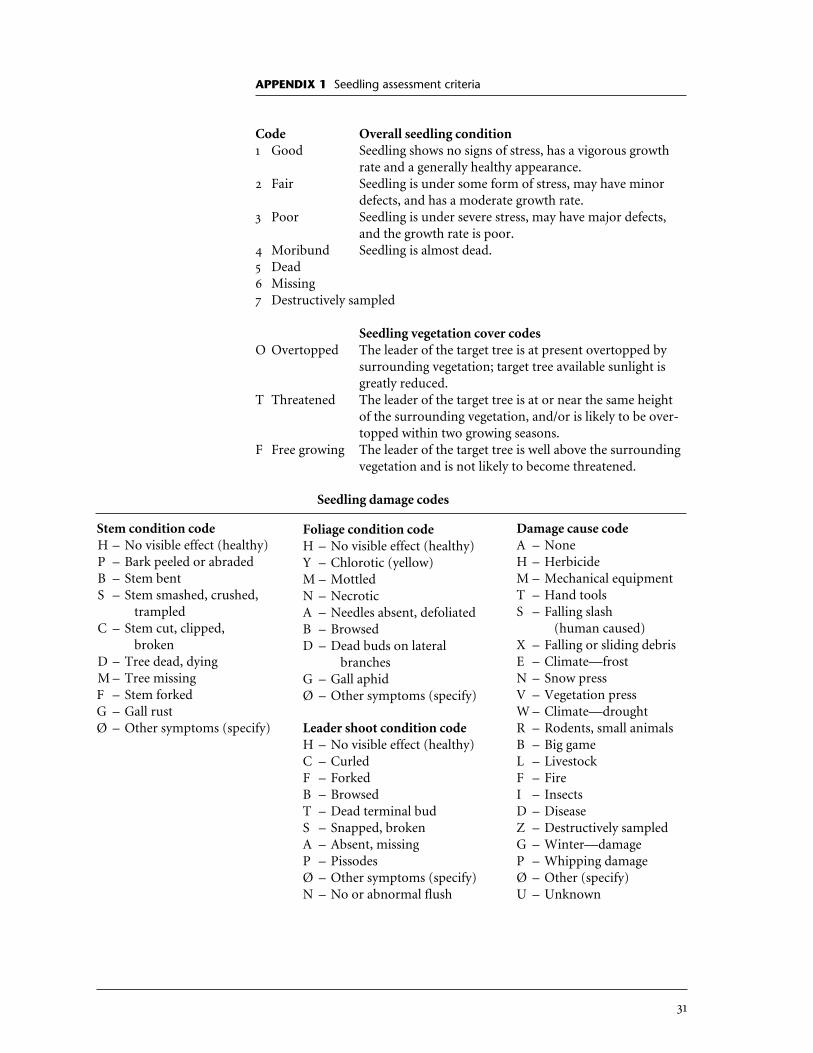
APPENDIX 1 Seedling assessment criteria
Code Overall seedling condition1 Good Seedling shows no signs of stress, has a vigorous growth
rate and a generally healthy appearance.2 Fair Seedling is under some form of stress, may have minor
defects, and has a moderate growth rate.3 Poor Seedling is under severe stress, may have major defects,
and the growth rate is poor.4 Moribund Seedling is almost dead.5 Dead6 Missing7 Destructively sampled
Seedling vegetation cover codesO Overtopped The leader of the target tree is at present overtopped by
surrounding vegetation; target tree available sunlight isgreatly reduced.
T Threatened The leader of the target tree is at or near the same heightof the surrounding vegetation, and/or is likely to be over-topped within two growing seasons.
F Free growing The leader of the target tree is well above the surroundingvegetation and is not likely to become threatened.
Seedling damage codes
Stem condition codeH – No visible effect (healthy)P – Bark peeled or abradedB – Stem bentS – Stem smashed, crushed,
trampledC – Stem cut, clipped,
brokenD – Tree dead, dyingM – Tree missingF – Stem forkedG – Gall rustØ – Other symptoms (specify)
Foliage condition codeH – No visible effect (healthy)Y – Chlorotic (yellow)M – MottledN – NecroticA – Needles absent, defoliatedB – BrowsedD – Dead buds on lateral
branchesG – Gall aphidØ – Other symptoms (specify)
Damage cause codeA – NoneH – HerbicideM – Mechanical equipmentT – Hand toolsS – Falling slash
(human caused)X – Falling or sliding debrisE – Climate—frostN – Snow pressV – Vegetation pressW – Climate—droughtR – Rodents, small animalsB – Big gameL – LivestockF – FireI – InsectsD – DiseaseZ – Destructively sampledG – Winter—damageP – Whipping damageØ – Other (specify)U – Unknown
Leader shoot condition codeH – No visible effect (healthy)C – CurledF – ForkedB – BrowsedT – Dead terminal budS – Snapped, brokenA – Absent, missingP – PissodesØ – Other symptoms (specify)N – No or abnormal flush