Embed Size (px)
Citation preview

© 2005, Security Analysts Association of Japan
1
Feature Article: Asset-Backed Securities
Effects of Valuation Model on RMBS Investment
Research Institute of Asset Management, Asset Management Headquarters, Mizuho Trust and Banking Co., Ltd.
Hiroshi Kasari, Chief Researcher
(Chartered Member of the Security Analysts Association of Japan)Atsushi Kaji, Senior Researcher
(Chartered Member of the Security Analysts Association of Japan)Jun Kataoka, Senior Researcher
(Chartered Member of the Security Analysts Association of Japan)
Table of Contents
1. Introduction
2. Conditional Prepayment Rate (CPR) Model
3. Interest Rate Model
4.Assessment of RMBS (Residential mortgage-backed Housing Loan Corporation securities)
5.Conclusion
Residential mortgage-backed Housing Loan Corporation securities (RMBS) carry a conditional prepayment option which straight bonds do not. Therefore, investors need some common yardsticks to assess indicators in relation to such securities. In general, such assessment requires a conditional prepayment model and an interest rate model; however, employing them without a good understanding of characteristics specific to each makes it difficult to effectively carry out investment estimation and risk assessment. In this context, this study conducts assessment in relation to the characteristics of RMBS on the condition that the assessment procedure considered is practical from the viewpoint of investors.
Hiroshi Kasari: Graduated from the Department of Urban Engineering, Faculty of Technology, University of Tokyo, in 1988 and
joined Yasuda Trust and Banking in the same year. In October 2000, he joined the Research Institute of Asset Management,
Mizuho Trust and Banking.
Atsushi Kaji: Graduated from the Faculty of Economics, University of Tokyo, in 1990 and joined Yasuda Trust and Banking in
the same year. In October 2000, he joined the Research Institute of Asset Management, Mizuho Trust and Banking.
Jun Kataoka: Obtaining a master's degree from the Institute of Science and Engineering Graduate School, Keio University, in
1990, he then joined Yasuda Trust and Banking. In October 2000, he joined the Research Institute of Asset Management,
Mizuho Trust and Banking, through work at the Mitsubishi Research Institute.
© 2005, Security Analysts Association of Japan
2
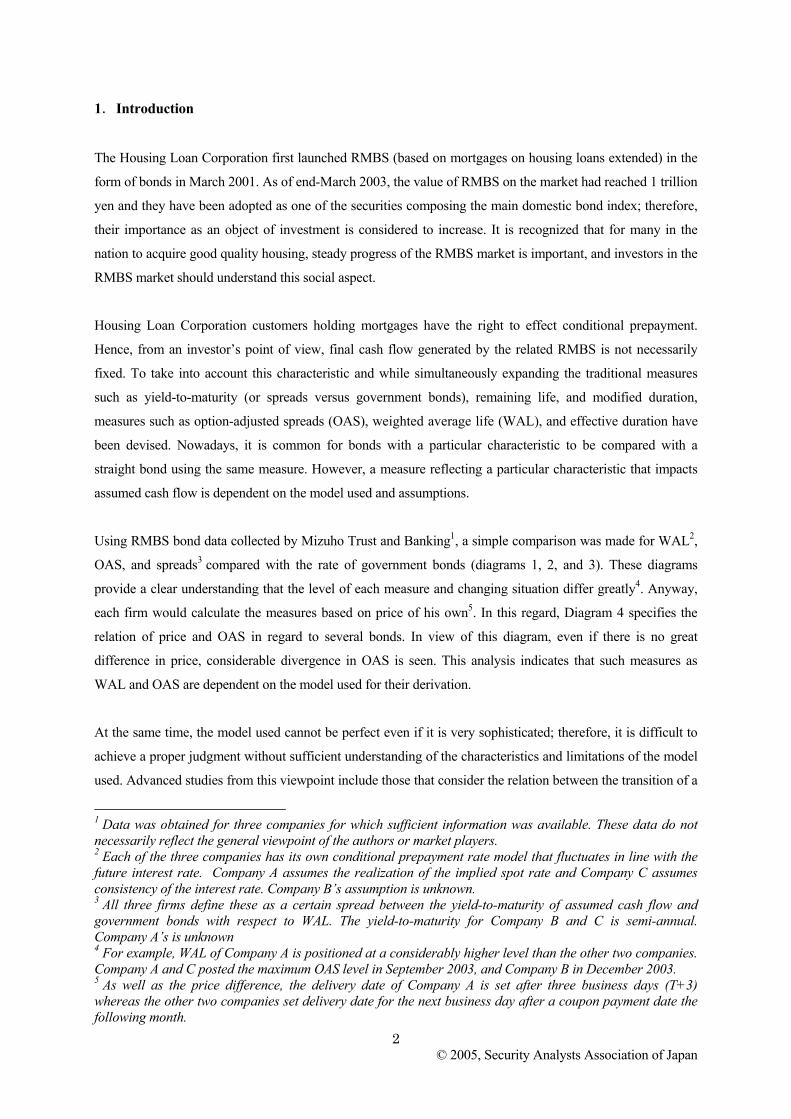
1.Introduction
The Housing Loan Corporation first launched RMBS (based on mortgages on housing loans extended) in the
form of bonds in March 2001. As of end-March 2003, the value of RMBS on the market had reached 1 trillion
yen and they have been adopted as one of the securities composing the main domestic bond index; therefore,
their importance as an object of investment is considered to increase. It is recognized that for many in the
nation to acquire good quality housing, steady progress of the RMBS market is important, and investors in the
RMBS market should understand this social aspect.
Housing Loan Corporation customers holding mortgages have the right to effect conditional prepayment.
Hence, from an investor’s point of view, final cash flow generated by the related RMBS is not necessarily
fixed. To take into account this characteristic and while simultaneously expanding the traditional measures
such as yield-to-maturity (or spreads versus government bonds), remaining life, and modified duration,
measures such as option-adjusted spreads (OAS), weighted average life (WAL), and effective duration have
been devised. Nowadays, it is common for bonds with a particular characteristic to be compared with a
straight bond using the same measure. However, a measure reflecting a particular characteristic that impacts
assumed cash flow is dependent on the model used and assumptions.
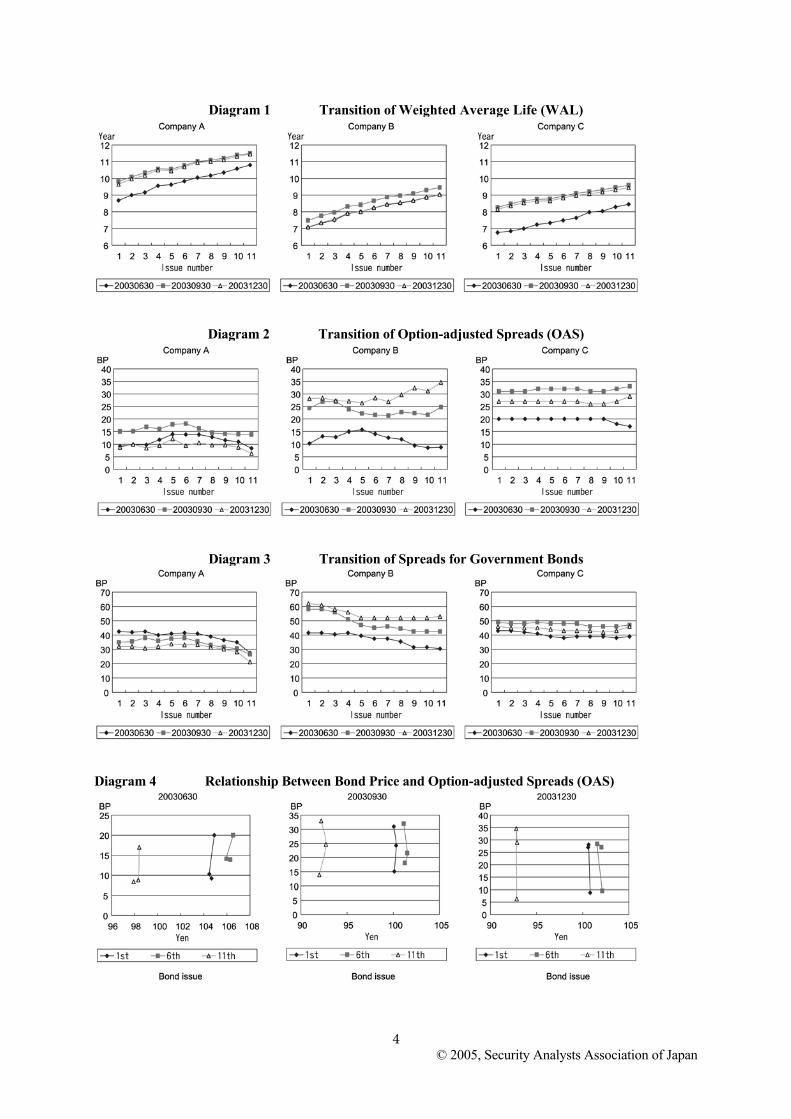
Using RMBS bond data collected by Mizuho Trust and Banking1, a simple comparison was made for WAL2,
OAS, and spreads3 compared with the rate of government bonds (diagrams 1, 2, and 3). These diagrams
provide a clear understanding that the level of each measure and changing situation differ greatly4. Anyway,
each firm would calculate the measures based on price of his own5. In this regard, Diagram 4 specifies the
relation of price and OAS in regard to several bonds. In view of this diagram, even if there is no great
difference in price, considerable divergence in OAS is seen. This analysis indicates that such measures as
WAL and OAS are dependent on the model used for their derivation.
At the same time, the model used cannot be perfect even if it is very sophisticated; therefore, it is difficult to
achieve a proper judgment without sufficient understanding of the characteristics and limitations of the model
used. Advanced studies from this viewpoint include those that consider the relation between the transition of a
1 Data was obtained for three companies for which sufficient information was available. These data do not necessarily reflect the general viewpoint of the authors or market players. 2 Each of the three companies has its own conditional prepayment rate model that fluctuates in line with the future interest rate. Company A assumes the realization of the implied spot rate and Company C assumes consistency of the interest rate. Company B’s assumption is unknown. 3 All three firms define these as a certain spread between the yield-to-maturity of assumed cash flow and government bonds with respect to WAL. The yield-to-maturity for Company B and C is semi-annual. Company A’s is unknown 4 For example, WAL of Company A is positioned at a considerably higher level than the other two companies. Company A and C posted the maximum OAS level in September 2003, and Company B in December 2003. 5 As well as the price difference, the delivery date of Company A is set after three business days (T+3) whereas the other two companies set delivery date for the next business day after a coupon payment date the following month.

© 2005, Security Analysts Association of Japan
3
conditional prepayment rate and MBS price change such as that by Waldman [1992]. On the other hand,
Babbel and Zenios [1992] analyzed the effects on OAS caused by interest rate model parameter variations. In
addition, the effect on MBS price valuation caused by parameter variations of models is considered in the
study of Kariya, Ushiyama and Pliska [2002]. As a result of establishing an assessment procedure that might
be practical from the viewpoint of investors, this study identifies specific effects on the characteristics of
RMBS caused by parameter transition of the model employed. The assessment of attributes in regard to
RMBS is considered below based on the conditional prepayment and interest rate models described, and then
assessment procedures are given.
© 2005, Security Analysts Association of Japan
4
Diagram 1 Transition of Weighted Average Life (WAL)
Diagram 2 Transition of Option-adjusted Spreads (OAS)
Diagram 3 Transition of Spreads for Government Bonds
Diagram 4 Relationship Between Bond Price and Option-adjusted Spreads (OAS)

© 2005, Security Analysts Association of Japan
5
2. Conditional Prepayment Rate Model
2.1 Advanced studies
Concepts in advanced studies are generally classified into 1) methods modeling past behavior in relation to
conditional prepayment using statistical techniques, 2) methods explaining and applying an assessment theory
for the prepayment option, and 3) methods estimating an implied conditional prepayment rate that is priced in
the current market price.
A typical example of modeling past behavior in relation to conditional prepayment using a statistical
technique includes that by Schwartz and Torous [1989]. Schwartz and Torous [1989] applied a proportional
hazard model (life-time analysis for a conditional prepayment rate) and analyzed prices of US MBS using a
term structure model of interest rates. In addition, Ichijo and Moridaira [2001] analyzed Japanese housing
loan data using a proportional hazard model and also explained the variables used for a conditional
prepayment model.
A typical example of modeling past behavior in relation to conditional prepayment while applying an
assessment theory includes that by Stanton [1995]. Stanton [1995] analyzed prices of US MBS using an
interest rate model. His method recognizes past behavior in relation to conditional prepayment as an interest
rate option and considers the housing loan pool of collateral for MBS in the US as the collective of options
having various strike prices. In addition, Kariya, Ushiyama and Pliska [2002] proposes this method to analyze
prices of RMBS to consider the fluctuation in housing prices while applying an assessment theory for the
prepayment option.
A typical example of estimating an implied conditional prepayment rate inherent in the current market price
includes the model proposed by Cheyette [1993]. Here, something that defines the kind of conditional
prepayment rate model is initially determined, then necessary parameters are determined in conformity with
market price. This method is similar to implied volatility being derived from market price in the Black-
Scholes model; meanwhile, this method is also employed to estimate a conditional prepayment rate that the
market discounts in the assessment period.
Ichijo [2003] attempted to mix a proportional hazard model and an assessment model. An example studied by
Yamamoto and Zenios [1993] of an attempt to model a conditional prepayment rate using the neural network
method in addition to the aforementioned three methods is given in this report.
In the meantime, any attempt to model a conditional prepayment rate is really just the same as “modeling
complicated human behavior”; therefore, the result of such an attempt is likely to be affected by various
national identities and social systems. Advanced studies that have been referred to were mainly based on
examples in the US; on the other hand, various studies, such as the method used by Ichijo and Moridaira
© 2005, Security Analysts Association of Japan
6
[2003], concerning behavior in relation to conditional prepayment, have been made in Japan. These various
studies include examples by Yamagishi, Hatayama and Kakuma [2002] that use a conditional prepayment rate
model considering the seasonal influences specific to Japan such as bonus payments and changes that occur
each fiscal year. In addition, Katsumata [2002] and Tokaku [2003] attempted to perform modeling focusing
on the different patterns of behavior between total redemption and partial redemption in Japan.
2.2 Our approach
Almost all the studies that have been referred to have employed detailed data in regard to each loan as original
data and have modified them appropriately. From the viewpoint of such entities as issuing organizations that
set issuing conditions and securities companies engaged in composing the securities, this approach is taken as
a matter of course. However, from the viewpoint of investors who attempt to find the most significant
meaning with regard to the final cash flow generated by the securities, this approach is not necessarily
essential6. For this reason, we adopted the approach of Kataoka and Tamura [2003] which assumes a priori
explaining variables and a function for a conditional prepayment rate (based on principal studies) and then
estimates the parameters considering the practical conditional prepayment rate of each disclosed bond
(practical CPR)7.
2.3 Conditional prepayment rate model
The main reasons that loan debtors implement conditional prepayment are as follows: 1) to ease the interest
burden as a result of refinancing a lower interest housing loan rather than the current housing loan; 2) to sell
house; and 3) by obtaining excess cash. In fact, considering the model of a conditional prepayment rate to be
obtained in a concrete manner from advanced studies, it will generally specify the ability to explain behavior
in relation to conditional prepayment as a result of properly adapting such factors as elapsed time8, interest
rate incentive “i” (=rt-r0)9, and seasonality.
Given this factor, in this case, assuming that a conditional prepayment rate can be explained by two variables,
such as elapsed time and interest rate incentive10, parameters were estimated using the data in regard to an
actual conditional prepayment rate of the outstanding RMBS obtained using the homepage of the Housing
Loan Corporation.
6 The Housing Loan Corporation commenced the disclosure of each housing loan from November 2003. 7 This concept enables us to find similarities in thinking when estimating a conditional prepayment rate (CPR) that is inherent in the market price in that the “sharing of open information” is utilized properly, while putting an empirical base to a statistical model. 8 Studies using elapsed months after starting point of a loan (or issue of securities) have mainly been performed. 9 The differential between the current fixed interest rate on a housing loan, “r0”, and the interest rate on a housing loan, “r1”, where a financing contract is newly fixed at point “t” after implementing financing. 10 Seasonality is an important element in explaining a conditional prepayment rate. However, almost all the effects are supposed to be set off in the process of calculating the current value of cash flow accumulated over 30 years. For this reason, we adopted a simpler model.

© 2005, Security Analysts Association of Japan
7
Specifically, a conditional prepayment rate, C t, was formulated as follows:
where “Tt” is the function of elapsed month “t” after bond issuance and “It” is the function of interest rate
incentive “i.”
In the first place, as for “Tt,” the same functional type as the model of a conditional prepayment rate of the
“PSA” type was assumed11 (where a conditional prepayment rate increases in proportion with elapsed months
before reaching “η,” and after reaching “η” it remains constant.)
On the other hand, interest rate incentive “i”, a differential between the current borrowing rate of interest and
the refinancing interest rate, is defined as the remaining balance of the par rate of a 5-year government bond
after deduction of weighted-average coupons (WAC). “It” was defined as an exponential function using
advanced studies as a reference such as 1) where the interest rate incentive increases as a result of the decrease
in the par rate of government bonds, conditional prepayment increases, and 2) where the interest rate incentive
increases, the increase in conditional prepayment rate is accelerated.
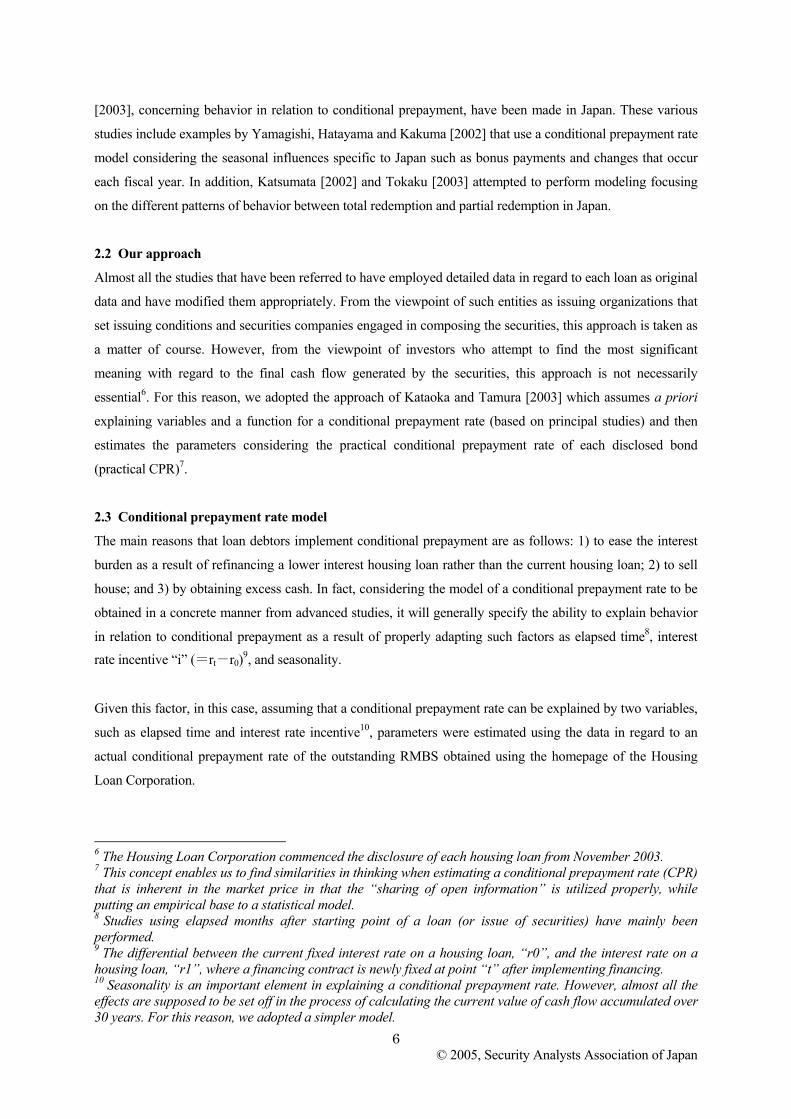
In this case, “I” is the time lag. “l =2” was assumed in advance. Diagram 5 shows a conditional prepayment
rate model. The estimation results (= tallying between an actual CRP model and a model CRP) are indicated
in diagrams 6 and 7).
Diagram 5 Image of a Conditional Prepayment Rate Model
11 According to the results of both domestic and foreign studies, the number of months necessary for saturation (number of months to attain a certain conditional prepayment rate) is supposed to be 30 to 60 months. However, the effect of burnout is not taken into consideration.
© 2005, Security Analysts Association of Japan
8
Diagram 6 Actual CPR and Model CPR (1st bond issue)
Diagram 7 Actual CPR and Model CPR (6th bond issue)
3. Interest rate model
12
In this study, a 3-factor CIR model was selected from among the equilibrium models. The two main reasons
the equilibrium model was adopted instead of an arbitrage-free model that is generally used by securities
companies are that, firstly, investors need to determine whether it is undervalued or overvalued from the long-
term point of view, and secondly, therefore, continuity of the adopted model is important13.
The concrete model is as follows:
12 A detailed explanation of the interest rate model is omitted because of space limitations. 13 See Tuckman(1995)for reference for comparing the equilibrium model and the arbitrage-free model.

© 2005, Security Analysts Association of Japan
9
In this case, “r” indicates a short-term interest rate. “F,” “m,” “Z,” and “a” represent a three-dimensional,
vertical vector, where “F” = factor (variable), “m” = regression level (parameter), “Z” = three-dimensional
independent Winner process (variable), and “a” = coefficient vector to transform from factor to short-term
interest rate (parameter). Moreover, each symbol such as “c,” “v,” and the square root of “F” represents a 3×3
matrix; in particular, “v” and the square root of “F” represent a diagonal matrix where “C” = factor regression
velocity (parameter), “v” = volatility (parameter), and the square root of “F” = factor (variable).
In addition, the spot rate S (T) for remaining period T can be described as follows 14:
where A (T) and Bi (T) are functions of T and parameters.
4. Assessment of RMBS (Residential Mortgage-backed Housing Loan Corporation Securities)
4.1 Assessment Procedure
As indicated above, because conditional prepayment rate changes are affected by future interest rates, it
follows that the cash flow of RMBS can be determined. In this regard, in order to assess RMBS, the future
interest rate is given for a conditional prepayment rate model in some way. The methods below are
considered to obtain the future interest rate.
● One that assumes the current spot rate curve will remain in the future as well.
● One that assumes the future current spot rate curve inherent in the current spot rate curve (=implied spot
rate curve) will be put into practice.
● One that generates several kinds of interest rate paths in the future, using a method such as the Monte
Carlo simulation.
The third method, i.e. the Monte Carlo simulation method, is adopted in this study. The specific procedures
for assessment are generally as follows:
1) As a result of generating three-dimensional normal randoms, stream of factors are generated by assigning
them to “dZ” in Formula 4 15
14 It is notable that the theoretical spot rate given by the equilibrium model sometimes deviates widely from the spot rate for the market (Diagram 9). The theoretical curve coincides with the market curve in the arbitrage-free model.

© 2005, Security Analysts Association of Japan
10
2) As a result of assigning the stream of factors to Formula 6 obtained by 1), the par rate of 5-year
government bonds and the 1-month interest rate are calculated at each point in time (the 10th of each month).
3) The interest rate incentive is calculated by deducting the WAC of each bond from the par rate of 5-year
government bonds16. As a result of calculating a conditional prepayment rate for each bond by assigning the
interest rate incentive obtained and the months elapsed, cash flow is determined17.
4) WAL (weighted average life) is calculated by extracting that part of principal from cash flow obtained in
3).
5) On the other hand, together with OAS in addition to the 1-month interest rate obtained in 2), a deflator
from the beginning point of assessment is calculated.
6) The value of assessment on each path corresponds to the sum of cash flow calculated in 3) divided by
deflators at each point calculated in 5).
Meanwhile, OAS is calculated by performing a convergent calculation so that the average value of an
assessment on each path corresponds to the market price. In addition, the number of path occurrences was
set at 500 times.
4.2 Reassessment of each company
First, in combination with the assessment using our model, we attempt to consider WAL obtained
irrespective of price. Rising interest rates reduce the conditional prepayment rate in the process of
diminishing the interest rate incentive, which leads to the prolongation of WAL. For example, observations
were selected from end-June, end-September, and end-December 2003. For periods from June to
September, the yield curve (= spot rate curve) steepened; however, for December, it stayed (Diagram 8). As
expected, for periods from June to September, WAL at each company gained almost the same amount, and
it thus remained at the same level as that in September till December (Diagram 10)18. On the other hand,
15 To be exact, discretization is observed after rewriting Formula 4 to the relational expression in regard to the risk neutral measure. As a result of discretization, the value of the factor is dependent on a path so that it is liable to result in a minus value. However, where simulation is implemented, such restrictions that prevent it from resulting in a minus value are imposed. 16 The rising loan interest rate after 11 years have passed is taken into consideration in the process of adjusting the interest rate incentive for each security. 17 It is assumed that the Housing Loan Corporation implemented a clean-up call (= the option for the remaining balance to be repayable in a lump sum where the balance of the principal loan amount is less than 10% of the initial loan). 18 WAL (weighted average life) of Company B is exceptional so that (the absolute value of) the variation value to be identified from June to September and the variation value to be identified from September to December is at much the same level; therefore, the model of a conditional prepayment rate provided by this company is unique. For this reason, it is not referred to further when comparing WAL.

© 2005, Security Analysts Association of Japan
11
considering the level of WAL, our assessment and that of Company A is the same, while that of Company
C is lower19. Assuming that there is not a large difference in the conditional prepayment rate model, this
difference is considered to coincide with the assumption of Company C that the yield curve will not move.
In other words, with an upward spot rate curve, the implied spot rate curve tends to stay at a higher level;
therefore, it is deemed that the assumption of Company A that the implied spot rate will be put into practice
results in a low estimated conditional prepayment rate20. Using WAL as a measure for the remaining period
of a straight bond is common; however, as mentioned, it is fundamentally essential that investors have
sufficient understanding of the kind of assumption that has been implemented to obtain WAL in the
calculation.
19 After September, it is observed that WAL obtained by our study outweighs that obtained by Company A. This is probably because estimated cash flow in our study has a tendency to be prolonged as a result of deviation between the theoretical curve and market curve widening for the remaining period up to 10 years (Diagram 9). In addition, it is thought that the large difference between the 6th bond issuance and the 7th bond issuance is attributable to the difference that coincides with the effect of the rising loan interest rate after 11 years have passed (refer to footnote 16). 20 The path of the short-term interest rate generated by Monte Carlo simulation is almost consistent with an instantaneous forward rate curve; therefore, WAL provided by our study is almost consistent with WAL provided by Company A where it is assumed that the same conditional prepayment rate model is used.
Diagram 8 Change in Yield Curve Diagram 9 Deviation Between Theoretical Curve and Market Curve

© 2005, Security Analysts Association of Japan
12
Diagram10 Comparison of Weighted Average Life (WAL)
Next, the study considers OAS that plays an important role in comparing relative value among several
securities. As for the three points stated previously, OAS provided by each company and OAS estimated by
our study based on the price provided by each company were compared (Diagram 11).
First, it is understandable that OAS estimated by our study is far higher than that provided by each
company21, the main reason probably being the different interest rate models used. It is believed that from
among arbitrage-free models each company employs a logarithm model22; however, such a model tends to
generate an extremely high interest rate path 23,24. Therefore, in a path environment where conditional
prepayment does not occur often as a result of remaining relatively high above a certain interest rate level,
deflators provided by each company are likely to have larger values than those provided by us. This
analysis assumes price as a given value; therefore, the result obtained by our calculation tends to show
OAS as a relatively large value. These differences are so important that it is presumed that, for example,
judgment by employing our OAS is different from that by employing OAS of Company A where RMBS
are compared with government bonds.
Another characteristic is that spread differentials among securities were relatively larger in our assessment. As
shown in Diagram 11, the spread differential among securities stays generally within the range of
approximately 5bps. On the other hand, maximum spread differentials obtained by our reassessment reaches
approximately 20bps (Diagram 11) 25. This indicates that employing a different model could have different
results, even if it is a comparison with securities in the RBMS sector.
21 Adjustment provided by Company A is not performed in the estimation (refer to footnote 5). 22 Assessed based on materials provided by each company. 23 Each company generates an interest rate path where they calculate OAS. 24 Refer to Ho and Goodman[2003], etc. 25 The low OAS rate of the 11th bond issue is outstanding; refer to footnote 27.

© 2005, Security Analysts Association of Japan
13
Diagram 11 Comparison of OAS (Original: 1st order; Our estimation: 2nd order)
4.3 Effect of modeling a conditional prepayment rate
This section studies the effect where modeling a conditional prepayment rate overestimates or underestimates
the practical conditional prepayment rate. First, to explain the accuracy of the conditional prepayment rate
employed, the difference between practical CPR and model CPR was 0.0% on average and 1.2% with
standard deviation. Average practical CRP was 3.0%; therefore, the effect of multiplying “Ct,” i.e., an
output of the model by 0.5-1.5 times to be used as a target [i.e., “(3.0±1.2)÷3.0=1.0±0.4,”] was observed.
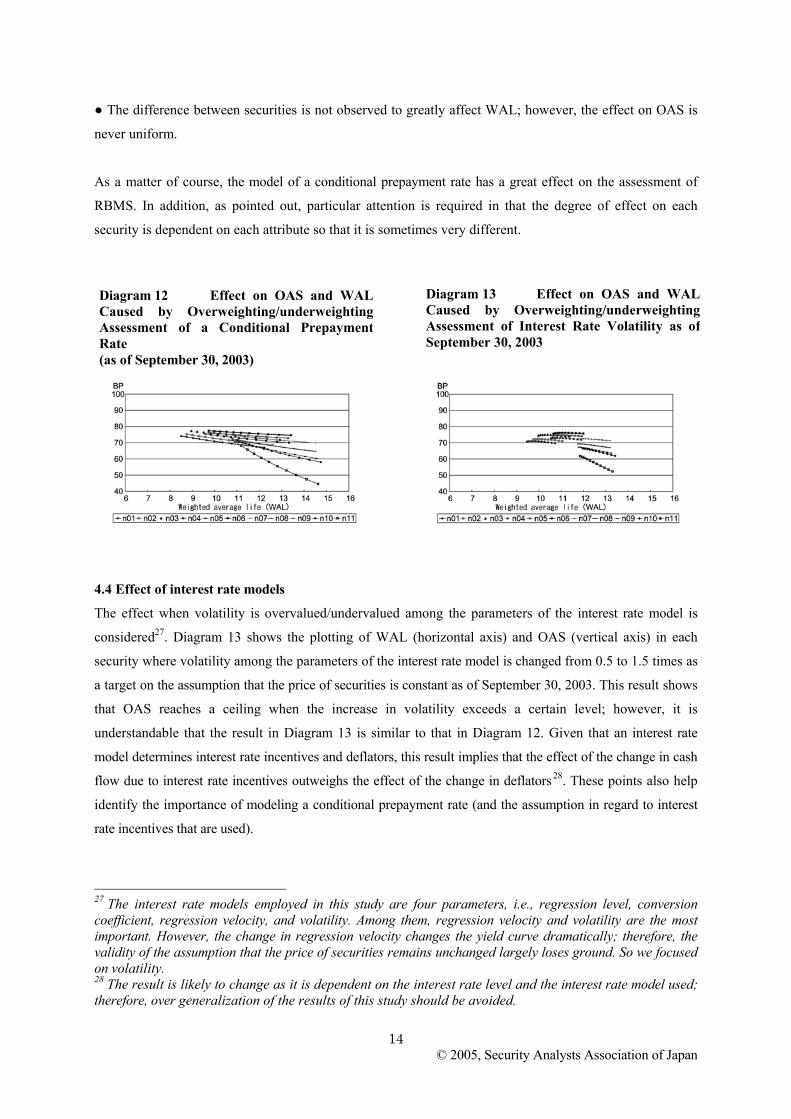
Diagram 12 shows the plotting of WAL (a horizontal axis) and OAS (a vertical axis) for each security
where the multiplying power in each output of the modeling of a conditional prepayment rate is changed on
the assumption that the price of securities is constant as of September 30, 2003. The shortening of WAL and
the expansion of OAS were observed in line with the increase in multiplying power in each output 26. The
following points were noted.
● The variation of WAL is generally four years or less. This implies that WAL varies for roughly half a
year even though the bias of the model of a conditional prepayment rate stays within the range of 10% to
20%.
26 It is as a matter of course that WAL tends to be shortened (or to be prolonged) in line with an overweighting assessment (an underweighting assessment) of a conditional prepayment rate. Meanwhile, it is generally considered that OAS expands (contracts) for the following reason. Where a conditional prepayment rate is overweighted, the cash flow from principal diminishes without any change in deflators; therefore, as a general rule, it is supposed to lead to a rise in stock price. However, as a result of the assumption that the price of securities is constant in this analysis, OAS is supposed to increase. Meanwhile, the main reason for the widely different condition in the fluctuation of each security is likely to be caused by the difference in coupon rate. For example, with two kinds of security where the expiration date, the assumed amortization rate, and WAC are identical, but coupon rates are different, the security with the lower coupon rate exhibits a larger rise in cash flow compared with previous cash flow. For this reason, it is supposed to display a greater rise in price (expanding degree of OAS in this analysis). In fact, OAS of the 11th bond issue that carries an extremely low coupon rate fluctuates markedly compared to others.
© 2005, Security Analysts Association of Japan
14
● The difference between securities is not observed to greatly affect WAL; however, the effect on OAS is
never uniform.
As a matter of course, the model of a conditional prepayment rate has a great effect on the assessment of
RBMS. In addition, as pointed out, particular attention is required in that the degree of effect on each
security is dependent on each attribute so that it is sometimes very different.
4.4 Effect of interest rate models
The effect when volatility is overvalued/undervalued among the parameters of the interest rate model is
considered27. Diagram 13 shows the plotting of WAL (horizontal axis) and OAS (vertical axis) in each
security where volatility among the parameters of the interest rate model is changed from 0.5 to 1.5 times as
a target on the assumption that the price of securities is constant as of September 30, 2003. This result shows
that OAS reaches a ceiling when the increase in volatility exceeds a certain level; however, it is
understandable that the result in Diagram 13 is similar to that in Diagram 12. Given that an interest rate
model determines interest rate incentives and deflators, this result implies that the effect of the change in cash
flow due to interest rate incentives outweighs the effect of the change in deflators 28. These points also help
identify the importance of modeling a conditional prepayment rate (and the assumption in regard to interest
rate incentives that are used).
27 The interest rate models employed in this study are four parameters, i.e., regression level, conversion coefficient, regression velocity, and volatility. Among them, regression velocity and volatility are the most important. However, the change in regression velocity changes the yield curve dramatically; therefore, the validity of the assumption that the price of securities remains unchanged largely loses ground. So we focused on volatility. 28 The result is likely to change as it is dependent on the interest rate level and the interest rate model used; therefore, over generalization of the results of this study should be avoided.
Diagram 12 Effect on OAS and WALCaused by Overweighting/underweightingAssessment of a Conditional PrepaymentRate (as of September 30, 2003)
Diagram 13 Effect on OAS and WALCaused by Overweighting/underweightingAssessment of Interest Rate Volatility as ofSeptember 30, 2003
© 2005, Security Analysts Association of Japan
15
5. Conclusion
As we have shown, the indicators regarding attributes (OAS, WAL and so on) are highly dependent on the
relevant model. In consequence, there are many problems where the indicators related to attributes
announced by each organization are used too readily without understanding the introduced premise in the
case of investment judgment and risk management. Institutional investors are required to compare and
study assessment using various models, while being fully aware of 1) the content of the models used in the
market, and 2) popularity of each model in the market. In addition, even if they have their own model, they
should consider investment judgment and risk management methodologies by comparing with models
proposed by other companies, but without having blind trust in them. For additional reference, it is
important to improve analytical methods from the standpoint of both the issuing side and the investment side,
as well as to disclose achievements stemming from improvements in analytical methods. This will promote an
in-depth understanding of RMBS for market participants, consequently contributing to development of the
RMBS market.
In preparing this report, we obtained useful advice from Professor Soichiro Moridaira of Keio University.
We are very grateful to him and hereby express our appreciation. Any misunderstanding in this report is the
responsibility of the relevant authors. In addition, the content of this report does not represent the opinions of
the organization to which the authors belong, but solely their opinions.

© 2005, Security Analysts Association of Japan
16
References
(1) Ichijo, H., S. Moridaira. “Prepayment Analysis of Housing Loans”, working paper of the summer
meeting, JAFEE2001, pp221-239.
(2) Ichijo, H., “Study of the Model of a Conditional Prepayment Housing Loan Rate in Combination with
the Structural Type Approach and Guided Type Approach.” working paper of the summer meeting,
JAFEE2003, pp188-207.
(3) Uchida, J. and Y. Yamagishi. “Viewpoint of Redemption Record Data by the Housing Loan
Corporation”, 2003, “Global Quantitative Research”, Financial Research Center, Nomura Securities,
November 14, 2003.
(4) Kaguraoka, Y., “Assessment of Mortgage-Backed Securities”, Financial Analysts Journal, September
1993, Vol. 31, pp1-10.
(5) Kaji, Atsshi, 2003, “Study of Risk Management for MBS (1) Study of a Conditional Prepayment
Model”, pension fund report, Mizuho Trust and Banking, 2003・4 No. 47, pp46-58.
(6) Kaji, Atsshi, 2003, “Study of Risk Management for MBS (2) Assumption Example of a Conditional
Prepayment Model and MBS Cash Flow”, pension fund report, Mizuho Trust and Banking, 2003・5, No.
pp48, 37-48.
(7) Kataoka, Jun and Y. Tamura, 2003, “CPR Model of RMBS of Housing Loan Corporation by Mean of
Disclosed Data, working paper of the Joint Meeting of Statistics-Related Academic Conference, fiscal 2003,
Japanese Society of Applied Statistics, Biometric Society of Japan, and Japan Statistical Society.
(8) Katsumata, H., 2002, “Analysis of Redemption Record Data by MBS Series, Conditional Prepayment
Rates, Housing Loan Corporation,” September 9, 2002, Nikko, Salomon, and Smith Barney International
Securities.
(9) Katsumata, H., 2002, “A Model Ⅰ・Ⅱ of Conditional Prepayment Rates, Housing Loan Corporation”,
material written for seminar held by Nikko, Salomon, and Smith Barney International Securities, October
23, 2002.
(10) Tokaku, K., 2003, “A New Model of MBS Conditional Prepayment Rates, Housing Loan Corporation,
The Estimation of Concept and Parameter of a New Model Proposed by Mizuho Trust and Banking”,

© 2005, Security Analysts Association of Japan
17
Mizuho Securities Structured Finance Commentary No. 8 03/01, Department of Strategic Security
Investment.
(11) Yamagishi, Y., G. Hatayama and K. Kakuma, 2002, “ Handling of Residential Mortgage-Backed
Housing Loan Corporation Security (RMBS) in NOMURA - BPI”, Global Quantitative Research,
Financial Research Center, Nomura Securities, November 28, 2002.
(12) Moridaira, Soichiro and Yutaka Kojima, 1997,” Finance Session 4, Computational Finance”, Asakura
Syoten.
(13) Oba, Akiyoshi and S. Sugawara, 2002, “Theory and Practice of Pension Asset Management” , Nihon
Keizai Shimbun.
(14) Arora, Amitabh., David K. Heike. and Ravi K. Mattu, “Risk and Return in the Mortgage Market:
Review and Outlook.” The Journal of Fixed Income, 2000, 10 (1), pp5-18.
(15) Babbel, David. F., Stavros., A. Zenios. “Pitfalls in the Analysis of Option-adjusted Spreads,” Financial
Analysts Journal, 1992, July/August, pp65-69.
(16) Chen, Si. “Understanding Option-Adjusted Spreads: The Implied Prepayment Hypothesis,” The
Journal of Portfolio Management, 1996, 22 (4), pp104-113.
(17) Cheyette, Oren. “Implied Prepayments Addressing Anomalies in Modeling MBS Value and Risk,”
The Journal of Portfolio Management, 1996, 23 (1), pp107-115.
(18) Cox, J. C., J. E. Ingersoll. and S. A. Ross. “A Theory of the Term Structure of Interest Rates”
Econometrica, 1985, pp53, 385-407.
(19) Hayre, Lakhbir S., Sharad Chaudhary and Robert A. Young. “Anatomy of Prepayments”, The Journal
of Fixed Income, 2000, 10 (1), pp19-49.
(20) Ho, Jeffrey., Laurie Goodman, “Interest Rates-Normal or Lognomal?” The Journal of Fixed Income,
2003, 13 (2), pp33-45.
(21) Kariya, Takeaki., Fumiaki Ushiyama and Stanley Pliska. “A Three-Factor Valuation Model for
Mortgage-Backed Securities (MBS),”working paper, Institute of Economic Research, Kyoto University,
September 4, 2002.

© 2005, Security Analysts Association of Japan
18
(22) Schwartz, Eduardo S. and Walter N. Torous. “Prepayment and the Valuation of Mortgage-Backed
Securities, ”The Journal of Finance, 1989, 44 (2), pp375-392.
(23) Stanton, Richard. “Rational Prepayment and the Valuation of Mortgage-Backed Securities,” The
Review of Financial Studies, 1995, 8 (3), pp677-708.
(24) Tuckman, Bruce, Fixed Income Securities, John Wiley & Sons, 1995.
(25) Waldman, Michel, “Beyond Duration: Risk Dimensions of Mortgage Securities,” The Journal of Fixed
Income, 1992, 2 (3), pp5-15.
(26) Yamamoto, Yoshio., Stavros A. Zenios, “Predicting Prepayment Rates for Mortgages Using the
Cascade-Correlation Learning Algorithm,” The Journal of Fixed Income, 1993, 2 (4), pp86-96.


![ASSET Valuation[1]](https://img.pdfslide.us/doc/110x75/577d27af1a28ab4e1ea48bd2/asset-valuation1.jpg)