Embed Size (px)
Citation preview
., ...... ----------------------------------
Effects of Uterine Removal on the Growth of the Fetus in the Remaining Uterine Horn of Mice
Herbert Sipahutar
A thesis submitted to the Department of Zoology, University of Tasmania, in partial fulfilment of the requirements for the degree of Master of Science
May 1997

Declaration and Statement
I hereby declare that this thesis contains no material which has been accepted for the
award of any degree or diploma in any university and that, to the best of my knowledge,
this thesis contains no copy of previously published material except where due reference
is made in the text.
7L-_-+ Herbert Sip
29 May 1996
Authority of Acces Statement This thesis may be mad(: available for loan and limited copying in 3ccordance with the Copyright Act 1961.
1L-_-/.:o.
29 M.y 1996
Table of Contents
Declaration and Statement
Summary
Acknowledgments
1. General Introduction
1.1. General Review
1.1.1. Reproductive Biology of the Mouse
1.1.2. Utero-ovarian Relationships
1.1.3. Progesterone and Pregnancy
1.1.4. Prenatal Growth
1.1.5. The Growth of Neonate
1.1.6. Normal Histology of the Ovary and Uterus
1.2. Study Objectives
2. General Methods
2.1. The Animals
2.1.1. Breeding and Handling
2.1.2. Mating and Judgement of Gestation
2.1.3. Room Environment
2.2. Experiment Design
2.3. Surgery
2.4. Autopsy
2.5. Statistical Analysis
3. Effects on the Length of Gestation and Prenatal Growth
3.1. Introduction
3.1.1. Litter Size and Length of Gestation
3.1.2. Utero-ovarian Relationship and Length of Gestation
3.1.3. Objectives
3.2. Methods v
Page
IV
1
1
1
4
9
15
20
20
22
24
24
24
25
25
26
27
30
31
32
32
34
34
35
3.2.1. Determination of Gestation length
3.2.2. Calculation of Gestation Length
3.2.3. Prenatal Growth
3.3. Result s
3.3.1. Length of Gestation
3.3.2. Prenatal Growth
3.4. Discussion
4. Effects on Progesterone Concentration and Uterine and
35
36
36
40
40
45
63
Ovarian Histology 74
4.1. Introduction 75
4.1.1. Uterine Involvement in Progesterone Secretion by the CL 75
4.1.2. Uterine removal and progesterone levels 77
4.2. Objectives 79
4.3. Methods 79
4.3.1. Progesterone Measurement 79
4.3.2. Histological Procedure 81
4.3.3. Statistical Analysis 83
4.4. Results 83
4.4.1. Progesterone Concentrations 83
4.4.2. Histology 89
4.5. Discussion 95
4.5.1. Progesterone Concentration 95
4.5.2. Ovarian and Uterine Histology 100
5. Effects on Postnatal Growth 103
5.1. Introduction 103
5.1.1. Postnatal Growth 103
5.1.2. The Growth of Mammary Glands During Pregnancy 104
5.1.3. Milk Production 105
5.1.4. Maternal Behaviour 106
5.1.5. Objective 107
5.2. Methods 107
5.2.1. Maternal Behaviour 108
5.2.2. The Growth of Neonates 109
5.2.3. The Mammary Gland Weight 109
5.3. Results 110
VI
5.3.1. Maternal Behaviour
5.3.2. The Growth of Neonates
5.3.3. The Mammary Gland Weight
5.4. Discussion
6. General Discussion
6.1. Experimental Design
6.2. Experimental Limitation
6.3. Effects on Length of Gestation, Litter Size and Progesterone
Concentrations
6.4. Effect on Prenatal Growth
6.5. Effects on Postnatal Growth and Matemal Behaviour
References
vn
110
113
116
121
126
126
127
127
129
132
135

Acknowledgments
I would like to express my sincere gratitude to my patient supervisor Dr. R. W. Rose,
who with a combination of encouragement, criticism, guidance and assistance made this
project possible and made the times of frustration more tolerable.
My special thanks also go to the academic and technical staff In the Zoology
Department, University of Tasmania. In particular: Associate Professor R.W.G. White
for his excellent support which made things run more smoothly, Dr. Sue Jones for
instructing me in progesterone analysis (RIA) and affording interesting discussions, Dr Leon Bannuta and Dr. Roy Swain for their excellent advice and discussions on
statistical analysis, Mr. Jerry Lim for his helpful advice concerning photography, Mr Barry Rumbold for his help in the purchasing of materials and Messrs Alan Dumphy
and Wayne Kelly for their efficient technical support during the course of this project.
Very special thanks also go to Mr William Elvey for his friendship and help in fmal
editing of this thesis.
I am also grateful to those at the International Student Office, University of Tasmania,
Hobart who gave their assistance, especially to Mr C. Street for his invaluable help at the beginning of the study, Ms 1. Lansdowne for her invaluable advice during the
course of study, and Ms L. Oxley and Mrs M. Eldridge for their excellent help in editing
this thesis.
I wish to extend my thanks to the Directorate General Higher Education, Department of
Education and Culture of the Republic of Indonesia for having awarded me a scholarship to undertake this study at the University of Tasmania. Also my thank. to
IKIP Medan, especially to Prof. Drs. Dannono, M Ed (Rector) and Prof Djanius
Djamin, SH., M Si. (Vice Rector-I) for their assistance with the extra funds needed to
finish this work.
I also thank my mother for her unfailing encouragement and support. Finally, but very
significantly. I wish to give my warmest thanks to my wife, Linda, for her patience and
encouragement during my two years' work in Hoban and for the sacrifice of all her
weekends and for her devoted help especially during the final preparation of this thesis.
j j
J __ _
Chapter 1 I ntraduction
1.1 General Review
1.1.1 Reproductive Biology of the Mouse
a. Female Reproductive System
The female reproductive system of the mouse is composed of paired ovaries, oviducts
uterii, cervices and a single vagina and clitoris with clitoris gland (Fekete. 1941;
Hummel et al., 1966; Rugh, 1967).
The ovaries:
The ovaries are small, pink and paired spherical bodies located at the posterolateral poles
of the kidneys functioning to produce mature female sex cells, the ova, and sex
hormones. Each ovary is attached to the dorsal body wall by the ligamentum
suspensorium ovarii (mesovarium) and connected to the anterior end of the uterus by the
ligamentum ovarii proprium. Each ovary is enclosed in a thin transparent elastic capsule
or bursa from which ovulated ova cannot escape. The surface of the ovary is smooth in
the prepubertal female but becomes nodular after sexual rnatunty because of the
Olcpter1 Introduction 2
presence of follicles and corpora lurea (CL). It is covered by a thin, transparent
cOIUlective tissue membrane covered on both surfaces by mesothelium. Ovarian size is
different in strain and age because of the differences in numbers of follicles and CL.
The oviduct
This is a tubular, long (1.8 cm), narrow, coiled structure, extending from the
periovarian space to the uterine horn and functioning as a transport tunnel for the ova or
spermatozoon. Ana[Qmically, this tunnel can be distinguished in three different portions,
i.e. ampulla, isthmus and intramural portion (Hunune1 er aI.., 1966). The ampulla
begins with ciliated and fimbriated infundibulum near the ovarium bursa. The ampulla
appears to be an expandable sac in which the ova may accumulate before fertilisation
and it is not highly ciliated (Rugh, 1967). The isthmus is a long, narrow, tightly and
coiled tube lined with simple, low columnar non-ciliated epithelium which exhibits
rhythmic peristaltic contraction during transportation of the ova. The last, intramural
portion, joins the urerine horn [0 the oviduct within the uterine walL
The uterus:
The uterus consists of two tubular lateral horns (cornua) fOnning a Y-shaped structure
with a single median body (corpus). Each horn is attached to the dorsal body wall by the
heavy broad ligaments (rnesomeUia) tluough which blood and lymph vessels and nerves
course at regular intervals. The body of the uterus consists of a cranial and a caudal or
cervix portion.
The vagina and clitoris:
The vagina is a short extension of the corpus uteri and cervix with an external opening
anterior to the anus on the ventral body surface.
b. Reproduction oflhe Mouse
Mice are polyestrous and spontaneous ovulators. Under normal diurnal light cycles they
ovulate and exhibit oestrus, including mating behaviour, every 4 or 5 days. Periodicity
of oestrous is a direct result of ovarian cyclic changes and this cycle is a reflection of the
alteration in hypothalamus activity and changes in gonadotropin secretion. The key role
in cyclic reproductive activity is played by [he hypothalamus.
0l.:pter1 lntroduction 3
Apart from the litter size and slIain differences, the length of gestation is affected by the
reproductive state of the animal. In the non-suckling mouse the gestation period lasts 19
or 20 days, but in the mated suckling female this period is regularly lengthened for a
significant period of time (Snell, 1941; Gruneberg, 1952; Rugh, 1967). Prolongation of
gestation in suckling females mated at the post-partum oestrous seems affected by
parity. The multiparae female has an additional 6 - 16 days of gestation beyond 19,
whereas the primipara female has 8 - 13 days (Gruneberg, 1952).
The female mouse is sexually mature at about 30 days of age. Sexual manuity is
characterised by the opening of the vagina, cornification of the vagina, mating capability
(the first mating), rate of pregnancy after the first mating (Bronson et aI., 1966) and a
maximal growth rate (Cheek and Holt, 1963). Although the majority of females gave
birth to the first liner at about 3 months of age, many of them can give birth before the
age of 2 months (Gruneberg. 1952). The highest receptivity of the female to the male
occurs at the period of oestrus (heat) but mating may also take place during proestrous
or metestrous-I. However, the most successful mating occurs at oestrus. followed by
proestrous. late oestrus and metestrous-! with the rate of mating (characterised by the
vaginal plug) of 83%, 57%, 36% and 22% respectively and almost 80 to 90% of mice become pregnant (Bronson et ai., 1966).
Liner size depends on the number of eggs ovulated and the rate of prenatal mortality
(Snell, 1941; Gruneberg, 1952; Rugh, 1967). Both of these factors seem to be affected
by the strain, parity, age, health and vigour of the mother (Snell, 1941; Gruneberg,
1952; Rugh, 1968). The normal liner size averages between 10 and II (range: 1- 19) in CFJ-S strain (Rugh, 1967), or 5 to 6 (range: I - 14) in the dba strain (Gruneberg,
1952) or 7.4 (range: 2 - 12) in a random bred strain (Snell, 1941). The ftrSt litter is generally the smallest and the third or fourth or fifth the largest; thereafter. litter size
gradually declines, while the variability increases (Gruneberg, 1952; Rugh, 1967).
Multiparous mice of 7 to 9 months of age have more implantation sites than those of
virgin mice, either young or older, while ex-breeders have the smallest average number
of implantation sites (Rugh, 1967). Several authors have reported that litter size is more
affected by parity than maternal age; if these two variables are held constant, maternal
weight also affects litter size (see Gruneberg. 1952). This difference in litter size may be
explained by the pre-implantation loss since embryonic pre-implantation loss is
correlated with parity and with the weight of the mother but only slightly correlated with
age of the mother (Snell, 1941).
Olcpterl Introduction 4
The lheoretical males/females sex ratio of 1:1 of the offspring is rarely found even in a
large nonnal population. The number of males is usually higher £han females (Snell,
1941; Gruneberg, 1952; Rugh, 1967). Rugh (1967) postulated that this imbalance in
favour of males may be related to the size of the Y chromosome, which is slightly
smaller than the X chromosome. However, a differential prenatal mortality between the
two sexes, the diet given to the mother (especially in a pure line) and seasonal
conditions when the mother gave birth may also cause a disturbed sex ratio at birth
(Gruneberg, 1952).
The two sexes can be easily distinguished at birth by morphological appearance. The
ano-genital papilla distance is greater in males than females, and males are generally
larger and heavier than females (Gruneberg, 1952; Rugh, 1967). Morphological
differences between the two sexes become more clear by the age of about 8 to 10 days,
when the nipples of the female appear. At a similar age, females are slenderer than
males; males are aggressive and females are docile (Gruneberg, 1952; Rugh, 1967).
Rugh (1967) noted that the growth of the placenta, which in turn affects the growth of
the embryo, seems to be affected by the position in the hom, since embryos implanted
nearest the cervix appear to be resorbed more frequently, lighter in weight and more
retarded in development with the average size of the placenta smaller than that of other
positions. However, contradictory evidence has also been found by Hashima (1956)
and McLaren and Michie (1960) who recorded that the smallest fetuses were located in
the middle region, not in the cervix end, of lhe uterine hom. A similar trend was
observed in guinea-pigs (Eckstein et at., 1955) and rabbits (Bruce and Abdul-Karim,
1973).
1 .1 .2 Utero-ovarian Relationships
1 .1 .2.1 Anatomical Relationships
The anatomical basis by which the ovary and the uterus can communicate is facilitated
by the blood vessels, lymphatics and nerve systems (Baird, 1984).
The blood vessels:
In species with a bicornuate uterus, such as mice, each hom of the uterus is supplied
with blood from an artery fonned by the anastomosis of the uterine and ovarian artery.
i--
I \
L
O1cpter1 Introduction 5
The characteristics of the vascular anatomy of the uterus and ovaries in some laboratory
animals has been studied by DelCampo el al. (1972). They found that the uterine artery
provided a major portion of the ovarian blood. Much of the uterine venous blood drains
cranially into a conunon trunk, which drains both the uterus and ovaries in the guinea
pig. rat and hamster. In the rabbit, however, the uterine artery provides only a minor
portion of the ovarian blood and most of the uterine blood drains caudally.
Unfortunately, little detailed work has been reported on the vascular anatomy of the
mouse reproductive system, especially on the utero-ovarian point.
The lymphatic vessels:
The lymphatic vessel enters the uterus and creates a main plexus between the circular
and longitudinal muscle layer in the rat or in the subserosa, muscularis and junction of
the muscularis and endometrium in the rabbit and rat. The plexus then sends small
vessels into the serosa, and in some species into the endometrium (Finn and Porter,
1975). In the rat, the lymphatic vessels of the uterine horns and ovary commonly fuse
into dual vessels which run parallel to the ovarian blood vessels (Finn and Porter,
1975). These vessels drain into lymphatic node renalis. Caudal parts of the uterus and
vagina are drained by afferent vessels of another group of lymphatic nodes. The
myometrium contains an extensive plexus of lymphatic capillaries; however, the
endometrium contains only a few vessels along the base of the uterine glands (Hebel
and Stromberg, 1986).
The nervous system:
Both parasympathetic and sympathetic nerves terminate m the ovary, but their
importance in regulating ovarian function is not known.
1.1,2.2 Functional Relationships
The functional relationships between the uterus and the ovary, whether in cyclic,
pseudopregnant or pregnant animals have been studied extensively in some species. Total or partial uterine removal, ovariectomy, or the cutting or blocking of the physical relationship between the uterus and ovary were the usual techniques used. The results of these studies have been reviewed by several authors (Bland and Donovan, 1966;
Anderson, 1973; 1977; Hilliard, 1973; Finn and Porter. 1975; Niswender and Net[ ,
1988).
.�.--------------------------------------------------------------------------
I I
Olq:lter1 Introduction 6
How the uterine hom regulates ovarian function, and vice versa, has attracted attention
for many years. It is well known that hysterectomy extends the duration of luteal
function (Perry and Rowland, 1961; Melampy ef aI., 1964; Butcher ef aI., 1969; Malven
et aI., 1967). Both unilateral hysterectomy and unilateral hysterectomy combined with
contralateral ovariectomy extends the luteal life span of the rat (Butcher et ai., 1969;
Anderson, 1973). Further, it has been found that the quantity of tissue removed at hysterectomy is important in determining the final duration of luteal life or
pseudopregnancy (Bland and Donovan, 1966; Butcher et aI., 1969). Butcher et at.
(1969) also observed that the lmeolytic effect of the nongravid uterus had a local
component which was dependent upon the physical connection between the uterine hom
and ovary.
Based on their observation on the hysterectomized rat, Melampy et af. (1964) and
Malven et al. (1967) suggested that the Ulerus plays a role in detennining the duration of
luteal function indirectly by reducing the effect ofLH secreted by the pituitary. This was
later confirmed by Macdonald et al. (1970) who reported ,ha' the duration of lu'eal
function of hypophysectomised rats rreated with prolactin and LH was moderately
extended by hysterectomy. However, Christian el at. (1968) suggested that the uterus
may exert its luteolytic effect directly on the CL rather than by affecting the secretion of
LH.
In the rabbit and hamster, hysterectomy prolongs the duration of pseudopregnancy, but
has no effect on the periodicity of the oestrus cycle (Bland and Donovan, 1966;
Anderson, 1973). Fur,hermore, Kelley and Brinkley (1971) found tha' the uterus not
only influences the regression of the CL of pseudopregnant rabbits but may also
influence luteal development. Hysterectomy in cyclic guinea pigs results in prolongation of the luteal phase of the cycle, and the time of the cycle at hysterectomy detennines the
duration of progesterone secretion. The earlier the uterus is removed, £he longer £he CL will be functional (Rowlands. 1961). However, in the dog, luteal regression occurs
independently of a uterine luteolysin, but it may play a role in control of duration of
anoestrus (Hoffmann el aI., 1992).
In the mouse, hysterectomy has no Significant effect on subsequent cycle, on the
duration of pseudopregnancy, or on other characteristics of pseudopregnancy (Dewar.
1973). Even up to day 8 of pregnancy luteal function was independent of the presence
or absence of the uterus. However, removal of the placenta after day 14 of pregnancy
� .------------------------------------------
i
, > >,
O1cpter1 Introduction 7
was followed by the cessation of luteal function (with the possible exception of the 18th
day) (Dewar. 1973).
A stimulus from the uterus of non-fertile cycles in the beef heifer and its effect on the
change of active CL into the corpora albicantia was found by Anderson et al. (1962). In the ewe, hysterectomy alters the pattern of plasma progesterone and prevents the
premature regression of the CL (Southee et al., 1988). In the laner case, secretory
activiry of the CL is reduced by the time of hysterectomy.
In humans and primates, some contradictory effects of uterine removal on the ovarian
function have been found. On the one hand, some authors consider that hysterectomy
can cause the ovarian function to cease and can stimulate early menopause (for review,
see Bland and Donovan, 1966). Conversely, other investigators have failed to find
evidence of depressed gonadal activity after hysterectomy (Neill et al., 1969) and argue
that the resulting abnormalities in the previous studies were due to inadvertent
interference with the blood vessels or nerves of the ovary (Anderson, 1973; 1977).
These authors, however, have reached the same conclusion that hysterectomy alters
neither the menstrual cycle nor the onset of menopause. Quite recently, Metcalf et al.
(1992) after studying the ovarian function on hysterectomized women over a long
period of observation reported that the ovaries of woman without utem are physiologically similar to intact women.
How the luteal function can be affected by the uterine factors was examined by several
investigators (for review, see Heap and Flint, 1984). In the rat the life of the CL of
pregnancy is initially extended by the secretion of pituitary lmeotrophin at the time of
mating and supported by the placenta after the first half of the gestation period (Heap
and Flint, 1984). The life of the CL can also be extended by an antiluteolytic stimulus
sent by the conspectus (0 inhibit the normal luteolytic action of the uterus mediated by
PGF2a, as occurs in sheep (Weems et at., 1992). In human beings the placental
secretion of a luteotrophin substance (human chorionic gonadotrophin, hCG) which
also has an anLiluteolytic action.
It can be summarised that, although there is considerable variation in its effects on
mammals, uterine removal results in prolongation of the luteal function in cyclic and/or
pseudopregnant animals. This suggests that uterine tissue plays a role in regulating
luteal regression at the end of the oestrus cycle or pseudopregnancy. and thus is an
--------------------------------------
I
O1cpter1 Introduction 6
important factor in maintaining luteal activity in the absence of pregnancy. Furthermore.
the reguJatory function of the uterine horn upon luteal activity is time dependent. Thus
the repeaduell ve state of females on which Olerine removal is performed is critical in determining whether the CL will regress normally or remain functional. In addition, in many species, regulation of luteal activity by the uterine tissue is exerted locally_
1 .1.2.3 Functional Relationships During Pregnancy
To maintain a uterine environment conducive to pregnancy, progesterone must be
secreted throughout gestation and the CL of pregnancy must survive and grow larger
than the CL of the nonnal cycle (Hilliard, 1973). In mice, placental progesterone
secretion is apparently of less importance for the maintenance of pregnancy than it is in
many other species since gonadectomy at any time during gestation is followed by the
termination of pregnancy (Hall, 1957; Bronson el al., 1966).
Luteal growth, function, and regression, as well as the maintenance of pregnancy,
depends upon complex relationships between ovary, pituitary, uterus and conspectus.
However, there are differences in each species in terms of the relative importance of
these components. The ovary (rat and mouse), both the placenta and pituitary (hamster),
the uterus (guinea pig), and both the ovary and pituitary (rabbit) play a dominant role in maintaining luteal function during pregnancy (Hilliard, 1973). However, in all five
species the role of the conspectus is important in sust�ining the luteal function and the
IUleotrophic effect is exerted either by preventing the action of prostaglandin or by
inhibiting its production (Hilliard, 1973).
It is well known that the role of the pituitary during pregnancy is different in different
species. Although in all species hypophysectomy before implantation results in termination of pregnancy, and hypophysectomy before midpregnancy frequently leads
to fetal dealh and resorption due to the loss of anterior lobe secretion, removal of the
pituitary in the second half of gestation has a different effecl in different species (Heap e(
ai., 1973; Hilliard, 1973). In the pregnant mouse, the pituitary is required for the first
half of the gestation period only, and the conspectus has developed a functional
relationship with the endometrium as early as day 5 of pregnancy (Hilliard, 1973). In this species and another animals such as the rat, guinea pig and sheep, pregnancy is
maintained when the pituitary is removed after midpregnancy. In these four species.
especially in the rat, the main components of the pituitary luteotrophic hormones during
. �------------------
Olcpter1 Introduction 9
the flrst half of gestation are prolactin and LH; these are then supplemented by a
placental luteotrophic honnone during the second half of gestation. Prolactin and
placental lactogen are needed to maintain synthesis of oestradiol, which is the
detenninant factor in maintaining progesterone secretion (Heap et al.. 1973; Macdonald,
1978; Heap and Flint, 1984).
In the rabbit, the role of the luteotrophic hormone complex, which consists of prolactin,
FSH, and possibly a low level of LH is to stimulate the follicles to secrete oestrogens,
which have a direct trophic influence on luteal celis, prolonging their life and promoting
progesterone secretion (Heap and Flint, 1984). Since hypophysectomy is followed by
abortion, it indicates that in this species luteotrophic hormone derives solely from the
pituitary and the placenta does not secrete an adequate amount of progesterone to
maintain pregnancy.
In human females and primates, either the pituitary or the ovaries are not essential from
a relatively early stage of gestation and the main site of progesterone synthesis for the
greater part of gestation is in the placenta (Heap et at., 1973). The maintenance of the CL of pregnancy probably depends initially on the secretion of human chorionic
gonadotrophin (heG) by the trophoblast shortly after implamation. A placental lactogen
(hPL) may also be involved later in gestation (Heap and Flint, 1984).
It is clear that in all these species the pituitary has a critical role in the initial events of
pregnancy but, in some species the subsequent endocrine role of the pituitary in
pregnancy maintenance is transferred to the placenta.
1 .1 .3 Progesterone and Pregnancy
1 .1 .3.1 The importance of Progesterone During Pregnancy
Progesterone is the most potent of the progestagens (Heap et at., 1973; Mauvais-Jarvis,
1983; Johnson and Everitt, 1995) and is also the most important hormone in pregnancy.
So far as we know, there is no species in which pregnancy can be maimained in the total
absence of progesterone (Heap et al., 1973; Heap and Flint, 1984) because the onset,
maintenance and termination of pregnancy, especially in mammals, are regulated by
changes in the progesterone to oestradiol concentrations ratio (Raziano et al., 1972;
Heap el af. 1973; Ryan. 1973). Since pseudopregnancy in mice is only 10 to 12 days in
� .. ---------------------------------------------------------I !
�ter1 Introduction 10
length (Bartke, 1970; Dewar, 1973), successful pregnancy for 18 to 19 days requires
some factors that prolong the functional life span of progesterone-secreting organs.
The principal functions of progesterone during pregnancy are to prepare and maintain the uterine environment conducive to the growth and development of the conceptus, and
to stimulate the growth of manunary glands but, at the same time, to suppress milk secretion (Simmer, 1968; Heap el aI., 1973; Johnson and Everitt, 1995). The
observation that immunisation of the female against progesterone before and during
implantation periods in mice (Wright et al., 1982) or before and after implantation in rats
(Raziano et aI., 1972) prevents implantation or interferes with pregnancy suggests the
critical role of progesterone. The key roles of progesterone in maintaining pregnancy
after implantation may be exerted by one or more of the following actions: 1) inhibition
of myometrial contractions, 2) prevention of inununologic rejection of the embryo, 3)
suppression of endometrial PG production, and 4) maintenance of uterine growth and
plasticity (Rothchild, 1983).
Several researchers have studied the progesterone profiles of the circulating blood in intact pregnant mice (McCormack and Greenwald, 1974a; Murr et al., 1974; Virgo and
Bellward, 1974; Pointis et aI., 1981). The progesterone profiles observed by these
researchers are remarkably similar. In general, progesterone concentration shows a
bimodal curve pattern during pregnancy. The concentration reaches the first peak on day
4 (Virgo and Bellward, 1974) or day 6 (McCormack "od Greenwald, 1974a) or day 7
(Murr et al., 1974) and the second peak, which is the highest during gestation period,
on day 15 (Murr el al., 1974) or day 16 (McCormaCk and Greenwald, 1974a; Virgo and
Bellward, 1974) and between the two peaks, at about day 10 to II, progesterone
decreases to a significantly low level. In all these observations, the profIle always
begins with low levels during the first 2 days and tenninates with approximately the
same levels on the day of pruturition.
The low levels of progesterone on days I and 2 cOITelated with the minimum weights
and morphological (McCormack and Greenwald. 1974b) and functional development
(Finn and Martin, 1971) of the CL. Finn and Martin (1971) proposed that either the CL
may not be sufficiently developed to secrete progesterone before day 3, that some other
factor may be involved in the initiation of progesterone secretion, or that there is a
delayed time of up to 4 8 hrs between prolactin reaching the ovary and the secretion of
progesterone. The increase in the progesterone concentration during the first half of
-. . .. ------------------------------------------------------
�ter1 Introduction 1 1
pregnancy is needed to induce and maintain decidualization (Virgo and BeUward, 1974)
and the decrease in the middle of gestation may represent a decrease in steroidogenesis
due to the transitory Slams from a pituitary to a placental source of luteotrophin
(McCormack and Greenwald, 1974a). The increase in progesterone concentration,
reaching a peak on day 15 or 16 of pregnancy. reflects the additive effect of placental
and piruitary sources of luteotrophin (Finn and Martin, 1971; McCormack and
Greenwald. 1974a; Virgo and BeUward, 1974). These researchers also agree that
progesterone withdrawal at the end of pregnancy is a prerequisite for parturition.
Similar changes in progesterone concentrations during pregnancy in mice have been
observed in the rat (Grota and Eik-Nes, 1967; Wiest, 1970; Morishige et ai., 1973;
Pepe and Rothchild, 1974). Progesterone concentration changes in the rat are inversely
related to the serum luteinizing honnone (LH) concentration during the period from day
11 to term (Morishige er al. 1973).
1 .1 .3.2 The Sources of Progesterone
In the non-pregnant female animal progesterone is biosynthesized in the ovary and
adrenal cortex. In the pregnant female an additional and temporary source of
progesterone, the placenta, is formed. Biosynthesis of progesterone in the placenta
reveals some significant differences from that in the ovary and adrenal cortex, but the
steroids formed are chemically identical with those produced elsewhere (Heap et al..
1973).
a. The ovary
The observation that pregnancy in mice or rats is tenninared by the removal of the ovaries or destruction of the CL at any stage of pregnancy unless exogenous
progesterone is provided (Bronson et aI., 1966; Jaitly el aI., 1966; Csapo and Wiest,
1969; MacDonald. 1978) suggests that the ovaries are the principal source of
progesterone during the entire period of gestation (Pointis et al., 1981). Although the
placenta synthesises progesterone during the second half of gestation, its conuibution to
overall maternal progesterone concentration is small compared with the ovarian
contribution in the mouse (Pointis et ai .. 1981) and pig (Kensinger et aI., 1986). In
contrast to this. lhe role of the extra-ovarian source of progesterone is very important in
the maintenance of gestation in the human being. monkey, ewe. mare and guinea pig,
Olcplerl introduction 12
since bilateral ovariectomy after definite stages of gestation does not interfere with
pregnancy in many species (see Simmer, 1968; Allen, 1975).
Ovarian progesterone can be synthesised in the follicle, interstitial and luteal tissue
(Heap er aZ., 1973). However, the main source of ovarian progesterone is the CL tissue
(Elbaum et aI., 1975; Heap et aI., 1973; Mauyais-Jarvis, 1983). Elbaum et af. (1975)
observed that total CL weight is significantly correlated with serum progesterone
concentration on day 16 of pregnancy of the rat. In addition, the prominence of the
progesterone-secreting interstitial tissue varies greatly in different species. For example,
this tissue is very prominent in the ovaries of mice, rats and rabbits but absent in the
ovary of large domestic animals such as the cow, ewe, sow, and mare (Hansel et ai.,
1973; Heap et af., 1973).
Luteal biosynthesis of progesterone is regulated by hormones or substances originating
from both the pituitary gland and the uterus. For example, both gonadotrophin and
prostaglandins (PGs) exert dual effects, i.e. stimulation and inhibition, on luteal
progesterone biosynthesis (reviewed by Dorfman, 1973; Hansel et af., 1973). In the in
vitro system, progesterone secretion of the ovary is higher after stimulation of the LH in
the cow; and progesterone secretion in the rabbit increases in the presence of PGE2
(Dorfman, 1973; Hansel et ai., 1973). However, several authors reported a luteolytic
effect of PGs, especially PGF2cx' in the in vivo system (Dorfman, 1973; Hansel et ai.,
1973). In addition, PGs did not stimulate the progestt:rone synthesis when added to
saruraling amounls of LH or heG (Dorfman, 1973). It has also been reponed that a
small dose of PGF2cr. injected into the ovarian bursa of a pseudopregnant hamster
resulted in stimulation of luteal function (luteotrophic effect) while a single larger dose
produced a depression (luteolytic) effect (Lukaszewska et aI., 1972). More recently,
Mauvais-Jarvis (1983) observed that the stimulating effect of LH on progesterone
synthesis and secretion by the CL is mediated by an increased synthesis of cAMP.
b, The placenta
The fact that placental pregnancy can be induced by removing the feruses from the
uterus of the rabbit. rat, cat and rhesus monkey (see Allen. 1975), and that the removal
of either the fetuses or the placenta at delivery resulted jn a decrease in progesterone
concentration (Grota and Eik-Nes, 1967) suggests that the endocrine function of the
placenta is important in maintenance of gestation. In the guinea pigs, in fact, placental
progesterone is sufficient to support and LO continue pregnancy after bilateral
I
O1cpter1 Introduction 13
ovariectomy at day 28 of pregnancy (Heap and Deanesly, 1966). In the rat, the fetal
placenta is responsible for the secretion of an enzyme inhibitor, possibly a placental
LTH, that regulates the activity of ovarian 20a-OH-SDH (Heap er at., 1973). The latter
hormone has a key position in the control of ovarian steroid biogenesis. It is also
reported that the placenta not only contains enzymes for steroid synthesis but it also
synthesises a small quantity of progesterone during the second half of pregnancy in the
mouse (Salomon and Sherman, 1975: Pointis et al., 1981; Kensinger el at., 1986) or in Lbe guinea pig (Heap and Deanesly, 1966).
In the human being the placenta is the main source of progesterone during the gestation
period. Some evidence for this conclusion has been provided by Sinuner (1968).
Firstly_ there is a positive relationship between peripheral serum concentration of
progesterone and placental size. Secondly. hypophysectomy, oophorectomy, and
adrenalectomy treatments fail to induce a significant change in pregnanediol levels.
Finally. progesterone concentration is higher in [he umbilical and uterine venous blood
than in the corresponding arterial or venous blood of the mother at term. Placental
progesterone of the pig, goat and rabbit, however, is never produced in sufficient
quantities to maintain gestation in the absence of the ovaries (Heap and Flint, 1984).
Although placental conuibution on the maternal progesterone concentration is relatively
small in several species (rat: Elbaum et at., 1975; pig: Kensinger el ai., 1986), the
placenta has another means of determining maternal prcgesterone concentration since it
can stimulate CL to grow and increases its rate of progesterone secretion by stimulating
the production of intralu£eal oestrogen (Kato et al., 1979). A direct relationship between
the nwnber of conceptuses, the sjze of the CL and the serum progesterone concentration
on day 15 of pregnancy bas been reported by Kato el al. (1979).
The importance of placental endocrine function during gestation period can be interpreted from the experimental results reviewed by Heap el al. (1973). Hysterectomy
results in tennination of the CL function in the rabbit, rat. hamster, guinea pig and cat,
and removal of the fetuses alone. while the placenta left ill situ does not alter the course
of pregnancy in the rabbit, rat, mouse. monkey and cat (Heap et ai., 1973). In addition,
observations on mice revealed that plasma progesterone concentrations increase in the
second half of gestation (Pointis et ai., 1981) where these values are higher in mice
selected for large litters than for small (Michael et at., 1975) or are proportionally related
to liner size (Soares and Talamantes. 1983; Humphreys el ai., 1985). In addition, the
,I ,i
'I
, !
"
I'
Chc.pter1 Introduction 1 4
ult:roovarian venous blood ratio of progesterone concentrations during the second half
of gestation in unilaterally ovancctorrUzed mice is increased, ranging between 0.006 (at
day 13) to 0.04 nglml plasma (day 16 - 17) (Pointis et ai., 1981). Progesterone
concentration in the ovarian venous blood ranges between 958 - 3096 nglml (with the
maximwn values reached at day 13 and the minimum at day 18) and in the uterine
venous blood ranges between 17.7 - 1 14.9 ng/ml (with the maximum values reached at day 17 and the minimum at day 13). Progesterone concentrations in the peripheral
plasma in the same period of gestation never exceed a value of 25 nglml (Pointis et ai., 1981). This infonnation suggests that the placenta has an endocrine function during
pregnancy and that placental endocrine function is increased when the ovarian function
is decreased.
c, The adrenal
The fact that maternal adrenals of many species are capable of producing appreciable
amounts of gonadal steroids including androgens, oestrogens, and progestagens has
been reported by several investigators as reviewed by Heap et al. (1973). More recently,
Macdonald and Matt (1984) measured the contribution of the adrenal on steroid
(androgen and progestin) secretion in pregnant rats and suggested that the adrenal cortex
contributes to the placental progesterone pool during pregnancy. They observed that
adrenalectomy caused lower levels of serum progesterone on days 10, 14, 16, and 1 8 of
pregnancy. However, whether they make a significant contribution to pregnancy
maintenance or not remains in question. The adrenal secretion of progestagens and other
gonadal steroids is high under conditions of Stress or under stimulation of ACfH but
adrenalectomy does not result in termination of pregnancy in the rat, cat, dog, and ferret
(Heap et ai., 1 973).
1 .1 .3,3 The Rate of Progesterone Secretion
The rate of progesterone secretion seems to be different in different stages of the
reproductive cycle or of pregnancy. For example. the rate of secretion in early
pregnancy in the rabbit is about 4.37 !-lg/min, whereas the ovaries in late pregnancy
secrete about 4.57 !-lg/min. Stimulation of LH can double the secretion rate to 7.43 and
7.72 !-lg progesterone per minute for early and late pregnancy, respectively. In the cyclic
rat, ovarian venous blood concentrations vary bet\veen 0.02 to 0.08 !-lglovary/min with
a maximal levels reached in proeslrous (Heap eI al.. 1973). In the pregnant mare the
production rate of progesterone III the ovary is about 300 pglceillday with a secretion
-------------------------------------------------------------
Olcpter1 Introduction 1 5
[ale of about 78.7 Ilg/min, and in the pregnant guinea-pig the values are 419 pglceWday
and 0.83 Jlglmin for production and secretion rates respectively (for details see
Dorfman, 1973). In pregnant goats, the secretion rate is dependent upon the number of
CL in the ovaries. For example, there is 4.2 J.lglmin in the ovary with single CL and 7.2
Ilglmin in one with three CL (Linzell and Heap, 1968). In sheep. however, this CL
dependent progesterone secretion rate can not be detected (Linzell and Heap, 1968). It is
suggested (hat in ovary-dominated animals (the ovary as a main source of progesterone
during pregnancy), but not in placenta-dominated animals, the ovarian progesterone
secretion rate is closely related to the number of CL.
The maximum concentration of progesterone produced by the rat placenta is 0.02 �glg
placenta (Heap et at., 1973). Placental secretion rate in sheep is about 9.7 �glmin but
the placenta does not secrete progesterone in goats (Linzell and Heap, 1 968). In humans, the rate varies between 0.06�0.22 )lglmin (these values are summarised from
several authors who measurde the rate at different stages of pregnancy with different
methods of measurement) (Simmer, 1968). In general, the secretion rate of the placenta
is increased with the age of gestation.
In the goat, adrenal secretion of progesterone can make a small but significant
contribution during pregnancy in the range of 60 - 415 ng/min (about 1 - 10% of that
from the CL) but in the sheep the adrenal secretion rate is very low, valued between 0.7
- 2.8 ng/rnin (Linzell and Heap, 1968).
1 .1 .4 Prenalal Growth
According to Cockburn (1989) fetal growth is governed by the rate of cell division in
different cells and tissues, and total size reflects changes in cell number rather than changes in cell size or the quantity of extracellular materials. Some of me factors
affecting the prenatal growth rate are uterine size (uterine environment), genetic
potential, maternal health and nutrition, blood supply and placental function. Of these,
the major determinant is the uterine environment (Brumby, 1960; McCarthy, 1965;
Cockburn. 1989), Brurnby (1960) noted that sex linked genes were not responsible for
any marked effect on body size. However, Moore el al. (1970) and Aitken el al. ( 1 977)
found that greater control on prenatal growth was exerted by the embryonic genotype
and that maternal effects were of minor importance. However, both Brumby ( 1960) and
.
Olc;pler1 Introduction 1 6
Moore et at. (1970) agree that genetic factors have a greater effect in regulating postnatal
growth than that of uterine or maternal effects.
The influence of non-genetic maternal factors on prenatal growth have been studied
extensively_ For example, a constraining influence of the uterine hom on the growth of
fetus has been reported by Healy (1960) and McCarthy ( 1965). Fetal growth was
negatively correlated with both the number of implants in !.he same hom (local effect)
and the number of implants in the whole litter (systemic effect) (McCarthy, 1965).
Furthermore, Healy (1960) reported that the fetal position in the horn, the quantity of
the nutrient taken up from maternal blood circulating. the size of placenta, the blood
pressure at which maternal blood reaches the placenta and the growth of the placenta
itself all have a great effect on fetal growth.
There are two stages at which maternal factors affect the growth of offspring, i.e. 1)
Prenatal maternal effects, when the fetus is entirely dependent upon its mother nutrition,
and 2) Postnatal maternal effects, where the new born offspring is entirely dependent
upon maternal care (maternal milk supply). The effect of both prenatal and postnatal
maternal factors on total body weight tends to decrease with the age of the offspring,
however, the effect of the genotype tends to increase (£1 Oksh el al., 1967).
In his review on the effect of genetic factors on prenatal growth, Snow ( 1989) draws
two important conclusions. Firstly, genetic constitution is the most important factor in the control of embryonic growth (although environmental factors have an impact).
Secondly, for successful growth an interaction between embryonic and maternal
genome is needed. The maternal genmype may act on !.he embryo in two ways. i.e. it
may affect the development of the oocyte and the ability of the uterus to support
embryonic/fetal development.
In most liner-bearing marrunalian species prenatal growth depends on the litter size.
Fetal weight is negatively related to liner size in guinea pigs (Eckstein and McKeown.
1955b), mice (McLaren and Michie, 1960; Healy, 1960; McLaren, 1965) and rats (Barr
el ai., 1970). This effect of litter size is due to the limitation of nutrients available in the
shared maternal blood stream. Eckstein (1955, in Healy, 1960), on the basis of
observations on the rabbit, suggested a theory of competition to explain the effect of
intrauterine overcrowding on fetal growth: I ) Fetal size is positively correlated with
placental size, 2) Placental size is affected by the number of implants through both local
--- .......... ----------------------------------------------------�
Olcpter1 Introduction 1 7
and systemic influences. 3) Fetal size is affected by the fetal number, both locally and
systemically. and finally 4) There is a blood supply limitacion to the uterus.
Besides the size of liner, prenatal growth is also affected by other factors such as
maternal metabolism and fetal metabolism as well, and placental regulation of nutrient
production and its transportation to the fetus (Healy, 1960; Jones, 1976). The effect of
maternal metabolism on prenatal growth can be seefl in the occurrence of fetal
overgrowth in the diabetic pregnancy. Conversely, either the reduction of food intake
during pregnancy or surgical alteration of uterine blood flow to the placenta or to the
umbilical blood flow to the fetus, is associated with intra-uterine growth retardation
(Jones, 1976).
T ransponation and hennena! function of the placenta has a significant effect on prenatal
growth. Because the quantity of nutrients taken up from the maternal blood is under
placental regulation, the placental size and maternal blood pressure reaching the placenta
are also factors which should be considered in studying the prenatal growth. The
provision of nutrition from the mother to the fetus is controlled by the concentration of
nutrients in the maternal circulation and the blood supply to the placenta (Jones, 1976).
The reduction in placental mass, leading [0 decreased maternal blood flow, reduces the
nutrients available for fetal growth. The composition of the nutrient supply to the fetus
may also be influenced by the placental metabolism. The placenta has the capacity for
amino acid metabolism and inter-conversion, substantial lactate production and the
synthesis of lipids (Jones, 1976). Placental hormones may exert effects on maternal
metabolism that in turn can promote fetal growth, ego a shift in the glucose supply to the
fetus or an increase in free fatty acids late in gestation.
Although genetic and environmental influences are also important faclOrs in regulating
prenatal growth, there is considerable variation between mammals (McKeown et at.,
1976). Birth weight in species where (he reserves of the uterus are sufficient to support
the full growth of the fetus to the end of pregnancy is determined by the fetal genes and
is related to the size of both parents. However, in species where the capacity of the
uterus is more limited, maternal influences predominate in detell1llning the rate of fetal
growth. In these species weight at birth is related to the size of the mother rather than to
that of the father (McKeown et al.. 1976).
O"IGpter1 Introduction 1 8
Endocrine and metabolic factors interact in a complex fashion in controlling fetal
growth. Multiple pregnancy IS associated with a reduction in placenml and fetal size.
Chromosomal or antigenic dissimilarity seem to play a minor role (Dawes, 1976).
However, the fact that there are gender difference in prenatal growth suggests that the
antigenic dissimilarity between mother and fetus plays an important role in regulation of
prenatal growth (Snow, 1989).
Maternal factor and prenalal growth
Maternal influences primarily determme the rate of fetal growth only in species where
the reserves of the uterus are insufficient (Q support the full growth of the fetus to the
end of pregnancy. In species where the uterus can support the full growth of the fetus,
birth weight is determined by the fetal genes and is related to the size of both parents
(McKeown e/ aI., 1976).
Uterine size
In multiple pregnancy. binh weight is related to liner size: there is a tendency for growth
retardation in large litters. McKeown el at. (1976) have proposed three explanations for
growth retardation: 1) lack of space, 2) limitation of nutrients, and 3) restriction of the
channel. The last explanation (restriction of channel) was made on the basis of an
observations on feto·placental relationships.
Maternal health and nutrition
Some reviews have described how the maternal health and nutritional state affects prenatal growth (Widdowson, 1968; Eisen, 1976). In the earlier stages of gestation,
food and accommodation in the uterus are not limiting factors. However. in the later
stages the number of young sharing the uterine blood supply can have a profound effect
upon size at birth. Nutrition of the mother during pregnancy and lactation has a
profound effect on the growth of her progeny. The fact that liner size is inversely related
to the weight of the fetus is an mdication of the prenatal competition that occurs among
the young for the limited supply of nutrients in the maternal circulation.
------------------------------------------------------------
Olcpter1 Introduction 1 9
Blood supply
As mentioned previously, the nutritional state of the mother plays an important role in regulating the growth afthe young in utero. Conversely, in mice, there is evidence that
fetal weight is unaffected by the nurritional state of the mother (Healy. 1960), and there
are several aspects of the prenatal growth pattern which cannot be described solely on
the basis of competition for nutrition (McLaren and Michie, 1 960). For example, in mice, McLaren (1965) found that fetal growth was affected by both local and systemic
factors and that there was a causal dependence of fetal growth on placental size. The
importance of haemodynamic factors in relation to prenatal growth has been suggested
by severa! authors (Eckstein and McKeown, 1955b; McKeown et at., 1953; Hea!y,
1960; McLaren and Michie, 1960; McLaren, 1965). They believe that haemodynamic
factors might be responsible for the effect of position in the horn on placental growth,
and hence on fetal growth, and the systemic effect of liuer size on fetal and placental
growth. Also, both the pressure at which maternal blood reaches the placenta and the
size of placenta are important in detennining the quantity of nutrients available for fetal
growth. More recently. Even el al. (1994) examined the relationships between fetal
body weight and both uterine and placental blood flow in the rat. They found that blood
flow was greater at the cervical and ovarian end than in the middle region of the uterus,
but they failed to find a significant difference in the pattern of fetal weight. Although
variations in blood pressure down the length of the horn do not directly affect the
growth of the fetus (McLaren, 1965; Bruce, 1976), it has been found that both placental
and feta! size are limited by the rate of utero-placental blood flow (Clapp, 1989).
Placental function
The growth hormone releasing factor (GHRF), origina!ly identified in the
hypothalamus, has been found in the placenta of the rat. mouse (in which it is called
mGHRF) and human but little is known about its function and even less is known about
factors that regulate its production. Quile recently, Endo et al. ( 1994) reported that the
production of mGHRF mRNA could be detected as early as day 1 1 of pregnancy with
the maximum values on day 15-17, followed by a slight decline on day 18 . Endo et al. (1994) suggested that the mGHRF gene expression in the placenta is regulaled by
intracellular cANlP concentration.
The placenta of a number of species produces polypeptides that are members of the
prolactin (PRL)-growth hormone (GH) family. The be�t-studied members of this family
�, .... ------------------------------------------I I
, l
01cpter1 lntroduction 20
in the mouse are mouse placental lactogen (mPL)-I, mPL-II, and proliferin (PLF). The
known biological activities of mPL-I and mPL-1I are similar to those of PRL. The
function of PLF has not been determined, although it is known to differ from that of the
mPLs. Each of these three proteins is produced by giant cells at mid pregnancy.
Yamaguchi et at. ( 1994) reported that the same giant trophoblast giant cells express
these three pcmeins simultaneOUSly at midpregnancy, so their gestational proflles in
maternal blood during this period result at least partly from changes in gene expression
in one population of cells and not from a differentiation of several subsets of giant cells,
each expressing only one member of the gene family.
1.1.5 Growth of the Neonate
The prenatal and preweaning periods are probably the most critical in determining adult
body weight and reproductive efficiency (Eisen, 1976). Prenatal and preweaning
growth are affected by both internal factors (genotype of the fetus or neonate and birth
weight of the neonate) and external factors, especially parental factors, litter mates and
other envirorunental (physical) features (Hafez, 1963). Parental factors, primarily
maternal factors affect the growth of neonates mainly by the mmher's ability to produce
and supply milk which, apart from generic differences, is dependent on maternal age,
parity, diet and many other variables (Gruneberg, 1952). Maternal behaviour including
pup retrieval, licking, nursing and nest building also affecting the growth of neonates.
At the beginning of the weaning period the growth of the neonate is slow for a period of
14 to 15 days, but rapid growth is resumed after the change to solid food is completed
(Gruneberg, 1 952). No differences are observed in the growth "'te of males and
females until 4 weeks post-natal, but after this age, the growth rate of males becomes
higher than females (Gruneberg, 1952).
1.1.6 Nonnal Hislology ofthe Ovary and Uterus
1.1 .6.1. The Ovary
Mammalian ovaries usually consist of conical and medullary areas which are clearly
identified. In the mouse, however, these areas are not easily identified (Gude et at.,
1982). The CL is the most prominent tissue in the ovary. This tissue is a complex, but
temporary, endocrine organ of the ovary which develops from the ovulated follicle and
secretes a relatively large amoum of progesterone for maintenance of pregnancy. The
�ler1 Introduction 21
ovaries may contain many sets of CL. The most recent CL are easily distinguishable
from the older ones by their blue colour, the latter stained more heavily with eosin.
The CL of pregnancy enlarges until about day 13 of pregnancy (mean diameter 976
nun), and this size remains constant until about day 18 when the CL starts to regress
(Fekete, 1941). At days 10 - 1 2 of pregnancy all the CL present in the ovary (except
those of pregnancy) rapidly degenerate, forming fibrous masses containing large fat
globules.
The CL is fonned by luteal cells, namely large luteal cells (originating from granulosa
cel1s) and small luteal cells (originating from theca cells), and non luteal cells, namely
vascular cells (endothelial cells, pericytes, macrophages, lymphocytes) and connective
tissue cells (fibroblast or fibrocytes) (Gibori, 1993). On a volume basis, the CL of
pregnancy of sheep consisted of large luteal cells (25 - 35%), small luteal cells (12 -
1 8%), (vascular elements ( I I %), connective tissue (22 - 29%) and fibroblasts (7 - 1 1 %)
(Niswender and Nett, 1988). Both small and large luteal cells differ not only in size but
also in morphology. In the rat, for example. the small luteal cells (12 to 20 ).1 in
diameter) are characterised by a large oval nucleus and a few lipid droplets while the
large luteal cells (30 ).1 in diameter) have a small spherical nucleus and are filled with
lipid droplets (Nelson er aI., 1992). In addition, large lliteal cells are polyhedral in shape
with a lightly staining cytoplasm while small luteal cells are spindle shape with a darkly
staining cytoplasm (Niswender and NeH. 1988).
Although both smail and large luteal cells respond to LH stimulation with an increase in steroidogenic output, the cell content of LH receptors is greater in the large than in the
small luteaI cells. The large luteal cells. with or without LH stimuJation, are the principal
source of steroids (Nelson et at., 1 992).
1 .1 .6.2 The Uterus
The endometrium or mucosa of the mouse uterus are composed of three main tissues,
i.e. luminal epithelium, a simple coluIlU1ar epithelium lining. branched rubular glands,
and vascular connective tissue. The size. shape and internal organisation of the uterine
endometrial cells are controlled to a large extenl by the ovarian hormones. The number
of glands in the endometrium varies according to the reproductive state of the animals.
The myometrium consists of an inner circular and outer longitudinal layer of smooth

----------------------
OlGpter1 Introduction 23
Uterine hom removal was performed on four different days of gestation. i.e. day 2, day
6, day 10, and day l4 in [Wo different ways, either with its ipsilateral ovary or not. To
access [he effect of treatment, operated females were autopsied on several different days
of gestation, i.e. day 3, day 7, day 10. and day 14; when fetal weight was measured.
Additional observation was made on the uterine and placental growth after halving the
size of liuer (by removmg onc of the uterine horns).
To examine the hormonal effect of the treatment, plasma progesterone concentration was
measured at an interval of 4 days during the gestation period and on the day of delivery.
This observation was enriched by the histological examination of the ovary and uterine
tissues collected on day 18 of pregnancy.
The effect of the removal of one merine hom on the maternal responsiveness towards
pups and on growth of the neonate was noted by observing maternal behaviour during
the flfst 5 days POSt partum and by recording the weight of the neonate daily during the
fust 21 days after birth (preweaning period). Observations were made after reducing
litter size by up to 4 young per litter (2 males and 2 females).

Chapter 2 General Methods
2.1 The Animals
Ten pairs of mice of the Quackenbush strain, aged between 3 to 4 months obtained
from the Zoology Department, University of Tasmania, were propagated to produce a
colony stock of animals for experimental purpose. The experiments were carried out
between August 1994 and September 1995.
2.1.1 Breeding and Handling
Each female mouse was housed with a single fertile male. Pregnant females were then
separated from the male at least one week before the expected parturition day. At the
time of parturition, litters were sexed and weighed individually; female pups with an
extremely low birth weight and most of the male pups were discarded at delivery. The
remaining litters were then weighed three times a week during the preweaning period
and separated from the parents (weaned) at 3 weeks of age. At 5 weeks of age. the
sexes were caged separately into a colony stock. Pups with an abnormal increase in
Olc:pter2 General Methods 25
body weight during the first five weeks from birth were discarded. The colony of
offspring was used as the subject for these experiments.
Mice were housed in opaque plastic cages of two sizes, small (30 x 1 2 x 1 2 cm) or
large (40 x 30 x 15 cm), fitted with stainless steel lids. The small cages were used for
mating and experimental treatments and the large for the colony stock. The cages were
washed once a week, and given a fresh 0.5 cm thick bedding of dry paper pellets. The
cages were attached to the shelves of a mobile rack.
2.1 .2 Mating and Judgement of Gestation
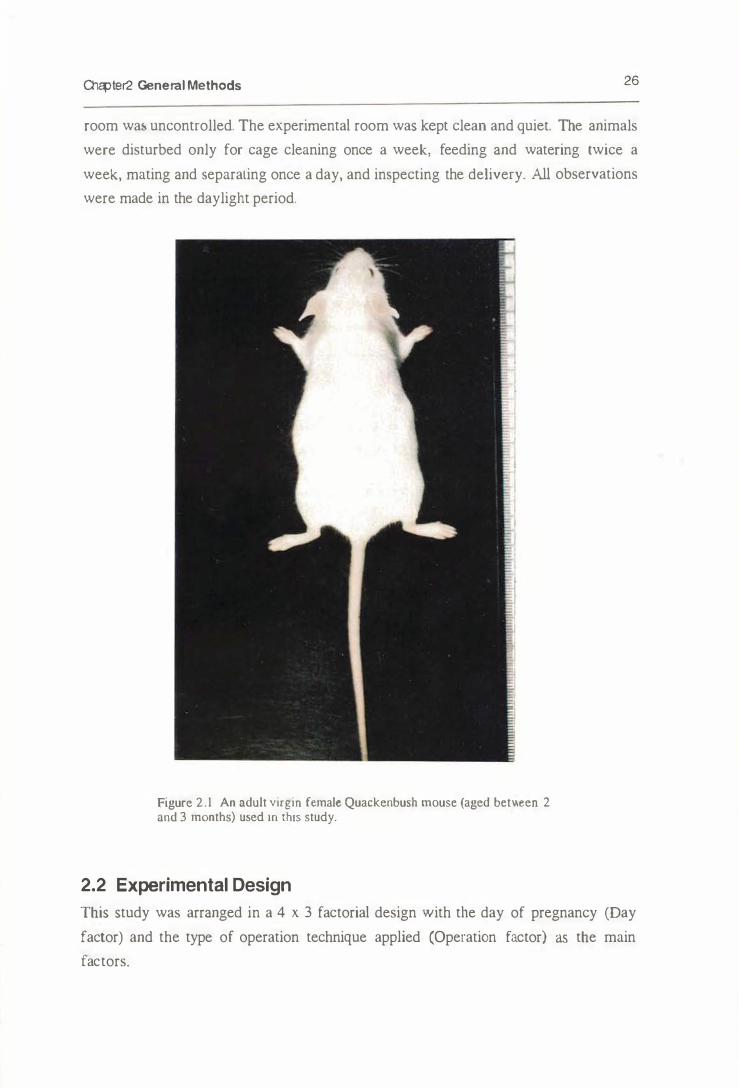
Virgin female mice from the colony aged between 2 to 3 months were used in all of the
experiments (Figure 2.1) . Proestrous or oestrous mice were placed overnight with
males of the same age (2 females per male) at about 0500 to 0530 PM. Female mice,
with or without a vaginal plug. were separated from the males on the following
morning. Either the presence of the vaginal plug checked the subsequent morning or
the increase in body weight several days after mating was used to judge the stage or
age of pregnancy. The day of vaginal plug presence was designated as day 0 of
pregnancy. For the females without a vaginal plug in the morning, but which showed
an increase in body weight several days after mating, the stage or age pregnancy was
determined from the day when separation was made. Before the operations pregnant
females were kept in groups of three or four in small cages. After operation, however,
females were kept separately in an individual cage until autopsy.
All animals were fed commercial laboratory pellets (Gibson Ltd, Hobart, Tasmania,
Australia) and tap water ad libitum. Food and water were changed once a week at the
time of cage cleaning. and at the same time the water boules were washed. Old food or
water was fIrst discarded before being replaced with fresh food.
2.1.3 Room Environment
Breeding (animal propagation) colony stock and treated animals were kept in a
temperature- and light-controlled room. Room temperature was maintained in the
range of 19'C to 22'C or 20.41 ± 0.13 (mean ± SEM). Light (L) and dark (D) periods
were scheduled so that there were 12L112D hours with the light switched on at 06.00
AM and off at 06.00 PM. The only source of light was from two pairs of 35 watt
fluorescent lamps regulated by an automatic timer. The humidity of the experimental
O1cpter2 General Methods 26
room was uncontrolled. The experimental room was kept clean and quiet. The animals
were disturbed only for cage cleaning once a week, feeding and watering twice a
week, mating and separaling once a day, and inspecting the delivery. All observations
were made in the daylight period.
Figure 2.1 An adult virgin remale Quackenbush mouse (aged bet\.\een 2 and 3 months) used III thIS study.
2.2 Experimental Design
This study was arranged in a 4 x 3 factorial design with the day of pregnancy (Day
factor) and the type of operation technique appUed (Operation factor) as the main
factors.
O1qJler2 General Methods 27
The Day ractor: The day factor was the stage or age of pregnancy when the operation was perfonned.
Mice were examined on four different days of pregnancy, i.e. day 2, day 6, day 10
and day 14.
The Operation factor: The operation factor was set based on [he type of operation applied for each animal.
There were 3 levels of operation factor performed, i.e. one uterine horn was removed
(unilateral uterectomy, t:X). one uterine hom and its ipsilateral ovary were removed
(unilateral utero-ovariectomy. VOX). and neither the uterine hom nor the ovary was
removed (sham-operated concrol, SOP).
This experiment, therefore, consists of 4 x 3 = 12 treaunent groups (fable 2.1).
Pregnant mice were allocated at random to these 12 groups of 5 to 8 animals each.
Table 2.1 Two way table showmg the factorial design used in the experiment. Each cell representS the experimental groups.
Day of Operation techniques operation UX UOX SOP
2 2UX 2UOX 2S0P 6 6UX 6UOX 6S0P
10 IOUX IOUOX IOSOP 14 14UX 14UQX 14S0P
2.3 Surgery
All operations were performed between 10.00 to 13.00 on the designated day for each
group under a light anaesthesia by intra peritoneal injection of 0.30 to 0.45 ml of a
freshly prepared 1 .2 % solution of 2,2,2·tribromoelhanoi (Avenin: Fluka Chemika,
French) in distilled water. This dosage was equal to 0.01 ml per gram body weight.
All operations were performed under clean, but not sterile, conditions. Surgical
procedures are summarised in Figure 2.2.
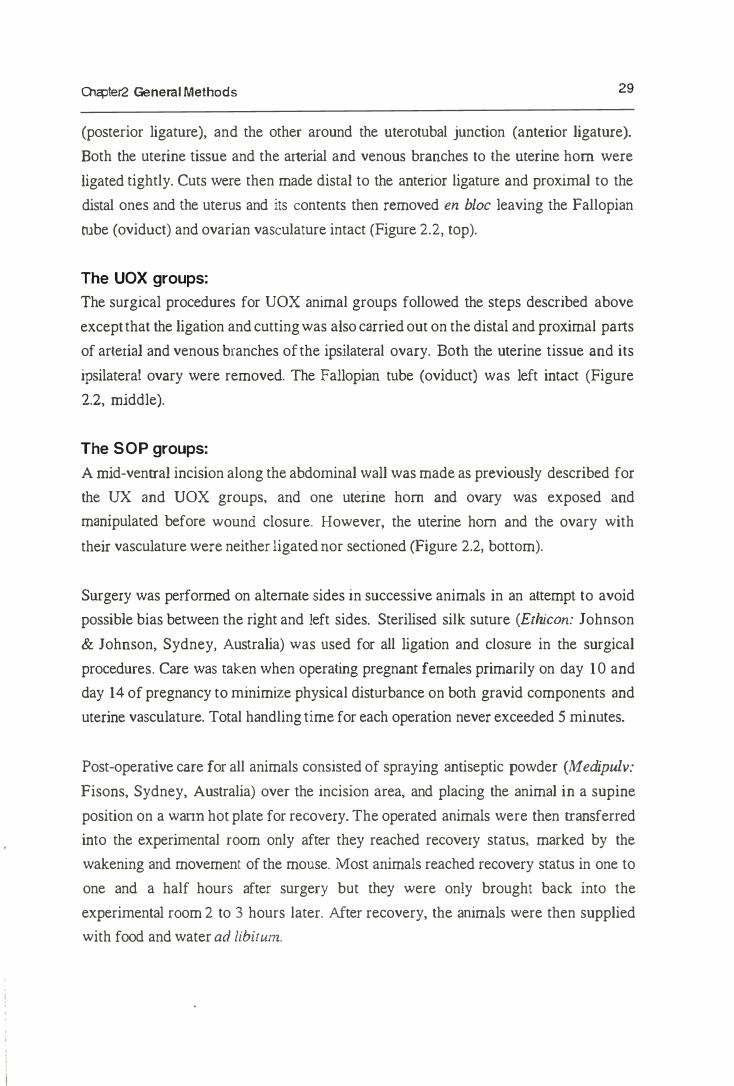
The UX groups:
Removal of one uterine hom was carned out through a mid-ventral incision along the abdominal wall. One ulerine horn was then exposed and one ligature placed around the
distal or cervical ends of the uterine horn, just at the junction of the two horns
•

D-4'B2 Gene",' Methods
Ovary
Uterine horn -
Cervix Vagina
ux
uox
Oviduct
SOP
Figure 2.2 Surgical procedures carried out during experimental treatment. One uterine horn (UX group) or onc uterine horn with its ipsilateral ovary (UOX group) was removed (shaded area) at several different days of gestation, i.e. Day 2, 6, 10, and Day 14. Ligatures (arrow heads), which included the uterine blood vessels, were placed around the distal or proximitl of the CUL<; areas. In UOX group, the oviduct was left intact Sham oper:lIcd control (SOP group) consisted of laparotomy and inspection of both uterine horn, neither ligation or cuts was performed in the SOP group. (Adopted from vom Sanl and Dhar, 1992).
28
----------------------------------------------------------------.
0'I.Epte12 General Methods 29
(posterior ligature), and the other around the uterotubal junction (anterior ligature).
Both the uterine tissue and the arterial and venous branches to the uterine hom were
ligated tightly. Cuts were then made distal to the anterior ligature and proximal to the
distal ones and the uterus and its contents then removed en bloc leaving the Fallopian
rube (oviduct) and ovarian vasculature intact (Figure 2.2, lOp).
The UOX groups:
The surgical procedures for UOX animal groups followed the steps described above
except that the ligation and cutting was also carried out on the distal and proximal parts
of arterial and venous branches of the ipsilateral ovary. BOlh the uterine tissue and its
ipsilateral ovary were removed. The Fallopian tube (oviduct) was left intact (Figure
2.2, middle).
The SOP groups:
A mid-venrra! incision along the abdominal wall was made as previously described for
the UX and UOX groups, and one uterine horn and ovary was exposed and
manipulated before wound closure. However, the uterine horn and the ovary with
their vasculature were neither ligated nor sectioned (Figure 2.2, bottom).
Surgery was performed on alternate sides in successive animals in an attempt to avoid
possible bias between the right and left sides. Sterilised silk suture (Ethicon: Johnson
& Johnson, Sydney, Australia) was used for all ligation and closure in the surgical
procedures. Care was taken when operating pregnant females primarily on day 10 and
day 14 of pregnancy to minimize physical disturbance on both gravid components and
uterine vasculature. Total handling time for each operation never exceeded 5 minutes.
Post-operative care for all animals consisted of spraying antiseptic powder (Medipulv: Fisons, Sydney, Australia) over the incision area, and placing the animal in a supine
position on a wann hot plate for recovery. The operated animals were then transferred
into the experimental room only after they reached recovery status, marked by the
wakening and movement of the mouse. Most animals reached recovery status in one to
one and a half hours after surgery but they were only brought back into the
experimental room 2 to 3 hours later. After recovery, the animals were then supplied
with food and water ad libitum.
............. ----------------------------------------------------------------------. �, ,
Ch:pter2 General Methods 30
2.4 Autopsy Autopsy was perfonned for all operated-pregnant females at the designated day for
each day-based group (Table 2.2). Autopsy was carried out after a blood sample for
each animal was collected (see below).
Table 2.2 The days of autopsy for each experimental group.
Blood sampling
Group 2UX. 2UOX. 2S0P 6UX. 6UOX. 6S0P 10UX. IOUOX. IOS0P 14UX, 14UOX, ]4S0P
Day of pregnancy at autopsy
3. 7. I I . 15. 1 8 7. 1 1. 15. 1 8
1 1 , 15, 18 15. 18
Blood samples were obtained from all treated-pregnant females on the day of autopsy.
Blood samples were also collected on parturition day_ Collection of the blood samples
was perfonned under light anaesthesia as described previously (Section 2.3). Blood
sample (0.8 - 1.5 mVmice) was obtained by means of cardiac puncture with 26G
needles and 2 m1 heparinized disposable plastic syringes (50 IV sodium heparin per
syringe), transferred into lithium heparin tubes, and then centrifuged at 2500 g for 10
minutes. Plasma was then harvested and stored in a freezer at -200C until hormonal
assay.
Uterine and ovarian tissue
After blood sampling, mice were killed by cervical dislocation. The remaining uterine
horn (for both UX and UOX groups) or intact uterus (for SOP groups) and its ovary
were removed, weighed on a Mettler balance and then placed in a petri dish containing
0.9% (w/vJ NaCI solution for examination. Fresh examination of the uterine horn and
its content from the females on day 18 of pregnancy was made directly.
Because the uterine born and its gravid components were more difficult to distinguish
and separate by morphology before day 18 of pregnancy, they were not dissected for
fresh examinations. Uterine horns from day 3 to day 15 of pregnancy_ therefore, were
fixed directly in Bouin's solution. They were then examined under low magnification
with a dissecting microscope.
Olc:pler2 General Methods 31
2.5 Statistical Analysis
Results are expressed as means ± SEM. In most cases, data from the right and left
uterine horns which originated from the SOP groups were averaged first before being
analysed and presented in figures or tables. Statistical analysis (paired samples t-test)
on preliminary data (data from Dr. Rose) revealed that there were no significant
differences between right and left uterine hom. Two way analyses of variance
(ANOVA) of general linear model using the Systat 5.2 program on a Macintosh
machine were used for the overall test of effects of the day and Operation factors. One
way analysis of variance was also performed [Q analyse the effect of the Operation
factor in the specified days of operation. If the overall test was significant, a post-hoc
analysis of Tukey HSD-test was used for further analysis. According to statistical
theory, data in percenwges are binomially distributed, the deviation from nonnality
being greatest for small (0 - 33%) or large percentages (70 - 100%) (Zarr, 1974).
Such dam was transformed using arcsine transfonnation procedures before analysis.
The analytical results were then presented in their original fonn (percentages).
Regression or correlation analyses were used to examine a possible association
between two parameters. Paired samples Hest was also applied when appropriate. In this study, only differences belween mean at p < 0.05 were considered significant.
Chapter 3 Effects on Length of G estation and P renatal G rowth
3.1 Introduction
It has been well established that the onset of pamuition is timed by the fetus via
secretions of adrenal cortex (fetal cortisol) which results in an increased in oestrogen (E)
to progesterone (P) ratio. Increasing in EIP ratio will stimulate the uterine synthesis and
release of PGF20.' Mechanical events of parturition are activated by PGF2o;. me synthesis
and release of the PGF2a then enhanced by oxytocin as parturition proceeds (Thorburn,
1991; Johnson and Everitt, 1995). Thorburn (1991) proposed that the growth pattern of
the fetus represents a genetically programmed 'clock' which acts by stimulating
placental PG� production leading to maturation of key organ systems in the fetus and
finally parturition.
3.1.1 Litter S ize and Length of Gestation
An inverse relationship between liner size and the length of gestation is commonly
found in mammals, including the mouse. Biggers et ai. (1963) presumed that the
inverse relationship is modulated by two types of mechanism: 1) some local effect of
c
---------------------------------------------------�q
Ol<:pler3 Effects on Length of Gestation and Prenatal Growth 33
crowding, originating and acting in the uterus, or 2) a systemic effect, which may and
may not originate in the uterus, but which must nevertheless be related in some way to
the number of young carried. Further, in mice, Biggers et a1. (1963) have described an
experimental examination of this inverse relationship either by inducing a local uterine
overcrowding (by unilateral ovariectomy) or by halving the number of conceptuses
without interfering with the number of CL (by unilateral ligation of the Fallopian tube).
They found that the controlling influences originated from the conceptuses directly,
rather than the number of the CL formed in the ovary. They also showed that the effect
of litter size operated systemically rather than locally. This shows that the length of
gestation period is inversely related to litter size (Biggers et al.. 1963; Dewar, 1968),
irrespective both of their distribution between uterine horns and of the number of
corpora lutea (Biggers et aI., 1963). Since the length of gestation is unaffected by the
distribution of the conceptuses berween the two uterine horns, as reported by Biggers et
al. (1963), it might be concluded that the litter size effect operates systemically rather
than locally.
Similar results have previously been reported in the rabbit (Hammond, 1934), guinea
pigs and man (Widdowson, 1968) and also in the pig (Martin et al., 1978). These
provide evidence that the greater the number of the fetuses, no maner how they are distributed in the uterine hom. the earlier they are born and the lighter their birth weight.
Of factors influencing the growth rate of the fetus, the supply of maternal blood to the
placenta, the size of the placenta and the nutrition state of the mother are the important
factors (Widdowson, 1968). However, it has been shown that in mice this effect was
not continuously linear over the range of litter size (Dewar, 1968). In addition, Holinka
et al. (1978) failed to detect a significant effect of litter size on the length of gestation in
the 3 - 7 months-old age of mice even though this effect was very significant in the older
( 1 1 - 12 months-old age) mice. They suggested that the major factor in prolongation of
pregnancy in the older mouse was the retardation in the decrease of progesterone levels
at the end of gestation period.
An experimental analysis to describe the nature of the systemic effect of litter size on
gestation period in rrtice was constructed by McLaren and Michie (1 963). They showed
that the total mass of fetal or placental tissue affects the length of gestation directly.
irrespective of number in the uterine horns. In this case, the weight of conceptuses was
inversely related to the length of gestation period. However, whether the influence
regulating the onset of parturition solely exerted by the fetuses or placenta or both
remains unclear. Biggers el al. ( 1963) failed to detect a mechanical effect of liner size in
_, __________________________ 4
Olcpter3 Effects on Length of Gestation and Prenatal Growth 34
regulating the length of gestation since the stretching of the uterine wall does not appear
to induce parturition by increasing uterine irritability. One way in which litter size might
affect the length of gestation would be if oestrogen, produced by the placenta, stimulates
the uterus to become responsive to oxytocin (Biggers et ai., 1963).
The involvement of the placenta in regulating the length of gestation period has become
obscured since Harkness et al. (1964) failed to detect any oestrogen in the mouse
placenta. In addition, Dewar (1968) also failed to show the effect of a physiological
dose of oestradiol on the length of gestation period, but with higher doses pregnancy
was significantly prolonged. The answer to the question of whether the fetuses or
placenta or their combination is involved in regulating the length of gestation was
revealed by McLaren (1967), who proposed that the length of gestation is affected more
by the fetuses mass, no matter whether it is produced by a greater number of feruses or
by an increase in their mean weight, rather than placental factors.
Kihlstrom (1972) has produced a literature review on the relation between period of
gestation and body weight in some placental mammals. After examining data from about
208 species, varying in weight from 10 to lOS g, he found that the length of gestation
(G) was related to body weight (W) by the equation G = a. Wh. The numerical value of
parameter a varies with the type of placenta, while the exponent b is approximately the
same for all terrestrial animals. Kihlstrom also found that the size and developmental
stage of the newborn animals is likely to be related to the length of gestation.
3.1.2 Utero-ovarian Relationship and Length of Gestation
In the pig, like in mice, the ovary is necessary throughout pregnancy and CL is
regressed at tenn. The disconnection of the nomal anatomical relationship between the
uterus and ovary (by transplanting the ovary to the uterus or the abdominal Wall, or by
removing one uterine horn and its contra lateral ovary) has no effect on the length of
gestation of the pig (Martin et aI., 1978). Since the levels of both oestrogen and
progesterone were also unaltered after treatment in this study, Martin et al. (I978)
concluded that the usual connection between the uterus and the ovary is not an absolute
requirement for pregnancy maintenance and parturition.
3.1 .3 Objectives
This srudy attempted to examine the effect of removal of one uterine horn on the prenatal
___________________________________________________ �4
Olzpler3 Effects on Length of Gestation and Prenatal Growth 35
growth in Ihe remaining uterine horn of the mouse. Removal of the uterine hom was
carried out in two ways, ie. by cutting one uterine hom only and by cutting the hom
with its ipsilateral ovary, and on four different days of pregnancy, ie. day 2, 6, 10, and
14 of pregnancy. Before examining the effect on prenatal growth, examination on the
effect of me reduction of the conceptuses into a half of normal number on length of
gestation was made. The possible effect of the uterine hom removal on the development
of the uterine vasculature, especially on the arteries supplying blood to the uterus and/or
to the placenta, was also examined.
3.2 Methods
3.2.1 Oetennination of Gestation Length
Ninety·six pregnant mice were used in the investigation of gestation length. The initial
weight of the animals (at the day of vaginal plug) varied from between 26.00 to 49.00 g
and mean (± SO) of 35.55 ± 4. 31 . The animals were caged in groups of 3 or 4 and
randomly placed in 12 groups of 8 at the time of surgical operation. The environmental
conditions, with respect to room temperature and lighting period are described in
Chapter 2.
Pregnancies were visually timed from the finding of vaginal plug. Only the animals with
vaginal plug in the morning of examination were directly included for experimental
observation. The remaining animals (without a vaginal plug on the morning of
examination) were separated from the males and were kept separate for at least 10 days
after mating, during which period they were weighed daily. In this case, in an animal without a vaginal plug but showing a significant increase in body weight, the age of
pregnancy could be referred to that of animals with a vaginal plug. The day of vaginal
plug or the day of separation from male (for animals without vaginal plug) was
designated as day 0 of pregnancy and the end of day 0 of pregnancy was taken as
midnight after the morning on which the plug was found.
As day 17 of pregnancy approached, the mice were separated and placed into small
individual cages. The animals were then checked for births three times a day during
daylight period between 0600 - 0700 h (morning). 1200 - 1300 h (mid day), and 1800 _
1900 h (late afternoon).
Except for weighing, surgical procedures, cage cleaning. feeding and watering. and
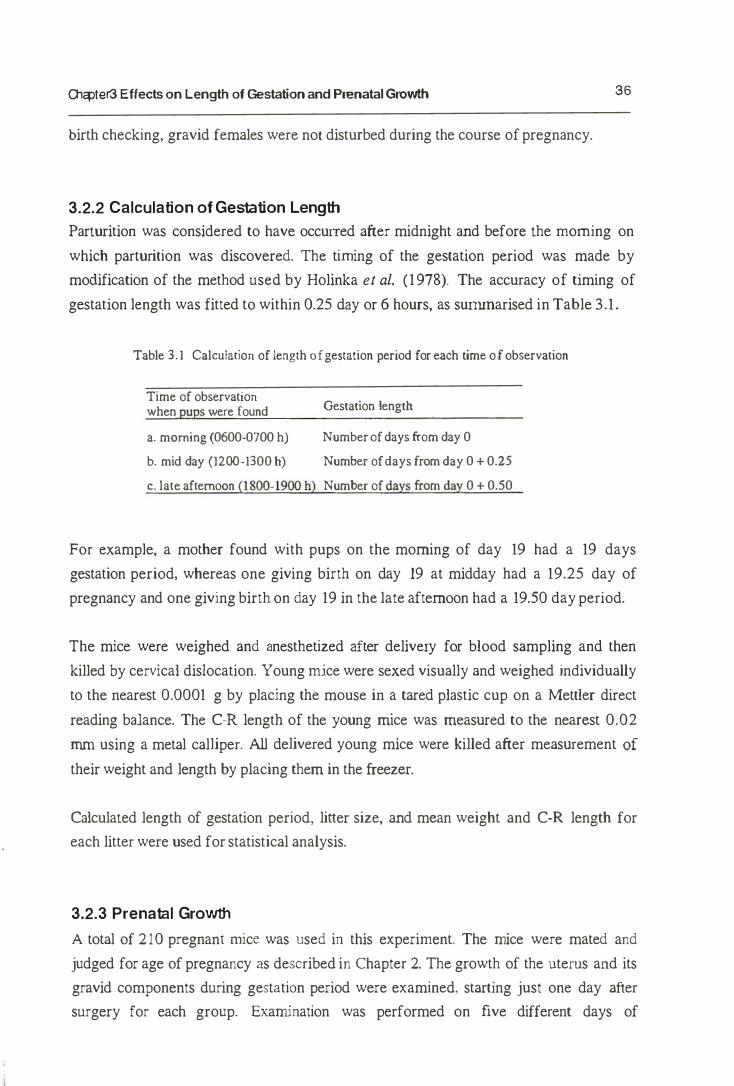
� . ,, ____________________________________________ --'4
Qlc;pter3 Effects on Length of Gestation and Prenatal Growth 36
birth checking. gravid females were nor disturbed during the course of pregnancy.
3.2.2 Calculation of Geslation Lenglh
Parturition was considered to have occurred after midnight and before the morning on
which parturition was discovered. The timing of the gestation period was made by
modification of the method used by Holinka ef of. (1978). The accuracy of timing of
gestation length was fitted to within 0.25 day or 6 hours, as surrunarised in Table 3.1.
Table 3.1 Calculation of length of gestation period for each time of observation
Time of observation when pups were found
a. morning (0600-0700 h)
b. mid day (1200-1300 h)
Gestation length
Number of days from day 0
Number of days from day 0 + 0.25
C. late afternoon (1800-1900 h) Number of days from day 0 + 0.50
For example, a mother found with pups on the morning of day 19 had a 19 days
gestation period, whereas one giving birth on day 19 at midday had a 19.25 day of
pregnancy and one giving birth on day 19 in the late afternoon had a 19.50 day period.
The mice were weighed and anesthetized after delivery for blood sampling and then
killed by cervical dislocation. Young mice were sexed visually and weighed individually
to the nearest 0.0001 g by placing the mouse in a tared plastic cup on a Mettler direct
reading balance. The C-R length of the young mice was measured to the nearest 0.02
nun using a metal calliper. All delivered young mice were killed after measurement of their weight and length by placing them in the freezer.
Calculated length of gestation period, liner size, and mean weight and C-R length for
each litter were used for statistical analysis.
3.2.3 Prenatal Growth
A total of 210 pregnant mice was used in this experiment. The mice were mated and
judged for age of pregnancy as described in Chapter 2. The growth of the uterus and its
gravid components during gestation period were examined, starting just one day after
surgery for each group. Examination was performed on five different days of
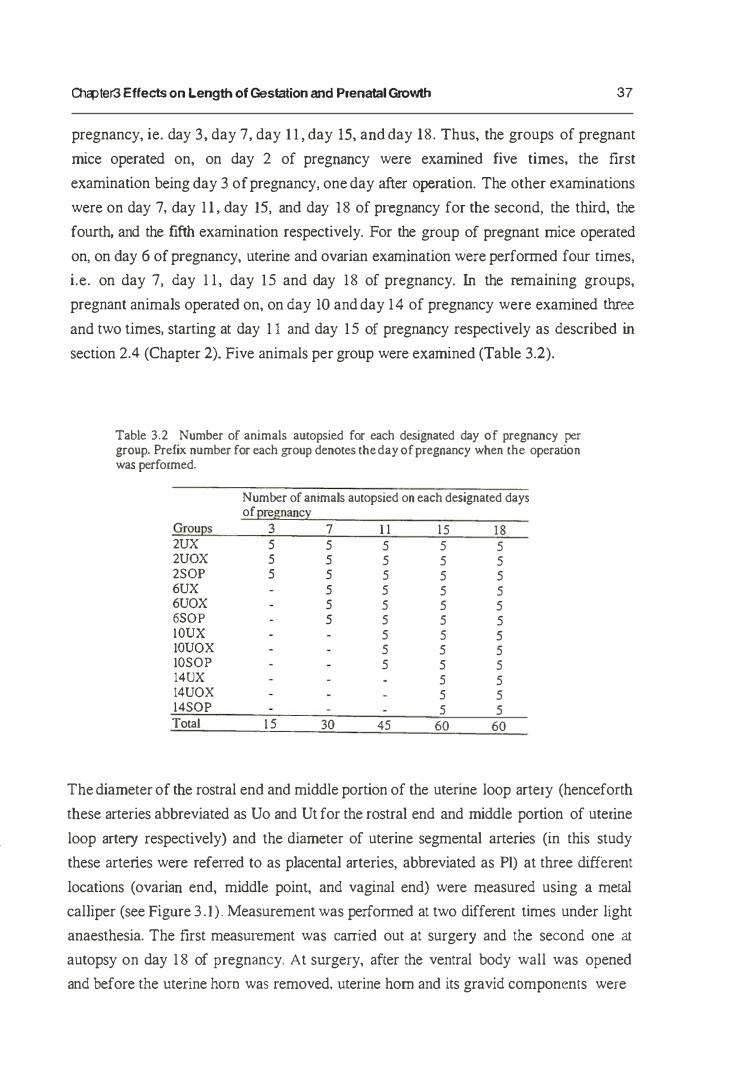
.. , .......................................... --------------�c i
O1cpter3 Effects on length of Gestation and Prenatal Growth 37
pregnancy, ie. day 3, day 7, day 1 1 , day 15, and day 18. Thus, the groups of pregnant
mice operated on, on day 2 of pregnancy were examined five times. the first
examination being day 3 of pregnancy. one day after operation. The other examinations
were on day 7, day 1 1 , day 15, and day 18 of pregnancy for the second, the third, the
fourth. and the fifth examination respectively. For the group of pregnant mice operated
on, on day 6 of pregnancy, uterine and ovarian examination were performed four times.
i.e. on day 7, day 1 1, day 15 and day 18 of pregnancy. In the remaining groups,
pregnant animals operated on, on day 10 and day 14 of pregnancy were examined three and two times, starting at day 1 1 and day 15 of pregnancy respectively as described in section 2.4 (Chapter 2). Five animals per group were examined (Table 3.2).
Table 3.2 Number of animals autopsied for each designated day of pregnancy per group. Prefix number for each group denotes the day of pregnancy when the operation was performed.
Number of anima1s autopsied on each designated days of Qregnancy
Groups 3 7 I I 15 18 2UX 5 5 5 5 5 2UOX 5 5 5 5 5 2S0P 5 5 5 5 5 6UX 5 5 5 5 6UOX 5 5 5 5 6S0P 5 5 5 5 10UX 5 5 5 IOUOX 5 5 5 IOS0P 5 5 5 14UX 5 5 14UOX 5 5 14S0P 5 5 Total 15 30 45 60 60
The diameter of the rostral end and middle portion of the uterine loop artery (henceforth
these arteries abbreviated as Uo and Ut for the rostral end and middle portion of uterine
loop artery respectively) and the diameter of uterine segmental arteries (in this study
these arteries were referred to as placental arteries, abbreviated as PI) at three different
locations (ovarian end, middle point, and vaginal end) were measured using a metal
calliper (see Figure 3.1). Measurement was perfonned at two different times under light
anaesthesia. The first measurement was earned out at surgery and the second one at
autopsy on day 1 8 of pregnancy. At surgery, after the ventral body wall was opened
and before the uterine hom was removed, uterine hom and its gravid components were
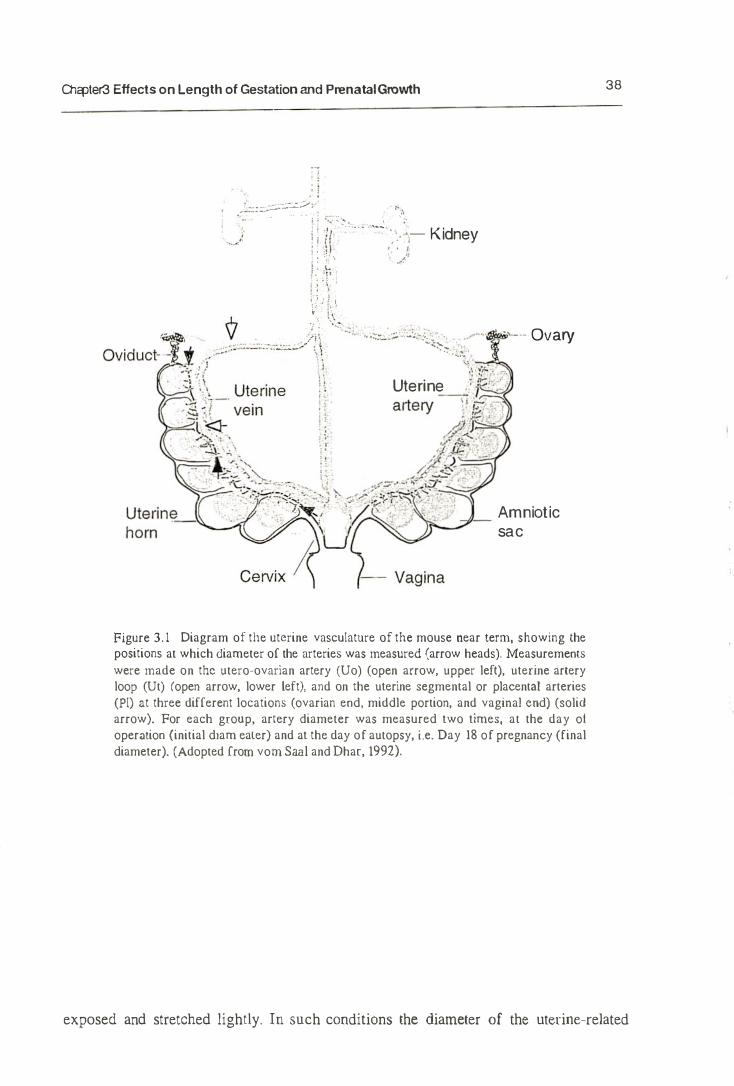
-·--------------_4
Olcpter3 Effects on Length ot Gestation and Prenatal Growth
.' ! "-�:�'�-':'::':::/' . � �
-' ! : II' ,-,,� - . -,: ,< :.- Kidney I ' I j I : ': "
�,,.
h�
" -"" �<,_ r-t� .. Ovary
•
Uterine ,� �f. .. ,.,. .; ''':..'';:".-
Amniotic sac
Figure 3, 1 Diagram of the uterine vasculature of the mouse near lenn, showing the positions at which diameter of the arteries was measured (arrow heads). Measurements
were made on the utero-ovarian artery (Uo) (open arrow, upper left), uterine artery loop (Ut) (open arrow, lower [eft), and on the uterine segmental or placental arteries (PI) at three different locations (ovarian end, middle portion, and vaginal cnd) (solid arrow), For each group, artery diameter was measured two times, at the day of operation (initial dlam eater) and at the day of autopsy, Le. Day 18 of pregnancy (final diameter). (Adopted from vom Saa] and Dhar, 1992).
38
exposed and stretched lightly. In such conditions the diameter of the uterine-related
,
- -----------------------------------------------------.... --.. --.................... .
O1cpter3 Effects on Length of Gestation and Prenatal Growth 39
arteries was determined easily to the nearest 0.02 mm by usmg a metal calliper. A
similar procedure was applied when measuring the artery diameter at autopsy on day 1 8
of pregnancy. Measurement on day 1 8 of pregnancy was performed before the blood
sample was collected.
After bleeding, mice were killed for the uterine examination by cervical dislocation. The
remaining uterine hom (for both UX and UOX groups) or intact uterus (for the SOP
group) and its ovary was removed, weighed and then placed in a petri dish containing
0.9% (w/v) NaCI solution until examined for gravid components (for horns obtained
from day 18 of pregnancy) or until fixing in Bouin's solution (for horns obtained from
days 3, 7. 1 1 , and I S of pregnancy).
All uterine horns and ovaries collected from the groups of animals at day 18 of
pregnancy were examined on collection. After opening the uterus, conceptuses (fetuses,
fetal membranes. and placentae) were removed in order from the ovarian end to the
vaginal end of the uterine horn. For the SOP group, the left uterine hom was examined
first before the right one. Each conceptus was opened and exarnlned before the next
conceptus was removed following Norman and Bruce ( l979b). The number of live
fetuses was recorded, dissected free from their membranes, separated from their
umbilical cords, blotted lightly by transferring them four times on dry petri dish
surfaces. sexed visually, and immediately weighed individually to the nearest 0.0001
gram on a Mettler direct reading balance. Visual determination of fetal sex was made by
observing the ano-genital papilla distance, where the distance is larger in males than in
females (Gruneberg. 1952; Rugh. 1967). Fetal C-R length was determined to the
nearest 0.2 rnrn using a metal calliper. Each placenta was carefully separated from its
umbilical cord and from feral membranes, blotted lightly as for feruses, and weighed.
Care was taken to remove the anached fetal membranes from both the fetus and the
placenta. The remaining uterine rissue plus embryonic membranes and umbilical cord
were carefully bloued lightly by transferring them onto dry petri dish surfaces four times
and weighed totally. The total amount of fetal fluid per horn was obtained by subtraction
of total feral weight, total placental weight, and total empty uterine tissue, embryonic
membranes and umbilical cord from the total weight of uterine horn (McLaren et ai.,
1976). This entire procedure, i.e. preparation. separation of uterine tissue, fetus, and
placenta from the embryonic membranes, was conducted on a filter paper moistened
with saline solution. This procedure was performed on the live conceptuses only.
Ovaries were examined for weight and number of corpora lutea after all the excessive fat
covering the ovary was removed. The number of corpora IUlea was counted visually
I
_, ______________________________________________ -.u
, l .
Olapter3 Effects on Length of Gestation and Prenatal Growth 40
under dissecting microscope. Corpora lutea were counted in a petri dish three before
recording as a unit of data .
Because the uterine horn and its gravid components were more difficult to distinguish
and separate by morphology before day 18 of pregnancy, they were not dissected for
fresh weight measurements. The uterine horns from day 3, day 7, day I I, and day 15
of pregnancy, therefore, were fixed in Bouin's solution until examined. These uterine
horns and their gravid components were examined under a dissecting microscope at low
magnification.
When examining the fixed uterine horns, the strong smell of Bouin's solution was first
removed by washing them in slow running tap water for about 2 minutes. After opening
the merine hom, conceptuses were removed in order. Fetuses and placentae (from I I
and 15 days old) were separated from their membranes and/or its umbilical cord, blotted
slightly by transferring them to filter paper as many as four times, sexed visually,
weighed individually and detennined for C-R length of fetus as described for fresh
examination. The remaining uterine tissue plus fetal membranes and umbilical cord were
weighed totally as empty uterus. The amount of fetal fluid per horn was calculated as for
fresh examination of uterine horn from day 18 of pregnancy.
The uterus obtained from day 3 of pregnancy was examined for uterine weight only
when day 7 uterine horn was examined for boch uterine weight and conceptus weight.
Fetal weight, placental weight and fetal C-R length were averaged per hom before being
used for statistical analysis. Therefore, for the SOP group, which had two uterine
horns, the mean values of the right and the left horn for each parameter were averaged.
3.3 Results
3.3.1 length of Gestation
a. Time and day of Parturition
Distribution of animals for each group on the time and day of partwition is given in
Table 3.3. Most animals gave birth in the early morning, and parturition at mid-day and
late-afternoon was rare. The overall time of birth were 68.8%, 9.4%. and 2 1 .9% for
early morning. mid-day, and late-afternoon respectively. This distribution pattern of
time of birth was generally found i n the UX and UOX. but not in SOP groups. Almost
"
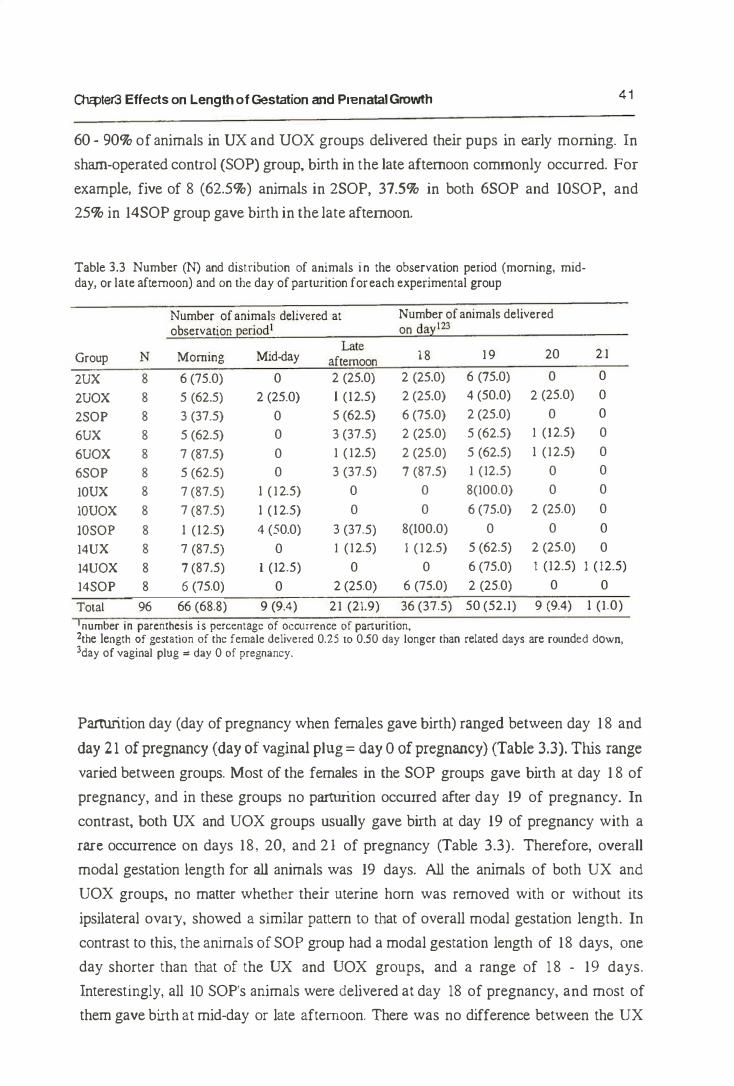
Olcpter3 Effects on Length of Gestation and PrenataJ Growth 41
60 � 90% of animals in UX and VOX groups delivered their pups in early morning. In
sharn�opera[ed control (SOP) group, birth in the late afternoon commonly occurred. For
example, five of 8 (62.5%) animals in 2S0P, 37.5% in both 6S0P and IOSOP, and
25% in 14S0P group gave birth in the late afternoon.
Table 3.3 Number (N) and distribution of animals in the observation period (morning, mid-day, or late afternoon) and on the day of parturition for each experimental group
Number of animals delivered at Number of animals delivered observation period! on da:z:123
La" 1 8 1 9 20 2 1 Group N Morning Mid-day afternoon
2UX 8 6 (75.0) 0 2 (25.0) 2 (25.0) 6 (75.0) 0 0
2UOX 8 5 (62.5) 2 (25.0) I (12.5) 2 (25.0) 4 (50.0) 2 (25.0) 0
2S0P 8 3 (37.5) 0 5 (62.5) 6 (75.0) 2 (25.0) 0 0
6UX 8 5 (62.5) 0 3 (37.5) 2 (25.0) 5 (62.5) I (12.5) 0
6UOX 8 7 (87.5) 0 1 (12.5) 2 (25.0) 5 (62.5) I (12.5) 0
6S0P 8 5 (62.5) 0 3 (37.5) 7 (87.5) 1 (12.5) 0 0
10UX 8 7 (87.5) I (12.5) 0 0 8(100.0) 0 0
IOUOX 8 7 (87.5) I (12.5) 0 0 6 (75.0) 2 (25.0) 0
IOS0P 8 I (12.5) 4 (50.0) 3 (37.5) 8(100.0) 0 0 0
14UX 8 7 (87.5) 0 I (12.5) I (12.5) 5 (62.5) 2 (25.0) 0
14UOX 8 7 (87.5) 1 (12.5) 0 0 6 (75.0) I (12.5) 1 (12.5)
14S0P 8 6 (75.0) 0 2 (25.0) 6 (75.0) 2 (25.0) 0 0
Total 96 66 (68.8) 9 (9.4) 21 (21.9) 36 (37.5) 50 (52.1) 9 (9.4) I (1.0) lnumber in parenthesis is percentage of occurrence of panurition, 2the length of gestation of the female delivered 0.25 to 0.50 day longer than related days are rounded down, 3day of vaginal plug = day 0 of pregnancy.
Parturition day (day of pregnancy when females gave birth) ranged between day 1 8 and
day 2 1 of pregnancy (day of vaginal plug = day 0 of pregnancy) (Table 3.3), This range
varied between groups. Most of the females in the SOP groups gave birth at day 1 8 of
pregnancy, and in these groups no parturition occurred after day 19 of pregnancy. In
contrast, both UX and UOX groups usually gave birth at day 19 of pregnancy with a
rare occurrence on days 18. 20. and 2 1 of pregnancy (Table 3.3). Therefore. overall
modal gestation length for all animals was 19 days. All the animals of both UX and
UOX groups, no matter whether their uterine horn was removed with or without its
ipsilateral ovary, showed a similar pattern to that of overall modal gestation length. In
contrast to this. the animals of SOP group had a modal gestation length of 18 days, one
day shorter than that of the UX and UOX groups, and a range of 18 � 19 days.
Interestingly, all 10 SOP's animals were delivered at day 18 of pregnancy. and most of
them gave birth at mid�day or late afternoon. There was no djfference between the UX

.; ...... ______________________________________ __.c
Olc:pter3 Effects on Length of Gestation and Prenatal Growth 42
and VOX groups in the distribution of animals on day of panurition (fable 3.3).
Parturition on day 21 of pregnancy was a very rare occurrence for all groups. In this
study, only one of 96 animals gave birth on day 21 of pregnancy.
b. Liller Size and Length of Gestation In general, with one exception in the 6S0P
group, mean body weight of females at the day of parturition (final body weight)
remained higher than on day 0 of pregnancy (day of vaginal plug) (initial body
weigbt)(Table 3.4). Mean percentages in final and initial body weight differences varied
between 10 - 30% of initial body weight (except for 6S0P group which had a negative
value of -0.59%), These differences were statistically significant (p < 0.05) in almost all groups, except in the 6UOX, 6S0P, and lOUX groups. However, neither day factors
nor Operation factors nor their combination influenced significantly the percentage of
female body weight increase.
Table 3.4 also shows that the size of litter per female for all groups varied between 2
and 18. The smallest size was found in the 2UOX group and the biggest one in the
6S0P group. For all days of operation, the removal of one uterine hom, whether it was
followed by the removal of its ipsilateral ovary or not, significantly reduced litter size by
almost 50% compared to their sham-operated control (SOP) groups. However, removal
of one ovary following the removal of one uterine hom had no significant effect on the
size of litter. For each day of operation, the size of litter in the UX group was the same
as in the UOX groups except at day 6 of pregnancy where litter size of the UOX group
was significantly higher than that of UX group (Table 3.4). The age of pregnancy when
the uterine horn was removed (day factors) and combination of the day and Operation
factors had no effect on liner size. Thus, the animals operated on, on day 14 of
pregnancy showed a similar panern in their litter size to the animals operated on, on the
other days of pregnancy regardless of whether operation techniques of UX or UOX or
SOP were used.
For each day of operation, the gestation period in both the UX and UOX groups tended
to be longer, but still not significantly, than that of the SOP groups (Table 3.4). The
difference in length of gestation period was significant if the data was pooled on the
Operation groups (UX, UOX and SOP groups) without considering the day factors
(Figure 3.2). Mean (± SEM) lengths of gestation period of UX group ( 19.03 ± 0.08)
and UOX group (19.19 ± 0. 1 1 ) were significantly longer than SOP group (18.39 ±
0.06) days (p < 0.001). This suggests that the reduction of the liner to a half of its
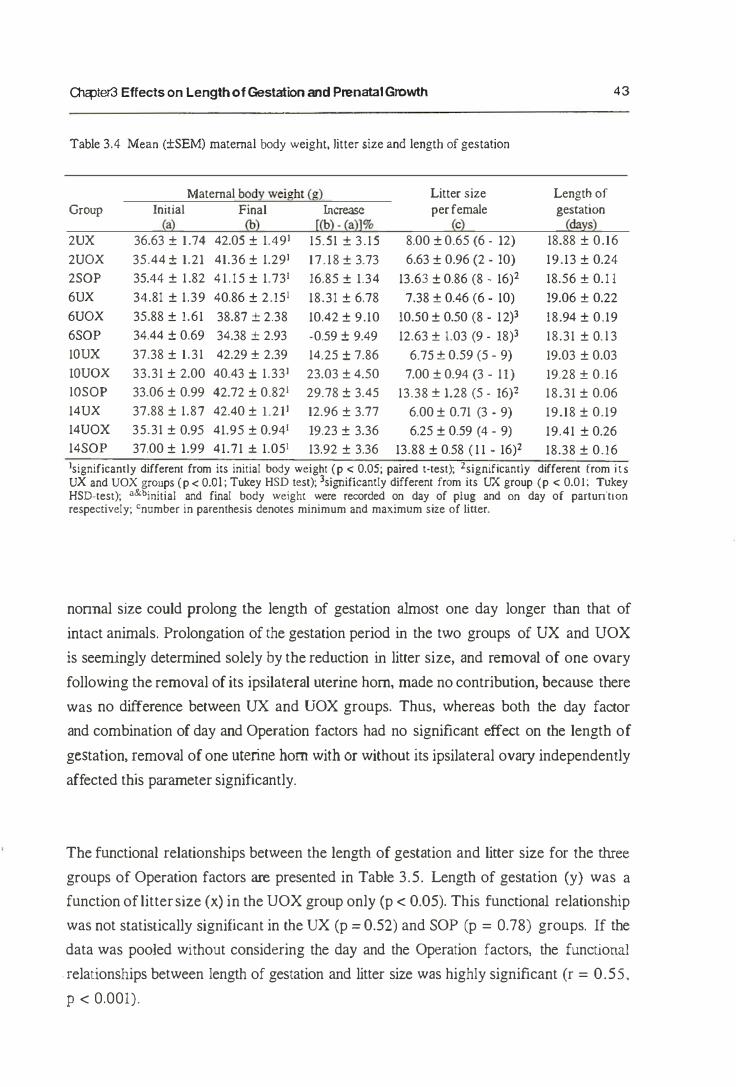
.' _______________________ c
�ter3 Effects on Length of Gestation and Prenatal Growth
Table 3.4 Mean (±SEM) maternal body weight, litter size and length of gestation
Group
2UX 2UOX 2S0P 6UX 6UOX 6S0P IOUX IOUOX lOSOP 14UX 14UOX 14S0P
Maternal body weight {g) Initial Final
(a} (h) 36.63 ± 1 .74 42.05 ± 1.491 35.44 ± 1.21 41.36 ± 1.291 35.44 ± 1 .82 4 1 . 1 5 ± 1.731 34.81 ± 1.39 40.86 ± 2.151 35.88 ± 1.61 38.87 ± 2.38 34.44 ± 0.69 34.38 ± 2.93 37.38 ± 1.31 42.29 ± 2.39 33.31 ± 2.00 40.43 ± 1.331 33.06 ± 0.99 42.72 ± 0.821 37.88 ± 1.87 42.40 ± L2J1 35.31 ± 0.95 41.95 ± 0.941 37.00 ± 1.99 41.71 + 1.05[
Increase [(h) -(all% 15.51 ± 3.15 17.18 ± 3.73 16.85 ± 1.34 18.31 ± 6.78 10.42 ± 9.10 -0.59 ± 9.49 14.25 ± 7.86 23.03 ± 4.50 29.78 ± 3.45 12.96 ± 3.77 19.23 ± 3.36 13.92 ± 3.36
Litter size per female
(c} 8.00 ± 0.65 (6 - 12) 6.63 ± 0.96 (2 - 10)
13.63 ± 0.86 (8 - 16)2 7.38 ± 0.46 (6 - 10)
10.50 ± 0.50 (8 - 12)3 12.63 ± 1.03 (9 - 18)3
6.75 ± 0.59 (5 - 9) 7.00 ± 0.94 (3 - 11)
13.38 ± 1.28 (5 - 16)2 6.00 ± 0.71 (3 - 9) 6.25 ± 0.59 (4 - 9)
13.88 ± 0.58 ( 1 1 - 16)2
43
Length of gestation
(days2 18.88 ± 0.16 19.13 ± 0.24 18.56 ± 0.1 1 19.06 ± 0.22 18.94 ± 0.19 18.31 ± O. l 3 19.03 ± 0.03 19.28 ± 0.16 18.31 ± 0.06 19.18 ± 0.19 19.41 ± 0.26 18.38 ± 0.16
[significantly different from its initial body weight (p < 0.05; paired t·test); 2signific3ntly different from its UX and UOX groups (p < 0.0 I ; Tukey HSD test); 3significantly different from its UX group (p < 0.0 I; Tukey HSD.test); a& initial and final body weight were recorded on day of plug and on day of parturitIOn respectively; cnumber in parenthesis denotes minimum and maximum size of liner.
nonnal size could prolong the length of gestation almost one day longer than that of
intact animals. Prolongation of the gestation period in the two groups of UX and VOX
is seemingly determined solely by the reduction in litter size, and removal of one ovary
following the removal of its ipsilateral uterine horn, made no contribution, because there
was no difference between UX and UOX groups. Thus, whereas both the day factor
and combination of day and Operation factors had no significant effect on the length of
gestation, removal of one uterine hom with or without its ipsilateral ovary independently
affected this parameter significantly.
The functional relationShips between the length of gestation and litter size for the three groups of Operation factors are presented in Table 3.5. Length of gestation (y) was a
function of litter size (x) in the UOX group only (p < 0.05). This functional relationship
was not statislically Significant in the UX (p :::;: 0.52) and SOP (p = 0.78) groups. If the
data was pooled without considering the day and the Operation factors, the functional
. relationships between length of gestation and litter size was highly significant (r = 0.55,
P < 0.001).
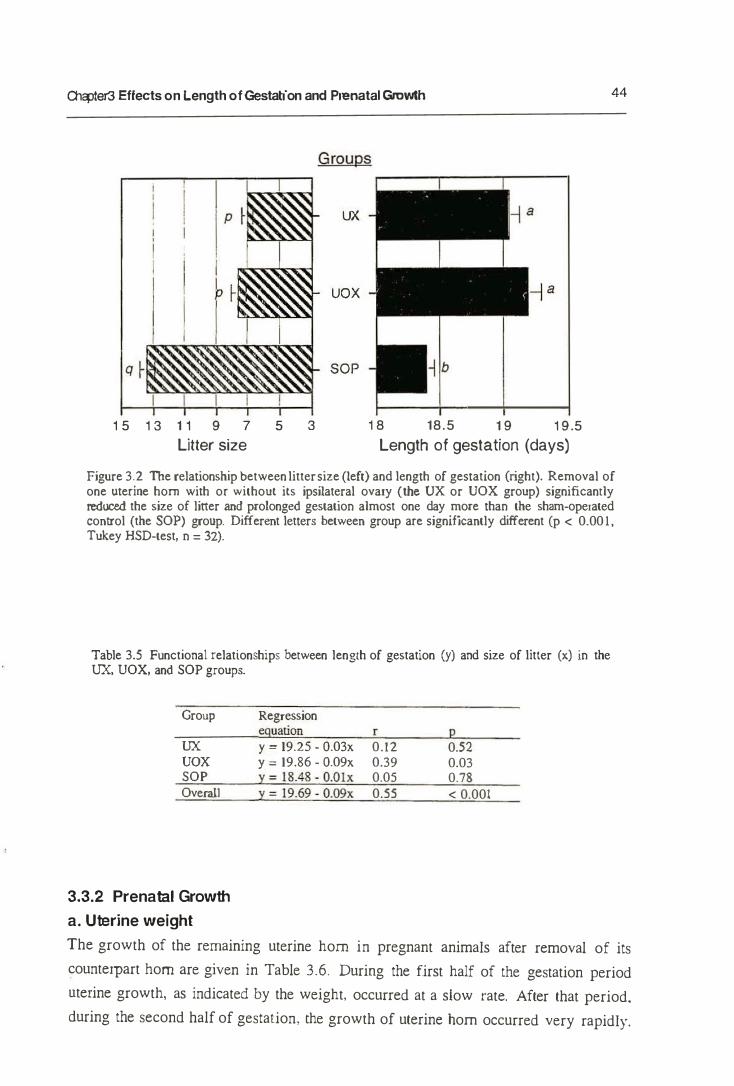
.:_------------------
O\cpter3 Effects on length of Gestation and Prenatal Growth
1 5 1 3 1 1 9 7
Litter size 5 3
Groups
ux
uox
SOP
a
1 8 18.5 1 9 1 9.5
Length of gestation (days)
44
Figure 3.2 The relationship between litter size (left) and length of gestation (right). Removal of one uterine horn with or without its ipsilateral ovary (the UX or UOX group) significantly reduced the size of liner and prolonged gestation almost one day more than the sham-operated conlrol (the SOP) group. Different letters between group are significantly different (p < 0.001, Tukey HSD-test. n = 32).
Table 3.5 Functional relationships between length of gestation (y) and size of litter (x) in the UX, UOX, and SOP groups.
Group
UX uox SOP OvernJ
3.3.2 Prenatal Growth
a. Uterine weight
Regression equation , p Y - 19.25 - O.03x 0.12 0.52 y = 19.86 - O.09x 0.39 0.03 y - 18.48 - O.Olx 0.05 0.78 Y - 19.69 - O.09x 0.55 < 0.001
The growth of the remaining uterine horn in pregnant animals after removal of its
counterpart horn are given in Table 3.6. During the first half of the gestation period
uterine growth, as indicated by the weight, occurred at a slow rate. After that period. during the second half of gestation, [he growth of uterine horn occurred very rapidly.
.............. ------------------------------------------�.
Ol.:pler3 Effects on Length of Gestation and Prenatal Grov.tth 45
From day 1 1 to day 15 of pregnancy, the growth rate increased dramatically; the weight
of the whole uterine horn for day 1 1 of pregnancy was below one gram while the value
for day 15 of pregnancy varied between 4 to 5 grams or more. A more dramatic increase
in growth of the uterine hom occurred from day 15 to day 18 of pregnancy_ The figure
for day 18 of pregnancy ranged between 10 to 18 grams (see Table 3.6, by day and
Operation). The same tendency was observed for empty uterine tissue weight (after their
gravid components, except the embryonic membranes, were removed). However, the
percentage of uterine tissues relative to the whole uterine weight decreased with the age
of pregnancy. There were no differences between group of day and Operation in the
uterine hom weight (either in whole, empty uterine tissue or percentage of empty uterine
tissue) during the gestation period examined. Therefore, it is likely that both day factor
and Operation factor were worked separately and their influence on weight of the
remaining Olerine hom were petformed independently (see the middle (By day) and the
bottom (By Operation) parts of TabIe 3.6).
The influence of the day factor (day of pregnancy when one uterine hom was removed)
on the weight of the remaining uterine horn was not as expected. Although differences
between group of day factors in uterine weight were detectable, these differences did not
appear in a regular way. Therefore, the expectation that females operated on earlier days
of pregnancy should have a heavier uterine weight than those operated on, on the later
days was not observed in this study.
Operation factors showed a more reasonable effect (see the lower part of Table 3.6, By
Operation) on uterine growth. In general, uterine weight (either whole, empty, or %
empty) of the operated females (either the UX or UOX group) was heavier than that of
unoperated females (SOP group). This difference was statistically significant on some
days of pregnancy aOlopsied, especially at day 15 and day 18 of pregnancy. However,
once again, the removal of one ovary following the removal of its ipsilateral uterine born
had no effect on the growth of the remaining uterine horn.
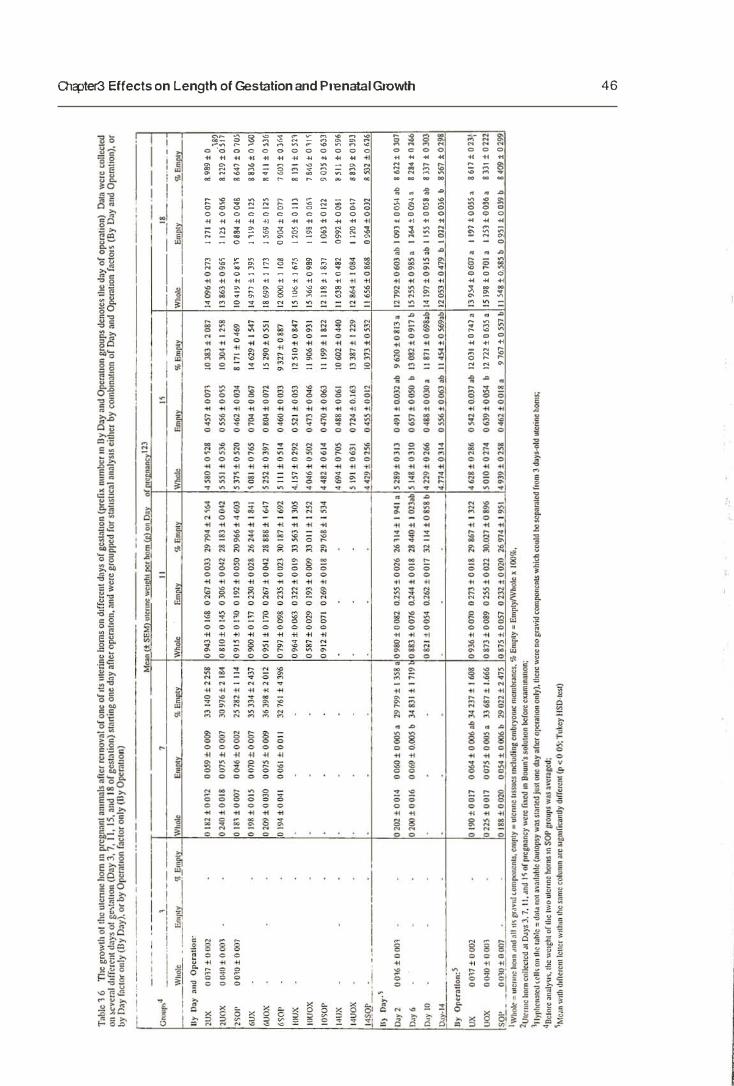
O1cpter3 Effects on Length of Gestation and Prenatal Growth
O� � � � � ! � � 5 � � ; 0:; 0 0 0 Q 0 0 0 0 0 0
... H .. .. .. .. .. .. .. .. .. � � i � ... § � : 8 � E � .. .. - .. � � � � � .. .. .
§ � � A � i " � E � � � o .,. .,. 0 0 0 .,. 0 0 0 0 .,. � � � � � � � � � � �
� E = � � 8 � � 8 � � J _ _ .,. _ _ 0 _ _ - 0 _ .,.
� � o 0 • •
;; * E s! S � o _ _ _ _ 0 .. .. .. .. .. ..
� e _ 0 • •
; ; § § e � .. ;a :! � S! ... .. '" ....
;; � . . .,. 0 .,. ; .. .. ... .. S � E s: .. .. - .. t .. t ... � s a :; o 0 0 .. .. .. .. .. § � !8 S
� ::: � o 0 0 • • • ; i:: § · . .
· .
a a � o 0 0 • • • � � :; _ _ 0
i i2 !!: <:> 0 0:; • • • � ! ;'l; :! :::: =
· . .
� � o 0 0 • • •
§ f:; � � ::: '"
=
46
1
.'--------------------------"-!!!
I i I I ,.
Olcpter3 Effects on Length of Gestation and Prenatal Growth 47
b. Uterine Artery Diameters
Figure 3.3 displays the mean diameter of arteries nourishing the uterine hom, measured
initially at operation days for each group and finally at day 18 of pregnancy. In this
case, removal of one uterine hom had a positive effect on the development of the arteries
supplying the blood to the remaining uterine hom since their diameter in operated
animals (UX and UOX groups) was higher than in sham-operated animals (SOP
group). However, this effect was time-dependent since only animals operated on, on
day 2 and day 6 of pregnancy showed significant differences in any parameters between
UX or UOX group and SOP group (see Figure 3.3B and C). For example, the mean (±
SEM) diameter of initial placental arteries (PI) in the UX animals operated on day 2 of
pregnancy was 0.20 ± 0.03 m.m (Figure 3.3A) and it reached a diameter of 1.05 ± 0.06
mm on day 18 of pregnancy (Figure 3.3B), an increase of about 500% from the initial
diameters (Figure 3.3C). The latest two values in the UX group were significantly
higher (p < 0.05) than the SOP group's values, ie. 0.71 ± 0.05 rnrn and 200%
respectively. A significant difference in this parameter was also found in animals
operated on day 6 of pregnancy. However, the removal of one uterine hom after day 6
of gestation had no significant effect on the development of the arteries nourishing the
remaining uterine hom or piacenme. The increase in percentage of the arteries' diameter
decreased with the stage of pregnancy when removal of one uterine horn was
performed. This phenomenon was observable in all groups of animals used and in all
arteries measured in this study (Figure 3.3C).
According to statistical analyses, the combination of the Operation factor and the day
factor had no effect on the artery diameter. These two factors, however, affected the
development of uterine artery diameter independently of each other. If the data collected
on day 18 of pregnancy was grouped by Operation factor, it was found that the Uo
diameters in the SOP group were significantly smaller than those of both the UX (p <
0.01) and the UOX (p < 0.05) groups. The Ut and PI diameters also showed similar
differences between the SOP group and the UX or UOX groups with the levels of
significance of p < 0.001 (UX) and p < 0.01 (UOX) for Ut, and p < 0.001 (both UX
and UOX group) for PI.
From the data obtained from normal pregnant animals on the days of operation, as
presented in Figure 3.3A, it can be concluded that the most critical stage of pregnancy
for the arteries development was different in different arteries. A very rapid development
of the PI arteries, as indicated by their values in percemage of increase between two
consecutive days of gestation when measurement was perfonned (data not shown). was
,.
�r3 Effects on Length of Gestation and Prenatal Growth 48
reached in the first half of the gestation period, especially between day 2 and day 6 of
pregnancy. After that period the development rate of arteries decreased gradually until
day 14 of pregnancy. In connast to this, the Ut and Uo showed constant development
during the gestation period examined. An even more rapid development in the Ut
diameter was found in the second half of gestation period, especially between day 1 0
and day 1 4 of pregnancy.
Figure 3.3 also shows that PI arteries underwent the most dramatic development during
the gestation period compared to both of the Ut and Uo arteries. For example, at day 2
of pregnancy, when animals were operated on, the mean (SEM) diameter of PI were
0.20 ± 0.03, 0.26 ± 0.03, and 0.26 ± 0.03 rnrn for UX, UOX and SOP groups
respectively (Figure 3.3A). These values increased dramatically during the gestation
period, reaching a value of 1.05 ± 0.06, 1.04 ± 0.04, and 0.71 ± 0.05 mrn respectively
for UX, UOX, and SOP groups on day 18 of pregnancy (Figure 3.3B). Thus, there
was an increase in PI diameter of about 500%, 300%, and 200% of that of initial
diarne!er for UX, UOX, and SOP groups respectively (Figure 3.3C). A! lhe same
period, the percentage increase in Ut diameters only reached a value of about 200%,
200%, and 180%; and Uo diarne!ers reached a value of 150%, 170%, and 140% for
UX, UOX, and SOP groups respectively.
c. Gravid Components
Gravid components of the uterus, ie. uterine tissue, fetal fluid, placentae and fetuses,
were exam.ined carefully at several days of gestation. The weight of empty uterine tissue
was found after all of the fetal fluid, placenta, and fetuses were removed. Placenta and
fetuses were easily removed from the uterus or from their membranes at day 18 of
pregnancy but not at earlier days of pregnancy. Uteri from females autopsied before day
18 of pregnancy were fixed in fixative solution, Bouin's solution, before examination.
In such a condition, the components of pregnant uterus could be removed and separated
as easily as at day 18 of pregnancy. Total placental weight and total fetal weight were
counted by totalled individual weight of the placenta and fetus for each uterine horn.
Toral weight of fetal fluid was found by subtracting the toral weight of placenta and
fetuses from weight of the intact uterine horn. The percentage of each gravid
component, relative to the total weight of the uterine horn, was then detennined. For
SOP groups which had two uterine horns, the gravid components of each hom were
counted separately then, the two values were averaged before being analysed.
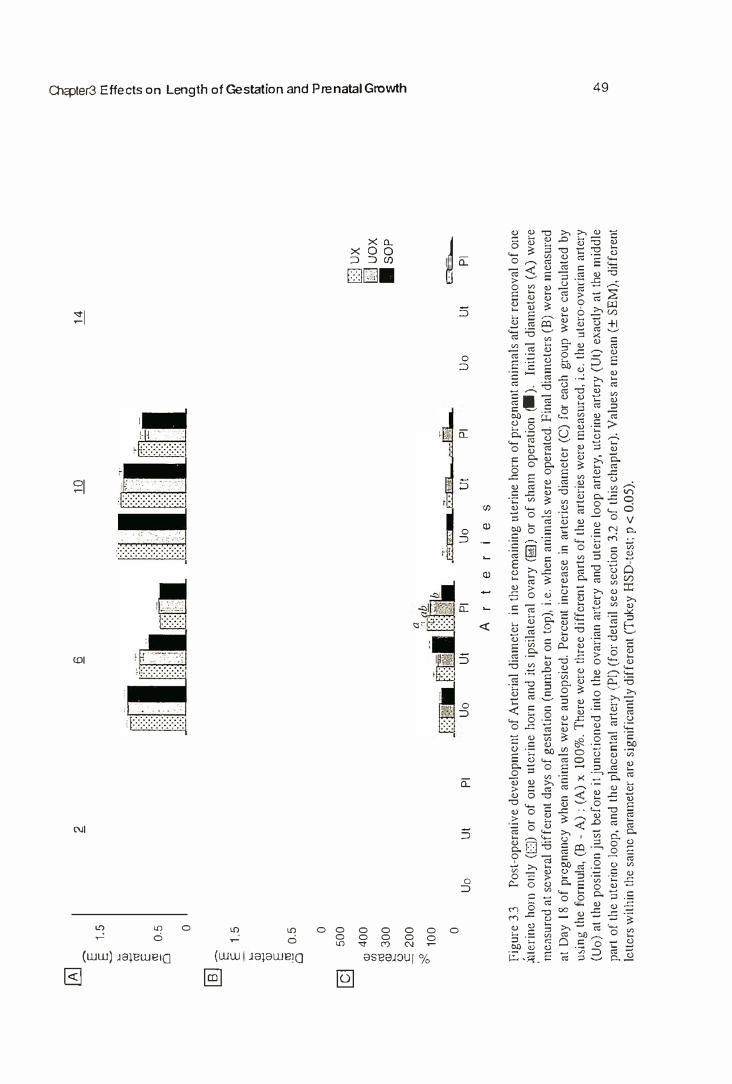
0
2 E
.s
1,5
�
w " E • 6
0.5 0
g
[I'
U�ltI
[ICIl
Q 1Q
... -
,-::::
. .:::
::-:.
- ,
D"':�'·· l[h
illI o
• •••. : D
b
11
OOE
2
[Q] E
1. 5
�
w 1ii E . !!! 0
5 o
' 0
5 00
w 4
00
" m 30
0 �
u
E 20
0 "
o
100 0
Uo
UI
PI
� , b
-== ",-
ii FR
.. -
" .LJ
I _
_ L:�
« ;'-:1
.r:'� E'1Ei1-
---=@L..
Uo
UI
PI
Uo
UI
PI
Ar
te
ri
es
Dux
[J
uox
.so
P
�=
�
Uo
U
I P
I
Fig
ure
3.3
Pos
t-op
eral
i ve
deve
lopm
ellt
of A
rter
ial
diam
eter
in
the
rem
aini
ng u
teri
ne h
orn
of p
regn
ant a
nim
als
afte
r re
mov
al o
f Ol
le
;t)lc
rinc
hom
0111
y (0
) or
of O
lle u
teri
ne h
orn
and
its
ipsi
late
ral
ovar
y (6)
or
of s
ham
ope
rutio
n (I
I). In
itia
l di
amet
ers
(A)
wer
e ' m
easu
red
at s
ever
al d
iffe
rent
day
s of
ges
tati
on (
num
ber
on l
Op),
i.e. w
hen
anim
als
wer
e op
erat
ed. F
inal
dia
met
ers
(E)
wer
e m
easu
red
at D
ay [
8 o
f pr
egna
ncy
whe
n an
imal
s w
ere
auto
psie
d. P
erce
nt i
ncre
ase
in a
rter
ies
diam
eter
(C
) fo
r ea
ch g
roup
wer
e ca
lcul
ated
by
min
g th
e fo
rmul
a, (8
.. A
) : (
A)
x 10
0%
. The
re w
ere
thre
e di
ffer
ent p
arts
of
the
arte
ries
wer
e m
easu
red,
i.e
. the
ute
ro-o
vari
an a
rter
y CU
o) a
t the
pos
itio
n ju
st b
efor
e it
junc
tion
ed in
to t
he o
vari
an a
rter
y an
d ut
erin
e lo
op a
rter
y, u
teri
ne a
rter
y (U
t) e
xact
ly a
t th
e m
iddl
e pa
rt o
f th
e ut
erin
e lo
op, a
nd t
he p
lace
ntal
art
ery
(PI)
(fo
r de
tail
see
sect
ion
3.2
of
this
cha
pter
). V
alue
s ar
e m
ean
(± S
EM
), d
iffe
rent
le
iter
s w
ithin
the
saill
e pa
ram
eter
are
sig
nifi
cant
ly d
iffe
rent
(T
ukey
HSD
-lcs
t; p
< 0
.05)
.
' r ]
i 01 m it :i; o
o .. o
'" 5' o
- Ii' � 0'
o § C.
'0 OJ o
� '" a � ,.
<0
•
Olcpler3 Effects on Length of Gestation and Prenatal Growth 50
A two way analysis of variance revealed that the combination effect of the day and
Operation factors on the uterine gravid component parameters was not significant. Data
was then combined in groups of both Operation and day factors separately. Figures 3.4
and 3.5 were constructed (Q represent the weight proportion of each gravid component
in groups of both Operation and day factors respectively.
Operation factors significantly affected the weight of the remaining uterine hom if the
pregnancy of treated females was allowed to continue until day 18. At day 1 8 of
pregnancy, mean weight of the remaining uterine horn in the UX and VOX group were
significantly higher than that of SOP groups (p < 0.05) (Figure 3.4, Table 3.6).
However, the removal of one ovary, ipsilateral to the removed Ulerine horn, had no
effect on the growth of the remaining uterine horn. There was no difference between the
merine weight of the UX and UOX group (Figure 3.4, Table 3.6). There were no
differences between operated and sham-operated control animals in the whole uterine
weight if autopsy was performed earlier than day 18 of pregnancy.
At day 3 of pregnancy, the mean total weight of the uterine horn of operated animals
was 0.04 g, slightly higher than sham-operated (SOP) control animals (0.03 g). At day
7 of pregnancy, the weight of the uterine horn reached a value of between 5 to 6 times
its original weight at day 3. At this time, the horn consisted of uterine tissues, decidual
tissue. and uterine fluid. This fluid comprised the largest proportion (about 40% of
uterine weight) of the uterine weight in the SOP group but only 23% and 27% in UX
and UOX groups respectively. The largest proportion of uterine content in the later two
groups was decidual tissue, i.e. 42% and 39% for the UX and UOX respectively.
However. there was no difference between groups in the proportion of gravid
components (Figure 3.4).
At day 1 1 of pregnancy. the uterus consisted of uterine tissue, fetal fluid, placentae and
fetuses in the proportion of 30 : 26 : 25 : 19 (in the UX group), or 30 : 23 : 28 : 1 9 (in
the UOX group). or 27 : 32 : 23 : 18 (in the SOP group). For all groups the highest
percentage of the total fetal fluid was reached at this stage of pregnancy. There was no
significant difference between groups either in these proportions of the gravid
components or in the total weight of the uterine horn. Total weights of the uterine horn
were 0.94, 0.87. and 0.88 g for the UX. UOX and SOP group respectively (Figure
3.4).
,
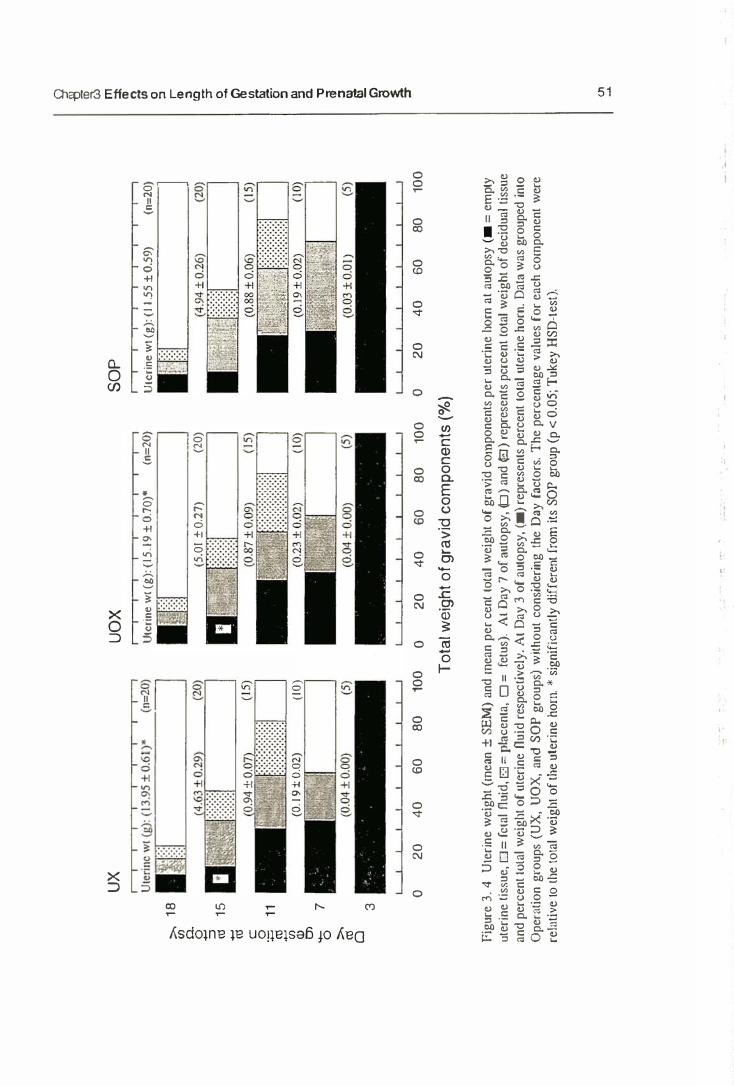
ux
>-18
'"
a.
0
- "
'" 15
- '" c
.2
11
- '" - "'
Q)
0>
-
7
0
>- '" 0
3 o
20
uo
x
, U
teri
ne
WI (
g):
(15
.19
± 0
.70
)·
(0=2
0)
I�IH
(5.0
1 ±
0.2
7)
(20
)
'·liiT:jJ
.-
--.-
--.
(O.1
9±
O.0
2)
(10
)
" p., q
40
6
0
I
80
10
0
0
20
4
0
60
8
0
100
To
tal w
eig
ht o
f gra
vid
co
mp
one
nts
(%j S
OP
Ule
rine
WI (
g):
(1
1.5
5 ±
0.5
9)
(n::
:20)
IFF I
I
o 2
0
40
6
0
80
100
Fig
ure
3. 4
U
leri
ne
wei
gh
t (m
ean
± S
EM
) an
d m
ean
pe
r cC
nllQ
lal
wei
gh
t o
f g
rav
id c
om
po
nent
s p
er
uter
ine
horn
at
auto
psy
(_ =
empt
y ut
erin
e ti
ssue
, 0 =
fcta
l fl
uid
,@=
pla
cen
ta,
0 =
fet
us).
A
I D
ay 7
of
auto
psy
, ¢:J) a
nd S
) rep
rese
nts
pcr
ccn
llo
lal
wei
gh
t o
f d
ecid
ual
tiss
ue
and
per
cen
t 10
lal
wei
gh
t o
f ut
erin
e n
uid
res
pec
tiv
ely
. At
Day
3 o
f au
top
sy, (_
) repr
esen
ts p
erce
nt t
Ola
l u
teri
ne
ho
rn.
Dat
a w
as g
roup
ed i
nlO
O
per
atio
n g
roup
s (U
X,
VO
X,
and
SO
P g
roup
s) w
ith
ou
t co
nsi
der
ing
the
Day
fac
lors
. T
he
per
cen
tag
e v
alu
es f
or
each
co
mp
on
ent
wer
e re
lati
ve 10
Ihe
10
lal
wei
gh
l o
f th
e ut
erin
e ho
rn.
* s
ign
ific
antl
y d
iffe
rent
fro
m i
ts S
OP
gro
up (
p <
0.0
5; T
ukey
HS
D-I
cst
).
i "' no il' � o
, :; .5 5' !l. Ii' � g' � c.
.., � , 1.: '" � '" -
I!!!
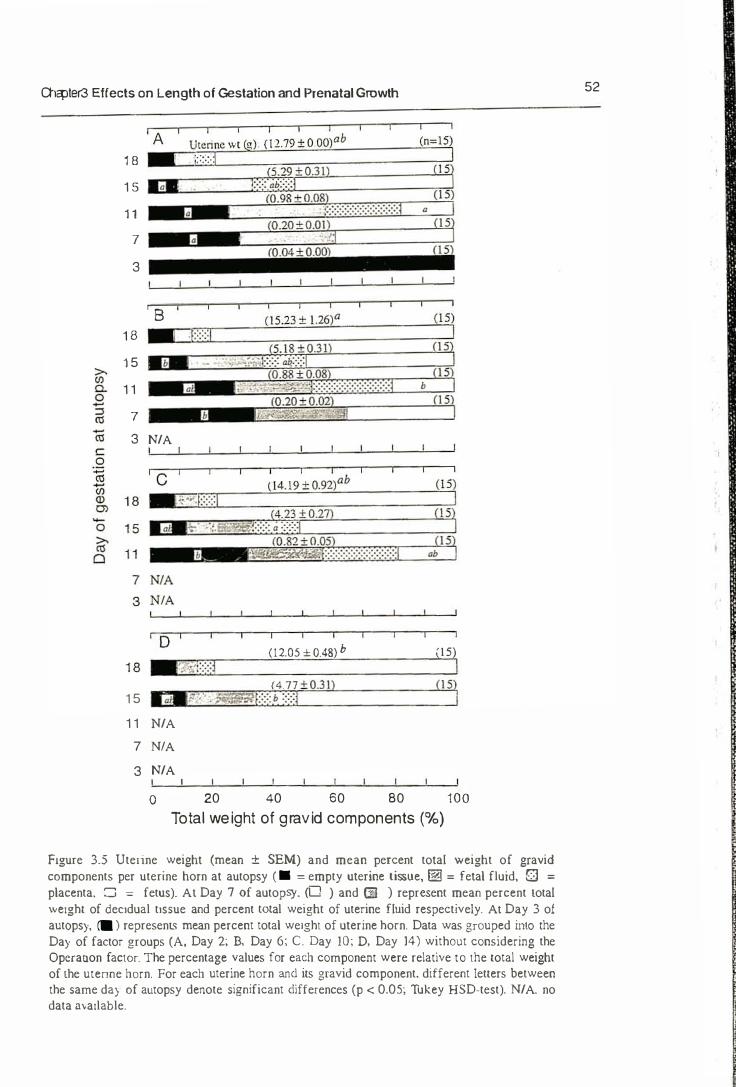
Olc:pter3 Effects on Length of Gestation and Prenatal Growth
iA i
1 a I::::::
1 5
1 1
7
3
1 8
1 5
1 1
7
' 8
3 N/A
1 0 i
(12.05 + 0.48) b
(4.77 ±O.3!) 1 5 la_P;·,·· .·�;;:W:;:b :::::) 1 1 N/A
7 NfA
3 N/A
(\5) I
(J 5)
o 20 40 60 80 100
Total weight of gravid components (%)
Figure 3.5 Uterine weight (mean ± SEM) and mean percent total weight of gravid components per uterine horn at autopsy ( . = empty uterine tissue, 12 = fetal fluid, 0 =
placenta. � = fetus). AI Day 7 of autopsy. (0 ) and (I) ) represent mean percent lotal weight of deCidual tissue and percent 100al weight of uterine fluid respectively. At Day 3 of autOpsy. � ) represenL� mean percent total weight of uterine horn. Data was grouped into the Day of factor groups (A, Day 2; B, Day 6; C. Day 10; 0, Day 14) without considering the Opcrauon factoL The percentage values for each component were relative to the total weight of the utenne horn. For each uterine horn and its gravid component. different letters between the same da) of autopsy denote significant differences (p < 0.05; Tukey HSD-test). N/A. no data available.
52
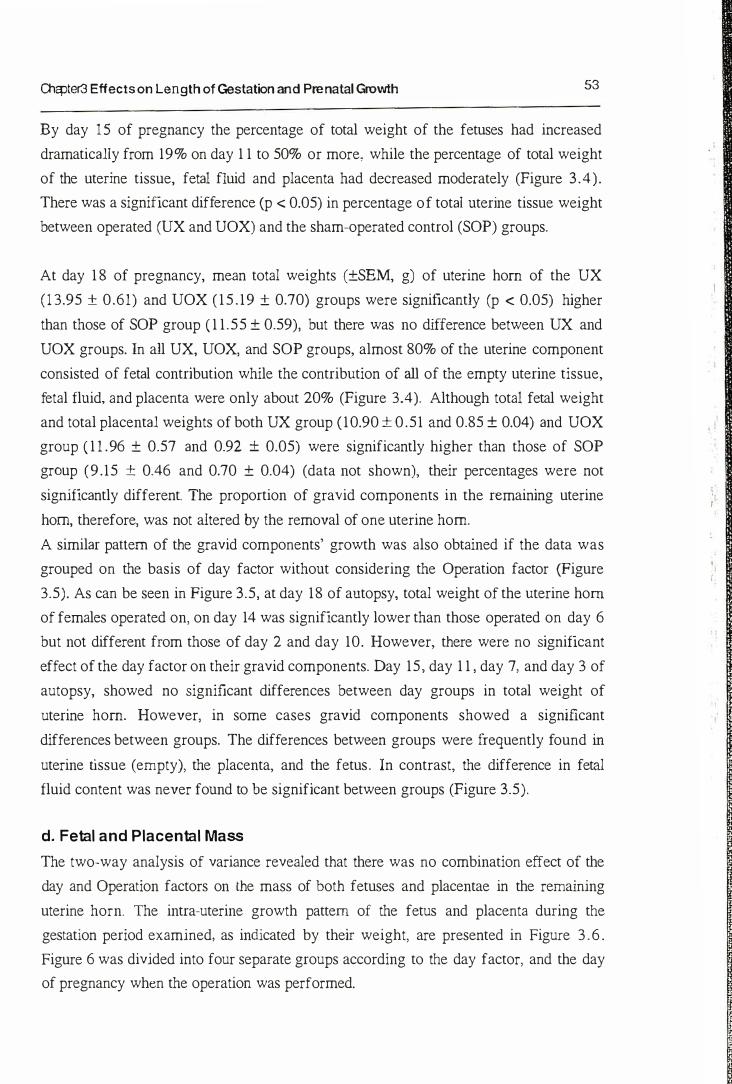
OlGpter3 Effects on Length of Gestation and Prenatal Growth 53
By day 1 5 of pregnancy the percentage of total weight of the fetuses had increased
dramatically from 19% on day 1 1 to 50% or more, while the percentage of total weight
of the uterine tissue, fetal fluid and placenta had decreased moderately (Figure 3.4).
There was a significant difference (p < 0.05) in percentage of total uterine tissue weight
between operated (UX and UOX) and the sham-operated control (SOP) groups.
At day 1 8 of pregnancy, mean total weights (±SEM, g) of uterine horn of the UX
(1 3.95 ± 0.61) and UOX ( 15 . 19 ± 0.70) groups were significantly (p < 0.05) higher
than those of SOP group ( 1 1.55 ± 0.59), but there was no difference between UX and
UOX groups. In all UX, UOX, and SOP groups, almost 80% of the uterine component
consisted of fetal contribution while the contribution of all of the empty uterine tissue,
fetal fluid, and placenta were only about 20% (Figure 3.4). Although total fetal weight
and total placental weights of both UX group (10.90 ± 0.51 and 0.85 ± 0.04) and UOX
group ( 1 1 .96 ± 0.57 and 0.92 ± 0.05) were significantly higher than those of SOP
group (9.15 ± 0.46 and 0.70 ± 0.04) (data not shown), their percentages were not
significantly different. The proportion of gravid components in the remaining uterine
horn, therefore, was not altered by the removal of one uterine hom.
A similar paUern of the gravid components' growth was also obtained if the data was
grouped on the basis of day factor without considering the Operation factor (Figure
3.5). As can be seen in Figure 3.5, at day 18 of autopsy, total weight of the uterine horn
of females operated on, on day 14 was significantly lower than those operated on day 6
but not different from those of day 2 and day 10. However, there were no Significant
effect of the day factor on their gravid components. Day 15, day 1 1 , day 7, and day 3 of
autopsy, showed no Significant differences between day groups in total weight of
uterine horn. However, in some cases gravid components showed a significant
differences between groups. The differences between groups were frequently found in uterine tissue (empty), the placenta, and the fetus. In contrast, the difference in fetal
fluid content was never found to be significant between groups (Figure 3.5).
d. Fetal and Placental Mass
The two-way analysis of variance revealed that there was no combination effect of the
day and Operation factors on the mass of both fetuses and placentae in the remaining
uterine horn. The intra-uterine growth pattern of the fetus and placenta during the
gestation period examined, as indicated by their weight, are presented in Figure 3.6.
Figure 6 was divided into four separate groups according to the day factor, and the day
of pregnancy when the operation was performed.
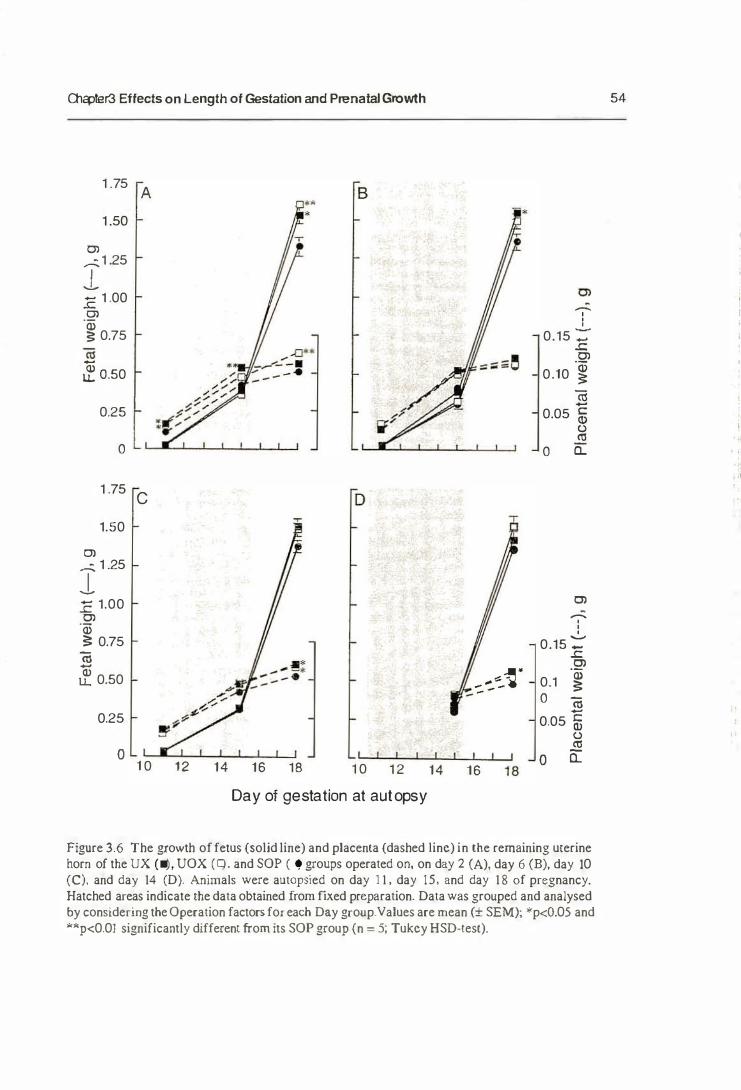
1: _______________ _
Ch;pter3 Effects on Length of Gestation and Prenatal Growth
1 .75 A
1 .50
0) -" 1 .25
1 1: 1 .00 .2' � 0.75 '"
� O.50
0.25
o
1 .75 C
1.50
0) -" 1 .25
1 1: 1.00 0)
·iii " 0.75 <ii a; LL 0.50
0.25
o 1 0 1 2 1 4 1 6 1 8
B
D
1 0 1 2
Day of gestation at autopsy
•
-<�. -:. - -�
1 4 1 6 1 8
-, , -'-
0.15 _ .<:: 0)
0.10 .� <ii
0.05 &i �
o a.
0) -, , ,
0.15 :E 0)
·iii 0.1 " o <ii 0.05 �
" '"
o a::
Figure 3.6 The growth of fetus (solid line) and placenta (dashed Iinc) in the remaining uterine horn of the UX (�, VOX (q. and SOP ( � groups operated on, on day 2 (A), day 6 (B), day 10 (C). and day 14 (D). Animals were autopsied on day 1 1 , day 15, and day 1 8 of pregnancy. Hatched areas indicate the data obtained from fixed preparation. Data was grouped and analysed by considering the Operation factors for each Day group.Values are mean (± SEM); *p<O.05 and *"'p<0.01 significantly different from its SOP group (n = 5; Tukcy HSD-tesl).
54
.!_--------------------....,
Ql.:pler3 Effects on Length of Gestation and Prenatal Growth 55
Until day 15 of pregnancy the growth of fetuses was not affected by the removal of one
uterine hom since fetal weight of the UX or VOX groups was not different from its
sham-operated control (SOP group) whether the mother was operated on, on day 2 of
pregnancy (Figure 3.5A), or on day 6 (Figure 3.6B), or on day 10 (Figure 3.6C) or on
day 14 (Figure 3.6D). After day 15 of pregnancy, fetal weight of either the UX and
VOX groups or the UX group alone, was higher than that of SOP group. These
differences, however, are only significant in groups of animals operated on day 2 and
day 6 of pregnancy (Figure 3.6A and 3.6B). In contrast, significant differences in placental weight between groups was detected from day 1 1 to day 1 8 of pregnancy in the animals operated on day 2 of pregnancy. The significant difference between the UX
or UOX and SOP group can also be detected at day 18 of pregnancy in the animals
operated on, on day 10 and day 14 of pregnancy (Figure 3.6C and 3.6DJ.
In general. Figure 3.6 also shows that between day 1 1 and 15 of pregnancy, both
fetuses and placentae of all day groups and also of all Operation groups were grown
rapidly. The fetal growth line of the UX, UOX and SOP groups was similar to each
other. their lines were almost coincident with one another. After day 15 of pregnancy,
the fetus showed a marked increase, while the placenta showed a decrease or a plateau
in their growth rate. It seems that, the growth of the fetus continued until the day of
parturition even though the placenta had reached its maximum size at the end of the flrst
half of gestation period.
A Significant effect of the removal of one uterine horn on fetal and placental growth
could be detected after day 1 1 of pregnancy. If the data is pooled by Operation factor
without considering day factor (Figure 3.7), it can be seen that both fetal growth and
placental growth of both the UX and UOX groups was Significantly higher than that of
SOP groups with the exception that fetal weight of the UOX group on day 15 of
pregnancy were not significantly different from the SOP group. At any day of autopsy,
however, there were no significant differences between the UX and UOX group in fetal
and placental growth. Again, Figure 3.7 shows that maximum fetal growth occurred
between day 15 and day 1 8 of pregnancy, preceded by the maximum rate in placental
growth which occurred between day 1 1 and day 15 of pregnancy.
Placental mass. but not fetal mass, was significantly influenced by the day factor.
However. the effect of the day factor on fetal and placental mass was time-dependent.
This factor only effectively induced intra-uterine mass when examined in the earlier
days of pregnancy (Figure 3.8). Placental weight of females operated on, on day 2 and
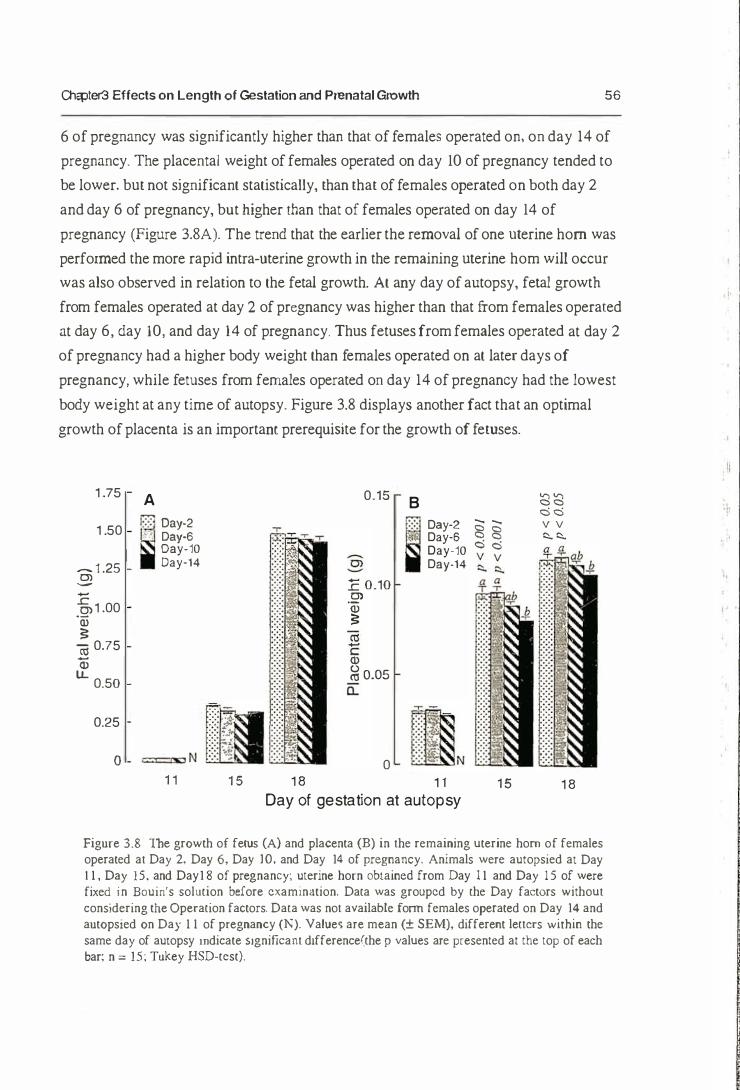
�ter3 Effects on Length of Gestation and Prenatal Growth 56
6 of pregnancy was significantly higher than that of females operated on, on day 14 of
pregnancy. The placental weight of females operated on day 10 of pregnancy tended to
be lower. but not significant statistically, than that of females operated on both day 2
and day 6 of pregnancy, but higher than that of females operated on day 14 of
pregnancy (Figure 3.8A). The trend that the earlier the removal of one U(erine hom was
performed the more rapid intra-U(erine growth in the remaining uterine hom will occur
was also observed in relation to the fetal growth. At any day of autopsy, fetal growth
from females operated at day 2 of pregnancy was higher than that from females operated
at day 6, day 10, and day 14 of pregnancy. Thus fetuses from females operated at day 2
of pregnancy had a higher body weight than females operated on at later days of
pregnancy, while fetuses from females operated on day 14 of pregnancy had the lowest
body weight at any time of autopsy. Figure 3.8 displays another fact that an optimal
growth of placenta is an important prerequisite for the growth of fetuses.
1 .75 A
; g:;:�
1 .50 Day-10
Oi 1 .25 Day-14
---" .2> 1 .00 <ll ;: m 0.75 ;; LL 0.50
m
0.25 :::: ' <l-( f .. , N .r\� 0 1 1 1 5
0.15
9 :E 0.10 .2' <ll ;: '" -c: <1l � O.O5
CL
0 18
B
I
Day-2 . . Day-S Day-10 Day-14
I .' . .:. " N
1 1 Day of gestation at autopsy
:g :g c) c) - - v v :5 :5 � �
'" '" v v
15 18
Figure 3.8 The growth of fetus (A) and placenta (B) in the remaining uterine hom of females operated at Day 2, Day 6. Day 10, and Day 14 of pregnancy. Animals were autopsied at Day I I . Day 15, and Day 1 8 of pregnancy; uterine horn obtained from Day I I and Day 15 of were fixed in Bouin's solution before examination. Data was grouped by the Day factors without considering the Operation factors. Data was not available fonn females operated on Day 14 and autopsied on Day I I of pregnancy (1\). Value'i are mean (± SEM). different lettcrs within the same day of autopsy mdicate SIgnificant dlfference(the p values are presented at the top of each bar: n = 15; Tukey HSD-tcst).
Ii
·1.
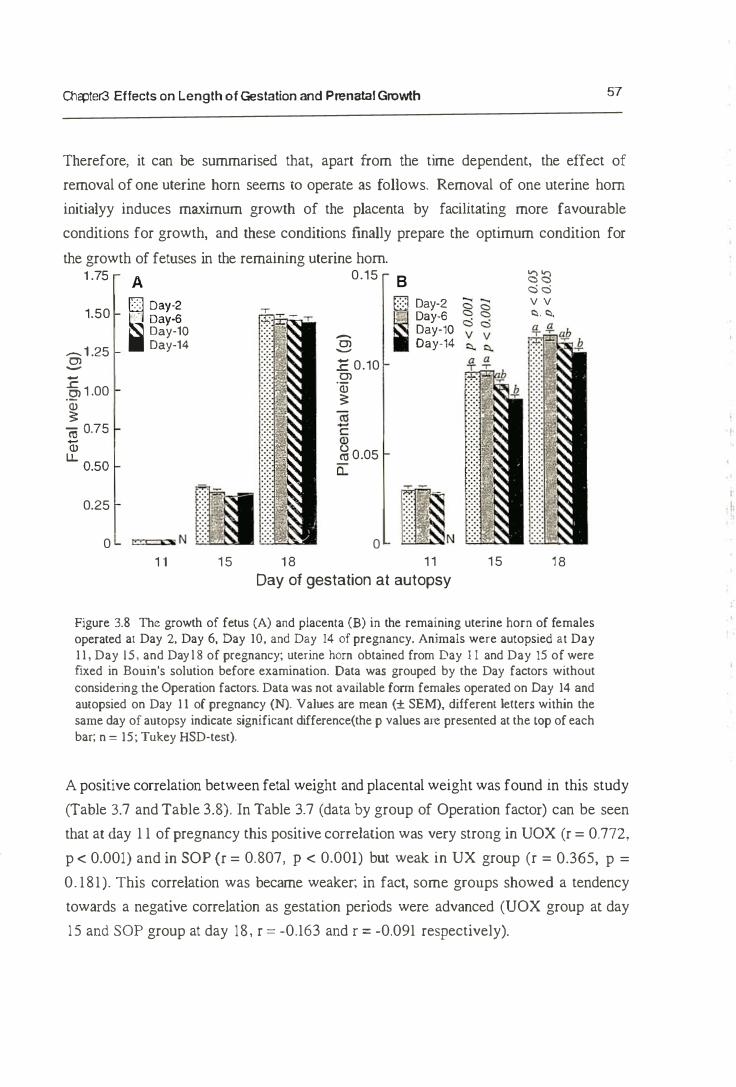
.'-------------------......,
O1cpler3 Effects on Length of Gestation and Prenatal Growth 57
Therefore, it can be summarised that, apart from the time dependent, the effect of
removal of one Ulerine horn seems (0 operate as follows. Removal of one uterine horn
initialyy induces maximum growth of the placenta by facilitating more favourable
conditions for growth, and these conditions finally prepare the optimum condition for
the growth of fetuses in the remaining Ulerine hom. 1 .75 A
0.15 B �H3 c o
; g:�:� o Day-2 v v
1.50 � Day-S "- "-Day-10 -
Day-l0
_1.25 Day-14 Ol Oay-14 -
Ol E 0.10 -- Ol .c ·iii .21 1 .00 " Q) " '" ca 0.75 C - Q) Q) �O.O5 LL 0.50 "-
0.25
0 "" o;::!Iol N 0 1 1 15 1 8 1 1 15 18
Day of gestation at autopsy
Figure 3.8 The growth of fetus (A) and placenta (B) in the remaining uterine horn of females operated at Day 2, Day 6, Day 10, and Day 14 of pregnancy. Animals were autopsied at Day 1 1 , Day 15, and Day l 8 of pregnancy; uterine horn obtained from Day I I and Day 15 of were fixed in Bouin's solution before examination. Data was grouped by the Day factors without considering the Operation factors. Data was not available fonn females operated on Day 14 and autopsied on Day 1 1 of pregnancy (N). Values are mean (± SEM), different ieners within the same day of aulOpsy indicate significant difference(the p values are presented at the tOp of each bar; n = 15; Tukey HSD·test).
A positive correlation between fetal weight and placental weight was found in this study
(Table 3.7 and Table 3.S). In Table 3.7 (data by group of Operation factor) can be seen
that at day 1 1 of pregnancy this positive correlation was very strong in UOX (r = 0.772,
P < 0.001) and in SOP (r = 0.S07, P < 0.001) but weak in UX group (r = 0.365, P =
0. 181). This correlation was became weaker; in fact, some groups showed a tendency
towards a negative correlation as gestation periods were advanced (UOX group at day
15 and SOP group at day IS , r = -0.163 and r = -0.091 respectively).
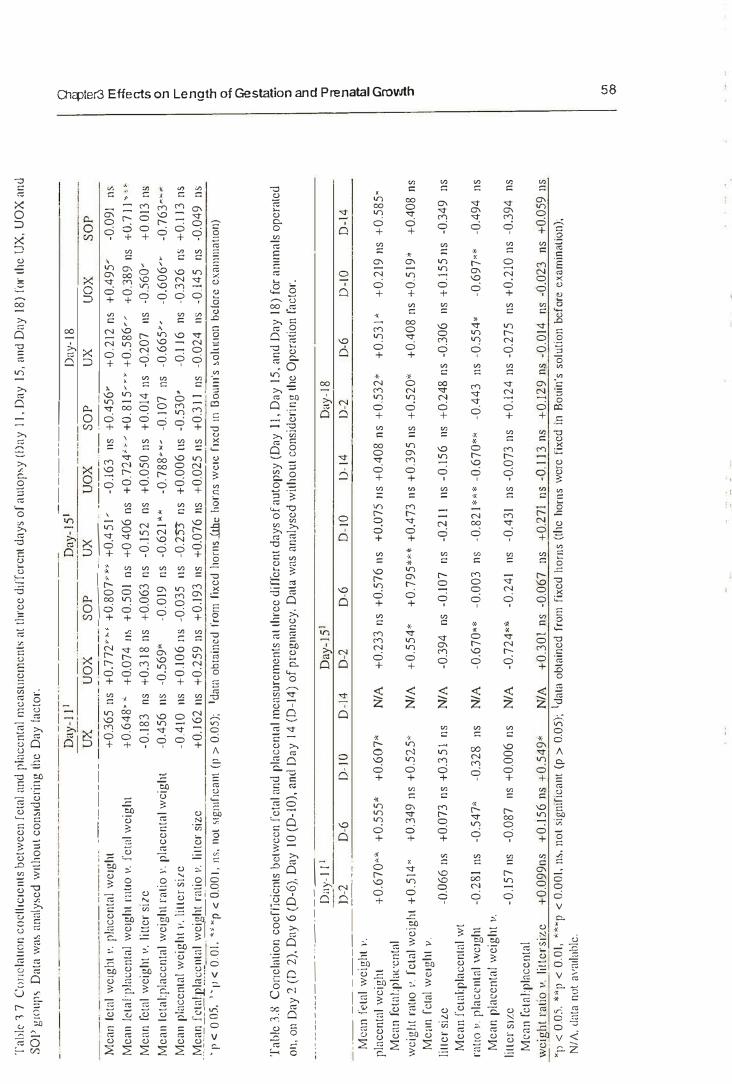
Tab
le 1
7 C
()n�l
aIiO
n co
cillC
lent
s be
twee
n fe
tal a
nd p
lacc
ntal
mca
SllIe
rncn
ts a
t thr
ee d
dTcr
cnt d
ays
of a
utop
�y (I
)ay
II, D
ay 1
5, n
nd D
ay 1
8) fo
r th
e U
X, U
OX
and
50
1' g
J(lUp
� D
ata
wn�
ana
lyse
d w
itho
ut c
on�l
deri
l1g th
e D
ay f
acto
r.
��-
--
--
---
_ ._
--
--
Mea
n fe
tal
wei
ght
\'. p
lace
nta!
wei
ght
Mea
n !c
talv
lace
ntal
wei
ght
nttl
O v.
few
l wei
ght
Mea
n fe
tal
wei
ght v
. li
tter
size
M
ean
leta
l:pla
ccnt
al w
eigh
t rat
io \'
. pla
cent
al w
cigh
t
-
-
-
-
�
--
-
-
-
-
�IY
- �_,,
__
__ _
___ ��
__
}2�
:",15,-
' _=
-:-:
UX
UO
X
SO
P
UX
U
OX
S
OP
--
--
_ .. _-
+0,
365
ns +
0.7
72�'"
+O.
807 ..
. �·
+0.
45
1� --
---
-_
._
-
-
-0.1
63
ns +
0.45
6'"
Day
-18
ux
uox
SOP
+0
.212
ns +
0.49
5'
-0.0
91
ns
+0
.648
> �
+0.
074
II�
+0.
501
ns +
040
6 ns
+
0.7
24"
" +
O.8
15��
" +
0.58
6u
+0
.389
IlS
+
O.7
11"
'�
-0.1
83
115
+0.
318
ns
+0.
063
ns
-0.1
52 n
s +
0.05
0 ns
+
0.01
4 ns
-0
.207
liS
-0
.56
0"
+0,
013
115
-0.4
56 I
1S
-0.5
69'"
-0.0
19 n
s _0
.62
1"
-0.7
88""
� -0
.107
ns
-0
.665
'"'
-0.6
06'"
-0
.763
'"
Mea
n pl
acen
tnl w
eig
ht I'
. lil
ler s
ile
-0.4
10 I
1S
+0
.10
6 11
5 -0
.035
liS
-0
.253
ns
+
0.00
6 liS
-0
.530
� -0
.1 J 6
ns
-0
.326
ns
+
0.1
J 3 n
s M
ean
fcta
l:pla
ccnt
al w
eigh
t ra
tio v
. lil
ler
size
+
0. J 6
2 I1S
+
0.25
9 ns
+0
.193
ns
+0.0
76 l
iS
+0.
025
liS
+0.
31 J
ns
-0.0
24
ns
-0.1
45
ns
-0.0
49
ns
·:-I�·
�-00
5�':-
t�··:;
-0.0
1, -:;
;;;-;;-:;:-0:
001,
n�,
nOl
�lg
ll!fl
canl
(p >
0.05
); Id
ata
obta
ined
fro
m fi
xed
horn
s (t
he h
orns
wel
e fI
xed
1ll n
O�lII'
s �o
ll1l1o
n be
fore
exa
mlll
atlO
n)
Tah
le l
.S C
onel
ntio
n co
effi
cicn
ts b
etw
ccn
feta
l and
pla
cent
al m
easu
rem
ents
at t
hree
dif
fere
nt d
nys
of a
utop
sy (
Day
II,
Day
15,
and
Day
18)
for
anim
als
oper
ated
Oi
l, 0
11 D
ay 2.
(02)
, Day
6 (
D-6
), D
ay 1
0 (D
-10)
, nnd
Day
14
(D-1
4) o
f pr
egna
ncy,
Dat
n w
as n
naly
sed
with
out c
onsi
deri
ng th
e O
pera
tion
fact
or.
._--
-- -
----
-_ .
. __ .
_-
--
Dny
-Ill
1.l·2
-
_._
---
---
--
---
-- --
-M
ean
feta
l wei
ght
v.
D� 6
D
�IO
plac
enta
l wci
ght
+0
.670
'"
+0
,555
'" +
0.60
7"
Mea
n fe
tal:p
lilC'c
ntnl
w
cigh
t rn
tlo I
'. fc
lnl w
eigh
t +
0.5
14"
+0.
349
ns +
0.52
5"
Me<
ln f
clal
wCl
ghl v
.
D-\
4
N/A
N/A
Oat
-lS
I O
ay-1
8 D
·2
D·6
D
�lO
1 )-1
4 D
-2
D·6
D
-IO
D
-\4
+0.
233
ns +
0.57
6 ns
+
0.07
5 li
S +
0.40
8 ns
+0.
532*
+
0.5
31*
+
0.2
19 li
S +
0.5
85M
+0.
554*
+
0.7
95**
· +0
.473
ns
+0.
395
I1S +
0.52
0"
+0.
408
ns +
O.5
19�
+0.
408
ns
Iille
rsi
Le
-O.0
66
ns
+0.0
73 n
s +0
.35
1 ns
N
/A
-0.3
94
ns -
0.10
7 ns
-0
.211
I1S
-0
.156
ns
+0
.248
ns
-0.3
06
ns +
0.1
55 li
S -0
.349
ns
M
ean
fela
l:pla
cenl
al w
t ra
tlO)/.
pla
cenl
nl \
vclg
ht
-0.2
81 n
s -0
.547
* -0
.328
ns
N
/A
-0.6
70*·
-0
.003
ns
-0,8
21·
*· -
0.67
0""
-0.4
43
ns -
0.55
4�
-0.6
97·*
-0
.494
ns
M
ean
plac
enta
l wei
ght
1'.
lille
rSl
Z.e
-0.1
57 n
s -0
.087
ns
+0.
006
ns
N/A
-0
.724
"'*
-0.2
41
ns
-0.4
31
ns -
0.07
3 ns
+
0.1
24 n
s -0
.275
ns
+0.
210
ns
-0.3
94
ns
Mcn
n fc
tnl:p
lncc
ntal
�
cighl
rat
io v
. lit
ters
ize
+0.
099n
s +
0.1
56 n
s +
0.54
9*
N/A
+
0.30
1 ns
-0.
067
ns
+0.
271
ns -
0.1
13 n
s +
0.1
29 n
s -0
.014
ns
-0.0
23
ns +
0.05
9 ns
�I
l < 0
,05.
""p
< 0
.01,
"""p
< 0
.001
, n&,
not
Sig
nifi
cant
(p
> 0
.05)
; tda
tn o
btai
ned
from
fix
ed h
orns
(the
horn
s w
ere
fixe
d in
Bou
in's
sol
utio
n be
fore
exa
min
atio
n);
NfA,
dat
a no
! al
'atl'
lblc
.
I m il' &t o " :; " '" 5' S. fi' �. " § c. " OJ " � I '"
0>
II!

.'--------------------------,
Olc:pIer3 Effects on Length of Gestation and Prenatal Growth 59
The decrease in correlation coefficients can also be detected when me data is analysed
based on group of day factors (Table 3.8). A significant positive correlation between
mean fetal weight and mean placental weight was detected at day 1 1 of pregnancy in D-
2, D-6, and D-lO groups. This association was not significant at day 15 of pregnancy
before reaching a significant positive correlative association at day 18 of pregnancy
again (Table 3.8).
Table 3.7 and Table 3.8 also show that the association between mean fetal placental
weight ratio and mean fetal weight was positive for all groups of day of operation and
also for all days of autopsy (fable 3.8). On the contrary, there was a negative
association between mean fetal:placemal weight ratio and mean placental weight for all groups of day of operation and also for all groups of day of autopsy. Neither mean fetal
weight, nor mean placental weight, nor mean fetal:placental weight ratio showed a
significant association with liner size. Significant negative correlation between mean
placental weight and litter size at day 15 of autopsy in SOP group (r ; -0.530, p < 0.05)
(Table 3.7), or at day 15 in 0-2 group (r = -0.724, p < 0.01) (Table 3.7), or between
mean fetal weight and lItter size at day 18 in UOX group (r = -0.560, P < 0.05) (Table
3.7), or significant positive correlation between mean fetaJ:placental weight ratio and
litter size at day II in 0-10 group (r = 0.549, p < 0.05) (Table 3.8) apparently was only
an exclusive occurrence.
Table 3.9 Mean (± SEM) fetal-placental weight ratio for both by day and by Operation groups autopsied at three different days of pregnancy (day I I, day 15. and day 18).
Groups
By day: day 2 day 6 day 10 day 14
By Operation: UX VOX SOP
day of pregnancy at autopsyl 1 1 15 18
0.707 ± 0.030 3.861 ± 0.139ab 13.049 ± 0.347 0.765 ± 0.027 3.441 ± 0.166 b 12.661 ± 0.300 0.769 ± 0.017 3.482 ± 0.130 b 1 3.075 ± 0.327
N/A 4.088 ± 0. 1 14 a 13.510 ± 0.279
0.776 ± 0.034 a
0.694 ± 0.018 b 0.782 ± 0.172 a
3.702 ± 0.126 3.586 ± 0.123 3.867 ... 0.145
12.922 ± 0.276 13.158 ± 0.236 13.143 ± 0.316
IOlfferent lcl!ers withm the same column are significantly different (p < 0.05; Tukey HSO-test); N/A. no data available.
"
Olcp!er3 Effects on Length of Gestation and Prenatal Growth 60
e. Fetal:Placental Weight Ratio and Placental Weight Relationship
The efficiency of placenta after removal of one uterine horn was estimated indirectly by
calculating the feta1:placental weight ratio for each conceptus (Dwyer et at., 1992). Mean
value per hom was then calculated and used in statistical analysis. For SOP groups,
me:lIl values of placental efficiency of the two horns were averaged before being
analysed.
The ability of placenta to support fetal tissue increased dramatically as pregnancy
proceeded (Table 3.9). One gram placenta can afford only less than one gram fetal tissue
at day 1 1 of pregnancy. This ability rose up to about 411 (g fetal tissue/ g placental
tissue) at day 15 of pregnancy and then increased again and reached a maximum level of
about 131l at day 18 of pregnancy. Two way analysis of variance revealed that the
combination of day and Operation factors had no significant effect on fetal:placental
weight ratio. On certain days of autopsy, however, the day and Operation factors
worked separately and significantly affecting the fetal:placental weight ratio (Table 3.9).
For example, fetal:placental weight ratio of animals operated on, on day 14 of
pregnancy and autopsied at day 15 of pregnancy was significantly higher than for those
operated on, on day 6 and day 10 (p < 0.05). A small, but significant (p < 0.05),
difference was also detected between UOX and UX and SOP groups, but there was no
significant difference between UX and SOP group.
To see whether the day factor or the Operation factor influence the placental efficiency at
the same day of autopsy or not, the relationship between fetal:placental weight ratio and
placental weight was analysed separately in groups of Day or Operation factor. The
results for each day of autopsy are presented in Figure 3.9 and Figure 3 .10 (see also
Table 3.7 and Table 3.8). At the same day of autopsy, fetal:pIacentai weight ratio of
most groups were negatively correlated with placental weight. This suggests that the
ability of placenta to support the fetal tissue is decreased as the weight of placenta
increased. These relationships were significant in the UX group at day 15 (r = -0.621, P
< 0.01) and day 1 8 (r = ·0.665, P < 0.01) but not on day I I of pregnancy. In the UOX
group this relationship was significant at all days of pregnancy examined while in the
SOP group only significant at day 18 of pregnancy (Figure 3.9, Table 3.7). The
negative correlation between fetal:placentaI weight ratio and placental weight of the
animals operated on day 2 of pregnancy was only significant at day 10 of pregnancy
\vhile the animals operated on day 6 showed a significant relationship at day 1 1 and day
18 of pregnancy. The animals operated on day 10 showed a Significant relationship at
day 15 and day 1 8 of pregnancy.
1
"
!.
·' 1 .,
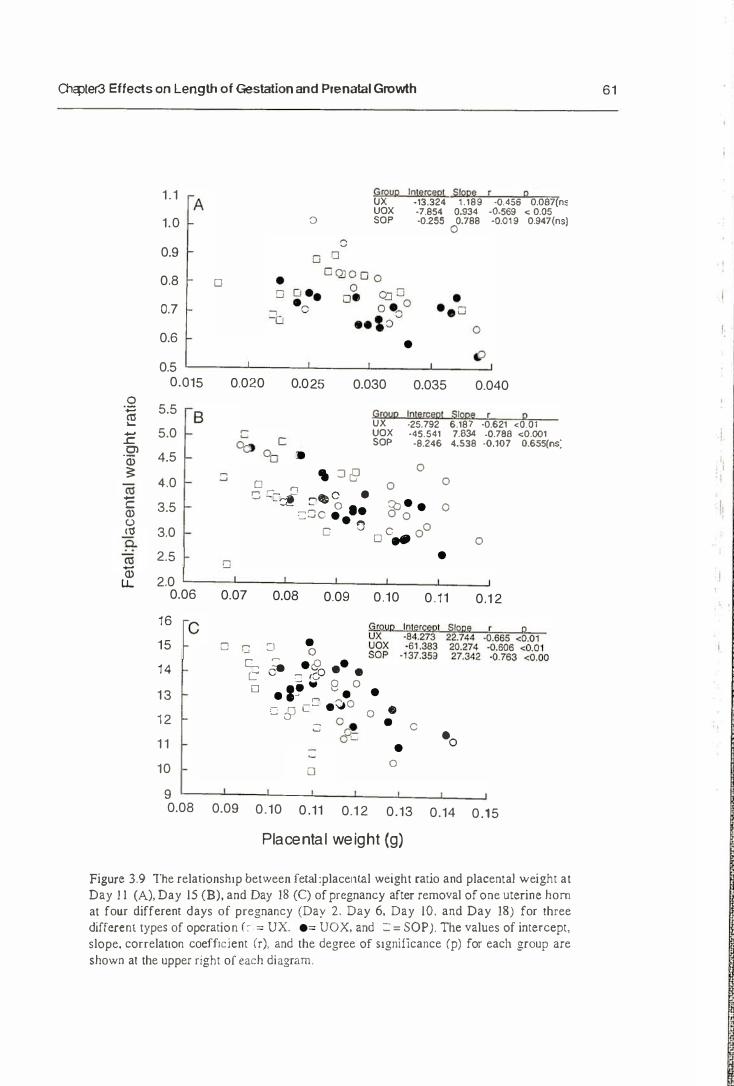
Olc:pter3 Effects on Length of Gestation and Prenatal Growth
1 .1 A
1.0
0.9
0.8
0.7
0.6
0.5 0.D15
0 .'" �
5.5 B - 5.0 .c C>
4.5 'iii ;, '"
4.0
C 3.5 " " '" 3.0 a.
0; 2.5 -"
2.0 "-0.06
16 C
15
14
1 3
12
1 1
10
9 0.08
o
0
Group ux UOX sOP
IQ1f!!CeQl SIQDt! r p
•
'13.324 1.189 {lASS 0.087(n� -7.854 0.934 .(1.569 < 0.05 ·0.255 0.788 (I.019 0.947{ns)
a
0.020 0.025 0.030 0.035 0.040
o
•
Groog ux UOX sOP
Imercep! Siooe r p ·25.792 6.187 -0.621 <0,01 -45.541 7.834 .(I.7a8 <0.001
-8.246 4.538 .(1.107 0.6S5(ns:
o , � e !2 r. 0 C . 0 -' '-Cb! �. 0
9:> • •
o
::8C ••• • 0 0 C 0 C 00 0 "
o
o •
0.07 0.08 0.09 0.10 0.11 0.12
0
0.09
." c., L 0
� • 0 r • .0 • oe tCJ . .
Ii - e 0 . " . f'l ."" 0
c .:9 c� ."" OJ 0,. &C
0
• 0
0.10 0.11 0.12
• • c
• 0
0.13
Placental weight (g)
·0
0.14 0.15
Figure 3.9 The relationshIp between fet.al:placental weight ratio and placental weight at Day I I (A), Day 15 (B), and Day 18 (C) of pregnancy after removal of one uterine hom at four different days of pregnancy (Day 2. Day 6, Day 10. and Day 18) for three different types of operation (� .= Ux. .= UOX, and == SOP). The values of intercept, slope. correlatlon coeffIcient (r). and the degree of SIgnificance (p) for each group are
shown al the upper right of each diagram.
61
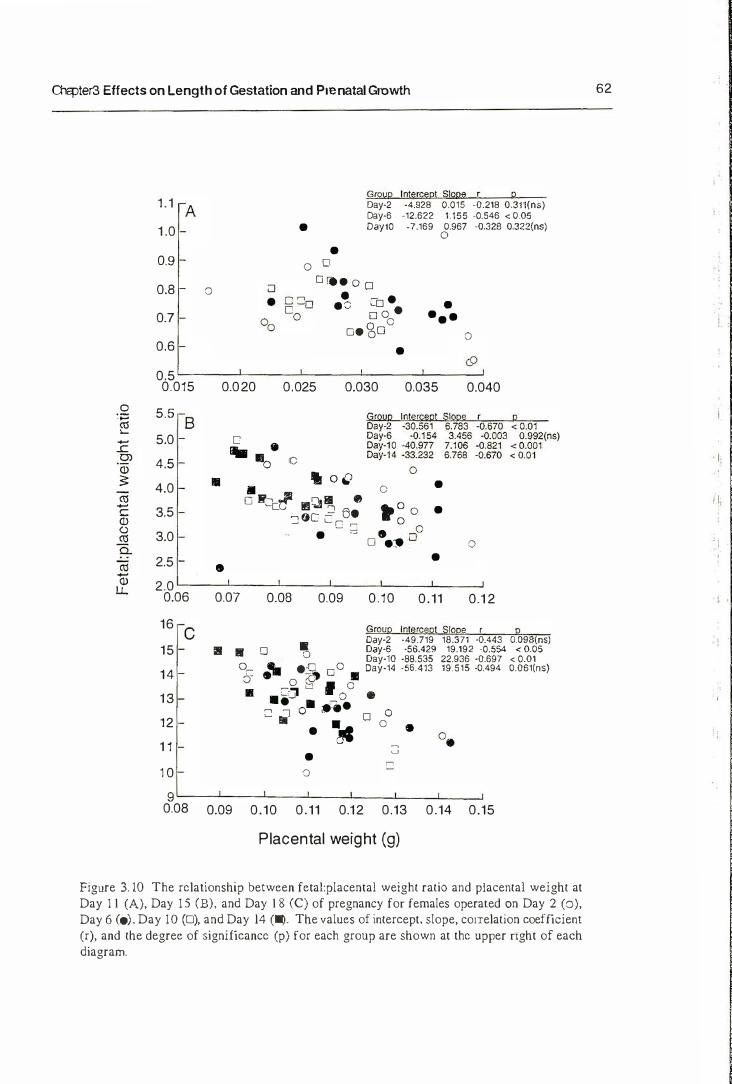
Ol<:pter3 Effects on Length of Gestation and Prenatal Growth
1 .1 A
1 .0
0.9
0.8
0.7
0.6
0.5 0.015
a 5.5 ., B '" � - 5.0 .c 0)
4.5 OJ " 4.0 '" -c OJ 3.5 "
3.0 '" "-'" 2.5 -OJ 2.0 LL
0.06
16 C
15
14
1 3
12
1 1
1 0
9 0.08
0
• •
Group tntercePt Slope r p Day-2 -4.928 oms -0.218 0.311(ns} Day-6 -12.622 1.155 -0.546 < 0.05 Dayl0 -7.169 0.967 -0.328 0.322(n5)
°
° 0 O ce . O O
.� CO · 0
0 · ° O. go
•
• •• • o
0.020 0.025 0.030 0.035 0.040
•
•
c • ... ·0 C
" 0 " • o "2c-l' .," '!, •
..., ac ': a. � '- r ,..., - � •
° •
�� o • • �O
o .:.e w ° •
0.07 0.08 0.09 0.10 0.11 0.12
GrQUP Intercept Slope r p Day-2 ·49.719 18.371 -().443 0.098(n5)
• • a � Day-S ·56.429 19.192 ·0.554 < 0.05 Day-tO -88.535 22.936 -0.697 <: 0.01
Q.... ..... ..0 _0 Day-14 ·56.413 19.515 ·0.494 0.061(ns) tr · ... ;c) L.J .
_ -� i:;j I 0
"-<J o . -· 0· "· 2 � 0 0 . 'i!c 0
� . • �
o
0.09 0.10 0.11 0.12 0.13 0.14 0.15
Placental weight (g)
Figure 3. iO The relationship between fetal:placental weight ratio and placental weight at Day 1 1 (A), Day 15 (B), and Day 1 8 (C) of pregnancy for females operated on Day 2 (0), Day 6 (.). Day 10 (0), and Day 14 (�. The values of intercept, slope, correlation coefficient (r), and the degree of significance (p) for each group are shown at the upper right of each diagram.
62
Ii
, �
"
-----------------
Ol<:pter3 Effects on Length of Gestation and Prenatal Growth 63
3.4 Discussion
a. Effect on the Length of Gestation
The ienO'lh of aestation is controlled by a complex process including external factors, , ,
such as photoperiod, and internal factors, such as litter size. Litter size influences
gestation length In normally polytocous animals such as mice; small litters are associated
with a longer gestation period (Dewar, 1968). For example, Biggers el al. (1963), by
unilaterally ovariectomizing or by unilaterally ligating the Fallopian tube before mating
in mice, showed that the length of gestation was influenced by the total number of
conceptuses in the female. The fact that length of gestation is negatively related to the
size of liner (Biggers el al., 1963; Dewar, 1968) led us to infer that removal of one
uterine horn at several different days of gestation would halve the size of litter and this
condition would lead to prolongation of the gestation period.
In the present study removal of one uterine horn on several different days of gestation
significantly reduced the size of litter. Operated female mice, whether or not !:heir
ipsilateral ovary was removed, had a smaller litter size at birth compared with sham
operated control group (Table 3.4). Although, in mice, the remaining ovary can undergo
compensatory growth (regarding the number of ova ovulated) after unilateral
ovariectomy (Biggers et al., 1963; McLaren, 1963), in this study, as expected, removal
of ipsilateral ovary following removal of uterine hom in the UOX group, had no effect
on the size of liner compared to the UX group. Surgery procedures in this study were
perfonned after copulation. The earliest operation was perfonned on day 2 of pregnancy
and the latest one was on day 14 of pregnancy. This procedure was the opposite to me
procedure used by Biggers et al. (1963) who examined the effect of litter size on
gestation period in mice by using females from which one ovary had been surgically
removed before sexual maturity. The later procedure would allow the remaining ovary
to adjust the number of ova to be ovulated.
In the present study, [he UX and UOX groups where their liner size was reduced up to
a half of normal size had a mean length of gestation period almost one day longer than
that of the SOP group with one day difference in moda1 length of gestation (modal
gestation length was 19 days for the UX and UOX groups and 18 days for SOP group)
(Figure 3.2). This Liner size-related gestation length is consistent with the previous
studies reported by Biggers et at. (1963), McLaren and Michie (1963). and Dewar
(1968). However, in mice. Dewar (1968) has failed to detect a continuously linear
IOverse reiatlOnsh..ip over the range of liner sizes. but this relationship was mostly
confirmed In the litters below the modal size.
_, .................................................... �2
O1cpter3 Effects on Length of Gestation and Prenatal Growth 64
Because me length of gestation of pregnant mice in this study is not different in the UX
and UOX group, this shows that the controlling influence of the liner size on the length
of gestation period originated from the fetuses themselves or of their association with
placental tissue, and not from the number of corpora lutea of pregnancy fonned in the
ovary. This is fully consistent with a study on the pig (Omtvedt eI at., 1965; Martin et
ai., 1977) and with a study on mice (Biggers et al., 1963), who found that litter size,
but not the number of corpora lutea in the ovary. related inversely with the length of
gestation. Biggers et al. (1963) suggested that the effect of litter size on the length of
gestation was solely due to the total number of fetuses, and not on their distribution, in the uterine hom. In other words, the effect of liner size on the length of gestation
operates systemically rather than locally.
The nature of the systemic effect of litter size on length of gestation period has been
described by Mclaren and Michie (1963) and Mclaren ( 1967). By varying total fetal
mass independently of feta! number, Mclaren and Michie ( 1963) suggested that
systemic effect of the liner size on the length of gestation was a reflection of the total
fetal mass or total placental mass rather than the number of concepruses in the uterine
hom. The heavier young were associated with a shorter gestation period. The present
study is a!so in agreement with the finding of Mclaren and Michie (1963). If the data
was pooled by the type of operation, both mean total weight of fetus and mean total
weight of placenta per female in the SOP group were heavier than those of the UX and
VOX groups (data not shown).
Dewar (1973), conducted an experiment which attempted to examine the influence of
total hysterectomy on the duration of pseudopregnancy in albino mice; he found no
effect of total hysterectomy on the duration of pseudopregnancy. In addition, loss of the
placenta on the day 8 of pregnancy did not affect the duration of corpora lutea activity
but it declined to a near constant level from the day 14 of pregnancy onwards. Loss of
the placenta after day 14 of pregnancy was followed by almost immediate cessation of
luteal function. Dewar (1973) suggested that these findings may be due primarily to
reduction in pituitary luteotrophic activity where this period corresponds to a time of
increased gonadotrophin content of the pituitary. There is no indication from the present
work that the presence of one uterine horn exerts a local or systemic effect in hastening
the functional decline of the corpora lutea after removal of one uterine horn (see Chapter
4)
.! .............................................. ..
O1cpter3 Effects on Length of Gestation and Prenatal Growth 65
The prolongation of the gestation period in small litters (as in UX and UOX group)
compared with large liners (as in SOP groups) in the present study is likely not caused
by delayed implantation since the day of operation was not accompanied by any effect
on the len gth of gestation period.
The finding thal both the Day factor and the combination of Day and Operation factor
had no effect on length of gestation period (Table 3.4) tallies also with the previous
explanation about the effect of the uterine removal. Because of litter size was
systemically (total number of conceptuses in the female) and not locally (number of
conceptuses in the more crowded uterine hom) affected by the length of gestation, thus
the mechanical tension on the uterine walls due to the fetal growth, which increases
particularly rapidly in the later stages of pregnancy is not involved in initiating
parturition by increasing uterine irritability. Recently, many reports (for review see
Thorburn, 1991) revealed that the onset of parturition is initiated by the hormonal events
rather than by mechanical events. Parturition is initiated by the increase in the EIP ratio
due to the secretions of fetal cortisoL The changes in this FJP ratio will stimulate the
uterine synthesis and release of PGF2a. which results in activation of mechanical events
of parturition (Thorburn, 1991; Johnson and Everiu, 1995). Because the level of
corticoid may be increased as the number of fetuses in the uterine horn increase and
because lhe corticoids from the fetus are more important than maternal corticoids in
initiating the onset of parturition thus the day factor would not alter the onset of
parturition of a group of animals treated with the same type of operation.
This study was designed towards defining the effect of removal of one uterine horn on
pre-natal growth of the embryo in the remaining uterine horn. It is possible of course
that other factors influencing the length of gestation period in mice were not considered
in the experimental design. Therefore these methodological problems in the research
design limit our interpretations on the effect of b'eatment on the length of gestation
period in mice.
b. Effect on the Uterine-related Arteries Diameter
The uterine aneries diameter measurement estimated the growth of arteries in the
remaining uterine hom after removal of the contralateral uterus. It was assumed that the
uterine vasculature growth in the remaining horn would be favoured by removal of one
uterine horn and its vasculature. Because the uterus undergoes dramatic growth and
alterations in vasculature in preparation and adaptation for pregnancy (Makowski,
-,----------------
Olcp!er3 Effects on length ot Gestation and Prenatal Growth 66
1977), it was expected that the uterine-related arteries diameter in both UX and VOX
groups (operated animals) would be greater than that in the SOP group {sham-operated
control animals). It was also expected that arteries diameter in the remaining uterine hom
of the animals operated on at earlier days of pregnancy would be greater than that of
animals operated on at later days of pregnancy.
In the present study the final diameter (as measured at day 1 8 of pregnancy) of utero
ovarian arteries (Uo) and placental arteries (PI), but not uterine arterial diameter (Ut), of
both the UX and VOX females were significantly higher than those of the sham
operated animals (SOP) females when operation was performed on day 2 of pregnancy
(Figure 3.3). If animals were operated on day 6 of pregnancy, the difference between
operated and sham·operaled control groups in artery diameter was only significant in the
PI arteries whereas the diameter of both Uo and Vt arteries showed no significant
differences between operated and sham·operated control groups. At day 18 of
pregnancy PI arteries increased in diameter up to about five-fold (for the UX group) or
three·folds (for the VOX group) compared with their initial diameter at day 2 of
pregnancy, whereas in the SOP group they only reached an increase of about two· folds
compared with their initial diameter. Although arteries' diameter of both the UX and
UOX groups tend to be higher than that of the SOP group, removal of uterine hom after
day 6 of pregnancy had no significant effect on uterine vasculature in the remaining
uterus.
These findings led us to summarise that the removal of one uterine hom caused vascular
hypertrophy in the remaining uterine hom, and that uterine vasculature undergoes a
dramatic growth during the early gestation period, particularly between day 2 and day 6
of pregnancy, and that during that period the placental arteries had the most dramatic
growth. In physical terms, flow rate is inversely related to the resistance and resistance
is inversely related to the radius of a pipe. Thus, if this concept applies to the
haemodynamic aspect of the artery, blood flow in a big artery should be higher than that
in a smaller one, and blood flow should increase as diameter of the artery increases.
Because uterine·related artery diameter continues to grow during the gestation period, as
shown by the increase in their diameter, this should be accompanied by an increase in
the blood flow during the course of pregnancy. These findings are in agreement with
those of Garris (1983; 1984) who reported the regulative role of the uterine vasculature
on the growth of fetus and placenta in the uterus. The initial fetal· placental UniE
fonnation and its subsequent maintenance in the guinea pig, for example. was marked
by both dramatic growth of the uterine vascula[Ure and fluctuation in uterine blood flow
. ...... ----------------------------------
: . c " : .; E lkct:; on Ll."n�J th of Gc�l;1t;OJl :lnd Prcn�t;1I Gro\'lth 67
\ " :: � : " . " , ,; I ! n.' 11\ 1\:.:1 :,I::�·\:nl.d (,'r!ll:ltl(\!l was :1-"SOC1,Hcd with :til ckvauon 1Il
. . " : : . 1 :: : < , . ' . : : : . " , . ( \ i . : ! l ! ' . I I JS-l: Edw:Il'd ,llId \ ! i ! l i;,:.IIl. ! 9�7) :tlld n.:dw':llon III [he
' . ': : : ::.' : ' : . . . . ! i :. ·\\ ,iUI I !!:' l',lrl> l'I::��rl.�lh:y II,IS tile glC:llcst dfcc\ 011 placclllal growth
t r.: : : � .. l ' I � : , t '!.q'I'. ! " StJl . [II !IIi .. : .. : ill lpbm.Llioll is l.:olllpkll.:d :1I (!;ty 6 of pregnancy
I.::: . : ! : -);," ' , ;:�':!;l" : t .il :!llU!h.' IIIL'/t.':I.'C in ul\;ri/ll . .:-n;l:tlt.:t1 ant.:r), <.iJ:ullda. parucularly
::! I ' ! ':: :" " , ,:!.:1: l:\�·r. ,!un1l,-: l',lrly pn:;,�n;lIl!.:y as uhscrn;d III [IllS study It may Ix: ,:::;".: 1 :, t" "tq'!" ' i 1 th' r.q'I.! 11h.' l\::bl' in IIh.:ri1\\.: wcigh! :tl llllpbnl;ltlOn. All Increase In
'. : :: : ' ; : ,. i,j.>,>,! 1 1 , · · .... : :r, ' l l l l, 1 till· t ! ! !Il' \\f implantalion (Garris and Whll.:hc;'ld. 1 98 1 ) or
' : ! " �l:;j iii,· ,;:;hiu.d �·�· I I !c;:..:!il\lI p(:rilld (Ciarris and D:lr. 1 9S5) as rcponed occurred In
Ii:: ::\!1!��·.: i'l:: :'lll'l','!1:- lit!."' Sl':.:�ubtinll. CI:IPP ( 1 989) hypothesis.:d that tht! placenta is : �\: •. ,,;" mIL: 111(::·1i�" �:h\\\"lh I�''::llblion beeausl: thl: dccrcasl! III lhl! plact!ntal perfusion or
:!:;i! :�'ilt d .... ·!i·;;.Ty I Ildu .. ·�·:, Illl' pl:lc(:ll1:d rl:k:asl: of one or morl! pepudcs whIch mhlbH the
::·1,·;: ,l( lIlU!llpk �h)wth (:lLIOfS :U1J therehy suppress Ihe rate of fetal and placemal
\h.: .. : h;!·: .... · :, dupk.x utl:illS with a loop artery feedlllg. each ute nne horn. As expected by
.\l. .. :L:r,·n ::!i.i \ i L...-illl' 1 1960J. and \"\..111 5;1:11 and Dh:lr ( 1 992) revealed thaI blood flow In
!i;; ui.·rill�· ;ull'ry !:- hidl l-.'Clioll:11 in [he hOll:'C mouse. As a consequence of rh1s
i);.l:I ..: .. :U(·'l.d Ilow. �lll\��P[llSI:S at the cervical and ovanan t!nds of each utennc horn
'.', �·r..: f,l\·(ll!r\.'d b\· thl: !!r�:ltcr blood flow { \·Olll Sa:ll and Dhar. 1992: Even ef (II.. 1 994).
TI;:lt 1:- why tlh.: sJ1lalh.:.�t (I.!tu.-;e.-; are located In the middle regIon of a ute nne horn as
rq" l[kd i i I ::U!lll::! pi�.-; t Eck�tl.!ll1 d (1/ . 1 955). Illice UvlcLarcn and :"lIchle. 1 960), and
m illl' r:lhhll d 3I"1.1<':': and Abdul-Karim. 1973)
c. Effect on Prenatal Growth Til;.' {,'.:u:, elf till' prl·Sl.!llt -"tudy W;t.-; on the dfl:ct of the removal of one uterine hom on
IiI .. ' fl·i::! �r'1wih III Ihl: reI1l:1llling lHefllle hom and thl.! quesuons asked were. first, would
:il·.: ;�'l1l:!lning: utl:fl l1': 11(1/11 h.: ;!bll.! to pro\·ldc a more favourable condJtion for the growth
. . { f�" u,�'''; ;:(I.:r fl.!!llo\·al oi !i-, countt:rp;m horn. Secondly. If so. do any day factors
:··.::1 :: '!�nlii.::�ilt ;.:ilc.:1. Thild!y. do the Op;.:r;nlOn lactor and the day factor worked
m,!:r:i:':::::'i'; pr lil (('mbtn::tlnn 1
Ti:; 1t1':,::";: id;:!h1nsillp bd· .... ;:.:ll [(-1::1 wClght and fetal lenght III polytocous anImals.,
.T.:"::i Ii: ilH\.·�· , l k'::I:: t'; (:/ . 1 9(11l \lcCarth� . 1 965. ,\'IcLarcll. 1965). IS due pnmanly to
�'::-n:H;"d .:�'n·:;,:ul1on (Qr .:J. ll lTIlt<.:d pool or nutflt:nt� III the maternal Circulation (Clapp.
1 'l,;N ' . CI �:r':' I 1 98-91 -,u.;;gt:stcd !nai placenral and fClal growth are hrruted by the rale of

- ,----------------
O'\q::lter3 Effects on Length of Gestation and Prenatal Growth 68
utero-placental blood flow and a minor reduction in flow results in growth restriction
with no evidence of metabolic abnonnalities. Because of the limitation of nutrients and
space provided by the mother, of course, the number of competitors is an important
determinant in this competition. The rate of intra-uterine growth is partly affected by the
number of fetuses in the same uterine horn (local effect) and partly by the number of
liner males (systemic effect) (Eckstein and McKeown, 1955a). ]t was assumed that
removal of one uterine horn would result in redistribution of maternal cardiac output into
the remaining Ulenne horn. If so, according to Clapp's flow limited-prenatal growth
theory. the redistribution of blood flow as a result of uterine removal, would provide
more nuuients to the conceptuses in the remaining uterine horn. Thus, the degree of pre
natal competition between conceptuses for nutrienrs could be reduced by the removal of
one uterine hom. This more favourable condition would induce fetal growth at a higher
rate.
Biggers el al. ( 1963) and McLaren ( 1963) showed that unilateral ovariectomy alone in
unmated mice resulted in ovarian hypertrophy, thus there is no difference between
operated and unoperated animals in their ovulation rate. Dziuk (1968), Webel and Dziuk
(1974) and Knight et at. (1973; 1977) reported that unilateral hysterectomy-ovariectomy
before mating resulted in ovarian hypertrophy, thus the number of ova ovulated by the
operated females is not different from that of unoperated females, and that operated
females have similar reproductive performance to the unoperated females up to day 30
of pregnancy. With respect to the ovulation rate, these ovarian compensatory effects,
after unilateral ovariectomy in mice (Biggers et aI., 1963; McLaren, 1963) or after
unilateral hysterectomy-ovariectomy in the pig (Dziuk, 1968; Webel and Dziuk, 1974;
Knight et ai., 1973; 1977), and uterine compensatory effects (with respect to the space
available in the uterine hom) after unilateral hysterectomy-ovariectomy in pig (Dziuk,
1968; Webel and Dziuk. 1974; Knight el al.. 1973; 1977) could not occur in this study
because all of the operation procedures were performed during the course of gestation.
Although an increase in the number of Graafian follicles in the remaining ovary after
removal of one ovary in the pregnant mouse has been reported by Ross and Beaumont
(1974), similar to that pattern of response in the non-pregnant mouse as reported by
McLaren (1963). unilateral ovariectomy before implantation resulted in embryonic
development arrest and implantation decrease due to honnonal deficiency in the adjacent
uterus of the rat (Nuti et al.. 1971).
During the course of pregnancy, total weight of the uterus is determined by the gravid
components and the weight of uterine tissue itself; and the growth of the uterus depends
.'----------------------------------------------
Olc:pter3 Effects on Length of Gestation and Prenatal Growth 69
primarily on the number of developing embryos contained. In the present study, the uterine hom undergoes extensive growth during the course of pregnancy (Table 3.6;
Figure 3.4 and 3.5). This is in close agreement with the theory that the growth of the
uterus is directed to accommodate the developing embryos contained by the uterus itself,
that is, the growth of the merus is dependent on both contact effect and hormonal effect
(Huggett and Hammond, 1964). The contact effect exerts itsself as soon as the
artachment of the embryo to the uterine mucosa is made, while the honnonal effect
begins to take effect during mid-pregnancy (Huggett and Hammond, 1964). Although
the percentage of empty uterine tissue decreased as pregnancy proceeded, the real
weight. in fact, increased extensively as the whole uterine weight increased (Table 3.6).
According to Huggett and Hammond ( 1964), the enlargement of the uterus during
pregnancy is partly caused by active growth particularly in the muscular tissue and
partIy by (be dilation of the mucosal tissue due to the growing embryonjc contents.
Gravid components of the uterus comprised fetuses and placentae and their membranes,
fetal fluid and the uterine tissue itself. In this study total weight (%) of fetal fluids,
placenta and uterine tissue per horn reached the maximum values at day 1 1 of
pregnancy. After day 1 1 of pregnancy, each value decreased gradually to reached a
minimum value below or about 10% of total weight of the uterine hom at day 1 8 of
pregnancy, just about one day before the expected parturition. In the same period total
weight (%) of the fetus per horn showed a marked increase from about 20% at day 1 1 to
a most dominant value of about 80% at day 18 of pregnancy. This tendency was
observed either in the operated (the UX and VOX) or in the unoperated (the SOP)
groups (Figure 3.4). This tendency can also be detected if the data is analysed in groups
of day factors (Figure 3.5). This is to say, therefore, that during the first half of
gestation period fetal fluids had a greater rate of growth than any other gravid
components. and then this rapid growth rate is taken over by the fetuses during the
second half of gestation period. The total fluid content of the conceptuses is made up of
yolk-sac fluid. exocoelomic fluid and amniotic fluid. Payne and Deuchar ( 1 972) noted
that the amount of exrra-embryonic fluid in the rat is largely regulated by the yolk sac. A
rapid increase in the amount of fetal fluid during the early gestation period has also been
reported by Renfree eI al. (1975) who studied the developmental changes in fetal fluids
in four different strains of mice from day l i to day 18 of pregnancy. Renfree et al.
(1975) showed that the amount of fluid was related to both the day of pregnancy (the
fluid reaching a peak: on day 16) and fetal weight. Later, McLaren eI al. ( 1976) clearly
showed that fetal fluid weight was inversely related to both litter size and fetal weight.
In this case the effect of fetal weight was exerted locally while liner size affected the
.! ............ ----------------------------�
OlcpIer3 Effects on Length of Gestation and Prenatal Growth 70
fluid systemically. The finding in [his study, therefore, supports the idea that the
changes in the fetal fluid throughout gestation may be a necessity for continuation of
fetal growth and maturation without any corresponding increase in intra-uterine pressure
(Huggett and Hammond, 1964; Renfree el at., 1975; McLaren et ai., 1976). However,
the peak. level of fetal fluid reached on day I I of pregnancy in the present study does not
parallel that found by Renfree et al. ( 1975) who found a peak amount of fetal fluid on
day 16. It is may be due primarily to differences in the approach procedure used. In this
study, the amount of fetal fluid was determined indirectly from the fixed object, except
for day 18 of pregnancy, while Renfree et al. (l975) worked with fresh preparation for
each day of gestation examined. Besides that, strain differences should also be considered. In mice, a one to two days difference between strains in reaching the fetal
fluid peak volume (Renfree et al., 1975), and a difference between strain in total amount
of fetal fluid at the same day of pregnancy (Johnson, 1971) have been documemed.
As mentioned above. the main focus of this study is to examine the effect of removal of
one uterine horn on the feral and placental growth in the remaining uterine horn. It was
expected that uterine transection would result in redirection of blood flow into the
remaining ucerine horn which, finally, prepares a more favourable environment for
growth.
In the present study, all groups, except the group of animals operated on, on day 14 of
pregnancy (data before day 14 of pregnancy for this group was not available), placental
growth, as indicated by weight, occurs predominantly in the first half of gestation
whereas feta! growth accelerates in mid-gestation and proceeds rapidly until term
(Figure 3.6; 3.7; 3.8).This result indicates that in the mouse the rapid growth of the
placenta precedes the period of rapid fetal growth and that placenta! development remain
rather static during the period of rapid fetal growth. This is supported by the positive
relationship between fetal and placental weight (Table 3.7 and 3.8). The placental
limitations of fetal growth in some species, particularly at the end of gestation period
have been reported by some authors (mice: McLaren, 1965; pig: Knight eI a1., 1977; rat:
Norman and Bruce, 1979a; 1979b; guinea pigs: Eckstein and McKeown, 1955a; 1955b;
Eckstein et aI., 1955). Knight et al. ( 1977), who observed the conceptus development
in intact and unilaterally hysterectomised-ovariectonUsed gilts, reported an increase in
fetal death after day 35 of gestation in a crowded uterine horn. They suggest that this
increase in fetal death is primarily caused by the placental insufficiency to support fetal
growth after day 35 of pregnancy. Eckstein el a1. (1955), who studied the effect of litter
size on variation in placental weight in the guinea-pig, and McCarthy (1967), who

· .. -----------------------------------
� l . I ', ' .. ::: if�Cb on Lell91h of Gcsl;Jlion :lIld PrcniJlillGrowlh 71
.·\.�::!:i\.·.: : 1:.- �' :(C;i , , :' I l l!.'!' .,il" ,llld lll,lll:!il.tl \\"l:i�:lll ll!l [d;!l ;tncl pl:u.:":l1lal wl.!ighl in
! : ! : .... <:,' 't" ;�',: ,:1.:[ [i .�' :'�" \,:Ih " f the (l'W.'; i� inlluclll"t:d by bOIl! S),SII.!JnIC and ]oc;.J
-' : (.'�': . \ ! ; :: '''::1 ['!.\ ... ·l·!ll.:! "l'c::.:ht \\";IS !lU! :1 �OUt! lIld..:x o f pl:iccl1lal function and did not . . - -
'" . ; . ·r:. ; .... ;'1.:.:: (::.' .!''''�·i.lll\'n l'dWl.:;.:ll llll';lII (..:[al m.:Il;ht and Iil(cr size (EckslClI1 el al., >j."; � : .\ kh,', '\'. l: '-: .d . . 1<1:'11 Ibis P:lf:Ulldcf W:IS also II1l1ul.!llccd by both syslemlc and
:,',',d , n',';: ' ! F ... ·1::-[,:\11 , '! .:E . . !\/)5: .\kCtnhy. 1967).
1, ... ·.·;:::1::. ,II,' 1>;\."'1 .... !\\t\C l ll (l( pi :t":clll:d l cglllauun of fdal growth has been extensively
, �" ; �cw:"'! d",'\\" l!I.:rl.' ! O\Vl·!l�. 19() ! : \V;tll� and Chard, 1 99 1 ; fowdcn, 1995: Harding
,:1;,j j,llin"[" JI, l 'N): "�lblnSl)J1 ('f (1/ , 19951. Th.: .: fkct of placcnlJ on Ihe growth of lhe
{:..It!� 1:- \,:.\l'rll:d hy bllth m;I;:lxllil' and ,.:nelocnn\! l1l\!chall1sms (Robinson ef at . . 1 995),
,:!1,i h' ,d!,l'.\· l il .. ' fl.'l:d �1"t)\\"Ih thi:, ll1\!chamsl11s mUSI bl.! supported by a sufficient numenl
�l!!'!'!:: ! I'bi,l m:: :md John:,lllO, 19(5) . Th!.: placenta controls the felal growth by its
.:,:[',:":: 11\' h") [i:m.�f;:r 1l1itril'IHs (rom th!.: llloth.:r to the ferus and by its capacity to utilize ::i1.[ m,'Ji t"y [ll ;.: :1\':llbbk lill ln.:nts (Ow!.!ns, 199 1 ) . All Insulin. cortisol, thyroxine, and
f'Jtllli.:r;.· �iI'wth ihlrmOlll'S :u!.: 1I1\·oh·.:d 111 both fc[al tissue <.Iccrellon and differentiation:
[ill� ::"::[!lll1, ill parI. m:ly h!.: l1l!.!dl:lI.:d by thl' IIlsulll1-likc growth factors (IGFs) (Fowden , i 1)1)5 1.
f3,1Ih f..:!:d w�l�ht and pl:!c.:nlal w!.:ighl of til!.: SOP group was lower than that of both
L'\: :!!1d l'O.\ �r(ll!ps Two impon:ant find!llgs can be revealed from thiS result. Firstly,
ih: ..:ff..:�! ()! lli!.:rir,..: IlInlt;ltion Oil Ih..: growlh of fdal and placenta! weight operated by
d:::. I ,: 01 rrcfll:Illcy Th!.: maxllllaJ utenne carrymg capacHy for a large Jmer may be :.:'\\.-;.:;:dcd :::II:r (by I-J of prcgnancy ThiS strongly suppOrts 'the limitation theory'
,u��;:.'�l'�i hy )ole I\.eo\\ n ('f al i 1976) S!.!condly, fetal growth retardation detected in the
�OP groups comp:lr.:d 10 the L'X and l:OX groups suggests the existence of the
"Y";::"Illh.- l'I!l'CI on i\
-,----------------
Olcpler3 Effects on Length of Gestation and Prenatal Growth 72
pregnancy may be due to either the nature of the data themselves or the methodological
lImitation faced in this study. In fact. due to the difficulty of separating the fetus from
the embryonic membrane in fresh preparation at days 1 1 and 15 of observation (and also
observation data at day 3 and 7), they were fixed in Bouin's solution before
examinatIOn. The uterine tissue and its gravid components may not be evenly
dehydrated by the Bouin's solution during fixation period or may not be dried properly
during the examination period.
Both the Day factor and Operation factor are independently affected the total fetal
weight, total placental weight, and total placenta1:fetal weight ratio at day 18. Those
parameters were lower in the group of animals operated on day 14 of pregnancy than in those of day 2. day 6, and day 10 of pregnancy. The difference was only significant
statistically compared to day 6 of pregnancy. Between groups and types of operation,
the SOP group was significantly lower than those of the UX and UOX group. There
were no a significant differences between UX and UOX groups. This is a strong
confirmation to the finding on the individual mean of the same parameters described on
the previous page of this report. These results also suggested that the reduction of liner
size up to half the normal size (SOP group) by removing one uterine hom allows both
the fetus and placenta to grow optimally in the remaining uterine horn. The optimal fetal
and placental growth in the remaining uterus may be provoked by the availability of
nutrients in a large amount sufficient for the growth of conceptuses.
Within groups of day, but not within groups of operation, there was a positive
relationship between fetal and placental weight. The common regression coefficient for
group of animals operated on day 2, day 6, day 10, and day 14 of pregnancy were 1.22 (r2 = 0,732, P < 0.001), 0,37 (r2 = 0,875, p < 0,001), 2,06 (r2 = 0,797, P < 0.00 1) ,
and 0,77 (r2 = 0,838, p < 0.001) respectively, A positive relationship between fetal and
placental weight can be used to argue a limitation of the placental function to support
fetal growth near term (Norman and Bruce, 1979a). This relationship has been reported
in rabbit. rat. guinea-pig, and in many monotocous animals (Norman and Bruce, 1979a)
but not usually in the mouse (McLaren, 1965).
, , l
... ----------------------------------------------------�
Chcpter4 Effects on Progesterone Concentrations and Ovarian and Uterine Histology 74
Chapter 4 P lasma Concentrations of P rogesterone and O varian and Uterine H istology
4.1 Introduction
4.1.1 Uterine Involvement in Progesterone Secretion by the CL
a. Luteotrophic effect of the uterus:
It is now accepted that the luteal life span during pregnancy is controlled by the uterus,
the adenohypophysis, and the conceptuses. Luteotrophic activity of the pituitary during
pregnancy in mice has been reported by several authors (Jaitly et al., 1966; Choudary
and Greenwald. 1969). However, this activity becomes insignificant after the first half
of gestation since hypophysectomy after Day 10 of pregnancy has no effect on
pregnancy (Choudary and Greenwald, 1969). After Day 10 of pregnancy the
luteotrophic role of the pituitary is taken over by the placenta (Choudary and Greenwald,
1969; Kohmoto and Bern, 1970). In greater detail, Critser et al. (1980) reported that the
conceptuses play a significant role in maintaining luteal life span during pregnancy. The
trophic action of the conceptuses on the corpora lutea (CL) is exerted in two ways.
Firstly, by day 8 of pregnancy the conceptuses inhibit the uterine luteolytic mechanism.
Secondly. by day 10. the conceptuses actively produce substances with mammotrophic
and luteotrophic activity (Critser el ai., 1980).
OJ.:pter4 Effects on Progesterone Concentrations and Ovarian and Uterine Histology 75
Although Dewar (1973) reported that the uterus did not influence the luteal life span,
several investigators have reported the presence of a regulatory effect of the uterus on
circulating progesterone concentrations in mice (Michael et ai., 1975; Barkley et ai.,
1977; Pointis el aI., 1981; Soares and Talamantes, 1983; Humphreys el aI., 1985) and
rats (Rothchild et al . • 1973). The capability of the uterine tissue to concentrate
progesterone above peripheral blood levels throughout early and mid-pregnancy has also
been reported by Wiest (1970).
The relationship between progesterone concentrations and fetal numbers has also been
studied by several investigators. For example. Humphreys et al. (1985) reported that
plasma progesterone concentration was positively related to fetal number, and that fetal
number was positively correlated with CL volume. Between days 6 and 12 after mating,
the plasma progesterone level of intact pregnant mice was greater than that of both
hysterectomyzed or intact pseudopregnant mice, and levels in hysterectomyzed mice
were higher than those of intact pseudopregnant animals (Critser el al.. 1982). The
observation that PGF2a. concentration was lower in pregnant and higher in intact
pseudopregnant mice than in hysterectomysed pseudopregnant mice (Critser el al ..
1 982), suggests that the luteotrophic effect of the uterine tissue is exerted by regulating
the PGF2a. secretion.
b. Luteolytic effect of the uterus:
Numerous investigators have studied the effects of uterine removal on ovarian function.
particularly luteal function in several species. The results have been reviewed by several
authors including Bland and Donovan ( 1966) and Anderson (1973; 1 977). Briefly,
while in primate species, including the human being, the ovarian function continues
uninteffilpred after removal of uterine tissue, in non-primates, the effects of uterine
removal vary between species and according to the reproductive state of the animals. In
the cyclic mice, rat, and rabbit, for example, hysterectomy does not interfere with
ovarian function, but it can prolong the ovarian function close to !hat of nonnal
pregnancy if it is conducted after a sterile mating. In contrast, in guinea pigs. removal of
the uterine horn at day 5 of the cycle causes a prolongation of progesterone secretion for
more than eight months. The persistence of this progesterone secretion, however, will
be reduced for a period of equivalent to gestation (65 - 70 days) if only the uterus is
removed on day 10 of the cycle. In those species in which uterine removal prolongs the
ovarian function, there is a relationShip between the functional length of the ovary and
the amount of uterine tissue remaining after operation (Bland and Donovan, 1966;
Anderson, 1973; 1977).
-.
OlGPter4 Effects on Progesterone Concentrations and Ovarian and Uterine Histology 76
Although luteal regression (luteolysis) can be caused by the withdrawal or inadequacy of
luteotrophic support, in many species it can also be caused by active production of a
luteolytic factor that brings about normal luteal regression (Bland and Donovan, 1966;
Anderson, 1973; Anderson, 1977; Johnson and Everitt, 1995).
Luteal function can be prolonged in many mammals, with the notable exception of
primates, either by hysterectomy or by ligating the tissues, including the blood vessels,
between the uterus and the ovary; however if the endometrium of the excised uterus is
homogenised and injected, luteolysis occurs (see Johnson and Everitt, 1995). Both the
ovary and the endometrium may be sources of lutolytic factors, depending on the
species and stage of the cycle. Hysterectomy results in regression of the CL only in the
contralateral ovary in the ewe, and if the whole uterus is transplanted elsewhere in the
body, lureolysis is prevented unless the ovaries are transplanted with the uterus as a unit
(Hansel et al., 1973; Johnson and Everitt, 1995). In addition, a small segment of uterine
horn remaining after partial hysterectomy in the sow is able to induce an earlier luteal
regression in the ovary ipsilateral to that uterine segment than in the contralateral ovary
(see Anderson, 1977). These results demonstrate that there is a humoral factor which
passes from the endomelfium to the ovary and causes luteolysis, that the luteolytic effect
of the uterus is exerted locally and that the ovary must be in close proximity for luteal
regression. The endometrial substance responsible for CL luteolysis has now been
established in the ewe, sow (Hansel et aI., 1973; Heap and Flint, 1984), cow (Hansel et
al., 1973; Heap and Flint, 1984; Johnson and Everitt, 1 995), sheep, guinea-pig and
horse (Heap and Flint, 1984; Johnson and Everitt, 1995) as PGF2a.. PGF2a. passes
from the endometrium into the uterine vein, and then by a local coumer-current transfer
it passes to the ovarian artery, and thence to the ipsilateral ovary (Hansell et al., 1973;
Heap and Flint, 1984; Johnson and Everitt, 1995).
The production of PGF2a. is stimulated by the oxytocin secreted from the CL, and if
oxytocin is neutralised, then luteolysis is delayed (Johnson and Everitt, 1995).
.. '------------------------------------------------
Olcpter4 Effects on Progesterone Concentrations and Ovarian and Uterine Histology 77
4.1.2 Uterine removal and progesterone levels
The effect of uterine removal (or hysterectomy) on progesterone concentration has been
reported by several investigators in mice (Critser et al., 1982), rats (Rothchild et a!.,
1973). guinea pigs (Rowlands and Short, 1959; Heap er ai., 1967) and in sheep
(Southee et ai., 1988). Hysterectomised pseudopregnant mice had plasma progesterone
concentrations at day 6, 8, 10, 12 after mating which were greater than those of intact
pseudopregnant but lower than those of intact pregnant mice (Critser et at., 1982). In
hypophysectomised rats, progesterone secretion continues for about 3 days after
removal of the uterine hom at day 12 of pregnancy (Rothchild €I aI., 1973). Although
the level of progesterone found by Rothchild ec ai. (1973) was lower than that of either
the intact or of the day 12 hypophysectomised pregnant rats, this finding is consistent
with the finding of Macdonald ec al., (1970) who reported that the luteolytic effect of LH
can be reduced by removing uterine tissue of the hypophysectomised rats. In non
pregnant guinea pigs, removal of the uterine horn results in both a prolongation of luteal
function and an increase in secretory capacity (Rowlands and Short, 1959; Heap et aI.,
1966). Prolongation of the progesterone secretion after hysterectomy was also found in
the anoestrous ewe which implies that premature regression of CL can be prevented by
removing the uterine tissue (Southee et ai., 1988).
Luteal regression of the cycling beef heifer (Anderson el ai., 1962) or pseudopregnant
rat (Labhsetwar, 1967) is dependent upon a stimulus from the uterus. Hysterectomy of
cycling heifers results in an extension of the luteal function to a period equivalent to or
exceeding that of pregnancy (Anderson et ai., 1965). Hysterectomy failed to affect
significantly the hypophysial levels of gonadotrophins during the period studied by
Labhsetwar (1967) and Christian el al. ( 1968). This allows the possibility that luteolytic
factors secreted by the endometrium act directly on CL without interfering with pituitary
function. Thus elimination or deletion of these factors (for example, by hysterectomy)
would allow the CL to remain active to secrete progesterone for longer than normal.
Hysterectomy at earlier days of the cycle also prolongs luteaJ function and increases the
luteal content of progesterone in the ewe (Anderson, 1973). Both luteal content and
peripheraJ progesterone concentration are raised after hysterectomy, which suggests
maintenance of the CL in this species. In goats, hysterectomy after mating decreases
jugular progesterone concentration over a period of 5 to 10 days, remains relatively
constant for a variable length of time, and then decreases either gradually or abruptly to
anestrous levels « 0.5 ng/ml). This indicates that maintenance of progesterone secretion
-'
�ter4 Effects on Progesterone Concentrations and Ovarian and Uterine Histology 78
occurs in hysterectomised goats, although at a depressed level for a variable length of
time after mating ( 147 to 184 days) (Currie and Thorburn, 1974).
Masuda et ai., ( 1967) reported Lhat either the presence of embryos in the uterus or the
absence of the uterus caused an increase in progesterone production as early as Day 14
of pregnancy, when compared with the same day of the cycling pig. Therefore, it may
be that, as in mice (Critser et at., 1980), luteal maintenance during pregnancy in the pig
can be exerted either by suppression of the luteolysin factors or by secretion of the
lureotrophic factors. However, a contradictory finding was reported by Belt et al.
(1970), who found that the luteal content of progesterone of a pig hysterectomised on
Day 40 and 60 of pregnancy was generally similar to that of intact animals during
comparable stages. This was tben confirmed by the finding of similarities in the fine
structure of granulose lutein cells in the CL in pregnant and hysterectomised animals
(Belt et ai., 1970). It is likely that the trophic influences controlling the CL may be
similar during pregnancy and after hysterectomy.
Though hysterectomy shortens the anestrous interval, it has no effect either on
progesterone, estradiol, prolactin, and growth hormone concentrations in cyclic dogs
(Hoffmann er al., 1992).
In guinea pigs, aneriai concentration of progesterone is low during the normal cycle,
after hypophysectomy and hysterectomy in the cyclic animals, and in the first 2 weeks
of pregnancy (Heap et at., 1967). During gestation the placenta and ovaries contribute to
the progesterone content of the peripheral blood, but placental production is relatively
more important near term (Heap et aI., 1973). Rowlands (1961) reported that
hysterectomy in cyclic animals resulted in prolongation of luteal function, noting that the
stage of the cycle at hysterectomy was critical. The earlier hysterectomy is performed in
the cycle, the longer the CL will be functional. Even removal of the uterine horn very
late in the estrous cycle (Day 15) had a detrimental effect on the life span of the CL.
Secretory activity of CL in pregnant hysterectomised guinea pigs is similar to that of the
estrous cycle (Heap er al., 1973).
The peripheral serum concentrations of progesterone and [he ovarian tissue levels of
20a-OH-SDH show similar patterns during prolonged pseudopregnancy 10 hysterectomised rats and in rats bearing decidual tissue (Pepe and Rothchild, 1974).
Hysterectomy either before or after inducing pseudopregnancy in rats prolongs the CL
life span until days 18 - 25, though the CL is smaller than those found durino ,
.. , .............. ------------------------------------------�
0lq:ller4 Effects on Progesterone Concentrations and Ovarian and Uterine Histology 79
pseudopregnancy (Anderson, 1973). Progesterone concentration after hysterectomy will
be maintained at a level comparable to that found on day 6 of intact pseudopregnant
animals for about one week longer than nonnal pseudopregnancy, but in the last week
these levels are much lower than during a similar period of pregnancy (Heap et at.,
1973). In pseudopregnant. deciduomata-bearing pseudopregnant, and lactating animals,
hysterectomy combined with hypophysectomy regressed the CL but progesterone
secretion was maintained for about 3 days after day 12 of pregnancy in the absence of
piruitary and placenta (Rothchild et al., 1973). Since the progesterone concentration
detected after operation is significantly lower than that found in inmct or in Day 12
hypophysectornised rats (Rothchild et ai., 1973), this suggests that in the rat the
placental luteotrophin seems to increase the rate of progesterone secretion in the absence
of LH.
Linle is known of the effects of removal of the uterus and/or the ovary on progesterone
levels during the subsequent pregnancy. The following section provides data on this
topic.
4.2 Objectives
As described above. several investigators have examined the concentration of
progesterone in maternal blood during various stages of gestation in intact mice.
However. few examinations on the effect of unilateral hysterectomy to maternal
hormone concentration during gestation have been made. The purpose of the present
study was to characterise progesterone concentration in maternal plasma after removal of
one uterine horn. with or withom its ipsilateral ovary. at several different stages of
pregnancy. Besides that, this study was also undertaken to provide details of the
histologic changes, if any, in the remaining merine hom (especially in the epithelial cells
lining the endometrium) and in the ovary(ies) (especially in the luteal cells) of the mice
after surgery. Surgery was carried out on alternate sides of the uterine horn in
successive animals.
4.3 M ethods
4.3.1 Progesterone Measurement
a. Blood sampling
Blood samples were collected at several specified days of gestation and on the day of
panurition. Cnder light anesthesia. the mouse was exsanguited by directly puncturing
the heart with a 26G needle. The blood (0.8 - 1 .5 ml/mice) was sucked out by using
... , ...................... --------------------------------------------------
O1<:pter4 Effects on Progesterone Concentrations and Ovarian and Uterine Histology 80
heparinised disposable plastic syringes. placed in heparinised tubes and centrifuged. The
plasma was then harvested and kept in a freezer (-200C) until progesterone assay (see
Chapter 2). All blood samples were collected between 0900 and 1 100 h in the morning
or no longer than 4 hours after parturition. Blood samples were collected from 210
pregnant mice used for the embryonic growth experiment as described previously in
Chapter 3.
b. Progesterone assay
The radioimmunoassay (RIA) procedure used to measure plasma progesterone
concentrations was similar to that of Jones and Rose (1992). This procedure involved a
separation (extraction) of progesterone from plasma and an assay of the progesterone
concentration by radioimmunoassay. The antibody used in this RIA was kindly
provided by Dr. Susan Jones of the Zoology Department, University of Tasmania.
Separation of progesterone from the plasma:
Plasma was extracted with iso-octane (Ajax, A.R. grade) for progesterone. Glass
pasteur pipenes were packed with approximately I ml of 60-80 mesh chromosorb
(Chromosorb W) mixed with 25% (w/w) ethylene glycol (made by 24 g chromosorb +
6 g ethylene glycol). Approximately 5 mm acid-washed sand was added on top of the
chromosorb to avoid chromosorb disturbation when the sample or solvent was added.
Columns were wetted with 1 ml (2 x 0.5 ml) iso-octane and flushed with 3 ml (6 x 0.5
ml) of the same solvent to remove impurities from the column. Fifty micro litre plasma
samples were added to each column and progesterone was eluted with 3 ml (6 x 0.5 ml)
iso-octane. All 3 ml of eluent, containing progesterone, from each column were
collected iDlO glass tubes for assay. Percent recovery of progesterone was 93%.
Progesterone assay:
A set of duplicate standard solutions containing 0, 25, 50, lOa, 200, 400, and 800 pg
progesterone in 50 J.1l ethanol was prepared. These were prepared by a 1: 1 (vlv) serial
dilution of a stock solution of 800 pg progesteronelml in ethanol. Two extra tubes with
zero standard for non-specific binding (NSB) were also prepared. Fifty rnicrolitres of
[3H]-progesterone in ethanol was added to each standard, NSB, and sample tubes. All of these tubes were then dried under air in a warm water bath. One hundred microliters
prepared anti-progesterone antiserum solution were added to each standard and sample
tube, while the NSB tubes received 100 �l of assay buffer G. All tubes were then
vortexed, covered with aluminium foil, and incubated overnight at 4oC.
... , .......................... --------------------------------�
Olc:pter4 Effects on Progesterone Concentrations and Ovarian and Uterine Histology 81
Free molecules of progesterone were separated from antibody-bound progesterone by
the addition of 0.5 m1 dextran coated-charcoal suspension (5 mg charcoal + 0.5 rng
dextran T.70 + 0.2 mg thiomerosallml 0.2 M phosphate buffer). All tubes were
vortexed and then incubated at 40C for 15 minutes and centrifuged at 1 500 g and 4°C
for 15 minutes to sediment the dextran coated-charcoa1. One hundred and flfty
microlitres of supernatant were taken from each tube and added to a scintillation vial
containing 2.5 m1 scintillant (Ecc-scint, National Diagnostics) for radioactive counting.
All vials were then shaken well to avoid separation phase. Radioactivity was measured
in a Beckman LS 5801 liquid scintillation spectrometer. The absolute amount of
progesterone for each sample was determined automatically, as a computer print-out,
using a radioirrununoassay program. The intra- and inter-assay coefficients of variation
were 14.21 % (n = 10) and 10.25% (n = 8), respectively.
4.3.2 Histological Procedure
a. Tissue collection
Organs required for histological examination were the ovaries and uterine tissue with
placental tissues (the latter tissue denoted as implantation site) which were obtained from
the animals examined for the previous experiment (Chapter 3). Four animals per group
were chosen as a source of the tissue. On Day 18 of pregnancy, the pregnant animals
were killed by cervical dislocation. The remaining uterine horn was opened and fetuses
with their attached membranes were carefully removed without disturbing other tissue.
The placenta remained intact and its contact with the uterine tissue was not disturbed. In
order to avoid any tissue curving during fixation period, the uterine tissue (implantation
site) was spread in the petri dish. Bouin's fixative was immediately poured slowly over
the surface of the tissue until the whole tissue was evenly soaked (2 - 3 minutes).
During this pre-fixation treatment, care was taken to avoid excessive physical stretching.
The tissue was then sliced transversely and fixed in Bouin's solution for 48 hours.
The ovarian tissue was directly fixed in Bouin's solution after all the excess fat covering
the ovary was removed. The duration of fixation period was 48 hours. Two kinds of
ovarian tissue were obtained from the UX group. The first kind was an ovary where its
ipsilateral uterine horn remained intact (denoted as 0+), and the second was an ovary
where its ipsilateral ovary was removed (denoted as 0-).
,
... ------------------------------------------------------------�
Olcpfer4 Effects on Progesterone Concentrations and Ovarian and Uterine Histology 82
b. Tissue processing
Following the removal of the yellow stain from the picric acid by using a saturate
solution of lithium carbonate in 70% alcohol, each tissue was dehydrated in a series in
which alcohol content was gradually increased from 70% (four changes for 6 hours
each), 80% (for 3 hours), 90% (for 3 hours) to absolute alcohol (two changes for one
hOUf each).
Before embedding, the dehydrated tissues were then ctireclly transferred from absolute
alcohol to xylene until transparent (for about 12 hours), transferred to a wax-xylene
mixrure (50:50) for 30 minutes at 40oC, and infiltrated with wax by transferring them
into two changes of pure wax (for 30 minutes each) in the vacuum embedding oven.
Each tissue was then embedded in wax (Paraplast).
Sectioning was made transversely (for implantation site) and longitudinally (for ovarian
tissue) al 6 j.Lm. Serial sectioning of both implantation site and ovarian tissue was made.
Sections were then mounted on the slides and stained with hematoxylin and eosin.
c. Microscopic Examination
The diameter of large luteal cells and their nuclei and the length of the epithelial cells
lining the endometrial uterine were measured using the Nlli Image computer program v .
1.56 (written by Wayne Rasband, the U.S National Institutes of Health, available from
the Internet by anonymous FTP from zippy.nimh.nih.gov) running in the Macintosh
machine.
From each animal, four slides were chosen for examination. Four sections from each
slide were chosen randomly for examination, and five cells from each section were
randomly measured. Examination was made under 50x magnification of a light
microscope. The tissue image was captured by the video camera connected to the
Macintosh machine. The NIH Image program allows an image to be captured and
measured. Before measuring. the unit of measurement was calibrated from pixeU to
micrometer. The measurement results (in micrometer) were then sent to the statistical
Systat program for analYSis. The number of CL and Graafian follicles were also counted
during the microscopic examination.
... ,----------------------------------------------------------------�
Olc::pter4 Effects on Progesterone Concentrations and Ovarian and Uterine HistoJogy 83
4.3.3 Statistical analysis
ResullS are expressed as mean ± SEM, except where otherwise indicated. Two way
analysis of variance, if appropriate, was applied to access the effect of treatments. The
effect of operation on maternal progesterone concentrations for each group of Day factor
were accessed by using the one way analyses of variance. Multiple comparisons
between groups were made by the Tukey HSD-test. Paired samples (-test was also
applied if appropriate.
4.4 Results 4.4.1 Progesterone Concentrations
Progesterone concentrations (nglml plasma) measured during the period of one day after
operation to the parturition day fOf each group are presented in Figure 4. 1 . In the
animals operated on, on day 2 of pregnancy (Figure 4.1A), the UX and SOP groups
showed a small increase in plasma progesterone from 43.26 ± 10.93 and 48.52 ± 10.65
(mean ± SEM) on day 3 to 53. 1 1 ± 9.93 and 62.84 ± 14.49 for the UX and SOP
respectively on day 7 before reaching a constant level until day 1 1 . In the same period,
progesterone concentration in the UOX group remained constant, valued between 40.80
± 8.80 on day 3 and 44.77 ± 9.52 on day 1 1 . All groups reached a peak concentration
of 1 13.73 ± 2 1 .59 for the UX, 69.15 ± 19.22 for the UOX, and 104.98 ± 12.44 for the
SOP group on day 1 5 before dropping abruptly to the lowest level on day 18 of
pregnancy, except for the SOP group where the lowest level was reached on the
parturition day. At the day of parturition, progesterone concentrations rose again in the
UX and UOX groups. During the period from day 3 to day 1 5 of pregnancy
progesterone concentration of the UOX group tended to be lower (but not significantly)
than those of either the UX or the SOP group. At day 18 of pregnancy, however,
plasma progesterone concentration of the UX (6.95 ± 1.75) was similar to those of the
UOX groups (4.85 ± 2.19) which were significantly (p < 0.00 1) lower than that of the
SOP group (23.15 ± 2.03).
The pattern of progesterone concentration was altered when the operation was
penormed after day 2 of pregnancy (Figure 4.1B, C, and D). The peak levels of
progesterone on day 15 of pregnancy, as can be observed in all groups of animals
operated on, on day 2 of pregnancy, were never reached by the UX and UOX if the
operation was performed on day 6 (Figure 4.1B). day 10 (Figure 4.IC), and day 14 of
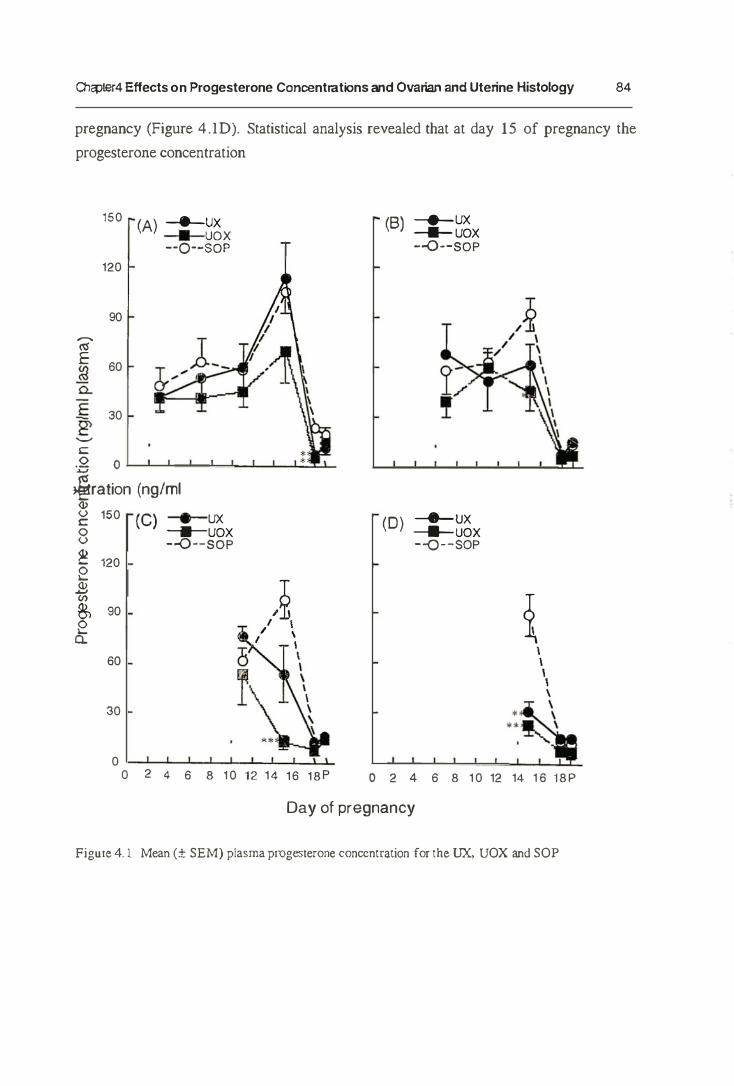
... '----------------------------------------------------------------------------�
Ole:pter4 Effects on Progesterone Concentrations and Ovarian and Uterine Histology 84
pregnancy (Figure 4.1 D). Statistical analysis revealed that at day 1 5 of pregnancy the
progesterone concentration
150 (A) __ ux
• UOX --o--sop
120
90 �
1-_ '" E 60 gj --CL E 30 g>
� c
,2 0 �
�ration (ng/ml <l> v 150 (C) • ux c 0 ___ uox v --o--80P � 120 2 .& '" � 90 2
a. 60
30
0 0 2 4 6 8 1 0
/� I 1 / , I I
\
I) I
r \, \ \ ,
12 14 16 18P
(8)
(0)
__ ux __ uox --o--80P
__ ux __ UOX --o--SOP
/ / /�
i I I I I \
o 2 4 6 8 1 0 12 14 1 6 l8P
Oay of pregnancy
Figure 4. 1 Mean (± SEM) plasma progesterone conccnlralion ror Ihe UX, UOX and SOP
, .'
... '------------------------------------------------------------�
Cl'\cpter4 Effects on Progesterone Concentrations and Ovarian and Uterine Histology 85
of the UOX group, bm not the UX group, was significantly lower than the SOP group
if they were operated on, on, on day 6 (p < 0.05) (Figure 4.IB) or day IO of pregnancy
(p < 0.001) (Figure 4.1C). If the operation was performed on day 14 of pregnancy,
both the UOX (p < 0.001) and the UX group (p < 0.01) showed a significant decrease
in their progesterone levels (Figure 4.1D).
At all days of observation, except at day 1 1 for the animals operated at day 6 of
pregnancy (Figure 4.1B), progesterone concentrations of the UX group were higher
than those of the UOX group. However, this difference was not significant. At. parturition day, all groups of animals operated on, on day 2, day 6, and day 1 1 , but not
on day 14, showed an increase in their plasma progesterone concentrations except for
the SOP group operated on, on day 2 of pregnancy.
A two way analysis of variance was performed in order to determine whether the Day
factor and the Operation factor affected the plasma progesterone concentrations in
combination or separately. The analysis revealed that the interaction effect of the Day x
Operation factor on the progesterone concentration was only detected on day 18 of
pregnancy. The SOP groups operated on, on after day 2 of pregnancy, in general,
showed a higher level in their progesterone concentration on day 18 of pregnancy than
the UX and UOX groups. Results of the Tukey HSD-test for this interaction effect are
presented in Table 4. 1 .
The independent effects of the Day factor and Operation factor on progesterone
concentration after operation are presented in Figure 4.2. Regardless of the Operation
factor, at day 15 of pregnancy the concentration of the animal treated on day 2 was
significantly higher than that of animals treated on either day 6, day 1 0 or day 14 of
pregnancy (Figure 4.2A). Significant differences between groups in the progesterone
concentration also occurred on day 1 8 of pregnancy. Progesterone concentration in the
animals operated on, on day 6 was significantly lower than that of the animals operated
on, on either day 2, day 10 or day 14. AJthough the progesterone concemration in both
the day 10 and day 14 groups was Significantly higher than that of the day 6 group, their
concentrations did not differ greatly from the day 2 group. Regardless of the Day factor,
progesterone concentration in the VOX group (whose uterine hom and ovary had been
removed unilaterally) was lower than that of both the UX and SOP groups (in which the
two ovaries were left intact) at all days of pregnancy observed (Figure 4.2B). However.
these differences were only significant at day 15 and day 18 of pregnancy.
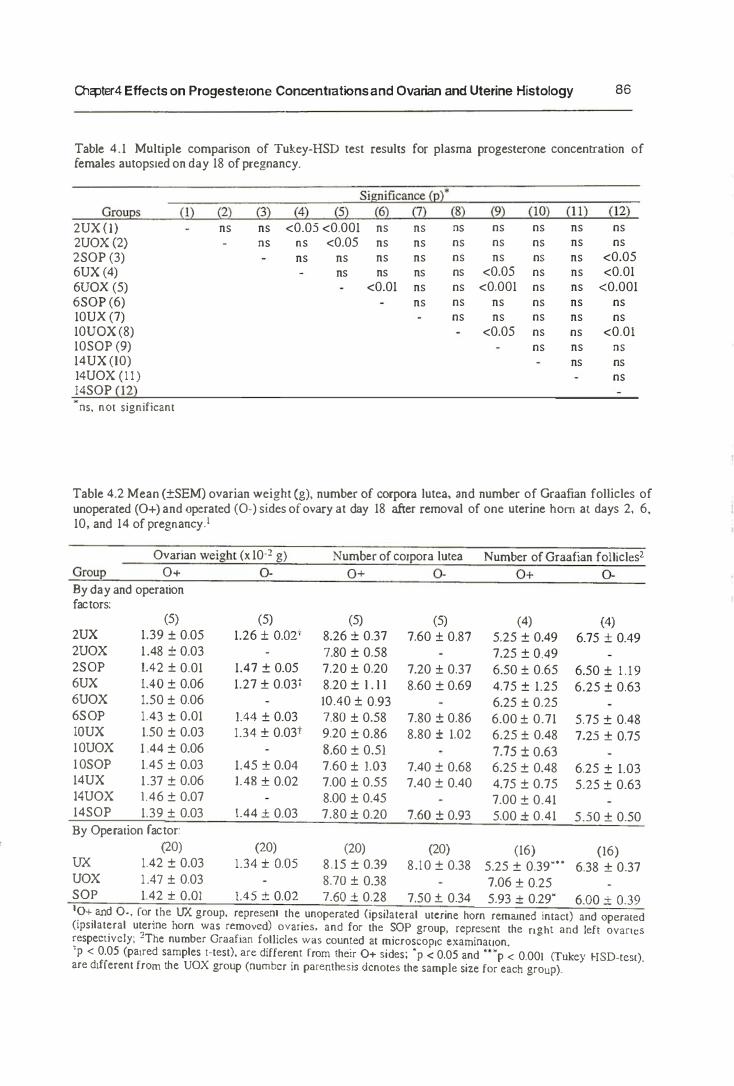
--'--------------------------------------------------,
Olzpter4 Effects on Progesterone Concentrations and Ovarian and Uterine Histology 86
Table 4.1 Multiple comparison of Tukey-HSD test resullS for plasma progesterone concentration of females autopsIed on day 18 of pregnancy.
Significance (l2f Groups (I) (2) (3) (4) (5) (6) (7) (8) (9) (10) (I I) (12)
2UX (I) ns ns <0.05 <0.001 ns ns ns ns ns ns ns 2VOX (2) ns ns <0.05 ns ns ns ns ns ns ns 2S0P (3) ns ns ns ns ns ns ns ns <0.05 6UX (4) ns ns ns ns <0.05 ns ns <0.01 6VOX (5) <0.01 ns ns <0.001 ns ns <0.001 6S0P (6) ns ns ns ns ns ns 10UX (7) ns ns ns ns ns 10VOX (8) <0.05 ns ns <0.01 10SOP (9) ns ns ns 14UX (10) ns ns 14VOX (II) ns 14S0P (12) . ns, nOt significant
Table 4.2 Mean (±SEM) ovarian weight (g), number of corpora luten. and number of Graafian follicles of unoperated (0+) and operated (0-) sides of ovary at day 18 after removal of one uterine hom at days 2, 6, 10, and 14 of pregnancy .I
Ovarian wei�ht (x 10-2 g) Number of corpora lutea Number of Graafian folliclesl Groul:! 0+ By day and operation factors:
2UX 2UOX 2S0P 6UX 6UOX 6S0P IOUX 10UOX 10SOP 14UX 14UOX 14S0P
(5) 1.39 ± 0.05 1 .48 ± 0.03 1.42 ± 0,01 lAO ± 0.06 1.50 ± 0.06 1.43 ± 0.01 1.50 ± 0.03 1 .44 ± 0.06 1.45 ± 0.03 1 .37 ± 0.06 \.46 ± 0.07 1.39 ± 0.03
By Operation ractor: (20)
UX 1.42 ± 0.03 VOX 1 .47 ± 0.03 SOP 1.42 ± 0.01
0-
(5) 1.26 ± O.02t
1.47 ± 0.05 1.27 ± 0.03t
1.44 ± 0.03 1.34 ± 0.03t
1.45 ± 0.04 1.48 ± 0.02
1.44 + 0.03
(20) 1.34 ± 0.05
lAS ± 0.02
0+ 0- 0+ 0-
(5) (5) (4) (4) 8.26 ± 0.37 7.60 ± 0.87 5.25 ± 0.49 6.75 ± 0.49 7.80 ± 0.58 7.25 ± OA9 7.20 ± 0.20 7.20 ± 0.37 6.50 ± 0.65 6.50 ± 1 . 19 8.20 ± l . l l 8.60 ± 0.69 4.75 ± 1.25 6.25 ± 0.63 lOAD ± 0.93 6.25 ± 0.25 7.80 ± 0.58 7.80 ± 0.86 6.00 ± 0.71 5.75 ± 0.48 9.20 ± 0.86 8.80 ± 1.02 6.25 ± 0.48 7.25 ± 0.75 8.60 ± 0.51 7.75 ± 0.63 7.60 ± 1.03 7.40 ± 0.68 6.25 ± 0.48 6.25 ± 1.03 7.00 ± 0.55 7.40 ± 0.40 4.75 ± 0.75 5.25 ± 0.63 8.00 ± 0.45 7.00 ± 0.41 7.80 + 0.20 7.60 ± 0.93 5.00 + 0.41 5.50 ± 0.50
(20) (20) (16) (16) 8.15 ± 0.39 8.10 ± 0.38 5.25 ± 0.39'" 6.38 ± 0.37 8.70 ± 0.38 7.06 ± 0.25 7.60 + 0.28 7.50 + 0.34 5.93 + 0.29" 6.00 + 0.39
to+ and 0-. for the UX group. represent the unoperated (ipsilateral uterine horn remamed intact) and operated (ipsilateral uterine horn was removcd) ovaries, and for the SOP group, represent the nght and left ovanes respectively; 2The number Graafian follicles was counted at microscopIc examinallon. 'p < 0.05 (paired samples t·test), arc different from their 0+ sides: 'p < 0.05 and " 'p < 0.001 (Tukey HSD-test). are different from the UOX group (numbcr in parenthesis denotes the sample size for each group).
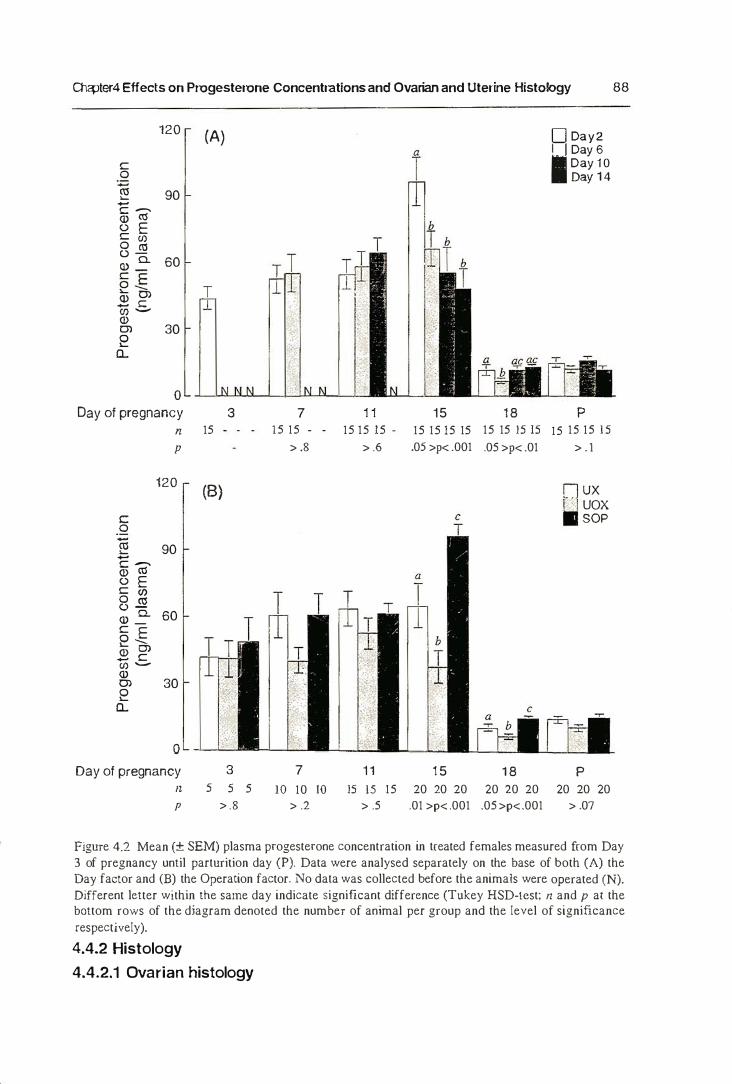
-'-----------------------m
OlGpter4 Effects on Progesterone Concentrations and Ovarian and Uterine Histology 88
e o
120
"§ 90 -c -Ol '" " E e "' o '" � 0.. 60
§ .§ � 0> 2 e "' -Ol 0> 30 e
f:L
o Day of pregnancy
(A)
3
n 15
e o
p
120
1§ 90 -c -Ol '" " E e "' o '" () c.. 60 Ol -e E e � Ol O>
_ e "' -Ol 0> 30 e
f:L
o Day of pregnancy
"
p
(8)
3
5 5 5 > .8
7 15 15 -
> .8
7
1 1 15 15 15
> .6
1 1
15 1 8
�DaY2 Day 6 Day 10 Day 14
p 15 15 15 15 15 15 15 15 15 15 15 15 ,05 >p< .001 .05 >p< .01
a
1 5 1 8
> . 1
�ux - UOX
sOP
p iO 10 JO 15 IS 15 20 20 20 20 20 20 20 20 20
> .2 > .5 .01 >p< .001 .05 >p< .001 > .07
Figure 4.2 Mean (± SEM) plasma progesterone concentration in treated females measured from Day 3 of pregnancy until parturition day (P). Data were analysed separately on the base of both (A) the Day factor and (B) the Operation factor. No data was collected before the animals were operated (N). Different letter within the same day indicate Significant difference (Tukey HSD-Icst; n and p at the bottom rows of the diagram denoted the number of animal per group and the level of significance
respectively).
4.4.2 Histology
4.4.2.1 Ovarian histology
" � '.
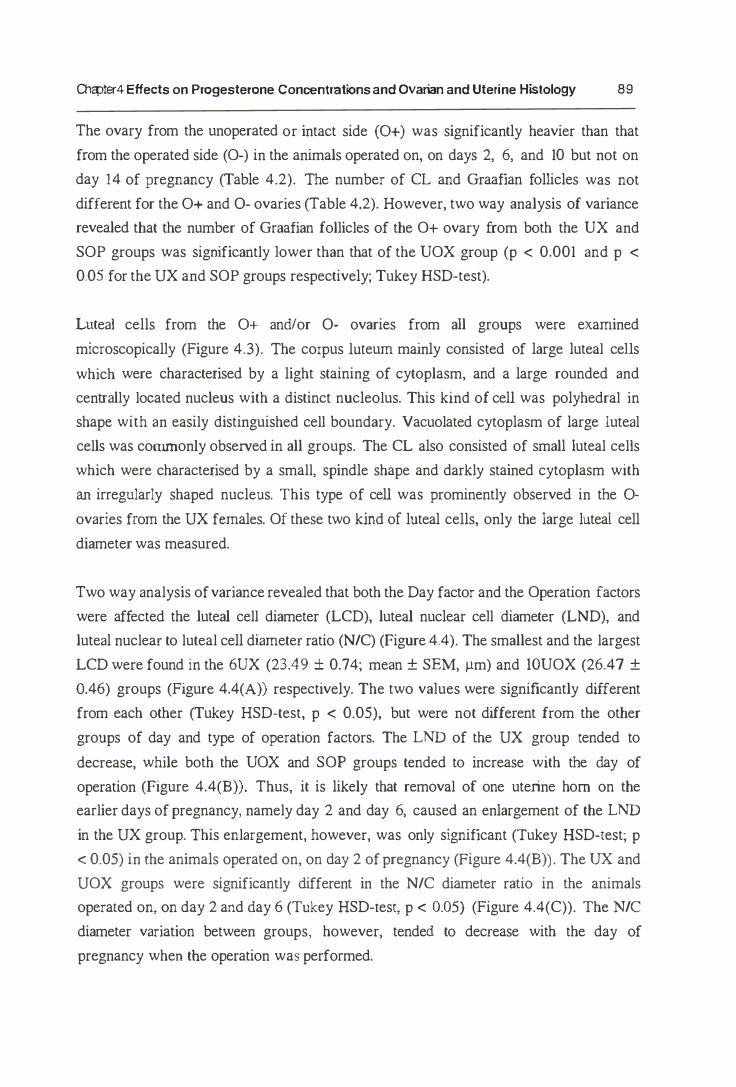
�' .. ----------------------------------------------------------------�
OlGpter4 Effects on Progesterone Concentrations and Ovarian and Uterine Histology 89
The ovary from the unoperated or intact side (0+) was significantly heavier than that
from the operated side (O�) in the animals operated on, on days 2, 6, and 10 but not on
day 14 of pregnancy (Table 4.2). The number of CL and Graafian follicles was not
different for the 0+ and 0- ovaries (Table 4.2). However, two way analysis of variance
revealed that the number of Graafian follicles of the Ot ovary from both the UX and
SOP groups was sigruficantly lower than that of the UOX group (p < 0.001 and p < 0.05 for the UX and SOP groups respectively; Tukey HSD-test).
Lmeal cells from the 0+ andlor 0- ovaries from all groups were examined
microscopically (Figure 4.3). The corpus IUleum mainly consisted of large luteal cells
which were characterised by a light staining of cytoplasm, and a large rounded and
centrally located nucleus with a distinct nucleolus. This kind of cell was polyhedral in
shape with an easily distinguished cell boundary. Vacuolated cytoplasm of large luteal
cells was commonly observed in all groups. The CL also consisted of small luteal cells
which were characterised by a small, spindle shape and darkly stained cytoplasm with
an irregularly shaped nucleus. This type of cell was prominently observed in the 0-ovaries from the UX females. Of these two kind of luteal cells, only the large luteal cell
diameter was measured.
Two way analysis of variance revealed that both the Day factor and the Operation factors
were affected the luteal cell diameter (LCD), luteal nuclear cell diameter (LND), and
luteal nuclear to luteal cell diameter ratio (N/C) (Figure 4.4). The smallest and the largest
LCD were found in the 6UX (23.49 ± 0.74; mean ± SEM, �m) and IOUOX (26.47 ±
0.46) groups (Figure 4.4(A» respectively. The two values were significantly different
from each other (Tukey HSD-test, p < 0.05), but were not different from the other
groups of day and type of operation factors. The LND of the UX group tended to
decrease, while both the UOX and SOP groups tended to increase with the day of
operation (Figure 4.4(B» . Thus, it is likely that removal of one uterine horn on the
earlier days of pregnancy, namely day 2 and day 6, caused an enlargement of the LND
in the UX group. This enlargement, however, was only significant (fukey HSD-test; p
< 0.05) in [he animals operated on, on day 2 of pregnancy (Figure 4.4(B» . The UX and
UOX groups were significantly different in the N/C diameter ratio in the animals
operaled on, on day 2 and day 6 (Tukey HSD-Iesl, p < 0.05) (Figure 4.4(C)). The N/C
diameter variation between groups, however, tended to decrease with the day of
pregnancy when tbe operation was performed.
I
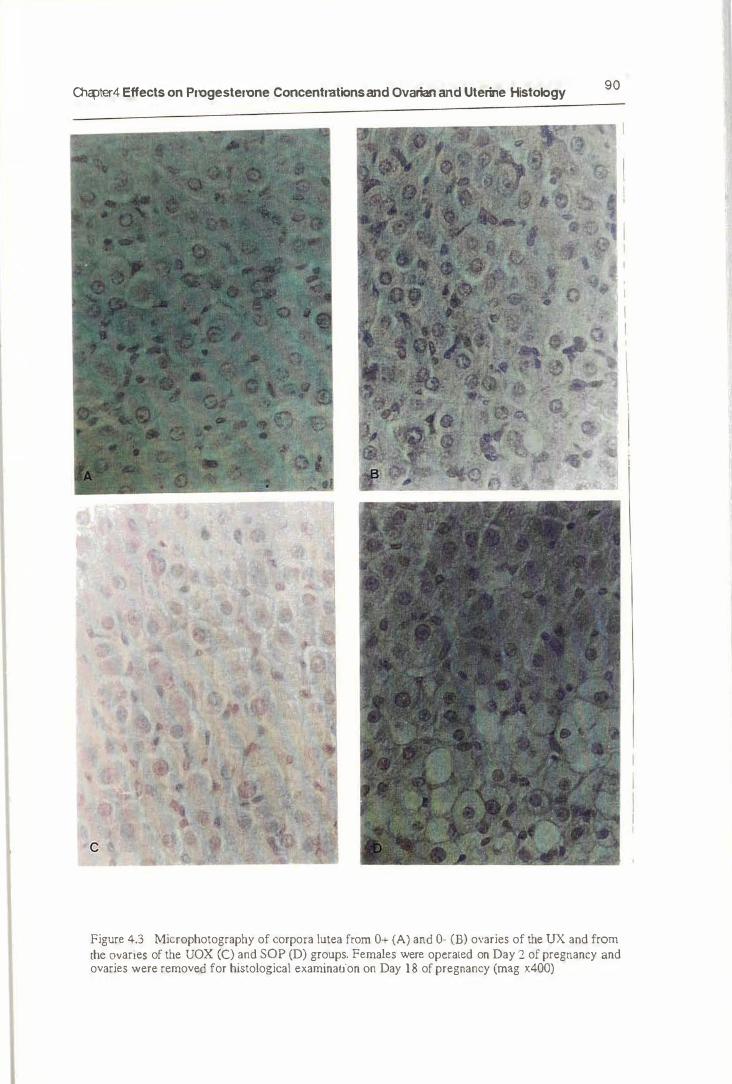
�r4 Effects on Progesterone Concentrations and Ovarian and Uteri1e Histology
c
Figure 4.3 Microphotography of corpora lutea from 0+ (A) and 0- (E) ovaries of the UX and from the ovaries of the VOX (C) and SOP (D) groups. Females were operated on Day 2 of pregnancy and ovaries were removed for histological examination on Day 1 8 of pregnancy (mag x400)
90
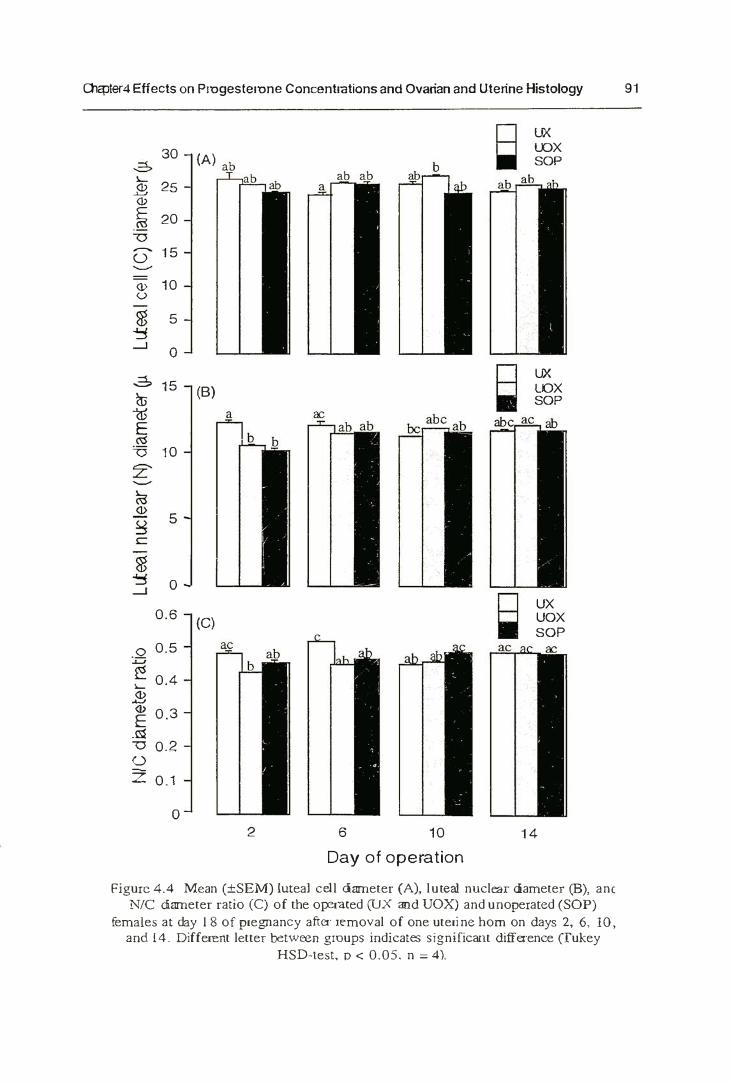
.. , -----------------------� � '
0lc:pter4 Effects on Progesterone Concentrations and Ovarian and Uterine Histology 91
30
L 2 25 <1>
.� 20
� 1 5 o -
<1> 10 v
5
o
2> 15 � '" E ,"
-0 10
5
o
0.6
,0 0.5
l'i I..... 0.4 2 E 0.3
.Oil "'0 0.2 o Z 0.1
o
(A)
(8)
(C)
2 6 10
Day of operation
ux LOX SOP
ux LOX SOP
UX UOX SOP
1 4
Figure 4.4 Mean (±SEM) luteal cell oameter (A), luteal nuclear ciameter (B), an( N/C dameter ratio (C) of the o{:eraced (UX and VOX) and un operated (SOP)
females at day 1 8 of pregnancy after removal of one uteri ne hom on days 2, 6, 10, and 14. Different letter between groups indicates significant difference (Tukey
HSD-tesl. P < 0.05. n = 4).
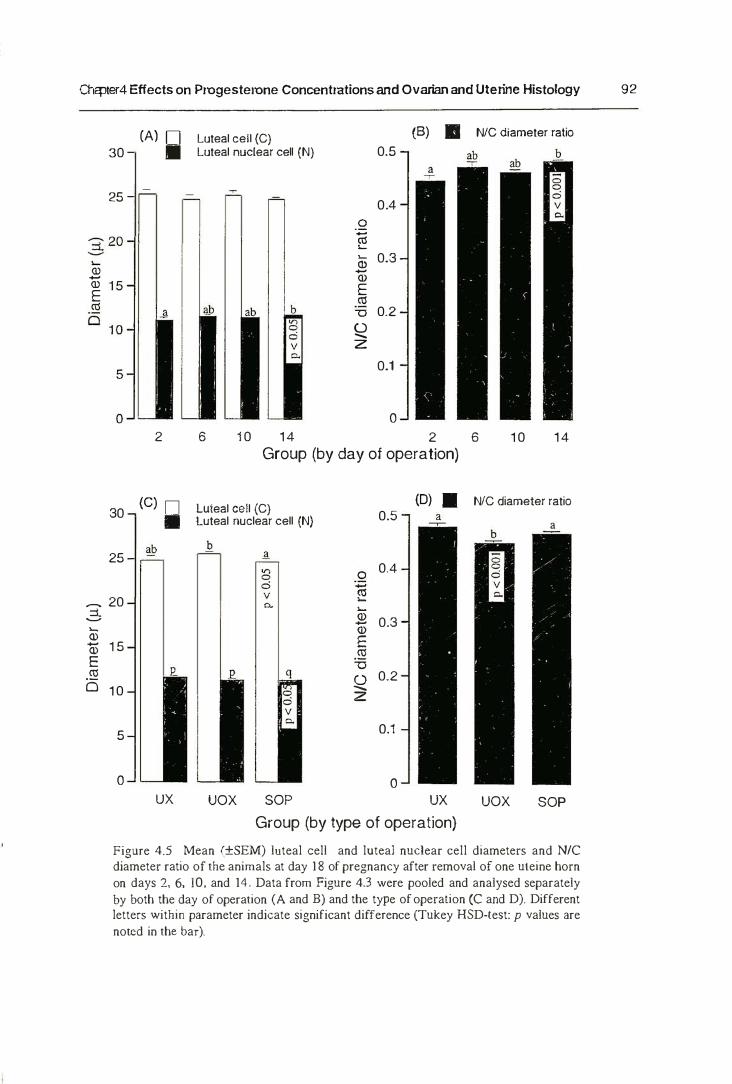
�i ________________________________________________ � �
0l;::pter4 Effects on Progesterone Concentrations and Ovarian and Uterine Histology 92
� (]) -(]) E '"
o
2; � (]) -(]) E .� 0
30 (A) ..
25
2
30 (C) IIr 25 ,p
20
1 5
10
5
o ux
Luteal cell (C) (8) • N/C diameter ralio Luteal nuclear cell (N) 0.5
6
0.4 o .� CD 0.3
-(]) E '"
"'C 0.2 � Z
0.1
o 10 14 2 6
Group (by day of operation) 10 14
luteal cell (C) (D) • N/C diameter ratio luteal nuclear cell (N) 0.5
� 0 0.4 0 " -v '" � � �
(]) 0.3 -(]) E .�
" 0 0.2 � Z
0.1
o UOX SOP UX
Group (by type of operation)
,
UOX SOP
Figure 4.5 Mean (±SEM) luteal cell and luteal nuclear cell diameters and N/C diameter ratio of the animals at day 18 of pregnancy after removal of one uleine horn on days 2, 6, 10, and 14. Data from Figure 4.3 were pooled and analysed separately
by both the day of operation (A and B) and the type of operation (C and D). Different letters within parameter indicate significant difference (Tukey HSD-Iest: p values are noted in the bar).

------------�--- . - - -
0lc:pter4 Effectson Progesterone Concentrations and Ovarian and Uterine Histology 93
3: 30
-�
25 <D W E 20 '"
"0 - 1 5 So2. <D 1 0 " '" 5 2 "
--J 0 -=L - 1 5 � <D -'" E '"
"0 10
Z -� '"
� 5 "
" c '" 2 " 0 --J
0.6
0 0_5 -'" �
0.4 � <D -<D 0.3 E
.<0; "0 0.2 0 � Z 0_1
0
(8)
n ...
(C)
2UX 6UX 10UX 14UX
G r o u p s
0+ 0-
0+ 0-
0+ 0-
Figure 4.6 Mean (±SEM) luteal cell diameter CAl, luteal nuclear diameter (B) and NrC diameter ratio (C) from intact (0+) and operated (0·) side of ovaries at day 1 8 of pregnancy after removal of one uterine horn (UX) on several different days of pregnancy (days 2, 6, 10, and 14). �H P < om and HWW p < 0.001 arc different from intact side (paired samples t-tcst; 1/ for 2UX and IQUX arc 240, and for 6UX and 14UX are 244).
... ,--------------------------------------------------------------�.
0lcpler4 Effects on Progesterone Concentrations and Ovarian and Uterine Histology 94
When the data was grouped into the day of operation factor (Figure 4.5(A) and (B)),
without considering the operation factor, it was found that 1 ) The highest and the lowest LCD were found in the animals operated on, on day 2 (25.39 ± 0.42) and day 14
(24.47 ± 0.17) of pregnancy respectively, but no differences between groups were
found; 2) The lowest value for LND was found in the animals operated on, on day 2
( 1 1 . 1 5 ± 0.26) which is significantly different (Tukey HSD-test. p < 0.05) from the
highest value obtained in the animals operated on, on day 14 ( 1 1 .67 ± 0. 1 0), but not
significantly different from the other two groups (day 6 and day 10); 3) Consequently,
the lowest value for NrC was found in the animals operated on, on day 2 (0.44 ± 0.01)
which is significantly different (Tukey HSD-test, p < 0.001) from the highest value
obtained in the animals operated on, on day 14 (0.48 ± 0.01), but not significantly
different from the other two groups (day 6 and day 10).
When the data was grouped into the type of operation factor, without considering the
day factor (Figure 4.5(C) and (D»), it was found that : 1) The highest values for LCD
were found in the UOX group (25.54 ± 0.22), and this value was significantly different
(Tukey HSD-test. p < 0.05) from the lowest value in the SOP group (24.57 ± 0.26) but
not different from the UX group; 2) The SOP femaJe was significantly different (Tukey
HSD-test, p < 0.05) from both the UX and UOX females in luteal nuclear diameter, but
was only significantly different from the UOX female in luteal cell diameter. No
differences between the UX and VOX females were detected (Figure 4.5(C)); 3) The
N/C ratio of the VOX group was Significantly different (Tukey HSD-test, p < 0.001)
from those of both the UX and SOP females (Figure 4.5(D)).
Statistical analysis on parameters from the 0+ and 0- ovaries of the UX groups
indicated that luteal cell size and luteal nuclear diameters of the 0- ovaries were
significantly (paired samples t-test, p < 0.001) lower than those of the 0+ ovaries
(Figure 4.6(A) and (E)). The N/C diameter ratio of the 0- ovary obtained from females
operated on, on day 2 of pregnancy was significantly (p < 0.001) lower than that of the
0+ ovary, but significantly higher than that of the 0+ ovary if operations were
performed on days 6 and 10 (Figure 4.6(C» . These parameters were not different in the
animals operated on, on day 14 of pregnancy.
4.4.2.2 Ulerine histology
The only quantitative data obtained from the uterine tissue was the length of the
endometrial epithelial cells measured on day 18 of pregnancy (Figure 4.7). The lenllth of
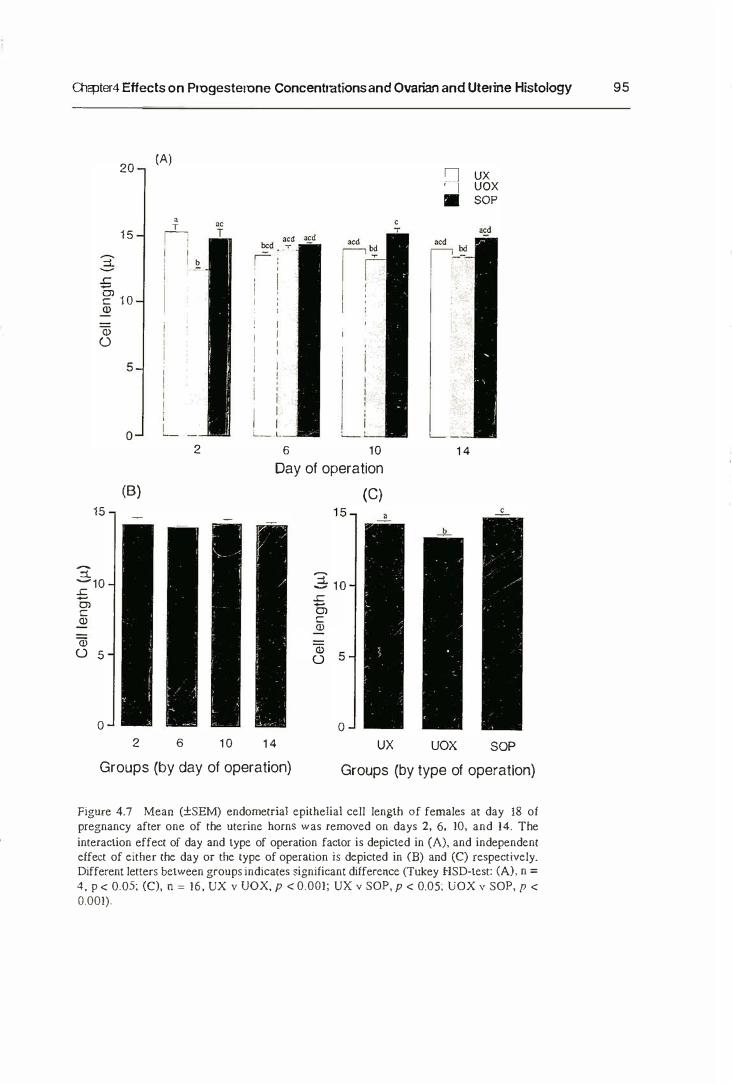
---.-------------------------------------------------------- --
O1cpter4 Effects on Progesterone Concentrations and Ovarian and Uterine Histo)ogy 95
20
15
.c 0, c 1 0
-:;:
'" '" o
15
-10 £: '"
c '" '" 0 5
o
5
o
(8)
2
IA)
• , 1-. -.
. L
6
2
10
6 10 Day of operation
(e)
� 10 .c 0, c '" Q; 0 5
o 1 4 ux
:] •
,
1 4
UOX
ux uox sOP
SOP
Groups (by day of operation) Groups (by type of operation)
Figure 4.7 Mean (±SEM) endometrial epithelial cell length of females at day 18 of pregnancy after one of the uterine horns was removed on days 2, 6, 10, and 14. The
interaction effect of day and type of operation factor is depicted in (A). and independent effect of either the day or the type of operation is depicted in (B) and (C) respectively. Different letters between groups indicates significant difference (Tukey HSD-test: CAl, n =
4. P < 0.05; (C), n = 16, UX v UOX, p < 0.001; UX y SOP, P < 0.05; VOX v SOP, P < 0.001).
Ii'
..n
- , -------------------------------��
OlqJter4 Effects on Progesterone Concentrations and Ovarian and Uterine Histology 96
epithelial cells (mean ± SEM. J.l.m) ranged between 12.39 ± 0.16 (the lowest value, in the 2UOX group) and 15.29 ± DAD (the highest value, in the 2UX group) (Figure
4.7(A» . Between the UX groups, the lowest value for the length of epithelial cells was
found in females operated on, on day 6 of pregnancy (13.58 ± 0.21) which is
significantly (Tukey HSD-test, p < 0.05) lower than that of females operated on, on day
2 but was not different from females operated on, on days 10 and 14. In contrast (Q this,
the highest value for epithelial cell length of the UOX groups was found in the females
operated on, on day 6 of pregnancy (19.93 ± 0.25) which is significantly lower than
that of females operated on, on day 2 (Tukey HSD·test, p < 0.05). There were no
significant differences found between the SOP groups in their epithelial ceU length.
According to the statistical analysis, it was found that, the day factor had no significant
independent effect on the length of epithelial cell (Figure 4.7(8)), while the Operation
factor worked in either an independent way from (Figure 4.7(C)) or interaction with the
day factor (Figure 4.7(A)). As can be seen in Figure 4.7(C), overall, the SOP group had
the highest value for epithelial cell length while the VOX group had the lowest value,
and values for the UX group were placed between the two values. These values were -
significantly different from one another (p values are depicted in Figure 4.7).
4.5 Discussions
4.5.1 Progesterone Concentrations
It has been well documented that the principal effect of total uterine removal is a
persistence of the CL in a functional condition resulting in the prolongation of
pseudopregnancy, the prolongation of high levels of progesterone secretion, the
inhibition of ovulation. the cessation of the dioestrous cycle and the retention of the
vaginal epithelium in a secretory state for periods equivalent to or longer than that of
pregnancy (Rowlands and Short, 1959; Rowlands, 1961, 1962; Perry and Rowlands,
1961; Anderson e1 af., 1962; Heap e1 af., 1967; Macdonald er af., 1970; Hausler and
Malven, 1971; Kelley and Brinkley, 197 1 ; Rothchild er al., 1973; Currie and Thorburn,
1974; Critser et at., 1982; Southee et aI., 1988). For extensive review, see Bland and
Donovan (1966) and Anderson (1973; 1977). The focus of this study is to examine the
effect on the progesterone concentration after the removal of one uterine horn. either
with or without its ipsilateral ovary. at varying days of pregnancy.
---.----------------------------------------------------------�
Olcpter4 Effects on Progesterone Concentrations and Ovarian and Uterine Histology 97
The pattern of progesterone concentration in the sham-operated control (the SOP) group
during the observation period is remarkably similar to that of normal pregnant female
mice reported by McCormack and Greenwald ( 1974a). MUIT et aI., ( 1 974), and Virgo
and Bellward ( 1974). However, there are minor differences between the results reported
here and their results. The progesterone concentrations reported here are, in average,
higher than those of McCormack and Greenwald ( 1974a) and Virgo and Bellward
( 1974). but similar to those of MUIT et aI., ( 1974). These differences may be due to the
strains of mice used.
Plasma progesterone concentration slightly increased between day 3 to day 7 of
pregnancy in the UX and SOP, but not in the UOX groups operated on, on day 2 of
pregnancy (Figure 4. 1A). During this period several critical events for uterine
preparation of pregnancy, i.e. implantation or induction and maintenance of nidation,
and placentation, occur in the uterus. All these events require the presence of
progesterone. Day 3 of pregnancy in the mouse is a starting point for luteal secretion of
progesterone (Finn and Martin, 1971). Virgo and Bellward ( 1974) postulated that
plasma progesterone changes during the period from day 2 to day 9 of pregnancy are
related to the role of progesterone in inducing and maintaining decidualisation. In the rat,
Wiest (1970) reponed a high intra uterine concentration of progesterone, higher than that
of peripheral blood concentrations, throughout early and mid pregnancy.
In the sham-operated control (SOP) group operated on, on day 2, but not in the SOP
group operated on, on day 6, progesterone levels slightly decreased between day 7 and
day I I of pregnancy. This finding is consisten[ with the data reponed by Murr et al.,
(1974) and Virgo and Bellward ( 1974). This mid-pregnancy decrease in progesterone
concentration correlates with the rapid phase in the growth of the CL. The CL of
pregnancy increased sharply in size on day 8 of pregnancy, and this maximum growth
persists until day 1 3 (see Hilliard, 1973). This period is also indicated by the transition
period of pregnancy maintenance
hypophysectomy after day to can
(Choudary and Greenwald, 1969).
from the pituitary to the placenta, since
be conducted withoUl tenninating pregnancy
The increase in plasma progesterone concentration on day 1 1 to day 15 in all groups
operated at day 2 might be caused by the additive effect of placental and pituitary sources
of luteotrophin. It is well known that, in the mouse, the ovaries are the main sources of
progesterone required for maintenance of pregnancy since ovariectomy or destruction of
the CL results in termination of pregnancy (Hall, 1957). Hypophysectomy after day 10
;-O' .. --------------------------------------------------------------------�--��------
O1q:lter4Effects on Progesterone Concentratk>ns and Ovarian and Uterine Histok>gy 98
of pregnancy is compatible with the maintenance of pregnancy (Choudary and
Greenwald, 1969). During the second half of pregnancy the mouse placenta synthesises
progesterone, although this placental contribution to the maternal progesterone is very
low compared with that of the ovary and is not sufficient to maintain pregnancy (Deane
et aI., 1962; Pointis el al.. 1981). In the rat, this placental progesterone production
occurs throughout pregnancy and it may be independent of pituitary influences
(Macdonald and Matt. 1984; Matt and Macdonald. 1984).
The trophic support of the corpus luteum during the second half of pregnancy in mice
depends on the capability of the mouse placenta to produce a gonadmrophin, i.e.
placental chorionic gonadotrophin (mouse chorionic gonadotrophin, mCG), which is
similar to hCG (Rao ef al., 1982). This mCG reached peak levels on day I I and day 1 6
post coitum (Wide and Wide, 1979). Another gonadotrophin secreted b y the placenta
that maintains progesterone production during the gestation period is mouse placental
lactogen (mPL) which is positively correlated with liner size (Markoff and Talamantes,
1981). These two placental honnones, mCG and rnPL, are believed to be involved in
maintaining steroid production in the ovaries during the second half of pregnancy
(Humpreys et al., 1985). Recently, two mPL molecules have been characterised in mice
as mPL-J and mPL-II (Soares ef al.. 1 982; Ogren and Talamantes. 1988). The mPL-J
and mPL-ll concentration peaks on day 10 and day 14 respectively (Soares et aI., 1982;
Ogren et al., 1989) and secretion of the mPL-ll is modulated by both activin and inhibin
proteins produced by both the decidual and placental tissues (Yamaguchi et al., 1995).
Recent work clearly indicates that the two rnPL are produced by the trophoblast giant
cells (Yamaguchi et al., 1994), and that both are luteotropic and support progesterone
production at mid pregnancy in the mouse (Galosy and Talamantes, 1995).
The finding that there is a sharp decline in plasma progesterone concentration between
days 15 and 18 of pregnancy (Figure 4. 1 and Figure 4.2) is consistent with the data
previously reported by several researchers in mice (McConnack and Greenwald, 1974a;
Murr eI al., 1974; Virgo and Bellward, 1974), in the rat (Morishige et al. , 1973; Grota
and Eik-Nes, 1967), or in the golden hamster (Leavitt and Blaha, 1970). These data are
consistent with the hypothesis that a high concentration of progesterone may prevent the
onset of parturition and that progesterone withdrawal is required to permit parturition. In
many animals, the decrease in progesterone concentration one day before parturition is
caused by the regression of corpus luteum function. The decrease in progesterone
concenrration coincides with the increase in LH during the second half of gestation in the
rat (Morishige et al . . 1973), and one of the major factors causing decreasing plasma
,
,
,.,------------------------------------------------------------
Olcpter4 Effects on Progesterone Concentrations and Ovarian and Uterine Histology 99
progesterone is fetal and placental capabilities to metabolise progesterone into 3« and 313
hydroxy derivatives which have no progestational properties (Sanyal and Villee, 1973).
The relationship between progesterone decrease and the initiation of parturition during
the last period of gestation has clearly been described by Thorburn (1991). Progesterone
decrease in the last period of gestation is largely caused by the increase in placental 1 7a
hydroxylase activity due to the increase in the cortisol release by the fetus. The decrease
in the progesterone concentration in turn causes an increase in the maternal estrogen to
progesterone concentration ratio. The latter will induce an increase in PGFza. synthesis
in and release from the maternal placenta, which directly causes an increase in the uterine
activity and allows parturition to occur. The presence of a local signal sent by the gravid
horn to the ovary for the onset of parturition in rats is reported by Cavaille and Maltier
( 1978).
An increase in progesterone concentration found in all groups (except in the SOP group
operated on, on day 2 and day 14) at parrurition day is in agreement with the data of
Grota and Eik-Nes ( 1967) assaying progesterone in the peripheral blood of the pregnant
rat. Grota and Eik-Nes (1967) reported an increase in progesterone levels within 6 hours
after delivery: from 10 nglm1 plasma at day 22 to 43 nglm1 plasma. Due to difficulties in
coUecting the blood samples exactly at the time of parturition. the samples from the
delivered mothers were collected around 3 to 4 hours after parturition. Pregnant females
were checked for parturition in a 3 to 4 hour period.
Removal of one uterine hom on day 2 of pregnancy (either followed by the removal of
its ipSilateral ovary or not) did not alter the pattern of maternal progesterone secretion
except a slight difference (but highly significant) between operated females (the UX and
VOX groups) and the control (SOP) group at day 18 (Figure 4.1A). However, while
the UX and SOP groups are approximately the same in their progesterone concentration
during !.he period from day 3 to day 15, the UOX group shows a moderate reduction
compared with those of both the UX and UOX groups. This suggests a compensatory
effect of the surviving ovary or extra-ovarian origin in progesterone secretion might
occur after the operation. It has been well documented that during the gestation period,
progesterone synthesis occurs in [he ovary (McCormack and Greenwald, 1974a; Murr et
at., 1974: Virgo and Bellward. 1974), adrenal cortex (Butterstein and Hirst. 1977;
Pointis et al.. 198 1 : Macdonald and Matt, 1984), and in the placenta (Pointis el ai.,
198 1 ; Macdonald and Matt, 1984; Matt and Macdonald, 1984). In an earlier stUdy on the
rat. Wiest (1970) reported the capability of the uterine tissue to concentrate progesterone
during early and mid pregnancy periods. More recently it was found that the high
--------------------�-------.. -.-
Olcpter4 Effects on Progesterone Concentrations and Ovarian and Uterine Histology 100
concentration of progesterone in the uterus is not only caused by the capability of the
uterus to concentrate progesterone but also by its capability to produce the progesterone
itself (Bonnarny el al., 1992). It is likely that the ovaries are the main source of
progesterone during pregnancy since bilateral ovariectomy results in the tennination of
pregnancy (Hall, 1957; Bronson et al., 1966).
Removal of one uterine horn or removal of one ovary automatically reduces the number
of conceptuses or CL of intact animals by up to one half. Unilateral ovariectomy after
implantation (at days 8.5, 1 1 .5, and 14.5 of pregnancy) results in compensatory
changes in the remaining ovary with respect to the number of Graafian follicles, with no
changes in follicular size, in mice (Ross and Beaumont, 1974). In unmated mice or rats,
there was also a compensatory growth of the surviving ovary after unilateral
ovariectomy (McLaren, 1963; Peppler and Greenwald, 1970; Gibson et at., 1979;
Gosden et af., 1989) although the weight of the ovary which remained intact was not
equal to the total weight of the two ovaries in the control group (McLaren, 1963). This
compensatory growth was greater if the unilaterally ovariectomised females were
allowed to mate and became pregnant because the remaining ovary sheds nearly twice as
many eggs as the notmal number per ovary (McLaren, 1963). Rahima and Bruce ( 1987)
also reported that unilateral ovariectomy before and after mating in rats caused an
increase in the rate of progesterone and 20a-dihydroprogesterone secretion in the
surviving ovary. In contrast to this, there was no extra ovulation in guinea pigs after
unilateral ovariectomy at day 4 or day 5 post coilllm unless all of the CL in the
remaining ovary were also removed at the time of operation (Oeanesly, 1971). After
ovariectomy at day 28 post coilum in guinea pigs, the concentration of progesterone in
the systemic blood was reduced up to half the values of intact animals which are
characterised by a high concentration in uterine veins but low in placental tissue (Heap
and Deanesly, 1966).
In the UOX's females operated on in the later days of pregnancy, I.e. day 6 (Figure
4.1B), day 10 (Figure 4. 1C), and day 14 (Figure 4.10) the differences were significant
at day 15 of pregnancy. In fact, progesterone concentration of the UX group was also
significantly lower than the SOP group when the operation was perfonned on day 14 of
pregnancy (Figure 4.1D). As a consequence of this reduction in progesterone
concentration, both the UX and UOX groups which were operated after day 2 of
pregnancy never reached a peak. level on day 15 of pregnancy as in the SOP group.
Thus. it is likely that the later the operation is perfonned the greater the effect of the
uterine removal on the progesterone concentration of both the UX and VOX groups.
01q;ler4Effects on Progesterone Concentrations and Ovarian and Uterine Histology 1 0 1
4.5.2 Ovarian and Uterine Histology
In mice, the ovary is necessary until the last 2 days of pregnancy (Hillard, 1973). The
CL of pregnancy continue to grow until it reaches a maximum size on day 13 and there
are no significant changes that take place until day 18 when the CL form fibrous masses
and accumulate large fat globules and gradual shrinking begins (Fekete, 1941; Rugh,
1967; Hillard. 1973). In the cyclic animal the effect of uterine removal on the CL
function is both species- and time-dependent. The effect is species dependent since in species with a long metestrus phase, uterine removal can prolong the CL function but
not in species with a short estrous cycle; or time dependent since whether the CL will
regress normally or not depends on the stage of cycle at which the operation is
performed (Moor et al., 1970; Finn and Porter, 1 975).
Measurements on the ovarian weight on day 1 8 of pregnancy indicate that removal of
one uterine horn in mice as early as day 10 of pregnancy results in a decrease in weight
of the ovary ipsilateral to the operated horn faster than that of the contralateral side
though both the CL and Graafian follicle contents of the two ovaries are not different.
Histological evidence revealed that this regression in the ipsilateral ovary of the UX
group might be due to the regression in the luteal cells. Unilateral utero-ovariectomy in pregnant females (in the UOX group) significantly induces a rapid growth of young
follicles into Graafian follicles which, in tum, apparently affect the weight of the
remaining ovary.
The non pregnant uterine horn is luteolytic; removal of uterine horn prolongs lmeal
function in the mouse (Hillard, 1973). During the course of pregnancy the life span of
the CL of pregnancy is maintained by the conceptuses in addition to the trophic support
of the uterus and pituitary. However, the trophic action of the pituitary is only dominant
during the first half of the gestation period and then ceases after day 10 of pregnancy
(Choudary and Greenwald, 1969; Gibori, 1993). The trophic support of the pituitary is
then taken over by the placenta (Choudary and Greenwald, 1969; Kohmoto and Bern.
1970; Kato er ai., 1979; Gibori. 1993; Galosy. 1995). while by day 8 the conceptuses
enhances the trophic action by inhibiting the uterine luteolytic mechanism and by actively
producing luteotrophic substances (Critser et ai., 1980). Recently, in vivo and in vitro
study revealed that mouse placental lactogen I (mPL-I) and mPL-IJ which are actively
secreted by the placenta at midpregnancy are luteotrophic (Yamaguchi et ai., 1994;
,<
Otcpter4 Effects on Progesterone Concentrations and Ovarian and Uterine Histology 1 02
Galosy and Talamantes, 1995). The secretion of mPL-ii is regulated by lhe activin and
inhibin secreted by both the uterine dicidua and placenta during pregnancy (Yamaguchi
el aI., 1995).
The finding (hal the 0+ ovary is heavier than the 0- ovary in the UX group is apparently
consistent with the theory that the uterus and conceptuses play an important role in
maintaining CL function during the course of pregnancy, and that the trophic action of
the uterus and conceptuses is exerted locally rather than systemically. Thus the size and
endocrinological activity of the CL is dependent on the presence or absence of the gravid
uterine hom. Implantation is initiated on day 5 and completed by day 6 of pregnancy in
the mouse (Rugh, 1967; Abrahamsohn and Zorn, 1993), two days before the CL of
pregnancy sharply increase in size (Hillard, 1973). The role of the mouse conceptuses in
maintaining the CL function was also studied by Humphreys el aI., (1985) who reported
that the number of CL is negatively related to mean CL volume and the number of
conceptuses is positively related to mean CL volume per female. The same resull was
also reported by Kato er aI., (1979) in the rat.
The local effect of the uterus on the CL function has been reported by several authors in
the hamster, guinea pig. sheep, pig and cow (bur not in the rat or rabbit). When one
urerine horn is removed the corpora lutea ipsilateral to the removed horn regresses,
whereas those in the oppOsite ovary are maintained (for review, see Anderson, 1973).
In addition, unilateral ovariectomy alone (the ipsilateral uterine hom remains intact)
before mating results in CL hypertrophy and increases the rate of progesterone secretion
in the remaining ovary; however, unilateral ovariectomy after mating decreases the rate
of progesterone secretion though CL hypertrophy occurs in the remaining ovary
(Rahim. and Bruce, 1987).
Histological evidence also indicates that (he removal of one uterine horn, whether this
surgical procedure is foHowed by the removal of ipsilateral ovary or not, results in luteal
cell enlargement although the only significam effect is detected in the unilaterally utero
ovariectomized females (the VOX group) (Figure 4.5(C)). Overall means (±SEM) of
large luteal cell diameters were 24.74 ± 0.43, 25.54 ± 0.22. and 24.57 ± 0.26 )..lm, with
[he mean (±SEM) nuclear luteal cell being 1 1 .68 ± 0.16, 1 1 .33 ± 0.16 and 1 1 .29 ± 0. 1 0 )..lm for the UX, VOX and SOP groups respectively. This suggests that
enlargement of luteal cells in the VOX group is solely caused by the abundant increase
in the cytoplasm. Consequently. the N/C diameter ratio value for the VOX group is
significantly lower than both the UX and SOP groups (Figure 4.5(D)). The nonnal size
.. .. --------------------------
Olcpter4 Effects on Progesterone Concentrations and Ovarian and Uterine Histology 103
of large imeal cells is 26 - 45 ).lm in the mouse (Galosy and Talamantes, 1995), 30 Jlm in
the rat (Gibori. 1993) or 40-50 �m in the pig (Belt, 1970).
These findings are parallel with the finding that the UOX group had progesterone
concentrations lower than those of both the UX and SOP groups as previously
described (see Section 4.5.1). The enlargement of luteal cells in the UOX females might
be due [0 the compensatory effect of the remaining ovary to fulfil progesterone needs
during pregnancy. The rate of progesterone secretion by the ovary in rats is related to the
mass of luteal tissue available (Elbaum et aI., 1975) which in turn is a function of the
number and volume of the individual CL in the ovary. Because both the total number
and the total DNA content of large luteal cells in the CL is 1 .5 to 2-fold greater than the
small cells (Nelson et ai., 1992), thus total steroidogenic activity of the large luteal cells
is greater than the small cells (Nelson el ai., 1992; Gibori, 1993) and total steroid output
of the CL should be detennined by the large luteal cells rather than the small cells.
Ie was found thal endometrial epithelial cells of the UOX group were significantly lower
than those of both the TJX and SOP groups and the value for the UX was significantly
lower than that of the SOP group (Figure 4.7(C)). This finding indicates that the
presence of the two ovaries or the presence of the counterpart horn are required for the
growth and maintenance of the endometrial epithelial cells. However, whether the
decrease in the endomeoial epithelial cell size is caused by the surgical procedures or not
remains unclear. Bilateral ovariectomy in the mouse results in the reduction of both the
uterine weight and the size of the endomeoial cells, but the weight of the uterus and
morphological changes in the endometrium, which are comparable to those found in estrous or during the follicular stage of the menstrual cycle, will be observed soon if the
ovariectomised animals are injected with estrogen (Finn and Porter, 1975) .
.. .. ----------------------------------
Chapter 5 Effect on Postnatal Growth
5.1 Introduction
5.1 .1 Postnatal Growth Prenatal and preweaning periods are probably the most critical in determining adult
body weight and reproductive efficiency. According to Hafez (1963), preweaning
growth is detennined by both internal and external factors. Internal factors include birth
weight. genotype, and hormonal condition of the neonate. External factors include liner size, maternal environment (maternal milk production, behaviour, age, genotype,
nutrition status), and other factors such as environmental physical condition, including
temperarure, humidity, and light. The effect of prenatal and postnatal maternal
environments on body weight are varied with the age of pups (EI Oksh et al., 1967:
Moore er ai . . 1970).
Postnatal growth of individual mice generally follows a sigmoid curve, and the same
curve is shown by the body content of fat and water if ploued against age (Cheek and
Holt. 1963). In the rat postnatal growth occurs in two main stages, the first stage being
pre-maturity growth and the second postmaturity growth. (PahL 1969). Premarurit)
0l�ter5 Effect on Postnatal Growth 1 04
growth is marked by the growth of all parts of the animal and results in high relative
growth rate, while the postmaturity growth is marked by an increase in body weight but
is not accompanied by significant changes in any part of the animals.
Since the body content of fat and water shows a sigmoid curve, and since the fat free
dry solids (proteins and mineral ash) of the body show a linear relationship with time
(Cheek and Holt. 1963). it is likely that the growth of the neonate is primarily
detemtined by the fat and water content of the body, especially during the second stage
(post·rnaturicy) growth (Pabl, 1969). Maximal growth rate occurs at about 37 days of
age, the time when the fust oestrus can be observed in females. After the 5th day after
birth there is a progressive reduction in the rate of weight gain until the end of the
weaning period and after the weaning period there is a decrease in me concentration of
water and electrolyte per unit weight (Cheek and Holt, 1963).
The size of litter at birth has a strong negative and approximately linear effect on body
weight at 100 days after birth in mice (Wahlsten and Bulman-Felming, 1987), thus the
reduction of titter size at birth results in an increase in growth rate (Park and
Nowosielski-Slepowron. 1971; Timson and Dudenhoeffer, 1985), After birth, the
young are entirely dependent upon maternal care at first and thereafter are largely
dependent for a considerable period. Some of the most important postnatal maternal care
includes the milk supply available and maternal responses towards the young. Growth
rate increases after the reduction of liuer size during the suckling period, presumably as
a result of the decreased competition between young for the limited amount of milk available.
5.1 .2 The Growth of Mammary Glands During Pregnancy
In the mouse, the lobulo-alveolar system begins to grow and differentiate at day 5 of
pregnancy, although the secretion of milk will not be initiated before parturition occurs
(Sinha et al.. 1974). The alveolar system is well established at day 14 of pregnancy,
wtUle the secretory activity begins in alveoli near the nipple and progresses until day 17
when the whole alveoli are involved in anticipation of lactation (Rugh, 1964). The
growth of the lobulo-alveolar sysrem is stimulated by a complex of hormones which
includes the lactogenic hormones (prolactin, growth hormones, and placental lactogen),
steroid hormones (progesterone and oestrogen), adrenal corticoids and insulin. These
hormones originate from the ovaries. adrenal cortex, or placenta (Cowie and Tindal.
197 1 ; Cowie. 1984; Buttle, 1988; Wang et aI., 1990; Johnson and Everitt, 1995),
'.
Olq:lter5 Effect on Postnatal Growth 1 05
The action of the steroid hormones and adrenal corticoids and insulin occurs in a
syneroistic marmer with the iactooenic hormones. The effect of steroid hormones, for o 0
example. is felt in two ways, either directly by affecting the growth of mammary
parenchyma or indirectly by stimulating the pituitary gland to release prolactin (Cowie,
1984) ego steroid hormones do not work effectively in the absence of the pituitary.
The important role of progesterone, and oestrogen as well, on the growth of mammary
glands is well known. The effect of the steroid honnones on the growth and
differentiation of the lobulo-alveolar system occurs in both synergistic and separate
ways. Oestrogen induces the mammary epithelium to proliferate and causes little
alveolar differentiation, while progesterone induces both epithelial proliferation and
alveolar differentiation. The combination of the two hormones results in an additive
action on both epithelial piOliferation and alveolar differentiation (Rugh. 1964). Most
recently. Wang et al. ( 1990) presumed that progesterone action on the epithelial
proliferation is mediated by the oestrogen-dependent progesterone receptors.
5.1 .3 Milk Production
Lactogenesis in the alveolar epithelium is blocked by circulating progesterone during
pregnancy (Gandelman and Svare, 1975). This interpretation is supported by the fact
that parturition is preceded by a decrease in plasma progesterone concentrations (MulT et
al., 1974), and that prolactin and placental lactogen increase in plasma throughout
pregnancy, reaching their maximum level at parturition, although the mammary glands
remain unresponsive to these hormones until progesterone levels drop after parturition
(Johnson and Everitt, 1995) . The inhibitory effect of progesterone on lactose synthesis
in the mouse and rat has also been documented (Cowie, 1984). Since lactation will
occur following hysterectomy as early as day 12 of pregnancy in mice (Gandelman and
Svare, 1975), thus luteotrophic factors originating from the placenta, which is important
in inducing ovarian progesterone secretion, also play an important role in inhibiting
lactation during the course of pregnancy in the animals.
In mice, lactation usually proceeds for a period of 3 weeks and reaches its peak at 14
days after parturition (Rugh, 1967). During this period the ducts and alveoli are dilated
with milk. but any unused glands or all the glands at the end of the lactation period will
regress.
O1cpter5 Effect on Postnatal Growth 1 06
5.1 .4 Maternal Behaviour
How lhe mother behaves towards the neonate after a normal gestation is an important
factor in detennining the growth of the neonate. Maternal behaviour to the pups soon
after parrurition includes cleaning (licking), warming (nest building), feeding (nursing)
and protection (pup-retrieval) (GandeJman et al.. 1970; Sayler and Salmon, 1971;
Pedersen, 1987). Hormonal mechanisms modulating maternal behaviour have been
studied extensively in mice (Lisk et al., 1969; Gandelman, 1973; Hauser and
Gandeiman. 1985) and show that hOITIlonal events during pregnancy are responsible for
the stimulation of maternal behaviour at parturition (Lisk et al., 1969; Hauser and
Gandeiman, 1985). Virgin mice implanted with prolactin in the hypothalamus, for
example, exhibit a full set of maternal behaviours (Lisk et at., 1969). Studies on rats
also show that the latency of the ovariectomised or ovariectomised-hysterectomised
virgin females to behave maternally can be reduced by administration of a combination
of progesterone, oestrogen, androgen, and prolactin (Zarrow et al., 197 1 ; Bridges el
aI., 1978; Bridges and Russel, 1981).
Recently. the most intensive research on the role of hormones in the stimulation of
maternal responsiveness has been focussed upon the involvement of steroids. primarily
progesterone (Bridges, 1984; Crombie et ai., 1995; Wang el al., 1992; Wang et al..
1995). In the rat, the responsiveness of the mother to her young at birth is primed by
progesterone and oestrogen during pregnancy (Bridges. 1984). Immunisation of mice
against progesterone results in the aberrant or negative behaviour of the mother during
the first 5 days of lactation (i.e. cannibalism, pup-retrieval and feeding failures, and pup
rejection) towards her young after the first successful pregnancy following recovery of
fertility (Wang et aI., 1992). Furthermore, Wang et al. (1995) revealed that the aberrant
behaviour of the antibody-treated mother is not due to the lack of milk secretion nor to
pup abnormality. More recently, it has been found lhat the occurrence of negative
behaviour in the mother treated with anti-progesterone antibody or progesterone
antagonist is due to the impainnent of the imprinting mechanism associated with the
establishment of normal maternal behaviour (Crombie et ai., 1995).
In Chapter 4, it was revealed that in mice operated on. on day 2 of pregnancy, the mean
progesterone concentration of both the SOP and UX groups is higher than that of the
UOX group. In mice operated after day 2 of pregnancy, progesterone concentration of
the UX group is higher than that of the UOX but lower than that of the SOP groups.
Although these differences are not significant in all days examined. this tendency
O1cpterSEffect on Postnatal Growth 1 07
in forms us that the reduction of corpora lutea and conceptuses or the reduction of
concepruses only up to a balf of the normal numbers results in a reduction in the
maternal concentration of progesterone.
As noted previously (Section 5 . 1 .2.2), either the normal growth and differentiation of
the mammary gland or the initiation of the milk secretion during gestation period is
regulated hormonally where the role of progesterone is important. One study on mice
showed that placental numbers and weight, but not fetal numbers or weight, are related
to the development of mammary glands (Barkley et aI. , 1979). Progesterone is also
involved in the initiation of maternal responsiveness towards the pups after parturition
(Bridges, 1984; Crombie ef ai., 1995; Wang et al., 1992; Wang ef ai., 1995).
5.1 .5 Objective
Since progesterone concentration of the SOP control group of mice was generally
higher than that of both the UX and UOX groups (with the exception of the UX
operated on, on day 2 of pregnancy) (Chapter 4) it was assumed that uterine removal
might result in one or all of the following conditions: 1) an abnormality in the growth
and differentiation of the manunary gland during gestation period which causes maternal
incapability to nourish pups, 2) an impairment of post partum maternal behaviour
towards the pups. However, since the gestation length of the SOP mice was
significantly shorter than both the UX and VOX groups (Chapter 3), it was assumed
that unilateral uterine transection would result in conditions which favoured the growth
of neonates in the UX and VOX group. This study aims to examine the possible effect
of unilateral uterine removal, with or without removal of its ipsilateral ovary, on the
growth of neonates delivered by the operated females.
5.2 Methods
Mature virgin mice were used for examination of postnatal growth. Handling, mating,
and surgery procedures and environmental conditions in the laboratory room are
described in Chapter 2. After surgery, females were caged in group of two or three.
Two or three days before the expected parturition day for the normal mice, pregnant
animals were caged individually in small opaque plastic cages of 30 x 12 x 12 em in size
with a 0.5 cm thick dry pellet paper bedding. The procedure for birth checking is
described in Chapter 3.
OlcpterS Effect on Postnatal Growth 108
5.2.1 Maternal Behaviour
With minor modifications, the methods of Bridges (1984), Wang et al. ( 1992),
Crombie et ai., (1995), and Wang et aI., ( 1995) were applied in the srudy of maternal
behaviour testing (described in Chapter 2). In addition to the pellet paper bedding, toilet
tissue paper strips were provided daily for a fresh nest after removing the old materials.
Testing was carried out on the day of delivery and repeated for five consecutive days.
Maternal response under testing was observed for ab<!ut 15 minutes at 10.00 after aU pups were moved out of the nest to the opposite side of the nesting cage. The following
criteria were used to detemrine maternal post parrum behaviour Bridges ( 1984), Wang
er al. (1992). Crombie et al .• (1995). and Wang er al.. (1995).
Nonna[ maternal behaviour:
Females which displayed the following response patterns were considered as behaving
normally; ( 1 ) retrieving: the mother was observed to pick up aU the pups and rerum
them to the nest; (2) nest-building: the mother was observed to display one or more of
the following behaviours - bringing material to the nest, nibbling materials, or
assembling the material; (3) lactation position: the mother covered at least two pups with
her body; and (4) licking: the mother was seen to lick pups.
Abnomzal maternal behaviour:
Females who display one of the following response patterns were considered as
behaving abnormally: (1) cannibalism: the mother attacked and killed one or more of her
pups during the observation period; (2) isolation: the mother failed to return one or more
pups to the nest site; (3) nursing failure: less than two pups were hovered over or
rucked under the dam.
Rejection:
As a result of abnonnal maternal behaviour, some pups were rejected, i.e. in the fonn
of cannibalism, isolation (the failure of mother to rerum back the pups to the nest site or
the transference of pups away from the nest site) or nursing failure.
5.2.2 The Growth of Neonates
At delivery. litter size was recorded. the pups were sexed, weighed individually and the mean weight of the whole litter was calculated. The number of stillborn and the

OlzpterS Effect on PoslnatalGrowth 109
possibility that the mother had eaten her own pups (cannibalism) at parturition day was
also recorded.
To reduce variation arising from the effects of litter size on postnatal growth, mothers
were allowed to nurse a maximum of four pups. Tbus, only a motber with four or more
live pups, which consisted of at least 2 males and 2 females, was used for the next
observation. In the case of the motber having more tban 4 pups, two males and two
females were selected from eacb litter after exclusion of obvious 'runts' , while the
mother having less than 4 pups was excluded. Only the mother with 4 pups remaining
at the end of observation was included in the analysis.
Young mice were weighed daily at about 10.00 b until they reached 21 days of age, the
first day when pups can be weaned without a detrimental effect on the pups CRugh,
1964). The body weight of individual pups was recorded to the nearest 0.01 g by
placing the mouse in a tared beaker glass on a Mettler direct reading balance.
5.2.3 The Mammary Gland Weight
To examine whether the removal of one uterine horn affects the growth of mammary
glands, data of mammary gland weight was obtained from another 60 females used in the previous experimentation for the length of gestation (Chapler 3). The five pairs of
manunary glands were carefully removed from the maternal skin at the day of
panurition. Mammary glands were dissected in order from the thoracic to the inguino
abdominal position. The mammary glands on the left side were removed and weighed
after those on the right position were finished. This procedure was important in order to
determine whether the weight of mammary glands from the operated side (the side
where the uterine born was removed) were different from the unoperated side or not.
The glands were weighed individually on a Mettler direct reading balance to the nearest
0.0001 g. This examination of the mammary gland was conducted in one to three hours
after delivery following bleeding for progesterone analysis purposes.
01�ter5 Effect on Postnatal Growth 1 1 0
5.3 Results
5.3.1 Maternal Behaviour
NOITI1al maternal behaviour was observed in 60-80% of the UX and 80-100% in the SOP females, much higber than in the UOX females (fable 5 .1) The mean percentages
of the pups rejected by the motber during observation period were higher (but
statistically not significant) in the UOX females compared to both the UX and SOP
females. Since maternal rejection usually ended in neonatal death, the number of young
at the end of observation (at day 5 post partum) was lower. Especially in the VOX
groups the difference between initial (at delivery) and final (at day 5 post pactum)
number of pups was significant (p < 0.05; paired t-test). The weight of pups delivered
either by the UX or UOX females was significantly higher than those delivered by the
SOP females (p < 0.05 to p < 0.001; Tukey HSD-Test). However, the weight
differences between groups became obscure as the lactation process proceeded to the
5th day.
If the data are grouped by Operation factor without considering the Day factor (fable
5.1, at the bottom rows) it can be seen that the overall mean of females maternally
normal was 75% and 85% respectively for the UX and SOP females compared to only
35% for the VOX females. The mean percentages of pups rejected by the UOX mother
(33.68 ± 6.97) was significantly higher than those of both the UX ( 1 l .0 1 ± 5.44) (p < 0.05) and the SOP (3.85 ± 2.26%) (p < 0.01) groups. There was no difference
between the UX and SOP groups in their rejection of the pups although their litter size
was significantly different at delivery (p < 0.001).
Although the overall incidence was small, pup rejections occurred as early as day 1 of
the lactation period {Table 5.2). Rejection then increased drastically at day 2 and
continued with a slight decrease at day 3 and became constant at day 4 and day 5 of
lactation period. The UOX group showed a higher rejection rate than that of both the
UX or UOX groups. Interestingly, while pup isolation andlor nursing failure occurred
in both the UX and SOP groups, cannibalised rejection was a more common behaviour
in the UOX groups.
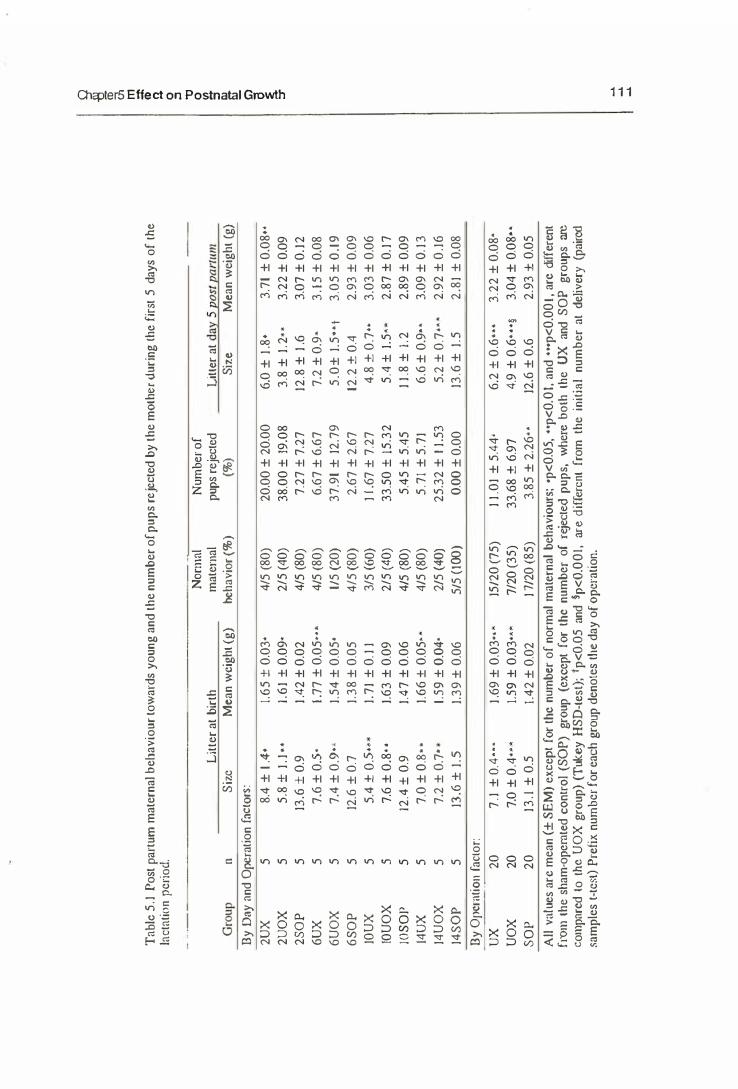
Tab
le 5
.1 P
ost p
artu
m m
ater
nal b
ehav
iour
tow
ards
you
ng a
nd th
e nu
mbe
r of
pup
s re
ject
ed b
y th
e m
othe
r d
urin
g th
e fi
rst
5 da
ys o
f th
e la
ctat
ion
pcr
iod
.
Nor
mal
N
umbe
r of
L
itte
r at
bir
th
mat
ernal
pu
ps r
ejec
ted
Litt
cr a
t da�
5e
ost e.
ortlf
m
!Jroup
"
S
izc M
ean
wci
ght (
g)
beha
vior
(%)
(%)
Si7
.e M
ean
wei
ght
(g)
By
Day
nnd
Ope
ration
fact
ors:
2UX
5
8.4
± 1.
4'
[.65
± 0
.03'
4/
5 (8
0)
20.0
0 ±
20
.00
6.
0±
1.8-
3.7
1 ±
0.0
8--
2UO
X
5 5
.8 ±
1.1
"
1.6
1 ±
0.0
9'
2/5
(40)
38
.00
± 1
9.0
8 3.
8 ±
1.2
..
3.2
2 ±
0.0
9 2S
0P
5
13.6
± 0.
9 1.
42 ±
0.0
2 4/
5 (8
0)
7.27
± 7
.27
12.8
± 1
.6
3.0
7±
0.1
2
6UX
5
7.6
± 0
.5'
1.77
± 0
.05·
"
415
(80
) 6.
67±
6.6
7 7.
2 ±
0.9
· 3
.15
±0
.08
6UO
X
5 7.
4 ±
0.9
··
1.54
± 0
.05'
11
5 (2
0)
37.9
1 ±
12
.79
5
.0±
1.5
"f
3.0
5 ±
0.19
6
S0
P
5 12
.6 ±
0.7
1.
38
± 0
.05
4/5
(80)
2.
67 ±
2.6
7 12
.2 ±
0.4
2.
93 ±
0.0
9 10
UX
5
5.4
± 0
.5'"
1.
71
± 0
.11
3/5
(60)
1 (.6
7 ±
7.27
4
.8 ±
0.7
'·
3.0
3 ±
0.0
6 10
UO
X
5 7.
6 ±
0.8
"
1.63
± 0
.09
2/5
(40)
33
.50
± 1
5.3
2
5.4
± 1
.5"
2.87
±0
.17
]O
SO
P
5 12
.4 ±
0.9
1.
47
± 0
.06
415
(80)
5.
45
± 5
.45
11.8
±1.
2
2.89
± 0
.09
[4U
X
5 7
.0 ±
O.S
.. 1.
66
± 0
.05"
41
5 (8
0)
5.7
1 ±
5.7
1 6
.6 ±
0.9
"
3.0
9±
D.1
3
14U
OX
5
7.2
± 0
.7"
1.59 ±
0.04
' 'lJ
5 (40
) 2
5.32
± 1
1.53
5.
2 ±
0.7
'"
2.92
± 0
.16
14
S0
P
5 13
.6 ±
1.5
1.
39
± 0
.06
515
(100)
0.00 ±
0.0
0 13
.6 ±
1.5
2
.81
± 0
.08
By
Opc
rnti ?1
l fac
lor:
UX
20
7
.1 ±
D.4
···
1.69
± 0
.03'
" 15
120
(75)
11
.01
± 5
.44'
6.
2 ±
0.6
···
3.2
2 ±
0.0
8'
UO
X
20
7.0
± 0
.4'"
1.5
9 ± 0
.03'
" 7/
20 (
35)
33.6
8 ±
6.9
7 4.
9 ±
0.6
"',
3.
04
± 0
.08"
S
OP
2
0
13.[
± 0
.5
1.4
2 ±
0.0
2 17
120
(85)
3.
85 ±
2.2
6"
12.6
± 0
.6
2.93
± 0
.05
All
vnlu
es a
rc m
ean
(± S
EM
) ex
cep
t fo
r th
c nu
mbe
r of
nor
mal
mat
erna
l be
havi
our
s; ·
p<O
.05,
"p<
O.O
I. a
nd "
·p<
O.O
OI,
arc
diff
eren
t fr
om
the
sha
m-o
pem
tcd
cont
rol
(SO
P)
grou
p (e
xcep
t fo
r th
e nu
mbe
r of
rej
ecte
d pu
ps,
whe
re bo
th t
he U
X
and
SO
P
grou
ps <re
co
mpn
red
to t
he U
OX
gro
up)
(Tuk
cy H
SD
-tes
t);
fp<
0.0
5 an
d ip
<D
.OO
I. ar
c d
ifferen
t fr
om t
he i
niti
al
num
ber
at
deliv
ery
(pai
red
sam
ples
t-t
cst)
Pre
fix
num
bcr
for
eac
h gr
oup
deno
tes
the
day
of o
pcra
tion.
i 0. m � II
o
,
'0
o g � Gl i �
�
�
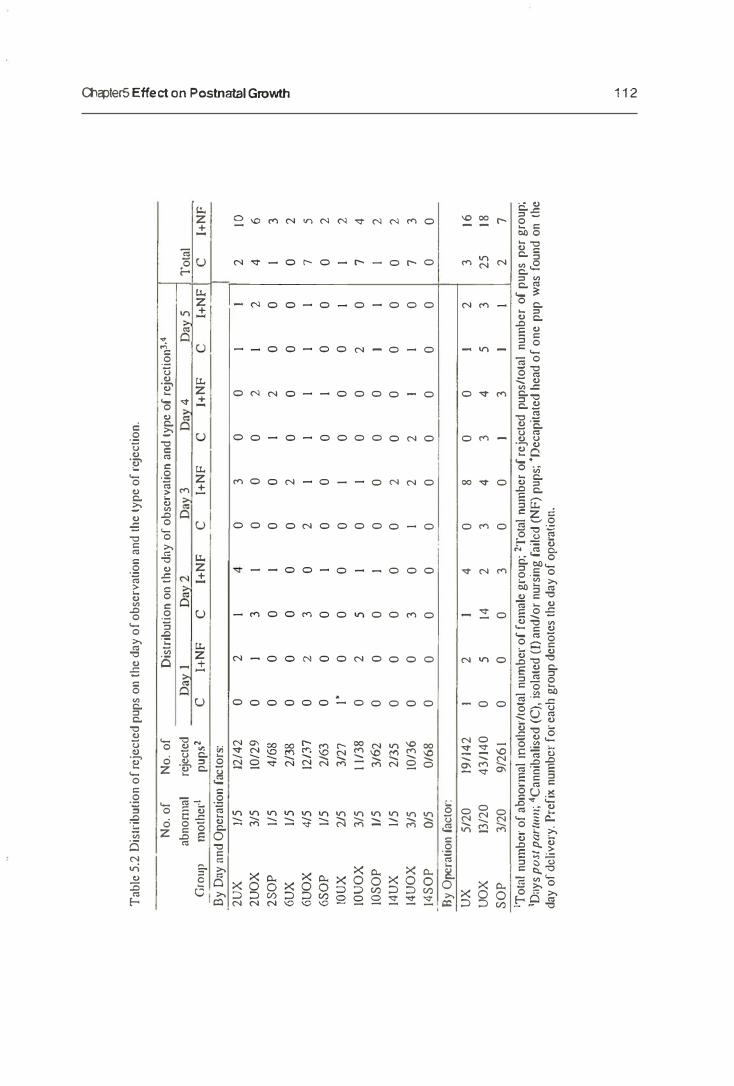
Tab
le 5
.2 D
istrib
utio
n of
reje
cted
pup
s on
[he d
ay o
f obs
erva
tion
and
the
type
of r
eject
ion.
No.
of
No.
of
Dist
ribut
ion
on th
e day
of o
bser
vatio
n an
d ty
pe o
f rej
ectio
n3,4
abno
nlla
l rej
ccted
D�
J D;W
2 Da
v 3
Dav
4 Da
v 5
Total
G
roup
m
othe
r' pu
pS2
C
T+N
F C
I+
NF
C
I+N
F C
l+
NF
C
I+N
F C
I+
NF
By D
ay a
nd O
pera
tion
fact
ors:
2UX
11
5 12
142
0 2
1 4
0 3
0 0
1 -,
2
10
2UO
X
315
1012
9 0
1 3
1 0
0 0
2 1
2 4
6 2S
0P
115
4168
0
0 0
1 0
0 1
2 0
0 1
3 6U
X
115
2138
0
0 0
0 0
2 0
0 0
0 0
2 6U
OX
41
5 12
/37
0 2
3 0
2 1
1 1
1 1
7 5
6S0
P 115
2/
63
0 0
0 1
0 0
0 1
0 0
0 2
IOUX
2/
5 3/
27
I'
0 0
0 0
1 0
0 0
1 1
2 10
UO
X
315
11/3
8 0
2 5
1 0
1 0
0 2
0 7
4 JO
SOP
1/5
3/62
0
0 0
1 0
0 0
0 1
1 1
2 14
UX
1/
5 2/
35
0 0
0 0
0 2
0 0
0 0
0 2
14U
OX
3/
5 10
/36
0 0
3 0
1 2
2 1
1 0
7 3
14S0
P 0/
5 0/
68
0 0
0 0
0 0
0 0
0 0
0 0
- By O
pera
tion
fact
or:
UX
5/
20
19/1
42
1 2
1 4
0 8
0 0
1 2
3 16
UO
X 13
120
43/1
40
0 5
14
2 3
4 3
4 5
3 25
18
SO
P 31
20
9126
1 0
0 0
3 0
0 1
3 1
1 2
7 --
_ .. _
--
!Tot
al nu
mbe
r of a
bnor
mal
mot
her/
tola
l num
ber o
f fem
ale g
roup
; 2To
tal n
umbe
r of r
ejec
ted
pups
/tota
l nu
mbe
r of
pup
s pe
r gro
up;
lD<lY
s po
Sl p
arlll
lll; 4
Can
niba
lised
(C),
isola
ted
(I) an
d/or
nur
sing
faile
d (N
F) p
ups;
'Dec
apita
ted
head
of o
ne p
up w
as fo
und
on t
he
day
of de
liver
y. Pr
efix
num
ber f
or ea
ch g
roup
den
otes
the d
ay o
f ope
ratio
n,
I � !l o
"
"
o � §: [ �
�
'"
O1cpter5 Effect on Postnatal Growth 1 1 3
5.3.2 The Growth of Neonates
Removal of one uterine hom in both the UX and UOX groups significantly reduced the
size of the litter (Table 5.3). As expected, total liuer weight at birth rose with liner size.
Consequently, total litter weight to maternal weight (TLW/MW) ratio at delivery was
also significantly reduced in both the UX and UOX groups. It was likely that the
reduction in liner size allowed the fetuses at the remaining uterine horn to grow at a
more rapid rate during the gestation period since mean birth weight of pups delivered by
both the UX and UOX groups was significantly (p < 0.01 to p < 0.001) higher than
that of the SOP groups. However, sex ratio of the pups surviving in the remaining
uterine hom was not altered by unilateral uterine transection. There was no difference
between the UX and UOX group in relation to either the size of liner, or both total and
mean weight of pups per liner or to the TLWIMW ratio at delivery. Two way analysis
of variance revealed that none of those parameters was affected by the day of operation
(the day factor). Table 5.3 also showed that maternal body weight at parturition or
weaning was significantly higher than that at mating (day 0 of pregnancy) in the UX or
VOX or SOP group.
Mean body weight at binh and at weaning and calculated growth rate for each group
after the reduction of litter size to four pups (2 males plus 2 females) per litter are
presented in Table 5.4 (for completed daily body weight records, see Appendix 5 . 1 ) .
After allocation of pups into groups of four per litter at birth, mean weight of the pups
from both the UX and UOX groups still remained higher than that of the SOP group as
observed before selection (see also Table 5.3 for comparison to the original mean body
weight of whole litter). At weaning (day 21 of lactation period), however, weight of
pups from the VOX group was generally lower than that of the UX and was similar to
the SOP group (with the exception of the animals operated on, on day 14 of
pregnancy). One way analysis of variance revealed that the growth rate of both the UX
and SOP groups was significantly lower than that of the UX group (p < 0.01; Tukey
HSD-test). However this difference was only significant in the animals operated on, on
day 2 and day lO af pregnancy. Table 5.4 also shows that although the weight of
selected pups at birth was not significantly different between males and females, the two
sexes were significantly different both in their growth rate and final body weight (at
weaning).
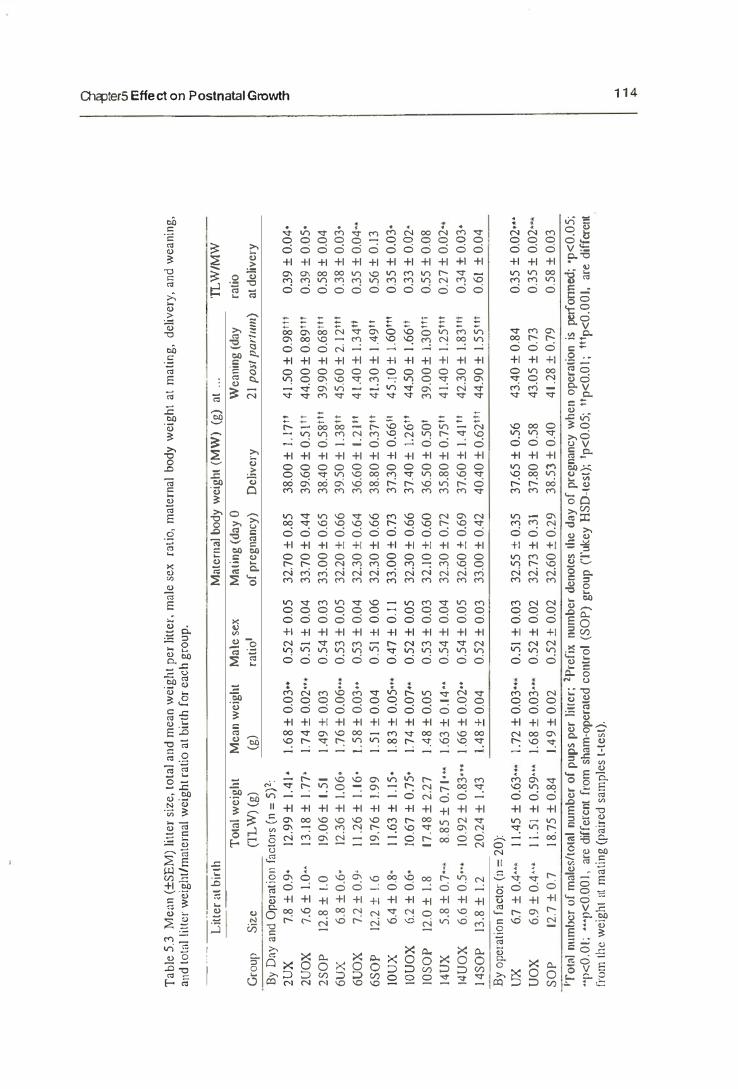
Tab
le 5
,3 M
ean
(±SE
M)
litt
er s
ize,
tot
al a
nd m
ean
wei
gh
t p
er li
ller
, mal
e se
x ra
tio,
mat
erna
l bo
dy w
eig
ht
at m
atin
g,
del
iver
y,
and
wea
ning
, an
d to
tal
liUer
wei
gh
t/m
atern
al w
eig
ht r
atio
at b
irth
for
each
grou
p.
_.-
. _
_ .-
Lill
er <I
t bir
th
Tot
al w
eigh
t M
ean
wei
ght
Gro
up
Size
(I
LW
) (g
) (g
)
l3y D
ay a
nd O
pera
tion
fac
tors
(n
= 5
)2:
2UX
7.
8 ±
0.9
' 12
.99
± 1
.41'
1.
68
± 0
.03"
2U
OX
7.
6 ±
1.0
..
13.1
8 ±
1.7
7·
1.7
4 ±
0.0
2'"
2$
OP
12
.8 ±
1.0
19
.06
± 1
.51
1.49
± 0
.03
6UX
6
.8 ±
0.6
-12
.36
± 1
.06
· 1.
76
± 0
.06'
" 6U
OX
7.
2 ±
0.9
' 11
.26
± 1
.16
' 1.
58
± 0
.03
..
6S0
P 12
.2 ±
1.6
19
.76
± 1
.99
1.
51
± 0
.04
10U
X
6.4
± 0
.8-
11.6
3 ±
1.1
5'
1.8
3 ±
0.0
5'"
IOU
OX
6.2
± 0
.6'
10.6
7 ±
0.7
5-1.
74
± 0
.07"
IO
SO
P
12.0
± 1
.8
17.4
8 ±
2.2
7 1.
48
± 0
.05
14UX
5
.8 ±
0.7
'"
8.85
± 0
.71'
" 1.
63 ±
0.1
4"
14
UO
X
6.6
± 0
.5'"
10
.92
± 0
.83,
"
1.66
± 0
.02"
14
S0P
13
.8±
1.2
20
.24
± 1
.43
1.4
8 +
0.0
4
By
oper
atio
n fa
ctor
(n
-20
): UX
6.
7 ±
0.4
'"
UO
X
6.9
± 0
.4 ..
' S
OP
12
.7 ±
0.7
11.4
5 ±
0.6
3'"
1.72
± 0
.03'
"
11.
51
± 0
.59'
" 1.
68
± 0
.03'
" 18
.75
± 0
.84
IA9
± 0
.02
Mal
e se
x
rati
o'
0.5
2 ±
0.0
5 0
.5!
± 0
.04
0.5
4 ±
0.0
3 0
.53
± 0
.05
0.5
3 ±
0.0
4 0
.51
± 0
.06
0.4
7 ±
0.1
1 0
.52
± 0
.05
0.5
3 ±
0.0
3 0
.54
± 0
.04
0.5
4 ±
0.0
5 0
.52
± 0
.03
0.5
1 ±
0.0
3 0
.52
± 0
.02
0.5
2 +
0.0
2
Mat
ernal
bod
y w
eigh
t (M
W)
(g)
at .
..
MAt
ing
(day
0
of p
regn
ancy
)
32.7
0 ±
0.8
5 33
.70
± 0
.44
33.0
0 ±
0.6
5 32
.20
± 0
.66
32.3
0 ±
0.6
4 32
.30
± 0
.66
33.0
0 ±
0.7
3 32
.30
± 0
.66
32
.10
± 0
.60
32
.30
± 0
.72
32.6
0 ±
0.69
33
.00
± 0
.42
32.5
5 ±
0.3
5 32
.73
± 0
.31
32.6
0 +
0.2
9
Del
iver
y
38.0
0 ±
1.1
7"
39
.60
± 0
.5 P'
38
.40
± 0
.58'
"
39.5
0 ±
1.3
8"
36.6
0 ±
1.2
1 f I
38.8
0 ±
0.3
7"
37.3
0 ±
0.6
611
37.4
0 ±
1.2
6"
36
.50
± 0
.50
' 35
.80
± 0
.75"
37
.60
± 1
.41"
40
.40
± 0
.621
ft
37.6
5 ±
0.5
6 37
.80
± 0
.58
38.5
3 ±
0.4
0
Wea
ning
(day
2
1 p
ost p
anllm
)
41.
50 ±
0.9
8ft!
44
.00
± 0
.89'
"
39.9
0 ±
0.6
8tt'
45
.60
± 2
.12"
' 4
1.40
± 1
.34
II
41.
30
± 1
.49"
4
5.1
0 ±
[,60
111
44.5
0 ±
1.6
6"
39.0
0 ±
1.3
0"
1 4
1.40
± 1
.25'
"
42.3
0 ±
1.8
3'"
44
.90
± 1
.55
'"
43.4
0 ±
0.8
4
43.0
5 ±
0.7
3 4
1.28
+ 0
.79
lLW
/MW
ratio
at
del
iver
y
0.3
9 ±
0.0
4'
0.3
9 ±
0.0
5'
0.5
8 ±
0.0
4 0
.38
± 0
.03'
0
.35
± 0
.04"
0
.56
± 0
.13
0
.35
± 0
.03'
0
.33
± 0
.D2
· 0
.55
± 0
.08
0.2
7 ±
0.0
2"
0.3
4 ±
0.D
3·
0.6
1 ±
0.0
4
0.3
5 ±
0.0
2-"
0
.35
± 0
.02'
" 0
.58
± 0
.03
'Tol
al n
umbe
r of
mal
es/t
otAl
num
ber
of p
ups
per
liuer
; 2P
refi
x nu
mbe
r de
note
s th
e da
y of
pre
gnan
cy w
hen
oper
atio
n is
perf
onn
ed;
·p<
0.0
5;
··p<
O,O
I; "
·p<
O.OO
I, a
re d
iffe
rent
fro
m s
ham
-ope
rate
d co
ntro
l (S
OP
) gr
oup
(Tuk
ey H
SD
-tes
t);
'p<
0.0
5; "
p<O.
OI;
tll
p<O
.OO
I, a
re d
iffe
rent
fr
om t
he
wei
gh
t Ht
mat
ing
(p
aire
d s
amp
les
t-te
st).
! m il' !l o
, ." � , � '" a � - - ..
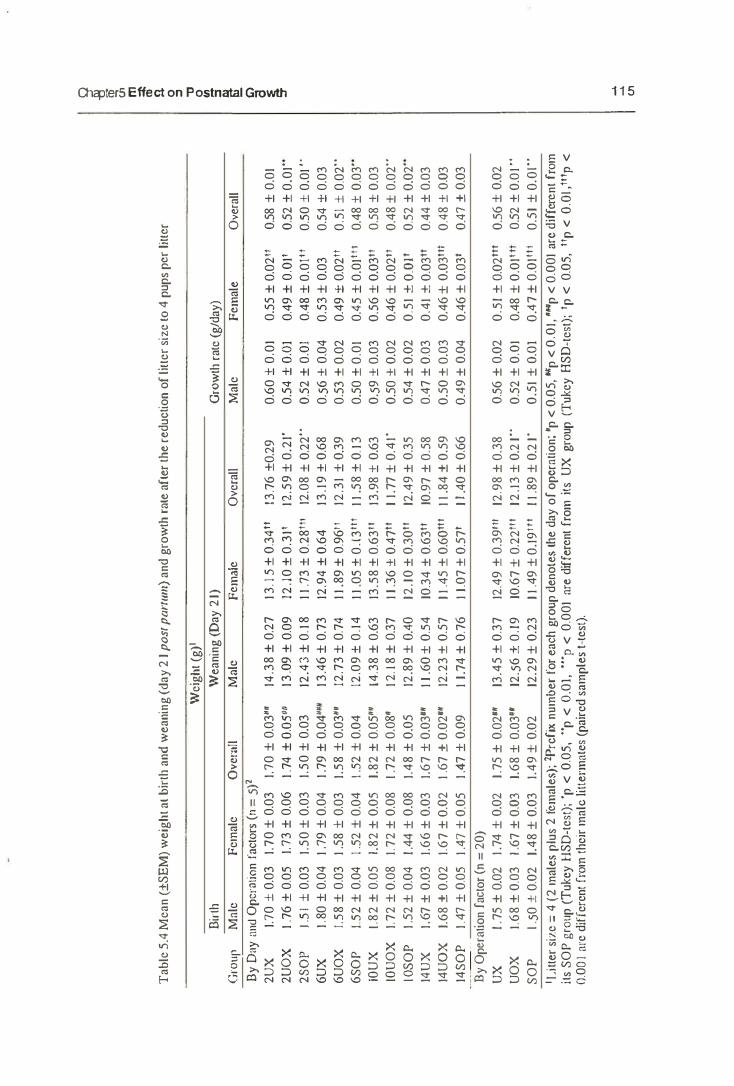
Tab
le 5,
4 M
ean
(±SE
M) w
eigh
t at b
irth
and
wea
ning
(day
21 p
os/ p
arll
lm)
and
grow
th ra
te af
ter t
he re
duct
ion
of li
tter s
ize t
o 4
pup
s per
litte
r
Birlh
G
roup
M
ale
Fem
ale
By D
ay a
nd O
pcrn
tion
facto
rs (n
_ S)
2
2U
X
2U
OX
25
0P
6UX
6U
OX
6S
0P
IOU
X
[OU
OX
IOSO
P
14U
X
14U
OX
14S
0P
1,7
0 ±
0,0
3
1.7
0 ±
0,0
3
1.7
6 ±
0.0
5
1.7
3 ±
0.0
6
l.5
1 ±
0,0
3
1.5
0 ±
0.0
3
1,80
± 0
,04
1.
79
± 0
.04
1.5
8 ±
0.0
3
1.5
8 ±
0.0
3
1.5
2 ±
0.0
4 1.
52
± 0
.04
[.8
2 ±
0.0
5
1.8
2 ±
0.0
5
1.7
2 ±
0.0
8 1.
72
± 0
.08
1.5
2 ±
0.0
4
1.4
4 ±
0.0
8
1.67
± 0
.03
1.6
6 ±
0.0
3
1.6
8 ±
0.0
2
1.6
7 ±
0.0
2
1.47
± 0
.05
1.
47
± 0
.05
By O
pcfm
ion
facto
r (0 =
20)
UX
UO
X
SO
P
1.75
± 0
.02
1.
74 ±
0.0
2
1.6
8 ±
0.0
3
1.6
7 ±
0.Q
3
I.S
0 ±
0.0
2
1.4
8 ±
0.0
3
Ovc
mll
1.7
0 ±
0.0
3"
1.74
± O
.OS
"
1.5
0 ±
0.0
3
1.7
9 ±
0.0
4'"
1.5
8 ±
0.0
3"
1.5
2 ±
0.0
4
1.8
2 ±
0.0
5"
[.7
2 ±
0.0
8'
1.4
8 ±
0.0
5
1.6
7 ±
0.0
3"
1.6
7 ±
0.0
2"
1.4
7 ±
0.0
9
1.7
5 ±
0.0
2"
1.6
8 ±
0.0
3°
1.4
9 ±
0.0
2
Wei
ght (
g)l
Wea
ning
(Day
21)
Mal
e Fe
male
O
vera
ll
14.3
8 ±
0.2
7
13.1
5±
0.3
4"
13
.76
±0
.29
13.0
9 ±
0.0
9
12.1
0 ±
0.3
1'
12.5
9 ±
0.2
1'
12.4
3 ±
0.1
8
11.7
3 ±
0.2
81t1
12
.08
± 0
.22
"
13,4
6 ±
0.7
3
12.9
4 ±
0.6
4
13.1
9 ±
0.6
8
12.7
3 ±
0.7
4
11.8
9 ±
0.9
6"
12
.31
±0
.39
12.0
9 ±
0.1
4
11.0
5 ±
0.1
31T
! 11
.58
±0
.13
14.3
8 ±
0.6
3 13
.58
± 0
.63
"
13.9
8 ±
0.6
3
12.i
8 ±
0.3
7 11
.36
± 0
.47
"
11.
77±
0,4
1·
12.8
9 ±
OA
O
12.1
0 ±
0.3
0"
12
.49
± 0
.35
11.6
0 ±
0.5
4
10.3
4 ±
0.6
3"
10.9
7 ±
0.5
8
12.2
3 ±
0.5
7
11,4
5 ±
0.6
0'"
1l
.84
± 0
.59
11.
74
± 0
.76
1
1.0
7 ±
0.5
7'
1l.4
0 ±
0.6
6
13.4
5 ±
0.3
7
12.4
9 ±
0.3
9'1
1 12
.98
± 0
.38
12.S
6 ±
0.1
9
10.6
7 ±
0.2
2'"
12
.13
± 0
.21"
12.2
9 ±
0.2
3 11
.49
± 0
.19
"'
11.8
9 ±
0.2
1'
Grow
th ra
le (g
lday
) M
ale
0.6
0 ±
0.0
1
0.5
4 ±
O.G
!
0.5
2 ±
0.0
1
0.S
6 ±
0.0
4
0.5
3 ±
0.0
2
0.5
0 ±
0.0
1
0.S
9 ±
0.0
3
0.5
0 ±
0.0
2
0.5
4 ±
0.0
2
0.4
7 ±
0.0
3
0.5
0 ±
0.0
3
0.4
9 ±
0.0
4
0.5
6 ±
0.0
2
0.5
2 ±
0.0
1
0.5
1 ±
om
Fem
ale
0.5
5 ±
0.0
2"
0.4
9 ±
0.0
1'
0,4
8 ±
0.0
1 It
0.5
3 ±
0.0
3
0,4
9 ±
0.0
211
0,4
5 ±
0.0
1'11
0.5
6 ±
0.0
3"
0,4
6 ±
0.0
2"
0.5
1 ±
0.Q
11
0.4
1 ±
0.0
3'1
0.4
6 ±
0.0
3"1
0,4
6 ±
0.0
3'
0.5
1 ±
0.0
211
1
0.4
8 ±
0.0
1'"
OA
7 ±
0.0
1"1
Ove
rall
0.5
8 ±
0.0
1
0.5
2 ±
0.0
1"
0.5
0 ±
0.0
1 ,.
0.5
4 ±
0.0
3
0.5
1 ±
0.0
2"
0,4
8 ±
0.0
3"
0.5
8 ±
0.0
3
0,4
8 ±
0.0
2"
0.5
2 ±
0.0
2"
0.4
4 ±
0.0
3
0.4
8 ±
0.Q
3
0.4
7 ±
0.0
3
0.5
6 ±
0.0
2
0.5
2 ±
0.0
1"
0.5
1 ±
O.O
I·'
tUtte
r siz
e _
4 (
2 m
ales
plu
s 2 fe
mal
es);
2Prc
fix n
umbe
r for
eac
h gr
oup
deno
tes t
he d
ay o
f opc
ratio
n; 'p
< 0
.05
, Hp
< 0
.01,
,up
< 0
.00
1 ar
c di
ffer
ent f
rom
ils
SO
P g
roup
(Tuk
ey l'
ISD
-test)
;'p
< 0
.05
, "p
< o
m,
"'p
< 0
.00
1 ar
e dif
fere
nt fr
om i
ts U
X g
roup
(Tu
key
HSD
-test)
; 'p
< 0
.05
, lip
< O
.OI,
'''p
<
0.0
0 I n
re d
iffer
ent f
rom
thei
r mtll
c Ii\
term
ntcs
(pair
ed sa
mpl
es I-
lest)
.
! m :;: n o
,
'tJ
o
I [ �
�
'"
O'IGpterS Effect on Postnatal Growth 1 1 6
Quantitative relationship between pups' body weight (g) and age (days) is plotted in Figure 5 . 1 (complete data for each point in this figure is presented in Appendix 5 .1);
and the intercept (�, slope (b) and coefficient of determination (r2) values for each
regression line are listed in Table 5.5. During the lactation period (from day I to day 2 1
post parrum) pups weight was positively related to age in all groups. No statistical
analyses were done to examine the differences between groups in either intercepts or
slopes values, (the statistical comparision of a series of repeated measures on the same
animals is a complex task) but it is clear from Figure 5.1 , Table 5.4 and Table 5.5 that
the pups from the UX group had a higher growth rate than both the UOX and SOP
groups. except in the animals operated on, on day 14 of pregnancy (Figure 5.1 (D» .
That is, some maternal factors rather than the number of pups suckled by the mother
during lactation period affected the pups' growth rate.
The daily weight gain of pups from animals operated on, on several different days of
pregnancy during lactation period is presented in Figure 5.2. The daily weight gain
pattern was similar in all groups. Weight increased slightly during the first 6 days of
lactation before remaining constant until day 12 to 13. The highest weight gain values
were reached by aU groups between day 13 to 14. After that, the pattern was slightly
varied between groups. The pups delivered by the animals operated on, on day 2 or 14
of pregnancy showed a continuous decrease in their weight gain from day 14 to day 2 1 .
In contrast, the pups delivered by the animals operated on, on day 6 or 10 of pregnancy
showed an increase in their weight gain during the last three days of the lactation period.
Figure 5.2 also shows that during the first week of the lactation period, the weight gain
of the SOP group was inferior to both the UX and VOX group (especially in the
animals operated on, on day 2 (Figure 5.2(A)) and 6 (Figure 5.2(B)). However, during
the last week of the lactation period the SOP group was similar or even superior to me
VX and UOX groups. This figure also provides additional confurnation that in general
daily mean weight gained by the UX groups was higher than that of both the VOX and
SOP groups, especially in the first two weeks of the lactation period (pups delivered by
females operated on, on day 14 of pregnancy was an exception to this generalisation).
5.3.3 The Mammary Glands Weight
There was no difference between operated and unoperated groups in their mean weight
of mammary glands (Table 5.6). Also, in the same groups of operated animals, the
weight of mammary glands from the operated side was not different from the (Jlands o
from the unoperated side.
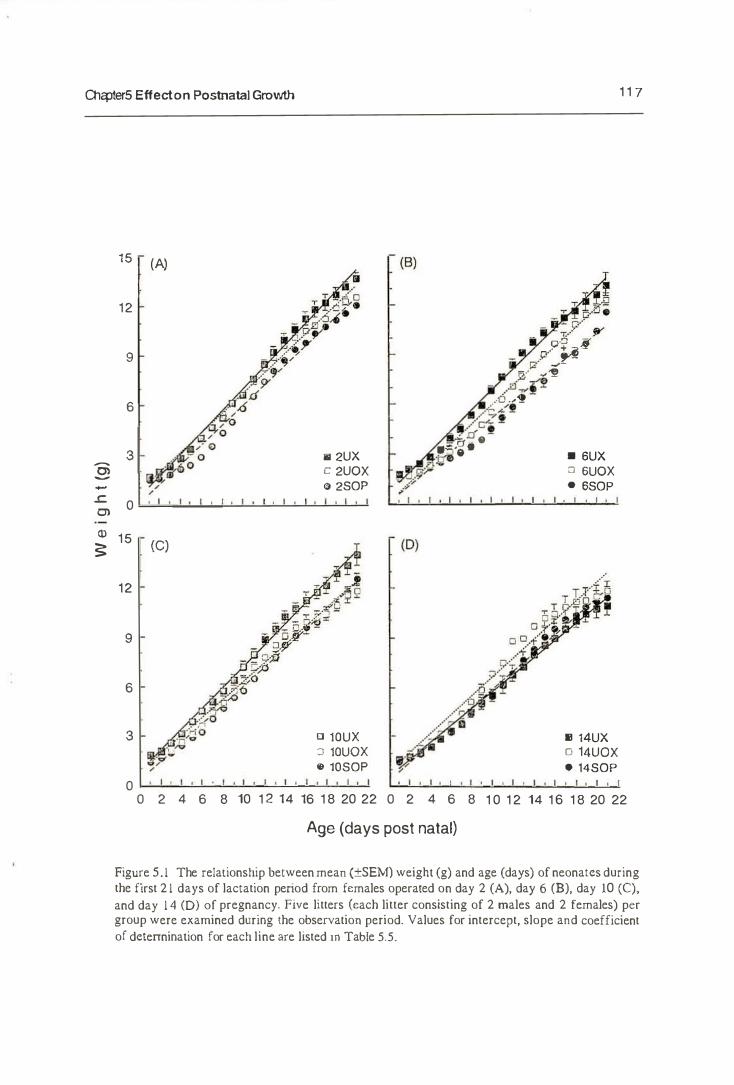
O1cpterS Effect on Postnatal Growth 1 1 7
§ -.c 0> CD �
15 IA) (8) •
12 y - • o· JY T. •••
9 - "P�-¥ �. -
D' ..... � - d" (I' / � ·0 .. 9
6 / ". !..(�:i -. / "" d • ", - 0
3 1i1 2UX .;; e ·
. 6UX 1;1" c 2UOX :J 6UOX a 2S0P · 6S0P
0 ' . , . I . I • I • I • I • , . , . , • I • I , I , I • , . , • I , I , ,
15 Ie) (D)
12
9
6
3 [] 10UX • 14UX :J 10UOX o 14UOX • 10S0P • l4S0P
0 ' . , I • I • I • I • , • I • I , , , . , . I • I , , . , . , · , . , . ,
0 2 4 6 8 10 1 2 14 16 1 8 20 22 0 2 4 6 8 1 0 1 2 14 1 6 1 8 20 22
Age (days post natal)
Figure 5.1 The relationship between mean (±SEM) weight (g) and age (days) of neonatcs during the first 2 1 days of lactation period from females operated on day 2 (A), day 6 (B), day 10 (C),
and day 1 4 (0) of pregnancy. Five litters (each litter consisting of 2 males and 2 females) per group were examined during the observation period. Values for intercept, slope and coefficient of dctennination for each line are listed 10 Table 5.5.
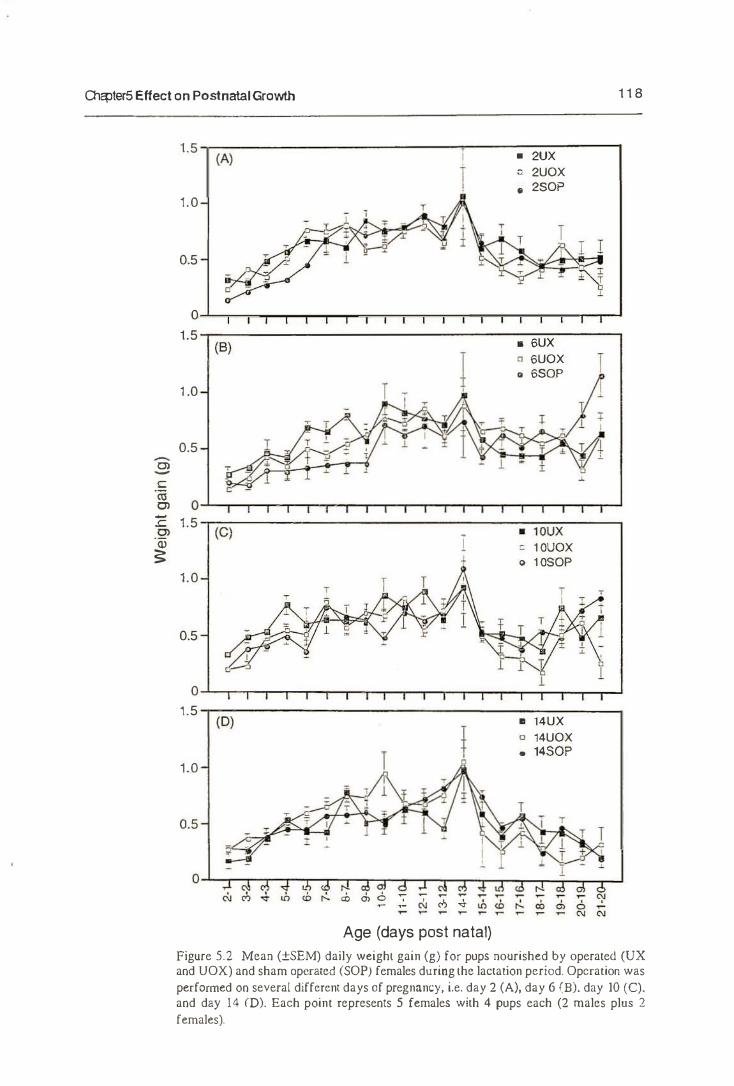
OlcpterS Effect on Postnatal Growth 1 1 8
'" -c:
';; '" -.c: '" 'Qi �
1.5 (A) 1
1.0
, i , ,
0.5
0
1.5 (8)
1 .0
0.5
0 1.5 (C) I
j 1.0
T
, -, 0.5
0
1.5 (D)
1.0
0.5
cO <:h 6 '7 '7 "7 "7 ..... ... t\J M '<T
Age (days post natal)
,
1
• 2UX ::. 2UOX • 2S0P
•
• 6UX o 6UOX o 6S0P
1 T T
T • - ±
• 10UX , 1 0UOX o 1 0S0P
1
• l4UX o l4UOX • 14$OP
I I
'i
1 1
1 , , T I
•
T
Figure 5.2 Mean (±SEM) daily weight gain (g) for pups nourished by operated (VX and VOX) and sham operated (SOP) females during the lactation period. Operation was perfonned on several different days of pregnancy, i.e. day 2 (A), day 6 (B). day 10 (C). and day 14 (0). Each point represents 5 females with 4 pups each (2 males plus 2 females).
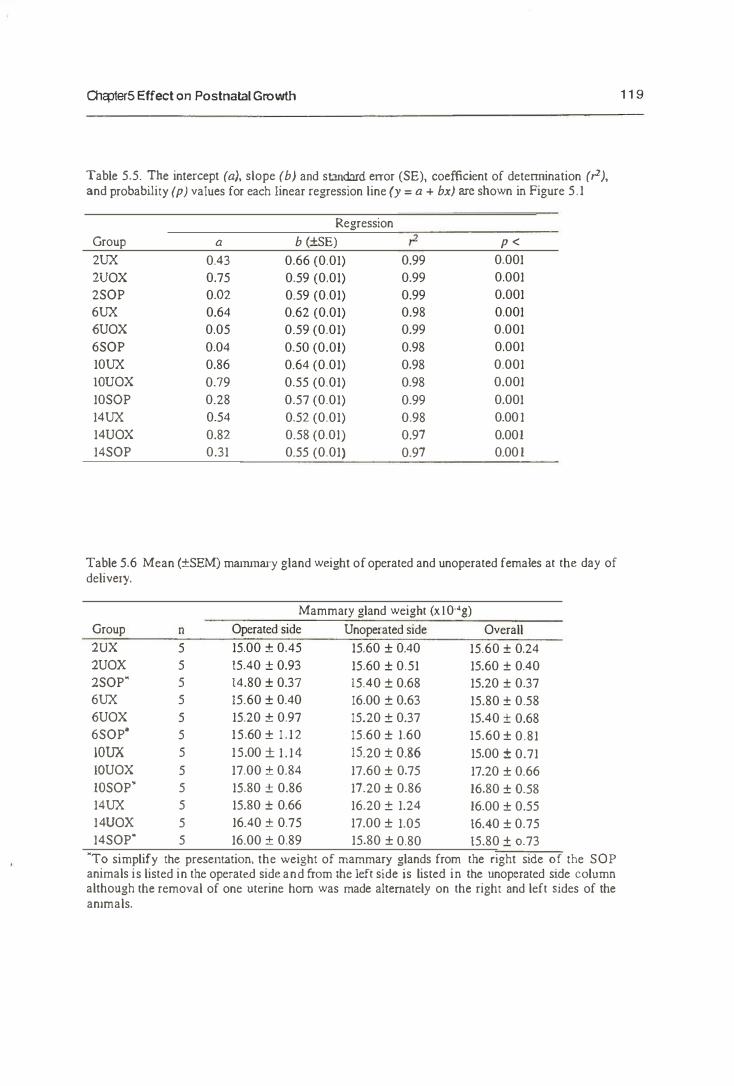
O1cpterS Effect on Postnatal Growth
Table 5.5. The intercept (a), slope (b) and standard error (SE), coefficient of detennination (r2), and probability (p) values for eaeh linear regression line (y = a + bx) arc shown in Figure 5.1
Regression
Group a b (+SE) " p <
2UX 0.43 0.66 (0.01) 0.99 0.001
2UOX 0.75 0.59 (0.01) 0.99 0.001 2S0P 0.Q2 0.59 (0.01) 0.99 0.001 6UX 0.64 0.62 (0.01) 0.98 0.001 6UOX 0.05 0.59 (0.01) 0.99 0.001 6S0P 0.04 0.50 (0.01) 0.98 0.001 10UX 0.86 0.64 (0.01) 0.98 0.001 iOUOX 0.79 0.55 (0.01) 0.98 0.001
10SOP 0.28 0.57 (0.01) 0.99 0.001 14UX 0.54 0.52 (0.01) 0.98 0.00 1 14UOX 0.82 0.58 (0.01) 0.97 0.001 14S0P 0.31 0.55 (0.01) 0.97 0.00 1
Table 5.6 Mean (±SEM) mammary gland weight of operated and unoperated females at the day of delivery.
Mammary gland weight (x I 0-4g)
Group 0 Operated side Unoperated side Overall
2UX 5 15.00 ± 0.45 15.60 ± 0.40 15.60 ± 0.24 2UOX 5 15.40 ± 0.93 15.60 ± 0.51 15.60 ± 0.40 2S0P' 5 14.80 ± 0.37 15.40 ± 0.68 15.20 ± 0.37 6UX 5 15.60 ± 0.40 16.00 ± 0.63 15.80 ± 0.58 6UOX 5 15.20 ± 0.97 15.20 ± 0.37 15.40 ± 0.68 6S0P' 5 15.60 ± 1 .12 15.60 ± 1.60 15.60 ± 0.81 10UX 5 15.00 ± 1 . 1 4 15.20 ± 0.86 15.00 ± 0.71 10UOX 5 17.00 ± 0.S4 17.60 ± 0.75 17.20 ± 0.66 IOS0P' 5 15.S0 ± 0.86 17.20 ± 0.86 16.S0 ± O.5S 14UX 5 15.S0 ± 0.66 16.20 ± 1.24 16.00 ± 0.55 14UOX 5 16.40 ± 0.75 17.00 ± 1.05 16.40 ± 0.75 14S0P' 5 16.00 ± 0.89 15.S0 ± 0.80 15.80 + 0.73
-To simplify the presenlalion, the weight of mammary glands from the right side of the SOP animals is listed in the operated side and from the left side is listed in the unopcrated side column although the removal of one uterine hom was made alternately on the right and left sides of the animals.
1 1 9
OlzpterS Effect on Postnatal Growth 120
5 .4 Discussion
5.4.1 Maternal Behaviour
This study begins with the observation on postnatal maternal behaviour towards pups
after removal of one uterine horn on several different days of pregnancy. It was
assumed that post operation changes in progesterone concentration might cause the
incomplete mammary gland growth and differentiation during the course of pregnancy.
It was also assumed that the decrease in the progesterone concentration after operation
in pregnant females, especially in the UOX group (see Chapter 3), might result in
maternal behaviour impairment. Based on these two assumptions, it was expected that
uterine removal on several different days of pregnancy could have a negative effect on
the growth of the neonate. These effects might be caused by the maternal incapability to
nourish the pups due to an abnormality in the milk production and/or an abnormality in
maternal behaviour towards pups.
In the present study, weight of the marrunary glands of the operated animals (both the
UX and UOX groups) was not different from the unoperated females (the SOP group).
In the same animals, weight of marrunary glands from the operated side was not
different from the unoperated side (Table 5.6). However, data on postnatal maternal
behaviour indicates that unilateral uterine transection followed by removal of its
ipsilateral ovary can induce abnormality in maternal behaviour. Only one of five (20%)
to two of five (40%) of the UOX females behaved normaJly towards their pups after
delivery (Table 5.1). Twenty five percent to forry percent of pups were rejected by the
UOX mother (Table 5.1), where cannibalism was the most frequent kind of maternal
rejection observed (Table 5.2).
These findings suggest [hat unilateral uterine transection at several different days of
pregnancy had no effect on the growth and differentiation of mammary glands.
However, abnormal maternal behaviour after birth could be induced if the operation was
followed by the removal of the ovary ipsilateral to the removed uterine hom. This
impairment in maternaJ behaviour is likely not due to the reduction in litter size at
delivery since the UX females, like the SOP females, remained maternally normal even
though their litters were reduced up to a half of normal size.
The onset of normal maternal behaviour at birth is primed by the oestrogen and
progesterone ratio during the course of pregnancy (Bridges and Russell, 1981 ;
Fleming, 1986; Siegel, 1986). In the rat, for example, a low level of progesterone in the
presence of oestrogen is needed to induce the onset of nonnal maternaJ behaviour while
OlcpterS Effect on Postnatal Growth 1 21
maintenance of a high level of progesterone in the presence of oestrogen prevents the
rapid onset of maternal behaviour (Bridges et al., 1978; Bridges and Russell, 1981;
Siegel, 1986). Fleming ( 1986) also reported that hormonal action nO( only works on the initiation of maternal behaviour at birth but aJso increases maternal attraction to pups and
facilitates a close relationship between mother and pups. Furthermore, Wang et al.
e 1992) reported abnonnaJ maternaJ behaviour in females previously treated with
antibody against progesterone and suggested that partial withdrawal of progesterone at
parturition, which results in hormonal imbaJance, can cause abnormaJ maternal
responses to pups. The findings in this study are in agreement with those of earlier
studies described above. Progesterone concentration of the UOX group was lower than
that of both the UX and SOP group (see Chapter 4). Thus the low levels of
progesterone after operation in the VOX group was associated with a high incidence in
the abnoll11aJity responses and maternal rejection in operated mothers towards their
young (Table 5.1 and Table 5.2). The UX group showed moderate values for both
maternal abnoll11ali£y responses and rejection towards pups, lying between the VOX
and SOP groups. It suggests that removal of one uterine horn alone, when the two
ovaries remain intact, on several different days of pregnancy was not strong enough to
induce abnormal postnatal maternal-behaviour towards the pups.
In this study, cannibalism was the most frequent form of maternal rejection found in £he
UOX group over isolation or nurSing failure, while the two latter forms are the most
frequent found in the UX group. The significance of this finding and the underlying
mechanisms are not known. One possible explanation is that progesterone, as proposed
by Crombie el al., (1995), has a broad spectrum of effects on the establislunent of
norma] materna] behaviour. This may work in different ways in determining whether
post partum maternal behaviour is manifested in isolation, nursing failure or
cannibalism. According to Crombie et aI., ( 1995), cannibatism is an indicator of
aberrant olfactory recognition which occurs without any impairment to maternal
behaviour.
The weight of the mammary gland from me operated females (the UX and VOX
groups) on the day of delivery did not differ from the unoperated females (the SOP
group) (Table 5.6). This finding is not consistent with the finding of impairment in maternal behaviour as described above. It also contradicts the fmding of Cerruti and
Lyons ( 1960) in mice. By injecting placental extract directly into the area of skin
covering one of the mammary glands of two month old virgin mice, Cerruti and Lyons
e 1 960) revealed that mammogenic activities of the mid-gestational placenta work in both
O1cpterS Effect on Postnatal Growth 1 22
a local and a systerrtic mode of action. It was expected that removal of one uterine horn,
which in turn reduces the number of placenta up to a half of the normal size, would
result in growth retardation or in a slower differentiation of mammary glands in either
the operated side or in operated animals compared to the unoperated side or unoperated
control animals.
It is known tbat the mammary gland development is progesterone dependent (VI ang et at., 1990) and ovary removal in pregnant animals results in the delay of both alveolar
development during pregnancy and lactogenesis at the time of parturition (Buttle, 1988).
Thus, the idea that abnormality in maternal responsiveness and pup rejection may derive
from the effects of progesterone deprivation, or from partial inhibition of progesterone
dependent mammary gland development (Wang er ai., 1990), leading to an inability to
provide enough milk. for the young, is not applicable in this study. However, this
finding supports the result of Wang et aL, ( 1995) who reported that a higher frequency
of pup rejection by the antibody-treated mother was not due to the lack of milk secreted
by the mother or a result of defects in the pups.
5.4.2 The Growth of Neonates
These findings offer additional evidence that there is an inverse relationship between
the number of young in the litter and the size of young at birth in polytocous mammals
(Eckstein and McKeown, 1955; Healy, 1960) and that a reduction in litter size results in
an increase in birth weight due to the reduction of prenatal competition for the limited
nutrients provided by the mother (Eckstein and McKeown, 1955; McCarthy, 1967).
In this postnatal study, the variation arising from the effects of liner size on postnatal
growth was eliminated by reducing the number of litter to four pups per liner (2 males
plus 2 females). In such conditions it was assumed that postnatal competition between
litrer mates in obtaining both maternal environment (milk. from maternal mammary
glands and maternal responses) and physical environment of the cage (space and nest
material), and the effect of sexes were minimised. It was expected, therefore, that the
only source of variation in postnatal body weight would originate from the mother,
namely the operated females (the UX and UOX groups) and the unoperated females (the
SOP group).
Data on growth of neonates show that at the day of delivery, overall mean weights of
selected pups from the UX and UOX groups were significantly higher than those of the
OlipterS Effect on Postnatal Growth 123
SOP groups, whether these animals wcre operated on, on day 2, day 6, day 10, or day
14 of pregnancy. At weaning, however, overall mean weight of pups from the UX
group tcnded to highcr than that of both the UOX and SOP group. This difference was
significant in the animals operated on, on day 2 and day 10 of pregnancy.
Consequently, the growth rate of pups from the UOX and SOP females was
significantly lower than the UX group, especially in groups of animal operated on, on
day 2. day 6. and day 10 of pregnancy (Table 5.4; Table 5.5; Figure 5.1 ; Figure 5.2).
These results agree with those of EI Oksh elal. (1967) and Moore et al., ( 1970) in that
maternal postnatal effects caused significant differences in body weight of mice. EI Oksh el al, (1967) reported tbat maternal postnatal environment accounted for 0, 5 1 , 63,
52% of the total variation in body weight at birth and at day 7, day 14, and day 2 1 of
the lactation period respectively. After that. this postnatal maternal effect decreases,
while the effect of genotype factor increases with the age of young (El Oksh el ai., 1967).
Although the weight gained by the pups from the UX group tended to be higher than
that from both the UOX and SOP groups, the pattern of the weight gain of these groups
was similar over 21 days of lactation period. For all groups, the gain is low during the
first 3 days, Slightly increaseed until day 6 before reaching a nearly constant value until
day 12 to 13 and reaching a maximum value on days 13 to 14 (Figure 5.2). This
similarity in weight gain supports the finding for the mammary gland weight as
previously described (see Section 5.4. 1) . Weight gain during the period of 7 to 14 days
is a good criterion for measuring mammary gland activities (milk production) since
weight gain during this period is most influenced by the milk supply (EI Oksh, 1967).
What explains rhe difference in growth rate between the UX and either the UOX or SOP
groups? The fact that the mammary gland weight was nO( different between groups, and
that the percentages of abnormality in maternal behaviour are higher in the UOX than
those of both the UX and SOP groups contradicts the assumption in this study that the
growth rate (also rhe final weight) of the young is influenced by both the maternal
production of milk and behaVIour towards pups. The UX group was not different from
the SOP group in eIther maternal behaviour or manunary gland weight. The two groups
were also similar in that they have intact ovaries. However, the two groups differed in
the pup weight at weaning and growth rate.
�ter5 Effect on Postnatal Growth 1 24
Possible explanations include: 1) the type of postnatal maternal behaviour towards pup
might in some way affect posrnatal growth, 2) single measurement of the marrunary
gland weight as conducted in this study might not be a good procedure to estimate milk production during the lactation period. Pup isolation and/or nursing failure were me
most dominant form of rejection behaviour displayed by the UX group while
cannibalism was specific for the UOX group although the form of isolation and/or
nursing failure of the VOX group was higher than the UX group. However, this
argument does not explain the difference in growth rate since the type and pattern of
postnatal maternal behaviour between the UX and SOP groups is not different (see
Table 5.2).
Maternal factors affecting preweaning growth of manunals includes genetic composition
(genotype), nutrition, milk production, behaviour (maternal care), and age, while the
other factors originate from the pups, including genotype, hormonal control, birth
weight, and litter size (Hafez, 1963).
The difference between males and females in either body weight or growth rate (fable
5.4) is parallel with those of Pahl ( 1969), and Wahlsten and Bulman-Fleming ( 1987)
who reported that the difference between males and females originated from intact
animals in growth rate. At days 100 after birth for both male and female mice the weight
differences between litters of 1 1 and 2 was about 3.7 g body weight. (Wahlsten and
Bulman-Fleming, 1987). In the rat, the point of divergence of male and female growth
curves begins 30 days post parlLlm (Pahl, 1969). However, Eisen ( 1976) in his review
of the growth curves of mice noted that maximum postnatal growth rate of the mouse is
reached at about half its mature size, and postnatal growth rate of males is higher than
that of females. The two sexes differ in the time taken to reach a sigmoidal growth
curve, where an adequate time for males to fit (he graph is age 70 days, and for females
is age l05 days (PaW, 1969).

.. 1 _____________________ _
Chapter 6 General D isclUssion
6.1 Experimental Design
This work is designed to examine the effect of removal of one uterine horn on fetal and
neonatal growth of mice. Removal of one uterine hom was carried out on four different
days of pregnancy, i.e. day 2, day 6, day 10, and day 14 with three different types of
operation, i.e. uterine hom only was removed (UX), uterine horn and its ipsilateral
ovary was removed (VOX), and neither the uterine hom nor the ovary was removed
(sham�opera(ed control) (SOP). The consequences of these procedures are as follows:
1) In the UX females, the size of litter is reduced up to a half of normal size in the
condition of normal number of the CL; 2) In the UOX females, both the size of litter and
the number of CL are reduced up to about a half of nonnal size; 3) In the SOP females,
both the size of litter and the number of CL remain uninterrupted.
This design allows us to examine the effect of the reduction of liner size on several
different days of pregnancy, whether it was followed by the reduction of CL number.
on the length of gestation, prenatal growth, post operative plasma progesterone
concentrations and ovarian and uterine histology, and post partum maternal
�l"""""""""""""--------------
OJa)terS Genera! Discussion 1 27
responsiveness towards young and neonatal growth during the first week of the
lactation period.
6.2 Experimental Limitation
Due to the difficulty of separating the fetus from embryonic membranes in fresh
preparation, uterine horn obtained from females on days 3, 7, I I , and 15 of pregnancy
were fixed in Bouin's solution before examination was made. Hence values of uterine
hom, placenta, and fetus weights and mher parameters obtained from these females are
based on Bouin-fixed preparation. In relation to this, it is possible that values of these
data are slightly below the real values obtained from fresh preparation due to the
dehidratory effect of the Bouin's solution used. Rugb (1967) suggests a formula to
correct Bouin-fixed data by adding 24% and 6.5% of values to the original weights and
lengths data respectively. On the orher hand, it is also possible that those data are not
different from, or even slightly more than, the real values obtained from freshly
prepared since Bouin-fixed preparations were first rinsed gently with running tap water
before examination. In such conditions, it was decided to analyse and present those data
without applying the correction fonnula suggested by Rugh (1967).
6.3 Effects on Length of Gestation, Litter S ize and Progesterone Concen
trations
This study confirmed that the reduction of litter size by approximately 50 percent results
in prolongation of the length of gestation up to about one day longer than normal litter
size. However, the reduction of CL number due to the removal of one ovary following
removal of one uterine horn had no effect on the length of gestation though it was
apparently related to the post operative concentration of progesterone. These results
suggest that it may be in this strain of mouse: 1) The Jength of gestation is regulated by
the number of fetuses or conceptuses in the uterine horn rather than the number of CL in the ovaries; 2) Progesterone concentration during pregnancy is more affected by the
number of CL rather than the number of conceptuses; 3) The reduction in progesterone
concentration due to the reduction in CL number had no significant effect on pregnancy
maintenance; 4) Progesterone concentration is just one of several, not the only, factors
involved in regulating the length of gestation or in detennining the onset of parturition.
... : ............................................................ -
Owter6 General Discussion 1 28
Liner size and progesterone concentration and their relationships with the length of
gestation can be explained by understanding the mechanism of the onset of parturition.
The control of parturition is a complex process and initiated by several interacting
factors. no single factor is solely responsible for the onset of parturition. In many
mammals. the onset of parturition is deterrn.ined by the fetus via secretions of cortisol
from the adrenal cortex. Cortisol released by the fetus then induces an increase in
placental 17cx-hydroxylase activity which results in an increased in ElF ratio. Increasing
in E!P ratio, via an oxytocin-dependent mechanism, will stimulate the uterine synthesis
and release of PGF2o.' and in tum, this prostaglandin will activate myometrial
contractions and cervical ripening. As parturition proceeds, PGF2Cl synthesis and release
then enhanced by oxytocin (Thorburn, 1991; Johnson and Everitt, 1995). Thus. an
increase in fetal number should be followed by an increase in fetal cortisol secretion,
which in turn induces the onset of parturition earlier than that of a small litter. From this
point of view it can be understood. therefore, why gestation length of both the UX and
UOX females in the study reported here is longer than that of the SOP females.
This result of the inverse relationship between liner size and length of gestation in mice
is in substantial agreement with those of Biggers et al. (1963), McLaren and :Michie
( 1963), McLaren ( 1967), and Dewar (1968) who hypothesised that the effect of litter
size operates systemically rather than locally. In the pig, the inverse relationship
between liner size and gestation length (Omtvedt, 1965; Martin et al., 1977) and the
positive correlation between litter size and estrogen concentration during the last two
weeks of gestation period, and the lack of relationships between CL number and
gestation length, progesterone, and estrogen concentration (Maron et at., 1977) have
been documented. In relation to these previous results, Biggers et al. (1963) and Martin
et at. ( 1977) claim that placental estrogen plays a significant role in initiation of
parturition. However, the involvement of placental estrogen in regulation of parturition
was no longer accepted since Harkness el o1. (1964) failed to detect the presence of
placental progesterone, and Dewar ( 1968) failed to induce prolongation of gestation
length by injecting a physiological dose of estrogen.
Progesterone sources during pregnancy include ovaries, adrenal cortex and placenta. In addition to its progestational role it is well known that placenta also actively produce a
luteotrophic hormone (Heap et al., 1973; Linkie and Niswender. 1973; Kelley el al.. 1975; Galosy and Talamantes, 1995) which can cake over the pituitary role in
maintaining ovarian function. Although ovaries are the main source of progesterone
during pregnancy. unilateral ovariectomy following the unilateral hysterectomy at any
O1a::lterS General Discussion 1 29
stage of pregnancy in !.he present study apparently have no effect on pregnancy
maintenance in !.he mouse. This finding is in accord wi!.h Pepe and Rothchild (1973)
who reported that pregnancy can be maintained in association with serum progesterone
levels that are approximately 75 to 80 percent lower than nonnal values.
In females operated on day 2 of pregnancy, surgical procedures failed to alter the pattern
of progesterone secretion though mean values for the unilaterally utero-ovariectomised
(UOX) females were lower, but not significantly, rhan those of both the UX and SOP
females. By day 10 of pregnancy, however, surgical procedures succeeded in altering
the pattern of progesterone secretion. Operation on day 6 of pregnancy apparently had
an unpredictable effect on both the pattern and concentration of progesterone. These
findings offer clear evidence that ovarian compensation (or maybe placental
compensation also) in producing progesterone due to the surgical procedures can be induced if the operation is carried out as early as day 2 of pregnancy. Compensatory
growth of follicles in the remaining ovary after unilateral ovariectomy has been reported
in unmated mice (Biggers el aI., 1963; McLaren, 1963). Unilateral ovariectomy as early
as day 8 of pregnancy also results in the CL hypertrophy in the rat, though plasma
progesterone levels remain low compared either to the control or to the premating
unilaterally ovariectomised females (Rahima and Bruce, 1987).
These findings also strongly support the theory that: 1) Ovaries are the main source of
progesterone and uterine (or placental) origin of progesterone are very small (Hall,
1957; Elbaum et at., 1975; Kensinger et ai., 1986); 2). Although placental capacity in
producing progesterone is very small, after day 10 of pregnancy their overall
contribution is very significant (Macdonald and Matt, 1984; Matt and Macdonald, 1984;
Kato el al., 1979). In mice, implantation is completed on day 6 of pregnancy (Rugh,
1967) and placentae grow sharply from day 8 and then, on day 10 they completely take
over the pituitary role in maintaining pregnancy by producing gonadotrophin, meG and
mPL (Choudary and Greenwald, 1969; Markoff and Talamantes, 198 1 ; Rao er al.,
1982; Soares el al., 1982; Humphreys el ai., 1985; Ogren and Talamantes, 1988).
6.4 Effect on Prenatal Growth
In several polytocous species litter size is inversely related to birth weight. A small size
of litter is usually related to the delayed parturition and a large litter is usually associated
with early parturition. This litter size factor also affecls the rate of fetal growth, both
�1"""""""""""""".5""""E""""""""
OlaJleiS Gene@! Discussion 1 30
locally and systemically, during gestation period, therefore, causing a variation in birth
weight. Clapp ( 1989) suggested that placental and fetal growth are limited by the rate of
utero·placental blood flow and a minor reduction in flow results in growth restriction
with no evidence of metabolic abOOITIlalities. Removal of one uterine hom results in the
reduction of litter up to a half nonnal size and prolongation of gestation length (see
Section 6.1 .2).
The results from the prenatal growth study confinned that:
1 . The effect of unilateral uterine removal in the mouse was time dependent. Until day
15, uterine removal at any day of pregnancy had no effect on prenatal growth.
However. if pregnancy was allowed to proceed until day 18, fetal weight from females
operated on days 2 and 6, but not on days 10 and 14, was significantly higher than that
from the SOP females.
These findings clearly indicate that: a) the last three or five days of pregnancy is the
most critical period for prenatal growth when the uterine horn begins to exert its effect
on prenatal growth b) the rate of prenatal growth is affected by the size of litter which
works systemically, c) the effect of litter size on prenatal growth is exerted during the
first half of the gestation period although the result of this effect can only be detected
during the last three to five days of pregnancy due to the uterine limitation on fetal
growth, and d) any effort directed to reducing the size of litter during the period of day
10 to term failed to induce a better prenatal growth of remaining fetuses.
These interpretations are parallel with Clapp's flow limited-prenatal growth theory that
prenatal growth is limited by the blood flow reaching the uterine horn (Clapp, 1989)
and also parallel with the uterine limitation theory suggested by McKeown (1976). In
mice, implantation is initiated on day 4 and is then completed on day 5 of pregnancy
(Rugh, 1967). The initial placental formation was associated with both dramatic growth
of the uterine vasculature and an elevation in uterine blood flow (Garris, 1984; Edward
and Milligan, 1987) and reduction in the uterine blood flow during early pregnancy has
the greatest effect on placental growth (Garris, 1984; Clapp, 1989). Thus, removal of
one uterine horn as early as day 2 or day 6 of pregnancy might result in the
reconstruction ancJJor enlargement in uterine vasculature of the remaining uterine horn.
especially in placental arteries, better than that of later days; and this, in tum could result
in blood flow redistribution and provide more nutrients to the remaining uterine horn.
These speculations to a large extent are supported by both placental and uterine
vasculature data discussed below (point 2, 3, and 4).
OJcoterG Gene@I Discussion 1 31
In intact animals variation in blood supply to the uterine hom which may influence
prenatal growth can originate from both the distension of the uterus and the decrease in
blood pressure induced by pregnancy McChany (1965). The distension of the uterine
horn and the decrease in blood pressure may restrict the blood supply to the placenta
and then affect the rate of fetal or placental growth. Both the degree of uterine distension
and reduction in maternal blood pressure correlate with the number of implants. The
effect of maternal blood pressure reduction on prenatal growth is exerted both locally
and systemically. Whether prenatal growth in the strain of mice reported here is affected
by the local effect or not was not examined. However, at least four reports on the
presence of local effect on prenatal growth in mice have been documented (McCharty,
1965; 1967; McLaren, 1965; Bruce and WeUstead, 1 992).
2. In aU groups, placentae grow rapidly during the first half of gestation period before
feruses reached their maximal growth rate. The growth of fetuses reached a maximal
rate in the second half of pregnancy when placenta have reached a plateau in their
growth rate. However, the difference in placental weight between operated and
unoperated females was only detected as early as day 1 1 of pregnancy. Placental
growth, but not fetal growth, was significantly influenced by the day of operation.
Therefore, placental weight of females operated on days 2 and 6 was significantly
higher than that of females operated on day 14 of pregnancy.
These findings confirm that fetal growth is controlled by the placenta and that optimal
growth of placentae is an important prerequisite for the growth of fetuses. Thus, the
idea that the decline in fetal weight is associated with the decline in placental weight
(mice: McLaren, 1965; pig: Knight ef aI., 1977; rat: Norman and Bruce, 1 979a; 1979b;
guinea pig: Eckstein and McKeown, 1955a; 1955b; Eckstein el ai., 1955) and that
intrauterine growth retardation is partly determined by the reduction in placental blood
flow (Dawes, 1976) are in agreement with these findings. More recently, Robinson et a1. (1995) reported that placental effect on prenatal growth is exerted by both metabolic
and endocrine mechanisms (Robinson et ai., 1995).
These findings also suggest that removal of one uterine hom firstly induces a maximum
placental growth by facilitating it with more favourable conditions for growth. and this
condition then prepares an optimum condition for the growth of fetuses in the remaining
uterine hom. This finding is strongly supported by the findings in the present study on
uterine vasculature which revealed that uterine vasculature underooes a dramatic orowth o 0
OlaJ!erG General Discusskm 1 32
early in the gestation period particularly between day 2 and day 6, and uterine removal
during this period, but not after this period, results in vascular hypertrophy in the
remaining uterine horn. The most dramatic increase was found in the placental artery.
However, the critical stage of pregnancy for arterial development was different in different arteries.
3. Either placental weight or fetal:placental weight ratio was positively related to the fetal
weight. Furthermore, placental efficiency increased dramatically with the age of
pregnancy, but at the same age of pregnancy the ability of placenta to support fetal
tissue was decreased as the weight of placenta increased either in the operated and
unoperated females.
4. Mean weight of either the entire or empty uterus per hom of the operated females was
significantly higher than that of the unoperated females when autopsied on days 1 5 and
1 8 of pregnancy. However, there was no evidence that females operated on, on earlier
days of pregnancy had a uterine horn heavier than those operated on later days. Also,
removal of one ovary following the removal of its ipsilateral uterine hom had no effect
on the growth of the remaining uterine hom. In addition, removal of one uterine hom
failed to alter the proportion of gravid components of the remaining uterine horn. On day 18 of pregnancy, almost 80% of the uterine component consisted of fetal
contribution and the remaining components never exceed the value of 20%.
6.5 Effects on Postnalal Growth and Maternal Behavior
The size of litter at birth and total birth weight per litter were significantly lower, while
both mean weight per liner and total liner weight to maternal weight ratio were
significantly higher in the operated than the unoperated females. Removal of one uterine
horn effectively induced abnonnal maternal behavior when the ovary ipsilateral to the
removed uterine horn was also removed. Only one of five (20%) to two of five (40%)
of the UOX animals were maternally nonnal towards pups. Twenty five percent to forty
percent of pups were rejected by the UOX mother where cannibalism was the most
frequent kind of maternal rejection observed while isolation or nursing failure, were the
most frequent found in the UX group.
Again. these findings strongly support the flow-limited theory of Clapp (1989) and
uterine limitation theory of McKeown (1976). Based on these two theories. prenatal
QypterS General Discussion 1 33
growth, and therefore birth weight of young, are inversely related with litter size. thus
the reduction in litter size results in an increase in birth weight which might be due to the
reduction of prenatal competition for the limited nurrienlS provided by the mother
(Eckstein and McKeown, 1955a; 1955b; McCarthy, 1967). However, the facts
obtained in this study that the growth of mammary glands was not affected by the
surgical procedures, and that the incidence of maternal behavior abnormality and
rejection towards pups in the UX females is lower than that of the UOX but higher than
that of the SOP females suggests that the abnormality of the UOX females is not solely
due to the reduction in the size of litter at birth.
The onset of nonnal maternal behavior is primed hormonally by a combination of low
level of progesterone in the presence of estrogen (Bridges et al., 1 978; Bridges and
Russell, 198 1 ; Fleming, 1986; Siegel, 1986). This ratio in progesterone and estrogen is
in accordance with the hormonal condition during the last days of gestation period. This
study found that maternal plasma progesterone concentration decreased abruptly from
day 1 5 to day 18 of pregnancy and on most observation days plasma progesterone
concentration of females from the SOP was higher than that of both the UX and UOX
group though these differences were not always statistically significant (see Chapter 4).
It is suggested that the decrease in progesterone concentration due to unilaterally uterine
and ovarian loss during pregnancy can induce an abnormality in maternal behavior. This
effect became weak if the ovary ipsilateral to the removed horn remained intact in situ.
Wang et at. (1992) revealed that partial withdrawal of progesterone at parturition, which
results in hormonal imbalance, can cause abnormal maternal responses to pups.
Regarding the effect of uterine removal on mammary gland growth, where mean weight
of mammary glands from operated females (or from the operated side) were not
different from unoperated females (or from unoperated side), these findings contradict
with Cerruti and Lyons ( 1960) who found that mid·gestational placental extract had
mammogenic activitiy which works both locally and systemically and with other authors
(Wang et al., 1990; Burrle, 1988) who reported !.he mammary growth dependency on
progesterone and with the progesterone data reported here (see Chapter 4). It might be that the single measurement of mammary gland weight or the procedure applied to
measure the mammary gland weight in this study are inappropriate.
Postnatal growth rate of pups from the UOX and SOP females was significantly lower
than the UX group, especially in groups of animal operated on day 2. day 6. and day 10
of pregnancy. Consequently, at weaning overall mean weight of pups from the UX

I ,
OJcpterS General Discussion 1 34
group tended to be higher than that of both the UOX and SOP groups. These findings
raised a big question on what is the factor or factors affecting postnatal growth in mice used in this study. The size of the litter during intrauterine growth period, which is
inversely related to birth weight (Eckstein and McKeown, 1955a; 1955b; McKeown el
ai., 1976), might affect preweaning growth and cannot be considered in this case since
the UOX group is significantly different from the SOP, but not different from the UX
group in liner size. To consider the maternal responsiveness towards young as a
detenninant factor in this case is not appropriate since the UOX and SOP groups are
different in their post-partum behavior. Therefore, this question remains unanswered
and needs a further study with a bigger sample size.
I
I
Reffell'ell'ilces
ABRAHAMSOHN, P.A. and Zorn, T.M.T. (1993) Implantation and decidualization in rodents. The Journal of Experimental Zoology, 266: 603-628
AlTKEN, R.I., Bowman, P., and Gauld, L (1977) The effect of synchronous and asynchronous egg transfer on foetal weight in mice selected for large and small body size. Journal of Embryology and Experimental Morphology, 37: 59-64
ALLEN, W.R. (1975) Endocrine function of the placenta. In Comparative Placentation (Ed.: D.H. Steven). Academic Press, London. pp. 2 14-267
ANDERSON, L.L. (1973) Effects of hysterectomy and other factors on luteal function. In Handbook of Physiology, Sec/ion 7, Vol II (Eds. : R.O. Greep and E.B. Astwood). American Physiological Socie£y. Washington. pp. 69-86
ANDERSON, L.L. ( 1977) Uterine control of ovarian function. In Biology of the Uterus (Ed.: R.M. Wynn). Plenum Pres, New York. pp. 587-651
ANDERSON. L.L., Bowerman. A.M., and Melampy, R.M. ( 1965) Oxytocin on ovarian function in cycling and hysterectomized heifers. lournal of Animal Science. 24: 964-968
ANDERSON, L.L., Neal, F.C., and Me1aphy, R.M. ( 1 962) Hysterectomy and ovarian function in beef heifers. AmerIcan loumal of Veterinary Research, 23: 794�802
References
, ' \ � , , .... , ,
137
BAIRD, T.D. ( 1984). The ovary. In Hannanal Control of Reproduce;on. 2nd Ed. (Eds.: c.R. Austin and R.V, Shon). Cambridge University Press. Cambridge pp. 91- 1 14
BARKLEY, M.S., Geschwind, 1.1., and Bradford, G.E. ( 1979) The gestational pattern of estradiol, testosterone and progesterone secretion in selected strains of mice. Biology Reproduction, 20: 733-738
BARKLEY, M.S., Michael, S.D., Geschwind, I.I. and Bradford, G.E. (1977) Plasma testosterone during pregnancy in the mouse. Endocrinology, 100: 1472-1475
BARR, M., Jensh, R., Brent, R. ( 1970). Prenatal growth in the albino rat: effects of number, intrauterine position and resorptions. Journal of Anatomy, 128: 4 13-428
BARTKE, A. (1970) Influence of an IUD on the luteolytic content of the uterus and on the duration of pseudopregnancy in mice. Journal of Reproduction and Fertility, 23: 243-247
BELT, W.D., Cavazos, L.F., Anderson, L.L., Kraeling, R.R. (1970) Fine structure and progesterone levels in the corpus )uteum of the pig during pregnancy and after hysterec[Qmy. Biology of Reproduction, 2: 98-113
BIGGERS, J.D., Curnow, R.N., Finn, C.A., and McLaren, A. (1963) Regulation of the gestation period in mice. Joumal of Reproduction and Fertility, 6: 125-138
BLAND, K.P. and Donovan, RI. ( 1966) The uterus and the control of ovarian function. In Advances in Reproductive Physiology (Ed.: A. McLaren). Academic Press, London. pp. 179-214
BONNAMY, PJ., Benhaim, A. and Leymarie, P. ( 1992) Changes of progesterone content of rat uterine flushings in relation to serum concentrations of progesterone during the oestrous cycle. Journal o/Reproduction and Fertility, 96: 233-239
BRIDGES, R.S and Russel, D.W. (1981) Steroidal interactions in the regulation of maternal behaviour in virgin female rats: Effects of testosterone, dihydrotestosterone, oestradiol, progesterone and the aromalase inhibitor, 1,4,6-androstatriene-3,17-dione. Journal of Endocrinology, 90: 31-40
BRIDGES, R.S. (1984) A quantitative analysis of the roles of dosage, sequence, and duration of estradiol and progesterone exposure in the regulation of maternal behavior in the rat. Endocrinology, 114: 930-940
BRIDGES, R.S., Rosenblatt, J.S., and Feder, H.H. ( 1978) Serum progesterone concentrations and maternal behavior in rats after pregnancy tennination: behavioral stimulation following progesterone withdrawal and inhibition by progesterone maintenance. Endocrinology, 102: 258-267
BRONSON, F.H., Dagg, c.P., and Snell, G.D. (1966). Reproduction. In Biology 0/ the Laboratory Mouse (Ed.:E.L. Green). McGraw-Hill Book Co., New York. pp. 1 87-204
References 138
BRUCE. N.W. ( 1976) The distribution of blood flow to the reproductive organs of rats near term. JournaL oj Reproduction and Fertility, 46: 359-362
BRUCE, N.W. and Abdul-Karim, R.W. (1973) Relationships between fetal weight, placental weight and maternal placental circulation in the rabbit at different stages of gestation. Journal oj Reproduction and Fertility, 32: 15-24
BRUCE, N.W. and Norman, N. ( 1975) Influence of sexual dimorphism on foetal and placental weights in the rat. Nature, 257: 62-63
BRUCE, N.W. and Wellstead, l.R. (1992) Spacing of fetuses and local competition in strains of mice with large , medium and small litters. Journal of Reproduction and Fertility, 95: 783-789
BRUMBY, P.J. ( 1960) The influence of the maternal environment on growth in mice. Heredity, 14: 1-18
BUTCHER, R.L., Barley, D.A., and Inskeep, E.K. ( 1969) Local relationship between the ovary and uterus of rats and guinea pigs. Endocrinology. 84: 476-481
BUTIERSTEh'l, G.M. and Hirst, l.A. ( 1977) Serum progesterone and fetal morphology following ovariectomy and adrenalectomy in the pregnant rat. Biology of Reproduction. 16: 654-660
BUTTLE, H. (1988) Role of the ovaries in inducing mammogenesls 10 pregnant pigs. Journal of Endocrinology, 118: 4 1-45
CAVAILLE, F. and Maltier, J.P. ( 1978) A local signal from the gravid hom to the ovary for the onset of parturition in rats. Journal oj Reproduction and Fertility, 54: 227-231
CERRUTI, R.A. and Lyons, W.R. (1960) Manunogenic activities of the mid-gestational mouse placenta. Endocrinology, 67: 884-887
CHAMPLIN', A.K. (1977) Strain differences in oestrous cycle and mating frequencies after centrally produced anosmia in mice. Biology oj Reproduction, 16: 5 13-516
CHEEK, D.B. and Holt, A.B. ( 1963) Growth and body composition of the mouse. American Journal oj Physiology, 205: 913-918
CHOUDARY, l.B. and Greenwald, G.S. ( 1969) Ovarian activity in the intact or hypophysectomyzed pregnant mouse. Anatomical Record. 163: 359-372
CHRISTIAN, R.M., Yuan. L., and Rothchild, L ( 1968) The effect of hysterectomy on parameters of luteinizing hormone secretion in pseudopregnant rats. Acta Endocrinologica, 58: 57-66
CLAPP, J.F. 1989. Utero-placental blood flow and fetal growth. In Fetal Growth (Eds.: F.Sharp. R.B. Fraser, and R.D.G. Milner). Springer-Verlag, London. pp.235-244
References 139
COCKBURN (1989) Fetal growth: An overview. In Fetal Growth (Eds.: F.Sharp, R.B. Fraser, and R.D.G. Milner). Springer�Verlag, London. pp.133-138
COWIE, A.T. (1984) Lactation. In Honnonal Control of Reproduction. (Eds.: C.R. Austin and R.Y. Short). Cambridge University Press, Cambridge. pp. 195�231
COWIE, A.T. and Tindal, 1.S. (197 1) Milk secretion. In Physiology of Lactarion (Eds: A.T. Cowie and 1.S. Tindal). Edward Arnold, London. pp. 137-184
CRITSER, E.S., Rutledge, 1.1. and French, L.R. ( 1980) Role of the uterus and the conceptus in regulating luteal lifespan in the mouse. Biology of Reproduction, 23: 558-563
CRITSER, E.S., Savage, P.1., Rutledge, 1.1., and French, L.R. ( 1982) Plasma concentrations of progesterone and 13,14�dihydro�1 5�keto prostaglandin F2a in pregnant, pseudopregnant and hysterectomyzed pseudopregnant mice. Journal of Reproduction and Fertility, 64: 79�83
CROMBIE. D.L., Hayes. 1.S .• Heap, R.B . • and Wang, M-W. (1995) Anti�progesterone effects on maternal recognition and behaviour imprinted during first pregnancy in mice. Journal of Endocrinology, 147: 33 1-337
CSAPO, A.I. and Wiest. W.G. ( 1969) An examination of the quantitative relationship between progesterone and the maintenance of pregnancy. EndocrinoLogy, 85: 735� 746
CURRIE, W.B. and Thornbum·, G.D. (1974) Luteal function in hysterectomized goats. Journal of Reproduction and Fertility, 41: 501-504
DAWES, G.S. (1968) Foetal and Neonatal Physiology: A Comparative Study of the Changes ar Birth. Year Book Medical Pub., Inc. Chicago. pp. 42-59 (p247)
DAWES, G.S. (1976) The physiological determinants of fetal growth. Journal of Reproduction and Fertility, 47: 183-187
DEANE, H.W., Rubin, B.L., Driks, E.c., Lobel, B.L., and Leipsner, G. ( 1962) Trophoblastic giant cells in placentas of rats and mice and their probable role in steroid-hormone production. Endocrinology, 70: 407-419
DEANESLY, R. (1971) The effects of corpora lutea removal by unilateral ovariectomy in the pregnant guinea-pig. Journal of Reproduction and Fertility 26, 39 1-392
DEM'ESLY, R. ( 1973) Termination of early pregnancy in rats after ovariectomy is due to irrunediate collapse of the progesterone-dependent decidua. JoumaL of Reproduction and Fertiliry, 35: 183-186
DELCAI.'vIPO, c.H. and Ginther. OJ. ( 1972) Vascular anatomy of the uterus and ovaries and the unilateral luteolytic effect of the uterus: guinea pigs, rats, hamsters, and rabbits. American Journal o/Veterinary Research, 33: 2561-2578
r I
References 140
DEWAR, A.D. ( 1 973) Effects of hysterectomy on corpus luteum activity in the cyclic, pseudopregnant and pregnant mouse. loumal of Reproduction and Fertility, 33: 77-89
DEWAR, A.D. ( 1 968) Litter size and the duration of pregnancy in mice. Quarterly Journal of Experimental Physiology, 53: 155-161
DORFMAN, R.I. ( 1 973) Biosynthesis of progesterone. In Handbook of Physiology, Section 7, Vol II (Eds.: R.O. Greep and E.B. Astwood). American Physiological Society. Washington. pp. 537-546
DWYER, C.M .. Madgwick, A.l.A., Crook, A.R. and Stickland, N.C. (1992) The effect of maternal undernutrition on the growth and development of the guinea pig placenta. Journal of Developmental Physiology, 18: 295-302
DZIUK, P.J. (1968) Effect of number of embryos and uterine space on embryo survival in the pig. Journal of Animal Science, 27: 673
ECKSTEIN, P. and McKeown, T. ( 1955a) The influence of maternal age, parity and weight on litter size in the guinea-pig. Journal of Endocrinology, 12: 1 15-1 19
ECKSTEIN, P. and McKeown, T. (1955b) Effect of transection of one horn of the guineapig's uterus on foetal growth in the other horn. Journal of Endocrinology, 12: 97-lO7
ECKSTEIN, P., McKeown, T., and Record, R.G. ( 1 955) Variation in placental weight according to litter size in the guinea-pig. Journal of Endocrinology, 12: 108- 1 14
EDWARDS, C. and Milligan, S.R. (1987) Uterine blood flow during the development and regression of the decidual cell reaction in ovariectomized, steroid-treated mice. EISEN, E.J. ( 1 976) Results of growth curve analyses in mice and rats. Journal of Animal Science, 42: 1008-1023
EL OKSH, H.A., Sutherland, T.M., and Williams, j.S. ( 1967) Prenatal and postnatal maternal influence on growth in mice. Genetics, 57: 79·94
ELBAUM, D.l., Bender, E.M., Brown, 1.M., and Keyes, P.L. (1975) Serum progesterone in pregnant rats with ectopic or in situ corpora lutea: correlation between amount of luteal tissue and progesterone concentration. Biology of Reproduction, 13: 541-545
EENDO, H., Yamaguchi, M., Fransworth, R., Thordarson, G., Ogren, L., Alonso, F.l . , Sakata, M. , Hirota, K., and Talamantes, F. ( 1994) Mouse placental cells secrete immunoreactive growth honnone-releasing factor. Biology of Reproduction, 51: 1206-1212
EVEN, M.D .. Laughlin. M.H., Krause, G.F. and yom Saal, F.S. ( 1994) Differences in blood flow to uterine segments and placentae in relation to sex, intrauterine location and side in pregnant rats. loumal of Reproduction and Fertility, 102: 245-252
FEKETE, E. (1941) Histology. In Biology oJ the Laboratory Mouse (Ed.: G.D. Snell). The Blakiston Co .. Philadelphia. pp. 89-167
References 141
FINN, C.A and Martin, L. 1971. The onset of progesterone secretion during pregnancy in the mouse. Journal of Rep rod uti on and Fertility, 25: 299-300
FINN, C.A. and Porter, D.G. 1975. The uterus: Handbooks in reproductive biology, YoU. Elek Science, London. pp. 96-99
FLEMiNG. A. ( 1986) Psychobiology of rat maternal behavior: How and where hormones act to promote maternal behavior at parturition. Annals of the New York Academy o/Sciences, 474: 234-251
FOWDEN, A.L. (1995) Endocrine regulation of fetal growth. Reproduction, Fertility and Development, 7: 351-363
GALOSY, S.S. and Talamantes, F. (1995) Luteotropic actions of placental lactogens at midpregnancy in the mouse. Endocrinology, 136: 3993-4003
GANDELMAN. R. ( 1 973) Maternal behavior in the mouse: Effect of estrogen and progesterone. Physiology and Behaviour, 10: 153-155
GANDELMAN, R. and Svare, B. ( 1975) Lactating following hysterectomy of pregnant mice. Biology of Reproduction, 12: 360-367
GANDELMAN, R., Zarrow, M.X., and Denenberg, V.H. (1970) Maternal behavior: differences between mother and virgin mice as a function of the testing procedure. Development and Phsycobiology, 3: 207-214
GARRIS, D.R. (1983) Regional variations in guinea pig uterine blood flow during pregnancy: Relationship to intrauterine growth of the fetal-placental unit. Teratology, 27: 101- 107
GARRIS, D.R. (1 984) Intrauterine growth of the guinea pig fetal-placental unit throughout pregnancy: regulation by utero-placental blood flow. Teratology, 29: 93-99
GARRIS, D.R. and Dar, M.S. (1985) Decidua-associated changes in guinea pig uterine blood flow and volume: relation to norepinephrine concentration. Anatomical Record, 211: 410-413
GARRIS, D.R. and Whitehead, D.S. (1981) Uterine blood flow and timing in blastocyst implantation in the guinea pig. American JournaL of Physiology, 241: E142-E145
GmORI, G. (1993) The corpus luteum of pregnancy. In The Ovary (Eds.: E.Y. Adashi and P.C.K. Leung). Raven Press, New York. pp. 261-3 1 7
GIBSON, W.R., Ingram. B.W., and Lee, V.W.K. ( 1979) Can reduced consumption of gonadotrophins account for ovarian compensation in unilaterally ovariectomized immature mice injected whith gonadotrophins? Jounwl of Reproductioll and Fmility, 57: 209-218
References
, \ ' , , � .. " . . .. , "
142
OOSDEN, R.O. , Telfer, E., Faddy, M.J., and Brook, DJ. ( 1989) Ovarian cyclicity and follicular recruitment in unilaterally ovariectomized mice. Journal of Reproduction and Fertility, 87: 257-264
GROTA, L.1. and Eik-Nes, K.B. (1967) Plasma progesterone concentrations during pregnancy and lactation in the rat. Journal of Reproduction and Fertility, 13: 83-91
ORUNEBERG, H. ( 1952) The Genetics ojche Mouse. Martinus Nijhoff, The Hague. pp. 6-24
HAFEZ, E.S.E. (1 963) Symposium on growth: Physiogenetics of prenatal and postnatal growth. Journal of Animal Science, 22: 779-791
HALL, K. (1957) The effect of relaxin extracts, progesterone and oestradiol on maintenance of pregnancy, parturition and rearing of young after ovariectomy in mice. Journal of Endocrinology, 15: 108- 1 17
HAMMOND, 1. (1934) The fertilisation of rabbit ova in relation to time. Journal of Experimental Biology, 11: 140-161
HANSEL, W . , Concannon, P.W., and Lukaszewska, 1.H. ( 1 973) Corpora lutea of the large domestic animals. Biology oj Reproduction, 8: 222-245
HANSEL, W. and Dowd, J.P. (1986) New concepts of the control of corpus luteum function. Journal oj Reproduction and Fertiliry, 78: 755-768
HARDING, J.E. and Johnson, " B .M. (1995) Nutrition and fetal growth. Reproduction, Fertility and Development, 7: 539-547
HARKNESS, R.A, McLaren, A., and Roy, E.1. (1964) Oestrogens in mouse placentae. Journal of Reproduction and Fertility, 8: 41 1-413
HASHIMA, H. (1956) Studies on the prenatal growth of the mouse with special reference to the site of implantation of the embryo. Tohoku Journal of Agricultural Research, 6: 307-312
HAUSER, H. and Gandelman, R. (1985) Lever pressing for pups: evidence for honnonal influence upon maternal behavior of mice. Hormones and Behavior, 19: 454-468
HAUSLER, C.L. and Malven, P.Y. (1971) Interaction between prolactin, LH, neurohypophysial hOlTIlones and hysterectomy on luteal function in rats. Biology of Reproduction, 5: 262-269
HEALY, M.1.R. (1960) Foetal growth in the mouse. Proceeding of Royal Society London, 153: 367-379
HEAP, R.B. and Deanesly, R. ( 1 966) Progesterone in systemic blood and placentae of intact and ovariectomized pregnant guinea-pigs. Joumal of Endocrinology, 34: 417-423
References
, \ ' .. , " . , : - . ,
143
HEAP, R.B, and Flint, A.P.F. ( 1984) Pregnancy. In Honllollal Control of Reproduction (Eds.: C.R, Austin and R. V. Short). Cambridge University Press, Cambridge. pp. 153-194
HEAP, R.B., Perry, J.S., and Challis, J.R.G. ( 1973) Hormonal maintenance of pregnancy. In Handbook of Physiology, Section 7, Vol II (Eds.: R.O. Greep and E.B. Astwood). American Physiological Society. Washington. pp, 217-260
HEAP, R.B., Perry, 1.S., and Rowlands, LW. (1967) Corpus luteum function in the guinea-pig; arterial and luteal progesterone levels, and the effects of hysterectomy and hypophysectomy. lOllmal of Reproduction and Fertility, 13: 537-553
HEBEL, R. and Stromberg, M.W. ( 1986). Anatomy alld Embryology of the Laboratory Rat, BioMed Verlag. Worthsee. pp, 1 17·123
HlLLIARD. 1. (1973) Corpus luteum function in guinea pigs, hamster, rats, mice and rabbits, Biology of Reproduction, 8: 203-221
HOFFMANN. B. , Hoveler, R., Hasan. S.H., and Failing, K. (1992) Ovarian and pituitary function in dogs after hysterectomy. Joumof of Reproduction and Fertility, 96:
837-845
HOUNK..<\, CF., Tseng, Y.c., and Finch, C.E. ( 1978) Prolonged gestation, elevated prepanuritional plasma progesteron and reproductive aging in C57BU6J mice. Biology of Reproduction, 19: 807-8 16
HUGGElT, A.S.G., and Hammond. J. ( 1964) Physiology of the placenta. In MarshaL/'s Physiology of Reproduction, Vol II (Ed.: A.S. Parkes). Longmans, Green and Co. Ltd., London. pp. 3 12-397
HUMMEL, K.P., Richardson, F.L. and Fekete, E. ( 1966). Anatomy. In Biology of the lLlboratory MOtlse (Ed.: E.L. Green). McGraw·Hill Book Co., New York. pp. 247-307
HUMPHREYS, E.M., Ghione, R . . Oosden, RG., Hudson, B.M., and Wide, L. ( 1985) Relationship between corpora lutea or feral number and plasma concentration of progesterone and testosterone in mice, Journal of Reproduction and Fertility, 75: 7-15
JAITLY, K.D., Robson, J.N., Sullivan, F.M., and Wilson, C. (1966) Hormonal requirement for the maintenance of gestation in hypophysectomized mice. Joumal of Endocrinology. 34: iv
JOHNSON. M,H. and Everitt, B.J. (1995) Essential Reproduction. 41hed. Blackwell Science Ltd. Oxford. pp. 25-44. 60-78: 309-335
JOHNSON. D.R. ( 197 1 ) Genes and genotypes affecting embryonic fluid relations in the mouse. Genetical Research, Cambridge, 18: 7 1 -79
JOH:\SON, M.R., Abbas, A. and Nicolaides. K.H. (1994) Maternal plasma levels of human chorionic gonadotrophin. oestradiol and progesterone in multife[al
. . ' .' . .. � "f . " '
References 144
pregnacies before and after fetal reduction. JoumaL of Endocrinology 143, 309-312
lJONES, e.T. (1976) Fetal metabolism and fetal growth. JournaL of Reproduction and Fertility. 47: 189-201
JONES, S.M, and Rose, R.W. ( 1 992) Plasma progesterone levels in the pregnant ratkangaroo (Bettongia gaimardi). General and Comparative Endocrinology, 87: 178-182
KA TO, H" Morishige, W.K., and Rothchild, 1. (1979) A quantitative relation between the experimentally detennined number of conceptuses and corpus luteum activity in the pregnant rat. Endocrinology, 105: 846-850
KELLEY, H,E. and Brinkley, H.J. (1971) Effect of hysterectomy on luteinizing hormoneinduced corpora lutea of pseudopregnant rabbits. Biology of Reproduction, S: 1-4
KELLEY, P.A., Shiu, R.P.e., Robertson, M.e., and Friesen, H.G. ( 1975) Characterization of rat chorionic mammotropin, Endocrinology, 96: 1 187-1195
KENSINGER, R.S., Collier, R.J., Bazer, F.w., and Kraeling, R.R. ( 1986) Effect of number of conceptuses on maternal hormone concentrations in the pig. Journal of Animal Science, 62: 1 666-1674
KlHLSTROM, lE. ( 1972) Period of gestation and body weight in some placental mammals, Comparative Biochemistry & Physiology, 43A: 673-679
KNIGHT, J.W., Bazer, F.W., and Wallace, H.D. ( 1973) Effects of superovulation and unilateral ovariectomy-hysterectomy on porcine uterine protein secretions, Journal of Animal Science, 36: 61-65
KNIGHT, J.W., Bazer, F.W., Thatcher, W.W., Franke, D.E., and Wallace, H.D. ( 1977) Conceptus development in intact and unilaterally hysterectomized-ovariectomized gilts: Interrelations among honnonal status. placental development, fetal fluids and fetal growth, Journal of Animal Science, 44: 620-637
KOHMOTO, K. and Bern, H,A, (1970) Demonstration of mammotrophic activity of the mouse placenta in organ culture and by transplantation, ]01l17W! of Endocrinology, 48: 99-107
LABHSETW AR, A.P. (1967) Hysterectomy and hypophysial FSH and LH levels in the rat. Journal of Reproduction and Fertility, 13: 169-171
LEAVIIT, W.W. and Blaha, G.c. ( 1 970) Circulating progesterone levels in the golden hamster during tbe estrous cycle. pregnancy, and lactation. Biology of Reproduction, 3: 353-361
LTNZELL, J.L. and Heap, R.B, ( 1968) A comparison of progesterone metabolism in the pregnant sheep and goat: sources of production and an estimation of uptake by some target organs. Journal oj Endocrinology, 41: 433-438
References 145
LISK, R.D., Pretlow, R.A, and Friedman, S.M. ( 1969) Hormonal stimulation necessary for elicitation of maternal nest·building in the mouse (Mus musculus). Animal Behaviour, 17: 730-737
LUKASZEWSKA, J., Wilson, L., and Hansel, W. ( 1972) Luteotropic and luteolytic effects of prostaglandins in the hamster. Proceedings of the Society for Experimental Biology and Medicine, 40: 1302·1307
MACDONALD, G.l. (1978) Factors involved in maintenance of pregnancy in the rat. The temporal need for estrogen, pituitary prolactin and the ovary. Biology of Reproduction, 19: 8 17-823
MACDONALD, GJ. and Matt, D.W. ( 1984) Adrenal and placental steroid secretion during pregnancy in the rat. Endocrinology, 114: 2068·2073
MACDONALD, GJ., Tashjian, A.H. and Greep, R.O. (1970) Influence of exogenous gonadO(ropins, antibody formation, and hysterectomy on the duration of luteal func· tion in hypophysectomized rats. Biology of Reproduction, 2: 202-208
MAKOWSKI, E.L. (1977) Vascular physiology. In BioLogy of the Uterus (Ed.: R.M . Wynn). New York, Plenum Press. pp. 77·100
MALISON, J.A., Swanson, P. and French, L.R. (1982) Effects of the uterus and midpregnancy conceptus on luteal lifespan of the rat. Journal of Reproduction and Fertility, 64: 25-32
MALVEN, P.V., Hansel, W. and Sawyer, C.H. ( 1967). A mechanism the luteotrophic action of exogenous prolactin in the rat. Journal of Reproduction and Fertility, 13:
205-212
MARTIN, L., Finn, c.A. and Carter, J. (1970) Effects of progesterone and oestradiol·17p on the luminal epithelium of the mouse uterus. Journal of Reproduction and Fertility, 21: 461-469
MARTIN, P.A., Bevier, G.W., and Dziuk, PJ. ( 1977) The effect of number of corpora lutea on the length of gestation in pigs. Biology of Reproduction, 16: 633-637
MARTIN, P.A., Bevier, G.W., and Dziuk, PJ. (1978) The effect of disconnecting the uterus and ovary on the length of gestation in the pig. Biology of Reproduction, 18: 428-433
MASUDA, H., Anderson. L.L.. and Henricks. D.M. ( 1967) Progesterone in ovarian venous plasma and corpora lutea of the pig. Endocrinology, 80: 240-246
MATI, D.W. and Macdonald, GJ. ( 1984) In vitro progesterone and testosterone production by the rat placen:a during pregnancy. Endocrinology. 115: 741-747
MAUVAIS-JARVIS, P. (1983). Progesterone and progestine: A general overview. In Progesterone and Progestil1s (Eds. : C.W. Bardin, E. Milgrom, and P. Mauvais· Jarvis). Raven Press, New York. pp.I- 16
I I
References 146
MCCARTHY, J.e. (1967) Effects of litter size and maternal weighl on foelal and placental weight in mice. Journal of Reproduction alld Fertility, 14: 507-510
MCCARTHY, J.e. (1965) Genetic and environmental control of foetal and placental growth in the mouse. Animal Production, 7: 347-361
MCCORMACK, J.T. and Greenwald, G.S. (1974a) Progesterone and oestradiol-17P concentrations in the peripheral plasma during pregnancy in the mouse. Journal of Endocrinology, 62: 101-107
MCCORMACK, 1.T. and Greenwald, G.S. ( l974b) Evidence for a preimplantation rise in oestradiol-17P levels on day 4 of pregnancy in the mouse. Journal of Reproduction and Fertilicy, 41 : 297-301
MCKEOWN, T. and Record, R.G. (1953) The influence of placental size on fetal growth according to sex and order of birth. Journal of Endocrinology, 10: 73-81
MCKEOWN, T., Marshall, T., and Record, R.G. (1976) Influences on fetal growth. Journal oj Reproduction and Fertility. 47: 167-181
MCLAREN, A. ( 1963) Mechanism of ovarian compensation following unilateral ovariectomy. Journal oj Reproduction and Fertility, 6: 321-322
MCLAREN, A. ( t 965) Genetic and environmental effects on foetal and placental growth in mice. Journal of Reproduction alld Fertility, 9: 79-98
McLAREN, A. ( 1967) Effect of foetal mass on gestation period in mice. Journal of Reproduction and Fertility, 13: 349-351
MCLAREN, A. and Michie, D. ( 1960). Control of pre-natal growth in mammals. Nature. 187: 363-365
MCLAREN, A. and Michie, D. (1963). Nature of the systemic effect of litter size on gestation period in mice. Journal of Reproduction and Fertility, 6: 139-141
McLAREN, A., Renfree, M.B., and Hensleigh, H.C. ( 1976) Influence of conceptus number and weight on the amount of foetal fluid in the mouse. Journal of Embryology and Experimental Morphology, 35: 191-196
MELAMPY, R.L., Anderson, L.L. and Kragt, C.L. (1964). Uterus and life span of rat corpora lurea. Endocrinology, 74: 501 -504
METCALF, M.G., Braiden, V. and Livesey, 1.R. (1992) Retention of normal ovarian function after hysterectomy. Joumal of Endocrinology, 135: 597-602
MICHAEL, S.D., Geschwind, 1.1., Bradford, G.E., and Stabenfeldt, G.H. (1975) Pregnancy in mice selected for small liner size. Reproductive hormone levels and effect of exogenous hormones. Biology oj Reproduction, 12: 400-407

References 147
MOOR, R.M., Hay, M.F., Short, R.V., and Rowson, L.E.A. ( 1970) The corpus luteum of [he sheep: Effect of uterine removal during Imeal regression. Journal of Reproduction and Fertility, 21: 319-326
MOORE, R.W., Eisen, E.J., and Vlberg, L.C. (1970) Prenatal and postnatal maternal influences on growth in mice selected for body weight. Genetics, 64: 59-68
MORISHIGE, W.K., Pepe, G.J., and Rotchild, I. ( 1973) Serum luteinizing hormone, prolactin and progesterone levels during pregnancy in the rat. Endocrinology, 92:
1527-1530
MURR, S.M., Stabenfeldt, G.H., Bradford, G.E., and Geschwind, I.I. ( 1974) Plasma progesterone during pregnancy in the mouse. Endocrinology, 94: 1209- 1 2 1 1
MURR, S.M., Bradford, G.E. and Geschwind, l.I. (1974) Plasma luteinizing hormone, follicle stimulating hormone and prolactin during pregnancy in the mouse. Endocrinology, 94: 1 12-116
NEIL, J.D., Johanson, E.D.B., and Koobi], E. (1969). Failure of hysterectomy to influence the normal pattern of cyclic progesterone secretion in the rhesus monkey. Endocrinology, 84: 464-465
NELSON, R.E. and Robison, O.W. (1976) Effects of postnatal on liner size on reproduction of female mice. Journal of Animal Science, 42: 824-830
NELSON, S.E., McLean, M.P., Jayalilak, P.G., and Gibori, G. (1992) Isolation, characterizaton, and culture of cell sUbpopulations forming the pregnant rat corpus luteuffi. Endocrinology, 130: 954-966
NISWENDER, G.D. and Nett, T.M. ( 1988) The corpus lmeum and its control. In The Physiology of Reproduction (Eds.: E. Knobil and J.D. Neill). Raven Press, Ltd., New York. pp. 489-525
NORMAN, N.A. and Bruce, N.W. ( 1979a) Fetal and placental weight relationships in the albino rat near term. Teratology, 19: 245-250
NORMAN, N.A. and Bruce, N.W. (1979b) Fetal and placental weight relationships in the rat at days 13 and 17 of gestation. Journal of Reproduction and Fertility, 57: 345-348
NUTI, K.M., Ward, W.F. and Meyer, R.K. ( 1971) Embryonic survival and development in unilaterally ovariectomized rats. Journal of Reproduction and Fertility, 26: 15-24
OGREN, L. and Talamantes, F. (1988) Prolactins of pregnancy and their cellular source. International Review of Cytology, 112: 1-65
OGREN, L., Southard, J.N., Colosi, P., Linzer, D.I.H., and Talamantes, F. (1989) Mouse placental lactogen-I: RIA and gestational profile in maternal serum. Endocrinology, 125: 2253-2257
References 148
OMTVEDT, l.T., Stanislaw, C.M. and Whatley, J.A. (1965) Relationship of gestation length, age, and weight at breeding, and gestation gain to sow productivity at farrowing. Journal oj Animal Science, 24: 531-535
OWENS, l.A. (1991) Endocrine and substrate control of fetal growth: Placental and maternal influences and insulin-like growth factors. Reproduction Fertility and Development, 3: 501-517
PAHL, PJ. (1969) Growth curves for body weight of the laboratory rat. Australian Journal oj Biological Science, 22: 1077·1080
PARK, A.W. and Nowosielski-Slepowron, B.AJ. (1971) The effects of litter size on rat body growth. Acta AnalOmica, 79: 15-26
PAYNE, 0.5. and Deuchar, E.M. (1972) An in vitro study of functions of embryonic membranes in the rat. JOllmal of Embryology and Experimental Morphology, 27: 533- 542
PEDERSEN, c.A. (1987) Maternal behaviour: Principles and findings. Neuroendocrinology LelCers, 9: 162
PEPE, G.l. and Rothchild, 1 . (1973) Serum progesterone levels in ovariectomized rats injected with progesterone and estrone: relation to pregnancy maintenance and growth of decidual tissue. Endocrinology, 93: 1 193-1199
PEPE, G. and Rothchild, 1. (1974) A comparative study of serum progesterone levels in pregnancy and in various types of pseudopregnancy in tbe rat. Endocrinology, 95: 275-279
PEPPLER, R.D. and Oreendwald, 0.5. (1970) Effect of unilateral ovariectomy on ovulation and cycle length in 4- and 5-day cycling rats. American foumal of Anatomy, 127: 1-8
PERRY, l.S. and Rowlands, loW. (1961) Effect of hysterectomy on the ovarian cycle of the rat. Journal of Reprodllctioll and Fertility, 2: 332-340
RAHlMA, A and Bruce, N.W. (1987) Effects of unilateral ovariectomy before and after maung on growth of corpora lutea and peripheral progestagen concentration in pregnant rats. Biology of Reproductioll, 37: 277-281
RAO, B., Poinlis, G., and Cedard, L (1982) Presence of a cborionic gonadotrophin-like factor in mouse placental cultures during the second half of gestation. Journal of Reproduction and Fertility, 66: 341-348
RAZIANO, J., Ferin, M., Van de Wiele, R.L. (1972) Effects of antibodies to estradiol-17� and to progesterone on nidation and pregnancy in rats. Endocrinology, 90: 1 133-1 1 38
RENFREE, M.B., Hensleigh, H.C., and McLaren, A. (1975) Developmental changes in the composilion and amount of mouse fetal fluids. Journal of Embryology and Experimental Morphology, 32: 435-446
References 149
ROB[NSON, J., Chidzanja, S., Kind, K., Lok, F., Owens, P., and Owens, J. (1995) Placental control of fetal growth. Reproduction, Fertility and Development, 7: 333-344
Ross, M.H. and Beaumont, H.M. (1974) Unilateral ovariectomy during pregnancy in mice. Journal of Reproduction and Fertility, 41: 235-239
ROTHCHILD, I., Billiar, R.B., Kline, LT., and Pepe, G. (1973) The persistence of progesterone secretion in pregnant rats after hypophysectomy: A comparison with pseudopregnant, deciduomata bearing pseudopregnant, and lactating rats. Journal of Endocrinology, 57: 63-74
ROTHCHILD, I. (I983) Role of progesterone in initiating and maintaining pregnancy. In Progesterone and Progestins (Eds.: C.W. Bardin, E. Milgrom, and P. MauvaisJarvis). Raven Press, New York. pp. 2 1 9-229
ROWLANDS, I.W. (1961) Effect of hysterectomy at different stages in the life cycle of the corpus luteum in the guine-pig. Journal of Reproduction and Fertility, 2: 341-350
ROWLANDS, I.W. and Short, RV. (1959) The progesterone content of the guinea-pig corpus luteum during the reproductive cycle and after hysterectomy. JOllnTnl of Endocrinology, 19: 81-86
ROWLANDS, I.W. (1962) The effect of oestrogens, prolactin and hypophysectomy on the corpora lutea and vagina of hysterectomyzed guinea-pigs. Journal of Endocrinology, 24: 105- 1 1 2
RUGH, R. (1967). The mouse, its reproduction and development. Burgess Pub. Co., Minneapolis. pp. 1-6; 7-43
RYAN, KT. (1973) Steroid hormones in marrunalian pregnancy. In Handbook of Physiology, Vol. II, Sect. 7. (Eds.: R.O. Greep and E.B. Astwood). American Physiological Society, Washington. pp. 285-293
SALOMON, D.S. and Sherman, M.1. (1975) The biosynthesis of progesterone by cultured mouse midgestation trophoblast cells. Developmental Biology, 47: 394-406
SANY AL, M.K. and Villee, C.A. (1973) Production and physiologic effects of progesterone metabolites in pregnant and pseudopregnant rats. Endocrinology, 92:
83-93
SAYLER. A. and Salmon, M. (1971) An ethological analysis of communal nursing by the house mouse (Mus musculus). Behaviour, 40: 62-85
SIEGEL, H.I. (1986) Abnormal basis of maternal behavior in the rat. Annals of the New York Academy of Sciences,474: 203-21 5
SIMMER. H. ( 1968) Placental hormone. In Biology ofGesrarion Vol. I (Ed.: N.S. Assali). Academic Press. New York. pp. 290-354
�' I
References
, " . . ,t! , • �� , ;;::)� ::.,. :;l •. : . "
150
SINHA, Y.N., Selby, F.W., and Vanderlaan, W.P. (1974) Relationship of prolactin and growth hormone to mammary functions during pregnancy and lactation in the C3H!St mouse. ioltmal of Endocrinology, 61: 219-229
SNELL, G.D. (1941). Reproduction. In Biology of the Laboratory Mouse (Ed.: G . D . Snell). The Blakiston Co., Philadelphia. pp. 55-88
SNOW, M.H.L. ( 1989) Effect of genom on size at birth. In Fetal Growrh (Eds.: F.Sharp, R.B. Fraser, and R.D.G. Milner). Springer-Verlag, London. pp.3-13
SOARES, M.1. and Talamantes, F. (1983) Genetic and litter size effects on serum placental lactogen in the mouse. Biology of Reproduction, 29: 165-171
SOARES, MJ., Colosi, 0., and Talamantes, F. (1982) Development and characterization of a homologous radioinununoassay for mouse placental lactogen. Endocrinology, 110: 668-670
SOUTHEE, l.A., Hunter, M.G., Law, A.S. and Haresign, W. (1988) Effect of hysterectomy on the short life-cycle corpus luteum produced after GnRH-induced ovulation in the anoestrous ewe. iOllnlni of Reproduction alld Fertility, 84: 149-155
THORBURN, G.D. (1991) The placenta, prostaglandins and parturition: a review. Reproduction, Fertility and Development, 3: 277-294
TLVlSON, B.F. and Dudenhoeffer, G.A (1985) Effect of increased growth rate during the suckling period on subsequent body weight and muscle weight to body weight ratio. Growth, 49: 455-469
VIRGO, B.B. and Bellward, G.D. (1974) Serum progesterone levels in the pregnant and postpartum laboratory mouse. Endocrinology, 95: 1486-1490
YOM SAAL, F.S. and Dhar, M.G. ( 1992) Blood flow in the uterine loop artery and loop vein is bidirectional in the mouse: lmplicatior.s for transport of steroids between fetuses. Physiology and Behavior, 52: 163-171
WAHLSTEN. D. and Bulman-Fleming, B . (1987) The magnitudes of litter size and sex effects on brain growth ofBALB/c mice. Growth, 51: 240-248
WANG, M-W., Crombie, D.L., Mais, D.E., Hayes, 1.S., and Heap, R.B. ( 1 995) Antiprogesterone antibody administration and the impainnent of postpartum maternal care in mice. Journal of Endocrinology, 145: 363-369
WANG, M-W., Heap, R.B., and Taussig, M.l. ( 1992) Abnormal maternal behaviour in mice previously immunized against progesterone. Joumal of Endocrinology, 134: 257-267
WANG. S . . Counterman, L.1 .. and Haslam. S.Z. ( l990) Progesterone action in normal mouse mammary gland. Endocrinology, 127: 2183-2189
.. ' ___________________ IIIIIIl!i1 __
References 1 51
WANG, H.S. and Chard, T. (1991) The role of insulin-like growth factor-I and insulin-like growth factor-binding protein-l in the control of human fetal growth. Journal of Endocrinology, 132: 1 1-19
\VESEL, S.K. and Dziuk, P.l. (1974) Effect of stage of gestation and uterine space on prenatal survival in the pig. Journal of Animal Science, 38: 960-963
WEBEL. S.K., Reimers, T.l., and Dziuk, PJ. ( 1975) The lack of relationship between plasma progetsterone levels and number of embryos and their survival in the pig. Biology 0/ Reproduction, )3: 177-186
WEEMS. C.W . . Vincent. D.L. and Weems. Y.S. (1992) Roles of prostaglandins (PG) F2a_ E 1 . E2, adenosine, oestradiol-17P, histone-H2A and progesterone of conceptus. uterine or ovarian origin during early and mid pregnancy in the ewe. Reproduction, Fertility and Developemnt, 4: 289-295
WIDDOWSON, E.M. (1981) The role of nutrition in manunalian reproduction. In Environmental Factors in Mammals Reproduction (Eds.: D. Gilmore and B . Cook). MacMillan Publisher. Ltd., London. pp. 145-159
WIDDOWSON, E.M. 1968. Growth and composition of the fetus and new born. In Biology of Gestation Vol. II : The Fetus and Neonate (Ed.: N.S. Assali). Academic Press, New York. pp. 1-49
WIDE, L. and Wide, M. ( 1 979) Chorionic gonadotrophin in the mouse from implantation to term. Journal of Reproduction and Fertility, 57: 5-9
WRlGHT, L.l., Feinstein, A., Heap, R.B., Saunders, le., Bennett, R.C., and Wang, M.Y. (1982) Progesterone monoclonal antibody blocks pregnancy in mice. Narure. 295: 4 1 5-417
YAMAGUCHI. M .. Ogren. L.. Endo, H . • Soares. MJ . • and Talamantes, F. (1994) Colocalization of placental lactogen-I, placental lactogen-II, and proliferin in the mouse placenta at mid pregnancy. Biology oj Reproduction, 51: 1 1 88-1192
YAMAGUCHI. M .. Tasaka. K.. Ogura. K.. Sakata. M . • Mizuki. 1.. and Miyake. A. ( 1995) Activin inhibits but inhibin activates mouse placental lactogen-IT secretion. Journal of Endocrinology. 146: 469-474
ZARROW, M.X., Gandelman, R. and Denenberg, V.H. (1971) Prolactin: Is it an essential hormone for maternal behavior in the mammal? Honnone and Behaviour, 2: 343-354