Embed Size (px)
Citation preview
Utah State UniversityDigitalCommons@USU
All Graduate Theses and Dissertations Graduate Studies
5-2010
Effects of Underwater Treadmill Exercise onMobility of People with Knee OsteoarthritisJaimie RoperUtah State University
Follow this and additional works at: https://digitalcommons.usu.edu/etd
Part of the Rehabilitation and Therapy Commons
This Thesis is brought to you for free and open access by the GraduateStudies at DigitalCommons@USU. It has been accepted for inclusion in AllGraduate Theses and Dissertations by an authorized administrator ofDigitalCommons@USU. For more information, please [email protected].
Recommended CitationRoper, Jaimie, "Effects of Underwater Treadmill Exercise on Mobility of People with Knee Osteoarthritis" (2010). All Graduate Thesesand Dissertations. 686.https://digitalcommons.usu.edu/etd/686
EFFECTS OF UNDERWATER TREADMILL EXERCISE ON MOBILITY OF
PEOPLE WITH KNEE OSTEOARTHRITIS
by
Jaimie Roper
A thesis submitted in partial fulfillment
of the requirements for the degree
of
MASTER OF SCIENCE
in
Health and Human Movement
Approved:
________________________________ ________________________________
Eadric Bressel, Ph.D Brian Larsen DPT, MS
Major Professor Committee Member
________________________________ ________________________________
Gerald Smith, Ph.D Edward M. Heath, Ph.D
Committee Member Committee Member
________________________________
Byron R. Burnham
Dean of Graduate Studies
UTAH STATE UNIVERSITY
Logan, Utah
2010

ii
Copyright © Jaimie Roper 2010
All Rights Reserved
iii
ABSTRACT
Effects of Aquatic Treadmill Exercise on Mobility of
People with Knee Osteoarthritis
by
Jaimie Roper, Master of Science
Utah State University, 2010
Major Professor: Dr. Eadric Bressel
Department: Health, Physical Education and Recreation
Gait, pain, and self-efficacy alterations in osteoarthritis (OA) patients may be
precursors for pathological alterations and are important variables to examine in an
aquatic therapy study aimed at improving mobility. A greater understanding of these
alterations will be useful for the treatment of OA and the prevention of OA progression.
The purpose of this thesis was twofold: to review the effects of certain land and aquatic
therapies on gait kinematics and mobility of people with osteoarthritis, and to examine
the effects of short-term aquatic treadmill exercise on gait kinematics, perception of
pain, and mobility in OA patients. A direct comparison of water versus land treadmill
exercise was used to determine the acute effectiveness of aquatic therapy on gait
kinematics, pain, and self-efficacy. Fourteen participants diagnosed with osteoarthritis
of the knee performed three consecutive exercise sessions for each mode of exercise.
Gait kinematics, pain, and self-efficacy were measured before and after each
intervention. Angular velocity gain score during stance for left knee extension was
iv
significantly higher for aquatic treadmill exercise compared to land treadmill exercise by
38.1% (p = 0.004). Similarly, during swing, the gain scores for angular velocity were
also greater for left knee internal rotation and extension by 65% and 20%, respectively (p
= 0.004, p = 0.008). During stance, the joint angle gain score for left hip flexion was
greater for land exercise by 7.23% (p = 0.007). Similarly, during swing, the angular
velocity gain score for right hip extension was significantly greater for aquatic exercise
by 28% (p = 0.01). Only the joint angle gain score for left ankle abduction during stance
was significantly higher for land exercise by 4.72% (p = 0.003). No other joint angle
gain scores for either stance or swing were significantly different for either aquatic or
land treadmill exercise (p = 0.06-0.96). Perceived pain was 100% greater for land than
aquatic treadmill exercise (p = 0.02) and self-efficacy gain scores were not different
between conditions (p = 0.37). The present study demonstrated that an acute training
period on an aquatic treadmill did influence joint angular velocity and arthritis-related
joint pain. Although acute effects of training (i.e., pain, angular velocity) improve after
aquatic rather than land training, it is unclear whether or not aquatic exercise is a better
long-term alternative to land exercise, and further longitudinal research is needed to
examine gait kinematic changes after an increased training period of aquatic exercise.
(111 pages)
v
ACKNOWLEDGMENTS
This study was supported by a grant from the National Swimming Pool
Foundation.
I am very thankful to my supervisor, Dr. Eadric Bressel, whose
encouragement, guidance, and support from the beginning enabled me to improve my
understanding of research in biomechanics. I would like to thank my committee
members, Drs. Gerald Smith, Edward Heath, and Brian T. Larsen (DPT), for their
support and assistance throughout this entire process.
I offer special thanks to my husband, family and friends for their patience,
encouragement, and moral support from the initial proposal writing to this final
document. I appreciate all of your kind thoughts and helpfulness along this journey.
Jaimie Roper
vi
CONTENTS
Page
ABSTRACT ....................................................................................................................... iii
ACKNOWLEDGMENTS ...................................................................................................v
LIST OF TABLES ........................................................................................................... viii
LIST OF FIGURES .............................................................................................................x
CHAPTER
1. INTRODUCTON .........................................................................................1
Purpose Statement ............................................................................5
Hypothesis........................................................................................5
Author Contribution .........................................................................6
Glossary of Terms ............................................................................6
2. REVIEW ARTICLE ....................................................................................8
Abstract ............................................................................................8
Introduction ......................................................................................9
Methods..........................................................................................11
Conclusion .....................................................................................24
3. EXPERIMENTAL ARTICLE ...................................................................29
Abstract ..........................................................................................29
Introduction ....................................................................................30
Methods..........................................................................................34
Results ............................................................................................40
Discussion ......................................................................................42
Conclusion .....................................................................................47
4. SUMMARY AND CONCLUSIONS ........................................................81
Summary of Review Article ..........................................................81
Summary of Experimental Article .................................................83
Conclusion .....................................................................................86
REFERENCES ..................................................................................................................88

vii
APPENDICES ...................................................................................................................97
Appendix A ...............................................................................................98
Appendix B .............................................................................................100
viii
LIST OF TABLES
Table Page
1 Characteristics of Included Land-based Studies ....................................................26
2 Characteristics of Included Aquatic-based Studies ................................................27
3 Physical Characteristics and Osteoarthritis (OA)
Descriptives for All Participants (n = 14) ..............................................................48
4 Knee Kinematic Variables Significant at the
0.05 Level and the 95% Confidence Interval.........................................................49
5 Ankle Kinematic Variables Significant at the
0.05 Level and the 95% Confidence Interval.........................................................50
6 Hip Kinematic Variables Significant at the
0.05 Level and the 95% Confidence Interval.........................................................52
7 Maximum Joint Angular Velocity (mean ± SD)
for the Stance Phase of Gait ...................................................................................53
8 Minimum Joint Angular Velocity (mean ± SD)
for the Swing Phase of Gait ...................................................................................55
9 Maximum Joint Angular Velocities (mean ± SD)
for the Swing Phase of Gait ...................................................................................57
10 Maximum Joint Angles (mean ± SD)
for the Stance Phase of Gait ...................................................................................59
11 Minimum Joint Angular Velocity (mean ± SD)
for the Stance Phase of Gait ...................................................................................61
12 Maximum Joint Angles (mean ± SD)
for the Swing Phase of Gait ...................................................................................63
13 Minimum Joint Angles (mean ± SD)
for the Stance Phase of Gait ...................................................................................65

ix
14 Minimum Joint Angles (mean ± SD)
for the Swing Phase of Gait ...................................................................................67
15 Self-Efficacy and Pain scores (mean ± SD)
for Aquatic and Land Treadmill Exercise ..............................................................69
16 Step Length and Step Rate Gain Scores (mean ± SD) for the
Right and Left Limbs for Aquatic and Land
Treadmill Exercise .................................................................................................70
x
LIST OF FIGURES
Figure Page
1 Experimental setup for the aquatic
treadmill mode .......................................................................................................71
2 Average walking speeds at different stages
for land and water conditions .................................................................................72
3 Aerial view of experimental setup
for collecting gait kinematic data ...........................................................................73
4 Joint coordinate system used for determining
positive and negative joint angles ..........................................................................74
5 Sagittal plane ankle angle during complete
gait cycle for left limb ...........................................................................................75
6 Sagittal plane knee angle during complete
gait cycle for left limb ............................................................................................76
7 Sagittal plane hip angle during complete
gait cycle for left limb ...........................................................................................77
8 Sagittal plane ankle angular velocity during
complete gait cycle for left limb ............................................................................78
9 Sagittal plane knee angular velocity during
complete gait cycle for left limb ............................................................................79
10 Sagittal plane hip angular velocity during
complete gait cycle for left limb ............................................................................80
CHAPTER 1
INTRODUCTION
Background
Osteoarthritis is a widespread disease and is also the most common form of
arthritis in the elderly (Davis, Ettinger, Neuhaus, & Mallon, 1991; Felson et al., 1987;
Hochberg, 1991). Osteoarthritis (OA) of the hip and knee is often distinguished by pain,
stiffness, and decreased range of motion. People who have OA of the lower extremities
are generally less active and have decreased physical conditioning and function. This
reduction in mobility further decreases one‟s ability to carry out daily activities and
complete regular physical exercise (Kaufman, Hughes, Morrey, Morrey, & An, 2001;
Mangione, Axen, & Haas, 1996).
Clinical OA diagnosis involves joint symptoms and evidence of physical change,
usually demonstrated with the use of a radiograph (Felson & Zhang, 1998). The most
common symptoms include joint pain and stiffness (Arden & Nevitt, 2006). Physical
examination typically reveals bony enlargements, pain upon palpation, and crepitus. Pain
usually increases with weight bearing and physical activity, and improves with rest
(American College of Rheumatology Subcommittee on Osteoarthritis Guidelines, 2000).
Mechanical complications of OA are characterized by joint destruction, loss of cartilage,
osteophytes (bone formation at the joint margins), weakening of muscles (i.e., quadriceps
femoris), and in some cases inflammation
(Hutton, 1989).
2
Along with physical examination and the aforementioned characteristics of OA,
systemic and local risk factors can be used to determine the likeliness one will develop
OA, and have been identified in reviews by Arden and Nevitt (2006) and Felson and
Zhang (1998). Systemic risk factors may increase susceptibility for injury to the joints,
either by directly damaging the tissue(s) or weakening the process of repair in damaged
tissue. Such risk factors include age, gender, hormones, bone density, ethnicity, genetics
and nutrition. Local risk factors are those that involve exposure of specific joints to
injury and excess loading situations that can lead to joint degeneration. Risk factors
include obesity, acute injuries, repetitive loading of the joint, deformity of the joint and
muscle strength and weakness.
Patients with OA are commonly prescribed physical exercise regimens to aid in
maintaining physical activity and daily functions. It has been reported that mechanical
complications due to OA or pain in the lower joints may indirectly decrease walking
capacity (Sutbeyaz, Sezer, Koseoglu, Ibrahimoglu, & Tekin, 2007). Early termination of
exercise programs because of knee pain may prevent individuals from receiving the
beneficial effects of aerobic training. Therefore, exercise programs intended to lessen
knee pain could potentially enable those with OA to execute a longer, more strenuous
workout, resulting in an advanced level of cardiovascular fitness and all of its
subsequent benefits (Mangione et al., 1996).
Aquatic exercises may allow OA patients to engage in longer and more strenuous
workouts as compared to land-based exercises (Hinman, Heywood, & Day, 2007). For
example, patients with OA may have an easier time completing closed-chain exercises in
3
an aquatic environment than on land because joint loading and pain across affected joints
may be less (Barela, Stolf, & Duarte, 2006). Additionally, by adjusting the depth of the
water, the percentage of body weight supported by the lower limbs can be incrementally
decreased, to accommodate a person‟s pain tolerance (Silvers, Rutledge, & Dolny,
2007). Finally, the warmth and pressure of water may assist in decreasing joint swelling
and pain, and allow for easier movement patterns (Hinman et al., 2007).
Research examining the effectiveness of aquatic therapy on mobility is limited in
OA patients. For instance, in a recent review article by Bartels et al. (2007), 30 potential
studies were retrieved, but only six were considered high quality. It was reported that
out of these six, only five examined mobility as a functional outcome measure. Out of
these five studies (Cochrane, Davey, & Matthes Edwards, 2005; Foley, Halbert, Hewitt,
& Crotty, 2003; Patrick et al., 2001; Stener-Victorin, Kruse-Smidje, & Jung, 2004;
Wang, Belza, Thompson, Whitney, & Bennett, 2007; Wyatt, Milam, Manske, & Deere,
2001), mobility was assessed with tests (e.g., 6-min walk test) that estimated
improvements in gait kinematics. While these studies reported improvement in mobility
after aquatic therapy, none examined specific gait kinematic parameters (e.g., step
length, joint angle and velocity). An appreciation for how a therapy affects kinematic
gait parameters may strengthen decisions made in treating those affected with OA and
may assist in selecting appropriate therapies to combat OA symptoms.
Previous research examining the progressive decline of kinematic gait parameters
on land in patients with OA has observed specific changes. Walker, Myles, Nutton, and
Rowe (2001) utilized electrogoniometers to examine the minimum and maximum joint
4
angles of the knee during various functional movements in 50 patients with OA of the
knee and 20 age and gender matched controls. Some of the functional movements
included walking on a level surface, and ascending and descending a slope. The
researchers observed that the OA patients had significantly lower maximum knee
extension angles for all activities and displayed only 70-80% of normal knee flexion
when compared to the control group (p = .004). Their results were supported by
Kaufman et al. (2001) who observed that OA patients walked slower and had 6° less
peak knee motion than normal subjects (p < 0.01). In a review by Messier (1994),
examining the effects of knee OA on gait, the researchers reported decreased knee range
of motion in patients with OA of the knee. These kinematic observations have lead to
the conclusion that changes in knee angle could be a strategy used by OA patients to
reduce joint movement so that less pain is felt during weight bearing activities. These
changes are important to examine because measurements of the mechanics of the disease
are necessary for a greater understanding of the functional affects of treatment(s).
With progressive worsening of OA, changes in gait kinematics are often
accompanied by progressive worsening in pain and perception of mobility. For
example, Astephen, Deluzio, Caldwell, and Dunbar (2008) studied the differences in
self-reported pain and function among three groups: asymptomatic participants and
participants with moderate OA, and severe OA. All scores were higher in the moderate
group than the asymptomatic group, and higher in the severe group than the moderate
group. Similarly, Focht, Rejeski, Ambrosius, Katula, and Messier (2005) observed that
OA patients involved in exercise have a higher self-efficacy for exercise than non-

5
exercising controls. These results indicate that studies examining the effectiveness of
physical therapy treatments for OA patients should include a measure of pain and self-
efficacy.
Purpose
Gait, pain, and self-efficacy alterations in OA patients noted in the previous
literature may be precursors for pathological alterations and would seem to be important
variables to examine in an aquatic therapy study aimed at improving mobility. A greater
understanding of these alterations will be useful for the treatment of OA and the
prevention of OA progression. The purpose of the present study was twofold. The
purpose of the review article was to determine the effects of certain land and aquatic
therapies on gait kinematics and mobility of people with osteoarthritis. The purpose of
the experimental study examined the effects of short-term aquatic treadmill exercise on
gait kinematics and perception of pain and mobility in OA patients.
Hypothesis
For the experimental article of this thesis (Chapter 3), it was hypothesized that
aquatic treadmill walking would elicit similar kinematic responses as land treadmill
walking at the same speed. It was also hypothesized that pain levels would decrease after
the aquatic treadmill intervention.
6
Authorship Contribution
The contributions of authorship for the manuscripts are as follows:
Non-Invasive Treatments of Osteoarthritis and their Effects on Function and Mobility
Roper, J. (90%) Bressel, E. (10%)
The Effects of Aquatic Treadmill Exercise on Mobility of People with Knee
Osteoarthritis
Roper, J. (85%) Bressel, E. (15%)
Glossary of Terms
Osteoarthritis: A progressive disease of the joints caused by ongoing loss of cartilage and
resulting in development of bony spurs and cysts at the joint margin
Aquatic exercise: A physical activity or treatment for an illness or disorder that takes
place while submerged in a body of water
Land-based exercise: A physical activity or treatment for an illness or disorder that takes
place while on land
Function: Characterized by balance, cardiopulmonary fitness, coordination, flexibility,
mobility, muscle performance, neuromuscular control, postural control, postural stability,
equilibrium, and stability.
Mobility: The ability of structures or segments to move or be moved in order to allow the
occurrence of range of motion for functional activities
Kinematics: Branch of biomechanics that describes the motion and spatial position of
objects without consideration of the forces involved
7
Step length: The rectilinear distance (usually measured in meters) between 2 successive
placements of each foot
Step rate: The amount of steps taken in a specific amount of time
Joint angles: The angle between two adjacent body segments
Angular velocity: Angular speed of a rotating joint
Noninvasive: A technique that does not require a participant‟s body to be broken by
incision, or any samples taken
Knee effusion: Excess fluid accumulation in or around the knee joint
8
CHAPTER 2
REVIEW ARTICLE
Noninvasive Treatments of Osteoarthritis and Their Effects on Function and Mobility
Abstract
The purpose of this paper was to review the literature examining noninvasive OA
therapies on kinematics of gait. An appreciation of these findings may help clinicians in
choosing the most efficacious therapy for improving mobility. Studies that utilize land-
based exercises have improved basic function, walking speed, and joint space narrowing.
Unfortunately while these land exercises have presented positive effects, other research
has noted that palpable effusions, (excessive fluid accumulation around or in the knee
joint) increased after training, and suggested the cause may be related to the mechanical
loading of the joint. Aquatic training is an option for decreasing the chances of
developing these effusions. Studies that have used aquatic training have noted
improvements in physical function, mobility, stiffness and pain upon movement. Future
biomechanical research is needed to evaluate benefits to aquatic training to better serve
programs aimed at improving function and mobility for patients with OA.
9
Introduction
Osteoarthritis is a widespread disease and is also the most common form of
arthritis in the elderly (Davis et al., 1991; Felson et al., 1987; Hochberg, 1991).
Osteoarthritis (OA) of the hip and knee is often distinguished by pain, stiffness, and
decreased range of motion. People who have OA of the lower extremities are generally
less active and have decreased physical conditioning and function. This reduction in
mobility further decreases one‟s ability to carry out daily activities and complete regular
physical exercise (Kaufman et al., 2001; Mangione et al., 1996).
Clinical OA diagnosis involves joint symptoms and evidence of physical change,
usually demonstrated with the use of a radiograph (Felson & Zhang, 1998). The most
common symptoms include joint pain and stiffness (Arden & Nevitt, 2006). Physical
examination typically reveals bony enlargements, pain upon palpation, and crepitus. Pain
usually increases with weight bearing and physical activity, and improves with rest
(American College of Rheumatology Subcommittee on Osteoarthritis Guidelines, 2000).
Mechanical complications of OA are characterized by joint destruction, loss of cartilage,
osteophytes (bone formation at the joint margins), weakening of muscles (i.e., quadriceps
femoris), and in some cases inflammation (Hutton, 1989).
Along with physical examination and the aforementioned characteristics of OA,
systemic and local risk factors can be used to determine the likeliness one will develop
OA, and have been identified in reviews (Arden & Nevitt, 2006; Felson & Zhang, 1998).
Systemic risk factors may increase susceptibility for injury to the joints, either by directly
damaging the tissue(s) or weakening the process of repair in damaged tissue. Such risk
10
factors include age, gender, hormones, bone density, ethnicity, genetics and nutrition.
Local risk factors are those that involve exposure of specific joints to injury and excess
loading situations that can lead to joint degeneration. Risk factors include obesity, acute
injuries, repetitive loading of the joint, deformity of the joint and muscle strength and
weakness (Arden & Nevitt, 2006; Felson & Zhang, 1998).
Previous studies have suggested that gait patterns of adults affected by OA are
considerably different when compared to healthy adults (Gyory, Chao, & Stauffer, 1976;
Messier, Loeser, Hoover, Semble, & Wise, 1992; Stauffer, Chao, & Gyory, 1977; Walker
et al., 2001). For example, Gyory et al. (1976) used a goniometer to compare three
dimensional knee angular kinematics of 29 normal participants to 65 OA participants and
30 with rheumatoid arthritis. The authors observed knee range of motion, stance phase
knee flexion/extension, walking velocity, stride length, and cadence were reduced in the
OA group. Similar results were reported by Walker et al. (2001) who observed that OA
patients had significantly lower maximum knee extension angles for all activities and
displayed only 70-80% of normal knee flexion when compared to the control group (p =
.004). Stauffer et al. (1977) observed reduced sagittal plane knee range of motion, stance
phase range of motion and 18% less internal and external knee rotation in the OA group.
These previously mentioned kinematic observations have lead to the conclusion that
changes in lower extremity kinematics could be a strategy used by OA patients to reduce
joint movement so that less pain is felt during weight bearing activities. These changes
are important to examine because measurements of the mechanics of the disease are
necessary for a greater understanding of the functional affects of treatment(s), such as
11
those that affect mobility. The purpose of this paper was to review the literature
examining noninvasive OA therapies on function and mobility. An appreciation of these
findings may help clinicians in choosing the most efficacious therapy for improving
mobility, such as kinematics of gait. By improving gait kinematics, patients with OA
may experience improved economy of gait and reduced secondary impairments to non-
arthritic joints via the kinetic chain. This review is organized in the following manner:
(a) strategies for literature search, (b) methods used to assess gait mobility with
descriptions of specific tests used to address mechanical and painful complications of
OA, and (c) various forms of noninvasive therapies used for treatment of OA and their
effects on mobility (Tables 1 and 2).
Methods
The strategy used for the present literature review involved searching the
following electronic databases: MEDLINE, PubMed, SPORT-DISCUS, and Google
Scholar. The following key words were used in different compositions: gait, kinematics,
function, osteoarthritis, therapy, exercise, aquatic, land-based, aquatic, mobility,
rehabilitation, biomechanics, gait analysis. The selection of articles was executed in two
successive screening stages. The first stage consisted of selecting articles based on title
and abstract, and the second involved applying the selection criteria to the full-text
articles.
The selection criteria for inclusion in this study were as follows: The study used at
least one type of noninvasive therapy to treat OA, and at least one of the outcome
12
measures was an assessment of gait, function and/or mobility, the studies were available
in English and were published in a peer-reviewed journal, and/or the study provided
additional information on noninvasive methods for treating OA. Seven articles from
1997 to 2009 were included (Tables 1 and 2).
Techniques Used to Measure Function and Mobility
In many studies mobility has been assessed using field tests that estimate gait
kinematics (Cochrane et al., 2005; Foley et al., 2003; Patrick et al., 2001; Rogind et al.,
1998; Stener-Victorin et al., 2004; Wang et al., 2007; Wyatt et al., 2001). For example,
the 6-min walk test requires participants to walk for 6 min over a flat surface such as a
running track, and measures the maximum distance a participant walked in 6-min. The
purpose of the 6-min walk test is to measure exercise endurance. The Timed Up and Go
(TUG) test is also timed, but measures the time it takes a participant to stand up from an
armchair, walk a distance of 3 m, turn, walk back to the chair, and sit down (Podsiadlo &
Richardson, 1991). The purpose of the timed up and go test is to provide a short test of
balance and basic mobility skills for frail community-dwelling elderly participants.
Self reported physical function measures are also used to assess gait kinematics,
the most popular being the Western Ontario and McMaster Universities Osteoarthritis
Index (WOMAC), the Stanford Health Assessment Questionnaire (HAQ) and the Jette
Functional Status Index (JFSI) (Fransen, Crosbie, & Edmonds, 1997). The Stanford
Health Assessment Questionnaire has two versions, a full version and a short version.
The short version is most frequently used and most commonly known as HAQ. The short
HAQ contains the HAQ Disability Index (HAQ-DI), the Visual Analog Scale (VAS) Pain

13
Scale, and the VAS Patient Global in a 2-page format (Bruce & Fries, 2003). The HAQ
was created to represent a model of patient oriented outcome assessment and has
influenced several diverse areas such as prediction of successful aging, inversion of the
therapeutic pyramid in rheumatoid arthritis (RA), development of risk factor models for
OA, and examination of mortality risks in RA. The HAQ has established itself as a
worthy and effective instrument for measurement of health status. It has increased the
credibility and use of validated self-report measurement techniques as a quantifiable set
of hard data endpoints and has created a new appreciation of outcome assessment (Bruce
& Fries, 2003). The WOMAC was developed to evaluate patients who had OA of the hip
or the knee. The index contains three subscales: One for pain (five items), one for
stiffness (two items), and one for disability (17 items). This questionnaire can be self-
administered, and it is reportedly reliable and valid (Bellamy et al., 1997). The JFSI
gives individual scores for degree of dependence, difficulty and pain during 18 activities.
The JFSI consists of 10 items within three sections (gross mobility, hand activities, and
personal care) scored on a 4-point scale from 1 = no pain to 4 = severe pain (Jette, 1980).
The item scores are summed for a total score. The minimum possible score is 10; the
maximum score (severe pain on every item) is 40. The reliability and validity of the JFSI
have been examined and found to be adequate (Fillenbaum, George, & Blazer, 1988). It
is helpful to use these types of measures when testing large clinical populations, as it is
essential to keep the test short and easy to perform for both assessor and participant
(Fransen et al., 1997).
14
Although the WOMAC, HAQ, and JFSI scales have been validated for those with
OA of the lower limbs, they have not been validated for those who are in earlier phases of
the disease (Fransen et al., 1997). Fransen et al. (1997) have suggested that it is possible
gait changes take place before any functional loss scored by these scales occurs, or even
before pain changes are recorded by self-reported ratings. The level of personal pain
experienced is only possible to determine indirectly by self-reported ratings using uni-
dimensional pain rating scales that may be used for various dimensions of pain, such as
the Visual Analog Scale (VAS), which is one of the most common used scales for self-
assessment of pain. Therefore it seems important for researchers to examine changes in
both questionnaire(s) and specific gait kinematic variables (e.g., changes in knee joint
angle), as the latter is a precursor to functional limitation for the OA population, and
could prove useful when measuring the effectiveness of a therapeutic intervention.
Previous studies have suggested that OA patients compensate for their pain in
their affected joint by increasing the work of other joints (Brinkmann & Perry, 1985;
Kaufman et al., 2001; Messier, 1994; Stauffer et al., 1977; Walker et al., 2001). For
example, Messier (1994) observed that OA patients increase hip angular velocity in order
to counteract a decrease in knee angular velocity. These observations are made by
directly measuring the kinematics of the joint during certain movements such as walking.
The kinematics of gait requires the use of sophisticated laboratory equipment such as
camera systems that compute three-dimensional motion or more simply
electrogoniometry.
15
Three-dimensional motion analysis presents a distinct method for measuring
lower extremity dynamics for physical activities such as walking. Motion analysis of the
human body often involves using optical systems capable of measuring retro-reflective
markers placed on a subject so segments can be analyzed. Trajectories are used to
estimate positions of underlying bony segments, with the false assumption that markers
and bones are rigidly connected (Stagni, Fantozzi, Cappello, & Leardini, 2005).
Electrogoniometers allow a researcher to measure the range of motion about a joint.
Electrogoniometry uses the relative positions of the thigh and leg to allow for quick
measurements of relative joint angles and continuous knee joint motion in all planes of
motion. Other techniques also exist for measuring joint kinematics during gait. For
example, accelerometry, electromechanical switches (attached to the heel to identify
timing of heel strike in gait), gyroscopes, and pedometers are also used to measure human
movement.
Current Treatments and Therapies
Land-based treatments. General physical therapy has been helpful for
osteoarthritis of the knee. Physical therapy (PT) practice involves applying cold and/or
heat, ultrasound, and shortwave therapy, instruction in joint use and preservation of range
of motion, supplying patients with canes or orthotic devices, and isometric exercises to
prevent muscle atrophy (Cooke & Dwosh, 1986). Rogind et al. (1998) utilized a basic
functional test, (which included activities such as a 20-m walking time, and time to walk
up and down one flight of stairs) to compare the effects of a physical training program on
25 patients with bilateral OA of the knee, with controls that had similar diagnosis of the
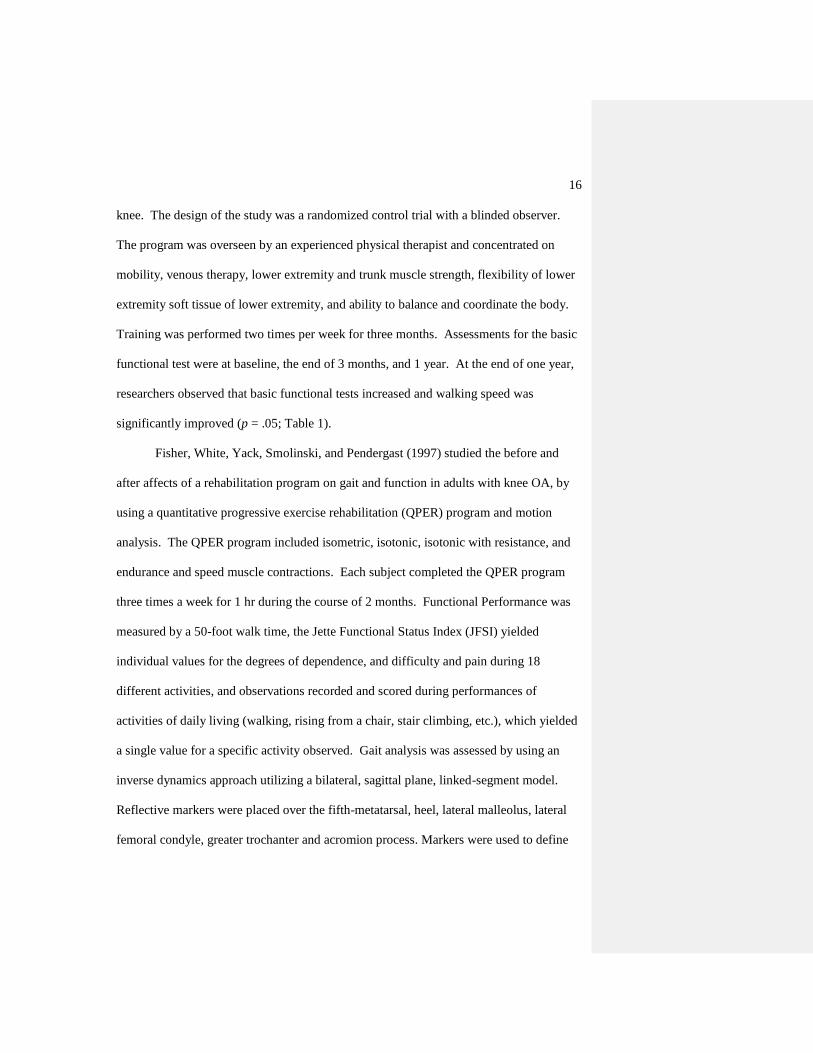
16
knee. The design of the study was a randomized control trial with a blinded observer.
The program was overseen by an experienced physical therapist and concentrated on
mobility, venous therapy, lower extremity and trunk muscle strength, flexibility of lower
extremity soft tissue of lower extremity, and ability to balance and coordinate the body.
Training was performed two times per week for three months. Assessments for the basic
functional test were at baseline, the end of 3 months, and 1 year. At the end of one year,
researchers observed that basic functional tests increased and walking speed was
significantly improved (p = .05; Table 1).
Fisher, White, Yack, Smolinski, and Pendergast (1997) studied the before and
after affects of a rehabilitation program on gait and function in adults with knee OA, by
using a quantitative progressive exercise rehabilitation (QPER) program and motion
analysis. The QPER program included isometric, isotonic, isotonic with resistance, and
endurance and speed muscle contractions. Each subject completed the QPER program
three times a week for 1 hr during the course of 2 months. Functional Performance was
measured by a 50-foot walk time, the Jette Functional Status Index (JFSI) yielded
individual values for the degrees of dependence, and difficulty and pain during 18
different activities, and observations recorded and scored during performances of
activities of daily living (walking, rising from a chair, stair climbing, etc.), which yielded
a single value for a specific activity observed. Gait analysis was assessed by using an
inverse dynamics approach utilizing a bilateral, sagittal plane, linked-segment model.
Reflective markers were placed over the fifth-metatarsal, heel, lateral malleolus, lateral
femoral condyle, greater trochanter and acromion process. Markers were used to define
17
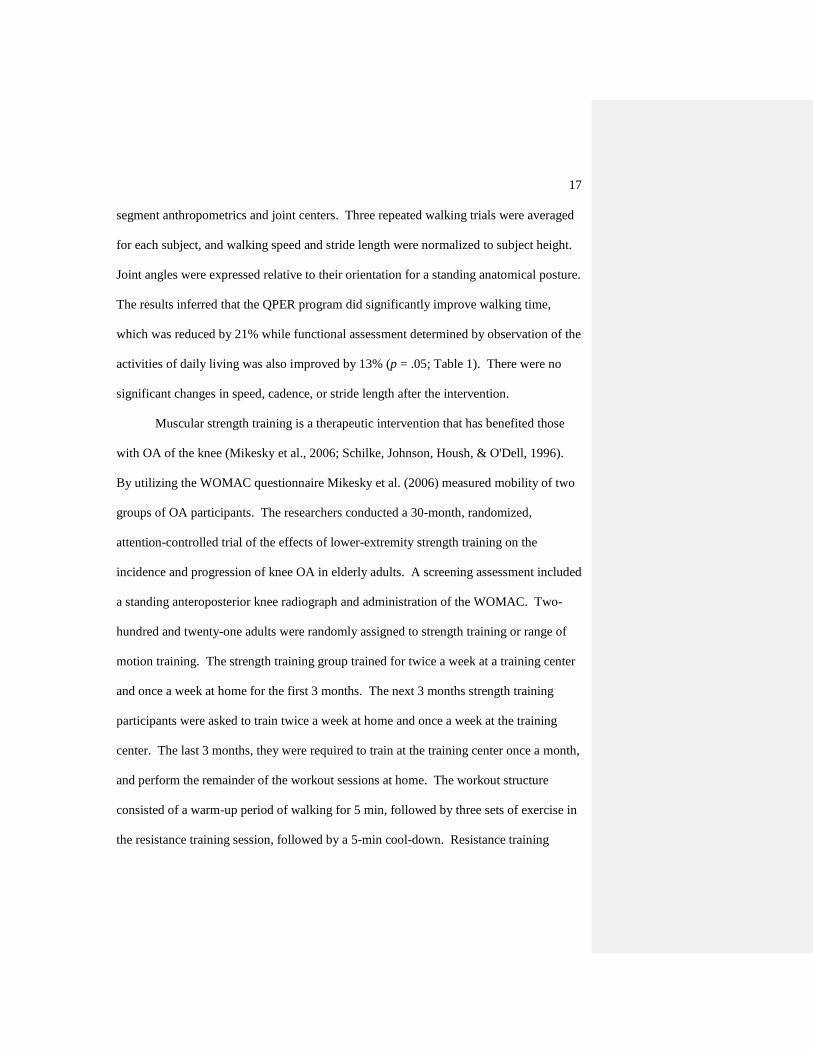
segment anthropometrics and joint centers. Three repeated walking trials were averaged
for each subject, and walking speed and stride length were normalized to subject height.
Joint angles were expressed relative to their orientation for a standing anatomical posture.
The results inferred that the QPER program did significantly improve walking time,
which was reduced by 21% while functional assessment determined by observation of the
activities of daily living was also improved by 13% (p = .05; Table 1). There were no
significant changes in speed, cadence, or stride length after the intervention.
Muscular strength training is a therapeutic intervention that has benefited those
with OA of the knee (Mikesky et al., 2006; Schilke, Johnson, Housh, & O'Dell, 1996).
By utilizing the WOMAC questionnaire Mikesky et al. (2006) measured mobility of two
groups of OA participants. The researchers conducted a 30-month, randomized,
attention-controlled trial of the effects of lower-extremity strength training on the
incidence and progression of knee OA in elderly adults. A screening assessment included
a standing anteroposterior knee radiograph and administration of the WOMAC. Two-
hundred and twenty-one adults were randomly assigned to strength training or range of
motion training. The strength training group trained for twice a week at a training center
and once a week at home for the first 3 months. The next 3 months strength training
participants were asked to train twice a week at home and once a week at the training
center. The last 3 months, they were required to train at the training center once a month,
and perform the remainder of the workout sessions at home. The workout structure
consisted of a warm-up period of walking for 5 min, followed by three sets of exercise in
the resistance training session, followed by a 5-min cool-down. Resistance training
18
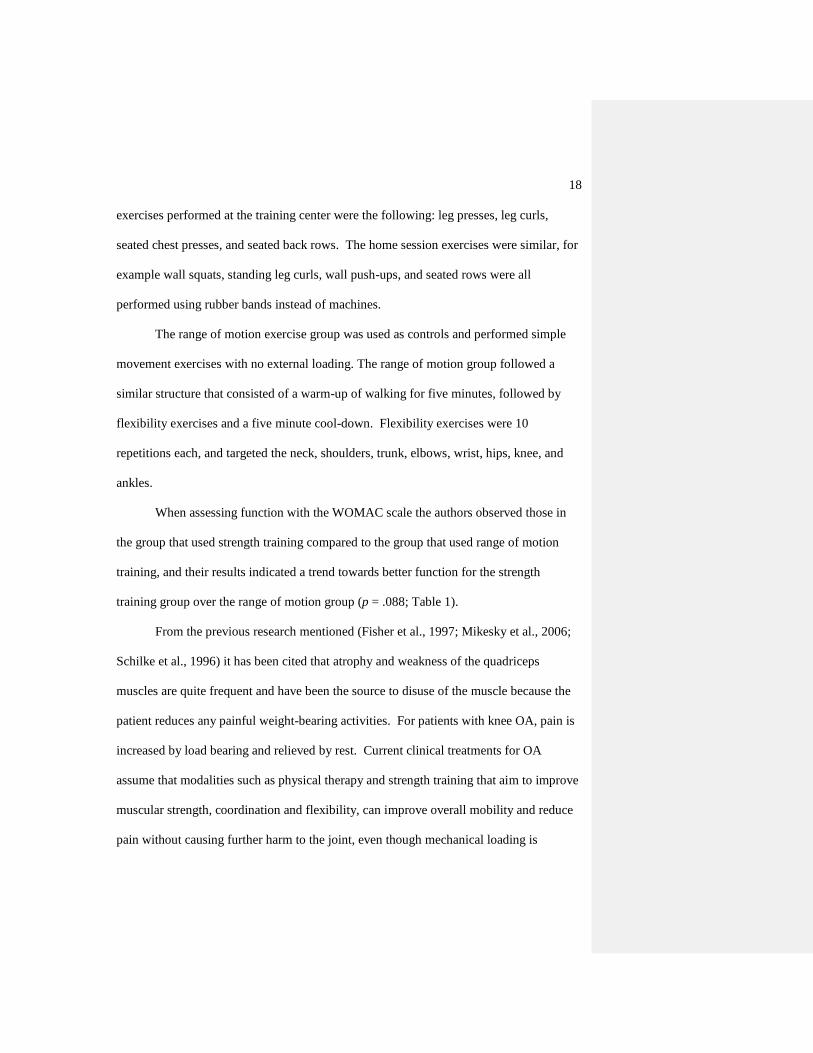
exercises performed at the training center were the following: leg presses, leg curls,
seated chest presses, and seated back rows. The home session exercises were similar, for
example wall squats, standing leg curls, wall push-ups, and seated rows were all
performed using rubber bands instead of machines.
The range of motion exercise group was used as controls and performed simple
movement exercises with no external loading. The range of motion group followed a
similar structure that consisted of a warm-up of walking for five minutes, followed by
flexibility exercises and a five minute cool-down. Flexibility exercises were 10
repetitions each, and targeted the neck, shoulders, trunk, elbows, wrist, hips, knee, and
ankles.
When assessing function with the WOMAC scale the authors observed those in
the group that used strength training compared to the group that used range of motion
training, and their results indicated a trend towards better function for the strength
training group over the range of motion group (p = .088; Table 1).
From the previous research mentioned (Fisher et al., 1997; Mikesky et al., 2006;
Schilke et al., 1996) it has been cited that atrophy and weakness of the quadriceps
muscles are quite frequent and have been the source to disuse of the muscle because the
patient reduces any painful weight-bearing activities. For patients with knee OA, pain is
increased by load bearing and relieved by rest. Current clinical treatments for OA
assume that modalities such as physical therapy and strength training that aim to improve
muscular strength, coordination and flexibility, can improve overall mobility and reduce
pain without causing further harm to the joint, even though mechanical loading is
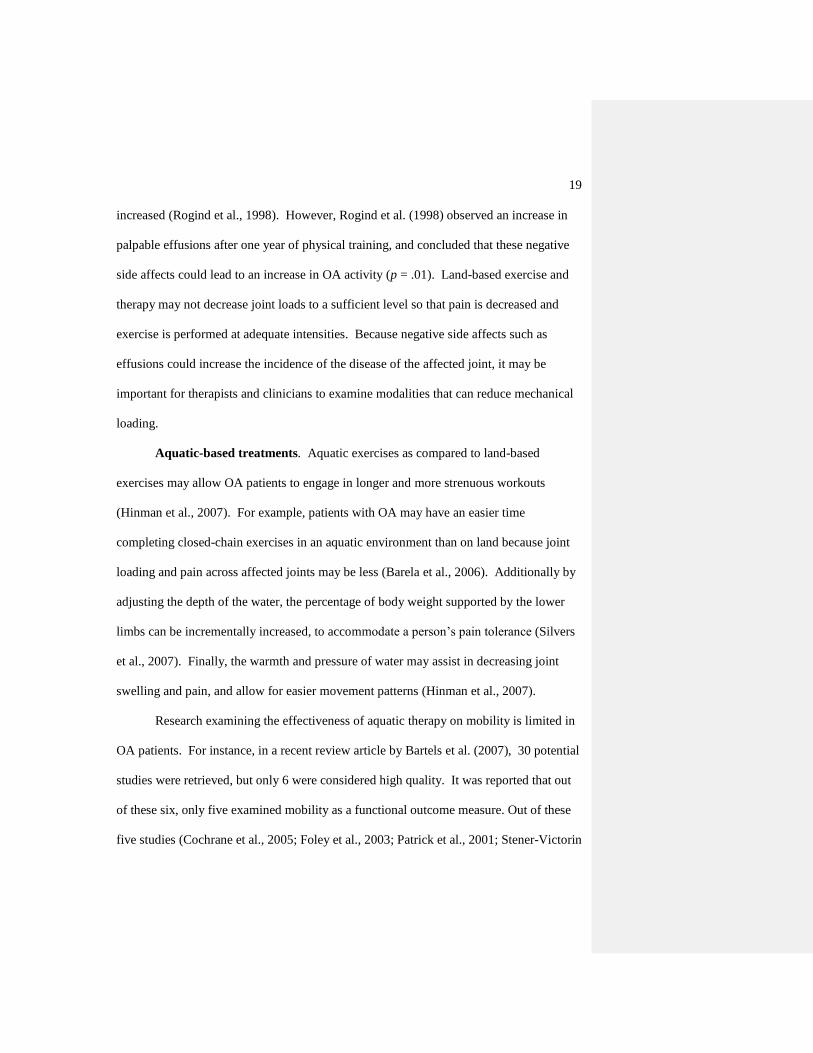
19
increased (Rogind et al., 1998). However, Rogind et al. (1998) observed an increase in
palpable effusions after one year of physical training, and concluded that these negative
side affects could lead to an increase in OA activity (p = .01). Land-based exercise and
therapy may not decrease joint loads to a sufficient level so that pain is decreased and
exercise is performed at adequate intensities. Because negative side affects such as
effusions could increase the incidence of the disease of the affected joint, it may be
important for therapists and clinicians to examine modalities that can reduce mechanical
loading.
Aquatic-based treatments. Aquatic exercises as compared to land-based
exercises may allow OA patients to engage in longer and more strenuous workouts
(Hinman et al., 2007). For example, patients with OA may have an easier time
completing closed-chain exercises in an aquatic environment than on land because joint
loading and pain across affected joints may be less (Barela et al., 2006). Additionally by
adjusting the depth of the water, the percentage of body weight supported by the lower
limbs can be incrementally increased, to accommodate a person‟s pain tolerance (Silvers
et al., 2007). Finally, the warmth and pressure of water may assist in decreasing joint
swelling and pain, and allow for easier movement patterns (Hinman et al., 2007).
Research examining the effectiveness of aquatic therapy on mobility is limited in
OA patients. For instance, in a recent review article by Bartels et al. (2007), 30 potential
studies were retrieved, but only 6 were considered high quality. It was reported that out
of these six, only five examined mobility as a functional outcome measure. Out of these
five studies (Cochrane et al., 2005; Foley et al., 2003; Patrick et al., 2001; Stener-Victorin

20
et al., 2004; Wang et al., 2007; Wyatt et al., 2001), mobility was assessed with field tests
(e.g., 6-min walk test) that estimated improvements in gait kinematics.
Foley et al. (2003) directly compared a land-based resistance exercise program
with an aquatic resistance exercise program among people with OA of the hip or knee to
a control group, to evaluate whether one modality provided benefits in strength and
mobility over the other. Each group had three exercise sessions a week for 6 weeks.
Outcome assessments included the 6-min walk test, distance walked, and the WOMAC.
The authors observed that both hydrotherapy and gym groups improved from baseline in
walking speed and distance (p < 0.001). WOMAC pain scores were significantly declined
from baseline in the hydrotherapy group (p = 0.045; Table 2), but not different between
groups. The authors concluded that hydrotherapy may be more appropriate for aerobic
based exercise programs.
Wyatt et al. (2001) also compared land-based exercise with aquatic exercise
among patients with moderate OA of the knee. Participants were randomly assigned to
either the aquatic or land condition. Both groups exercised three times a week for 6
weeks. Both exercise programs contained the following: two sets of manual resistance
knee extension and flexion, four way straight leg raises, mini squats, and an 800-foot
walk. The authors used a pretest/posttest design to detect differences in subject values
for passive ROM utilizing a universal goniometer and time for a 1-mile walk. Total knee
ROM and the 1-mile walk time improved for both groups between the pre and post
measurements (p ≤ 0.05; Table 2).
21
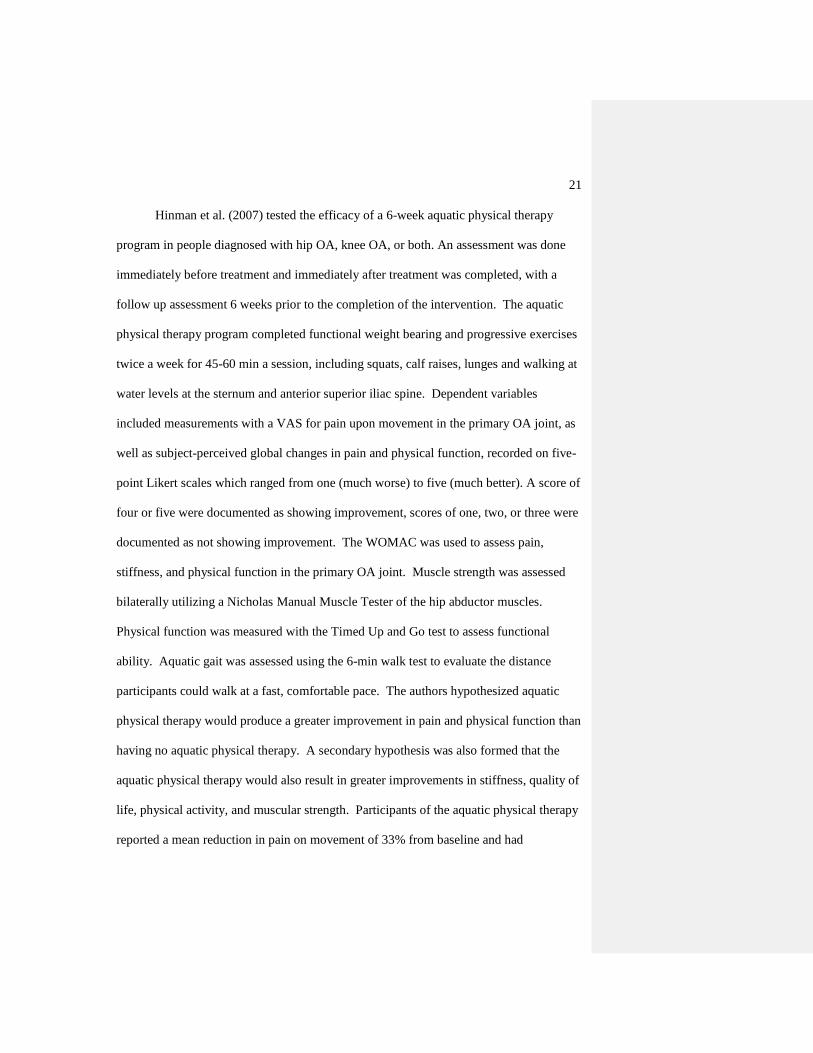
Hinman et al. (2007) tested the efficacy of a 6-week aquatic physical therapy
program in people diagnosed with hip OA, knee OA, or both. An assessment was done
immediately before treatment and immediately after treatment was completed, with a
follow up assessment 6 weeks prior to the completion of the intervention. The aquatic
physical therapy program completed functional weight bearing and progressive exercises
twice a week for 45-60 min a session, including squats, calf raises, lunges and walking at
water levels at the sternum and anterior superior iliac spine. Dependent variables
included measurements with a VAS for pain upon movement in the primary OA joint, as
well as subject-perceived global changes in pain and physical function, recorded on five-
point Likert scales which ranged from one (much worse) to five (much better). A score of
four or five were documented as showing improvement, scores of one, two, or three were
documented as not showing improvement. The WOMAC was used to assess pain,
stiffness, and physical function in the primary OA joint. Muscle strength was assessed
bilaterally utilizing a Nicholas Manual Muscle Tester of the hip abductor muscles.
Physical function was measured with the Timed Up and Go test to assess functional
ability. Aquatic gait was assessed using the 6-min walk test to evaluate the distance
participants could walk at a fast, comfortable pace. The authors hypothesized aquatic
physical therapy would produce a greater improvement in pain and physical function than
having no aquatic physical therapy. A secondary hypothesis was also formed that the
aquatic physical therapy would also result in greater improvements in stiffness, quality of
life, physical activity, and muscular strength. Participants of the aquatic physical therapy
reported a mean reduction in pain on movement of 33% from baseline and had
22
significantly less pain at 6 weeks than control participants (p < .01). Similarly, 75% of
the intervention participants reported a global improvement in physical function (p <
.001; Table 2). Outcomes that were not significantly different after intervention included
quadriceps femoris muscle strength, and the Timed Up and Go test.
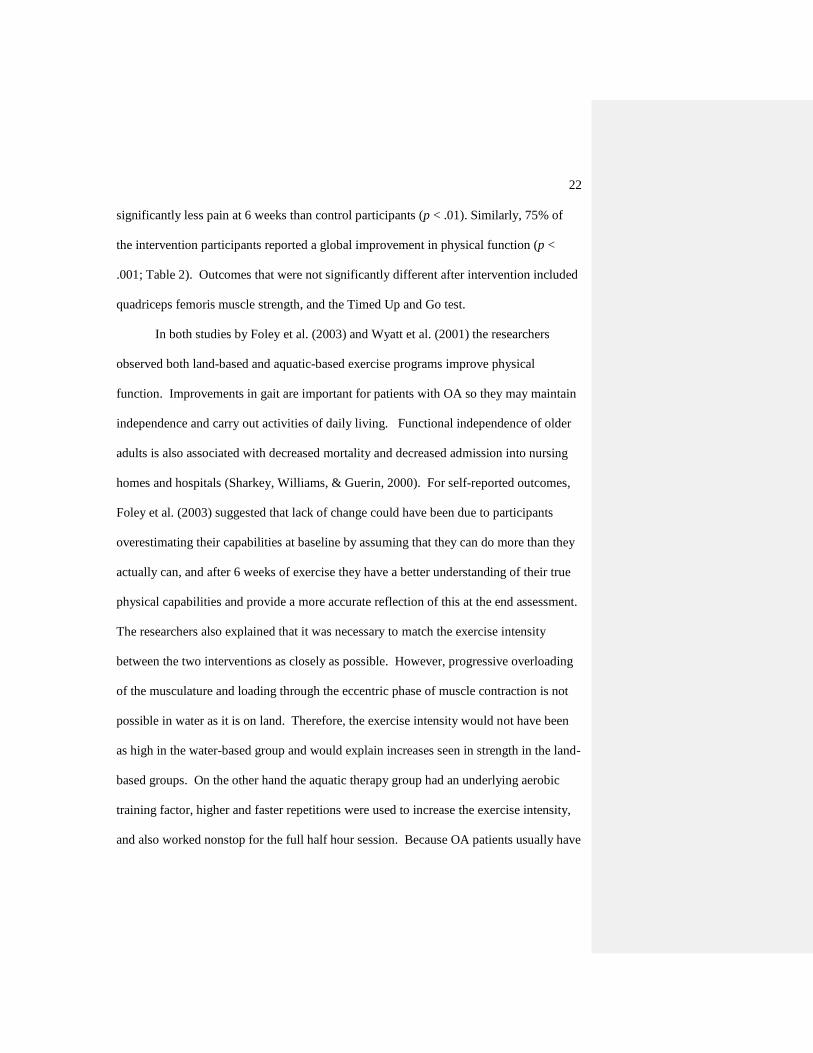
In both studies by Foley et al. (2003) and Wyatt et al. (2001) the researchers
observed both land-based and aquatic-based exercise programs improve physical
function. Improvements in gait are important for patients with OA so they may maintain
independence and carry out activities of daily living. Functional independence of older
adults is also associated with decreased mortality and decreased admission into nursing
homes and hospitals (Sharkey, Williams, & Guerin, 2000). For self-reported outcomes,
Foley et al. (2003) suggested that lack of change could have been due to participants
overestimating their capabilities at baseline by assuming that they can do more than they
actually can, and after 6 weeks of exercise they have a better understanding of their true
physical capabilities and provide a more accurate reflection of this at the end assessment.
The researchers also explained that it was necessary to match the exercise intensity
between the two interventions as closely as possible. However, progressive overloading
of the musculature and loading through the eccentric phase of muscle contraction is not
possible in water as it is on land. Therefore, the exercise intensity would not have been
as high in the water-based group and would explain increases seen in strength in the land-
based groups. On the other hand the aquatic therapy group had an underlying aerobic
training factor, higher and faster repetitions were used to increase the exercise intensity,
and also worked nonstop for the full half hour session. Because OA patients usually have
23
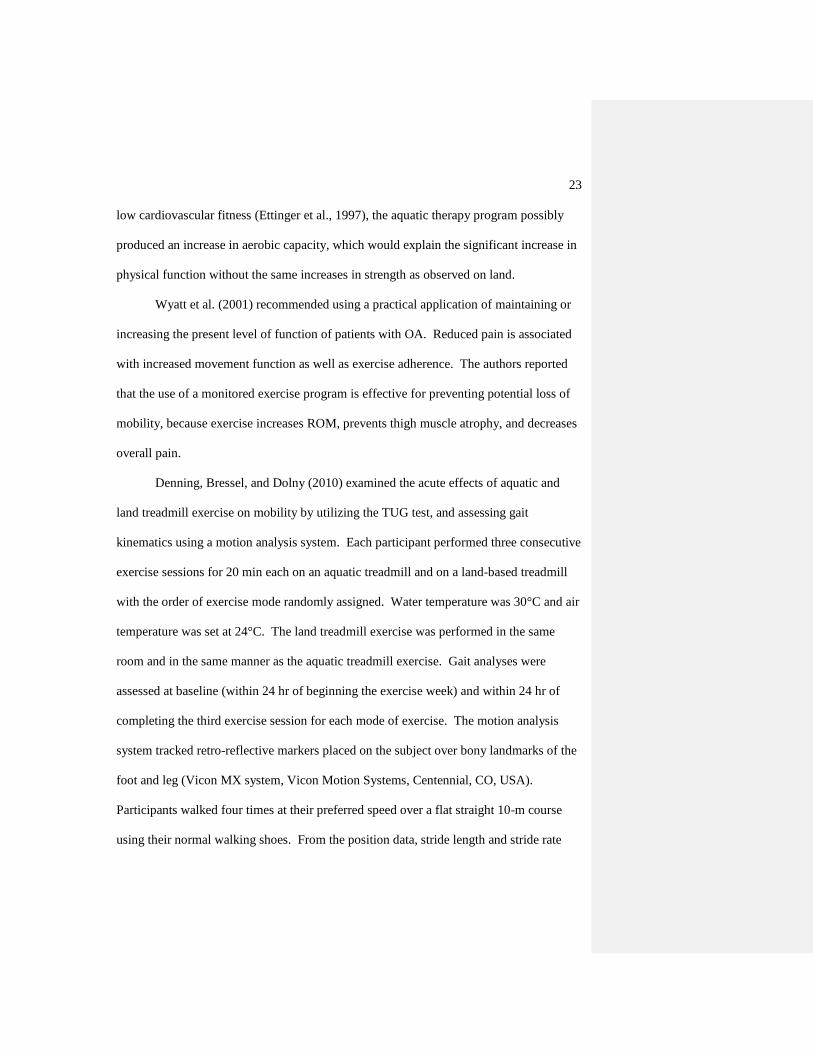
low cardiovascular fitness (Ettinger et al., 1997), the aquatic therapy program possibly
produced an increase in aerobic capacity, which would explain the significant increase in
physical function without the same increases in strength as observed on land.
Wyatt et al. (2001) recommended using a practical application of maintaining or
increasing the present level of function of patients with OA. Reduced pain is associated
with increased movement function as well as exercise adherence. The authors reported
that the use of a monitored exercise program is effective for preventing potential loss of
mobility, because exercise increases ROM, prevents thigh muscle atrophy, and decreases
overall pain.
Denning, Bressel, and Dolny (2010) examined the acute effects of aquatic and
land treadmill exercise on mobility by utilizing the TUG test, and assessing gait
kinematics using a motion analysis system. Each participant performed three consecutive
exercise sessions for 20 min each on an aquatic treadmill and on a land-based treadmill
with the order of exercise mode randomly assigned. Water temperature was 30°C and air
temperature was set at 24°C. The land treadmill exercise was performed in the same
room and in the same manner as the aquatic treadmill exercise. Gait analyses were
assessed at baseline (within 24 hr of beginning the exercise week) and within 24 hr of
completing the third exercise session for each mode of exercise. The motion analysis
system tracked retro-reflective markers placed on the subject over bony landmarks of the
foot and leg (Vicon MX system, Vicon Motion Systems, Centennial, CO, USA).
Participants walked four times at their preferred speed over a flat straight 10-m course
using their normal walking shoes. From the position data, stride length and stride rate
24
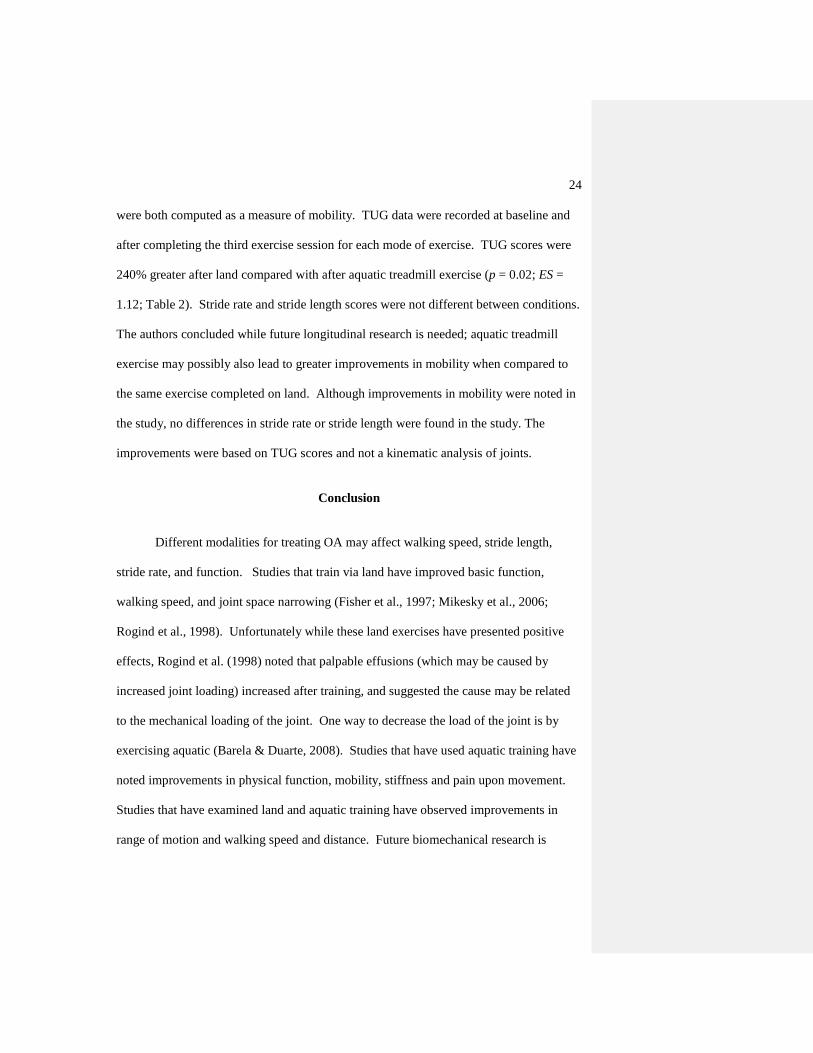
were both computed as a measure of mobility. TUG data were recorded at baseline and
after completing the third exercise session for each mode of exercise. TUG scores were
240% greater after land compared with after aquatic treadmill exercise (p = 0.02; ES =
1.12; Table 2). Stride rate and stride length scores were not different between conditions.
The authors concluded while future longitudinal research is needed; aquatic treadmill
exercise may possibly also lead to greater improvements in mobility when compared to
the same exercise completed on land. Although improvements in mobility were noted in
the study, no differences in stride rate or stride length were found in the study. The
improvements were based on TUG scores and not a kinematic analysis of joints.
Conclusion
Different modalities for treating OA may affect walking speed, stride length,
stride rate, and function. Studies that train via land have improved basic function,
walking speed, and joint space narrowing (Fisher et al., 1997; Mikesky et al., 2006;
Rogind et al., 1998). Unfortunately while these land exercises have presented positive
effects, Rogind et al. (1998) noted that palpable effusions (which may be caused by
increased joint loading) increased after training, and suggested the cause may be related
to the mechanical loading of the joint. One way to decrease the load of the joint is by
exercising aquatic (Barela & Duarte, 2008). Studies that have used aquatic training have
noted improvements in physical function, mobility, stiffness and pain upon movement.
Studies that have examined land and aquatic training have observed improvements in
range of motion and walking speed and distance. Future biomechanical research is
25
needed to evaluate benefits to aquatic training to better serve programs aimed at
improving function and mobility for patients with OA.
These gait, pain, and mobility alterations in OA patients noted in the previous
literature may be precursors for pathological alterations and would seem to be important
variables to examine in an aquatic therapy study aimed at improving mobility. A greater
understanding of these alterations will be useful for the treatment of OA and the
prevention of OA progression.
Table 1
Characteristics of Included Land-based Studies

26
Reference
Participants
Intervention
Main outcome
measures Key findings
Rogind et
al.
1998
Bilateral
Knee OA
General fitness, balance,
coordination, stretching
and lower extremity
muscle strength training,
twice a week for 3
months. Assessments
were at baseline, 3
months, and 1 year
Muscle
strength, AFI,
Pain (0 to 10
point scale),
walking speed
By one year, AFI
decreased 3.8
points (CI 2α = .05,
1.0 to 7.0), pain
decreased by 2.0
points (CI 2α = .05,
0.0 to 4.0), and
walking speed
increased 13%
(CI 2α = .05, 4% to
23%)
Fisher et
al.
1997
Women
with Knee
OA
QPER Program, 3 times a
week for 2 months, 1 hr a
day. Assessments were at
baseline and post QPER
50-foot walk
time, JFSI, and
observations
scored during
the performance
of daily living,
gait analysis
using video
records at 60 hz
Walking time
was significantly
reduced by 21%,
function
determined by
observation was
improved by
13% (p = 0.05)
Mikesky
et al.
2006
Knee OA
Randomized to strength
training or range-of-
motion exercises for 3
times a week for 12
weeks. Followed by
transition to home training
for 12 months
Assessments at 30 months
Standing AP
knee
radiograph,
WOMAC
JSN > 0.50 mm
was more
common in ST
than in ROM
(34% versus
19%; p – 0.038)
AFI = Algofunctional Index; QPER = Quantitative Progressive Exercise Rehabilitation;
JFSI = Jette Functional Status Index; WOMAC =Western Ontario and McMaster
Universities OA Index ; JSN = Joint Space Narrowing; ROM = Range of Motion; VAS =
Visual Analog Scale; TUG = Timed Up and Go.
27
Table 2
Characteristics of Included Aquatic-based Studies
Reference
Participants
Intervention
Main outcome
measures
Key findings
28
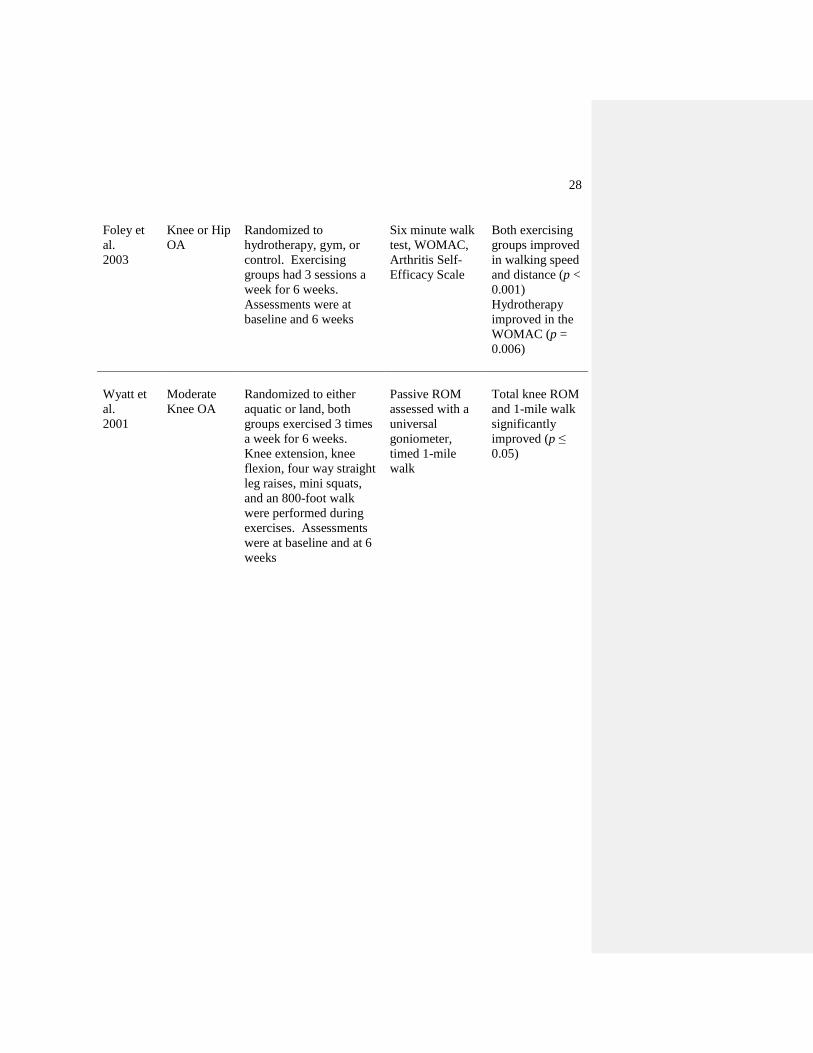
Foley et
al.
2003
Knee or Hip
OA
Randomized to
hydrotherapy, gym, or
control. Exercising
groups had 3 sessions a
week for 6 weeks.
Assessments were at
baseline and 6 weeks
Six minute walk
test, WOMAC,
Arthritis Self-
Efficacy Scale
Both exercising
groups improved
in walking speed
and distance (p <
0.001)
Hydrotherapy
improved in the
WOMAC (p =
0.006)
Wyatt et
al.
2001
Moderate
Knee OA
Randomized to either
aquatic or land, both
groups exercised 3 times
a week for 6 weeks.
Knee extension, knee
flexion, four way straight
leg raises, mini squats,
and an 800-foot walk
were performed during
exercises. Assessments
were at baseline and at 6
weeks
Passive ROM
assessed with a
universal
goniometer,
timed 1-mile
walk
Total knee ROM
and 1-mile walk
significantly
improved (p ≤
0.05)
29
Reference
Participants
Intervention
Main outcome
measures
Key findings
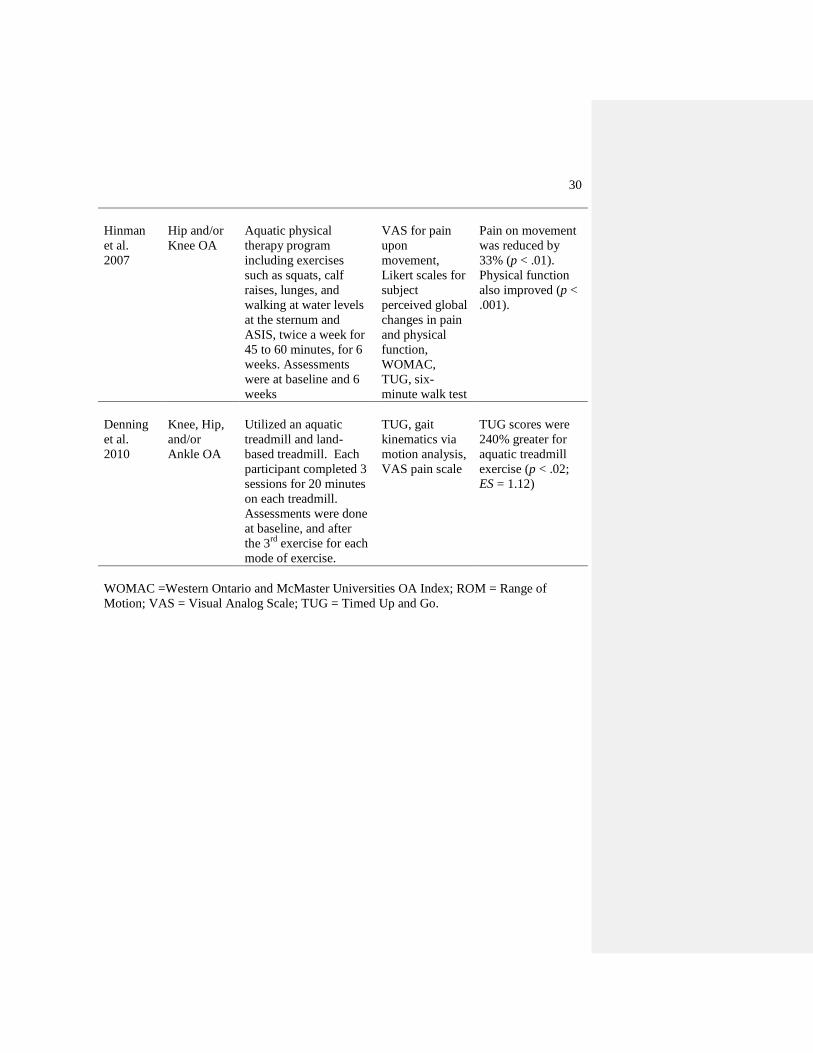
30
Hinman
et al.
2007
Hip and/or
Knee OA
Aquatic physical
therapy program
including exercises
such as squats, calf
raises, lunges, and
walking at water levels
at the sternum and
ASIS, twice a week for
45 to 60 minutes, for 6
weeks. Assessments
were at baseline and 6
weeks
VAS for pain
upon
movement,
Likert scales for
subject
perceived global
changes in pain
and physical
function,
WOMAC,
TUG, six-
minute walk test
Pain on movement
was reduced by
33% (p < .01).
Physical function
also improved (p <
.001).
Denning
et al.
2010
Knee, Hip,
and/or
Ankle OA
Utilized an aquatic
treadmill and land-
based treadmill. Each
participant completed 3
sessions for 20 minutes
on each treadmill.
Assessments were done
at baseline, and after
the 3rd
exercise for each
mode of exercise.
TUG, gait
kinematics via
motion analysis,
VAS pain scale
TUG scores were
240% greater for
aquatic treadmill
exercise (p < .02;
ES = 1.12)
WOMAC =Western Ontario and McMaster Universities OA Index; ROM = Range of
Motion; VAS = Visual Analog Scale; TUG = Timed Up and Go.
31
CHAPTER 3
EXPERIMENTAL PAPER
Effects of Aquatic Treadmill Exercise on Mobility in People with Knee Osteoarthritis
Abstract
This study examined the acute effects of aquatic and land treadmill exercise on
gait kinematics, pain, and self-efficacy. Fourteen participants diagnosed with
osteoarthritis of the knee performed three consecutive exercise sessions for each mode of
exercise. Gait kinematics, pain, and self-efficacy were measured before and after each
intervention. Step rate and step length were not different between conditions (p = 0.31-
0.92), but the angular velocity gain score during stance for left knee extension was
significantly higher for aquatic treadmill exercise by 38.1% (p = 0.004). Similarly,
during swing the gain scores for angular velocity were also greater for left knee internal
rotation and extension by 65% and 20%, respectively (p = 0.004, p = 0.008). During
stance, the joint angle gain score for left hip flexion was greater for land exercise by
7.23% (p = 0.007). Similarly, during swing the angular velocity gain score for right hip
extension was significantly greater for aquatic exercise by 28% (p = 0.01). Only the
joint angle gain score for left ankle abduction during stance was significantly higher for
land exercise by 4.72% (p = 0.003). No other joint angle gain scores for either stance or
swing were significantly different for either condition (p = 0.06-0.96). Perceived pain
was 100% greater for land than aquatic treadmill exercise (p = 0.02) and self-efficacy
32
gain scores were not different between conditions (p = 0.37). The present study
demonstrated that an acute training period on an aquatic treadmill did influence joint
angular velocity and arthritis related joint pain suggesting that for acute bouts of
exercise, an aquatic treadmill may improve angular speed of the joint and pain related to
OA. It is unclear whether or not aquatic exercise is a better alternative to land exercise,
and further longitudinal research is needed to examine gait kinematic changes after an
increased training period of aquatic exercise.
Introduction
Osteoarthritis is a widespread disease and is also the most common form of
arthritis in the elderly (Davis et al., 1991; Felson et al., 1987; Hochberg, 1991).
Osteoarthritis (OA) of the hip and knee is often characterized by pain, stiffness, and
decreased range of motion. People who have OA of the lower extremities are generally
less active and have decreased physical conditioning and function. This reduction in
mobility further decreases one‟s ability to carry out daily activities and complete regular
physical exercise (Kaufman et al., 2001; Mangione et al., 1996).
Patients with OA are commonly prescribed physical exercise regimens to aid in
maintaining physical activity and daily functions. It has been reported that mechanical
complications due to OA or pain in the lower joints may indirectly decrease walking
capacity (Sutbeyaz et al., 2007). Early termination of exercise programs because of knee
pain may prevent individuals from receiving the beneficial effects of aerobic training.
Therefore exercise programs intended to lessen knee pain could potentially enable those
33
with OA to execute a longer, more strenuous workout, resulting in an advanced level of
cardiovascular fitness (Mangione et al., 1996).
Aquatic exercises may allow OA patients to engage in longer and more strenuous
workouts as compared to land-based exercises (Hinman et al., 2007). For example,
patients with OA may have an easier time completing closed-chain exercises in an
aquatic environment than on land because joint loading and pain across affected joints
may be less (Barela et al., 2006). Additionally, by adjusting the depth of the water, the
percentage of body weight supported by the lower limbs can be incrementally decreased,
to accommodate a person‟s pain tolerance (Silvers et al., 2007). Finally, the warmth
and pressure of water may assist in decreasing joint swelling and pain, and allow for
easier movement patterns (Hinman et al., 2007).
Research examining the effectiveness of aquatic therapy on mobility is limited in
OA patients. For instance, in a recent review article by Bartels et al. (2007), 30 potential
studies were retrieved, but only six were considered high quality. It was reported that
out of these six, only five examined mobility as a functional outcome measure. Out of
these five studies (Cochrane et al., 2005; Foley et al., 2003; Patrick et al., 2001; Stener-
Victorin et al., 2004; Wang et al., 2007; Wyatt et al., 2001), mobility was assessed with
tests (e.g., 6-min walk test) that estimated improvements in gait kinematics. While these
studies reported improvement in mobility after aquatic therapy, none examined specific
gait kinematic parameters (e.g., step length, joint angle and velocity). An appreciation
for how a therapy affects kinematic gait parameters may strengthen decisions made in
34
treating those affected with OA and may assist in selecting appropriate therapies to
combat OA symptoms.
Previous research examining the progressive decline of kinematic gait parameters
on land in patients with OA has observed specific changes. Walker et al. (2001) utilized
electrogoniometers to examine the minimum and maximum joint angles of the knee
during various functional movements in 50 patients with OA of the knee and 20 age- and
gender-matched controls. Some of the functional movements included walking on a
level surface, and ascending and descending a slope. The researchers observed that the
OA patients had significantly lower maximum knee extension angles for all activities
and displayed only 70-80% of normal knee flexion when compared to the control group
(p = .004). Their results were supported by Kaufman et al. (2001) who observed that
OA patients walked slower and had 6° less peak knee motion than normal subjects (p <
0.01). In a review by Messier (1994) examining the effects of knee OA on gait, the
researchers reported decreased knee range of motion in patients with OA of the knee.
These kinematic observations have lead to the conclusion that changes in knee angle
could be a strategy used by OA patients to reduce joint movement so that less pain is felt
during weight bearing activities. These changes are important to examine because
measurements of the mechanics of the disease are necessary for a greater understanding
of the functional affects of treatment(s).
With progressive worsening of OA, changes in gait kinematics are often
accompanied by progressive worsening in pain and perception of mobility. For
example, Astephen et al. (2008) studied the differences in self-reported pain and
35
function among three groups: asymptomatic participants and participants with moderate
OA, and severe OA. All scores were higher in the moderate group than the
asymptomatic group, and higher in the severe group than the moderate group. Similarly,
Focht et al. (2005) observed that OA patients involved in exercise have a higher self-
efficacy for exercise than non-exercising controls. These results indicate that studies
examining the effectiveness of physical therapy treatments for OA patients should
include a measure of pain and self-efficacy.
These gait, pain, and self-efficacy alterations in OA patients noted in the previous
literature may be precursors for pathological alterations and would seem to be important
variables to examine in an aquatic therapy study aimed at improving mobility. A greater
understanding of these alterations will be useful for the treatment of OA and the
prevention of OA progression. The present study examined the effects of short-term
aquatic treadmill exercise on gait kinematics and perception of pain and mobility in OA
patients. An aquatic treadmill was chosen instead of more traditional aquatic therapy
exercises (e.g., deep water running) because it applies the principle of specificity and
allows for control over exercise intensity and buoyancy (Dolbow, Farley, Kim, &
Caputo, 2008). A direct comparison of water versus land treadmill exercise was
necessary to establish a control condition and to determine the acute effectiveness of
aquatic therapy on gait kinematics, pain and self-efficacy.
In this study the authors have chosen to include ankle and hip kinematics in
addition to knee kinematics to evaluate whether or not these joints are also affected by
training, based on reasoning that the body acts as a kinetic chain, and that all segments
36
of the body must act together to create human movement. If one component of the chain
is not functioning properly it may affect another.
Methods
Participants
Potential participants for this study were recruited from the local community
through flyers and informational sheets distributed through primary care physician
offices. Prior to participating in the study, all participants read and signed an informed
consent form approved by the University Institutional Review Board.
To be included in the study, participants had to be previously diagnosed with
knee OA through clinical history, physical examination, and radiographic analysis. All
diagnoses were made by a local rheumatologist and were confirmed for „definite‟ OA
based on the diagnostic algorithm reported by March, Schwarz, Carfrae, and Bagge
(1998). Additionally, participants had to be over 35 years of age, able to walk a city
block, and walk up stairs in a reciprocal manner. Participants were excluded if they
currently exercised on an aquatic treadmill, had intra-articular corticosteroid injections in
the past month, reported any neuromuscular disease such as Parkinson‟s disease, stroke,
cardiovascular disorders or surgeries to the lower limb (except for exploratory
arthroscopy), lavage of knee joint or partial meniscetomy at least one year prior to entry
into study. Fourteen participants who responded to the request for subjects met these
criteria. Physical characteristics and arthritis history for the participants are reported in
Table 3.
37
Procedures
This preliminary study used a quasi-experimental crossover design to address the
study purpose. Each participant was asked to perform three consecutive exercise
sessions on an aquatic treadmill (Figure 1; HydroWorx 2000TM
, Middletown, PA) and
on a land-based treadmill (Nordic Track 9600, ICON Fitness, Logan UT). Each exercise
bout was separated by at least 24 hr, and was completed within 1 week. Each mode of
exercise was separated by 1 week. The order of exercise mode was randomly assigned.
It was determined from pilot testing that three exercise sessions were appropriate to
provide familiarization of procedures and equipment and to realize any acute effects of
mode exposure.
The amount of walking for each exercise bout was 20 min and consisted of four
5-min stages (Figure 1). The first stage (the self-selected pace) required participants to
walk at a self-selected pace they considered “comfortable.” The second stage was 0.13
m/s faster than the self-selected pace and the third stage was 0.26 m/s faster than the
self-selected pace. The fourth stage speed was identical to the first phase speed (Figure
2). Participants performed the aquatic treadmill exercise with no shoes at a water depth
equal to the xiphoid process. The temperature of the water was 30o C with the air
temperature set at 24o C. The land treadmill exercise was performed in the same room
and in the same manner as the aquatic treadmill exercise and required participants to
wear their normal walking shoes along with typical exercise clothing. Treadmill incline
was set at 0º for each mode of exercise. Treadmill speed settings of 0.89 m/s were
compared between the aquatic and land treadmills using a video analysis. An interclass
38
correlation coefficient (ICC = 0.99) performed on the analyzed data indicated nominal
speed settings were similar between treadmills.
Measurements
Gait kinematics. Gait analyses were assessed at two baselines (within 24 hr of
beginning the exercise week) and within 24 hr of completing the third exercise session
for each mode of exercise. Gait kinematics were assessed using a motion analysis system
that tracked retro-reflective markers placed on the participant (Vicon MX system, Vicon
Motion Systems, Centennial, CO, USA). Participants walked four times at their preferred
speed over a flat straight 10 m course using their normal walking shoes (Figure 3). Seven
Vicon T-20 cameras sampling at 100 Hz tracked low mass (2.2 g) retro-reflective
markers placed on the skin according to the lower extremity plug-in gait model provided
by Vicon. Skin markers were placed on the toe, heel, lateral malleolus, mid-shank,
lateral aspect of the knee, mid-thigh, anterior superior iliac crest, and posterior superior
iliac crest, for both lower limbs. Three-dimensional position data from each reflective
marker were computed from direct linear transformations using Vicon Nexus software.
Position data gaps were filled by performing a cubic spline interpolation operation to
correct any errors or inconsistencies in the reconstructed and labeled data. Average
number of gaps filled per participant was 29.4, and average number of gaps filled per
marker was 2.36. The three-dimensional data were filtered using a Visual3D (C-Motion,
Inc, Germantown, MD, USA) low-pass Butterworth filter with a cutoff frequency (8 Hz)
based on a residual analysis (Winter, 1990; Appendix A) using Microsoft Excel (2007)
software .
39
From the position data, step length, step rate, joint angles, and velocities were
calculated. Step length was computed as the rectilinear distance (m) between two
successive placements of each foot. Step rate was computed as the difference in frames
between two successive placements of each foot divided by the recording rate of the
cameras. Maximum and minimum joint angles and angular velocities of the hip, knee,
and ankle were calculated for stance and swing phases from the position data using finite
difference equations provided by Visual3D. Stance phase was defined as the time
between heel strike and toe-off, and swing phase was determined as the time between
toe-off to heel strike. Heel strike was defined as the moment at which the heel marker
was at its lowest point in the vertical direction, and toe-off was defined as the moment at
which the toe marker was at its lowest point in the vertical direction.
Hip joint centers were estimated based on a regression equation and data
presented by Bell, Pedersen, and Brand, (1990). On average, all kinematic descriptors
were computed from six consecutive steps for both limbs. Variability for each stride
was calculated for knee flexion during stance and the median coefficient of variation was
1% (Appendix B). Joint angles were expressed relative to their orientation for a standing
anatomical posture and the positive and negative convention for each measure is
illustrated in Figure 4. Angular velocities were defined as the rate of change of the
angular position of the joint angle and expressed as degrees per second.
Pain scale. The perception of joint pain was assessed within 24 hr before the first
exercise session and within 24 hr after the third exercise session using a continuous
visual analog scale. The scale was 12 cm in length and was modeled after pain scales
40
described previously by Carlsson (1983). The left end of the scale was labeled “no pain”
and the right end was labelled “very severe pain.” To improve consistency of
implementing the pain scale, we provided written instructions to each participant before
they rated their pain. The instructions were, “please mark the line to indicate the arthritis
related joint pain that you have felt during the past week; the farther to the right, the
more discomfort/pain you feel.” Visual analog scales, such as the one used in this study,
are reported to be reliable assessments of pain perceptions and are more precise than
ordinal scales that rank responses (Carlsson, 1983; Gramling & Elliott, 1992;
McCormack, Horne, & Sheather, 1988). The pain scales were analyzed by measuring
the distance from the left of the scale to the vertical mark drawn by each subject. This
distance was measured to the nearest millimeter. All pre- and post-exercise pain scores
were averaged to yield a single mean pain score before the first and after the last
exercise.
Self-efficacy scale. Participants were asked to rate the level of certainty that
they could complete a certain amount of laps around the gymnasium. Participants
circled the number on a confidence ladder that represented their level of confidence to
walk around the gymnasium two times without stopping. This measurement was
repeated for anticipated distances of four laps, six laps, eight laps, 10 laps, and 12 laps
without stopping. Walking self-efficacy scores were determined by summing the
participants‟ confidence scores across the six levels of difficulty and multiplying by two.
This measurement procedure was consistent with the protocol developed by Bandura
(1977) and has previously presented acceptable psychometric properties in previous
41
studies (Focht et al., 2005; Rejeski, Craven, Ettinger, McFarlane, & Shumaker, 1996;
Rejeski, Ettinger, Martin, & Morgan, 1998).
Statistical Analyses
Self-selected treadmill speeds for the aquatic and land treadmills were compared
with a paired-samples t test and arthritis history information (e.g., time since diagnosis)
was analyzed descriptively. The independent variable in this study was mode of exercise
(aquatic treadmill or land treadmill) and the dependent variables were gait kinematics
(maximum and minimum joint angles and angular velocity, step length, and step rate),
perceived pain, and the Self-Efficacy scale. A gain score was computed and used for
statistical comparisons between conditions. Gain scores may provide reliable insight
into individual differences between conditions and are appropriate when variability may
be high within participants (Williams & Zimmerman, 1996; Zimmerman & Williams,
1982). For example, OA patients often display high variability in perceived pain
between days (Hochberg et al., 1995), preventing a stable base for comparisons. In the
present study, negative gain scores will indicate that pretest scores are greater than
posttest scores and positive gain scores will indicate the opposite.
The nonparametric Wilcoxon signed rank test was used to compare gait
kinematics, perceived pain, and self-efficacy scores between conditions. This
nonparametric test was selected because of the small sample size and because of the
arthritis related variability among participants and the probable effect this variability had
on the normal distribution of scores. Significant differences for pain and self-efficacy
scores were based on an alpha level set at 0.05. However, a Holm‟s correction to the

42
0.05 level was made for kinematic comparisons because of the large number of
comparisons (i.e., 432) (Lundbrook, 1998) and the risk this poses on misinterpreting a
true Type I error (Knudson, 2009). To help clinicians better interpret any significant or
non-significant results, the median difference in gain scores between conditions and their
95% confidence intervals (CI) were calculated.
Results
Data from all participants were used in the statistical analyses, although some
data (i.e., post aquatic treadmill data) were missing from one participant that was unable
to complete testing do to scheduling conflicts. Pairwise comparisons of the self-selected
speeds during exercise indicated they were not different between aquatic (0.76 ± 0.24
m/s) and land (0.80 ± 0.26 m/s) treadmill exercise (p = 0.13). The descriptive results
from arthritis history questionnaire revealed that, on average, the amount of time
between the diagnosis and testing in our laboratory was 7.88 ( 6.73) yrs and that the
knee was the primary arthritic joint (Table 3).
Joint Angles and Angular Velocity
Joint angle and angular velocity gain scores that were significantly different at
the p = 0.05 level are shown in Tables 4-6. A typical joint angle pattern for the gait
cycle at the ankle, knee, and hip are shown in Figures 5-10. After adjusting p values
using the Holm‟s correction, the angular velocity gain score during stance for left knee
extension was significantly higher for aquatic treadmill exercise by 38.1% (p = 0.004;
Table 7). Similarly during swing the gain scores for angular velocity were also greater

43
for left knee internal rotation and extension by 65% and 20%, respectively (p = 0.004, p
= 0.008; Tables 8, 9). During stance, the joint angle gain score for left hip flexion was
greater for land exercise by 7% (p = 0.007; Table 10). Similarly during swing the
angular velocity gain score for right hip extension was significantly greater for aquatic
exercise by 28% (p = 0.01; Table 8). Only the joint angle gain score for left ankle
abduction during stance was significantly higher for land exercise by 4.72% (p = 0.003;
Table 10). No other joint angle gain scores for either stance or swing were significantly
different for either condition (p = 0.06-0.96; Tables 11-14).
Confidence Intervals
Table 4-6 presents the confidence intervals (95% CI) for all kinematic variables
reaching the alpha level of 0.05. Not surprising, the width of confidence intervals
computed were high given the small sample. More specifically, it may be observed in
Table 4-6 that there is a 95% chance that the confidence intervals calculated (left knee
extension angular velocity for stance, left knee internal rotation angular velocity for
swing, right knee extension angular velocity for stance, left ankle abduction angular
velocity during stance, left hip flexion during stance, and right hip flexion angular
velocity during swing (29.1, 88.2), (-190, -52.6), (20.6, 109), (3.89, 19.8), (3.23, 15.2), (-
48.7, -11.2)) contains the true population median difference.
Perceived Pain, Self-Efficacy, and Step Rate and Length
Perceived pain was 100% greater for land than aquatic treadmill exercise (p =
0.02; Table 15) and self-efficacy gain scores were not different between conditions (p =

44
0.37). Step rate and step length gain scores were not different between conditions (p =
0.31 - 0.92; Table 16).
Discussion
Although physical therapists provide numerous exercises for patients with OA of
the knee, there is little scientific evidence to confirm whether certain modalities of
exercise are more advantageous than others for treatment of the disease (Callaghan &
Oldham, 1995). Many studies have compared knee kinematic gait variables, pain, and
self-efficacy of adults with OA with normal, healthy, controls (Huang, Lin, Yang, & Lee,
2003; Kaufman et al., 2001). The unique aspect of the present study is that the authors
examined the effectiveness of aquatic therapy on gait kinematics before and after aquatic
training using a three-dimensional approach analyzing changes at not just the knee, but
also at the hip and ankle.
Hip, knee, and ankle kinematics were affected over the course of the acute
training periods (Tables 3-11) and our gait kinematic values were consistent with
previous research measuring joint kinematics of patients with OA (Al-Zahrani & Bakheit,
2002; Messier, 1994; Walker et al., 2001). For example, Walker et al. (2001) reported an
average knee extension angle of 177°, which is consistent with our max knee extension
values (171°; Table 10). Huang et al. (2008) reported an average value for hip extension
during stance of 170°, which is also consistent with our hip extension values (165°; Table
10). It should be noted that studies used for comparisons did not use an intervention,
such as the present study.

45
Surprisingly, hip flexion gain scores were significantly greater for land exercise
than water, proposing that land treadmill exercise may be more likely to increase hip
flexion. However, this result may also suggest that after an acute bout of land exercise
compensatory deviations, such as excessive hip flexion, take place to overcome limited
range of motion at the knee and ankle. An increase in hip flexion would allow the
patient to overcome problems caused by the disease or difficulties the patient cannot
control. These findings may indicate that land exercise decreases knee rehabilitation
(Los Amigos Research and Education Institute, 2001).
Angular velocity gain scores for knee extension during stance, knee internal
rotation during swing, and knee extension during swing were significantly greater for
aquatic exercise over land. Similarly, angular velocity gain scores for ankle abduction
during stance, and hip flexion during swing were also greater for aquatic exercise over
land. These increases in angular velocity are important because the values may be close
to those of a normal population. The present study observed maximal knee angular
velocity during swing after aquatic exercise to be 337 °/s. These findings suggest that
aquatic therapy may be more beneficial for improving the angular velocity of a joint,
such as the knee, hip, or ankle. Radin, Yang, Riegger, Kish, and O'Connor (1991)
observed angular velocity scores during natural gait for a normal healthy population. The
authors reported maximal knee angular velocity during swing to be 403 °/s.
The mechanism for increasing angular velocity could be due to the unique
environment of the aquatic exercise, when aquatic, there is an increased resistance to
movement due to the drag force exerted by water against the segments of the body
46
(Barela & Duarte, 2008). Barela et al. suggested that to maintain a constant speed
aquatic it is necessary to generate an impulse to overcome the drag force in the
horizontal direction. The participants in the present study walked on an aquatic treadmill
versus walking in a pool, which meant that only limbs were moving through the water
rather than limbs plus their body, which lowered the overall fluid resistance. The
aquatic environment could perhaps strengthen the neuromuscular aspects of certain
muscles that affect lower limb kinematics, such as the quadriceps in effort to overcome
this increase in fluid resistance that influences joint angular velocity. Previous studies
(Huang et al., 2003; Marks, 1993) have demonstrated that strengthening the quadriceps
musculature with resistance exercise was associated with significant improvements in
pain and function.
Although significant differences were found in joint velocity and angle gain
scores between land and aquatic exercises, no differences were found between step rate
and step length, which suggest the differences found in angles and angular velocities,
had no influence on the step length or step rate during walking. In a similarly designed
study, Denning et al. (2010) observed mobility, based on Timed Up and Go scores,
improved after an acute bout of aquatic training as opposed to land training, but also
found no differences between stride rate and stride length. These similar findings could
infer that neuromuscular aspects of the body and balance improved, rather than walking
speed and step length. It should be noted that the present study was not designed to
encourage walking speed. The participants were asked to walk at their own comfortable
47
speed, had the study also included another condition in which participants were asked to
walk as fast as possible, there may have been differences in step rate and step length.
Results of this study indicated that patients with OA of the knee might have less
arthritis related joint pain by training on an aquatic treadmill as opposed to a land-based
treadmill. Wang et al. (2007) and Patrick et al. (2001) studied the effects of aquatic
exercise on self-reported pain, and did not observe changes in pain. This disagreement
between studies may be due to differences in several reasons, such as how and when an
assessment was administered, and the type of assessment. The current study targeted
pain only related to knee OA. Previous studies investigating the effectiveness of aquatic
therapy have also demonstrated decreases in arthritis related joint pain after therapy. For
example, Denning et al. (2010) detected perceived joint pain was less immediately after
aquatic versus land exercise, utilizing a visual analog scale, and was 140% greater after
aquatic exercise versus land. The present study also detected improvements in perceived
joint pain after three bouts of aquatic training compared to land, by 100%. Although the
exact mechanism for the reduction in pain is unknown, previous authors have concluded
that the benefits may be related to buoyancy, warmth, and pressure of the water (Barela
& Duarte, 2008; Denning et al., 2010; Hinman et al., 2007)
This preliminary study failed to find any difference between the two modalities
of training for improvements in self-efficacy gain scores. Prior studies have on the
contrary; found that exercise therapy can increase scores in self-efficacy (Ahern,
Nicholls, Simionato, Clark, & Bond, 1995; Focht et al., 2005). Focht et al. (2005)
observed significant improvements after a four-day study in self-efficacy. It is possible

48
that in the current study the participants overestimated their potential in walking a
certain number of laps around the gym, and assumed they could complete more than
they could prior to starting the physical exercise. After the bouts of exercise, they may
have had a more accurate idea of their physical capabilities at follow up, and therefore
had no significant differences between scores.
There are a number of limitations of the study that may have influenced the
results and application of results. Skin motion, particularly in participants who are
overweight or obese, causes marker motion relative to the underlying bone. This
movement affects the estimation of the gait kinematics, and is considered the most
critical source of error in human movement analysis (Leardini, Chiari, Della Croce, &
Cappozzo, 2005). Of the lower limb segments, the thigh is the greatest source of this
soft tissue artifact. Leardini et al. (2005) have recommended motion about other axes
other than the flexion/extension axis should be observed carefully, as this artifact can
produce false effects with magnitudes comparable to the amount of motion actually
occurring at the joint. Therefore, due to the effects of soft tissue artifact the authors of
the present study suggest interpreting the results of the kinematics section with caution.
Also, patients with OA completed measurements before and after only three exercise
sessions. Increasing the length of the training period may produce alternative outcomes
that would affect the gait kinematics and self-efficacy of the participants. While this was
a limitation, three exercise sessions were long enough for neuromuscular changes to take
place, and these results are supported by Denning et al. (2010) who demonstrated that
VO2 leveled of after the second exercise session.

49
It should be noted that in addition to kinematic and self-reported measurements,
participants in the present study gave subjective comments and all had preference to the
aquatic treadmill over the land treadmill. Generally the participants stated they enjoyed
how they felt in the water and were interested in continuing the aquatic exercise after
ending the study. However, due to the lack of aquatic treadmills in the community at the
time, most participants were unable to continue the training, which could be considered a
temporary shortcoming for aquatic treadmill training.
Conclusion
The present study demonstrated that an acute training period on an aquatic treadmill
tended to increase select joint angular velocities and decrease arthritis related joint pain.
Although some acute effects of training (i.e., pain, angular velocity) improved after
aquatic training compared to land, it is unclear whether or not aquatic exercise is a better
long-term alternative to land exercise as further longitudinal research is needed to
examine gait kinematic changes after an increased training period of aquatic exercise.
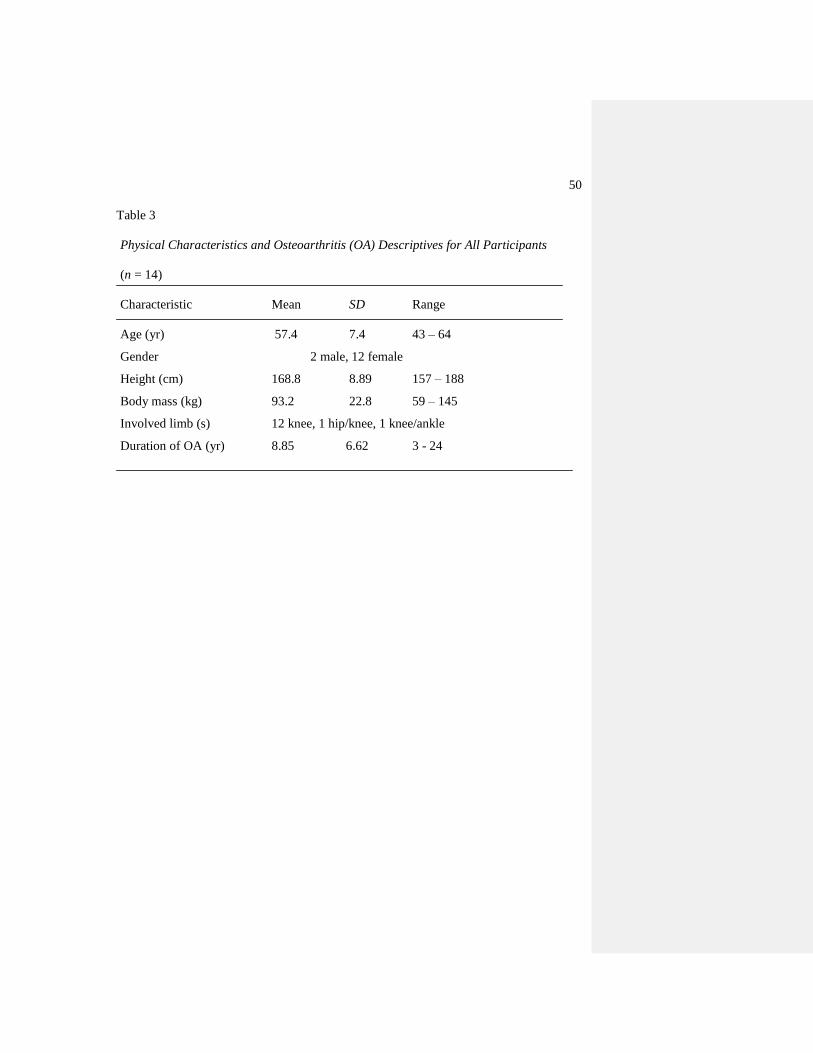
50
Table 3
Physical Characteristics and Osteoarthritis (OA) Descriptives for All Participants
(n = 14)
Characteristic Mean SD Range
Age (yr) 57.4 7.4 43 – 64
Gender 2 male, 12 female
Height (cm) 168.8 8.89 157 – 188
Body mass (kg) 93.2 22.8 59 – 145
Involved limb (s) 12 knee, 1 hip/knee, 1 knee/ankle
Duration of OA (yr) 8.85 6.62 3 - 24

51
Table 4

52
Knee Kinematic Variables Significant at the 0.05 Level and the 95% Confidence
Interval
Comparisons
p value
Holm‟s adjusted
value
95% CI
Land vs aquatic stance max
angular velocity for left knee
(Sagittal)
0.004 0.05/8 = 0.006 60.8 (29.1, 88.2)*
Land vs aquatic swing min
angular velocity for left knee
(Transverse)
0.004 0.05/7 = 0.007 -125 (-190, -52.6)*
Land vs aquatic swing max
angular velocity for left knee
(Sagittal)
0.008 0.05/6 = 0.008 62.4 (20.6, 109)*
Land vs aquatic stance max
angular velocity for right knee
(Sagittal)
0.02 0.05/5 = 0.01 42.6 (10.7, 73.7)
Land vs aquatic swing min
angular position for left knee
(Sagittal)
0.02 0.05/4 = 0.01 -6.46 (-15.6, -0.38)
Land vs aquatic stance max
angular position for right knee
(Frontal)
0.04 0.05/3 = 0.02 36.3 (3.47, 67.9)
Land vs aquatic stance min
angular position for right knee
(Frontal)
0.05 0.05/1 = 0.05 -3.91 (-8.70, -0.11)
* significant at the adjusted level
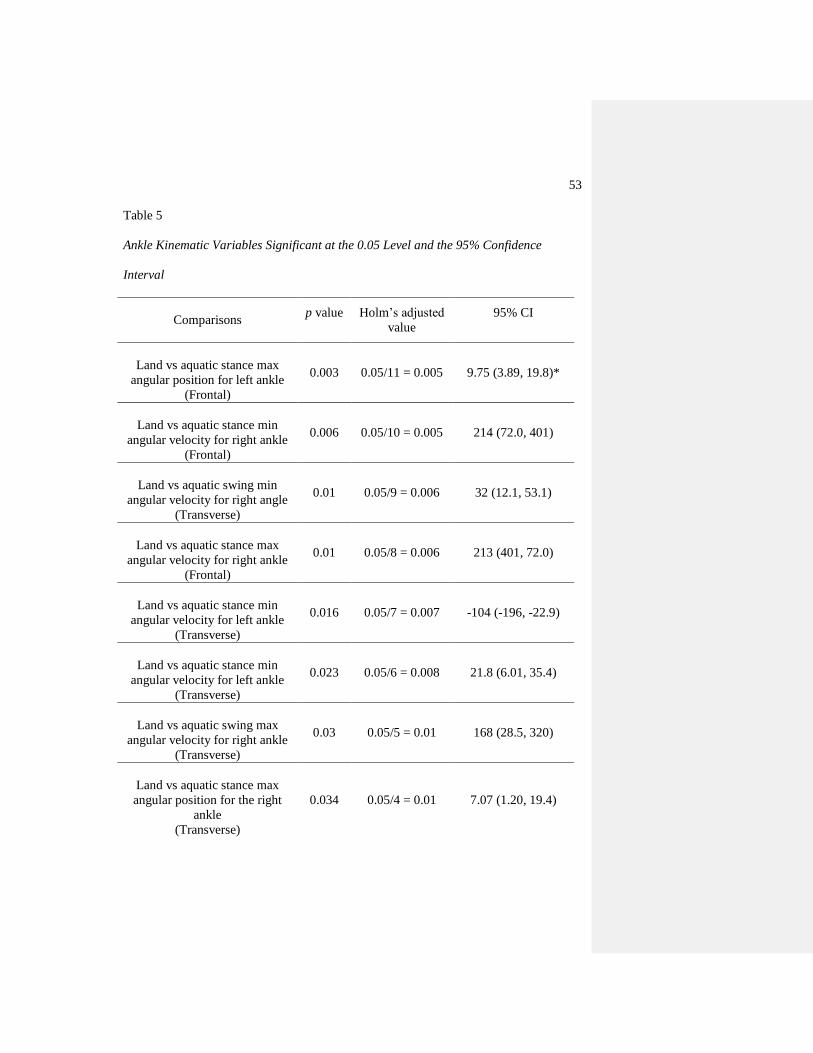
53
Table 5
Ankle Kinematic Variables Significant at the 0.05 Level and the 95% Confidence
Interval
Comparisons
p value
Holm‟s adjusted
value
95% CI
Land vs aquatic stance max
angular position for left ankle
(Frontal)
0.003 0.05/11 = 0.005 9.75 (3.89, 19.8)*
Land vs aquatic stance min
angular velocity for right ankle
(Frontal)
0.006 0.05/10 = 0.005 214 (72.0, 401)
Land vs aquatic swing min
angular velocity for right angle
(Transverse)
0.01 0.05/9 = 0.006 32 (12.1, 53.1)
Land vs aquatic stance max
angular velocity for right ankle
(Frontal)
0.01 0.05/8 = 0.006 213 (401, 72.0)
Land vs aquatic stance min
angular velocity for left ankle
(Transverse)
0.016 0.05/7 = 0.007 -104 (-196, -22.9)
Land vs aquatic stance min
angular velocity for left ankle
(Transverse)
0.023 0.05/6 = 0.008 21.8 (6.01, 35.4)
Land vs aquatic swing max
angular velocity for right ankle
(Transverse)
0.03 0.05/5 = 0.01 168 (28.5, 320)
Land vs aquatic stance max
angular position for the right
ankle
(Transverse)
0.034 0.05/4 = 0.01 7.07 (1.20, 19.4)
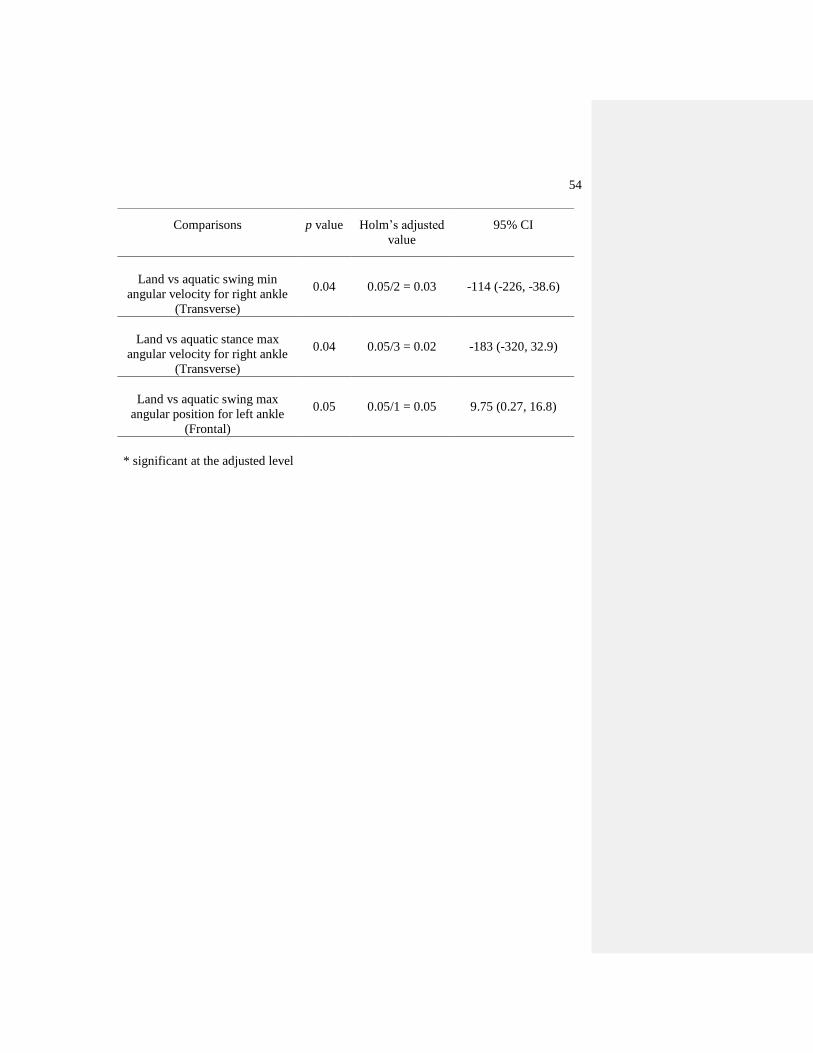
54
Comparisons
p value
Holm‟s adjusted
value
95% CI
Land vs aquatic swing min
angular velocity for right ankle
(Transverse)
0.04 0.05/2 = 0.03 -114 (-226, -38.6)
Land vs aquatic stance max
angular velocity for right ankle
(Transverse)
0.04 0.05/3 = 0.02 -183 (-320, 32.9)
Land vs aquatic swing max
angular position for left ankle
(Frontal)
0.05 0.05/1 = 0.05 9.75 (0.27, 16.8)
* significant at the adjusted level
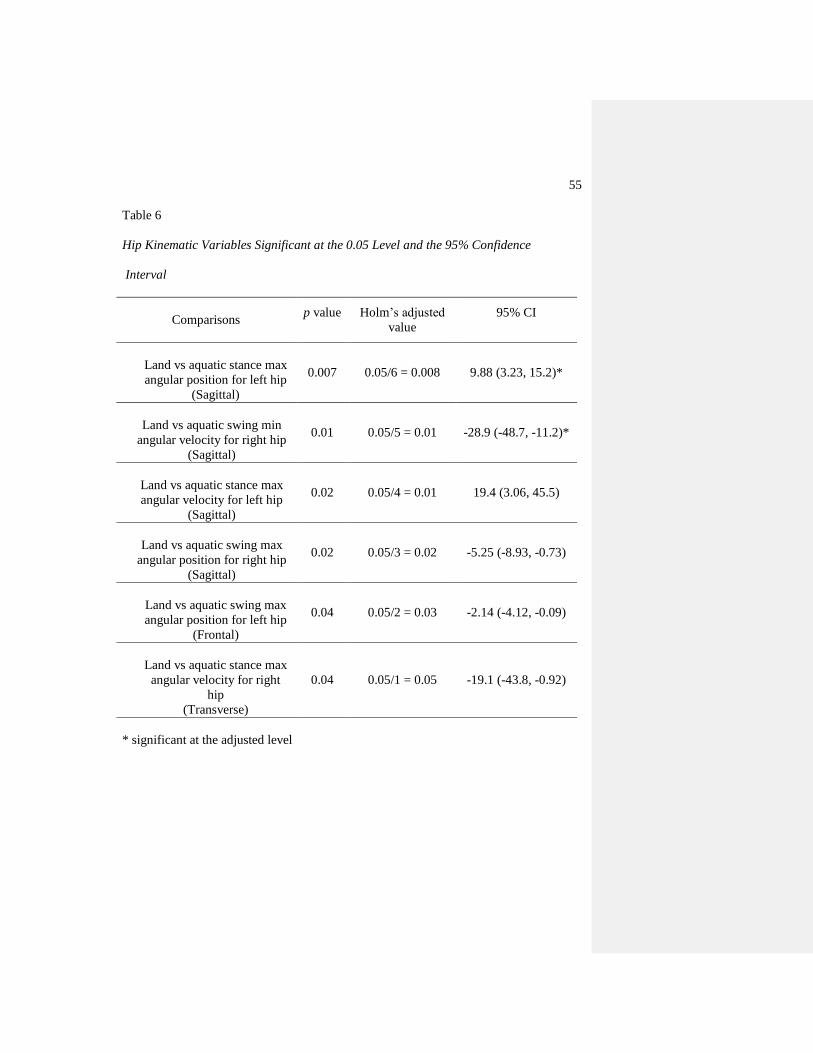
55
Table 6
Hip Kinematic Variables Significant at the 0.05 Level and the 95% Confidence
Interval
Comparisons
p value
Holm‟s adjusted
value
95% CI
Land vs aquatic stance max
angular position for left hip
(Sagittal)
0.007 0.05/6 = 0.008 9.88 (3.23, 15.2)*
Land vs aquatic swing min
angular velocity for right hip
(Sagittal)
0.01 0.05/5 = 0.01 -28.9 (-48.7, -11.2)*
Land vs aquatic stance max
angular velocity for left hip
(Sagittal)
0.02 0.05/4 = 0.01 19.4 (3.06, 45.5)
Land vs aquatic swing max
angular position for right hip
(Sagittal)
0.02 0.05/3 = 0.02 -5.25 (-8.93, -0.73)
Land vs aquatic swing max
angular position for left hip
(Frontal)
0.04 0.05/2 = 0.03 -2.14 (-4.12, -0.09)
Land vs aquatic stance max
angular velocity for right
hip
(Transverse)
0.04 0.05/1 = 0.05 -19.1 (-43.8, -0.92)
* significant at the adjusted level
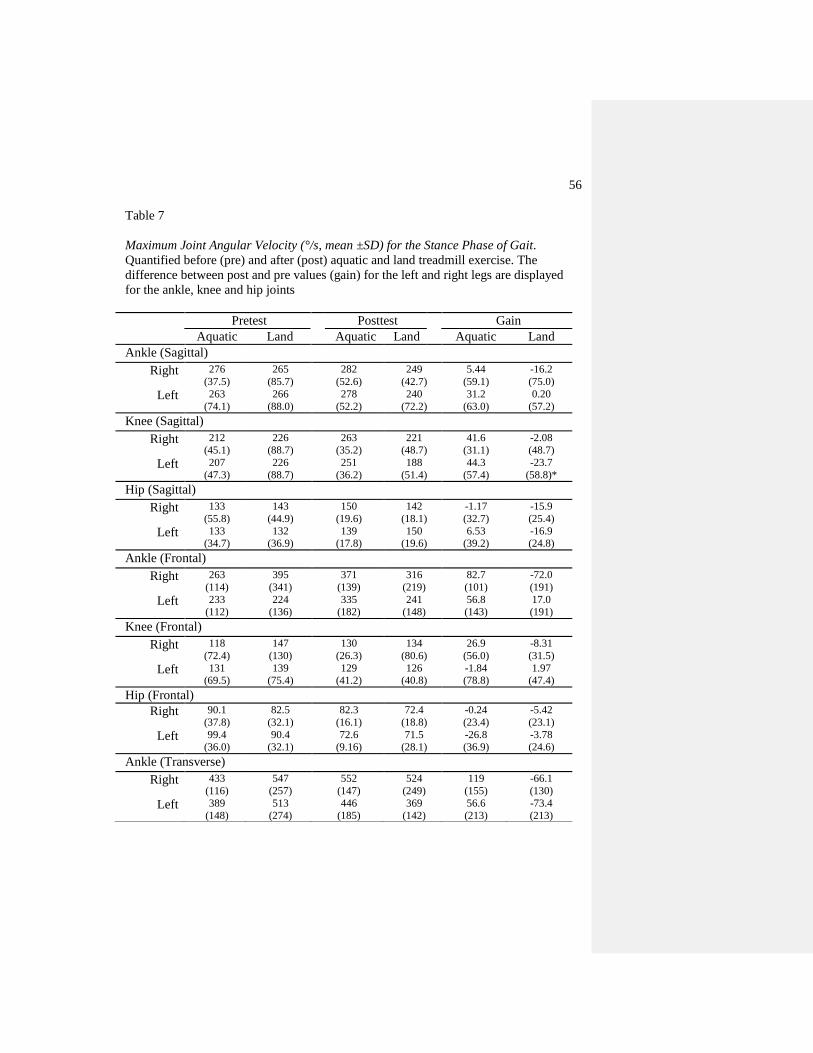
56
Table 7
Maximum Joint Angular Velocity (°/s, mean ±SD) for the Stance Phase of Gait.
Quantified before (pre) and after (post) aquatic and land treadmill exercise. The
difference between post and pre values (gain) for the left and right legs are displayed
for the ankle, knee and hip joints
Pretest Posttest Gain
Aquatic Land Aquatic Land Aquatic Land
Ankle (Sagittal)
Right 276
(37.5)
265
(85.7)
282
(52.6)
249
(42.7)
5.44
(59.1)
-16.2
(75.0)
Left 263
(74.1)
266
(88.0)
278
(52.2)
240
(72.2)
31.2
(63.0)
0.20
(57.2)
Knee (Sagittal)
Right 212
(45.1)
226
(88.7)
263
(35.2)
221
(48.7)
41.6
(31.1)
-2.08
(48.7)
Left 207
(47.3)
226
(88.7)
251
(36.2)
188
(51.4)
44.3
(57.4)
-23.7
(58.8)*
Hip (Sagittal)
Right 133
(55.8)
143
(44.9)
150
(19.6)
142
(18.1)
-1.17
(32.7)
-15.9
(25.4)
Left 133
(34.7)
132
(36.9)
139
(17.8)
150
(19.6)
6.53
(39.2)
-16.9
(24.8)
Ankle (Frontal)
Right 263
(114)
395
(341)
371
(139)
316
(219)
82.7
(101)
-72.0
(191)
Left 233
(112)
224
(136)
335
(182)
241
(148)
56.8
(143)
17.0
(191)
Knee (Frontal)
Right 118
(72.4)
147
(130)
130
(26.3)
134
(80.6)
26.9
(56.0)
-8.31
(31.5)
Left 131
(69.5)
139
(75.4)
129
(41.2)
126
(40.8)
-1.84
(78.8)
1.97
(47.4)
Hip (Frontal)
Right 90.1
(37.8)
82.5
(32.1)
82.3
(16.1)
72.4
(18.8)
-0.24
(23.4)
-5.42
(23.1)
Left 99.4
(36.0)
90.4
(32.1)
72.6
(9.16)
71.5
(28.1)
-26.8
(36.9)
-3.78
(24.6)
Ankle (Transverse)
Right 433
(116)
547
(257)
552
(147)
524
(249)
119
(155)
-66.1
(130)
Left 389
(148)
513
(274)
446
(185)
369
(142)
56.6
(213)
-73.4
(213)
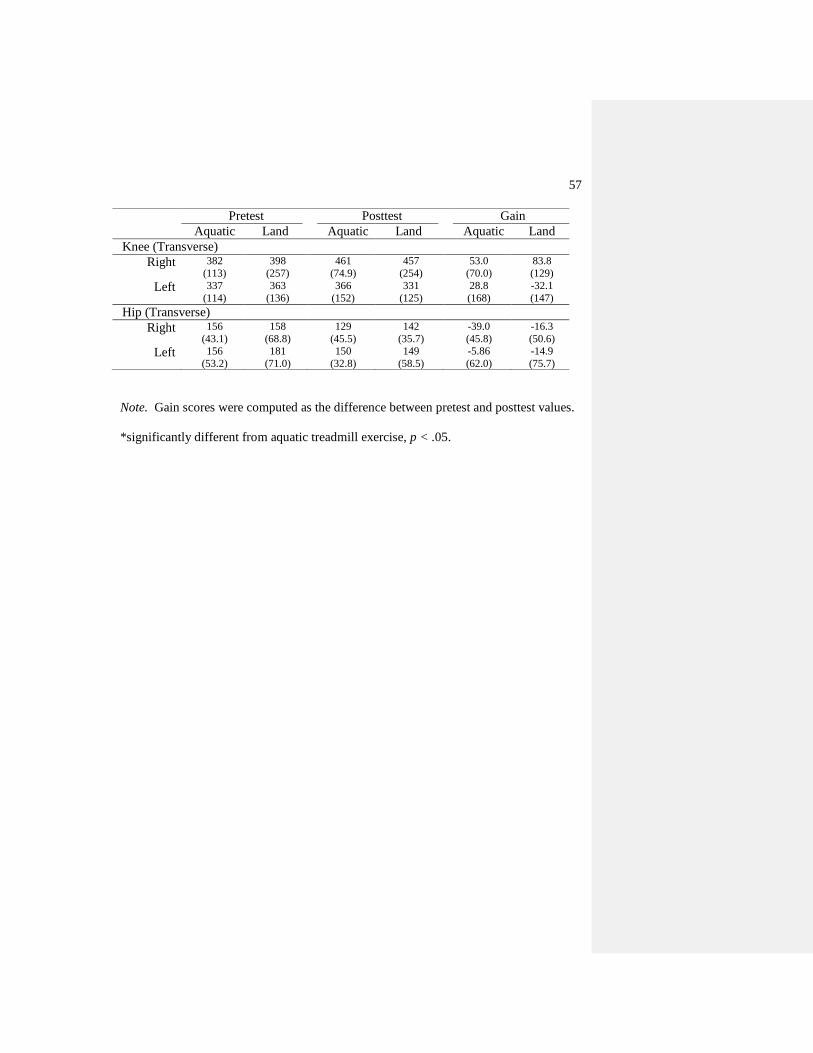
57
Note. Gain scores were computed as the difference between pretest and posttest values.
*significantly different from aquatic treadmill exercise, p < .05.
Pretest Posttest Gain
Aquatic Land Aquatic Land Aquatic Land
Knee (Transverse)
Right 382
(113)
398
(257)
461
(74.9)
457
(254)
53.0
(70.0)
83.8
(129)
Left 337
(114)
363
(136)
366
(152)
331
(125)
28.8
(168)
-32.1
(147)
Hip (Transverse)
Right 156
(43.1)
158
(68.8)
129
(45.5)
142
(35.7)
-39.0
(45.8)
-16.3
(50.6)
Left 156
(53.2)
181
(71.0)
150
(32.8)
149
(58.5)
-5.86
(62.0)
-14.9
(75.7)
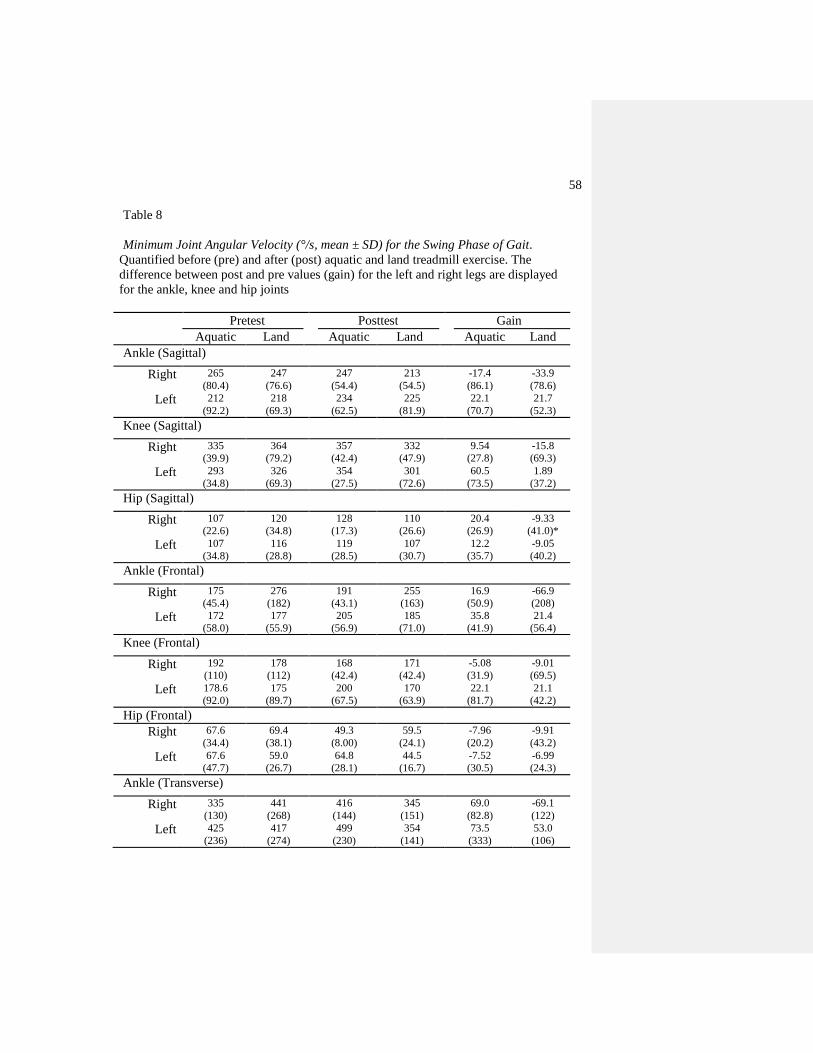
58
Table 8
Minimum Joint Angular Velocity (°/s, mean ± SD) for the Swing Phase of Gait.
Quantified before (pre) and after (post) aquatic and land treadmill exercise. The
difference between post and pre values (gain) for the left and right legs are displayed
for the ankle, knee and hip joints
Pretest Posttest Gain
Aquatic Land Aquatic Land Aquatic Land
Ankle (Sagittal)
Right 265
(80.4)
247
(76.6)
247
(54.4)
213
(54.5)
-17.4
(86.1)
-33.9
(78.6)
Left 212
(92.2)
218
(69.3)
234
(62.5)
225
(81.9)
22.1
(70.7)
21.7
(52.3)
Knee (Sagittal)
Right 335
(39.9)
364
(79.2)
357
(42.4)
332
(47.9)
9.54
(27.8)
-15.8
(69.3)
Left 293
(34.8)
326
(69.3)
354
(27.5)
301
(72.6)
60.5
(73.5)
1.89
(37.2)
Hip (Sagittal)
Right 107
(22.6)
120
(34.8)
128
(17.3)
110
(26.6)
20.4
(26.9)
-9.33
(41.0)*
Left 107
(34.8)
116
(28.8)
119
(28.5)
107
(30.7)
12.2
(35.7)
-9.05
(40.2)
Ankle (Frontal)
Right 175
(45.4)
276
(182)
191
(43.1)
255
(163)
16.9
(50.9)
-66.9
(208)
Left 172
(58.0)
177
(55.9)
205
(56.9)
185
(71.0)
35.8
(41.9)
21.4
(56.4)
Knee (Frontal)
Right 192
(110)
178
(112)
168
(42.4)
171
(42.4)
-5.08
(31.9)
-9.01
(69.5)
Left 178.6
(92.0)
175
(89.7)
200
(67.5)
170
(63.9)
22.1
(81.7)
21.1
(42.2)
Hip (Frontal)
Right 67.6
(34.4)
69.4
(38.1)
49.3
(8.00)
59.5
(24.1)
-7.96
(20.2)
-9.91
(43.2)
Left 67.6
(47.7)
59.0
(26.7)
64.8
(28.1)
44.5
(16.7)
-7.52
(30.5)
-6.99
(24.3)
Ankle (Transverse)
Right 335
(130)
441
(268)
416
(144)
345
(151)
69.0
(82.8)
-69.1
(122)
Left 425
(236)
417
(274)
499
(230)
354
(141)
73.5
(333)
53.0
(106)
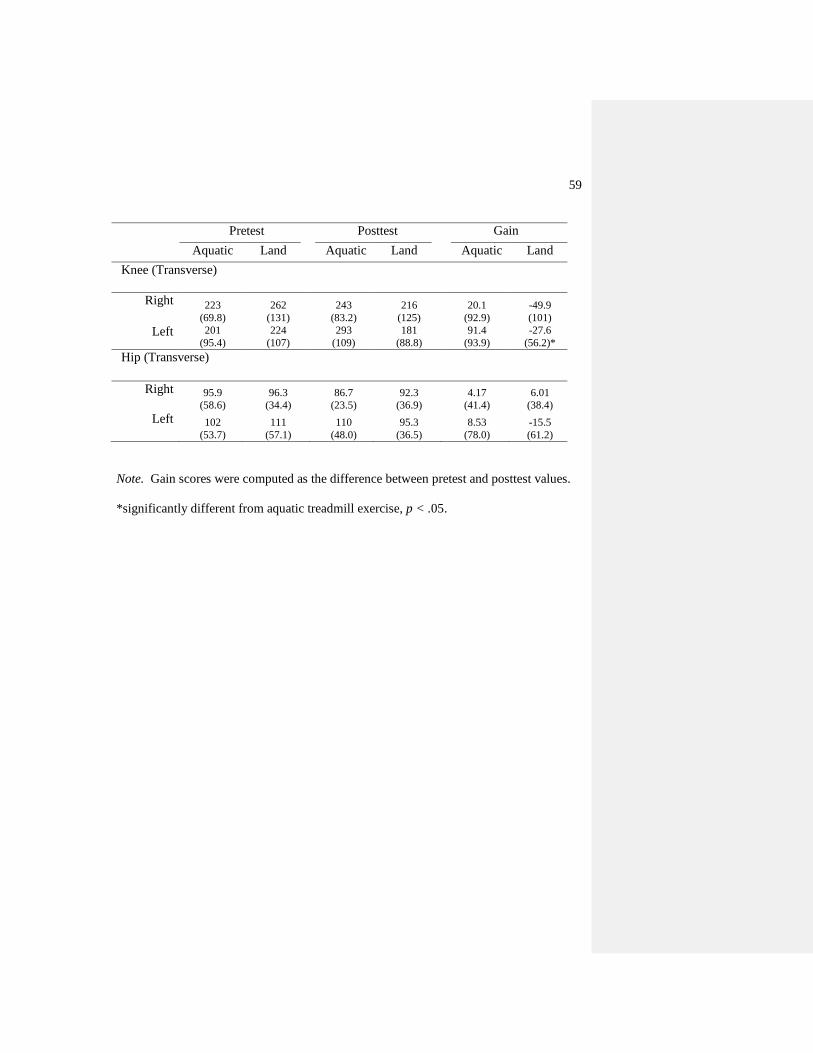
59
Pretest Posttest Gain
Aquatic Land Aquatic Land Aquatic Land
Knee (Transverse)
Right 223
(69.8)
262
(131)
243
(83.2)
216
(125)
20.1
(92.9)
-49.9
(101)
Left 201
(95.4)
224
(107)
293
(109)
181
(88.8)
91.4
(93.9)
-27.6
(56.2)*
Hip (Transverse)
Right 95.9
(58.6)
96.3
(34.4)
86.7
(23.5)
92.3
(36.9)
4.17
(41.4)
6.01
(38.4)
Left 102
(53.7)
111
(57.1)
110
(48.0)
95.3
(36.5)
8.53
(78.0)
-15.5
(61.2)
Note. Gain scores were computed as the difference between pretest and posttest values.
*significantly different from aquatic treadmill exercise, p < .05.
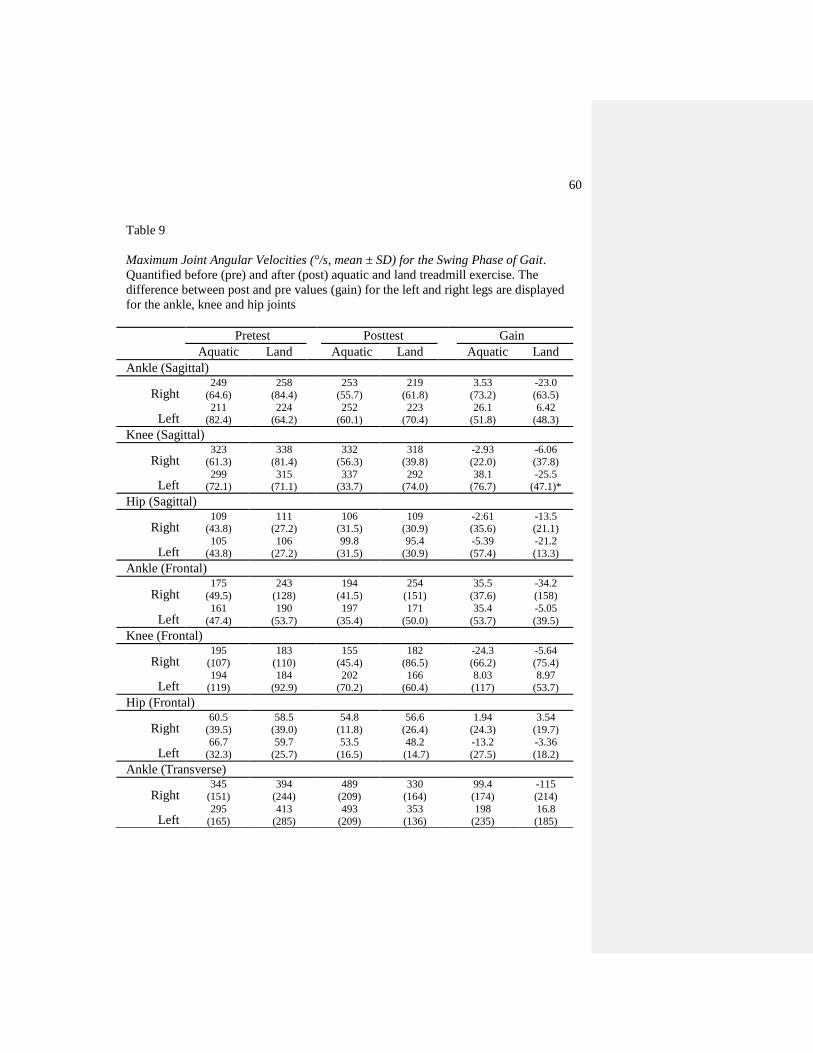
60
Table 9
Maximum Joint Angular Velocities (°/s, mean ± SD) for the Swing Phase of Gait.
Quantified before (pre) and after (post) aquatic and land treadmill exercise. The
difference between post and pre values (gain) for the left and right legs are displayed
for the ankle, knee and hip joints
Pretest Posttest Gain
Aquatic Land Aquatic Land Aquatic Land
Ankle (Sagittal)
Right 249
(64.6)
258
(84.4)
253
(55.7)
219
(61.8)
3.53
(73.2)
-23.0
(63.5)
Left 211
(82.4)
224
(64.2)
252
(60.1)
223
(70.4)
26.1
(51.8)
6.42
(48.3)
Knee (Sagittal)
Right 323
(61.3)
338
(81.4)
332
(56.3)
318
(39.8)
-2.93
(22.0)
-6.06
(37.8)
Left 299
(72.1)
315
(71.1)
337
(33.7)
292
(74.0)
38.1
(76.7)
-25.5
(47.1)*
Hip (Sagittal)
Right 109
(43.8)
111
(27.2)
106
(31.5)
109
(30.9)
-2.61
(35.6)
-13.5
(21.1)
Left 105
(43.8)
106
(27.2)
99.8
(31.5)
95.4
(30.9)
-5.39
(57.4)
-21.2
(13.3)
Ankle (Frontal)
Right 175
(49.5)
243
(128)
194
(41.5)
254
(151)
35.5
(37.6)
-34.2
(158)
Left 161
(47.4)
190
(53.7)
197
(35.4)
171
(50.0)
35.4
(53.7)
-5.05
(39.5)
Knee (Frontal)
Right 195
(107)
183
(110)
155
(45.4)
182
(86.5)
-24.3
(66.2)
-5.64
(75.4)
Left 194
(119)
184
(92.9)
202
(70.2)
166
(60.4)
8.03
(117)
8.97
(53.7)
Hip (Frontal)
Right 60.5
(39.5)
58.5
(39.0)
54.8
(11.8)
56.6
(26.4)
1.94
(24.3)
3.54
(19.7)
Left 66.7
(32.3)
59.7
(25.7)
53.5
(16.5)
48.2
(14.7)
-13.2
(27.5)
-3.36
(18.2)
Ankle (Transverse)
Right 345
(151)
394
(244)
489
(209)
330
(164)
99.4
(174)
-115
(214)
Left 295
(165)
413
(285)
493
(209)
353
(136)
198
(235)
16.8
(185)
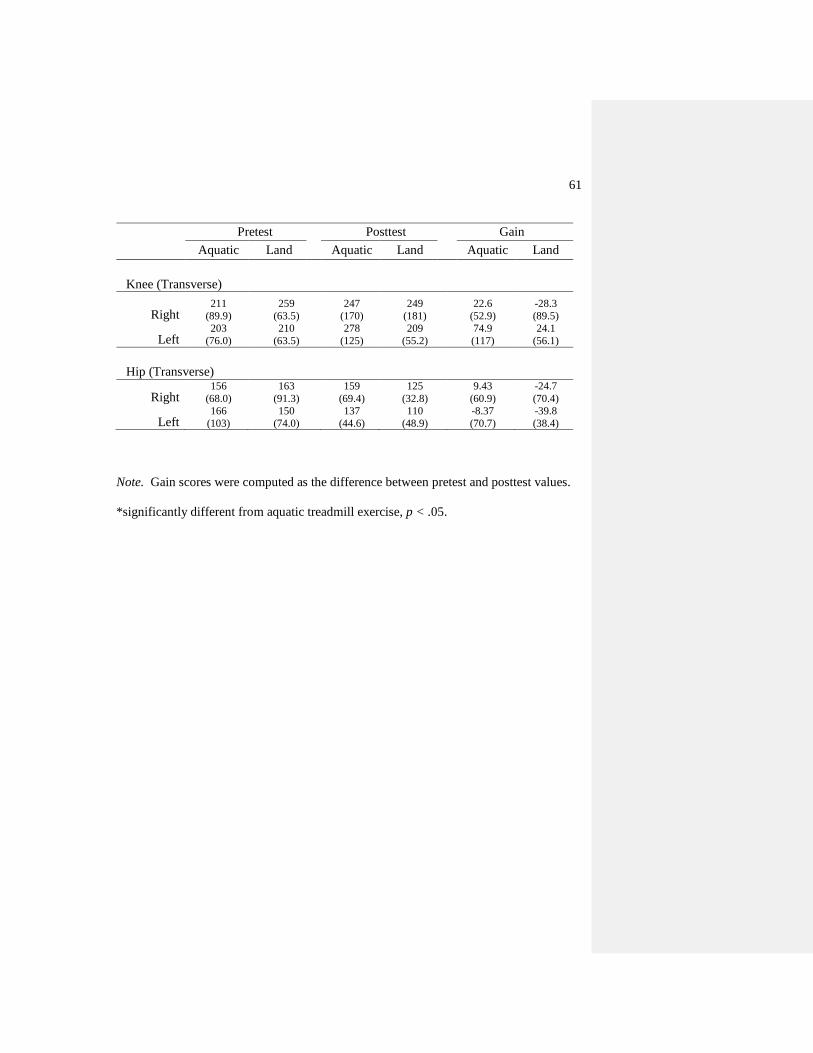
61
Note. Gain scores were computed as the difference between pretest and posttest values.
*significantly different from aquatic treadmill exercise, p < .05.
Pretest Posttest Gain
Aquatic Land Aquatic Land Aquatic Land
Knee (Transverse)
Right 211
(89.9)
259
(63.5)
247
(170)
249
(181)
22.6
(52.9)
-28.3
(89.5)
Left 203
(76.0)
210
(63.5)
278
(125)
209
(55.2)
74.9
(117)
24.1
(56.1)
Hip (Transverse)
Right 156
(68.0)
163
(91.3)
159
(69.4)
125
(32.8)
9.43
(60.9)
-24.7
(70.4)
Left 166
(103)
150
(74.0)
137
(44.6)
110
(48.9)
-8.37
(70.7)
-39.8
(38.4)
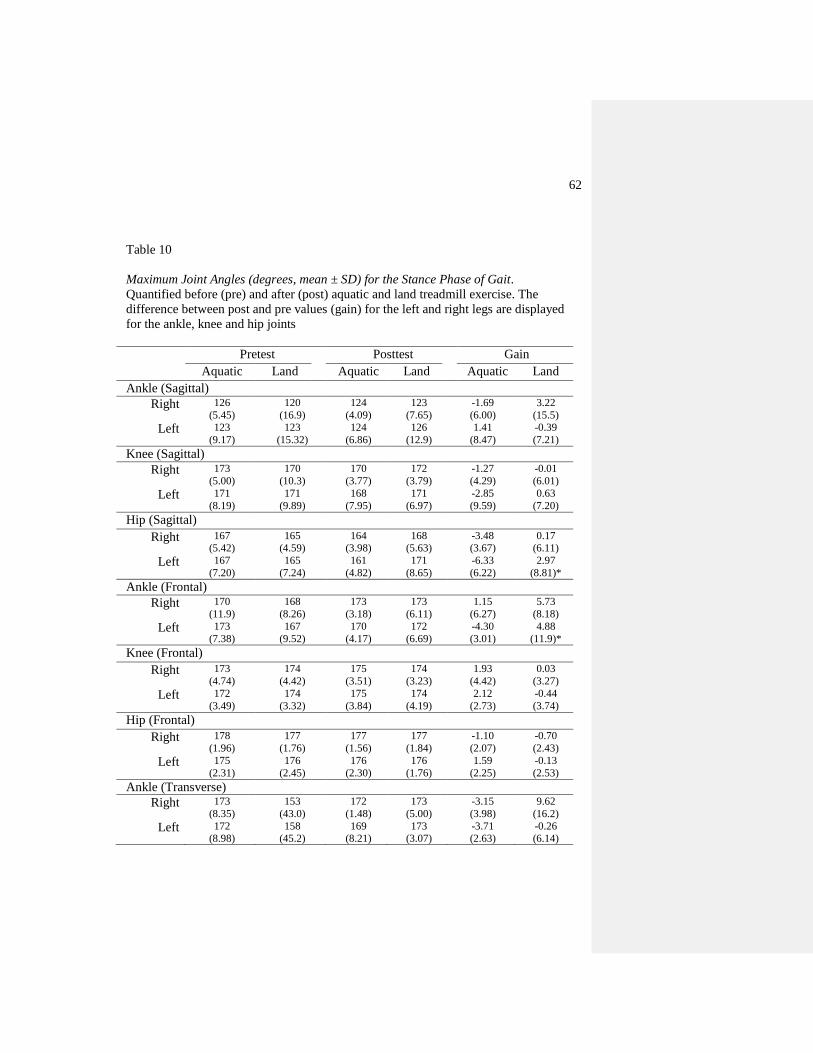
62
Table 10
Maximum Joint Angles (degrees, mean ± SD) for the Stance Phase of Gait.
Quantified before (pre) and after (post) aquatic and land treadmill exercise. The
difference between post and pre values (gain) for the left and right legs are displayed
for the ankle, knee and hip joints
Pretest Posttest Gain
Aquatic Land Aquatic Land Aquatic Land
Ankle (Sagittal)
Right 126
(5.45)
120
(16.9)
124
(4.09)
123
(7.65)
-1.69
(6.00)
3.22
(15.5)
Left 123
(9.17)
123
(15.32)
124
(6.86)
126
(12.9)
1.41
(8.47)
-0.39
(7.21)
Knee (Sagittal)
Right 173
(5.00)
170
(10.3)
170
(3.77)
172
(3.79)
-1.27
(4.29)
-0.01
(6.01)
Left 171
(8.19)
171
(9.89)
168
(7.95)
171
(6.97)
-2.85
(9.59)
0.63
(7.20)
Hip (Sagittal)
Right 167
(5.42)
165
(4.59)
164
(3.98)
168
(5.63)
-3.48
(3.67)
0.17
(6.11)
Left 167
(7.20)
165
(7.24)
161
(4.82)
171
(8.65)
-6.33
(6.22)
2.97
(8.81)*
Ankle (Frontal)
Right 170
(11.9)
168
(8.26)
173
(3.18)
173
(6.11)
1.15
(6.27)
5.73
(8.18)
Left 173
(7.38)
167
(9.52)
170
(4.17)
172
(6.69)
-4.30
(3.01)
4.88
(11.9)*
Knee (Frontal)
Right 173
(4.74)
174
(4.42)
175
(3.51)
174
(3.23)
1.93
(4.42)
0.03
(3.27)
Left 172
(3.49)
174
(3.32)
175
(3.84)
174
(4.19)
2.12
(2.73)
-0.44
(3.74)
Hip (Frontal)
Right 178
(1.96)
177
(1.76)
177
(1.56)
177
(1.84)
-1.10
(2.07)
-0.70
(2.43)
Left 175
(2.31)
176
(2.45)
176
(2.30)
176
(1.76)
1.59
(2.25)
-0.13
(2.53)
Ankle (Transverse)
Right 173
(8.35)
153
(43.0)
172
(1.48)
173
(5.00)
-3.15
(3.98)
9.62
(16.2)
Left 172
(8.98)
158
(45.2)
169
(8.21)
173
(3.07)
-3.71
(2.63)
-0.26
(6.14)
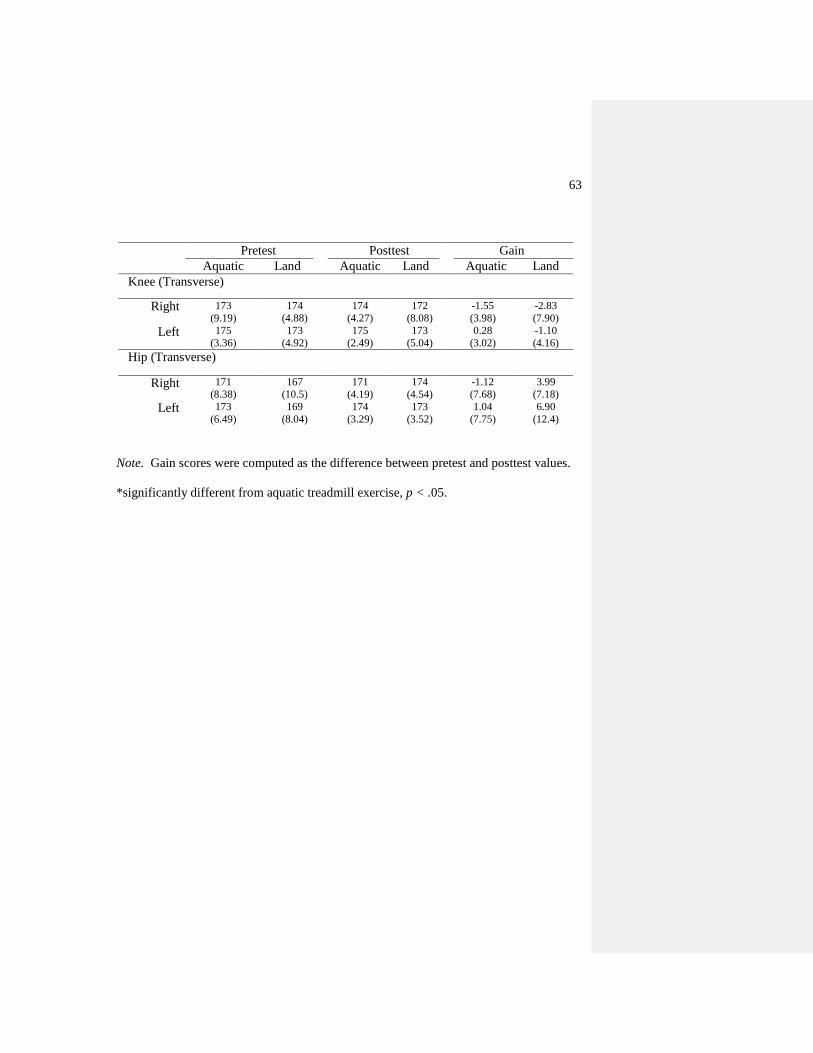
63
Note. Gain scores were computed as the difference between pretest and posttest values.
*significantly different from aquatic treadmill exercise, p < .05.
Pretest Posttest Gain
Aquatic Land Aquatic Land Aquatic Land
Knee (Transverse)
Right 173
(9.19)
174
(4.88)
174
(4.27)
172
(8.08)
-1.55
(3.98)
-2.83
(7.90)
Left 175
(3.36)
173
(4.92)
175
(2.49)
173
(5.04)
0.28
(3.02)
-1.10
(4.16)
Hip (Transverse)
Right 171
(8.38)
167
(10.5)
171
(4.19)
174
(4.54)
-1.12
(7.68)
3.99
(7.18)
Left 173
(6.49)
169
(8.04)
174
(3.29)
173
(3.52)
1.04
(7.75)
6.90
(12.4)
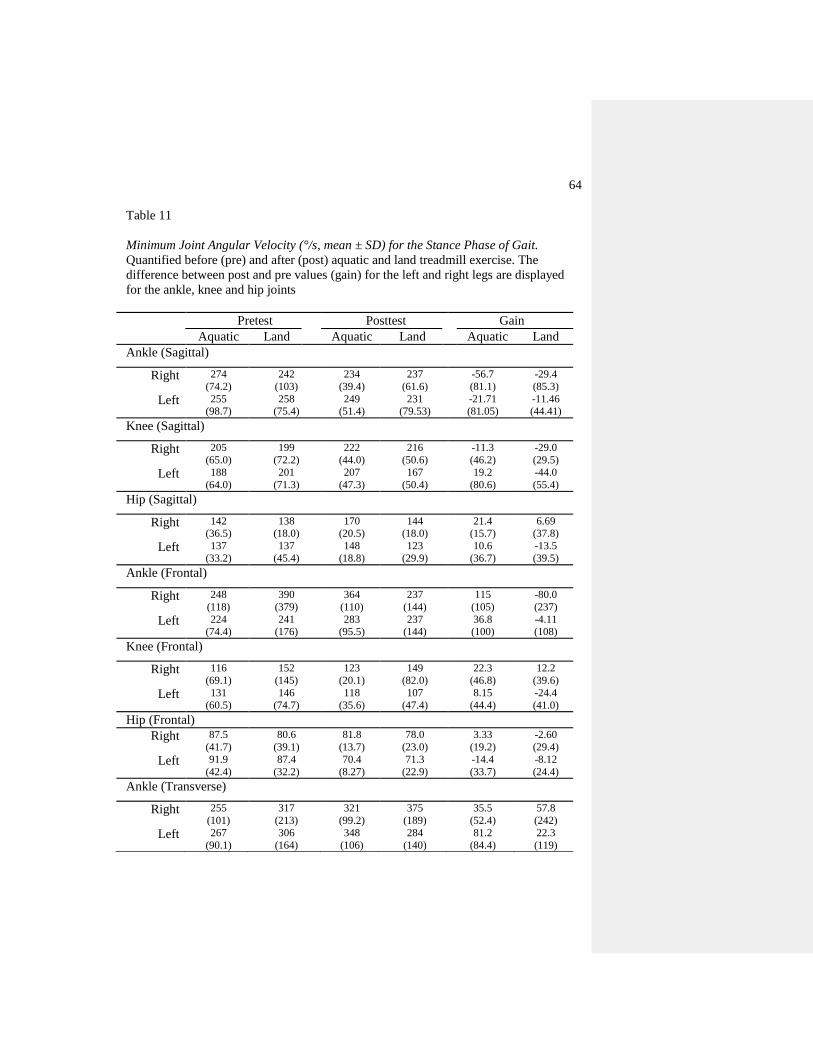
64
Table 11
Minimum Joint Angular Velocity (°/s, mean ± SD) for the Stance Phase of Gait.
Quantified before (pre) and after (post) aquatic and land treadmill exercise. The
difference between post and pre values (gain) for the left and right legs are displayed
for the ankle, knee and hip joints
Pretest Posttest Gain
Aquatic Land Aquatic Land Aquatic Land
Ankle (Sagittal)
Right 274
(74.2)
242
(103)
234
(39.4)
237
(61.6)
-56.7
(81.1)
-29.4
(85.3)
Left 255
(98.7)
258
(75.4)
249
(51.4)
231
(79.53)
-21.71
(81.05)
-11.46
(44.41)
Knee (Sagittal)
Right 205
(65.0)
199
(72.2)
222
(44.0)
216
(50.6)
-11.3
(46.2)
-29.0
(29.5)
Left 188
(64.0)
201
(71.3)
207
(47.3)
167
(50.4)
19.2
(80.6)
-44.0
(55.4)
Hip (Sagittal)
Right 142
(36.5)
138
(18.0)
170
(20.5)
144
(18.0)
21.4
(15.7)
6.69
(37.8)
Left 137
(33.2)
137
(45.4)
148
(18.8)
123
(29.9)
10.6
(36.7)
-13.5
(39.5)
Ankle (Frontal)
Right 248
(118)
390
(379)
364
(110)
237
(144)
115
(105)
-80.0
(237)
Left 224
(74.4)
241
(176)
283
(95.5)
237
(144)
36.8
(100)
-4.11
(108)
Knee (Frontal)
Right 116
(69.1)
152
(145)
123
(20.1)
149
(82.0)
22.3
(46.8)
12.2
(39.6)
Left 131
(60.5)
146
(74.7)
118
(35.6)
107
(47.4)
8.15
(44.4)
-24.4
(41.0)
Hip (Frontal)
Right 87.5
(41.7)
80.6
(39.1)
81.8
(13.7)
78.0
(23.0)
3.33
(19.2)
-2.60
(29.4)
Left 91.9
(42.4)
87.4
(32.2)
70.4
(8.27)
71.3
(22.9)
-14.4
(33.7)
-8.12
(24.4)
Ankle (Transverse)
Right 255
(101)
317
(213)
321
(99.2)
375
(189)
35.5
(52.4)
57.8
(242)
Left 267
(90.1)
306
(164)
348
(106)
284
(140)
81.2
(84.4)
22.3
(119)

65
Note. Gain scores were computed as the difference between pretest and posttest values.
*significantly different from aquatic treadmill exercise, p < .05.
Pretest Posttest Gain
Aquatic Land Aquatic Land Aquatic Land
Knee (Transverse)
Right 261
(131)
281
(136)
284
(109)
298
(125)
37.0
(82.1)
31.9
(144)
Left 266
(124)
276
(152)
303
(80.7)
265
(156)
36.1
(94.1)
13.3
(139)
Hip (Transverse)
Right 116
(39.1)
128
(29.9)
124
(43.1)
123
(51.4)
7.87
(62.0)
-14.8
(37.1)
Left 125
(44.4)
158
(62.7)
126
(20.8)
133
(52.8)
-6.64
(38.5)
-38.7
(64.1)
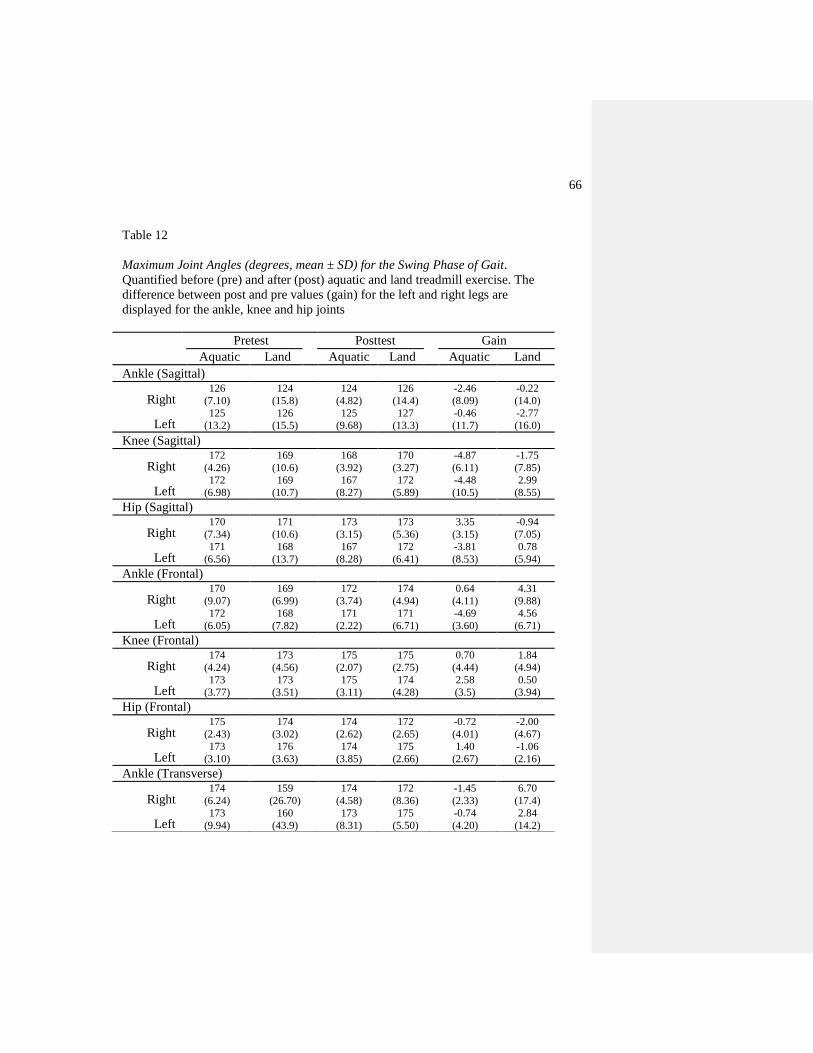
66
Table 12
Maximum Joint Angles (degrees, mean ± SD) for the Swing Phase of Gait.
Quantified before (pre) and after (post) aquatic and land treadmill exercise. The
difference between post and pre values (gain) for the left and right legs are
displayed for the ankle, knee and hip joints
Pretest Posttest Gain
Aquatic Land Aquatic Land Aquatic Land
Ankle (Sagittal)
Right 126
(7.10)
124
(15.8)
124
(4.82)
126
(14.4)
-2.46
(8.09)
-0.22
(14.0)
Left 125
(13.2)
126
(15.5)
125
(9.68)
127
(13.3)
-0.46
(11.7)
-2.77
(16.0)
Knee (Sagittal)
Right 172
(4.26)
169
(10.6)
168
(3.92)
170
(3.27)
-4.87
(6.11)
-1.75
(7.85)
Left 172
(6.98)
169
(10.7)
167
(8.27)
172
(5.89)
-4.48
(10.5)
2.99
(8.55)
Hip (Sagittal)
Right 170
(7.34)
171
(10.6)
173
(3.15)
173
(5.36)
3.35
(3.15)
-0.94
(7.05)
Left 171
(6.56)
168
(13.7)
167
(8.28)
172
(6.41)
-3.81
(8.53)
0.78
(5.94)
Ankle (Frontal)
Right 170
(9.07)
169
(6.99)
172
(3.74)
174
(4.94)
0.64
(4.11)
4.31
(9.88)
Left 172
(6.05)
168
(7.82)
171
(2.22)
171
(6.71)
-4.69
(3.60)
4.56
(6.71)
Knee (Frontal)
Right 174
(4.24)
173
(4.56)
175
(2.07)
175
(2.75)
0.70
(4.44)
1.84
(4.94)
Left 173
(3.77)
173
(3.51)
175
(3.11)
174
(4.28)
2.58
(3.5)
0.50
(3.94)
Hip (Frontal)
Right 175
(2.43)
174
(3.02)
174
(2.62)
172
(2.65)
-0.72
(4.01)
-2.00
(4.67)
Left 173
(3.10)
176
(3.63)
174
(3.85)
175
(2.66)
1.40
(2.67)
-1.06
(2.16)
Ankle (Transverse)
Right 174
(6.24)
159
(26.70)
174
(4.58)
172
(8.36)
-1.45
(2.33)
6.70
(17.4)
Left 173
(9.94)
160
(43.9)
173
(8.31)
175
(5.50)
-0.74
(4.20)
2.84
(14.2)
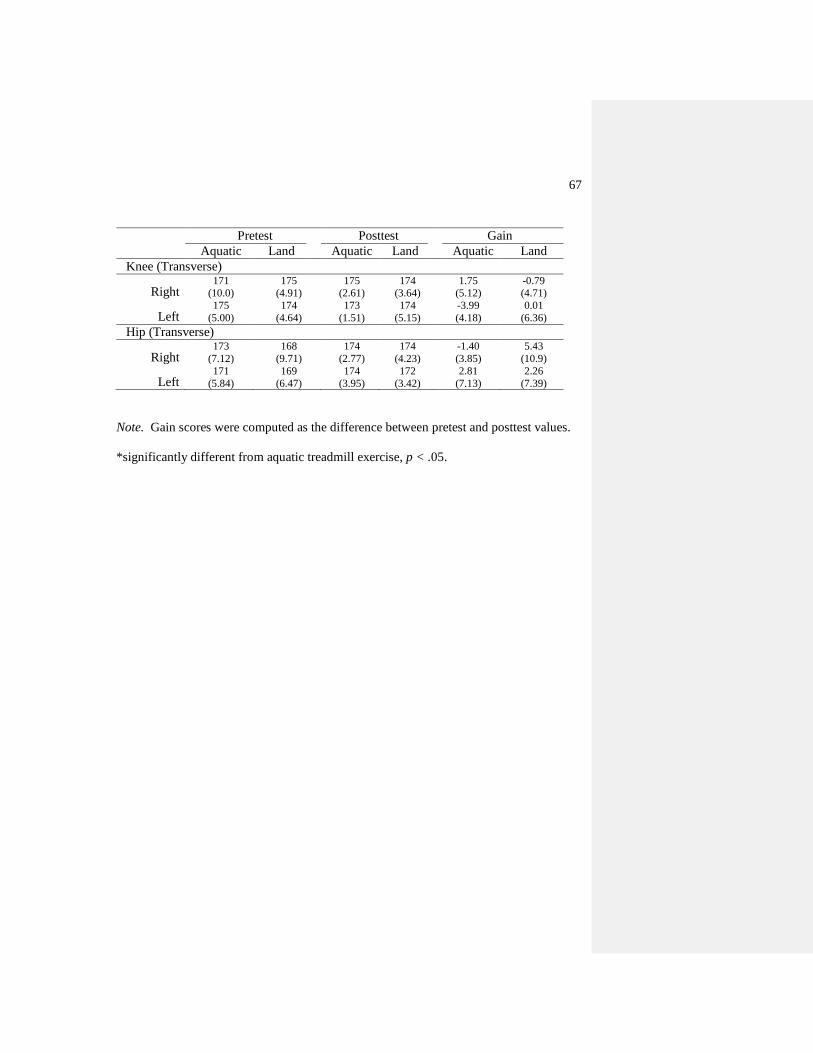
67
Note. Gain scores were computed as the difference between pretest and posttest values.
*significantly different from aquatic treadmill exercise, p < .05.
Pretest Posttest Gain
Aquatic Land Aquatic Land Aquatic Land
Knee (Transverse)
Right 171
(10.0)
175
(4.91)
175
(2.61)
174
(3.64)
1.75
(5.12)
-0.79
(4.71)
Left 175
(5.00)
174
(4.64)
173
(1.51)
174
(5.15)
-3.99
(4.18)
0.01
(6.36)
Hip (Transverse)
Right 173
(7.12)
168
(9.71)
174
(2.77)
174
(4.23)
-1.40
(3.85)
5.43
(10.9)
Left 171
(5.84)
169
(6.47)
174
(3.95)
172
(3.42)
2.81
(7.13)
2.26
(7.39)
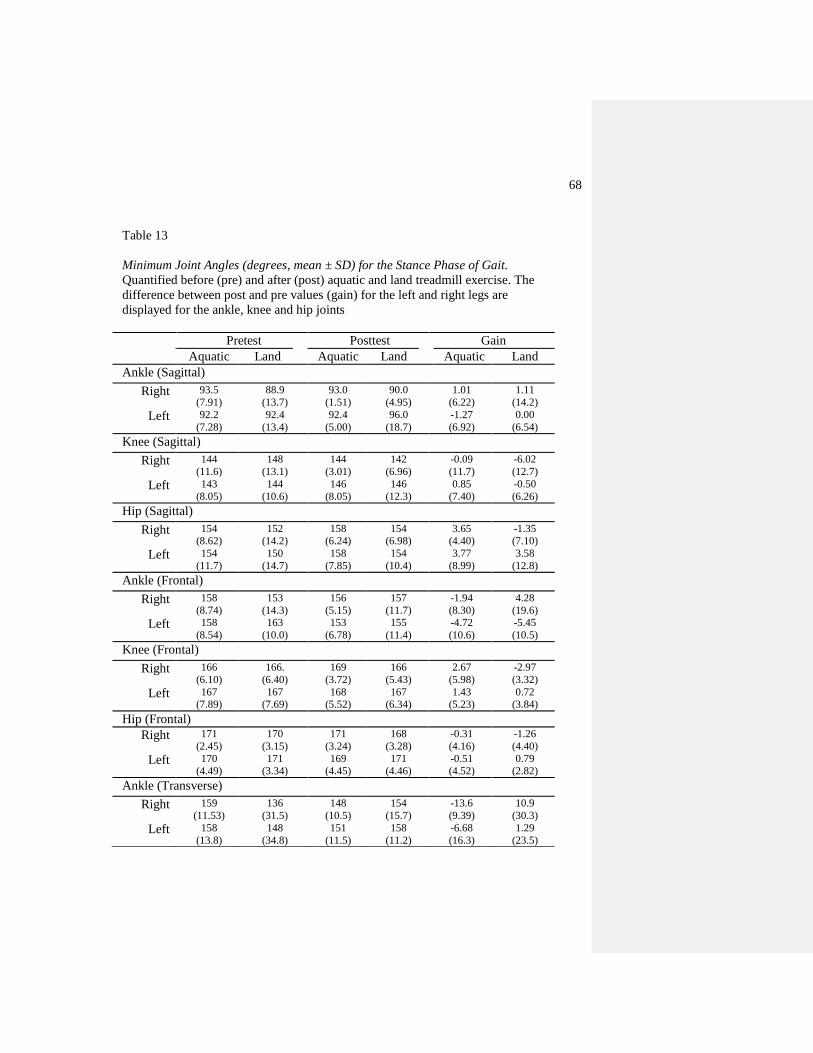
68
Table 13
Minimum Joint Angles (degrees, mean ± SD) for the Stance Phase of Gait.
Quantified before (pre) and after (post) aquatic and land treadmill exercise. The
difference between post and pre values (gain) for the left and right legs are
displayed for the ankle, knee and hip joints
Pretest Posttest Gain
Aquatic Land Aquatic Land Aquatic Land
Ankle (Sagittal)
Right 93.5
(7.91)
88.9
(13.7)
93.0
(1.51)
90.0
(4.95)
1.01
(6.22)
1.11
(14.2)
Left 92.2
(7.28)
92.4
(13.4)
92.4
(5.00)
96.0
(18.7)
-1.27
(6.92)
0.00
(6.54)
Knee (Sagittal)
Right 144
(11.6)
148
(13.1)
144
(3.01)
142
(6.96)
-0.09
(11.7)
-6.02
(12.7)
Left 143
(8.05)
144
(10.6)
146
(8.05)
146
(12.3)
0.85
(7.40)
-0.50
(6.26)
Hip (Sagittal)
Right 154
(8.62)
152
(14.2)
158
(6.24)
154
(6.98)
3.65
(4.40)
-1.35
(7.10)
Left 154
(11.7)
150
(14.7)
158
(7.85)
154
(10.4)
3.77
(8.99)
3.58
(12.8)
Ankle (Frontal)
Right 158
(8.74)
153
(14.3)
156
(5.15)
157
(11.7)
-1.94
(8.30)
4.28
(19.6)
Left 158
(8.54)
163
(10.0)
153
(6.78)
155
(11.4)
-4.72
(10.6)
-5.45
(10.5)
Knee (Frontal)
Right 166
(6.10)
166.
(6.40)
169
(3.72)
166
(5.43)
2.67
(5.98)
-2.97
(3.32)
Left 167
(7.89)
167
(7.69)
168
(5.52)
167
(6.34)
1.43
(5.23)
0.72
(3.84)
Hip (Frontal)
Right 171
(2.45)
170
(3.15)
171
(3.24)
168
(3.28)
-0.31
(4.16)
-1.26
(4.40)
Left 170
(4.49)
171
(3.34)
169
(4.45)
171
(4.46)
-0.51
(4.52)
0.79
(2.82)
Ankle (Transverse)
Right 159
(11.53)
136
(31.5)
148
(10.5)
154
(15.7)
-13.6
(9.39)
10.9
(30.3)
Left 158
(13.8)
148
(34.8)
151
(11.5)
158
(11.2)
-6.68
(16.3)
1.29
(23.5)

69
Note. Gain scores were computed as the difference between pretest and posttest values.
*significantly different from aquatic treadmill exercise, p < .05.
Pretest Posttest Gain
Aquatic Land Aquatic Land Aquatic Land
Knee (Transverse)
Right 166
(6.46)
160
(9.55)
162
(3.49)
160
(10.9)
-4.03
(7.31)
0.24
(15.7)
Left 161
(7.20)
163
(12.5)
161
(11.3)
155
(11.7)
2.99
(5.70)
-7.65
(15.2)
Hip (Transverse)
Right 168
(5.42)
171
(4.59)
172
(3.98)
168
(5.63)
1.61
(3.67)
-3.20
(6.11)
Left 170
(7.20)
170
(7.24)
169
(5.63)
167
(8.65)
-0.85
(6.22)
-2.71
(6.11)
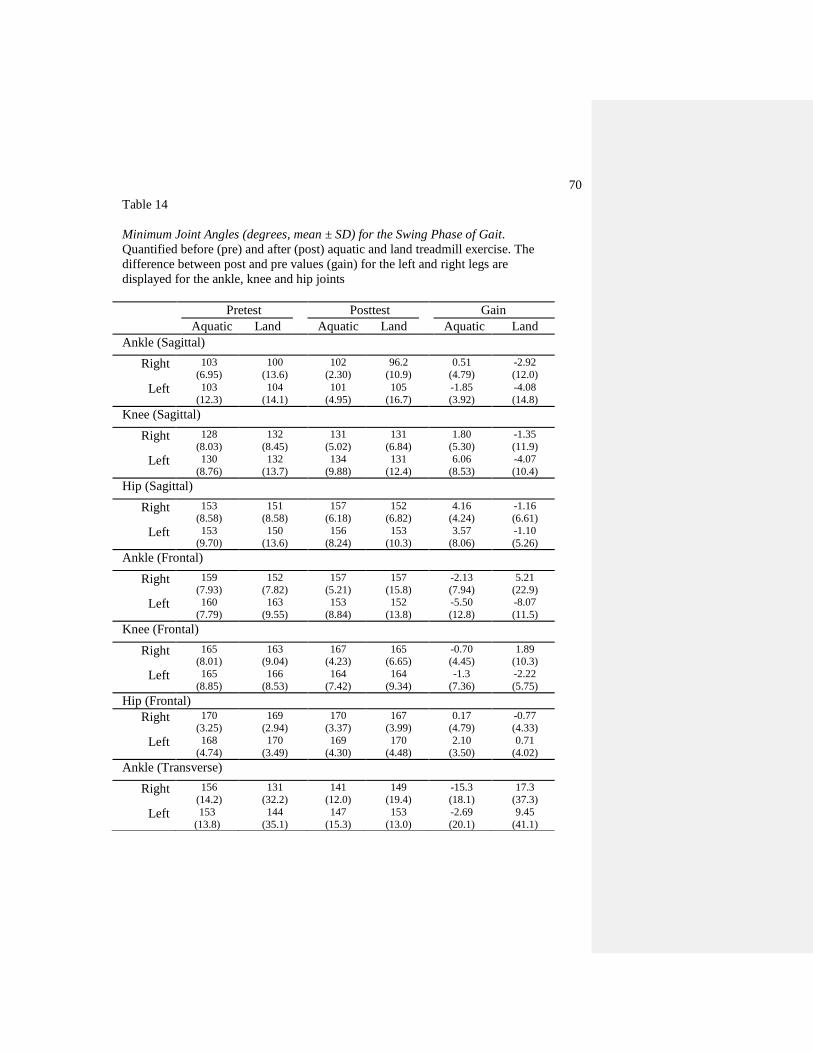
70
Table 14
Minimum Joint Angles (degrees, mean ± SD) for the Swing Phase of Gait.
Quantified before (pre) and after (post) aquatic and land treadmill exercise. The
difference between post and pre values (gain) for the left and right legs are
displayed for the ankle, knee and hip joints
Pretest Posttest Gain
Aquatic Land Aquatic Land Aquatic Land
Ankle (Sagittal)
Right 103
(6.95)
100
(13.6)
102
(2.30)
96.2
(10.9)
0.51
(4.79)
-2.92
(12.0)
Left 103
(12.3)
104
(14.1)
101
(4.95)
105
(16.7)
-1.85
(3.92)
-4.08
(14.8)
Knee (Sagittal)
Right 128
(8.03)
132
(8.45)
131
(5.02)
131
(6.84)
1.80
(5.30)
-1.35
(11.9)
Left 130
(8.76)
132
(13.7)
134
(9.88)
131
(12.4)
6.06
(8.53)
-4.07
(10.4)
Hip (Sagittal)
Right 153
(8.58)
151
(8.58)
157
(6.18)
152
(6.82)
4.16
(4.24)
-1.16
(6.61)
Left 153
(9.70)
150
(13.6)
156
(8.24)
153
(10.3)
3.57
(8.06)
-1.10
(5.26)
Ankle (Frontal)
Right 159
(7.93)
152
(7.82)
157
(5.21)
157
(15.8)
-2.13
(7.94)
5.21
(22.9)
Left 160
(7.79)
163
(9.55)
153
(8.84)
152
(13.8)
-5.50
(12.8)
-8.07
(11.5)
Knee (Frontal)
Right 165
(8.01)
163
(9.04)
167
(4.23)
165
(6.65)
-0.70
(4.45)
1.89
(10.3)
Left 165
(8.85)
166
(8.53)
164
(7.42)
164
(9.34)
-1.3
(7.36)
-2.22
(5.75)
Hip (Frontal)
Right 170
(3.25)
169
(2.94)
170
(3.37)
167
(3.99)
0.17
(4.79)
-0.77
(4.33)
Left 168
(4.74)
170
(3.49)
169
(4.30)
170
(4.48)
2.10
(3.50)
0.71
(4.02)
Ankle (Transverse)
Right 156
(14.2)
131
(32.2)
141
(12.0)
149
(19.4)
-15.3
(18.1)
17.3
(37.3)
Left 153
(13.8)
144
(35.1)
147
(15.3)
153
(13.0)
-2.69
(20.1)
9.45
(41.1)
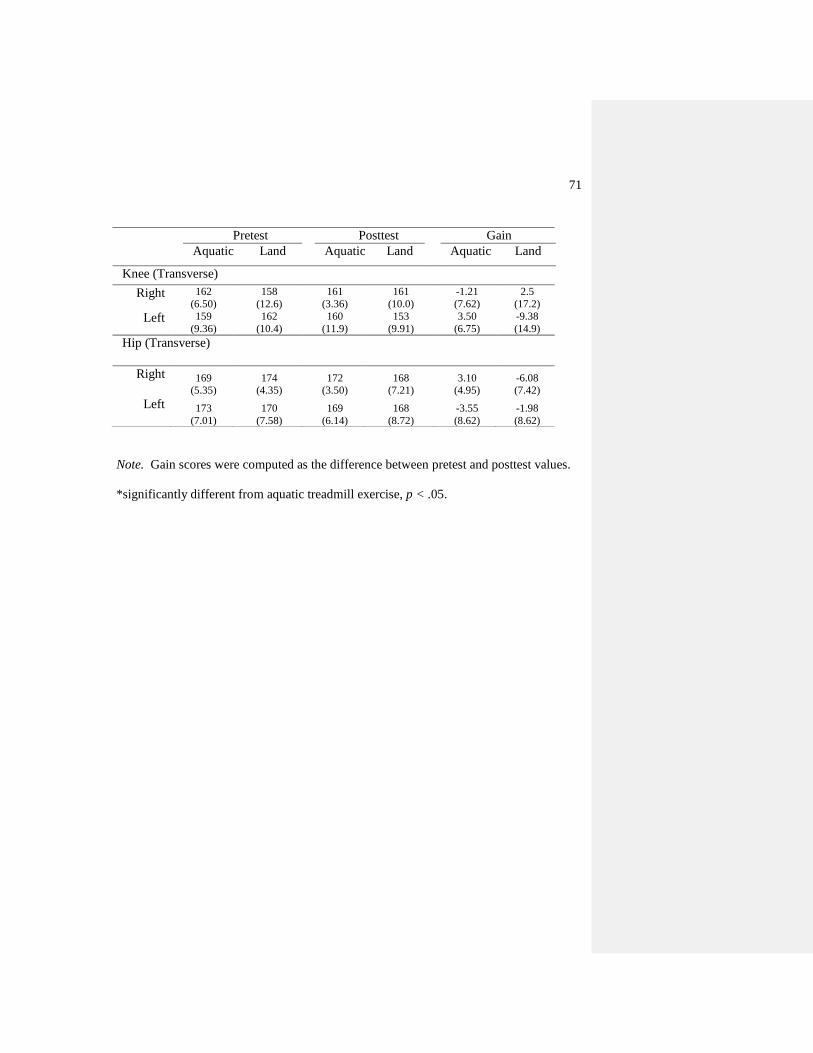
71
Note. Gain scores were computed as the difference between pretest and posttest values.
*significantly different from aquatic treadmill exercise, p < .05.
Pretest Posttest Gain
Aquatic Land Aquatic Land Aquatic Land
Knee (Transverse)
Right 162
(6.50)
158
(12.6)
161
(3.36)
161
(10.0)
-1.21
(7.62)
2.5
(17.2)
Left 159
(9.36)
162
(10.4)
160
(11.9)
153
(9.91)
3.50
(6.75)
-9.38
(14.9)
Hip (Transverse)
Right 169
(5.35)
174
(4.35)
172
(3.50)
168
(7.21)
3.10
(4.95)
-6.08
(7.42)
Left 173
(7.01)
170
(7.58)
169
(6.14)
168
(8.72)
-3.55
(8.62)
-1.98
(8.62)

72
Table 15
Self-Efficacy and Pain scores (mean ± SD) for Aquatic and Land Treadmill
Exercise
Pretest Posttest Gain
Aquatic Land Aquatic Land Aquatic Land
Self
Efficacy
92.0
(34.3)
92.0
(34.7)
96.0
(34.6)
86.3
(39.8)
-4.89
(34.6)
-4.57
(27.7)
Pain
40.0
(24.1)
37.2
(25.0)
37.4
(23.4)
25.5
(25.2)
0.13
(19.2)
-15.4
(20.7)*
Note. Gain scores were computed as the difference between pretest and posttest
values.
*significantly different from aquatic exercise, p < .05
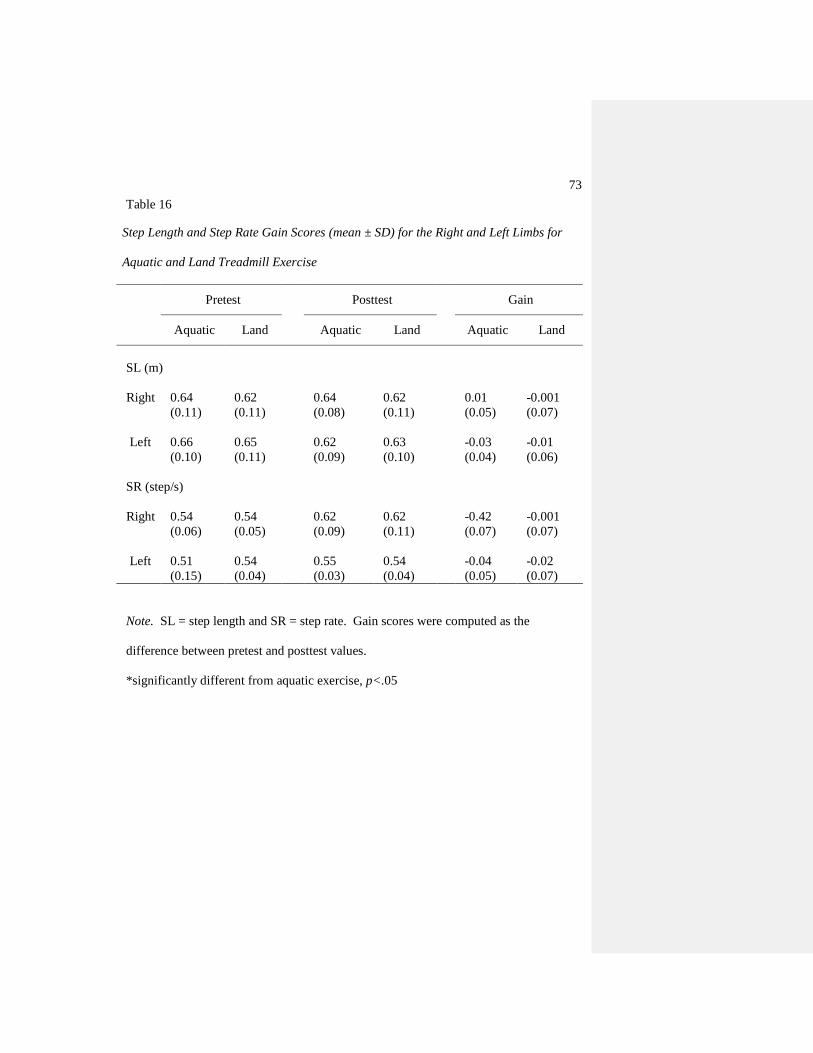
73
Table 16
Step Length and Step Rate Gain Scores (mean ± SD) for the Right and Left Limbs for
Aquatic and Land Treadmill Exercise
Pretest Posttest Gain
Aquatic Land Aquatic Land Aquatic Land
SL (m)
Right 0.64
(0.11)
0.62
(0.11)
0.64
(0.08)
0.62
(0.11)
0.01
(0.05)
-0.001
(0.07)
Left
0.66
(0.10)
0.65
(0.11)
0.62
(0.09)
0.63
(0.10)
-0.03
(0.04)
-0.01
(0.06)
SR (step/s)
Right 0.54
(0.06)
0.54
(0.05)
0.62
(0.09)
0.62
(0.11)
-0.42
(0.07)
-0.001
(0.07)
Left
0.51
(0.15)
0.54
(0.04)
0.55
(0.03)
0.54
(0.04)
-0.04
(0.05)
-0.02
(0.07)
Note. SL = step length and SR = step rate. Gain scores were computed as the
difference between pretest and posttest values.
*significantly different from aquatic exercise, p<.05
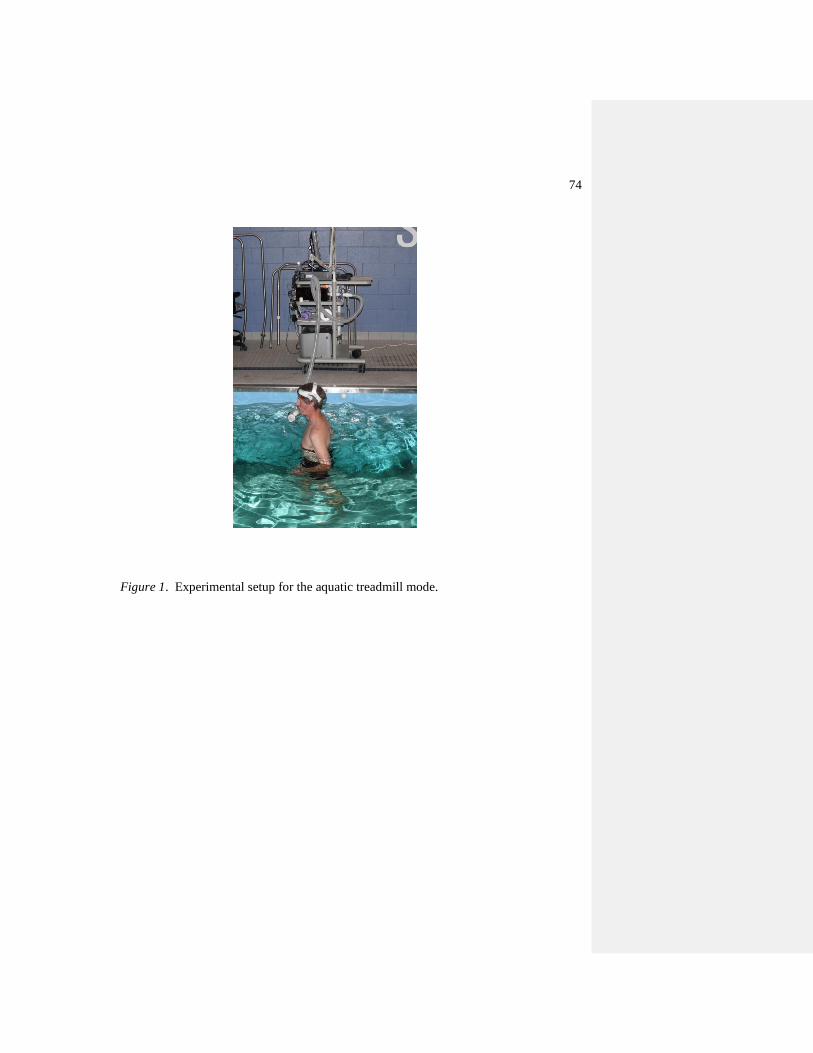
74
Figure 1. Experimental setup for the aquatic treadmill mode.
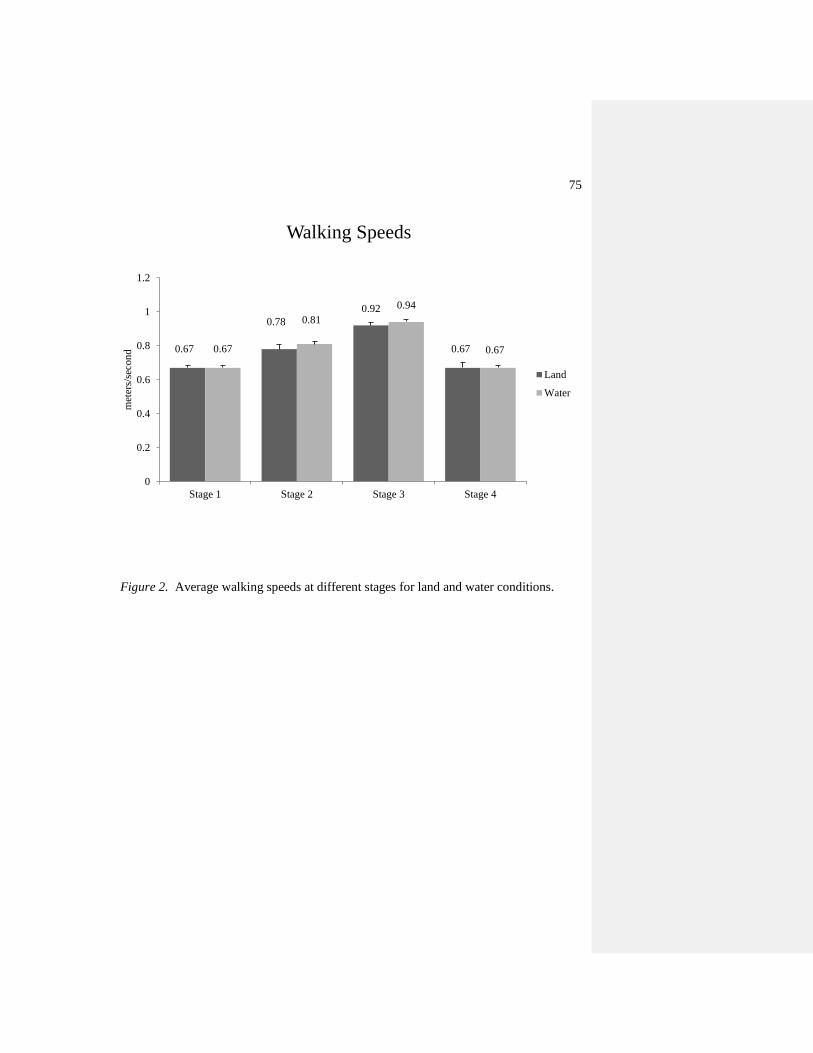
75
Figure 2. Average walking speeds at different stages for land and water conditions.
0.67
0.78
0.92
0.67 0.67
0.81
0.94
0.67
0
0.2
0.4
0.6
0.8
1
1.2
Stage 1 Stage 2 Stage 3 Stage 4
met
ers/
seco
nd
Walking Speeds
Land
Water
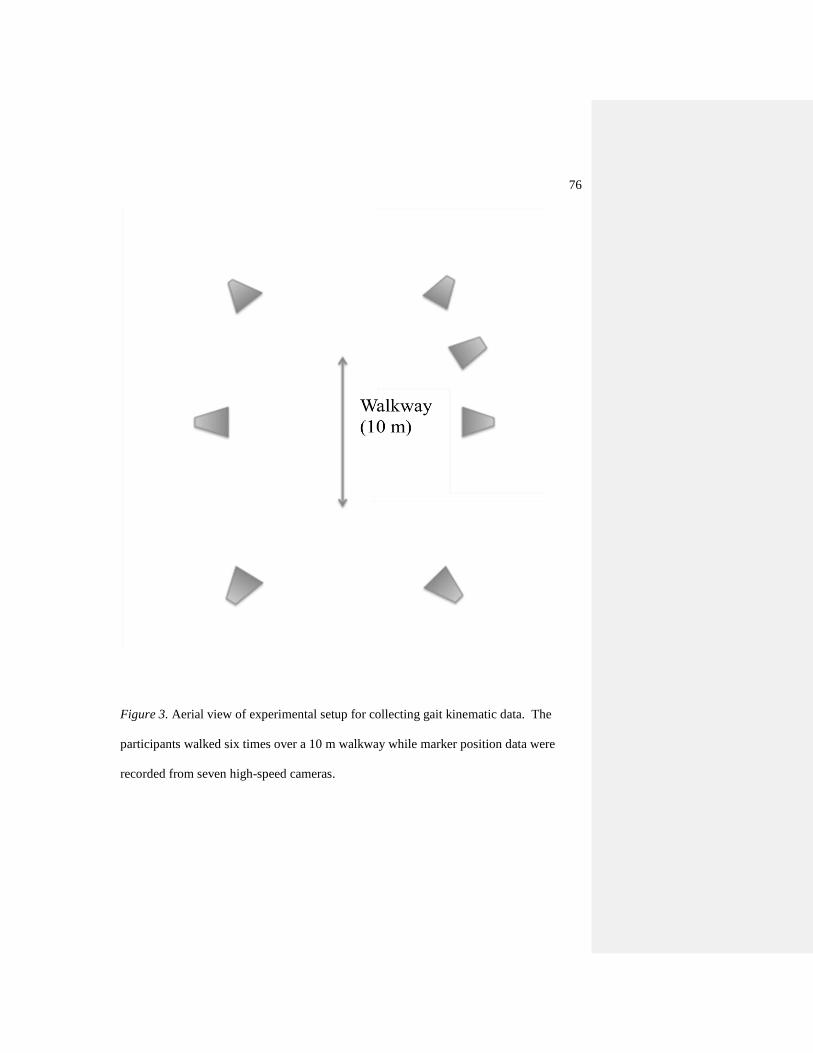
76
Figure 3. Aerial view of experimental setup for collecting gait kinematic data. The
participants walked six times over a 10 m walkway while marker position data were
recorded from seven high-speed cameras.
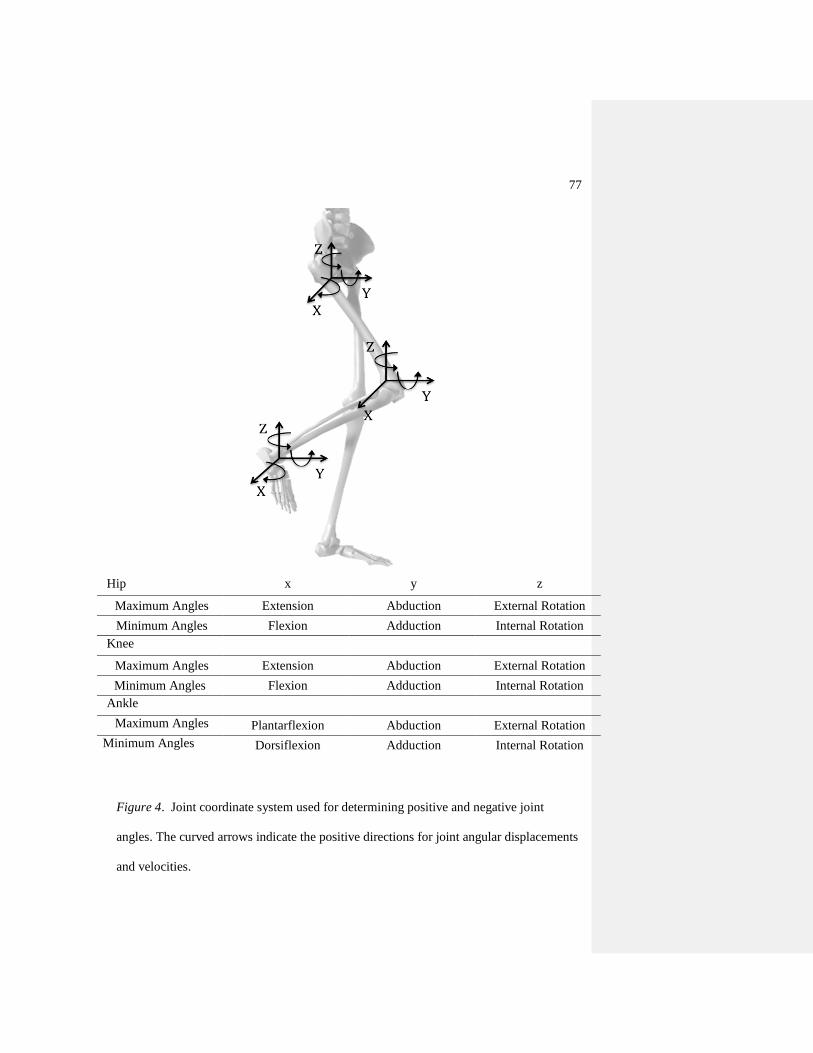
77
Figure 4. Joint coordinate system used for determining positive and negative joint
angles. The curved arrows indicate the positive directions for joint angular displacements
and velocities.
Hip x y z
Maximum Angles Extension Abduction External Rotation
Minimum Angles Flexion Adduction Internal Rotation
Knee
Maximum Angles Extension Abduction External Rotation
Minimum Angles Flexion Adduction Internal Rotation
Ankle
Maximum Angles Plantarflexion Abduction External Rotation
Minimum Angles Dorsiflexion Adduction Internal Rotation
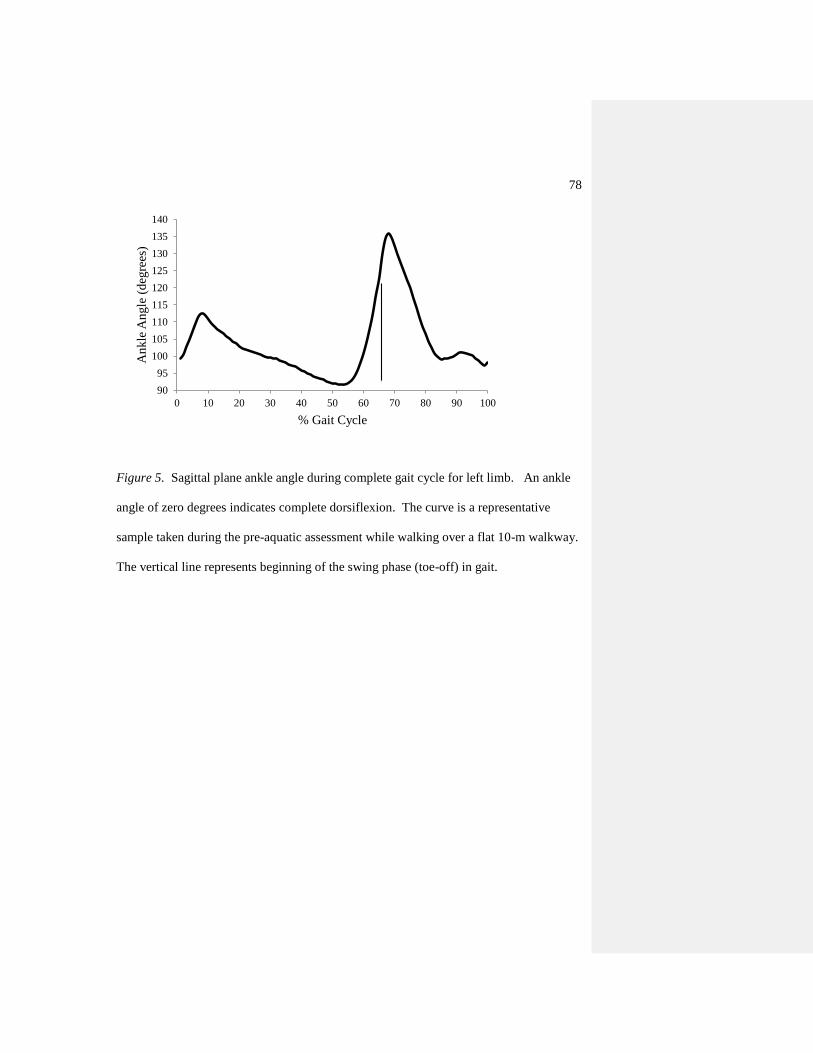
78
Figure 5. Sagittal plane ankle angle during complete gait cycle for left limb. An ankle
angle of zero degrees indicates complete dorsiflexion. The curve is a representative
sample taken during the pre-aquatic assessment while walking over a flat 10-m walkway.
The vertical line represents beginning of the swing phase (toe-off) in gait.
90
95
100
105
110
115
120
125
130
135
140
0 10 20 30 40 50 60 70 80 90 100
An
kle
An
gle
(d
egre
es)
% Gait Cycle
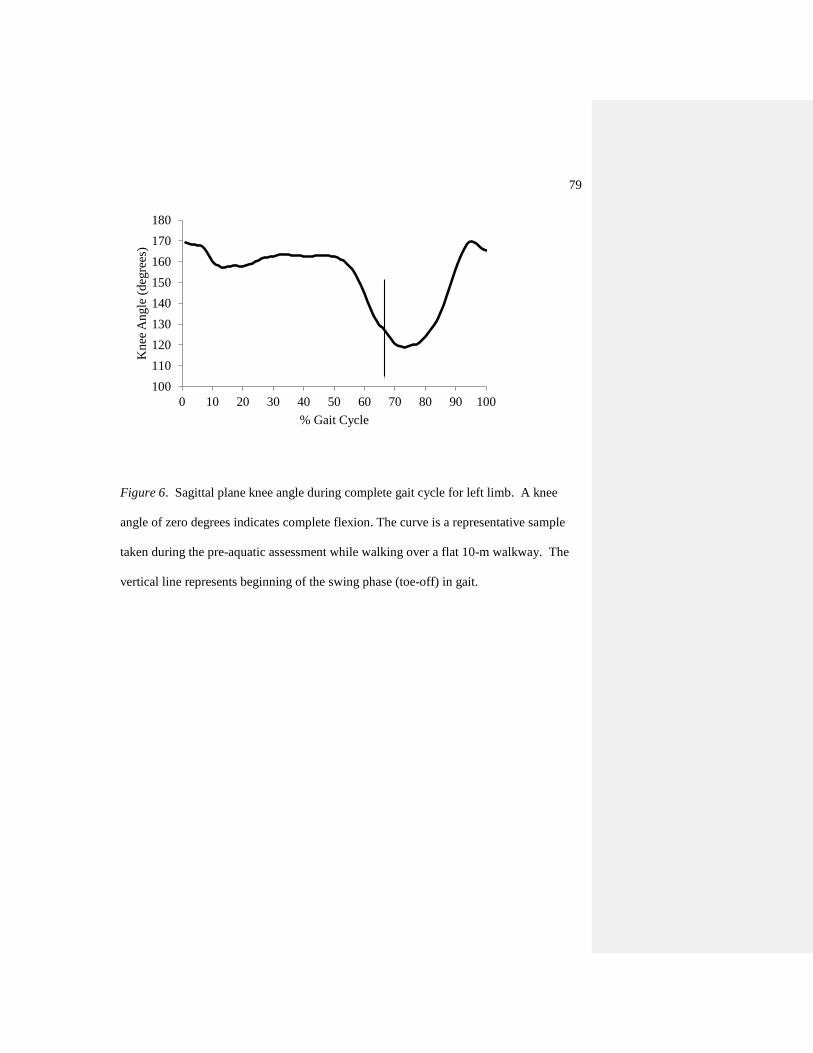
79
Figure 6. Sagittal plane knee angle during complete gait cycle for left limb. A knee
angle of zero degrees indicates complete flexion. The curve is a representative sample
taken during the pre-aquatic assessment while walking over a flat 10-m walkway. The
vertical line represents beginning of the swing phase (toe-off) in gait.
100
110
120
130
140
150
160
170
180
0 10 20 30 40 50 60 70 80 90 100
Kn
ee A
ngle
(d
egre
es)
% Gait Cycle

80
Figure 7. Sagittal plane hip angle during complete gait cycle for left limb. A hip angle
of zero degrees indicates complete flexion. The curve is a representative sample taken
during the pre-aquatic assessment while walking over a flat 10-m walkway. The vertical
line represents beginning of the swing phase (toe-off) in gait.
130
135
140
145
150
155
160
165
170
175
180
0 10 20 30 40 50 60 70 80 90 100
Hip
An
gle
(d
egre
es)
% Gait Cycle
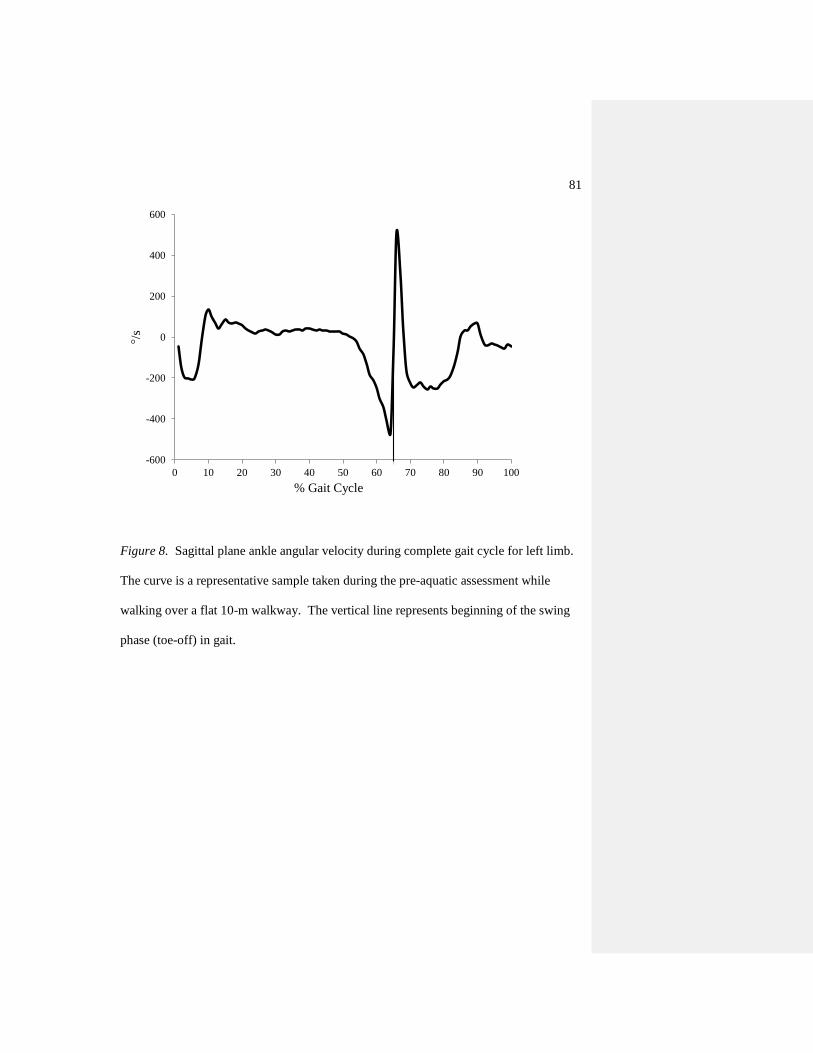
81
Figure 8. Sagittal plane ankle angular velocity during complete gait cycle for left limb.
The curve is a representative sample taken during the pre-aquatic assessment while
walking over a flat 10-m walkway. The vertical line represents beginning of the swing
phase (toe-off) in gait.
-600
-400
-200
0
200
400
600
0 10 20 30 40 50 60 70 80 90 100
°/s
% Gait Cycle
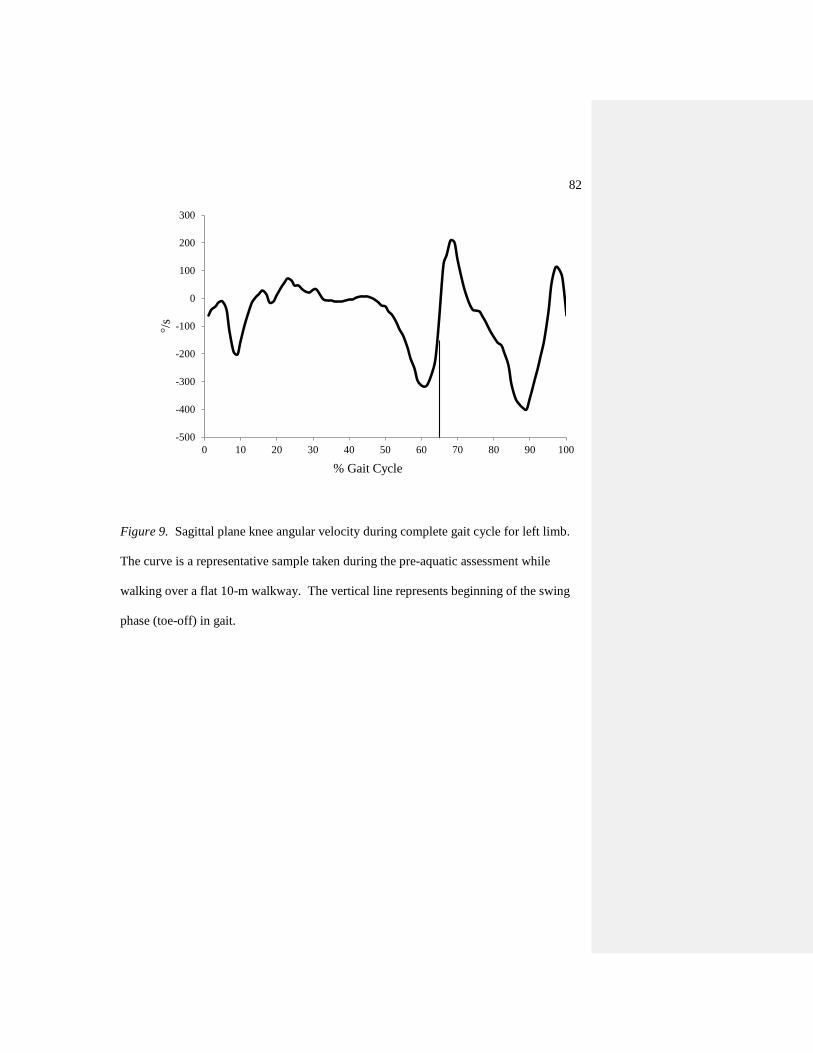
82
Figure 9. Sagittal plane knee angular velocity during complete gait cycle for left limb.
The curve is a representative sample taken during the pre-aquatic assessment while
walking over a flat 10-m walkway. The vertical line represents beginning of the swing
phase (toe-off) in gait.
-500
-400
-300
-200
-100
0
100
200
300
0 10 20 30 40 50 60 70 80 90 100
°/s
% Gait Cycle
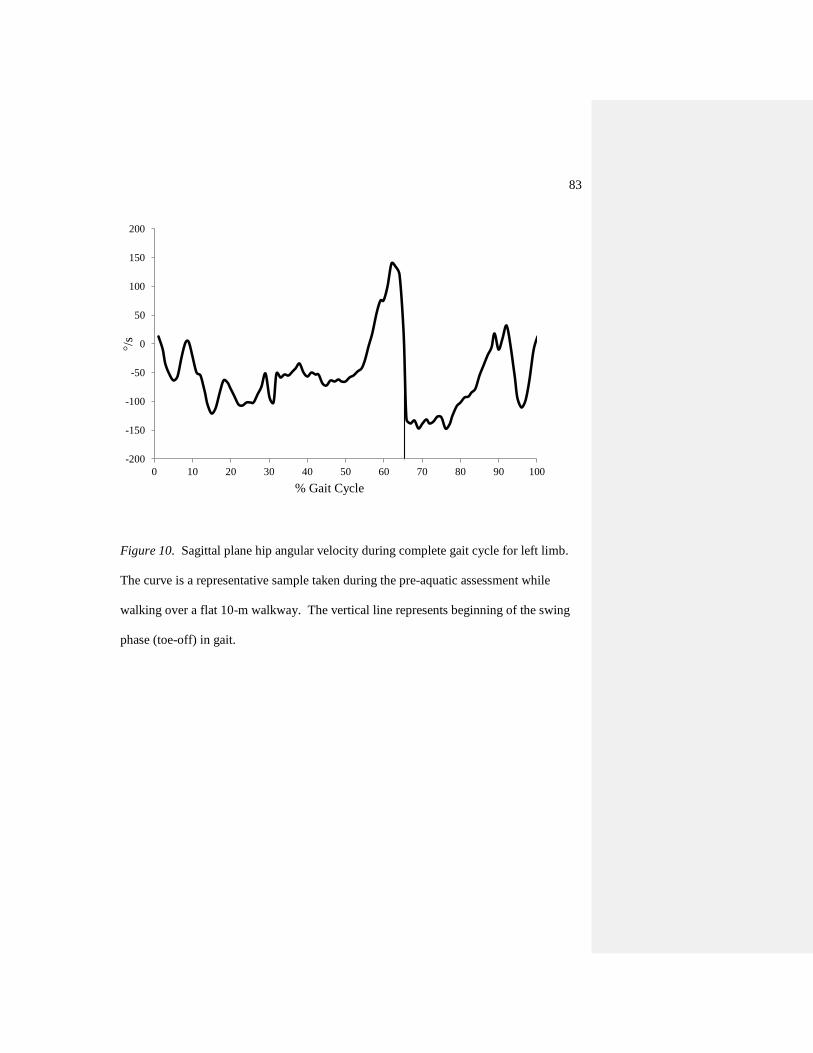
83
Figure 10. Sagittal plane hip angular velocity during complete gait cycle for left limb.
The curve is a representative sample taken during the pre-aquatic assessment while
walking over a flat 10-m walkway. The vertical line represents beginning of the swing
phase (toe-off) in gait.
-200
-150
-100
-50
0
50
100
150
200
0 10 20 30 40 50 60 70 80 90 100
°/s
% Gait Cycle
84
CHAPTER 4
SUMMARY AND CONCLUSION
Review Article (Chapter 2)
Previous studies have suggested that gait patterns of adults affected by OA are
considerably different when compared to healthy adults. Researchers have observed
differences in knee range of motion, stance phase knee flexion/extension, walking
velocity, stride length, and cadence when compared to a normal, healthy population
(Gyory et al., 1976; Messier et al., 1992; Stauffer et al., 1977; Walker et al., 2001).
These kinematic observations have lead to the conclusion that changes in lower
extremity kinematics could be a strategy used by OA patients to reduce joint movement
so that less pain is felt during weight bearing activities. These changes are important to
examine because measurements of the mechanics of the disease are necessary for a
greater understanding of the functional effects of treatment(s).
The purpose of this paper was to review the literature examining noninvasive OA
therapies on kinematics of gait. An appreciation of these findings may help with
clinicians in choosing the most efficacious therapy for improving mobility. This review
was organized in the following approach, methods used to assess gait mobility with
descriptions of specific tests used to address mechanical and painful complications of
OA, and various forms of noninvasive therapies used for treatment of OA and their
effects on mobility.
85
The selection criteria for inclusion in this study were as follows: the study used at
least one type of noninvasive therapy to treat OA, and at least one of the outcome
measures was an assessment of gait and/or mobility, the studies were available in English
and were published in a peer-reviewed journal, and/or the study provided additional
information on non-invasive methods for treating OA. Seven articles from 1997 to 2009
were included.
Different modalities for treating OA may affect walking speed, stride length,
stride rate, and function. Studies that train via land have improved basic function,
walking speed, and joint space narrowing (Rogind et al., 1998; Fisher et al., 1997;
Mikesky et al., 2006). Unfortunately while these land exercises have presented positive
affects, Rogind et al. (1998) noted that palpable effusions (which may be caused by
increased joint loading) increased after training, and suggested the cause may be related
to the mechanical loading of the joint. One way to decrease the load of the joint is by
exercising aquatic (Barela & Duarte, 2008). Studies that have used aquatic training have
noted improvements in physical function, mobility, stiffness and pain upon movement.
Studies that have examined land and aquatic training have observed improvements in
range of motion and walking speed and distance. Future biomechanical research is
needed to evaluate benefits to aquatic training to better serve programs aimed at
improving function and mobility for patients with OA.
These gait, pain, and mobility alterations in OA patients noted in the previous
literature may be precursors for pathological alterations and would seem to be important
variables to examine in an aquatic therapy study aimed at improving mobility. A greater

86
understanding of these alterations will be useful for the treatment of OA and the
prevention of OA progression.
Experimental Paper (Chapter 3)
Osteoarthritis is a widespread disease and is also the most common form of
arthritis in the elderly (Davis et al., 1991; Felson et al., 1987; Hochberg, 1991).
Osteoarthritis (OA) of the hip and knee is often characterized by pain, stiffness, and
decreased range of motion. People who have OA of the lower extremities are generally
less active and have decreased physical conditioning and function. This reduction in
mobility further decreases one‟s ability to carry out daily activities and complete regular
physical exercise (Kaufman et al., 2001; Mangione et al., 1996).
Aquatic exercises may allow OA patients to engage in longer and more strenuous
workouts as compared to land-based exercises (Hinman et al., 2007). For example,
patients with OA may have an easier time completing closed-chain exercises in an
aquatic environment than on land because joint loading and pain across affected joints
may be less (Barela et al., 2006). Additionally, by adjusting the depth of the water, the
percentage of body weight supported by the lower limbs can be incrementally decreased,
to accommodate a person‟s pain tolerance (Silvers et al., 2007). Finally, the warmth
and pressure of water may assist in decreasing joint swelling and pain, and allow for
easier movement patterns (Hinman et al., 2007).
Previous research examining the progressive decline of kinematic gait parameters
on land in patients with OA has observed specific changes. Prior studies examining
87
people with OA have detected decreased walking speed, and lower maximum knee
extension angles (Kaufman et al., 2001; Walker et al., 2001). With progressive
worsening of OA, changes in gait kinematics are also often accompanied by progressive
worsening in pain and perception of mobility (Astephen et al., 2008). The purpose of
the experimental study examined the effects of short-term aquatic treadmill exercise on
gait kinematics and perception of pain and mobility in OA patients.
Fourteen participants with OA of the knee performed three consecutive exercises
(20 min each) on an aquatic treadmill and on a land-based treadmill. The order of
exercise mode was randomized and completed within 1 week. Gait kinematics (step
rate, step length, min and max joint angles and angular velocity at the hip, knee, and
ankle), pain and self-efficacy measures were all recorded before (pre) and after (post)
completion of the aquatic and land-based treadmill.
Joint angles and angular velocity gain scores that were significantly different at
the p = 0.05 level are shown in Tables 4-6. After adjusting p values using the Holm‟s
correction, the angular velocity gain score during stance for left knee extension was
significantly higher for aquatic treadmill exercise by 38.1% (p = 0.004; Table 7).
Similarly during swing the gain scores for angular velocity were also greater for left
knee internal rotation and extension by 65% and 20%, respectively (p = 0.004, p =
0.008; Tables 8, 9). During stance, the joint angle gain score for left hip flexion was
greater for land exercise by 7.23% (p = 0.007; Table 10). Similarly during swing the
angular velocity gain score for right hip extension was significantly greater for aquatic
exercise by 28% (p = 0.01; Table 8). Only the joint angle gain score for left ankle

88
abduction during stance was significantly higher for land exercise by 4.72% (p = 0.003;
Table 8). No other joint angle gain scores for either stance or swing were significantly
different for either condition (p = 0.06-0.96; Tables 11-14).
Confidence Intervals
Table 4-6 presents the confidence intervals (95% CI) for all kinematic variables
reaching the alpha level of 0.05. Not surprising, the width of confidence intervals
computed were high given the small sample. More specifically, it may be observed in
Table 4-6 that there is a 95% chance that the confidence intervals calculated for the
kinematic variables contain the true population median difference.
Perceived Pain, Self-Efficacy, and Step Rate and Length
Perceived pain was 100% greater for land than aquatic treadmill exercise (p =
0.02; Table 15) and self-efficacy gain scores were not different between conditions (p =
0.37). Step rate and step length gain scores were not different between conditions (p =
0.31 - 0.92; Table 16).
The unique aspect of the present study is that the authors examined the
effectiveness of aquatic therapy on gait kinematics before and after aquatic training
using a complete three-dimensional study analyzing changes at not just the knee, but
also at the hip and ankle. The present study demonstrated that an acute training period
on an aquatic treadmill did influence joint angular velocity and arthritis related joint
pain. It is unclear whether or not aquatic exercise is a better alternative to land exercise,
89
and further longitudinal research is needed to examine gait kinematic changes after an
increased training period of aquatic exercise.
Conclusions
Review Article (Chapter 2)
Within the limitations of the review, it may be concluded that when compared to a
similar land-based treatment:
Aquatic exercise may decrease the affected joint pain and improve
mobility
Aquatic and land exercise may both improve physical function, range of
motion, walking speed and distance
Experimental Article (Chapter 3)
Within the limitations of this study, it may be concluded that when compared to a
similar land-based treatment:
OA patients displayed greater joint angular velocities after aquatic
treadmill exercise for the following:
o Left knee extension during stance
o Left knee internal rotation and extension during swing
o Right hip extension during swing
OA patients displayed greater joint angles after land treadmill exercise for
the following:
o Left hip flexion during stance
90
o Left ankle abduction during stance
Patients diagnosed with OA may have improved pain after training on an
aquatic treadmill when compared to a land-based treadmill
Step rate and step length tend to be not different after aquatic or land
treadmill intervention
L Comment [EB1]: ?
91
REFERENCES
Ahern, C. E., Nicholls, E., Simionato, E., Clark, M., & Bond, M. (1995). Clinical and
Psychological effects of hydrotherapy in rheumatic diseases. Clinical
Rehabilitation, 9, 204-212.
Al-Zahrani, K. S., & Bakheit, A. M. (2002). A study of the gait characteristics of patients
with chronic osteoarthritis of the knee. Disability and Rehabilitation, 24, 275-280.
American College of Rheumatology Subcommittee on Osteoarthritis Guidelines. (2000).
Recommendations for the medical management of osteoarthritis of the hip and
knee: 2000 update. Arthritis and Rheumatism, 43, 1905-1915.
Arden, N., & Nevitt, M. C. (2006). Osteoarthritis: Epidemiology. Best Practice and
Research Clinical Rheumatology, 20, 3-25.
Astephen, J. L., Deluzio, K. J., Caldwell, G. E., & Dunbar, M. J. (2008). Biomechanical
changes at the hip, knee, and ankle joints during gait are associated with knee
osteoarthritis severity. Journal of Orthopedic Research, 26, 332-341.
Bandura, A. (1977). Self-efficacy: Toward a unifying theory of behavioral change.
Psychology Review, 84, 191-215.
Barela, A. M., & Duarte, M. (2008). Biomechanical characteristics of elderly individuals
walking on land and in water. Journal of Electromyography and Kinesiology, 18,
446-454.
Barela, A. M., Stolf, S. F., & Duarte, M. (2006). Biomechanical characteristics of adults
walking in shallow water and on land. Journal of Electromyography and
Kinesiology, 16, 250-256.
92
Bartels, E. M., Lund, H., Hagen, K. B., Dagfinrud, H., Christensen, R., & Danneskiold-
Samsoe, B. (2007). Aquatic exercise for the treatment of knee and hip
osteoarthritis. Cochrane Database System Review, CD005523.
Bell, A. L., Pedersen, D. R., & Brand, R. A. (1990). A comparison of the accuracy of
several hip center location prediction methods. Journal of Biomechanics, 23, 617-
621.
Bellamy, N., Kirwan, J., Boers, M., Brooks, P., Strand, V., Tugwell, P., Altman, R.,
Brandt K., Dougados M., Lequesne, M. (1997). Recommendations for a core set
of outcome measures for future phase III clinical trials in knee, hip, and hand
osteoarthritis. Consensus development at OMERACT III. Journal of
Rheumatology, 24, 799-802.
Brinkmann, J. R., & Perry, J. (1985). Rate and range of knee motion during ambulation in
healthy and arthritic subjects. Physical Therapy, 65, 1055-1060.
Bruce, B., & Fries, J. F. (2003). The Stanford Health Assessment Questionnaire: A
review of its history, issues, progress, and documentation. Journal of
Rheumatology, 30, 167-178.
Callaghan, M. J., & Oldham, J.A. (1995). An evaluation of exercise regimes for patients
with osteoarthritis of the knee: A single blind randomized control trial. Clinical
Rehabilitation, 9, 213-218.
Carlsson, A. M. (1983). Assessment of chronic pain. I. Aspects of the reliability and
validity of the visual analogue scale. Pain, 16, 87-101.
93
Cochrane, T., Davey, R. C., & Matthes Edwards, S. M. (2005). Randomised controlled
trial of the cost-effectiveness of water-based therapy for lower limb osteoarthritis.
Health Technology Assessment, 9, iii-iv, ix-xi, 1-114.
Cooke, T. D., & Dwosh, I. L. (1986). Clinical features of osteoarthritis in the elderly.
Clinical and Rheumatology Disorders, 12, 155-172.
Davis, M. A., Ettinger, W. H., Neuhaus, J. M., & Mallon, K. P. (1991). Knee
osteoarthritis and physical functioning: Evidence from the NHANES I
Epidemiologic Followup Study. Journal of Rheumatology, 18(4), 591-598.
Denning, D. W., Bressel E., & Dolny, D.G. (2010). Underwater treadmill exercise as a
potential treatment for adults with osteoarthritis. International Journal of Aquatic
Research and Education, 4, 70-80.
Dolbow, D. R., Farley, R. S., Kim, J. K., & Caputo, J. L. (2008). Oxygen consumption,
heart rate, rating of perceived exertion, and systolic blood pressure with water
treadmill walking. Journal of Aging and Physical Activity, 16, 14-23.
Ettinger, W. H., Jr., Burns, R., Messier, S. P., Applegate, W., Rejeski, W. J., Morgan, T.,
Shumaker, S., Berry, M., O'Toole, M., Monu, J., Craven, T. (1997). A
randomized trial comparing aerobic exercise and resistance exercise with a health
education program in older adults with knee osteoarthritis. The Fitness Arthritis
and Seniors Trial (FAST). Journal of the American Medical Association, 277, 25-
31.
94
Felson, D. T., Naimark, A., Anderson, J., Kazis, L., Castelli, W., & Meenan, R. F.
(1987). The prevalence of knee osteoarthritis in the elderly. The Framingham
Osteoarthritis Study. Arthritis and Rheumatism, 30, 914-918.
Felson, D. T., & Zhang, Y. (1998). An update on the epidemiology of knee and hip
osteoarthritis with a view to prevention. Arthritis and Rheumatism, 41, 1343-
1355.
Fillenbaum, G. G., George, L. K., & Blazer, D. G. (1988). Scoring nonresponse on the
Mini-Mental State Examination. Psychology and Medicine, 18, 1021-1025.
Fisher, N. M., White, S. C., Yack, H. J., Smolinski, R. J., & Pendergast, D. R. (1997).
Muscle function and gait in patients with knee osteoarthritis before and after
muscle rehabilitation. Disabiity and Rehabilitation, 19, 47-55.
Focht, B. C., Rejeski, W. J., Ambrosius, W. T., Katula, J. A., & Messier, S. P. (2005).
Exercise, self-efficacy, and mobility performance in overweight and obese older
adults with knee osteoarthritis. Arthritis and Rheumatism, 53, 659-665.
Foley, A., Halbert, J., Hewitt, T., & Crotty, M. (2003). Does hydrotherapy improve
strength and physical function in patients with osteoarthritis--a randomised
controlled trial comparing a gym based and a hydrotherapy based strengthening
programme. Annals of the Rheumatic Diseases, 62, 1162-1167.
Fransen, M., Crosbie, J., & Edmonds, J. (1997). Reliability of gait measurements in
people with osteoarthritis of the knee. Physical Therapy, 77, 944-953.
Gramling, S. E., & Elliott, T. R. (1992). Efficient pain assessment in clinical settings.
Behavior Research Therapy, 30, 71-73.
95
Gyory, A. N., Chao, E. Y., & Stauffer, R. N. (1976). Functional evaluation of normal and
pathologic knees during gait. Archives of Physical Medicine and Rehabilitation,
57, 571-577.
Hinman, R. S., Heywood, S. E., & Day, A. R. (2007). Aquatic physical therapy for hip
and knee osteoarthritis: Results of a single-blind randomized controlled trial.
Physical Therapy, 87, 32-43.
Hochberg, M. C. (1991). Epidemiology of osteoarthritis: Current concepts and new
insights. Journal of Rheumatology Supplement, 27, 4-6.
Hochberg, M. C., Altman, R. D., Brandt, K. D., Clark, B. M., Dieppe, P. A., Griffin, M.
R., et al. (1995). Guidelines for the medical management of osteoarthritis. Part I.
Osteoarthritis of the hip. American College of Rheumatology. Arthritis and
Rheumatism, 38, 1535-1540.
Huang, S. C., Wei, I. P., Chien, H. L., Wang, T. M., Liu, Y. H., Chen, H. L., Lu, T.W.,
Lin, J.G. (2008). Effects of severity of degeneration on gait patterns in patients
with medial knee osteoarthritis. Medical Engineering and Physics, 30, 997-1003.
Huang, M. H., Lin, Y. S., Yang, R. C., & Lee, C. L. (2003). A comparison of various
therapeutic exercises on the functional status of patients with knee osteoarthritis.
Seminar Arthritis and Rheumatism, 32, 398-406.
Hutton, C. W. (1989). Osteoarthritis: The cause not result of joint failure? Annals of the
Rheumatic Diseases, 48, 958-961.
Jette, A. M. (1980). Functional Status Index: Reliability of a chronic disease evaluation
instrument. Archives of Physical Medicine and Rehabilitation, 61, 395-401.
96
Kaufman, K. R., Hughes, C., Morrey, B. F., Morrey, M., & An, K. N. (2001). Gait
characteristics of patients with knee osteoarthritis. Journal of Biomechanics, 34,
907-915.
Knudson, D. (2009). Significant and meaningful effects in sports biomechanics research.
Sports Biomechanics, 8, 96-104.
Leardini, A., Chiari, L., Della Croce, U., & Cappozzo, A. (2005). Human movement
analysis using stereophotogrammetry. Part 3. Soft tissue artifact assessment and
compensation. Gait and Posture, 21, 212-225.
Los Amigos Research and Education Institute, Inc. (2001). Observational gait analysis.
Downey, CA: Rancho Los Amigos National Rehabilitation Center.
Lundbrook, J. (1998). Multiple comparison procedures updated. Clinical Expiremental
Pharmacology and Physiology, 25, 1032-1037.
Mangione, K. K., Axen, K., & Haas, F. (1996). Mechanical unweighting effects on
treadmill exercise and pain in elderly people with osteoarthritis of the knee.
Physical Therapy, 76, 387-394.
March, L. M., Schwarz, J. M., Carfrae, B. H., & Bagge, E. (1998). Clinical validation of
self-reported osteoarthritis. Osteoarthritis and Cartilage, 6, 87-93.
Marks, R. (1993). The effect of isometric quadriceps strength training in mid-range for
osteoarthritis of the knee. Arthritis Care and Research, 6, 52-56.
McCormack, H.M., Horne, D.J., & Sheather, S. (1988). Clinical applications of visual
analogue scales: A critical review. Psychological Medicine, 18, 1007-1019.
97
Messier, S. P. (1994). Osteoarthritis of the knee and associated factors of age and obesity:
Effects on gait. Medicine and Science in Sports and Exercise, 26, 1446-1452.
Messier, S. P., Loeser, R. F., Hoover, J. L., Semble, E. L., & Wise, C. M. (1992).
Osteoarthritis of the knee: Effects on gait, strength, and flexibility. Archives of
Physical Medicine and Rehabilitation, 73, 29-36.
Mikesky, A. E., Mazzuca, S. A., Brandt, K. D., Perkins, S. M., Damush, T., & Lane, K.
A. (2006). Effects of strength training on the incidence and progression of knee
osteoarthritis. Arthritis and Rheumatism, 55, 690-699.
Patrick, D. L., Ramsey, S. D., Spencer, A. C., Kinne, S., Belza, B., & Topolski, T. D.
(2001). Economic evaluation of aquatic exercise for persons with osteoarthritis.
Medical Care, 39, 413-424.
Podsiadlo, D., & Richardson, S. (1991). The timed "Up and Go": A test of basic
functional mobility for frail elderly persons. Journal of American Geriatric
Society, 39, 142-148.
Radin, E., Yang, H., Riegger, C., Kish, V., & O'Connor, J. J. (1991). Relationship
Between Lower Limb Dynamics and Knee Joint Pain. Journal of Orthapedic
Research, 9, 398-405.
Rejeski, W. J., Craven, T., Ettinger, W. H., Jr., McFarlane, M., & Shumaker, S. (1996).
Self-efficacy and pain in disability with osteoarthritis of the knee. Journal of
Gerontology Series B Psychological Sciences and Social Sciences, 51, P24-29.
98
Rejeski, W. J., Ettinger, W. H., Jr., Martin, K., & Morgan, T. (1998). Treating disability
in knee osteoarthritis with exercise therapy: A central role for self-efficacy and
pain. Arthritis Care and Research, 11, 94-101.
Rogind, H., Bibow-Nielsen, B., Jensen, B., Moller, H. C., Frimodt-Moller, H., & Bliddal,
H. (1998). The effects of a physical training program on patients with
osteoarthritis of the knees. Archives of Physical Medicine and Rehabilitation, 79,
1421-1427.
Schilke, J. M., Johnson, G. O., Housh, T. J., & O'Dell, J. R. (1996). Effects of muscle-
strength training on the functional status of patients with osteoarthritis of the knee
joint. Nursing Research, 45, 68-72.
Sharkey, N. A., Williams, N. I., & Guerin, J. B. (2000). The role of exercise in the
prevention and treatment of osteoporosis and osteoarthritis. Nursing Clinics of
North America, 35, 209-221.
Silvers, W. M., Rutledge, E. R., & Dolny, D. G. (2007). Peak cardiorespiratory responses
during aquatic and land treadmill exercise. Medicine and Science in Sports and
Exercise, 39, 969-975.
Stagni, R., Fantozzi, S., Cappello, A., & Leardini, A. (2005). Quantification of soft tissue
artefact in motion analysis by combining 3D fluoroscopy and
stereophotogrammetry: A study on two subjects. Clinical Biomechanics (Bristol,
Avon), 20, 320-329.
Stauffer, R. N., Chao, E. Y., & Gyory, A. N. (1977). Biomechanical gait analysis of the
diseased knee joint. Clinical Orthopedic Related Research, 126, 246-255.
99
Stener-Victorin, E., Kruse-Smidje, C., & Jung, K. (2004). Comparison between electro-
acupuncture and hydrotherapy, both in combination with patient education and
patient education alone, on the symptomatic treatment of osteoarthritis of the hip.
Clinical Journal of Pain, 20, 179-185.
Sutbeyaz, S. T., Sezer, N., Koseoglu, B. F., Ibrahimoglu, F., & Tekin, D. (2007).
Influence of knee osteoarthritis on exercise capacity and quality of life in obese
adults. Obesity (Silver Spring), 15, 2071-2076.
Walker, C. R., Myles, C., Nutton, R., & Rowe, P. (2001). Movement of the knee in
osteoarthritis. The use of electrogoniometry to assess function. Journal of Bone
and Joint Surgery (British), 83, 195-198.
Wang, T. J., Belza, B., Thompson, E.F., Whitney, J. D., & Bennett, K. (2007). Effects of
aquatic exercise on flexibility, strength and aerobic fitness in adults with
osteoarthritis of the hip or knee. Journal of Advanced Nursing, 57, 141-152.
Williams, R.H., & Zimmerman, D.W. (1996). Are simple gain scores obsolete? Applied
Psychological Measurement, 20, 59-69.
Winter, D.A. (1990). Biomechanics and motor control of human movement. New York,
NY: Wiley.
Wyatt, F. B., Milam, S., Manske, R. C., & Deere, R. (2001). The effects of aquatic and
traditional exercise programs on persons with knee osteoarthritis. Journal of
Strength and Conditoning Research, 15, 337-340.
Zimmerman, D.W., & Williams, R.H. (1982). Gain scores in research can be highly
reliable. Journal of Educational Measurement, 19, 149-154.

100
APPENDICES

101
Appendix A
Mean Residual Analysis

102
0.0
0.5
1.0
1.5
2.0
2.5
0 5 10 15 20 25 30 35 40 45 50
Mea
n R
esid
ual
(m
m)
Cutoff Frequency (Hz)
Mean Residual Versus Cutoff Frequency
Appendix A. Sample data demonstrating the selection of optimal cutoff frequency for
filtering.
103
Appendix B
Coefficient of Variation
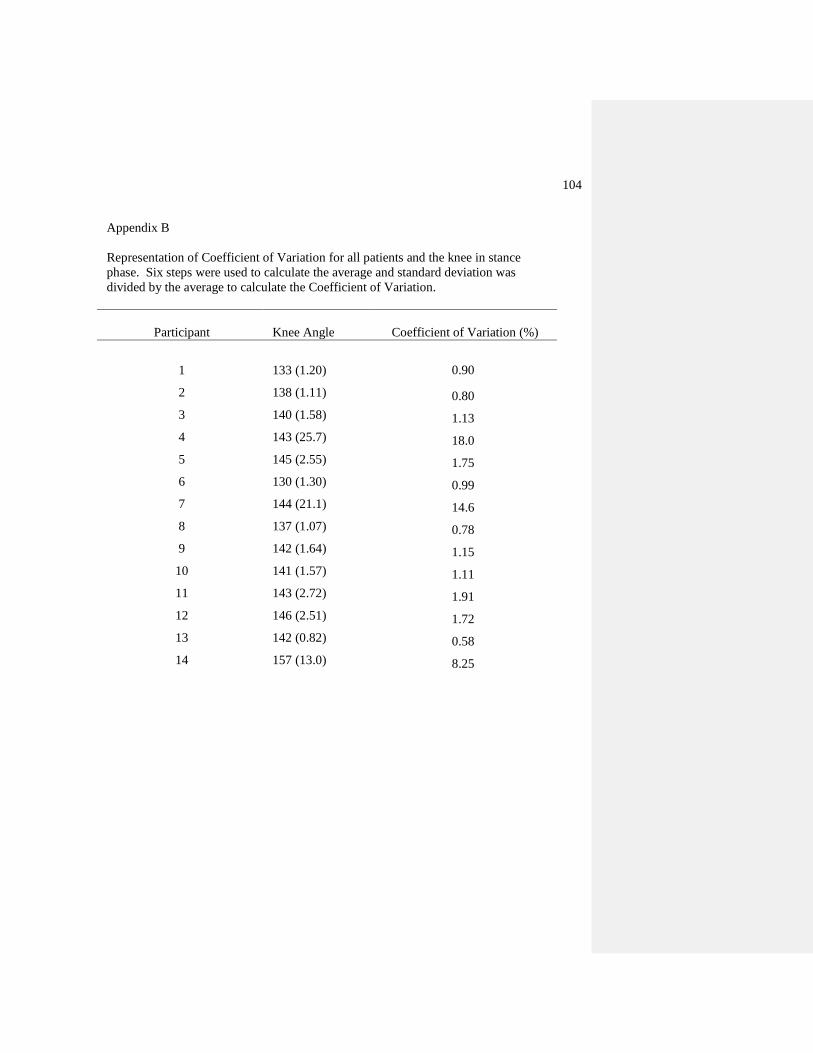
104
Appendix B
Representation of Coefficient of Variation for all patients and the knee in stance
phase. Six steps were used to calculate the average and standard deviation was
divided by the average to calculate the Coefficient of Variation.
Participant Knee Angle Coefficient of Variation (%)
1 133 (1.20)
0.90
2 138 (1.11) 0.80
3 140 (1.58) 1.13
4 143 (25.7) 18.0
5 145 (2.55) 1.75
6 130 (1.30) 0.99
7 144 (21.1) 14.6
8 137 (1.07) 0.78
9 142 (1.64) 1.15
10 141 (1.57) 1.11
11 143 (2.72) 1.91
12 146 (2.51) 1.72
13 142 (0.82) 0.58
14 157 (13.0) 8.25