Embed Size (px)
Citation preview
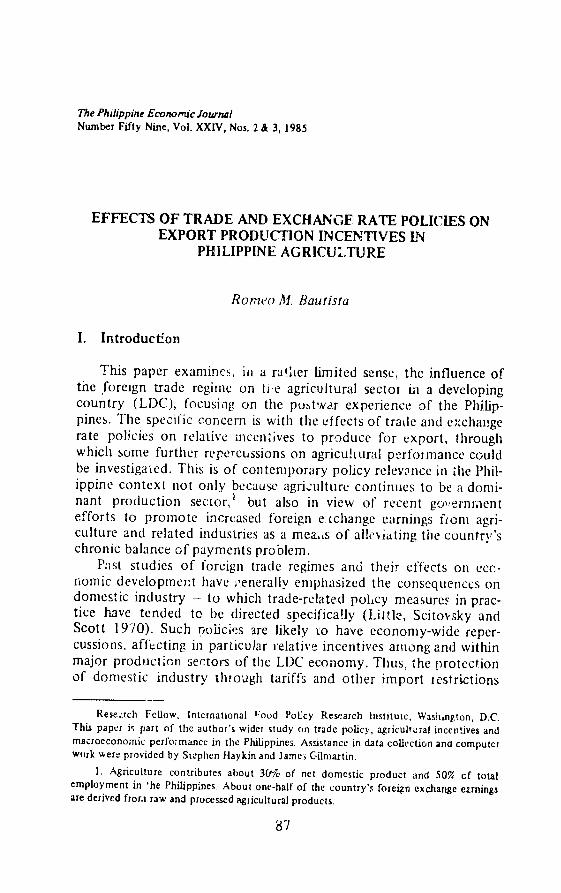
Effects of Trade and Exchange Rate Policies on Export Production Incentives in Philippine Agriculture
Romeo M Bautista
Reprintea from The Philippine Economic Journal No 59 Vol 24 Nos 2 amp 3 198
4Aig C - 36 S A
Reprint No 129
The Philippine Economic Journal Number Fifty Nine Vol XXIV Nos 2amp 3 1985
EFFECTS OF TRADE AND EXCHANGF RATE POLICIES ON EXPORT PRODUCTION INCENTIVES IN
PHILIPPINE AGRICUTURE
Romeo Al Bautista
I Introduction
This paper examines in a rather limited sense the influence of tne foreign trade regime on ieagricultural sector in a developing country (LDC) focusiag on the puotwdx experience of the Philipshypines The specific concern is with the effects of trade and exchange rate policies on relative icentives to produce for export throughwhich some further repercussions on agriculhural performance could be investigated This is of contemporary policy relevvance in ie Philshyippine context not only because agriculture continues to be a domishynant production sector l but also in view of recent governmentefforts to promote increased foreign e~cchange earnings fforn agrishyculture and related industries as a meas of alleiating the countrys chronic balance of payments problem
Past studies of foreign trade regimes and their effects on eccshynomic developmenzt have ienerally emphasized tile consequences on domestic industry - to which trade-related polcy measures in pracshytice have tended to be directed specifically (Little Scitovsky and Scott 1970) Such rpiicies are likely to have economy-wide repershycussions affecting in particu)ar relative incentives among and within major production sectors of the LDC economy Thus the protectionof domestic industry through tariffs and other import restrictions
Rese-rch Fellow International ood Polcy Research Institute Washington DC This paper ispart of the authors wider study on trade policy agriculrral incentives and macroeconomic performance in the Philippines Assistance in data collection and computer woirk kereprovided by Stephen Haykin and Jarne Gilmartin
1 Agriculture contributes about 30 of net domestic product and 507 cf total employment in he Philippines About one-half of the countrys foreign exchange earnings are derived frorm raw and processed agricultural products
87
88 THE PHILIPPINE ECONOMIC JOURNAL
which has characterized Philippine industrialization and trade polishycies throughout most of the postwar period can be presumed to havehad deleterious effects on production and export incentives in agrishyculture the magnitude of wiich would depend as recent studies -have shown - on substitution relationships in both production and demand
Section 11 of this paper gives a brief description of postwartrade and exchange rate policies in the Ihilippines indicating various stages in the evolution of the countrys foreign trade regime Theinduced changes in relative incentives among domestic activitiesprodttcin tradable goods are examined in Section IIlusing effective exchange rates Lstimated in previouIs studies This is followedI)y an analytical ampiscussion in Secion IVof the influence of theIoreign) trade regime on the strIctInre of domestic prices aiong exshyportables im portables and home goods which is shown t detershymine relaitive centives to produe for export vis-ha-vis 1orne goodsproduction Section V also describes the statistical e mation of theincidnce equations linking domestic Cthe price exportablesrelative to home goods to the domestic price of exportables relative to other tradable goods which provides the basis for representing quantitatively the indirect price effects of the foreign trade regimeIn Setion VI the effects on agricultural export incentives are spccifshyically examined Some aspects of relative incntives not taken into account in the effective exchange late measure use(d are discussedand concluding rem arks are given in the final section of the paper
II Postwar Trade and Fxchange Rat- Policies 3
Like any other developing countries the Philippines has relied on foreign trade and exchange rate policies aI key instrument inpromoting economic development since the end of the World Wr IIRapid industrialization Zhrough import substitution was emphasizedin the 1950s and I960s before a more outward-looking developmentpolicy began to be adopted in the early I9 70s
In response to a severe balance of payments problem directcontrols on imports and foreign eochange were instituted in 1949-50by the Philippine government Together with a heavily overvalued domestic curency (which retained the prewar exchange rate of two pesos per U S dollar) the criterion of essentiality governing the
2 See fox exarnptl (arcia (1Q81)3 For a detailed discus-ion of Philippine trade and exchange rate policies see Baldwin
(1975) and ilautista (1985) This section draws heavily on the latter source
89 BAUTISTA TRADE AND EXCHANGE RATE POLICIES
system of trade controls created a significant incentive for the domestic production of substitutes for industrial consumer goodsimports of which were considered less essential on the other hand imported raw materials and other essential producer goods were obtained at artificially low prices (in peso terms) Effectively penalshyized therefore were the primary production sectors (agriculture and mining) export-oriented industries and intermediate and capitalgoods production (categories which are of course not mutuallyexclusive) The rade deficits witnessed in the 1950s particularly during the second half of the decade were a reflection of the inshycreising import dependence of domestic industries and the inability tc stimulate exports
Towards the end of the I950s there was little room left for nonshyess ntial imports as producer goods already amounted to nearly909i of the aiinual import bill The worsening trade deficit promptedthe authorities to gi adually (lisinantle the conitrol system and rationalshyize the foreign exchange rate In 1902 the exchange rate for imports was raised to 39 pesos per US dollar while exporters began to receive 352 pesos per dollar This multiple exchange rate arrangeshyment gave way in 1905 to a unified system which officially devalued the domestic currency to d ie exchange rate of 39 pesos per dollar These policy reforms however did not alter very much the incentive structur- favoring import substitultion in industrial consumer goodsA highly protective tariff system introduceeuro in 1957 but made redundant at the time by the import and foreign exchange controls preserved the charcter of the protective structure biased againstexporting and backward integration
The I960s were therefore attended also by balance of paymentsdifficulties accentuated in the second half of the decade by expanshysionary monetary and fiscal policies that the government adopted In late 1969 a foreign exchange crisis developed precipi-ted by the need to service short-term credit that financed the trade deficits of the immedttely pre-ceding years The policy response was to float the PLilinpine peso in Febru-ry 1970 and eliminate some of the exshychange controls in effect since 1967 By December 1970 the exchange rate had settled to 64 pesos per US dollar representing an effective devaluation of 614 over the year It went up gradually to 750 b year-end 1975 around which level the exchange rate fluctuated very slightly through the end of the decade 4 Taking into account
4 Although it was officia claimed that a free exchange market had been created the Central Bank hequently bought and sold foreign exchange intervening heavily in cershytain years tu take effective control of the peso-dollar exchange rate See Bautista (19P
pp 147-79)
90 THE PHILIPPINE ECONOMIC JOURNAL
the exchange rate realignments of major currencies since the early 1970s the average annual rat of peso depreciation was 38 in nominal terms during 1971-80 In view of the 165 average annual rise in tile general price level (wholesale price index) over the same period the domestic currency actually was made to appreciate conshysiderably in real terms
The floating of the Philippine peso in early 1970 was followed bythe enactment of the Export Incentives Act later in the year signalshyling a policy shift towards a more outward-looking strategy of indusshytrial development away from the heavy import substitution drive of the previous two decades Both measures recognized the need to orient local industries toward the export market and promote nonshytraditioral exports Among other incentives manufacturing firms registereo with the Board of Invesiments under the Export Incentives Act qualified for various kinds of t- exenptions deductions from taxable income and tax credits They served to compensate in partfor the still pervasive bias of the countrys incentive system againstexporting The highly protective and distorted tariff system was the primary source of this bias bit no aftempt was made to deal directiwith this source of Hias as art (l1 the export promotion program durig the I970s 5
The primary secters (agri ilture and mining) producing the counshytrys traditional exports did not benefit from government policy efforts to promote exports during the 19 70s as much as the indusshytrial sector As part o tie devaluation package adopted in early1970 exporters of traditional export products were required for a time to convert 80 of their foreign exchange earnings at the old rate of 39 pesos per US dollar This dual exchange rate arrangeshyment was later replaced by temporary stabilization taxes on tradishytional exports at rates ranging from 4 to 10 ad valorem This was made a peimanent part of the customs and tariff code in 1973 Moreshyover in February 1974 an additional tax was levied on the premiumderived from export price increases beginning 1973 Thus the windshyfall gains from the de aluation and the commodity boom in the early part of the I976z were partly siphoned off from producers af tradishytional export products
Relative incentives due to trade and exchange rate policies thereshyfore tended to be biased against domestic production of agricultural exports throughout the postwar pcriod The foreign trade regime also
5 The Revised Tariff Code of 1973 simphfied the rate sructtre and actually raised more duties than it lowered
91 BAUTISTA TRADE AND EXCHANGE RATE POLICIES
discriminated against industrial exports particularly under the imshyport and foreign exchange controls of the 1950s however in the 1970s the export bias of the protective tariff system was being partshyly offset for domestic manufacturers by fiscal incentives and other selective export promotion measures The heavy bias of Philippine postwar trade and exchange rate policies was toward the industrial producers of import-substituting goods especially those competing with foreign suppliers of nonessential consumer goods imports
I1 Effect on Relative Incentives Among Tradable Goods
One useful measure of sectoral incentives provided by the foreign trade regime is the effective exchange rate (EER) for various typis of external transactions ie the number of units of domestic currency actuallh paid by importers or reccived by exporters per unit of foreign exchange including trade-related taxes and subsidies Invoking the lam c one price for the small open economy the long run effect of differential FR changes among various classes of tradables on their relative domestic prices is equiproportional Denoting the domestic prices of exportables and importables by Px and P their foreign prices by PX and P and their effective exchange rates by EER and IFUR respectively we have
() l = tUR f) = (I --tx )R x P
(2) = 1 11R = (I + t m ) RFIMR~ rP
where t and t are tile implicit export tax and import tariff rates and R and R are the nominal exchange rates applicable to expert and import goods respectively Thus other tlhings the same a 10 increase in the import-export EER ratio should lead ultimately to a 10X rise in the domestic price of import goods relative to export goods encouraging a production-shift toward import competing goods
EER estimates for each year during 1949-71 have been derived by Baldwin for different exchange control categories used by the Central Bank taking into account [not only] the different exchange rates applicable to various types of transactions [but also] the difshyferential impact on these transactions of tariffs discriminatory sales or compensating taxes (on imports) special foreign exchange taxes exemptions from various domestic taxes subsicized borrowing rates and marginal-deposit requirements on imports (Baldwin
92 THE PHILIPPINE ECONOMIC JOURNAL
1975)6 1his time series has been extended hy Senga (I 983) through1980 using Baldwins procedure and distinguishing also among thevarious exchange control categories For present purposes we areespecially interested in the ITR estinlates for traditional (mostlyagricultural and mining) exports new (industrial) exports andimports 7 Domestic production cornpetes heavily with imports ofnonessettial consumer goo)ds almost hy definition and hence themoverrfn t of t-ER Cor this particular import category relative totradidonal and new exports Also) Tuerit s Close exallliJ tion
The average annual 1111R levels and ratios for the a bovementionedcategorits of tradable goods are dlowrl for tile su hperiods 1950-59I9t6)O-01) And 1 M)P1)-Willlahle I tigurcs I 3 p1rtray the annualmovements in tile 1l1R ratio btwetcn traditional exports and each oflhe other tradable good caIICg-ies lhe ratios are consistentlythan one implyi A CtiiC nnin discrimination against less
traditionalexports Ihc increasin bias in taJvir of inport-comnieting producshytioT dtiring the ctir period is Also evident however relative to newexports the bia~ 1gair lt traditional exports appears lowest in tile I 1)PU
IV Fffec oil Ixport Incentives Rel ltive to Home Goods Anualv tical Fraie(ork
Ill 11dditiOn t the direct influence of the foreign trade regime onthe rClative prices among radable goods export incentives are also affected iutdit- ctly through the further repercussions on the domesticprice ot expotahle goods relative to home goodsIn the iilpic model of a small econory in which three goods areprodued naimely exportables impotables and home goods tradeand exchange rate policies affect directly the domestic pricc of exshyportables relative to importables which in turn affect the domestic
I it boud be noted that the lR measure does not capture tileadditional protecshytive effect tha nay arise trom quantitative import restrictions Therefore tileto extentthat if) eign exchange allocati-n and impxort quotas etfectively restricted importationtileof particular product groups (as with1950s) the I tR estimates understate the
nonessential incentive
consumer good imports during thebias toward domestic production of
inmport substitutes7 Liriffs and other taxes were averaged across comnmodities V ithin cacti importcategory by Bialdwin and Senga on an unweighted basis Sinilal tlr allimnports EIRin Table I above are unweighted averages of the available FER estimates for the six importcategories It would have been preferable to use weights based on import-competing producshy
tion but relev-nt data are not available
o
I5
14
13
12 -~gt
9 Iii
8 09 Xo8m 08
07
S06
Z
4 0
01 -
02shy
950 1955 1960 1965 1970 1975 1980
FAGURE I
RATIO OF EER FOR TRADITIONAL EXPORTS TO EER FOR iMPORTS
15 -I
14shy
13
0 12
m
09
Iz -
07- r w
t71
06- 0
z 05
040
00 0 2 - i z
1250 1955 1960 1985 1970 1975 1980
FIGURE 2RATIO OF EER FOR TRADITIONAL EXPORTS TO EER FOR NONESSENTIAL
CONSUMER GOOD IMPORTS
16
15
14
gt o 12
II
rM 05shy 07- z07
04
03shy
02
02 0
1950 1955 1960 1965 1970 1975 1980 [
FIGURE 3 RATIO OF EER FOR TRADITIONAL EXPORTS TO FFR FOR NEW EXPORTS
96
1970-80
THE PHILIPPINE ECONOMIC JOURNAL
TABLE IAVERAGE EFFEC1kVE EXCHANGE RATES BY PRODUCT CATEGORY
Category 1950-59 1960-6 Q
(pesosUS dollar)Traditional exports 2000 3459 o602 All imports 2578 5978 11868
(776) (579) (556)Nonessential Consumer 3645 10563 25459Good (NEC) impots (549) (327) (259) New exports 2294 3704 8018
(872) (934) (823)
Note Numbers in parenthces indliite rtios ot ii-R ltr traditional cxports to the lERs for other prodLct cate rtt S Sourcc ( l t-d troll) Fable 5-1 in laldwin (1975) and ppciidix 2 iini tra (1)83)
price (f pA vriles relative to home goods If foreign trade is inbalanc thc csjtilihnmi properties of the model can be analyzed in )itthterms (O equiliblbrilnl in the hmine goods market We make use ofthe latter pproach ill lriving the cqtilibrium price relationships
amnolng the IlIrre g(ods s which in Lte Elbsequent application to thePhilippines ire fUrth- disnigregated into various agricultural exportcategories
The demanid and supply functions for home gocs can be represhysentel respectively by
(3) Dh D1 (IM 1 1) 1 )h 4 and
(4) Sh hS (Prm PPh CP
where PM = domestic of importable goods domestic price of exportable goods
Ph = domestic prie of home goods
8 This analytical approach follows Dornbusch (1972 pp 177-85) Sjaastad (198)and Garcia (1981)
97 BAUTISTA TRADE AND EXCHANGE RATE POLICIES
Z h = total expenditure in terms of home gocds
CP = productive capacity of the economy detershymined by the existing domestic resources and technology
Differentiating (3) arn (4) while holding Z h and CP constant yields
(5) Cm -itn + Cx (ix f
(6) 17rn (I7m P + flx (PA - P
where c and c are the demand elasticities for home goods with respect to the relative prices of importables and exportables respecshytively 77m and r- are the orresponding supply elasticities and the hat (^ ) over a variable dcnotes a proportionate change
Setting I) = 5 t examine the com parative static properties of the model we lhC
(7) 0M (I 1) (11Y Ph) =0
where OM f 7 and 0 x -ix
Therefore
IOm ( m -- fix) + Om(tsx -- ih)] + Ox(Px -Ph) = 0
i nd hence
w lerec = 0m(0 + 0 ) Equation (8) is a necessary relationship an ong the domestic prices of exportables importables and home go )ds when the economy is displaced from one equilibrium state to another Note that o is positive and less than one if 0m ex gt 0 ie the cross price elasticities of excess demand for home goods are positive 9 Also the incidence parameter will be greater the higher
9 As pointed out by Dornbusch (1972) this condition does not require (a) that home goods and tradable goods txwsubstitutes both in production and in demand and (b) that exportables and importables be necessarily substititcs or complements
98 THE PHILIPPINE ECONOMIC JOURNAL
(lower) is tile degree of substitutability in consumption and producshytion between home goods and importabls (exportables) Assumingfull transmission of c iinges in cftfeklive exchange rates (reflectingchanges in exchanetrade and rate policies) on the domestic nrices of exIportafbles and thein pa rtahles incidence paramleter co detershymines u ri(l]Cel the induCed Cha IC in the domestic price of exportshyables relative tbone goods
[q(Iation ( lcan (transH)rmcl( iInto ml Nprcssi~n for tile realexchangc rate de inet as the ratio ol theii inl11 rate Rcxchange(assuning tie ame exchage rate r exports and imports) to the price at iome goods I sin (1I ad 2
(P) I + R + I
where 1 t =M +1 tM andR = R = R m
Setting P1P 0 substituting (9) and (10) into equation()to eli minate -andt aInd siinplifying we get
ti1) A 11 = [Iw1 A (I w)iT I which shows explicilly the effect ot trade policy represented by T and 1 on the real exchange rate
Distinrguishing between agric iltural and nonagricultural exportgoods equation (7)can be modified as follows (12) o ) + O g) = (P h ( amp1 ) 0
where Px and Px are the domestic prices of agricultural and nonshyagricultural export products respectively and
Ox = c q and O x =-c --77nx
the Os cs and ass being defined before but in reference to the two export goods
Let c = Orr0 Oax - OO and =conx OxO where O 0 +ax + Onx Equaion (12) can then be written
(13) =w h 1- ix)ax + Cnx inx
or
(14) fiax -h = Wn (Oax -imn)+ Wnx (iax -X
99 lAUTISTA TRADE AND EXCHANGE RATE POLICIES
Equation (13) expresses as a weighted average of the proporshytionate changes in the domestic prices of the three categories of tradable goods In equation (14) the donmestic price of agricultural export products relative to home goods is seen to depend on (a) the structure of domestic prices among tradable goods and (b) the incidence parameters w and wX
The extension io any number o export goods is straightforward Analogous to equation (i4) tie proportionate change in the domestic price of expcrt wood i relative to home goods can be expressed as folshylows
= 6(Ib c Pamp ---f + 1 Wi f-i --fij
where ) is the domestic price of export good i and the wos ae the incidence parameters
V stimatirm the Incidence Equations
We now proceed to the estimation of the incidence parameters appearing in equtions (8) (14) nd (15) Basic data used are described in the Appendix below One important point to note here is that the availa ble price data permit a disaggregation of export goods into agricultural and nonagricultural as well as into five cateshygories of agricultural _xporl products bIt not a disaggregation of import goods into the exchange control categories (including nonshyessential consuner goods) for which different effective ex-hange rates h_ve been estimated This is the underlying reason for having only an aggregatc PM variable in the analyticai discussion above
It is necessary to recall that the analysis is based on comparative statics assuming that total expenditure (Z ) and productive capacity(( ) reilain constant Using historical data invalidates this assumpshytion warranting the inclusion of and CI as shift variables in the regression equation tthw~ver becausC they turncd out to be highly correlatedtIJ it was decided to include only Cp (in both the aggreshygative and disaggregative specifications) Also since equations (8) (14) and (15) represent domestic price relationship when external trade is in balance we included a balance-of-trade variable (BOT) defined as the ratio of the trade balance (exportsminus imports) to exports as an additional explanatory variable in each of the estimating equations Lastly serial correlation of the error terms appeared
10 The correlation coefficient betweeni Zh and C is 995
100 THE PHILIPPNE LCONOIA JOURNAL
significant in the initial regressions for each equation the Cochrane-Orcutl iteration technique was used to correct for first-order autoshycorreid tion
The estimation results for the aggregative equation includingspecificatios with and without ( and BOT are as follows 1
(16) inP= 005 + S hIP 1 323 nC( + 095 OT 2 - 15) Q25) 550) (221)
R f4) D1 = 174 Rho = 037
(17) lnPP 032 + 8-46 InPiP + 121 BOT (16) (923) (287)
R = 930 DW 176 Pho = 959
(18) nP1-- -107 + S73 In Pr (- 48) (844)
R = 911 DW = 160 Rho = 961
Each of the coefficient esinates is statistically highly significantand more than 90 of the variance of the dependent variable isexplained The estimates of the incidence parameter (coefficientof PP Ii ) are seen to lie within a narrow range fromn 846 to873 inditating robustness across different specificationN We mayinfer that In the Philippine case trade and exchange rate policiesbiased agai ist cxpctables relative to import-computing productionhave also rnded to reduce substantially the relative incentive toproduce export gxls vis-a-vis home goods
Considering only agrict iiral export goods the estimated equashytion is as follows 12
11Ordnary Least Squares was used on annual data for the period 1950-76 Numbersin parentheses are [-values of the coefficient estimates
12 The stimati-n resilts for the disaggregative agricultural export categoriesshown in Appendix Table 2 do not differ markedly as
from the aggregate results The estishymated incidence parameter for imports wto varies from 582 for fruits and vegetablesto 684 for coconut products while that for nonagricultural exports wn ranges from 350for tobacco and products to 436 for fruits and vegetables The domestic price of each ofthe five agricultural export categories is found not to be significantly influenced by itsdomestic price relative to other agricultural export products Finally the coefficient estishyrsaves for the shift vatiat les In Cp and BOT) are in the neighborhood of their respectivevalues in the aggregate regression
101 BAUTISTA TikADE AND EXCHANGE RATE POLICIES
(19) lnPxPh 081 659 P P - 12 atI= + 412 (212) (704) (408)
+ 298 In (1 + 127 BOT (494) (261)
-2 R 986 DW-- 136 Rho = 745
Again thc statistical-gcodness-of-Fit is excellent Other thingsthe same a 1W( rise in the domestic price of importables (eg due to tariffs) is associated with a 66 decline in the domestic price of agricultural export prcduLts relative to home goods the otheron hand a 1T ( incrase in the dlomestic price of nonagricultural export products teg due to subsidies to industrial exports) leads to a 41 fall iiithe relative price of agricultural export goods vis-a-vis home goods
VI Effect on Agricaltural Export Incentives
Based on the estimated values of th incidence parameters the extent to which the observed changes inte effective exchange rates for traditional epo-ts new expots and imports over the three postwar decades fIcom 1950 to 1980 had affected the domestic pricesof agricultural extport products relative to home goods can be quantishyfied using equation (14) above Domcstic production competesclosely bun not exclusively with nonessential consumer goodsimports ie there is some substituIability between other imports and domestic products admittedly of a lower degree Since it has not been possible to disaggregate PM we consider below the effeets on P1 ijI of the observed changes in EERs for both all imports (Case 1) and NEC imports (Case 2)
The calculated changes in the l P imply a time )attern of the
corresponding indices of the price ratios for Cases I and 2 as shown in Figures 4 aTnd 5 respectively They represent hypothetical annual movements of the domestic price of agricultural exports relative to home goods due to postwar trade policy assuming that other factors (eg world prices) i ffecting the pice ratio remain unchanged In each of thet two cases ove observes a general decline over time in relative price incentive for agricultural export production vis4-dvis home goods
100
90
80
o
70 -i ~50shy
50 H 30
20H
10 zgt~
0 1950 1955 1960 1965 1970 1975
FIGURE 4 CALCULATED INDEX OF THE DOMESTIC PRICE OF AGRICULTURAL
EXPORT PRODUCTS RELATIVE TO HOME GOODS (Case i)
1980 -
90
80
70
gt
60
50
tz gt
30
20
gt M
10-shy
1950 1955 1960 196Z5 970 1975
FIGURE 5 CALCULATED INDEX OF THE DOMESTIC PRICE OF AGRICULTURAL
EXPORT PRODUCTS RELATIVE TO HOM-GOODS (Case 2)
1980
104 THE PHILIPPINE ECONOMIC JOURNAL
Estimates of the changes in relative prices of agricultural exportproducts due to he movements in [ER ratios over each of the three postwar decades and over the entire period ae summnarized in Table 3 The first line shows the proportionate chl-anges in the domesshytic price of agricultural export products relative to new (industrial) export ii) i l hased on the oIServed h is in the [R ratios for traditional and litw CNpOrtS Ihi is Ilhlwebie c0orre-poIlding effects on P)a based on the [FR estifoes br all imports (ase I) and r nonessential consutmer good inports ((ase 2) Fhe last two lines in Table 2 give the induceJ changes In Ptj calculated from the indices ie rived earlier icf V igu rtc-s 4 and 5 distinguishing again hctween C(ases I and 2
One striking o)hservalion cOncCrnim the entries in Table 2 is Ihat except oro 1 in I)95 J-o ne tive effects on the relative
olluCstiC prices OfAi cuitural export products are inrdica ted throughshyout Industrial inmport stbstitution based on direct controls in the I th5O is seen to have heu vilV penalized agriclt-ltural exports especiahy in reltion to imlport-conlll)eTlnug and 1ii11e goodS production File policy reforms in- the early I )00s which ds1 antled the system of impo)rt and Iremen chany contr-ols an1d deLviltied the Philippine peso tppalave agrictlturil industrial) fajvorcd over exports however the iinitivt stlcitlur oecarri ov- ore biased toward hnportibles ind home oods Finillv in the cxport promnotiondecade of the IQ-7)s aerictllni a export produtAion was ironically
TABLE 2 EFFECT OF FER CHANGES ON RELATIVE i)OMESTIC PRICES OF
AGRICULTURAL EXPORT PRO)UCTS
Relatve price 1950-59 1 )5Y-(9 19o0- 1950-80
(percent) PaxPnx --26 75 --113 --72 Pax Iin
Case 1 -356 --6 -66 -438 Case 2 -595 172 -- 147 -714
PaxhCase 1 --254 --65 --32 -325 Case 2 -435 -76 --140 --551
Note Case I is bawd on the effect on Pm due to changes in LEEKfor all imports Case 2 is based on the effect or P due to changes in IER for NEC imports
BAItTISTA TRADE AND EXCHANGE RATE POLICIES 105
not given any encouragenient tle iIduced changes in relative domesshytic prices duc to trde and exchainge rite policies heing seen in Table 2 to have ftvored industrial exports import-corn peting products and hole gOo(k
The last colunn (I Tahle 3 shows the overall deterioration inrelativ-e incentl 11iveC t aricultural cxport iFduCiV)Ji du Le t he
forciwn tiadc ICljmic o er the threc postwar dcidc Based )n (asc 2 the inducd decline in the domestic price ()I agrictltural exporl products is scN b ielaI1T I0 im)port-comlpetingMt ll)lC than( products andi albt 5) ieatie to hone eoods O1 the other hand the incentive bias towldll nv industrial) exp)orts dLC to trade policy incfeascd bo oIl et A eu )() And ]I )
lox sin tihese policV-iilttuced in1CS trus clifiies price ilncelivec n i t lt the auhld lnlVCel tClltin elativC priCeS Of
I K in pISagricullltural xpit i vil I lsti 1aC vailableoly throne] I~Th i nt td in lK App eu ndi]egtI ofthreIlle-yearClti
MOVil it ae ( h 1M 1ti 1 ) reLclculC ltcd aind plotted inli Mii Ftiguregt 0 t IttiSlltfe c-espoiin ine of the lyposhytl lical price rtogt1i r c in 1il Ill lti t ilcentives due to til I (flol ll Ion l l l
() l i0 liit t I l ii p ices of agrishycUlt iii] c n i tl I i j i ac i tli xc r This is
liyciilii int a I gt ictl r I hll ic ilL h im plies that ticr u t~lii a I1 I u t ci lll l tpriC lllll have
lbct i hehx (t i i~l li 111 11tl thc I [10It gtatulple
iulclt v i t (il -K iit l i iI t ii hil) il- slishoNing slartK I i i clli id i three i) ic o t R Ie twial relative
price I i tlt HI1Pi I Pts i u kl rlaC d to the rapid eP(tiM1l illl lii teLluiNU I] st1 rts1 dtlIliut [ I)7()s as 1101C1 Ill t I pueC C illI cht I Kic uc tolC ill 1p1c()f tl Ui1shytav ri - c fuIig Ic Iihlb cill Ilt ili ll t
The traph I FiuriL- t hru _h S Am) suggest that the incentive bias apairist agricu]ltiral exports producetion had not heen insubstanshytial relative to the aCtUal L1OmCstic price chalngCs Tie ratio of the vertical distance between the horiontat line at 1(t) nd the B-curve to the vertical dlistance betwVeen the A- an( 1-curves indicates the cumulative signi fica nce of trade polic relative to the other sources o1 the observedi inovenients in tih domestic prices of agricultural exports The calculated valhCu for 1()5 19o(1 and 1975 are shown in Tabe 3 One finds that even ater the 1972-74 commodity boom the contribution of trade policy to the actual changes in the domestic
2 10
200 oN
190
180
170shy
oo=
0
160-
5150-shy-r
140
I130-i
1201
4 Actual Price Ratio
z
IT
0
90- Trade Policy- induced Price Ratio
80 - -
525 5 5 M5 56 57 58 59 60 61 62 63 64 65 66 617 63 69 70 71 72 73 74 75
FIURtbTIME PROFILES OF ACTUAI AND TRADE tOLICY-INDUcrD PRICE RATIOBETWEEN AGRCULTURAL AND INDUSTRIAL EXPORTS
80
170]
160 to
50
140shy
a
130 H
120 -M
II0 A Actual Prie Ratio z
100shy gt
0 -z
80-4
70
B Trade Policy- Induced Price Ratio t
V
60 --shy
51
Tr
5253
54
5
5 56 5758
58
59
6
6061
62 63
64 65
66 67
68 69 70 71 72
7374
75
FIGURE 7 TIME PROFILFS OF ACTUAL ND I RADF POLICY-INDUCED PRICE RATIO
BETWEEN AGRICULTURAL EXPORTS AND IMPORT-COMPETING PRODUCTS
2701 260j
250shy0
240 230
220 210 -
11shy
200shy190 -
8o -70shy
160-A7 Actual Prce Ratio -
z 150shy140
130
120
0 z0O
100 1_
90-
100 _ _ _ _
B
_ _ __
Trade Policy-
_ _ _ _ _
Induced Price Ratio
_ _
gt
51 52 53 54 55 56 57 58 59 60 61 62 e3 64 65 66 67 68 69 70 71 72 73 74 75
FI(URLTIME PROFILES OF ACTUAL AND TRADE POLICY-INDUCED PRICE RATIO
BETWEEN AGRICULTURAL EXPORTS AND HOME GOODS
BAUTISTA TRADE AND EXCHANGE RATE POLICIES 109
TABLE 3 ESTIMATES OF THE CUMULATIVE SIGNIFICANCE OF TRADE POLICY
RELATIVE TO OTHER INFLUENCES ON THE DOMESTIC PRICE OF AGRICULTURAL EXPORTS VIS-A-VIS OTHER PRODUCT CATEGORIES
1950 1951 969 1975
Industrial expoits (1)ax 1nx )
0 106 022 044
Import-competing goods (1)xPn )
0 804 428 396
Home goods 0 360 253 162 (1ax
prices of agricultural export products remained relatively significant at least with respect to import-competing produc4s and home goods
VII Some Further ( onsiderations and (oslusion
A porn tCd out earlier ie 1P ineasure unlerst aiS the trade regimes degree of bias toward import-competing pioducts in the 19 50s to the extent (htl domestic prices of imported goods incuded a scarcity preininn due to the existence of quantitative restrictions on imlorts and foreign exchangze at the time Indeed direct compashyrison of whodesalc prices of comparble items in the Philippines and the Inited States (adjusti l or transport cost) has shown that in 195) implicit protcztive rates of 400 percent were not uncommon for nonessential consumer ioods whereas the average explicit degshyree oi protection (providco b) exchange rate and tax policies) in 1959 for this Category was around 150 percent (Baldwin 1975 p01) [his iirIics that a substantial amount of windfall gains was eing received by importers of nonessential consumer goods which
provided a further impetus at the time to the domestic productionof import substitutes and resource allocation away from exportindustries
Another aspect of relative incentives due to trade and exchangerate policies not taken into account by the EER measure relates tothe domestic pricing of intermediate inputs Most industrial rawmaterials and other producer goods were allowed to be importedliberally during the period of controls in the 1950s likewise in the
110 THE PIHLIPPINE ECONOMIC JOURNAL
I 9 60s and I 9 7 0s they were subject to much Vlwei tariff rates cornshypared to finished consumer goods Also government policies tend(ed) to raise moderately domestic above horder prices of agrishycultural inputs (David 1983 p 2Q) Using the c-ffec tive protection nite (lIT) measaure vhih repretsnt the matu of protection of doniestic value alcdd one includc bothi it subsidy it)domestic prd-otlr ron the potectlii output MId th pcInlNty from tile protectionl ot inputs
study of tffclive protection in the PhitippinTes based on tariffs and indirect taxes In the mid-1970s shows the weighted average IR to forthe Prinar cctors (agriUultuore and mining) to be only Lj conparcd to d14 for manutaturiac and that for export itjuistries t to be 4 rsu IP for nonexporting iniust ries lxport p1roductiol 111lIcrcutltire as thercreforc being douly penalshy
litricitire t
CtXot pr nt i cULgIii I i lI tT t1 iil by +hie ette eprotr1ori individual agricultira
pineapple11 1or to I o I cror
Sinlladv li - lt of Rsfor the variouSill1i11 I ru- - t ll cxchnigc c(trot LatephliS Jikt-id it I clf tinlig Strong ia tilein foreign iradc ftgillc Lgaiilt 1[iilhm 1u port l thethroughout period 1()4(-71 l1his cvemi alter tic littil )I nport and foreignexchlnge cotils in the ate P)50sI the ujiiiaorblc exchlange rate
exprtrItr s ogeth vrwith tlhe oro)i ctiOtl 1CipO-1ed inpLtsOti the the us us uted the lT R for traditiornal exports to be significantly iegtivc in 1)0I )Moreove the discrepancies ill ettectlive protective rates reialn( cdl) Ucrarco even after liledecontrol efltort and throtlllshyout the rest of the 170s (1 1975 p 106-)i )h0s md early Bldwin
fihe to(regoing discussion serves to ititclrcc tilte thufindings oi reVSent studV indicat ng that postwa Irati mid exchange rate polishyties discrini nated persistently a2iinist agricotural export production Indeed it is remarkah ltint e-el ii li 970s when an outwardshylooking developiini striugy was being promoted by tie government the bias inithe toreign trade regime against agricultural exports conshytinued In the case of industrial exports the existing biases of the tariff str tCtu re aid indirect taxes were being offset at least in1pact by fiscal and financial incentives provided to registered enterprises under tile -xport Priorities Act of- 1970 iswell as by tihe development
13 lellned tohe tlosL exporting more than I0- Ofllo du~tion 14 Av eO revealing illustration in the nput side isprovided hs the governmentshy
enforced to-tiered in 1973-75 was beingpricing of tertilizer during hich tite fertiliter sold to food crop producers at prices 50 to 70 less than prices paid by export crop proshyducers (see David and Wklisacan 1981 )
BAUTISTA TRADE AND EXCHANGE RATE POLICIES llI
ofexport infrastructure specifically directed to labor-intensive manushyfactured products Both inldustrial and agricultural exports grewfaster in the I70s than in Ihe previous two decades in Ilh case of agricultural exports tie comparative average annual growth rates were 15 and 38 in real terms however such imi provctne lt in export performance canI1o he attributed to the trade antid excha ngerAte policiCs adoptd which as made clear in the alhove discussion bcaeC ete n1101t biased against agricultural xport production during the 1)7(ilt
I tailine to provide oir a niore neutral incentive strucLure that corlli haVC eicOu_( rcd a more effiit allocation of scarce resources and greater Nariultral cxports Philippine trade and exchange rate policies ilrougliont ll()i[ of Ihe poslwar period preumlllably Contrishybhlted to a rela Reiiv iii nor economllic pertorrmance in ter-ms of real ric eo tlh and he ha Ltlice of payt llellts It Call also he Colshyt
cIhldl thalt All ill)prI)OvnitilI ill the forcien tiade regime ie correctshyin the imcentive bias against agriculturaI export pro duction represhy
ti otentially significant sourc 0i fltnre growth in agriculshytural inci aid ftoreign XJhzltangc ernings Institutional changes new iechnolic intraiructrr developnt and otler productivityshyraising public nksiles as well as access to foreign marklts may be neceCCsa1ir to boi sienifcailyM the lIreI1 ex potll pl olilarice of Ph iliprinc atgriculnnltle I(I wever Iheyiare likely to prove inmade-Luatle it relative incentive continute to b hea2vily biased against agriclltural cxport producLion
APPENDIX
I)erivation of Domestic Price Indices
The Central Bank begin coillecting wholesale prices of domestic and importshyed products is well as of commodities for the home market and for export in Metropolitan Manila in )949 and published them annually in the Statistical Bulletin in index torm with IQ5 base Yeai until 197o (In 1977 the base period was shiifted to IQ aconpanied by a change in commodity classificashytion) T c weights Of cumlnodiyv gioups for each index are givc-n in Appendix Table I
Locall producLd comrmodities for home consumption do not of course totally constiiute tire home goods or nontradables sector The two important omiisions are housing and services price ata on which are available only as components of the Central Banks Consumer Price Index To represent the domestic price of home goods (P) in the present study a weighted average of
APPENDIX TABLEWEIGHTS OF COMMODiIry ROUPS IN TliF (ENTRAL BAINK WHOLESALE
PRICE INDICES EROPOLIT-NI[OIZ MFi MANILA
WI)iCommodity group I ~JWII of locallyshyczpnr ruides zmported produced comnodities
c711ditteS for home consumption
Xh (PM hI
Food 134Beverages and tobacco
258 458
022 003 88Crude materials 570 050 047 0ML-ieral fuels 007 109 079Animal vegetable oils 089 006 018Chemicals 003 103 051 0Manufactured goods 048 211Machinery transport equipment 152
- 356 049 ZMiscellaneous manufactures 003 028 059 Total 1000 1000 1000
Source StatisticalBulletinXXVIII (December 1976) Central Bank of the Philippines
-2
APPENDIX TABLF 2REGRESSION RESULTS FOR INDIVIDUAL AGRI(UILTUPAL EXPORT CATEGCRIES
~Zr 1rI14 Ph IrP5xTX
Constant 074 07 0 3 081(174) (171 I 3
084 7 (274) -
In Pixm 684 682 582 669 656 gt(630) (662) (424) (689) (73)
in PixPioax - 075 -030 - 078 - 046 -097 z(-87) (-77) (--135) (-64) (-185
In Pix]Pnx 415 416 436 rshy
412 350(393) (340) (410) (399) (366)In (p 286 282 301 302 305 Z
(427) (423) (494) (482) (616) MBOT 135 123 127 126
(259) (267) (250) (255) (281)987 Qc90 978 984 981
DW 136 142 138 131 165 Rho 749 743 744 747
Note The subscripts ix ioax and nx refer to agricultural export categorytively Agricultural exports categories
i other agricultural exports and nonagricultural exports respecshyi =1 for coconut products 2 for sugar and sugar products 3 for fruits and vegetables 4 for abaca andproducts and 5 for tobacco and products
(LJ
692
114 THE PHILIPPINE ECONOMIC JOURNAL
the WPI for locally-produced commodities for home cunsunuption (PI 1)anc the two CPI components (ph2 for housing and P 3 for services) are calcul -I as follows
(AI) Ph = 350() h I + 104 P2 + 537 Ph3
The weights are based on the value adde es computed from the aggregated 12-sector hnput-Output Iransactions Taole for m(5 published in the Philippin Statistical Yearbook 19 75
Wholesale prices of mjor eport plOdUctS (published in tiheStatistical Bulletin) are used ttirepiesent each of the tike agricultural export categoies (Pix ) as folowsv
I (Co prodiltslnut cop[raics-ecada
2 ugar and pioducts cenitifugal stiiir Iruits and vegetabh s -caHLI)iCd pineIpple
4 Abaca and productu Utrriantiactured abaca 5 Tobacco and prodiicis leaf tobacco The aggregate doiniesti f zprice index gricuhi ra export products (P~) is
calcJated as the weighteld aoerie (based ot I(15 eport value shares) of the wholCsale price rirdice Ot t11 priidiwi catcigories 1-5 above The domestic price index for tronagricuhiral export piiihicts ( ) can then he coruptited from the fllowlorig
(A2) SaX ax - - = PV(i ))t
where Sa (=601) is the export value share of agricultural products (categories 1-5 above) in 1965
=Finally for each agricultural export category i (i 1 5) a price index (Uoa) is computd for all oher agricultural export categories as the weighted average of lie wholesale price indices of all agricultvral export categories other than i
REFERENCES
Baldwin Robert E Foreign 7ade Regimes and Economic Development The PhilippinesNew York National Bur-au of Economic Research 1975
Bautista Romeo M Structural Change in the Philippines Chap 6 in Ecoshynomic Interaction in the Pacific Basin edited by Laurence B Krause and Sueo Sekiguchi Washington DC The Brookings Institution 1980
__ Trade Liberalization in the Philippines Paper prepared for the Trade Policy Research Centre (London) International Food Policy Reshysearch Institute January 1985
115 BAUTISTA TMADE AND EXCHANGE RATE POLICIES
David Cristina Economic Policies and Philippine Agriculture Working Paper 83-02 Philippine Institute for Development Studies 1983
- and Arsenio M Balisacan An Analysis of Fertilizer Policies in tile Philippines Journalof PhilippineDeveloment VIII (1981) 21-37
Dornbusch Rudiger Tariffs and Nontraded Goods Journalof international Economics 4 (1972) 177-85
Garcia Jorge G The Effects of Lxchange Rates and C rercialPolic) on Agriculturul Incentives in Colombia 1953-1978 Research Report 24 International Food Policy Research Institute Washington DC 1981
Little Ian Tibor Scitovsky and Maurice Scoit Industry and Thade in Some
Developitg Countries New York Oxford Unive-sity Press 1) 70
Senga Kunio Industrial Policies and Incentive Structuores in the Philippines 1949-1980- Universit of the Philippires School of Economics June 1983 Mimeographed
Sjaastad Larry A Commercial Policy True Tariffs and Relative Prices Chap 3 in Current Issues in Gommercialtolic and Dipiomacv edited by
John Black and Brian Hindley pp 2651 New York St Martins Press 1980
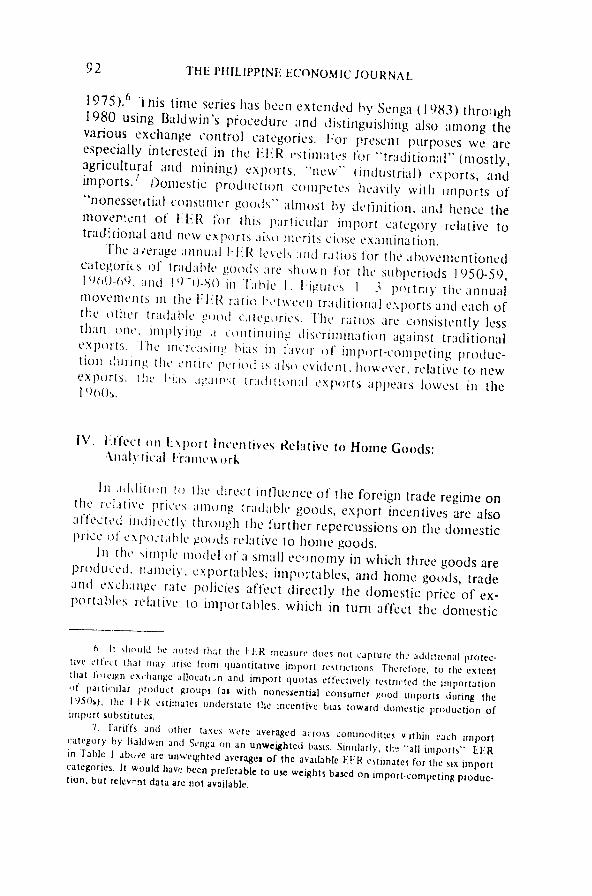
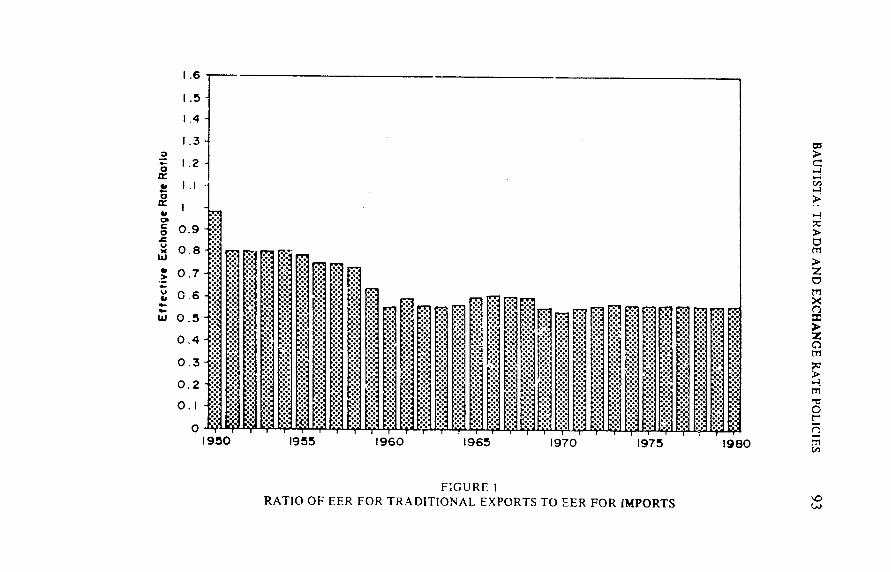
o
I5
14
13
12 -~gt
9 Iii
8 09 Xo8m 08
07
S06
Z
4 0
01 -
02shy
950 1955 1960 1965 1970 1975 1980
FAGURE I
RATIO OF EER FOR TRADITIONAL EXPORTS TO EER FOR iMPORTS
15 -I
14shy
13
0 12
m
09
Iz -
07- r w
t71
06- 0
z 05
040
00 0 2 - i z
1250 1955 1960 1985 1970 1975 1980
FIGURE 2RATIO OF EER FOR TRADITIONAL EXPORTS TO EER FOR NONESSENTIAL
CONSUMER GOOD IMPORTS
16
15
14
gt o 12
II
rM 05shy 07- z07
04
03shy
02
02 0
1950 1955 1960 1965 1970 1975 1980 [
FIGURE 3 RATIO OF EER FOR TRADITIONAL EXPORTS TO FFR FOR NEW EXPORTS
96
1970-80
THE PHILIPPINE ECONOMIC JOURNAL
TABLE IAVERAGE EFFEC1kVE EXCHANGE RATES BY PRODUCT CATEGORY
Category 1950-59 1960-6 Q
(pesosUS dollar)Traditional exports 2000 3459 o602 All imports 2578 5978 11868
(776) (579) (556)Nonessential Consumer 3645 10563 25459Good (NEC) impots (549) (327) (259) New exports 2294 3704 8018
(872) (934) (823)
Note Numbers in parenthces indliite rtios ot ii-R ltr traditional cxports to the lERs for other prodLct cate rtt S Sourcc ( l t-d troll) Fable 5-1 in laldwin (1975) and ppciidix 2 iini tra (1)83)
price (f pA vriles relative to home goods If foreign trade is inbalanc thc csjtilihnmi properties of the model can be analyzed in )itthterms (O equiliblbrilnl in the hmine goods market We make use ofthe latter pproach ill lriving the cqtilibrium price relationships
amnolng the IlIrre g(ods s which in Lte Elbsequent application to thePhilippines ire fUrth- disnigregated into various agricultural exportcategories
The demanid and supply functions for home gocs can be represhysentel respectively by
(3) Dh D1 (IM 1 1) 1 )h 4 and
(4) Sh hS (Prm PPh CP
where PM = domestic of importable goods domestic price of exportable goods
Ph = domestic prie of home goods
8 This analytical approach follows Dornbusch (1972 pp 177-85) Sjaastad (198)and Garcia (1981)
97 BAUTISTA TRADE AND EXCHANGE RATE POLICIES
Z h = total expenditure in terms of home gocds
CP = productive capacity of the economy detershymined by the existing domestic resources and technology
Differentiating (3) arn (4) while holding Z h and CP constant yields
(5) Cm -itn + Cx (ix f
(6) 17rn (I7m P + flx (PA - P
where c and c are the demand elasticities for home goods with respect to the relative prices of importables and exportables respecshytively 77m and r- are the orresponding supply elasticities and the hat (^ ) over a variable dcnotes a proportionate change
Setting I) = 5 t examine the com parative static properties of the model we lhC
(7) 0M (I 1) (11Y Ph) =0
where OM f 7 and 0 x -ix
Therefore
IOm ( m -- fix) + Om(tsx -- ih)] + Ox(Px -Ph) = 0
i nd hence
w lerec = 0m(0 + 0 ) Equation (8) is a necessary relationship an ong the domestic prices of exportables importables and home go )ds when the economy is displaced from one equilibrium state to another Note that o is positive and less than one if 0m ex gt 0 ie the cross price elasticities of excess demand for home goods are positive 9 Also the incidence parameter will be greater the higher
9 As pointed out by Dornbusch (1972) this condition does not require (a) that home goods and tradable goods txwsubstitutes both in production and in demand and (b) that exportables and importables be necessarily substititcs or complements
98 THE PHILIPPINE ECONOMIC JOURNAL
(lower) is tile degree of substitutability in consumption and producshytion between home goods and importabls (exportables) Assumingfull transmission of c iinges in cftfeklive exchange rates (reflectingchanges in exchanetrade and rate policies) on the domestic nrices of exIportafbles and thein pa rtahles incidence paramleter co detershymines u ri(l]Cel the induCed Cha IC in the domestic price of exportshyables relative tbone goods
[q(Iation ( lcan (transH)rmcl( iInto ml Nprcssi~n for tile realexchangc rate de inet as the ratio ol theii inl11 rate Rcxchange(assuning tie ame exchage rate r exports and imports) to the price at iome goods I sin (1I ad 2
(P) I + R + I
where 1 t =M +1 tM andR = R = R m
Setting P1P 0 substituting (9) and (10) into equation()to eli minate -andt aInd siinplifying we get
ti1) A 11 = [Iw1 A (I w)iT I which shows explicilly the effect ot trade policy represented by T and 1 on the real exchange rate
Distinrguishing between agric iltural and nonagricultural exportgoods equation (7)can be modified as follows (12) o ) + O g) = (P h ( amp1 ) 0
where Px and Px are the domestic prices of agricultural and nonshyagricultural export products respectively and
Ox = c q and O x =-c --77nx
the Os cs and ass being defined before but in reference to the two export goods
Let c = Orr0 Oax - OO and =conx OxO where O 0 +ax + Onx Equaion (12) can then be written
(13) =w h 1- ix)ax + Cnx inx
or
(14) fiax -h = Wn (Oax -imn)+ Wnx (iax -X
99 lAUTISTA TRADE AND EXCHANGE RATE POLICIES
Equation (13) expresses as a weighted average of the proporshytionate changes in the domestic prices of the three categories of tradable goods In equation (14) the donmestic price of agricultural export products relative to home goods is seen to depend on (a) the structure of domestic prices among tradable goods and (b) the incidence parameters w and wX
The extension io any number o export goods is straightforward Analogous to equation (i4) tie proportionate change in the domestic price of expcrt wood i relative to home goods can be expressed as folshylows
= 6(Ib c Pamp ---f + 1 Wi f-i --fij
where ) is the domestic price of export good i and the wos ae the incidence parameters
V stimatirm the Incidence Equations
We now proceed to the estimation of the incidence parameters appearing in equtions (8) (14) nd (15) Basic data used are described in the Appendix below One important point to note here is that the availa ble price data permit a disaggregation of export goods into agricultural and nonagricultural as well as into five cateshygories of agricultural _xporl products bIt not a disaggregation of import goods into the exchange control categories (including nonshyessential consuner goods) for which different effective ex-hange rates h_ve been estimated This is the underlying reason for having only an aggregatc PM variable in the analyticai discussion above
It is necessary to recall that the analysis is based on comparative statics assuming that total expenditure (Z ) and productive capacity(( ) reilain constant Using historical data invalidates this assumpshytion warranting the inclusion of and CI as shift variables in the regression equation tthw~ver becausC they turncd out to be highly correlatedtIJ it was decided to include only Cp (in both the aggreshygative and disaggregative specifications) Also since equations (8) (14) and (15) represent domestic price relationship when external trade is in balance we included a balance-of-trade variable (BOT) defined as the ratio of the trade balance (exportsminus imports) to exports as an additional explanatory variable in each of the estimating equations Lastly serial correlation of the error terms appeared
10 The correlation coefficient betweeni Zh and C is 995
100 THE PHILIPPNE LCONOIA JOURNAL
significant in the initial regressions for each equation the Cochrane-Orcutl iteration technique was used to correct for first-order autoshycorreid tion
The estimation results for the aggregative equation includingspecificatios with and without ( and BOT are as follows 1
(16) inP= 005 + S hIP 1 323 nC( + 095 OT 2 - 15) Q25) 550) (221)
R f4) D1 = 174 Rho = 037
(17) lnPP 032 + 8-46 InPiP + 121 BOT (16) (923) (287)
R = 930 DW 176 Pho = 959
(18) nP1-- -107 + S73 In Pr (- 48) (844)
R = 911 DW = 160 Rho = 961
Each of the coefficient esinates is statistically highly significantand more than 90 of the variance of the dependent variable isexplained The estimates of the incidence parameter (coefficientof PP Ii ) are seen to lie within a narrow range fromn 846 to873 inditating robustness across different specificationN We mayinfer that In the Philippine case trade and exchange rate policiesbiased agai ist cxpctables relative to import-computing productionhave also rnded to reduce substantially the relative incentive toproduce export gxls vis-a-vis home goods
Considering only agrict iiral export goods the estimated equashytion is as follows 12
11Ordnary Least Squares was used on annual data for the period 1950-76 Numbersin parentheses are [-values of the coefficient estimates
12 The stimati-n resilts for the disaggregative agricultural export categoriesshown in Appendix Table 2 do not differ markedly as
from the aggregate results The estishymated incidence parameter for imports wto varies from 582 for fruits and vegetablesto 684 for coconut products while that for nonagricultural exports wn ranges from 350for tobacco and products to 436 for fruits and vegetables The domestic price of each ofthe five agricultural export categories is found not to be significantly influenced by itsdomestic price relative to other agricultural export products Finally the coefficient estishyrsaves for the shift vatiat les In Cp and BOT) are in the neighborhood of their respectivevalues in the aggregate regression
101 BAUTISTA TikADE AND EXCHANGE RATE POLICIES
(19) lnPxPh 081 659 P P - 12 atI= + 412 (212) (704) (408)
+ 298 In (1 + 127 BOT (494) (261)
-2 R 986 DW-- 136 Rho = 745
Again thc statistical-gcodness-of-Fit is excellent Other thingsthe same a 1W( rise in the domestic price of importables (eg due to tariffs) is associated with a 66 decline in the domestic price of agricultural export prcduLts relative to home goods the otheron hand a 1T ( incrase in the dlomestic price of nonagricultural export products teg due to subsidies to industrial exports) leads to a 41 fall iiithe relative price of agricultural export goods vis-a-vis home goods
VI Effect on Agricaltural Export Incentives
Based on the estimated values of th incidence parameters the extent to which the observed changes inte effective exchange rates for traditional epo-ts new expots and imports over the three postwar decades fIcom 1950 to 1980 had affected the domestic pricesof agricultural extport products relative to home goods can be quantishyfied using equation (14) above Domcstic production competesclosely bun not exclusively with nonessential consumer goodsimports ie there is some substituIability between other imports and domestic products admittedly of a lower degree Since it has not been possible to disaggregate PM we consider below the effeets on P1 ijI of the observed changes in EERs for both all imports (Case 1) and NEC imports (Case 2)
The calculated changes in the l P imply a time )attern of the
corresponding indices of the price ratios for Cases I and 2 as shown in Figures 4 aTnd 5 respectively They represent hypothetical annual movements of the domestic price of agricultural exports relative to home goods due to postwar trade policy assuming that other factors (eg world prices) i ffecting the pice ratio remain unchanged In each of thet two cases ove observes a general decline over time in relative price incentive for agricultural export production vis4-dvis home goods
100
90
80
o
70 -i ~50shy
50 H 30
20H
10 zgt~
0 1950 1955 1960 1965 1970 1975
FIGURE 4 CALCULATED INDEX OF THE DOMESTIC PRICE OF AGRICULTURAL
EXPORT PRODUCTS RELATIVE TO HOME GOODS (Case i)
1980 -
90
80
70
gt
60
50
tz gt
30
20
gt M
10-shy
1950 1955 1960 196Z5 970 1975
FIGURE 5 CALCULATED INDEX OF THE DOMESTIC PRICE OF AGRICULTURAL
EXPORT PRODUCTS RELATIVE TO HOM-GOODS (Case 2)
1980
104 THE PHILIPPINE ECONOMIC JOURNAL
Estimates of the changes in relative prices of agricultural exportproducts due to he movements in [ER ratios over each of the three postwar decades and over the entire period ae summnarized in Table 3 The first line shows the proportionate chl-anges in the domesshytic price of agricultural export products relative to new (industrial) export ii) i l hased on the oIServed h is in the [R ratios for traditional and litw CNpOrtS Ihi is Ilhlwebie c0orre-poIlding effects on P)a based on the [FR estifoes br all imports (ase I) and r nonessential consutmer good inports ((ase 2) Fhe last two lines in Table 2 give the induceJ changes In Ptj calculated from the indices ie rived earlier icf V igu rtc-s 4 and 5 distinguishing again hctween C(ases I and 2
One striking o)hservalion cOncCrnim the entries in Table 2 is Ihat except oro 1 in I)95 J-o ne tive effects on the relative
olluCstiC prices OfAi cuitural export products are inrdica ted throughshyout Industrial inmport stbstitution based on direct controls in the I th5O is seen to have heu vilV penalized agriclt-ltural exports especiahy in reltion to imlport-conlll)eTlnug and 1ii11e goodS production File policy reforms in- the early I )00s which ds1 antled the system of impo)rt and Iremen chany contr-ols an1d deLviltied the Philippine peso tppalave agrictlturil industrial) fajvorcd over exports however the iinitivt stlcitlur oecarri ov- ore biased toward hnportibles ind home oods Finillv in the cxport promnotiondecade of the IQ-7)s aerictllni a export produtAion was ironically
TABLE 2 EFFECT OF FER CHANGES ON RELATIVE i)OMESTIC PRICES OF
AGRICULTURAL EXPORT PRO)UCTS
Relatve price 1950-59 1 )5Y-(9 19o0- 1950-80
(percent) PaxPnx --26 75 --113 --72 Pax Iin
Case 1 -356 --6 -66 -438 Case 2 -595 172 -- 147 -714
PaxhCase 1 --254 --65 --32 -325 Case 2 -435 -76 --140 --551
Note Case I is bawd on the effect on Pm due to changes in LEEKfor all imports Case 2 is based on the effect or P due to changes in IER for NEC imports
BAItTISTA TRADE AND EXCHANGE RATE POLICIES 105
not given any encouragenient tle iIduced changes in relative domesshytic prices duc to trde and exchainge rite policies heing seen in Table 2 to have ftvored industrial exports import-corn peting products and hole gOo(k
The last colunn (I Tahle 3 shows the overall deterioration inrelativ-e incentl 11iveC t aricultural cxport iFduCiV)Ji du Le t he
forciwn tiadc ICljmic o er the threc postwar dcidc Based )n (asc 2 the inducd decline in the domestic price ()I agrictltural exporl products is scN b ielaI1T I0 im)port-comlpetingMt ll)lC than( products andi albt 5) ieatie to hone eoods O1 the other hand the incentive bias towldll nv industrial) exp)orts dLC to trade policy incfeascd bo oIl et A eu )() And ]I )
lox sin tihese policV-iilttuced in1CS trus clifiies price ilncelivec n i t lt the auhld lnlVCel tClltin elativC priCeS Of
I K in pISagricullltural xpit i vil I lsti 1aC vailableoly throne] I~Th i nt td in lK App eu ndi]egtI ofthreIlle-yearClti
MOVil it ae ( h 1M 1ti 1 ) reLclculC ltcd aind plotted inli Mii Ftiguregt 0 t IttiSlltfe c-espoiin ine of the lyposhytl lical price rtogt1i r c in 1il Ill lti t ilcentives due to til I (flol ll Ion l l l
() l i0 liit t I l ii p ices of agrishycUlt iii] c n i tl I i j i ac i tli xc r This is
liyciilii int a I gt ictl r I hll ic ilL h im plies that ticr u t~lii a I1 I u t ci lll l tpriC lllll have
lbct i hehx (t i i~l li 111 11tl thc I [10It gtatulple
iulclt v i t (il -K iit l i iI t ii hil) il- slishoNing slartK I i i clli id i three i) ic o t R Ie twial relative
price I i tlt HI1Pi I Pts i u kl rlaC d to the rapid eP(tiM1l illl lii teLluiNU I] st1 rts1 dtlIliut [ I)7()s as 1101C1 Ill t I pueC C illI cht I Kic uc tolC ill 1p1c()f tl Ui1shytav ri - c fuIig Ic Iihlb cill Ilt ili ll t
The traph I FiuriL- t hru _h S Am) suggest that the incentive bias apairist agricu]ltiral exports producetion had not heen insubstanshytial relative to the aCtUal L1OmCstic price chalngCs Tie ratio of the vertical distance between the horiontat line at 1(t) nd the B-curve to the vertical dlistance betwVeen the A- an( 1-curves indicates the cumulative signi fica nce of trade polic relative to the other sources o1 the observedi inovenients in tih domestic prices of agricultural exports The calculated valhCu for 1()5 19o(1 and 1975 are shown in Tabe 3 One finds that even ater the 1972-74 commodity boom the contribution of trade policy to the actual changes in the domestic
2 10
200 oN
190
180
170shy
oo=
0
160-
5150-shy-r
140
I130-i
1201
4 Actual Price Ratio
z
IT
0
90- Trade Policy- induced Price Ratio
80 - -
525 5 5 M5 56 57 58 59 60 61 62 63 64 65 66 617 63 69 70 71 72 73 74 75
FIURtbTIME PROFILES OF ACTUAI AND TRADE tOLICY-INDUcrD PRICE RATIOBETWEEN AGRCULTURAL AND INDUSTRIAL EXPORTS
80
170]
160 to
50
140shy
a
130 H
120 -M
II0 A Actual Prie Ratio z
100shy gt
0 -z
80-4
70
B Trade Policy- Induced Price Ratio t
V
60 --shy
51
Tr
5253
54
5
5 56 5758
58
59
6
6061
62 63
64 65
66 67
68 69 70 71 72
7374
75
FIGURE 7 TIME PROFILFS OF ACTUAL ND I RADF POLICY-INDUCED PRICE RATIO
BETWEEN AGRICULTURAL EXPORTS AND IMPORT-COMPETING PRODUCTS
2701 260j
250shy0
240 230
220 210 -
11shy
200shy190 -
8o -70shy
160-A7 Actual Prce Ratio -
z 150shy140
130
120
0 z0O
100 1_
90-
100 _ _ _ _
B
_ _ __
Trade Policy-
_ _ _ _ _
Induced Price Ratio
_ _
gt
51 52 53 54 55 56 57 58 59 60 61 62 e3 64 65 66 67 68 69 70 71 72 73 74 75
FI(URLTIME PROFILES OF ACTUAL AND TRADE POLICY-INDUCED PRICE RATIO
BETWEEN AGRICULTURAL EXPORTS AND HOME GOODS
BAUTISTA TRADE AND EXCHANGE RATE POLICIES 109
TABLE 3 ESTIMATES OF THE CUMULATIVE SIGNIFICANCE OF TRADE POLICY
RELATIVE TO OTHER INFLUENCES ON THE DOMESTIC PRICE OF AGRICULTURAL EXPORTS VIS-A-VIS OTHER PRODUCT CATEGORIES
1950 1951 969 1975
Industrial expoits (1)ax 1nx )
0 106 022 044
Import-competing goods (1)xPn )
0 804 428 396
Home goods 0 360 253 162 (1ax
prices of agricultural export products remained relatively significant at least with respect to import-competing produc4s and home goods
VII Some Further ( onsiderations and (oslusion
A porn tCd out earlier ie 1P ineasure unlerst aiS the trade regimes degree of bias toward import-competing pioducts in the 19 50s to the extent (htl domestic prices of imported goods incuded a scarcity preininn due to the existence of quantitative restrictions on imlorts and foreign exchangze at the time Indeed direct compashyrison of whodesalc prices of comparble items in the Philippines and the Inited States (adjusti l or transport cost) has shown that in 195) implicit protcztive rates of 400 percent were not uncommon for nonessential consumer ioods whereas the average explicit degshyree oi protection (providco b) exchange rate and tax policies) in 1959 for this Category was around 150 percent (Baldwin 1975 p01) [his iirIics that a substantial amount of windfall gains was eing received by importers of nonessential consumer goods which
provided a further impetus at the time to the domestic productionof import substitutes and resource allocation away from exportindustries
Another aspect of relative incentives due to trade and exchangerate policies not taken into account by the EER measure relates tothe domestic pricing of intermediate inputs Most industrial rawmaterials and other producer goods were allowed to be importedliberally during the period of controls in the 1950s likewise in the
110 THE PIHLIPPINE ECONOMIC JOURNAL
I 9 60s and I 9 7 0s they were subject to much Vlwei tariff rates cornshypared to finished consumer goods Also government policies tend(ed) to raise moderately domestic above horder prices of agrishycultural inputs (David 1983 p 2Q) Using the c-ffec tive protection nite (lIT) measaure vhih repretsnt the matu of protection of doniestic value alcdd one includc bothi it subsidy it)domestic prd-otlr ron the potectlii output MId th pcInlNty from tile protectionl ot inputs
study of tffclive protection in the PhitippinTes based on tariffs and indirect taxes In the mid-1970s shows the weighted average IR to forthe Prinar cctors (agriUultuore and mining) to be only Lj conparcd to d14 for manutaturiac and that for export itjuistries t to be 4 rsu IP for nonexporting iniust ries lxport p1roductiol 111lIcrcutltire as thercreforc being douly penalshy
litricitire t
CtXot pr nt i cULgIii I i lI tT t1 iil by +hie ette eprotr1ori individual agricultira
pineapple11 1or to I o I cror
Sinlladv li - lt of Rsfor the variouSill1i11 I ru- - t ll cxchnigc c(trot LatephliS Jikt-id it I clf tinlig Strong ia tilein foreign iradc ftgillc Lgaiilt 1[iilhm 1u port l thethroughout period 1()4(-71 l1his cvemi alter tic littil )I nport and foreignexchlnge cotils in the ate P)50sI the ujiiiaorblc exchlange rate
exprtrItr s ogeth vrwith tlhe oro)i ctiOtl 1CipO-1ed inpLtsOti the the us us uted the lT R for traditiornal exports to be significantly iegtivc in 1)0I )Moreove the discrepancies ill ettectlive protective rates reialn( cdl) Ucrarco even after liledecontrol efltort and throtlllshyout the rest of the 170s (1 1975 p 106-)i )h0s md early Bldwin
fihe to(regoing discussion serves to ititclrcc tilte thufindings oi reVSent studV indicat ng that postwa Irati mid exchange rate polishyties discrini nated persistently a2iinist agricotural export production Indeed it is remarkah ltint e-el ii li 970s when an outwardshylooking developiini striugy was being promoted by tie government the bias inithe toreign trade regime against agricultural exports conshytinued In the case of industrial exports the existing biases of the tariff str tCtu re aid indirect taxes were being offset at least in1pact by fiscal and financial incentives provided to registered enterprises under tile -xport Priorities Act of- 1970 iswell as by tihe development
13 lellned tohe tlosL exporting more than I0- Ofllo du~tion 14 Av eO revealing illustration in the nput side isprovided hs the governmentshy
enforced to-tiered in 1973-75 was beingpricing of tertilizer during hich tite fertiliter sold to food crop producers at prices 50 to 70 less than prices paid by export crop proshyducers (see David and Wklisacan 1981 )
BAUTISTA TRADE AND EXCHANGE RATE POLICIES llI
ofexport infrastructure specifically directed to labor-intensive manushyfactured products Both inldustrial and agricultural exports grewfaster in the I70s than in Ihe previous two decades in Ilh case of agricultural exports tie comparative average annual growth rates were 15 and 38 in real terms however such imi provctne lt in export performance canI1o he attributed to the trade antid excha ngerAte policiCs adoptd which as made clear in the alhove discussion bcaeC ete n1101t biased against agricultural xport production during the 1)7(ilt
I tailine to provide oir a niore neutral incentive strucLure that corlli haVC eicOu_( rcd a more effiit allocation of scarce resources and greater Nariultral cxports Philippine trade and exchange rate policies ilrougliont ll()i[ of Ihe poslwar period preumlllably Contrishybhlted to a rela Reiiv iii nor economllic pertorrmance in ter-ms of real ric eo tlh and he ha Ltlice of payt llellts It Call also he Colshyt
cIhldl thalt All ill)prI)OvnitilI ill the forcien tiade regime ie correctshyin the imcentive bias against agriculturaI export pro duction represhy
ti otentially significant sourc 0i fltnre growth in agriculshytural inci aid ftoreign XJhzltangc ernings Institutional changes new iechnolic intraiructrr developnt and otler productivityshyraising public nksiles as well as access to foreign marklts may be neceCCsa1ir to boi sienifcailyM the lIreI1 ex potll pl olilarice of Ph iliprinc atgriculnnltle I(I wever Iheyiare likely to prove inmade-Luatle it relative incentive continute to b hea2vily biased against agriclltural cxport producLion
APPENDIX
I)erivation of Domestic Price Indices
The Central Bank begin coillecting wholesale prices of domestic and importshyed products is well as of commodities for the home market and for export in Metropolitan Manila in )949 and published them annually in the Statistical Bulletin in index torm with IQ5 base Yeai until 197o (In 1977 the base period was shiifted to IQ aconpanied by a change in commodity classificashytion) T c weights Of cumlnodiyv gioups for each index are givc-n in Appendix Table I
Locall producLd comrmodities for home consumption do not of course totally constiiute tire home goods or nontradables sector The two important omiisions are housing and services price ata on which are available only as components of the Central Banks Consumer Price Index To represent the domestic price of home goods (P) in the present study a weighted average of
APPENDIX TABLEWEIGHTS OF COMMODiIry ROUPS IN TliF (ENTRAL BAINK WHOLESALE
PRICE INDICES EROPOLIT-NI[OIZ MFi MANILA
WI)iCommodity group I ~JWII of locallyshyczpnr ruides zmported produced comnodities
c711ditteS for home consumption
Xh (PM hI
Food 134Beverages and tobacco
258 458
022 003 88Crude materials 570 050 047 0ML-ieral fuels 007 109 079Animal vegetable oils 089 006 018Chemicals 003 103 051 0Manufactured goods 048 211Machinery transport equipment 152
- 356 049 ZMiscellaneous manufactures 003 028 059 Total 1000 1000 1000
Source StatisticalBulletinXXVIII (December 1976) Central Bank of the Philippines
-2
APPENDIX TABLF 2REGRESSION RESULTS FOR INDIVIDUAL AGRI(UILTUPAL EXPORT CATEGCRIES
~Zr 1rI14 Ph IrP5xTX
Constant 074 07 0 3 081(174) (171 I 3
084 7 (274) -
In Pixm 684 682 582 669 656 gt(630) (662) (424) (689) (73)
in PixPioax - 075 -030 - 078 - 046 -097 z(-87) (-77) (--135) (-64) (-185
In Pix]Pnx 415 416 436 rshy
412 350(393) (340) (410) (399) (366)In (p 286 282 301 302 305 Z
(427) (423) (494) (482) (616) MBOT 135 123 127 126
(259) (267) (250) (255) (281)987 Qc90 978 984 981
DW 136 142 138 131 165 Rho 749 743 744 747
Note The subscripts ix ioax and nx refer to agricultural export categorytively Agricultural exports categories
i other agricultural exports and nonagricultural exports respecshyi =1 for coconut products 2 for sugar and sugar products 3 for fruits and vegetables 4 for abaca andproducts and 5 for tobacco and products
(LJ
692
114 THE PHILIPPINE ECONOMIC JOURNAL
the WPI for locally-produced commodities for home cunsunuption (PI 1)anc the two CPI components (ph2 for housing and P 3 for services) are calcul -I as follows
(AI) Ph = 350() h I + 104 P2 + 537 Ph3
The weights are based on the value adde es computed from the aggregated 12-sector hnput-Output Iransactions Taole for m(5 published in the Philippin Statistical Yearbook 19 75
Wholesale prices of mjor eport plOdUctS (published in tiheStatistical Bulletin) are used ttirepiesent each of the tike agricultural export categoies (Pix ) as folowsv
I (Co prodiltslnut cop[raics-ecada
2 ugar and pioducts cenitifugal stiiir Iruits and vegetabh s -caHLI)iCd pineIpple
4 Abaca and productu Utrriantiactured abaca 5 Tobacco and prodiicis leaf tobacco The aggregate doiniesti f zprice index gricuhi ra export products (P~) is
calcJated as the weighteld aoerie (based ot I(15 eport value shares) of the wholCsale price rirdice Ot t11 priidiwi catcigories 1-5 above The domestic price index for tronagricuhiral export piiihicts ( ) can then he coruptited from the fllowlorig
(A2) SaX ax - - = PV(i ))t
where Sa (=601) is the export value share of agricultural products (categories 1-5 above) in 1965
=Finally for each agricultural export category i (i 1 5) a price index (Uoa) is computd for all oher agricultural export categories as the weighted average of lie wholesale price indices of all agricultvral export categories other than i
REFERENCES
Baldwin Robert E Foreign 7ade Regimes and Economic Development The PhilippinesNew York National Bur-au of Economic Research 1975
Bautista Romeo M Structural Change in the Philippines Chap 6 in Ecoshynomic Interaction in the Pacific Basin edited by Laurence B Krause and Sueo Sekiguchi Washington DC The Brookings Institution 1980
__ Trade Liberalization in the Philippines Paper prepared for the Trade Policy Research Centre (London) International Food Policy Reshysearch Institute January 1985
115 BAUTISTA TMADE AND EXCHANGE RATE POLICIES
David Cristina Economic Policies and Philippine Agriculture Working Paper 83-02 Philippine Institute for Development Studies 1983
- and Arsenio M Balisacan An Analysis of Fertilizer Policies in tile Philippines Journalof PhilippineDeveloment VIII (1981) 21-37
Dornbusch Rudiger Tariffs and Nontraded Goods Journalof international Economics 4 (1972) 177-85
Garcia Jorge G The Effects of Lxchange Rates and C rercialPolic) on Agriculturul Incentives in Colombia 1953-1978 Research Report 24 International Food Policy Research Institute Washington DC 1981
Little Ian Tibor Scitovsky and Maurice Scoit Industry and Thade in Some
Developitg Countries New York Oxford Unive-sity Press 1) 70
Senga Kunio Industrial Policies and Incentive Structuores in the Philippines 1949-1980- Universit of the Philippires School of Economics June 1983 Mimeographed
Sjaastad Larry A Commercial Policy True Tariffs and Relative Prices Chap 3 in Current Issues in Gommercialtolic and Dipiomacv edited by
John Black and Brian Hindley pp 2651 New York St Martins Press 1980
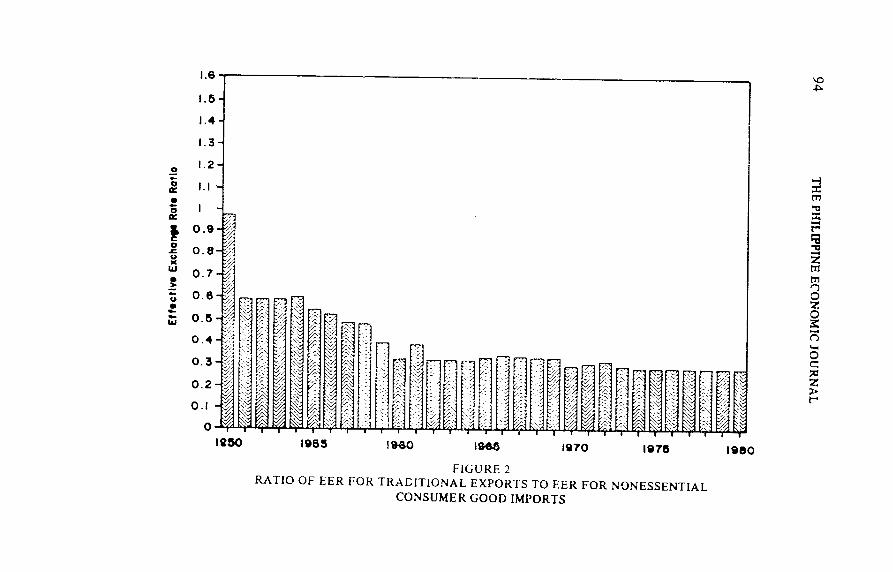
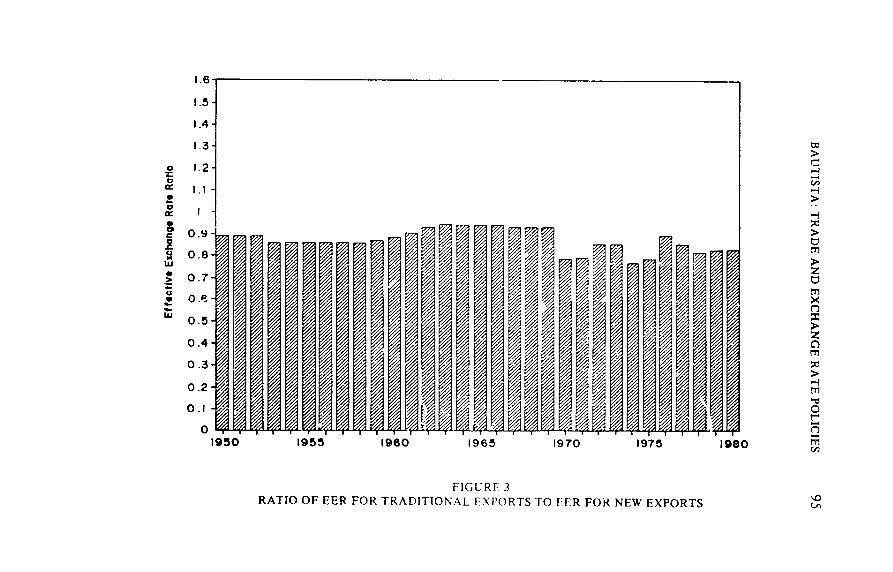
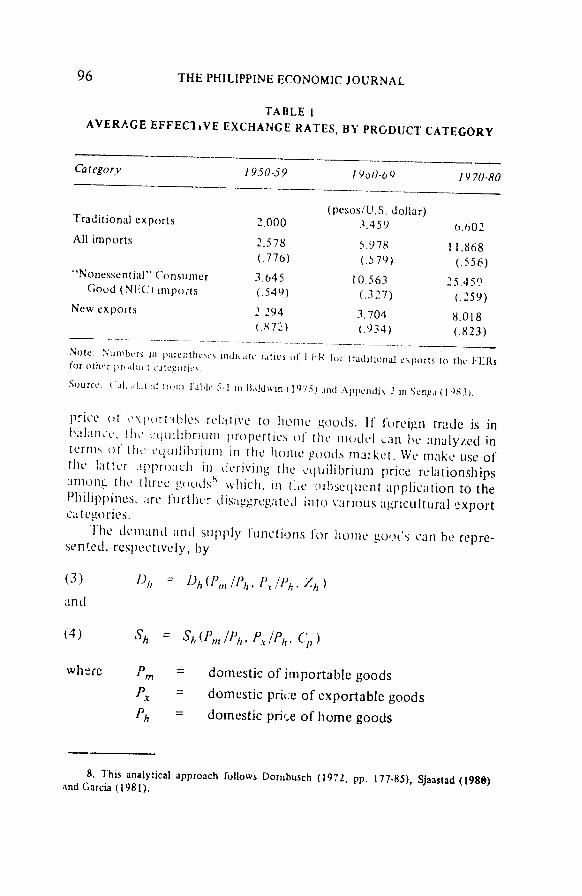
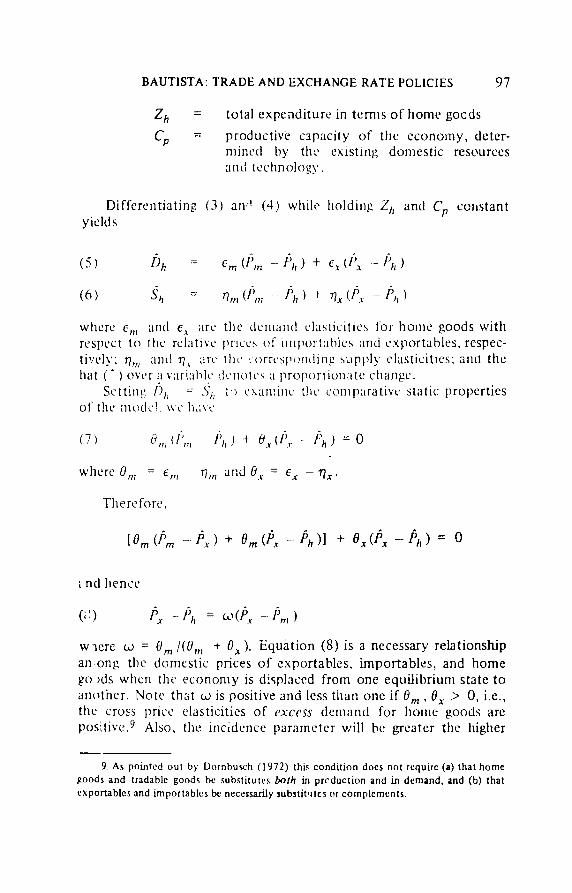
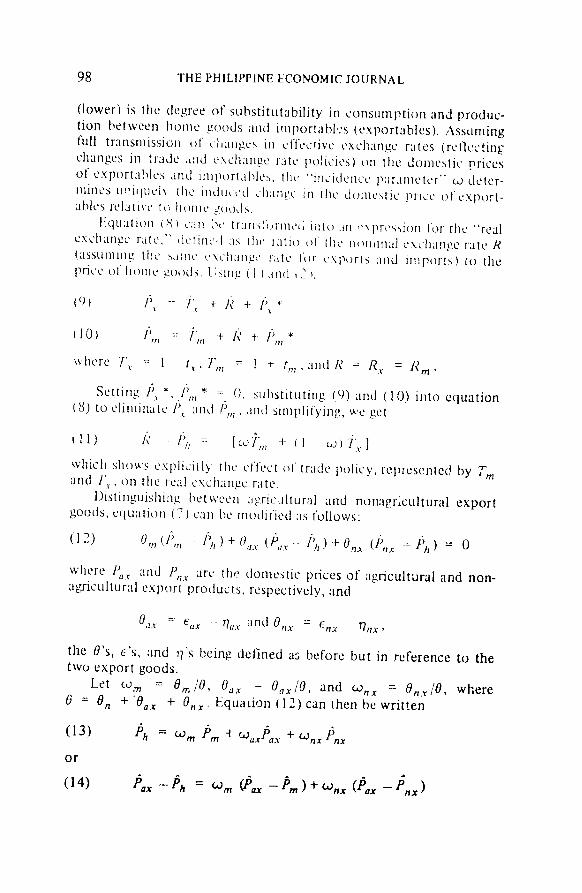
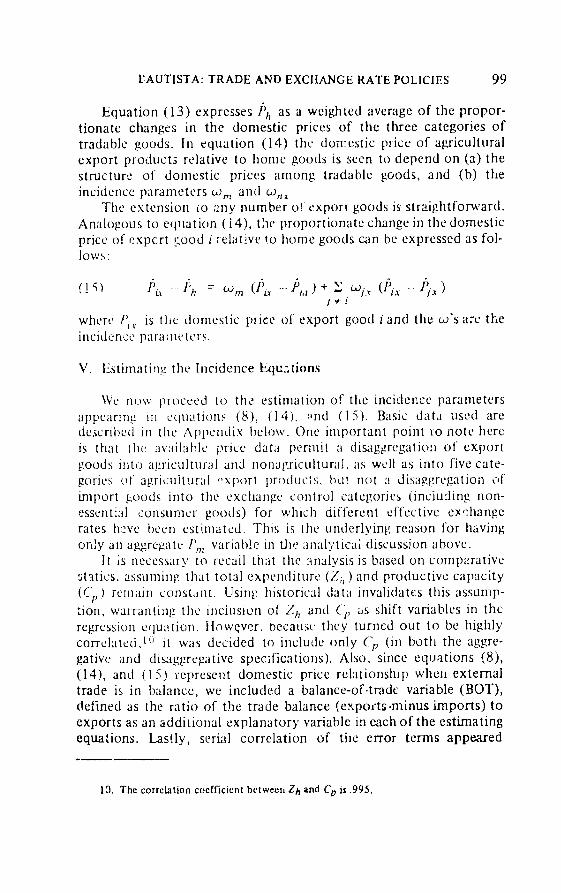
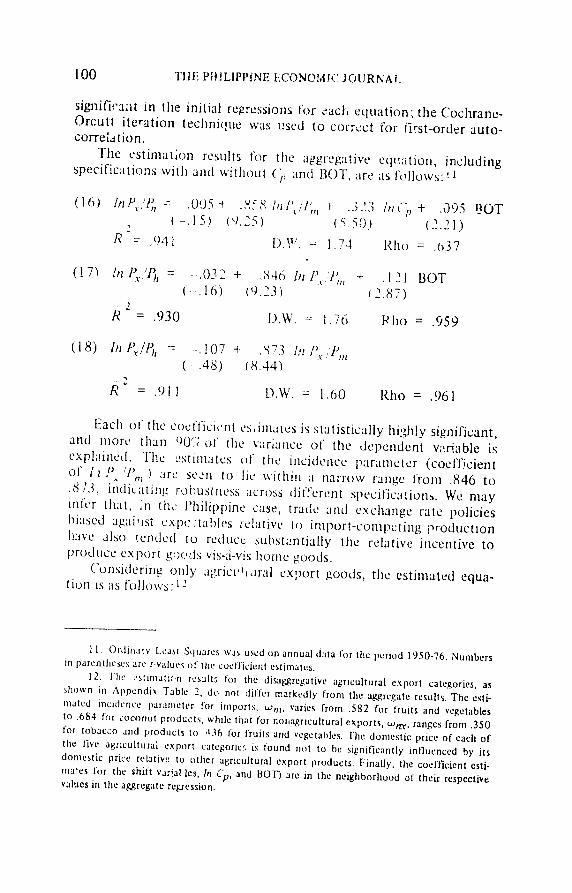
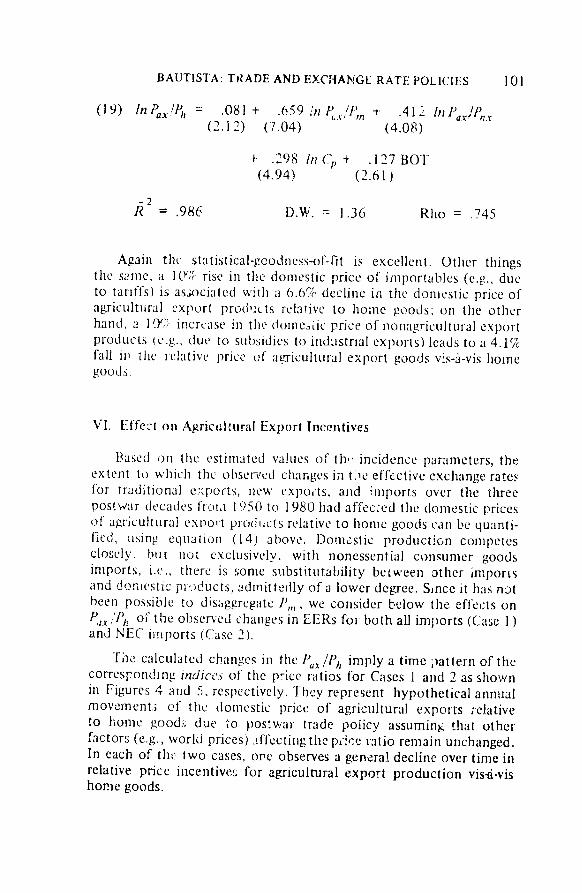
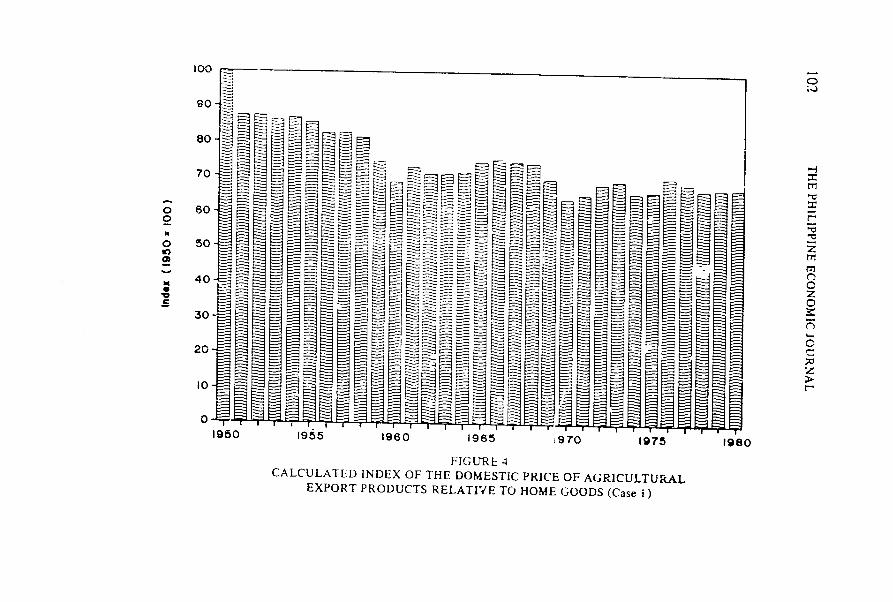
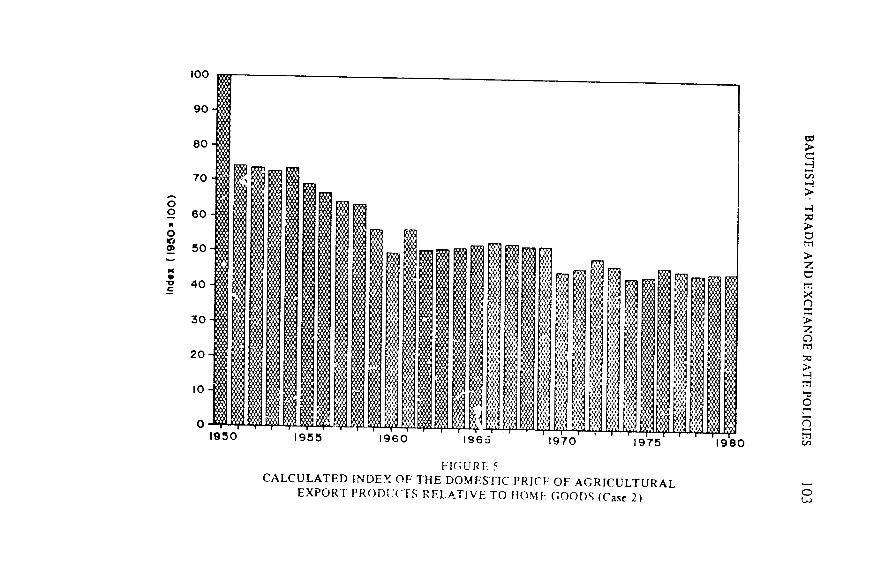
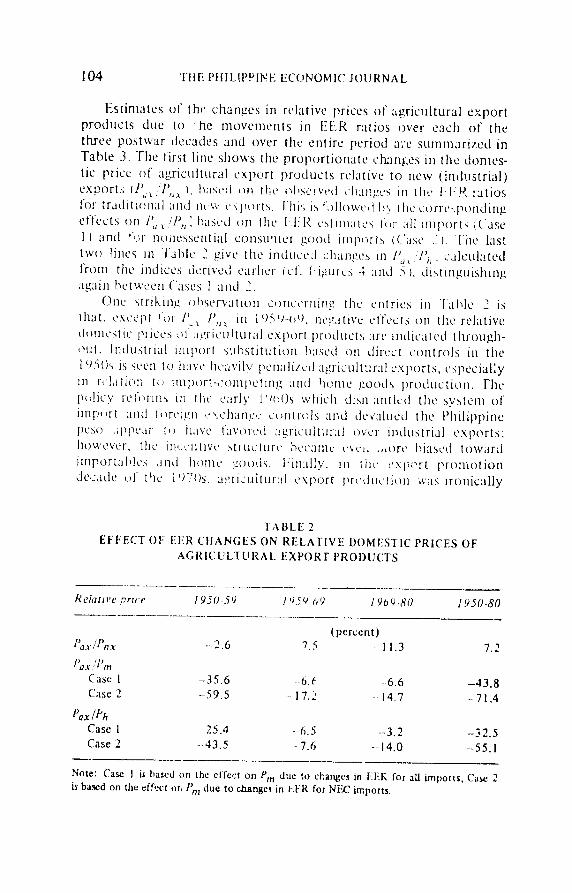
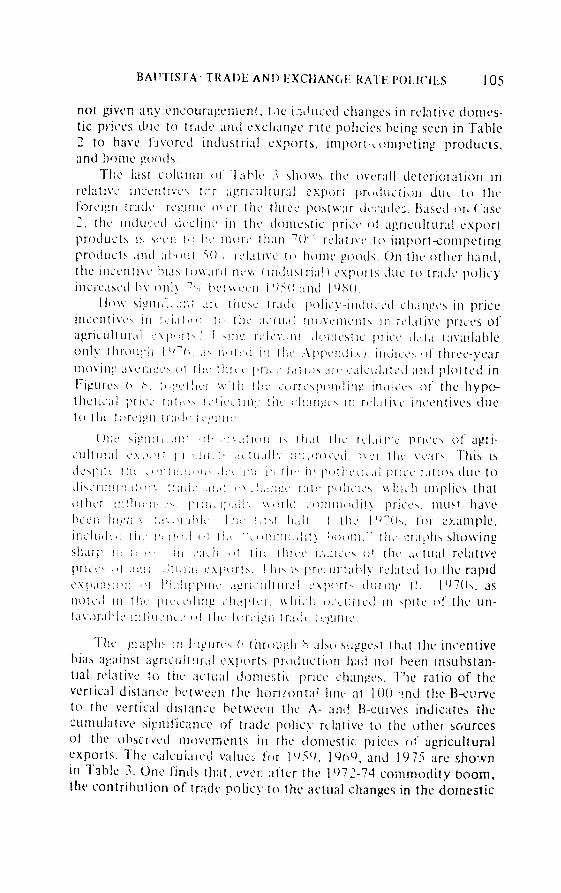
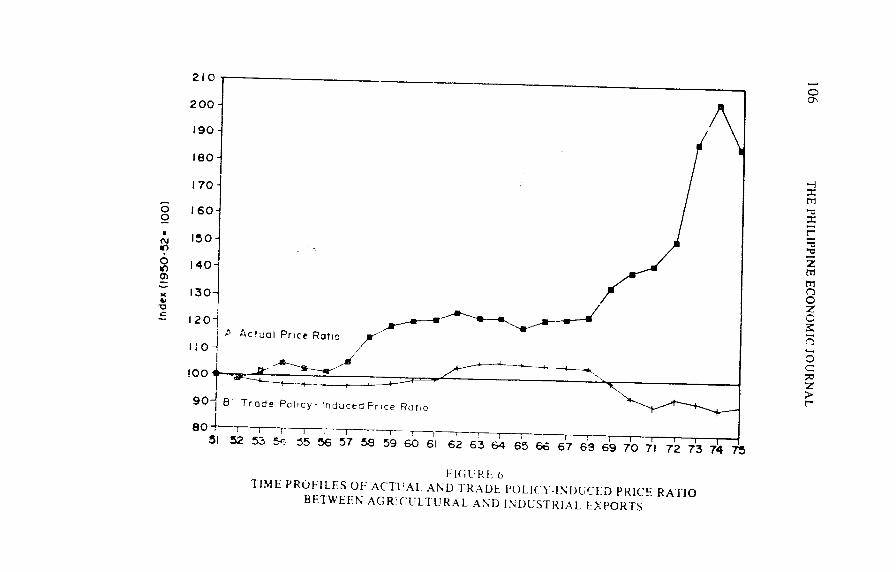
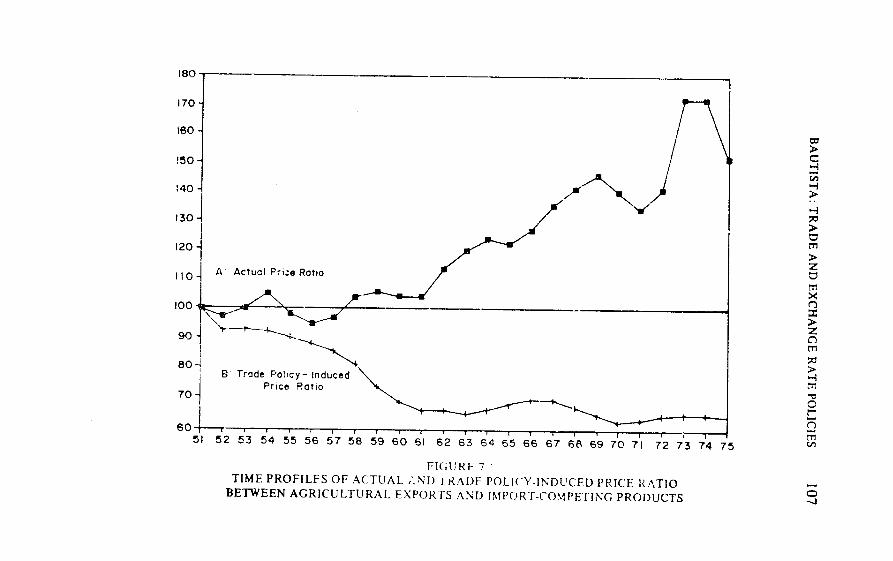
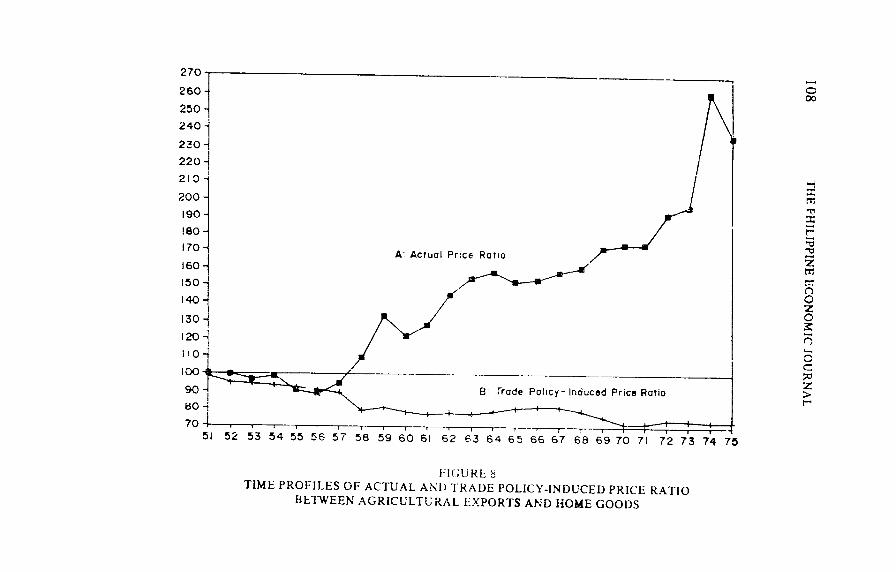
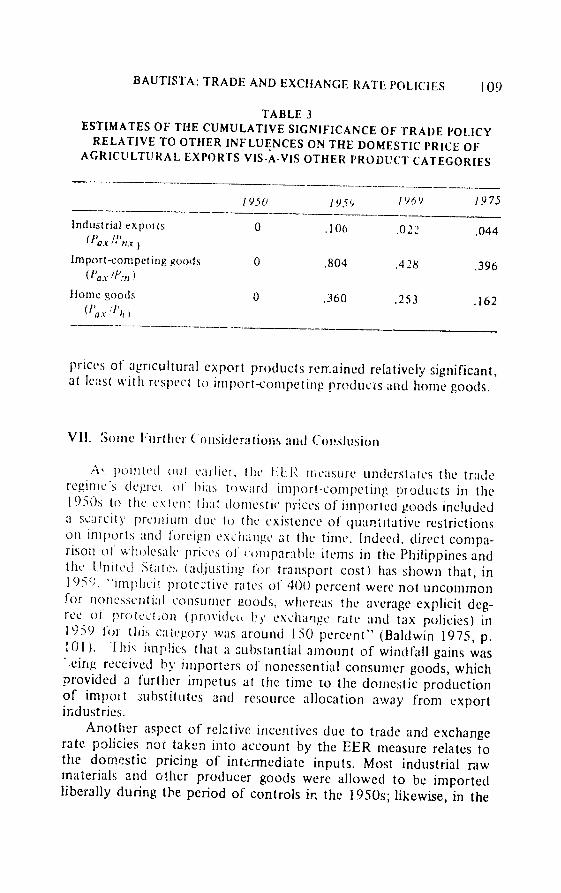
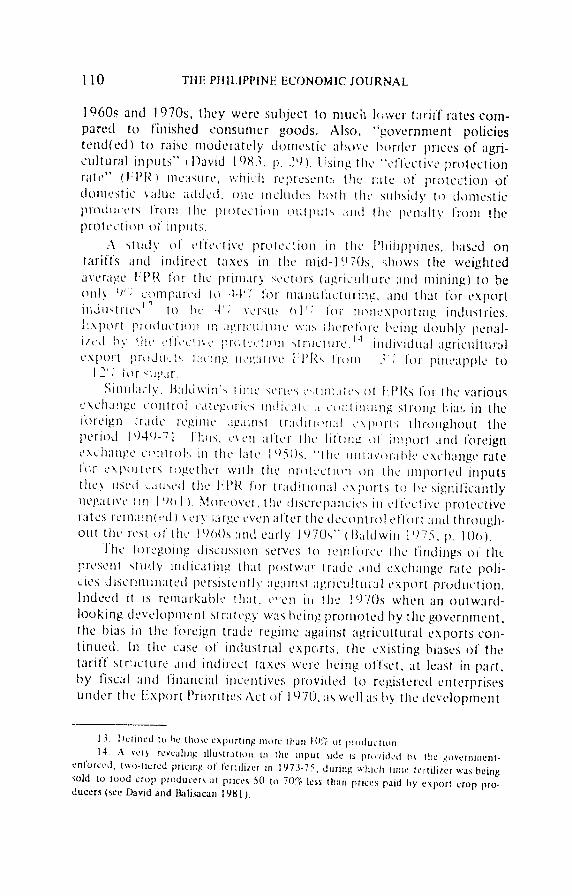
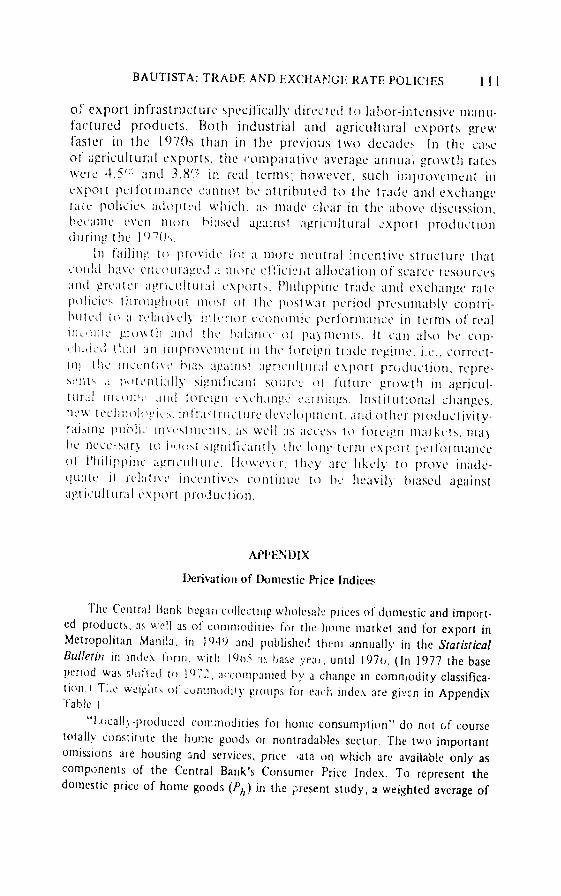
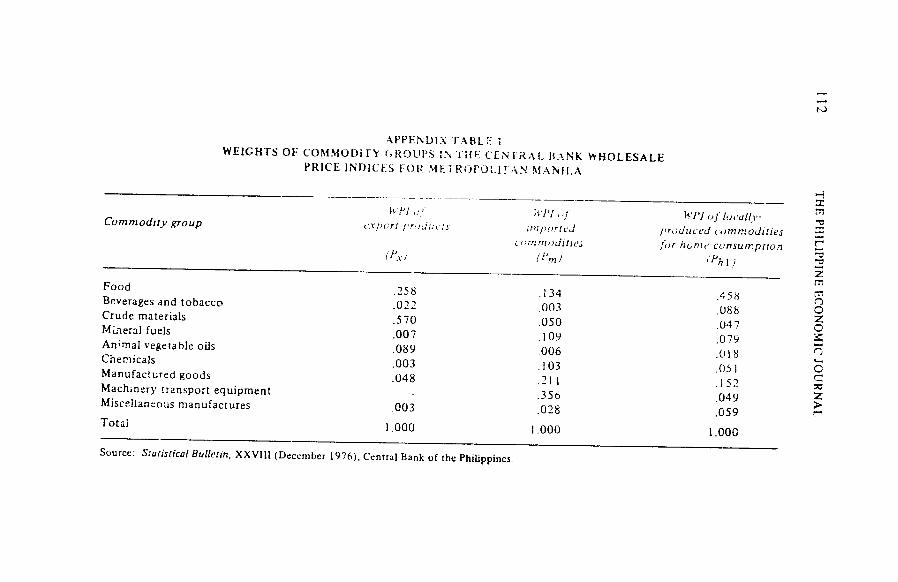
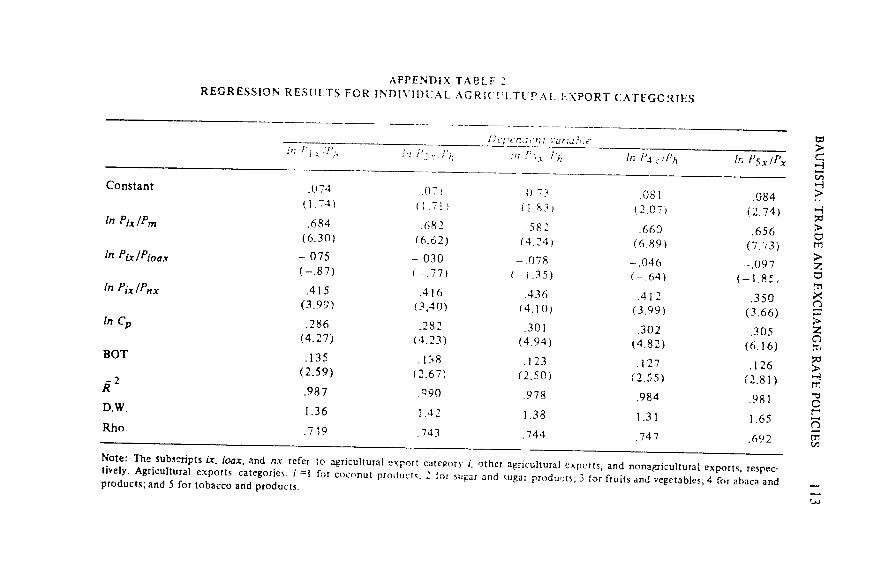