Embed Size (px)
Citation preview
EFFECTS OF TITANIUM DIOXIDE ON PROPERTIES OF POLYVINYL ALCOHOL
WITH AND WITHOUT SURFACTANT
By
Miss Niramon Sanguanwong
A Thesis Submitted in Partial Fulfillment of the Requirements for the Degree
Master of Engineering Program in Chemical Engineering
Department of Chemical Engineering
Graduate School, Silpakorn University
Academic Year 2012
Copyright of Graduate School, Silpakorn University
สำนกหอ
สมดกลาง
ผลของไทเทเนยมไดออกไซดทมตอสมบตของพอลไวนลแอลกอฮอลทมและไมมสารลดแรงตงผว
โดย
นางสาวนรมล สงวนวงศ
วทยานพนธนเปนสวนหนงของการศกษาตามหลกสตรปรญญาวศวกรรมศาสตรมหาบณฑต
สาขาวชาวศวกรรมเคม
ภาควชาวศวกรรมเคม
บณฑตวทยาลย มหาวทยาลยศลปากร
ปการศกษา 2555
ลขสทธของบณฑตวทยาลย มหาวทยาลยศลปากร
สำนกหอ
สมดกลาง
The Graduate School, Silpakorn University has approved and accredited the Thesis title of “effects of titanium dioxide on properties of polyvinyl alcohol with and without surfactant” submitted by Miss Niramon Sanguanwong as a partial fulfillment of the requirements for the degree of Master of Engineering in Chemical Engineering
....……........................................................................ (Assistant Professor Panjai Tantatsanawong, Ph.D.) Dean of Graduate School
........../..................../..........
The Thesis Advisor Assistant Professor Sirirat Wacharawichanant, D.Eng. The Thesis Examination Committee .................................................... Chairman (Tarawipa Puangpetch, Ph.D.) ............/......................../.............. .................................................... Member (Associate Professor ML. Supakanok Thongyai, Ph.D.) ............/......................../.............. .................................................... Member (Supakij Suttiruengwong, Dr.Ing.) ............/......................../.............. .................................................... Member (Assistant Professor Sirirat Wacharawichanant, D.Eng.) ............/......................../............
สำนกหอ
สมดกลาง
d
52404214 : MAJOR : CHEMICAL ENGINEERING KEY WORDS : TITANIUM DIOXIDE/ NANOCOMPOSITES/ ANIONIC
SURFACTANT/ POLYVINYL ALCOHOL/ SODIUM DODECYL SULFATE/ SODIUM DODECYL BENZENESULFONATE
NIRAMON SANGUANWONG : EFFECTS OF TITANIUM DIOXIDE ON PROPERTIES OF POLYVINYL ALCOHOL WITH AND WITHOUT SURFACTANT. THESIS ADVISOR : ASST. PROF. SIRIRAT WACHARAWICHANANT, D.Eng. 80 pp.
This research studied the morphological, mechanical and thermal properties of polyvinyl alcohol (PVA) and titanium dioxide (TiO2) nanocomposites. The nanocomposites were prepared by colloidal aqueous suspension of TiO2 prepared via solution casting method. Sodium dodecyl sulfate (SDS) and sodium dodecyl benzenesulfonate (SDBS) were used as surfactants to obtain a good dispersion of TiO2 nanoparticles in PVA matrix. The properties of PVA/TiO2 nanocomposites were studied the mechanical properties by a universal tensile testing and dynamic mechanical analysis (DMA). The thermal properties were investigated by differential scanning calorimeter (DSC) and thermogravimetric analysis (TGA). The dispersion of TiO2 particles in PVA matrix was observed by scanning electron microscopy (SEM) and UV–Vis spectroscopy was employed to evaluate the absorbance/transmittance behavior of the PVA/TiO2 nanocomposite films. SEM results indicated that the dispersion of TiO2 nanoparticles was a better distribution when added the surfactant but still appeared aggregates in PVA matrix at high TiO2 content. The aggregation of TiO2 nanoparticles increased with increasing of TiO2 content. Tensile testing results showed that the tensile strength of PVA/TiO2 nanocomposites increased with increasing TiO2 content and reached a maximum point at 0.4 wt%. Storage modulus from DMA result increased with increasing TiO2 content like the tensile test. The nanocomposites prepared with SDS surfactant had mechanical properties higher than the nanocomposites prepared without surfactant and with SDBS. It was observed that the thermal degradation of pure PVA proceeded by three degradation steps from TGA result. Additionally, the incorporation of TiO2 and both of surfactant did not affect the melting temperature of the PVA/TiO2 nanocomposites and the percent absorbance increased in the presence of surfactant.
Department of Chemical Engineering Graduate School, Silpakorn University Student's signature ........................................ Academic Year 2012 Thesis Advisor's signature ........................................
สำนกหอ
สมดกลาง
e
52404214 : สาขาวชาวศวกรรมเคม
คาสาคญ : ไททาเนยม ไดออกไซด / นาโนคอมโพสต/ สารลดแรงตงผวประจลบ/ พอลไวนลแอลกอฮอล/ โซเดยมโดเดควซลเฟต/ โซเดยมโดเดควเบนซนซลโฟเนต นรมล สงวนวงศ : ผลของไทเทเนยมไดออกไซดทมตอสมบตของพอลไวนล
แอลกอฮอลทมและไมมสารลดแรงตงผว. อาจารยทปรกษาวทยานพนธ : ผศ.ดร.ศรรตน วชรวชานนท. 80 หนา. งานวจยนเปนการศกษา ลกษณะทางสณฐานวทยา สมบต ทางกล และสมบตทางความรอนของโพลไวนลแอลกอฮอลและไทเทเนยมไดออกไซดนาโนคอมโพสตซงเตรยมโดยวธการหลอขนรปของสารละลายแขวนลอยไททาเนยมไดออกไซด โซเดยมโดเดควซลเฟตและโซเดยมโดเดควเบนซนซลโฟเนตถกใชเปนสารลดแรงตงผวเพอชวยใหไดมาซงการกระจายตวทดของอนภาคไททาเนยมไดออกไซดในเนอพอลเมอร สมบตทางกลศกษาโดยการทดสอบแรงดงและการวเคราะหเครองกลแบบไดนามก สมบตทางความรอนศกษาโดยเทคนคสแกนวดความรอนและเทคนควเคราะหการตกตะกอ นทางความรอน การกระจายตวของอนภาคไททาเนยมไดออกไซดศกษาโดยกลองจลทรรศนอเลกตรอนแบบสองกราด และ เครองวดการดดกลนแสง ถกใชในการประเมนคาพฤตกรรมการดดกลน /การสองผานของแสง พบวาการกระจายตวของอนภาคดขนเมอเตมสารลดแรงตงผวลงไป แตยงคงปรากฏการ เกาะกลมกนภายในเนอพอลเมอรและการเกาะกนของอนภาคเพมขนเมอเพมปรมาณของอนภาค ผลการทดสอบแรงดงแสดงใหเหนวาการทนตอแรงดงของนาโนคอมโพสตเพมขนเมอเพมปรมาณไททาเนยมไดออกไซดและเพมขนสงสดท 0.4 เปอรเซนตของนาหนก คาโมดลสสะสมเพมขนเมอเพมปรมาณไททาเนยมไดออกไซดเชนเดยวกบผลการทดสอบแรงดง วสดนาโนคอมโพสตทเตรยมโดยใชสารลดแรงตงผวโซเดยมโดเดควซลเฟตใหสมบตทางกลทสงกวาทเตรยมโดยไมมสารลดแรงตงผวและทมสารลดแรงตงผวโซเดยมโดเดควเบนซนซลโฟเนต พบวาการยอยสลาย ทางความรอนของพอลไวนลแอลกอฮอลบรสทธจากการวเคราะหดวยเทคนคการตกตะกอนทางความรอนมสามขนตอน นอกจากนการรวมตวกนของไททาเนยมไดออกไซดและสารลดแรงตงผวทงสองไมมผลตอการเปลยนอณหภมหลอมเหลวของพอลเมอรนาโนคอมโพสต และเปอรเซนตการดดกลนแสงสงขนในระบบทมสารลดแรงตงผว
ภาควชาวศวกรรมเคม บณฑตวทยาลย มหาวทยาลยศลปากร ลายมอชอนกศกษา........................................ ปการศกษา 2555 ลายมอชออาจารยทปรกษาวทยานพนธ............................................
สำนกหอ
สมดกลาง
f
ACKNOWLEDGEMENTS
Many people who have been enormously helpful in the master course. The author would like to sincerely express gratitude to Professor Dr. Sirirat Wacharawichanant, her advisor, for her invaluable suggestions, highly constructive comments, immense support, encouragement, useful discussions throughout this research and devotion to revise this thesis otherwise it cannot be completed in a short time.
In addition, the author would like to gratefully acknowledge thesis to Dr. Tarawipa Puangpetch, as the chairman of the committee, Associate Professor Dr. ML. Supakanok Thongyai and Dr. Supakij Suttiruengwong, as the members of the thesis committee, for their kind evaluation of work and valuable suggestions that could be beneficially used to improve working behavior.
In particular, may thanks for encouragement and taking care to Miss Jittima Tassanakulpan, my best friend for her facilitate and comforted. Special thanks for kind suggestions and useful help to Miss Pannida Kijkobchai, Miss Janyaporn Boromthongchoom, Miss Nipawan Yasamlee and Miss Arpaporn Somsuk, the members of Polymer Innovation Laboratory for their assistances; we share our thoughts, ideas and suggestions together. They provide me many good experiences and good friends. It is a memorable period of time in my life. Many other not especially name who have provided me with information, support and encouragement, please be assured that I think of you. My thanks also go to the Department of Chemical Engineering, Faculty of Engineering and Industrial Technology, Silpakorn University, for the creative and challenging atmosphere.
The author would like to thank the Center of Excellence on Catalysis and Catalytic Reaction Engineering, Department of Chemical Engineering, Faculty of Engineering, Chulalongkorn University for dynamic mechanical analysis (DMA), Differential scanning calorimeter (DSC), Ultraviolet–visible spectroscopy (UV-Vis) and thermogravimetric analysis (TGA).
Most importantly, the author would like to express highest gratitude to her parents and family, who always supported. Not only financially but also pay attention to through these years for their love, care and other their wills. The most success of graduation is devoted to my parents and family.
สำนกหอ
สมดกลาง
g
CONTENTS Page
English Abstract………………………………………………………………....... d Thai Abstract…………………………………………………………………........ e Acknowledgements……………………………………………………………….. f List of Tables…………………………………………………………………........ i List of Figures…………………………………………………………………...... j Chapter 1 Introduction…………………………………………………………….. 1 2 Theory………………………………………………………………….. 3 Polyvinyl alcohol (PVA)………………………………………….. 3 Titanium dioxide (TiO2)…………………………………………... 4 Surfactants………………………………………………………… 6 Sodium dodecyl sulfate (SDS)…………………………………. 6 Sodium dodecyl benzenesulfonate (SDBS)……………………. 7 Polymer nanocomposites………………………………………….. 8 Solution casting…………………………………………………… 8 Mechanical analysis……………………………………………….. 10 Universal tensile testing……………………………………… 10 Dynamic mechanical analysis (DMA)………………………… 11 Thermal analysis…………………………………………………... 11 Differential scanning calorimeter (DSC)………………………. 12 Thermogravimetric analysis (TGA)……………………………. 12 Scanning electron microscopy (SEM)…………………………….. 12 Ultraviolet–visible spectroscopy………………………………….. 13 3 Literature reviews……………………………………………………… 15 Polymer nanocomposites………………………………………….. 15 Polyvinyl alcohol nanocomposites………………………………... 17 Polyvinyl alcohol/Titanium dioxide nanocomposites…………….. 22 Polymer nanocomposites with surfactant…………………………. 24 4 Experimental procedure………………………………………………... 28 Materials…………………………………………………………... 28 Sample preparation………………………………………………... 31 Sample characterization…………………………………………… 32 Universal tensile testing………………………………………... 32 Dynamic mechanical analysis (DMA)…………………………. 33 Differential scanning calorimeter (DSC)………………………. 33 Thermogravimetric analysis (TGA)……………………………. 34 Scanning electron microscopy (SEM)…………………………. 34 Ultraviolet–visible spectroscopy (UV-Vis)……………………. 35 5 Results and discussion………………………………………………….. 36 Dispersion…………………………………………………………. 36 The dispersion of TiO2 nanoparticles in PVA matrix………….. 36 The dispersion of TiO2 particle in PVA matrix in the presence
of SDS……………………………………………………….
36 The effect of TiO2 on the dispersion in PVA matrix in the
presence of SDBS……………………………………………
36
สำนกหอ
สมดกลาง
h
Page Mechanical properties……………………………………………... 37 Universal Tensile Testing……………………………………… 37 Tensile strength……………………………………………... 37 Stress at break……………………………………………….. 45 Young’s Modulus…………………………………………… 46 Percent strain at break………………………………………. 47 Thermo Mechanical properties……………………………………. 47 DMA Analysis…………………………………………………. 47 Storage modulus (E´) of PVA/TiO2 nanocomposites………. 47 Storage modulus (E´) of PVA/TiO2 nanocomposites with
SDS……………………………………………………..
48 Storage modulus (E´) of PVA/TiO2 nanocomposites with
SDBS……………………………………………………
48 Thermal Properties………………………………………………… 50 DSC Analysis…………………………………………………... 50 Glass transition temperature (Tg)…………………………… 50 Melting point temperature (Tm)……………………………... 51 Crystallization temperature (Tc)…………………………….. 53 Degree of crystallinity ( ) and percent crystallinity………. 56 TGA Analysis………………………………………………….. 57 PVA/TiO2 nanocomposites…………………………………. 57 PVA/TiO2 nanocomposites with SDS………………………. 58 PVA/TiO2 nanocomposites with SDBS…………………….. 60 UV-Vis analysis…………………………………………………… 61 PVA/TiO2 nanocomposites…………………………………….. 61 PVA/TiO2 nanocomposites with SDS………………………….. 63 PVA/TiO2 nanocomposites with SDBS………………………... 63
Characterization of FT-IR spectroscopy…………………………... 63 6 Conclusions…………………………………………………………….. 65 References………………………………………………………………………… 67 Appendix………………………………………………………………………….. 74 Appendix A: Nomenclature…………………………………………….. 75 Appendix B: International proceeding…………………………………. 78 Biography…………………………………………………………………………. 80
สำนกหอ
สมดกลาง
i
LIST OF TABLES Tables Page 1 Physical Properties of Titanium Dioxide……………………………. 5 2 Glass transition temperature (Tg) of PVA nanocomposites without
and with surfactant……………………………………………...
51 3 Melting point temperature (Tm) of PVA nanocomposites without
and with surfactant……………………………………………...
51 4 Crystallization temperature (Tc) of PVA nanocomposites without
and with surfactant……………………………………………...
54 5 Degree of crystallinity (Xc) of PVA nanocomposites without and
with surfactant…………………………………………………..
56 6 Percent crystallinity of PVA nanocomposites without and with
surfactant………………………………………………………..
57 7 Decomposition temperature of PVA/TiO2 nanocomposites………… 58 8 The percentage weight losses of PVA nanocomposites without and
with surfactant at 600°C………………………………………...
59 9 Decomposition temperature of PVA/TiO2 nanocomposites with
SDS……………………………………………………………..
60 10 Decomposition temperature of PVA/TiO2 nanocomposites with
SDBS……………………………………………………………
61
สำนกหอ
สมดกลาง
j
LIST OF FIGURES Figures Page 1 Structural formula for PVA: (A) partially hydrolyzed; (B) fully
hydrolyzed……………………………………………………….
3 2 Micelle, hydrophilic type and hydrophobic type…………………….. 6 3 Sodium dodecyl sulfate structure…………………………………….. 7 4 Sodium dodecyl benzenesulfonate structure…………………………. 7 5 Hand proportioning, mixing, casting and curing with a two-
component liquid reactive resin system…………………………
9 6 Stress-strain curve……………………………………………………. 10 7 Energy level diagram representing electronic transitions……………. 13 8 Experimental schematic diagram…………………………………….. 28 9 PVA fraction…………………………………………………………. 29 10 TiO2 nano-powder………………………………………………….... 29 11 SDS powder………………………………………………………….. 29 12 SBDS powder………………………………………………………... 30 13 DI water purifier……………………………………………………... 30 14 Hot plate stirrer………………………………………………………. 30 15 Ultrasonic bath……………………………………………………….. 31 16 Petri dish glass……………………………………………………….. 31 17 Oven………………………………………………………………….. 32 18 Universal tensile testing machine……………………………………. 32 19 DSC………………………………………………………………....... 33 20 Thermogravimetric analyzer…………………………………………. 34 21 SEM…………………………………………………………………... 34 22 UV-Vis spectrophotometer…………………………………………... 35 23 SEM micrographs of Pure PVA and PVA/TiO2 nanocomposites at
various TiO2 content……………………………………………..
38 24 SEM micrographs of PVA/TiO2 nanocomposites at various TiO2
content…………………………………………………………...
39 25 SEM micrographs of PVA/TiO2 nanocomposites in the presence of
SDS at various TiO2 content……………………………………..
40 26 SEM micrographs of PVA/TiO2 nanocomposites in the presence of
SDS at various TiO2 content……………………………………..
41 27 SEM micrographs of PVA/TiO2 nanocomposites in the presence of
SDBS at various TiO2 content…………………………………...
42 28 SEM micrographs of PVA/TiO2 nanocomposites in the presence of
SDBS at various TiO2 content…………………………………...
43 29 The tensile strength of PVA/TiO2 nanocomposites without and with
surfactant………………………………………………………...
44 30 Stress at break of PVA/TiO2 nanocomposites without and with
surfactant………………………………………………………...
45 31 Young’s modulus of PVA/TiO2 nanocomposites without and with
surfactant………………………………………………………...
46 32 Percent strain at break of PVA/TiO2 nanocomposites without and
with surfactant…………………………………………………...
47 33 Storage modulus (E´) of PVA/TiO2 nanocomposites………………... 49
สำนกหอ
สมดกลาง
k
Figures Page 34 Storage modulus (E´) of PVA/TiO2 nanocomposites with SDS……... 49 35 Storage modulus (E´) of PVA/TiO2 nanocomposites with SDBS…… 50 36 Melting point temperature (Tm) of PVA nanocomposites…………… 52 37 Melting point temperature (Tm) of PVA nanocomposites with SDS… 52 38 Melting point temperature (Tm) of PVA nanocomposites with SDBS. 53 39 Crystallization temperature (Tc) of PVA nanocomposites…………… 54 40 Crystallization temperature (Tc) of PVA nanocomposites with SDS... 55 41 Crystallization temperature (Tc) of PVA nanocomposites with SDBS. 55 42 Percentage weights of PVA/TiO2 nanocomposites…………………... 58 43 Percentage weights of PVA/TiO2 nanocomposites with SDS……….. 59 44 Percentage weights of PVA/TiO2 nanocomposites with SDBS……… 61 45 UV-Vis transmittance spectra of the PVA/TiO2 nanocomposites…… 62 46 UV-Vis transmittance spectra of the PVA/TiO2 nanocomposites with
SDS……………………………………………………………...
62 47 UV-Vis transmittance spectra of the PVA/TiO2 nanocomposites with
SDBS…………………………………………………………….
63 48 FT-IR spectra………………………………………………………… 64
สำนกหอ
สมดกลาง
1
CHAPTER 1 INTRODUCTION
Plastic is a material that is used widely in several times. Today we can see the extended awareness about the plastics waste subject in all over the world, especially as the packaging applications [1]. In recent years, the petroleum shortage and environmental pollutions caused by non-degradable plastics have attracted world concerns over developing environmental friendly materials. The growing environmental awareness lately has triggered interests into more environmentally friendly and biodegradable materials [2]. Due to each type of polymer, the properties are restricted. Thus the properties improvement of polymer by the addition of the organic/inorganic nanoparticles in polymer matrix, which called polymer nanocomposites, is attractive. New class of polymeric/inorganic nanocomposites with improve performances have a great potential in many fields. Nanocomposites in which polymers focus on the inorganic nanoparticles, due to its improved to enhance the properties, such as mechanical properties so has received attention from many researchers. The increased properties are probably due to the effects of inorganic nanoscale structure and the stronger interaction between the organic matrix and inorganic materials [3]. Polyvinyl alcohol (PVA) is a largest synthetic water-soluble polymer used in a wide range of industrial, commercial, medical and food applications [4, 5, 6]. PVA is a semicrystalline polymer whose hydroxyl groups produce inter- and intra-molecular hydrogen bonding [7]. PVA was attractive as a polymeric matrix because of its good film forming, chemical resistance as well as reactive hydroxyl groups, which facilitate well dispersion of TiO2 nanoparticles. PVA is a biodegradable and water-soluble polymer and is used in many areas of technology and science. Hence, PVA and its nanocomposites have found a wide range of industrial applications such as sizing process of the textile industry and paper coating due to its high tensile strength, better flexibility, high thermal and chemical stability [8], emulsifiers and film packaging in food, coating, adhesives, and optical holographic industries. Nevertheless, there were few articles about PVA/TiO2 nanocomposites prepared by ultrasonic solution method. Among of inorganic fillers, TiO2 nanoparticles get attention, because of its good stability, nontoxicity, high photocatalytic activity, UV resistance, hydrophilicity, high refractive index and excellent transparency for the visible light [9]. However, TiO2 nanoparticles can be added directly in organic coating, but due to the high surface area and high polarity, there is a strong tendency for them to be aggregate [10]. Therefore, in order to help homogeneous dispersion of nanoparticles many researchers have been concentrating on the surface modification of nanoparticles and new method for incorporation of inorganic nano-filler into an organic matrix [11, 12, 13]. Several ways have been employed to modify the surface of nanoparticles. The adsorption of a surfactant on the nanoparticles surface is one of the most favorable methods and still attracting considerable attention from many researchers. In general, surfactant is a molecule that contains a hydrophobic hydrocarbon chain and a hydrophilic polar group in the same molecule. On the other hand, for successful preparation of the nanoscale materials, a lot
สำนกหอ
สมดกลาง
2
of methods such as melt mixing, sol–gel technique [14], emulsion technology [15] and in situ polymerization [16] in the presence of monomer and nanoparticles have been employed. Between them ultrasonic irradiation is a relatively new but quite well accepted method which has been widely used in jointing, machining, cleaning, therapeutic applications, chemistry and preparing nanomaterials. When ultrasonic wave passes through a liquid medium, a large number of microbubbles form, grow and collapse in a very short time, which is called the ultrasonic cavitations [10]. This can result in extreme conditions of temperature (> 2000 K) and pressure (> 500 bar) on a microsecond timescale [17]. Therefore, ultrasonic irradiation can produced a very harsh environment that can induce some chemical reactions that cannot take place under usual conditions and could be extensively applied in the homogenous dispersion of nanoparticles in organic polymers [10].
Objective of this work is investigated the effects of different surfactants micellar environment on mechanical and thermal properties of PVA/TiO2 nanocomposites. The polymer nanocomposites research is focused mainly on the two surfactants which are among the most used substances, sodium dodecyl sulfate (SDS) and sodium dodecyl benzenesulfonate (SDBS). Because of the different structures, the micellar circumstances of the two surfactants are different, too. The films of PVA/TiO2 nanocomposites were prepared by a solution casting method. The obtained nanocomposites were investigated the mechanical properties by a universal tensile testing and dynamic mechanical analysis (DMA). The thermal properties were investigated by differential scanning calorimeter (DSC) and thermogravimetric analysis (TGA). The dispersion of TiO2 particles in PVA matrix was observed by scanning electron microscopy (SEM) and UV–Vis spectroscopy was employed to evaluate the absorbance/transmittance behavior of the PVA/TiO2 nanocomposite films.
สำนกหอ
สมดกลาง
3
CHAPTER 2 THEORY
1. Polyvinyl alcohol (PVA)
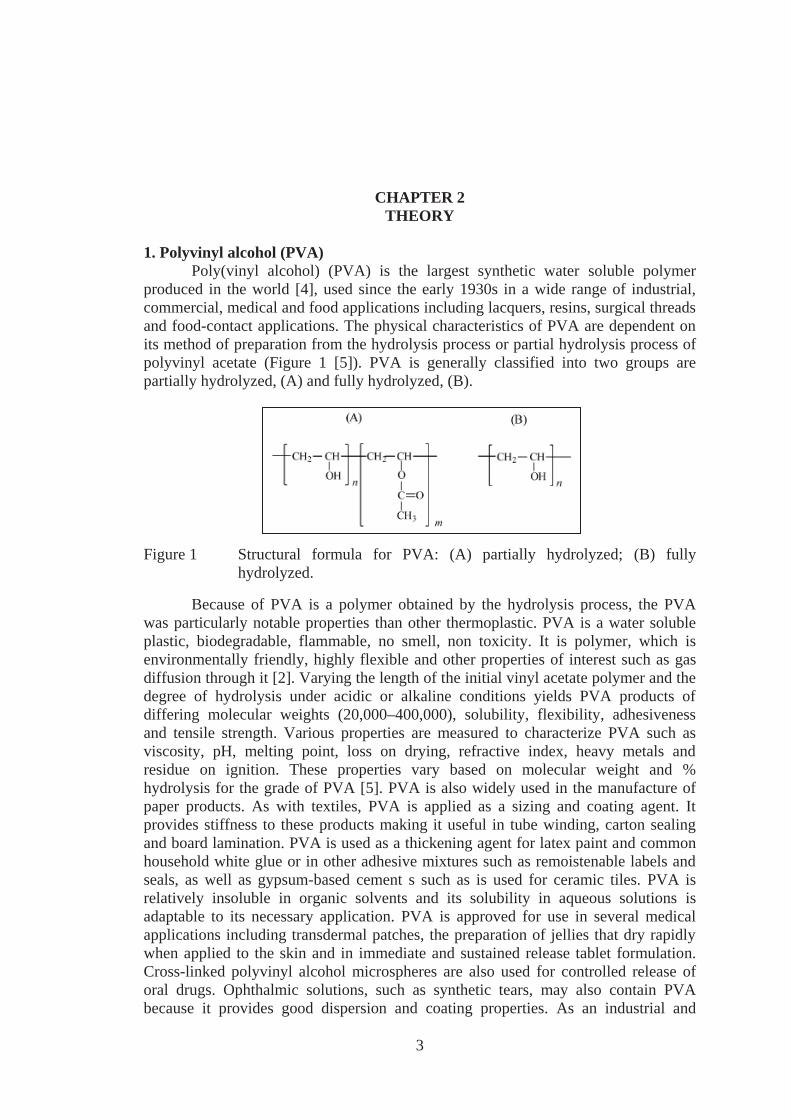
Poly(vinyl alcohol) (PVA) is the largest synthetic water soluble polymer produced in the world [4], used since the early 1930s in a wide range of industrial, commercial, medical and food applications including lacquers, resins, surgical threads and food-contact applications. The physical characteristics of PVA are dependent on its method of preparation from the hydrolysis process or partial hydrolysis process of polyvinyl acetate (Figure 1 [5]). PVA is generally classified into two groups are partially hydrolyzed, (A) and fully hydrolyzed, (B).
Figure 1 Structural formula for PVA: (A) partially hydrolyzed; (B) fully hydrolyzed.
Because of PVA is a polymer obtained by the hydrolysis process, the PVA was particularly notable properties than other thermoplastic. PVA is a water soluble plastic, biodegradable, flammable, no smell, non toxicity. It is polymer, which is environmentally friendly, highly flexible and other properties of interest such as gas diffusion through it [2]. Varying the length of the initial vinyl acetate polymer and the degree of hydrolysis under acidic or alkaline conditions yields PVA products of differing molecular weights (20,000–400,000), solubility, flexibility, adhesiveness and tensile strength. Various properties are measured to characterize PVA such as viscosity, pH, melting point, loss on drying, refractive index, heavy metals and residue on ignition. These properties vary based on molecular weight and % hydrolysis for the grade of PVA [5]. PVA is also widely used in the manufacture of paper products. As with textiles, PVA is applied as a sizing and coating agent. It provides stiffness to these products making it useful in tube winding, carton sealing and board lamination. PVA is used as a thickening agent for latex paint and common household white glue or in other adhesive mixtures such as remoistenable labels and seals, as well as gypsum-based cement s such as is used for ceramic tiles. PVA is relatively insoluble in organic solvents and its solubility in aqueous solutions is adaptable to its necessary application. PVA is approved for use in several medical applications including transdermal patches, the preparation of jellies that dry rapidly when applied to the skin and in immediate and sustained release tablet formulation. Cross-linked polyvinyl alcohol microspheres are also used for controlled release of oral drugs. Ophthalmic solutions, such as synthetic tears, may also contain PVA because it provides good dispersion and coating properties. As an industrial and
4
commercial product, PVA is valued for its solubility and biodegradability, which contributes to its very low environmental impact. Several microorganisms ubiquitous to artificial and natural environments such as septic systems, landfills, compost and soil have been identified which are able to degrade PVA through enzymatic processes. A combination of oxidase and hydrolase enzyme activities degrades PVA into acetic acid but both the percent hydrolysis and its solubility affect the rate of PVA biodegradation [5]. The properties depend on greatly on the degree of hydrolysis. The major interest of this family and, at the same time, the main disadvantage, is its solubility in water, which is: 1. Proportional to the degree of hydrolysis 2. Inversely proportional to the degree of polymerization. In addition to their water solubility, PVAs are appreciated for their good mechanical properties in the dry state, resistance to common solvents, barrier effect in dry atmospheres, possibility of food contact for suitable grades, biodegradability. On the other hand, the water solubility and high moisture absorption is an obstacle to their development in engineering applications. PVA must often be protected with other polymers. The cost is in the range for engineering polymers. PVA can be processed and plasticized by extrusion, injection, casting, dipping. The main engineering applications, possibly in combination with other polymers, for example: 1. Films for packing, colorants, disinfectants, fertilizers, herbicides, dyes, cosmetics, chemicals etc. 2. Films for composite molding 3. Solvent-resistant pipes and tubes 4. Membranes for chemical products or pumps carrying petroleum [18].
2. Titanium dioxide (TiO2) Titanium dioxide, also known as titanium (IV) oxide or titania is a chemical one as old as the world and one of the 50 types of substances that produce most global. General features white opaque born naturally with two major forms of (tetragonal), anatase (tetragonal) and brookite (orthorhombic) [19, 20]. All these forms are associated with well-known minerals such as: quartz, tourmaline, barite, hematite, silicates, feldspar, chalcopyrite, hematite and sphene. There are some differences in physical (e.g. crystal structure, stability, hardness, density) and optical (e.g. color, luster, brightness, refractive index) properties between them [21]. TiO2 are ubiquitously used materials in everyday life (e.g. in paints, household products and plastic goods). As TiO2 has high potential for UV scattering, coated and uncoated TiO2 nanoparticles have been employed for several decades as efficient UV-filters for sunscreens in the cosmetics field. Regarding percutaneous absorption, a main exposure route of cosmetics, most reports showed that TiO2 nanoparticles do not penetrate through the stratum corneum of healthy skin and possess no local or systemic risk to human health. Furthermore, since titanium and TiO2 are highly inert, they are believed to be safe for cosmetics use [22]. TiO2 has been a tremendous interest in their application for various applications, due to its chemical stability, low toxicity, more affordable, and properties that are many useful. In particular, TiO2 has been used widely in the field
5
of solar energy into other forms. This story began with photoelectrochemical solar energy conversion and then shifted into the area of environmental photocatalysis, including self-cleaning surfaces, and most recently into the area of photoinduced hydrophilicity, which involves not only self-cleaning surfaces, but also antifogging ones. One of the most interesting aspects of TiO2 is that the types of photochemistry responsible for photocatalysis and hydrophilicity are completely different, even though both can occur simultaneously on the same surface [23]. TiO2 is a finely divided, prime white hiding pigment used to impart color and opacity to a wide range of paints, plastics, paper, inks, elastomers and other materials. It is most commonly referred to by its chemical compound formula, TiO2. It is a totally synthetic inorganic colorant that is insoluble in water and resin and effectively scatters visible light better than any other commercially available white pigment. It, therefore, has the highest opacity of any white hiding pigment, owing to its high refractive index and its small, closely controlled particle-size distribution [24].
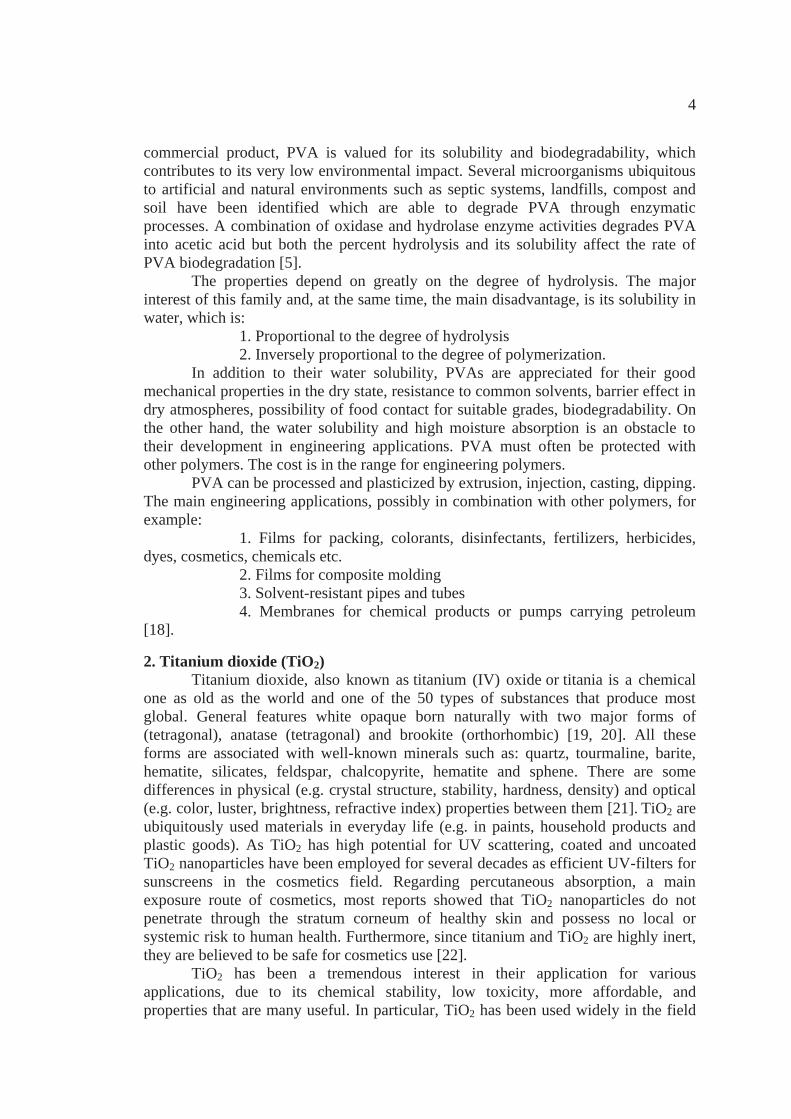
Table1. Physical Properties of Titanium Dioxide.
Chemical formula TiO2 Molecular weight 79.9 Melting point, °C 1855 Crystal structure Tetragonal Crystal forms (commercial) Rutile and anatase Density, g/cm3 3.9 (anatase)
4.2 (rutile) Refractive index 2.55 (anatase)
2.70 (rutile) Hardness, Mohs 5.5-6.0 (anatase)
7.0-7.5 (rutile)
Titanium, the world’s fourth most abundant metal (exceeded only by aluminium, iron, and magnesium) and the ninth most abundant element was discovered in 1791 in England by Reverend William Gregor, who recognized the presence of a new element in ilmenite. The element was rediscovered several years later by the German chemist Heinrich Klaporth in rutile ore who named it after Titans, mythological first sons of the goddess Ge [25]. TiO2 can no longer be viewed as a product whose demand is defined by regional markets. A global business, TiO2 is manufactured globally and the product is moved to meet demand wherever it exists. Pigmented-plastics manufactures are now realizing that this global market requires close coordination with TiO2 producers to meet the growth they are experiencing, both domestically and overseas. The plastics market is the second largest consumer of TiO2 in the world, using 18% of the world consumption or approximately 524,000 metric tons. Virtually all of the major thermoplastics, as well as a number of smaller-volume thermoplastics and thermosets, have some applications that require TiO2. Of all markets, plastics are predicted to grow the most aggressively in the next 5 years. Through 1994, the world consumption
6
of TiO2 for plastics is expected to grow at a compound annual rate of 6%. This growth of the plastics industry will demand a global commitment to TiO2 supply. Again, the plastics industry is growing rapidly, and its future is limited only by the creativity of its developing technology. Nontoxic TiO2 is one of the most widely used pigments in the world [24].
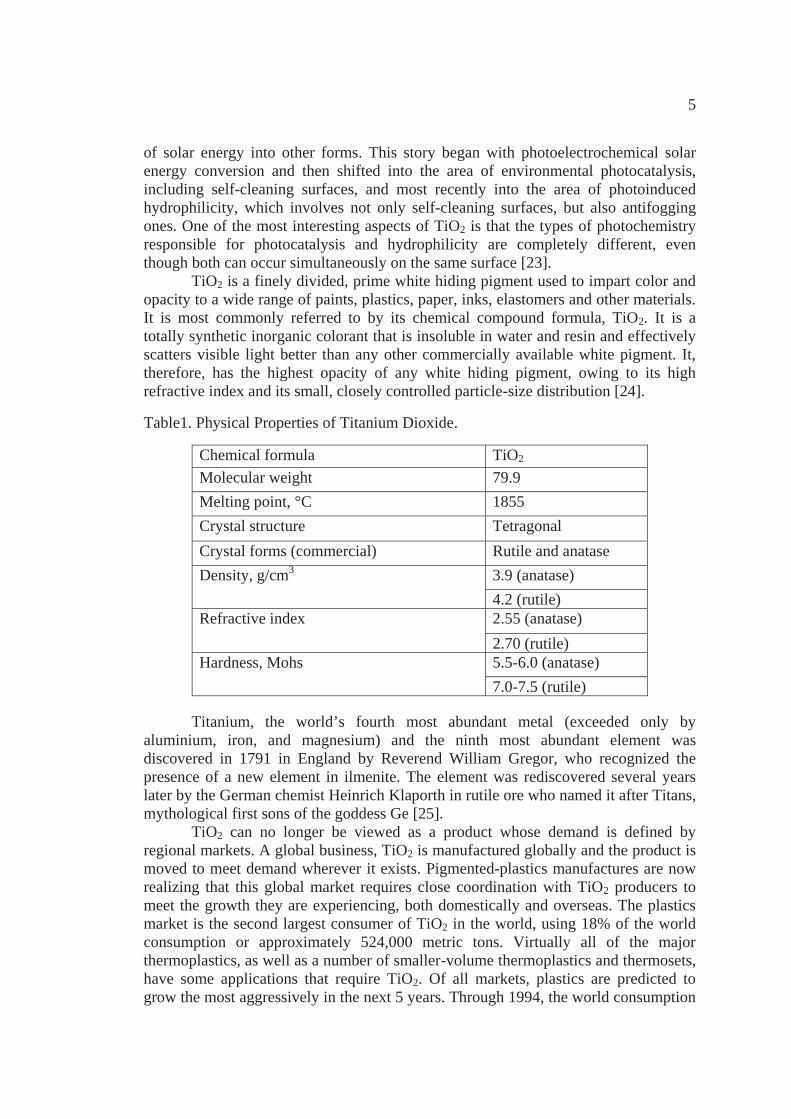
3. Surfactants Surfactants are compounds that lower surface tension of a liquid, the interfacial tension between two liquids or that between a liquid and a solid. Surfactants may act as emulsifiers, wetting agents, detergents, foaming agents and dispersants. Surfactants are usually organic compounds that are amphiphilic, meaning they contain both hyprophilic groups (heads) and hydrophobic groups (tails). Surfactants can be classified into four classes are cationic, anionic, nonionic and zwitterionic. As the concentration of surfactant increases over the critical micelle concentration in a solution, the surfactant molecules combine together to form spherical aggregates, is called micelle [26]. Surfactant molecule contains both a water insoluble, or oil soluble component and a water soluble component. Surfactant molecules will diffuse in water and adsorb at interfaces between air and water or at the interface between oil and water, in the case where water is mixed with oil. The insoluble hydrophobic group may extend out of the bulk water phase, into the air or into the oil phase, while the water soluble head group remains in the water phase. This alignment of surfactant molecules at the surface modifies the surface properties of water at the water/air or water/oil interface. In the aqueous phase, surfactants form aggregates, such as micelles, where the hydrophobic tails form the core of the aggregate and the hydrophilic heads are in contact with the surrounding liquid. Other types of aggregates such as spherical or cylindrical micelles or bilayers can be formed. The shape of the aggregates depends on the chemical structure of the surfactants, depending on the balance of the sizes of the hydrophobic tail and hydrophilic head [27]. Sample of aggregation of surfactant or micelle is shown in Figure 2 [28].
Figure 2 Micelle, hydrophilic type and hydrophobic type.
3.1 Sodium dodecyl sulfate (SDS) Sodium dodecyl sulfate (SDS or NaDS) or sodium laurilsulfate (SLS)
is an organic compound with the formula CH3(CH2)11OSO3Na and it structure is shown in Figure 3 [29]. It is an anionic surfactant used in many hygiene and cleaning products. The salt is of an organosulfate consisting of a 12-carbon tail attached to a
7
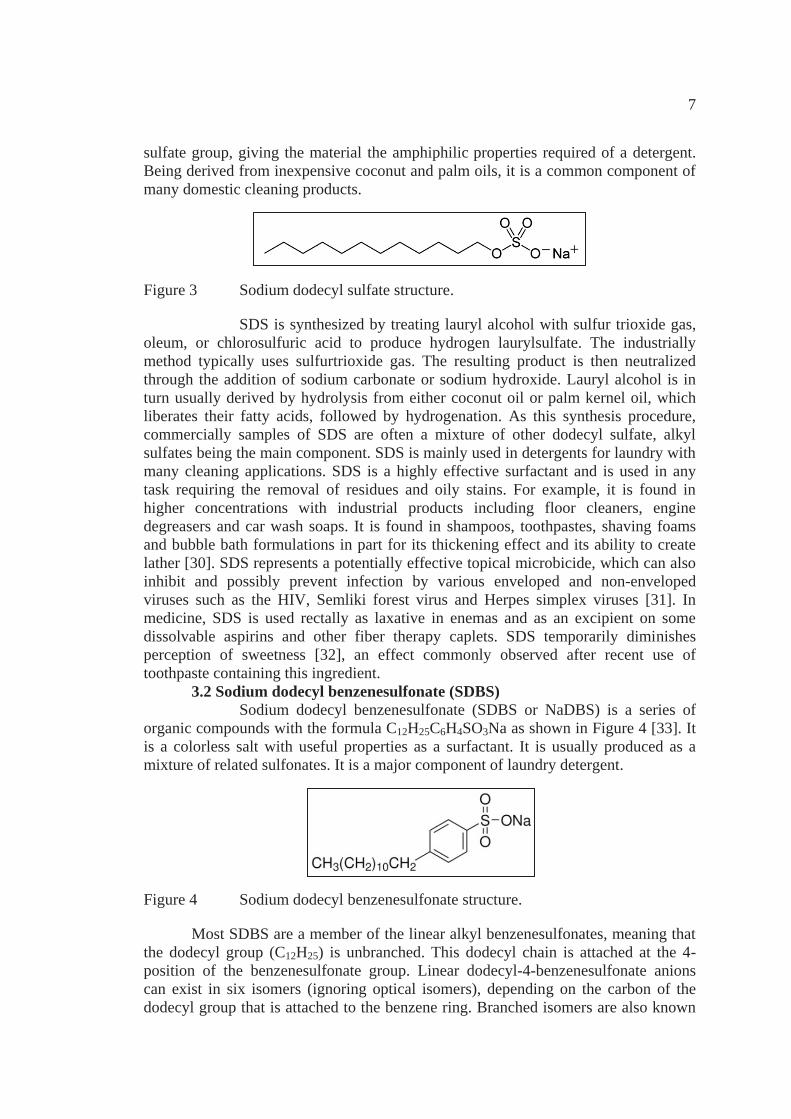
sulfate group, giving the material the amphiphilic properties required of a detergent. Being derived from inexpensive coconut and palm oils, it is a common component of many domestic cleaning products.
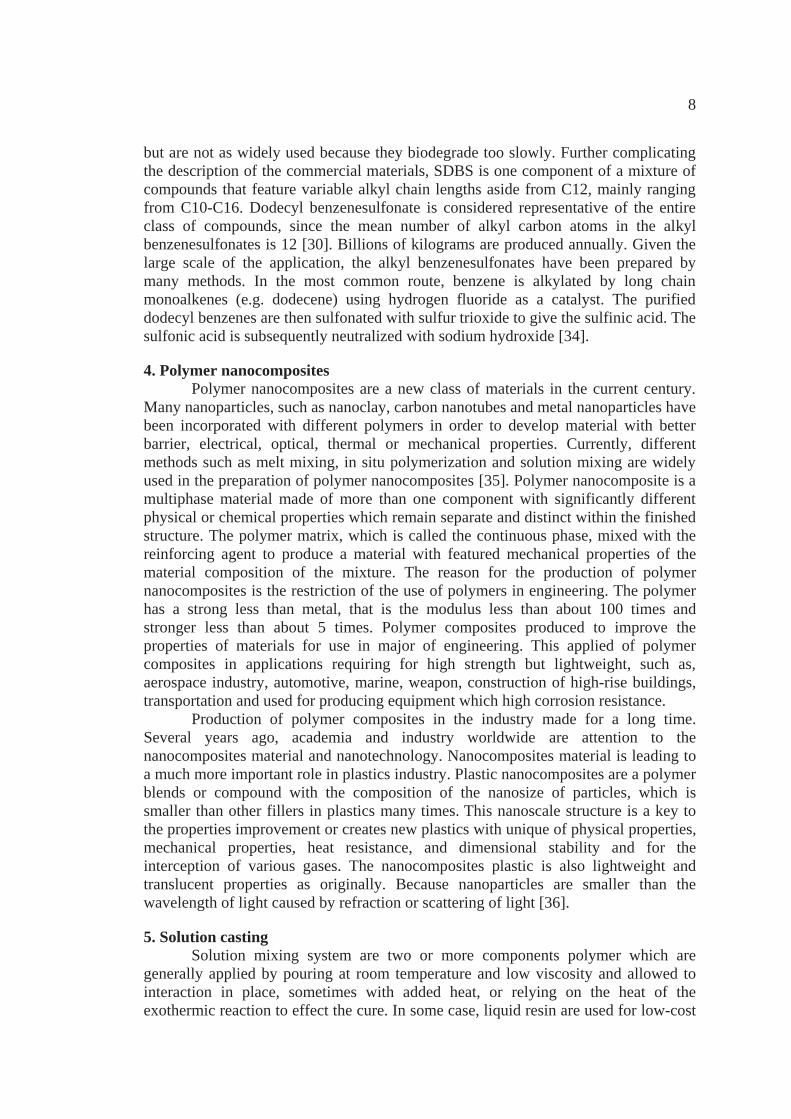
Figure 3 Sodium dodecyl sulfate structure. SDS is synthesized by treating lauryl alcohol with sulfur trioxide gas, oleum, or chlorosulfuric acid to produce hydrogen laurylsulfate. The industrially method typically uses sulfurtrioxide gas. The resulting product is then neutralized through the addition of sodium carbonate or sodium hydroxide. Lauryl alcohol is in turn usually derived by hydrolysis from either coconut oil or palm kernel oil, which liberates their fatty acids, followed by hydrogenation. As this synthesis procedure, commercially samples of SDS are often a mixture of other dodecyl sulfate, alkyl sulfates being the main component. SDS is mainly used in detergents for laundry with many cleaning applications. SDS is a highly effective surfactant and is used in any task requiring the removal of residues and oily stains. For example, it is found in higher concentrations with industrial products including floor cleaners, engine degreasers and car wash soaps. It is found in shampoos, toothpastes, shaving foams and bubble bath formulations in part for its thickening effect and its ability to create lather [30]. SDS represents a potentially effective topical microbicide, which can also inhibit and possibly prevent infection by various enveloped and non-enveloped viruses such as the HIV, Semliki forest virus and Herpes simplex viruses [31]. In medicine, SDS is used rectally as laxative in enemas and as an excipient on some dissolvable aspirins and other fiber therapy caplets. SDS temporarily diminishes perception of sweetness [32], an effect commonly observed after recent use of toothpaste containing this ingredient. 3.2 Sodium dodecyl benzenesulfonate (SDBS) Sodium dodecyl benzenesulfonate (SDBS or NaDBS) is a series of organic compounds with the formula C12H25C6H4SO3Na as shown in Figure 4 [33]. It is a colorless salt with useful properties as a surfactant. It is usually produced as a mixture of related sulfonates. It is a major component of laundry detergent.
Figure 4 Sodium dodecyl benzenesulfonate structure.
Most SDBS are a member of the linear alkyl benzenesulfonates, meaning that the dodecyl group (C12H25) is unbranched. This dodecyl chain is attached at the 4-position of the benzenesulfonate group. Linear dodecyl-4-benzenesulfonate anions can exist in six isomers (ignoring optical isomers), depending on the carbon of the dodecyl group that is attached to the benzene ring. Branched isomers are also known
8
but are not as widely used because they biodegrade too slowly. Further complicating the description of the commercial materials, SDBS is one component of a mixture of compounds that feature variable alkyl chain lengths aside from C12, mainly ranging from C10-C16. Dodecyl benzenesulfonate is considered representative of the entire class of compounds, since the mean number of alkyl carbon atoms in the alkyl benzenesulfonates is 12 [30]. Billions of kilograms are produced annually. Given the large scale of the application, the alkyl benzenesulfonates have been prepared by many methods. In the most common route, benzene is alkylated by long chain monoalkenes (e.g. dodecene) using hydrogen fluoride as a catalyst. The purified dodecyl benzenes are then sulfonated with sulfur trioxide to give the sulfinic acid. The sulfonic acid is subsequently neutralized with sodium hydroxide [34].
4. Polymer nanocomposites Polymer nanocomposites are a new class of materials in the current century. Many nanoparticles, such as nanoclay, carbon nanotubes and metal nanoparticles have been incorporated with different polymers in order to develop material with better barrier, electrical, optical, thermal or mechanical properties. Currently, different methods such as melt mixing, in situ polymerization and solution mixing are widely used in the preparation of polymer nanocomposites [35]. Polymer nanocomposite is a multiphase material made of more than one component with significantly different physical or chemical properties which remain separate and distinct within the finished structure. The polymer matrix, which is called the continuous phase, mixed with the reinforcing agent to produce a material with featured mechanical properties of the material composition of the mixture. The reason for the production of polymer nanocomposites is the restriction of the use of polymers in engineering. The polymer has a strong less than metal, that is the modulus less than about 100 times and stronger less than about 5 times. Polymer composites produced to improve the properties of materials for use in major of engineering. This applied of polymer composites in applications requiring for high strength but lightweight, such as, aerospace industry, automotive, marine, weapon, construction of high-rise buildings, transportation and used for producing equipment which high corrosion resistance. Production of polymer composites in the industry made for a long time. Several years ago, academia and industry worldwide are attention to the nanocomposites material and nanotechnology. Nanocomposites material is leading to a much more important role in plastics industry. Plastic nanocomposites are a polymer blends or compound with the composition of the nanosize of particles, which is smaller than other fillers in plastics many times. This nanoscale structure is a key to the properties improvement or creates new plastics with unique of physical properties, mechanical properties, heat resistance, and dimensional stability and for the interception of various gases. The nanocomposites plastic is also lightweight and translucent properties as originally. Because nanoparticles are smaller than the wavelength of light caused by refraction or scattering of light [36].
5. Solution casting Solution mixing system are two or more components polymer which are generally applied by pouring at room temperature and low viscosity and allowed to interaction in place, sometimes with added heat, or relying on the heat of the exothermic reaction to effect the cure. In some case, liquid resin are used for low-cost
9
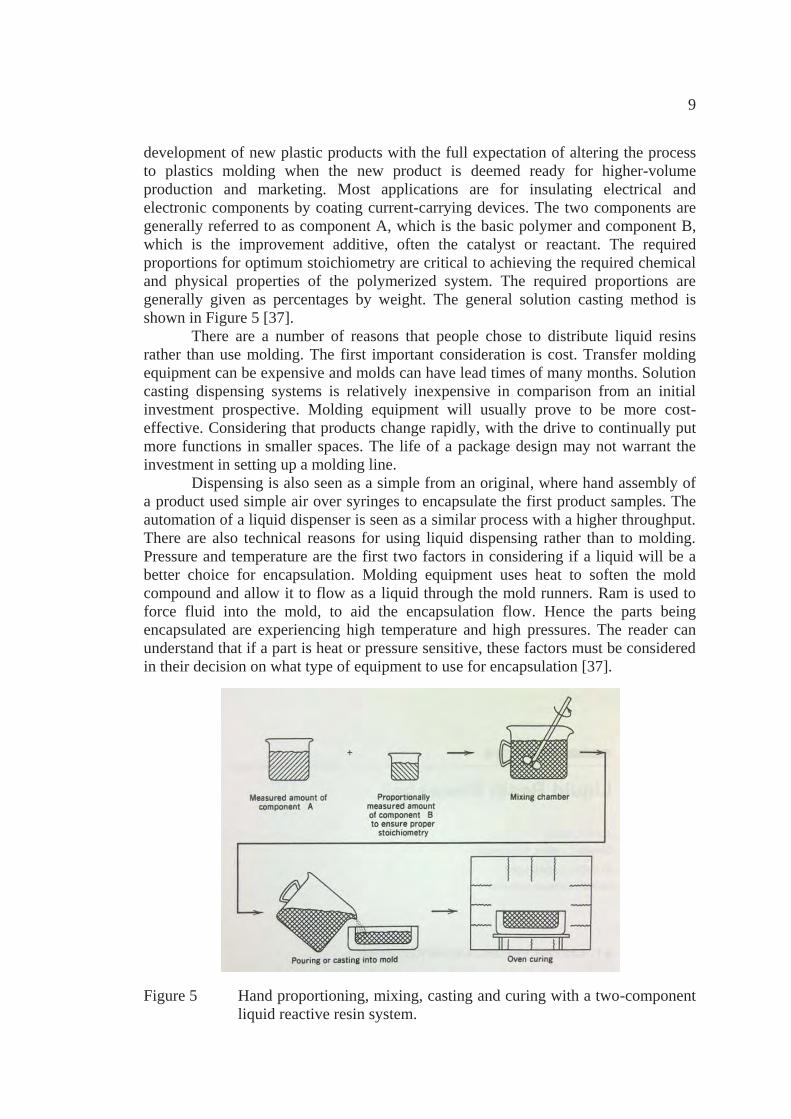
development of new plastic products with the full expectation of altering the process to plastics molding when the new product is deemed ready for higher-volume production and marketing. Most applications are for insulating electrical and electronic components by coating current-carrying devices. The two components are generally referred to as component A, which is the basic polymer and component B, which is the improvement additive, often the catalyst or reactant. The required proportions for optimum stoichiometry are critical to achieving the required chemical and physical properties of the polymerized system. The required proportions are generally given as percentages by weight. The general solution casting method is shown in Figure 5 [37]. There are a number of reasons that people chose to distribute liquid resins rather than use molding. The first important consideration is cost. Transfer molding equipment can be expensive and molds can have lead times of many months. Solution casting dispensing systems is relatively inexpensive in comparison from an initial investment prospective. Molding equipment will usually prove to be more cost-effective. Considering that products change rapidly, with the drive to continually put more functions in smaller spaces. The life of a package design may not warrant the investment in setting up a molding line. Dispensing is also seen as a simple from an original, where hand assembly of a product used simple air over syringes to encapsulate the first product samples. The automation of a liquid dispenser is seen as a similar process with a higher throughput. There are also technical reasons for using liquid dispensing rather than to molding. Pressure and temperature are the first two factors in considering if a liquid will be a better choice for encapsulation. Molding equipment uses heat to soften the mold compound and allow it to flow as a liquid through the mold runners. Ram is used to force fluid into the mold, to aid the encapsulation flow. Hence the parts being encapsulated are experiencing high temperature and high pressures. The reader can understand that if a part is heat or pressure sensitive, these factors must be considered in their decision on what type of equipment to use for encapsulation [37].
Figure 5 Hand proportioning, mixing, casting and curing with a two-component liquid reactive resin system.
10
6. Mechanical analysis Mechanical properties of materials are highly important to the material used. Due to plastic used in any function shall be receiving more or less force, to aware of mechanical properties of plastics that can be used appropriately and safely. In general, the purposes of mechanical properties testing are… 1. Use for the products design. 2. Confirming the safety adoption. 3. Quality control. 4. Confirm the accuracy of the manufacturing process. 5. As basic information of comparison and material selection. 6. As basic information for predicting performance in the applications. 7. As research information and development of new materials.
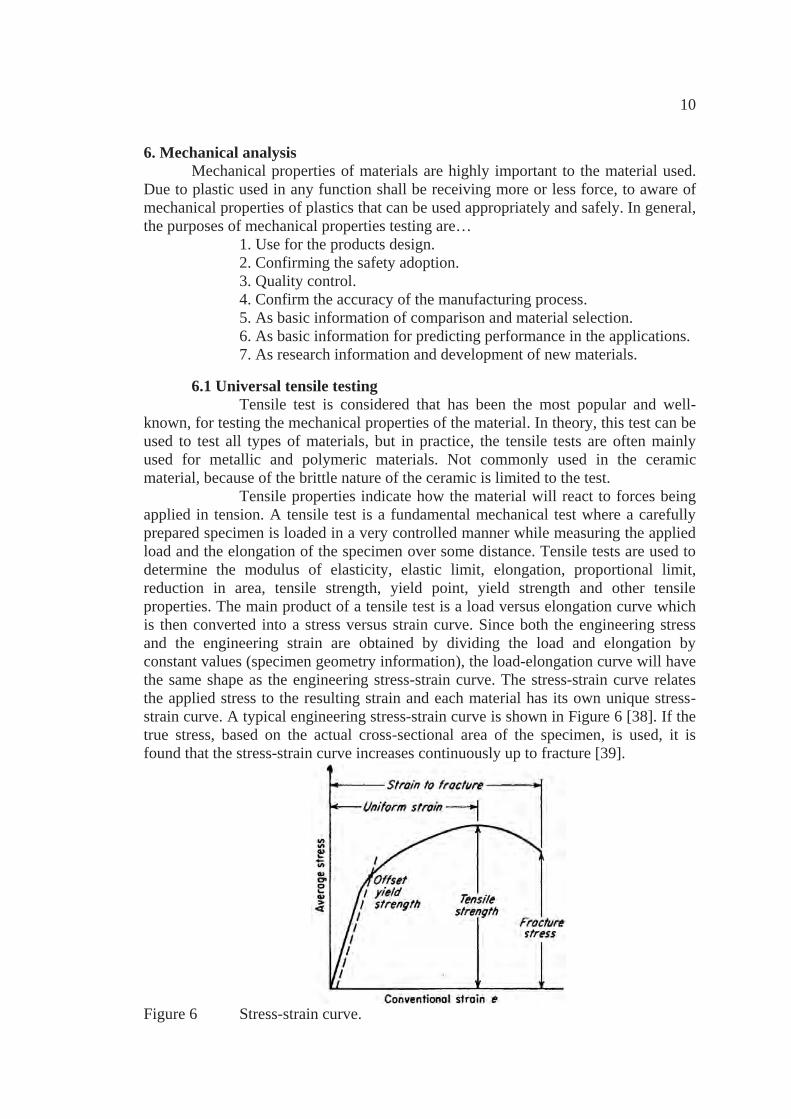
6.1 Universal tensile testing Tensile test is considered that has been the most popular and well-known, for testing the mechanical properties of the material. In theory, this test can be used to test all types of materials, but in practice, the tensile tests are often mainly used for metallic and polymeric materials. Not commonly used in the ceramic material, because of the brittle nature of the ceramic is limited to the test. Tensile properties indicate how the material will react to forces being applied in tension. A tensile test is a fundamental mechanical test where a carefully prepared specimen is loaded in a very controlled manner while measuring the applied load and the elongation of the specimen over some distance. Tensile tests are used to determine the modulus of elasticity, elastic limit, elongation, proportional limit, reduction in area, tensile strength, yield point, yield strength and other tensile properties. The main product of a tensile test is a load versus elongation curve which is then converted into a stress versus strain curve. Since both the engineering stress and the engineering strain are obtained by dividing the load and elongation by constant values (specimen geometry information), the load-elongation curve will have the same shape as the engineering stress-strain curve. The stress-strain curve relates the applied stress to the resulting strain and each material has its own unique stress-strain curve. A typical engineering stress-strain curve is shown in Figure 6 [38]. If the true stress, based on the actual cross-sectional area of the specimen, is used, it is found that the stress-strain curve increases continuously up to fracture [39].
Figure 6 Stress-strain curve.
11
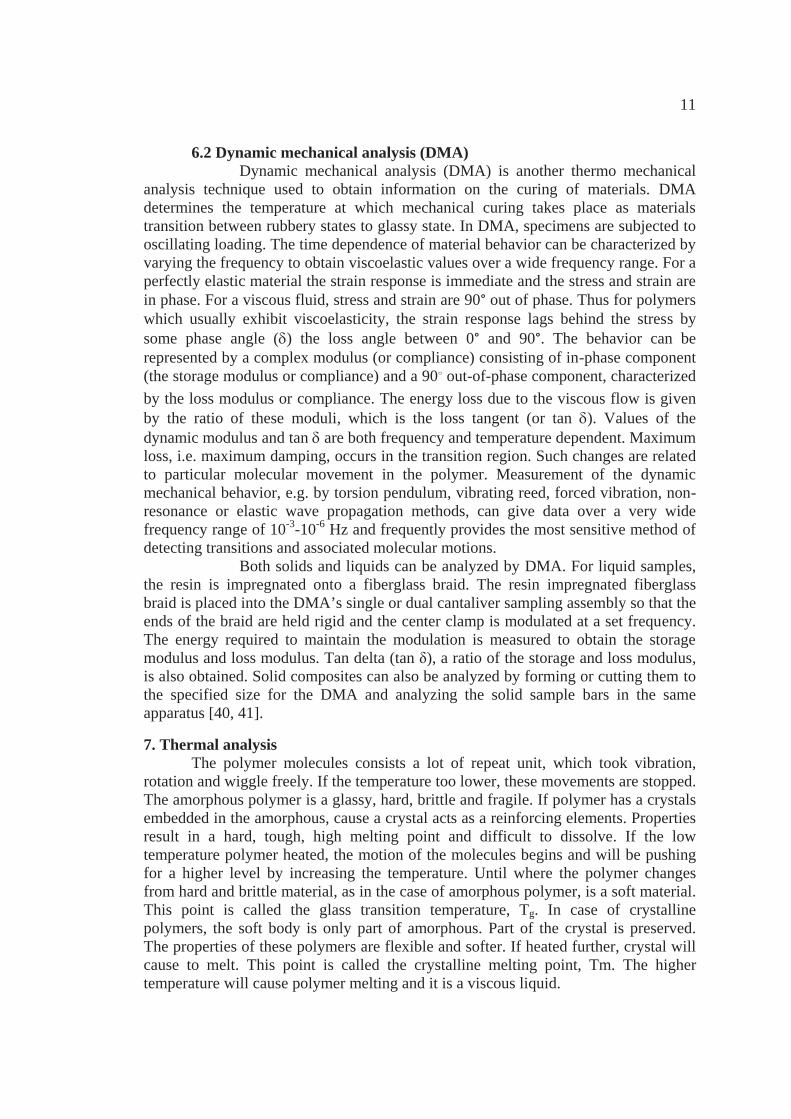
6.2 Dynamic mechanical analysis (DMA) Dynamic mechanical analysis (DMA) is another thermo mechanical analysis technique used to obtain information on the curing of materials. DMA determines the temperature at which mechanical curing takes place as materials transition between rubbery states to glassy state. In DMA, specimens are subjected to oscillating loading. The time dependence of material behavior can be characterized by varying the frequency to obtain viscoelastic values over a wide frequency range. For a perfectly elastic material the strain response is immediate and the stress and strain are in phase. For a viscous fluid, stress and strain are 90° out of phase. Thus for polymers which usually exhibit viscoelasticity, the strain response lags behind the stress by some phase angle ( ) the loss angle between 0° and 90°. The behavior can be represented by a complex modulus (or compliance) consisting of in-phase component (the storage modulus or compliance) and a 90๐ out-of-phase component, characterized by the loss modulus or compliance. The energy loss due to the viscous flow is given by the ratio of these moduli, which is the loss tangent (or tan ). Values of the dynamic modulus and tan are both frequency and temperature dependent. Maximum loss, i.e. maximum damping, occurs in the transition region. Such changes are related to particular molecular movement in the polymer. Measurement of the dynamic mechanical behavior, e.g. by torsion pendulum, vibrating reed, forced vibration, non-resonance or elastic wave propagation methods, can give data over a very wide frequency range of 10-3-10-6 Hz and frequently provides the most sensitive method of detecting transitions and associated molecular motions. Both solids and liquids can be analyzed by DMA. For liquid samples, the resin is impregnated onto a fiberglass braid. The resin impregnated fiberglass braid is placed into the DMA’s single or dual cantaliver sampling assembly so that the ends of the braid are held rigid and the center clamp is modulated at a set frequency. The energy required to maintain the modulation is measured to obtain the storage modulus and loss modulus. Tan delta (tan δ), a ratio of the storage and loss modulus, is also obtained. Solid composites can also be analyzed by forming or cutting them to the specified size for the DMA and analyzing the solid sample bars in the same apparatus [40, 41].
7. Thermal analysis The polymer molecules consists a lot of repeat unit, which took vibration, rotation and wiggle freely. If the temperature too lower, these movements are stopped. The amorphous polymer is a glassy, hard, brittle and fragile. If polymer has a crystals embedded in the amorphous, cause a crystal acts as a reinforcing elements. Properties result in a hard, tough, high melting point and difficult to dissolve. If the low temperature polymer heated, the motion of the molecules begins and will be pushing for a higher level by increasing the temperature. Until where the polymer changes from hard and brittle material, as in the case of amorphous polymer, is a soft material. This point is called the glass transition temperature, Tg. In case of crystalline polymers, the soft body is only part of amorphous. Part of the crystal is preserved. The properties of these polymers are flexible and softer. If heated further, crystal will cause to melt. This point is called the crystalline melting point, Tm. The higher temperature will cause polymer melting and it is a viscous liquid.
12
7.1 Differential scanning calorimeter (DSC) DSC is a thermoanalytical technique in which the difference in the amount of heat required to increase the temperature of a sample and reference are measured as a function of temperature. Both the sample and reference are maintained at very nearly the same temperature throughout the experiment. Generally, the temperature program for a DSC analysis is designed such that the sample holder temperature increases linearly as a function of time. The reference sample should have a well-defined heat capacity over the range of temperatures to be scanned. The basic principle underlying this technique is that, when the sample undergoes a physical transformation such as phase transitions, more (or less) heat will need to flow to it than the reference to maintain both at the same temperature. Whether more or less heat must flow to the sample depends on whether the process is exothermic or endothermic [42]. 7.2 Thermogravimetric analysis (TGA) TGA is one of the members of the family of thermal analysis techniques used to characterise a wide variety of materials. TGA measures the amount and rate (velocity) of change in the mass of a sample as a function of temperature or time in a controlled atmosphere. The measurements are used primarily to determine the thermal and/or oxidative stabilities of materials as well as their compositional properties. The technique can analyze materials that exhibit either mass loss or gain due to decomposition, oxidation or loss of volatiles (such as moisture). It is especially useful for the study of polymeric materials, including thermoplastics, thermosets, elastomers, composites, films, fibers, coatings and paints. TGA measurements provide valuable information that can be used to select materials for certain end-use applications predict product performance and improve product quality [43].
8. Scanning electron microscopy (SEM) A scanning electron microscopy (SEM) is a typically used to generate surface topography of conductive specimens. SEM is a type of electron microscope that images a sample by scanning it with a high-energy beam of electrons in a raster scan pattern. The electrons interact with the atoms that make up the sample producing signals that contain information about the sample's surface morphology, chemical composition, and crystallographic orientation. SEM has the advantage of simple procedures for specimen preparation.
There are several types of signals produced by the excitation of the incident electron beam, which can be detected and processed by different detectors. The types of signals produced by a SEM include secondary electrons, back-scattered electrons (BSE), characteristic X-rays, light (cathodoluminescence), specimen current and transmitted electrons. Secondary electron detectors are common in all SEMs, but it is rare that a single machine would have detectors for all possible signals. The signals result from interactions of the electron beam with atoms at or near the surface of the sample. In the most common or standard detection mode, secondary electron imaging or SEI, the SEM can produce very high-resolution images of a sample surface, revealing details less than 1 nm in size. Due to the very narrow electron beam, SEM micrographs have a large depth of field yielding a characteristic three-dimensional appearance useful for understanding the surface structure of a sample. A wide range of magnifications is possible, from about 10 times (about equivalent to that of a
13
powerful hand-lens) to more than 500,000 times, about 250 times the magnification limit of the best light microscopes. If a back-scattered electron (BSE) detector is installed, the SEM can generate BSE images through capturing the beam electrons reflected from the sample by elastic scattering. The contrast of BSE images contains chemical composition information because the intensity of the BSE signal strongly relate to the atomic number of the speciment causing elastic scattering of electrons. Therefore, BSE images can provide information about the distribution of different elements in the sample. BSE are often used in analytical SEM along with the spectra made from the characteristic X-rays. For the same reason, BSE imaging can image colloidal gold immune-labels of 5 or 10 nm diameters, which would otherwise be difficult or impossible to detect in secondary electron images in biological specimens. Characteristic X-rays are emitted when the electron beam removes an inner shell electron from the sample, causing a higher-energy electron to fill the shell and release energy. These characteristic X-rays are used to identify the composition and measure the abundance of elements in the sample [44, 45].
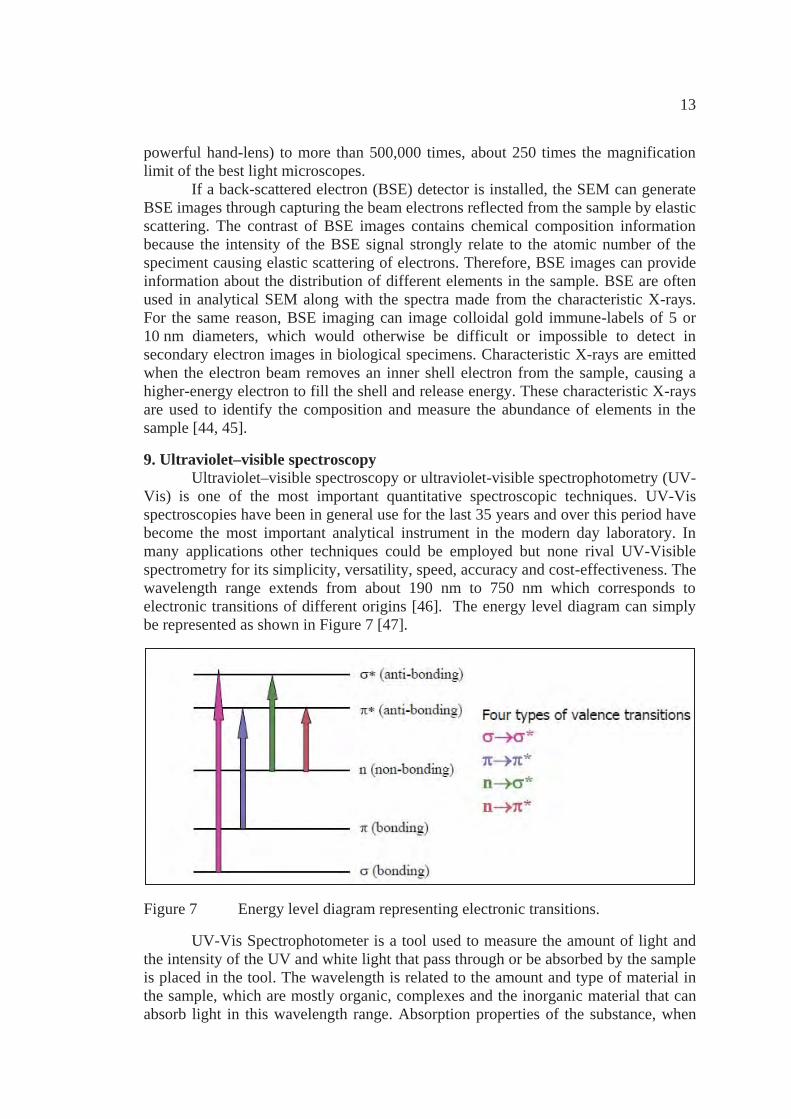
9. Ultraviolet–visible spectroscopy Ultraviolet–visible spectroscopy or ultraviolet-visible spectrophotometry (UV-Vis) is one of the most important quantitative spectroscopic techniques. UV-Vis spectroscopies have been in general use for the last 35 years and over this period have become the most important analytical instrument in the modern day laboratory. In many applications other techniques could be employed but none rival UV-Visible spectrometry for its simplicity, versatility, speed, accuracy and cost-effectiveness. The wavelength range extends from about 190 nm to 750 nm which corresponds to electronic transitions of different origins [46]. The energy level diagram can simply be represented as shown in Figure 7 [47].
Figure 7 Energy level diagram representing electronic transitions.
UV-Vis Spectrophotometer is a tool used to measure the amount of light and the intensity of the UV and white light that pass through or be absorbed by the sample is placed in the tool. The wavelength is related to the amount and type of material in the sample, which are mostly organic, complexes and the inorganic material that can absorb light in this wavelength range. Absorption properties of the substance, when

14
the molecule is shown with a light in the UV or white light energy to the electrons in the atoms of the absorbance change in status to a higher energy level. Measuring the amount of light that passes through or reflected from the sample relative to the light source wavelength values by the Beer-Lambert law is the absorbance of the compound will vary with the number of molecules that absorb light. Therefore, this technique can be used to determine the type and amount of substances contained in the sample. The Beer-Lambert law states that the absorbance of a solution is directly proportional to the concentration of the absorbing species in the solution and the path length. Thus, for a fixed path length, UV-Vis spectroscopy can be used to determine the concentration of the absorber in a solution. It is necessary to know how quickly the absorbance changes with concentration. This can be taken from references or more accurately, determined from a calibration curve [47].
15
CHAPTER 3 LITERATURE REVIEWS
1. Polymer nanocomposites
Wetzel, B. et al. [6] studied the small ceramic particles to enhance the mechanical and tribological properties of polymers. Aluminium oxide (Al2O3) nanoparticles and calcium silicate (CaSiO3) micro-particles were used as fillers for being mixed into the epoxy matrix. Composites were prepared by mechanical mixing. The addition of Al2O3 nanoparticles into epoxy resin to simultaneously improve stiffness, impact energy and failure strain at low filler contents (1–2 vol.%). The introduction of CaSiO3 microparticles into a composite matrix, 2 vol.% contains are an optimum amount to pushes the flexural modulus to even higher levels and further increases the wear resistance. Nanoparticles and microparticles are both able to improve the wear resistance of the epoxy matrix. Nanocomposites show signs of mild abrasive wear due to the hard ceramic particles. The good wear performance of the CaSiO3 composites may be the result of temporarily protecting microparticles which protrude out of the polymer surface and relieve the matrix from severe wear.
Selvin, Thomas P. et al. [48] studied the mechanical properties of titanium dioxide (TiO2) filled polystyrene (PS) microcomposites with the coupling agent, 3-amino ethoxy silane. Universal testing machine and impact tester were used to observe the PS/TiO2 microcomposite fabrication. Young’s modulus of the composite increase on increasing the TiO2 content and in the silane coupled system also the modulus values showed an increasing trend. The modulus values are higher than those containing no coupling agent. The tensile strength values increase linearly. In the case of systems with coupling agent also all the compositions showed an improved strength and optimum concentration of the coupling agent for the best mechanical properties is 0.5 wt%. SEM images confirm that the coupling agent added system also shows agglomeration at higher filler loading. Elongation at break values was found that higher than the virgin polymer in all compositions. In the system including silane coupling agent also the elongation at break values are higher than those containing absent coupling agent. And the impact strength shows a decrease with increase of filler loading. The reason for the decrease in the property can be attributed to the poor adhesion or bonding at the interface between the matrix and the filler. In the presence of the coupling agent, the interfacial bonding between the matrix and the filler increases and thus facilitates better transfer of stress.
Koji Nakane et al. [14] studied the properties of polyvinyl butyral (PVB)/TiO2 nanocomposites. The PVB/TiO2 nanocomposites were prepared by the sol–gel process. The properties of PVB/TiO2 nanocomposite films were investigated by the mixing TiO2 with PVB matrix, the nanocomposites became stiff and brittle by the addition of TiO2. The Young’s modulus increased about 2.4 times higher than pure PVB for the nanocomposite containing TiO2 15 wt%. Peak of DMA curves of the nanocomposites become lower and shifted to a high temperature gradually with
16
increasing the TiO2 content. The endothermic peak from DSC analysis is shifted to higher temperature and widen with an increase in TiO2 content. Thus the nanocomposites have higher thermal resistance than pure PVB. Effect of TiO2 content on abrasion resistant for PVB/TiO2 nanocomposites were improves. This result may be ascribed to increase of hardness and decrease of surface frictional resistance. The solubility and the degree of swelling in ethanol were concluded that PVB and TiO2 were intimately mixed together.
Ratna, D. et al. [49] studied the thermo mechanical properties and morphology of poly ethylene oxide (PEO)/clay nanocomposite. PEO/clay nanocomposites were prepared by a solution intercalation method and used chloroform as a solvent. The nanocomposites were characterized by X-ray diffraction (XRD), differential scanning calorimetry (DSC), Fourier transform infrared spectroscopy (FT-IR), tensile analysis and dynamic mechanical analysis (DMA) characterization techniques. XRD analysis show the modification of clay with organic ions results in a tremendous increase in d-spacing, indicates the formation of intercalated nanocomposite. FTIR indicates that in the nanocomposite the helical structure of PEO in distorted as a result of intercalation. DSC analysis indicated the melting point and heat of crystallization increases at 2.5% of loading and decreases with further. The storage modulus at all the temperature was found to be higher for nanocomposite compared to the pure PEO, observed by DMA. The tensile test found that tensile strength and percent elongation increases with the incorporation of clay.
Ismail, H. et al. [50] studied the thermal, physical and tensile properties of ethylene propylene diene monomer (EPDM) filled by halloysite nanotubes (HNT). EPDM/HNT nanocomposite was prepared by mixing 0–100 parts per hundred rubbers (phr) of HNTs with EPDM on a two-roll mill. XRD can confirm the presence of structures with limited intercalation of HNTs in EPDM matrix and can be attributed to the formation of nanocomposites. The microstructures of EPDM/HNT nanocomposites with 10 and 100 phr of HNT loading were also observed by TEM reveal that good dispersion of HNTs inside the EPDM matrix and three dimensional. There were found inter-tubular interactions between HNTs and EPDM. A zig-zag structure was formed by edge-to-edge and face-to-edge interactions between the HNTs. At high HNT loading (100 phr), not only do they avoid agglomeration, but also they tend to create zig-zag structures. Consequently, with increasing HNT content, the amount of zig-zag structures was increased, which are the main reasons for the simultaneous increases in tensile strength, stiffness and ductility of EPDM/HNT nanocomposites. TGA results clearly show the decreasing trend in maximum weight losses of EPDM/HNT nanocomposites with increase of HNT loading from 0 to 100 phr. Indicating good thermal stability of EPDM/HNT nanocomposites. And the flammability ranking based on UL-94 vertical burn test, the addition of HNTs from 0-100 phr had reduced the flammability of EPDM/HNT nanocomposites.
Lee, J. et al. [51] studied the properties of nano-ZnO/PVA/polyethylene oxide (PEO) composite thin films, to explore the possibility that the mechanical and electronic properties of ZnO in the form of nanoparticles. A series of PVA/nano-ZnO composites were prepared by dispersing nano-ZnO in aqueous solutions containing
17
mixtures of the PVA and PEO, and composite thin films were prepared by casting. Ultraviolet absorption, thermal behaviour and visco-elastic properties of the thin films were determined as a function of nano-ZnO content up to 15 wt%. The resistivity measurement of PVA/nano-ZnO suspensions in water indicated with increasing concentration of ZnO the resistivity decreases. SEM image of the surface nanocomposites cast films are optimized by inclusion of 1 wt% ZnO nanoparticles. At higher nanoparticle loading the particles tend to agglomerate. The UV–Vis transmission of films, nano-ZnO particles not only absorbs UV light, but also scatters visible light. Nano-ZnO PVA and PEO suspensions of 1% ZnO have better transmission of visible light compared to higher ZnO concentrations. For PVA, the value of Eʹ does not change. The addition of PEO to PVA decreases the Eʹ value of the thin film. A significant increase in Eʹ of the composite is clearly seen with the addition of 1% ZnO. That means the properties of the cast films are optimised by inclusion of 1 wt% ZnO nanoparticles.
Gong, Guan et al. [52] studied the tensile behavior, morphology and viscoelastic analysis of cellulose nanofiber (CNF) reinforced polyvinyl acetate (PVAc). The PVAc/CNF composites were prepared by using the twin screw extrusion technique. The tensile strength and modulus of PVAc increased with increasing CNF content. The fractured surfaces after the tensile tests of the nanocomposites showed bridging of CNFs inside the micro-cracks, indicates good stress transfer and limited plastic deformation. DMA study shows the storage modulus increased for all nanocomposites compared to the matrix. Tan delta slightly shift and broadening with increased CNF content. The activation energy for the transition increased with increased CNF content, this indicates the entanglement of CNFs and/or the PVAc/CNF interaction that restricts the segmental mobility of PVAc chains. The creep study showed that CNFs improved the elasticity of PVAc and strongly restricted the viscous flow of PVAc chains, thus improving the creep resistance of PVAc effectively.
2. Polyvinyl alcohol nanocomposites
Zidan, H.M. [53] studied the effect of AgNO3 filling with different amounts to investigate the UV-irradiation on the structure of PVA and morphology of PVA films. PVA films with various AgNO3 filler were prepared by a casting method. The DSC implied the presence of two different phases, with two different melting points, one phase was the pure PVA and the other was assumed to be a PVA–Ag+ complex phase. The transition at about 351K is preferably attributed to the glass transition (Tg) relaxational process resulting of the main-chain backbone. There is another exothermic peak at about 443K which is attributed to the α-relaxation associating the crystalline regions. The magnitude of Tg of the pure PVA is greater than those for the filled samples, but the α-relaxation temperature Tα is smaller. This may be due to the greater crystallinity or formation of another crystalline phase in filled samples. The optical absorption spectra of the un-irradiated films indicated the existence of the isolated and conjugated carbonyl groups which are normally found in PVA. Moreover these films were characterized by a broad and strong peak at 433 nm which was assigned to PVA–Ag+ chelate. The X-ray analysis confirmed the presence of two
18
different crystalline phases, which agrees with the DSC and optical absorption findings.
Song Ie Song et al. [7] studied the rheological features of PVA solutions in water-containing solvents with different hydration states. Two organic solvent systems containing equimolar ratio of water but different association strength were chosen, dimethyl sulfoxide (DMSO)/water and N-methyl morpholine N-oxide/water (NMMO monohydrate). The rheological properties of PVA solutions in the solvents were investigated and compared. The results indicated in dilute concentration regime, NMMO monohydrate gave higher intrinsic viscosity than DMSO/water. In high concentration regime, DMSO/water exhibited gave much lower power-law index than NMMO monohydrate. Storage modulus against loss modulus, both solutions exhibited slight decrease with increasing concentration. In addition, NMMO monohydrate gave tan δ greater than one at low frequency whereas DMSO/water gave tan δ much less than one over the entire frequency range examined. Further, the frequency to cause gelation was decreased with increasing concentration in the case of NMMO monohydrate. This indicates that PVA/DMSO/water system is more heterogeneous because weakly bonded water molecules produce hydrogel structure.
Jayasekara, R. et al. [54] studied the preparation, surface modification and characterization of solution cast starch PVA blended films. PVA has been blended with starch and glycerol to form polymer films. The blend containing 20% polyvinyl alcohol has been modified by application of chitosan to the surface. AFM results found air contact increases the degree of surface roughness dramatically and the starch surfaces are considerably rougher than the PVA surfaces. Blending of the PVA and starch creates surfaces intermediate in surface roughness between the two components and this is only slightly modified by the addition of chitosan. UV data obtained for PVA solutions provide similar evidence for the presence of carbonyl functional groups and support the FTIR data. Water contact angle will increase with increasing surface hydrophobicity. According to the results starch film surfaces have higher water contact angle than PVA. From this data it can be stated that starch film surfaces are hydrophobic and PVA film surfaces are hydrophilic. SEM technique confirms some of the expected properties of the surfaces related to drying and also confirms that the addition of chitosan makes the surface of blended film a little less rough. XRD found that blended films have shown some degree of crystallinity. The solution casting process has reduced the overall crystallinity in the blended films from the values in the original powder.
Wei Chen et al. [55] studied the mechanical properties and morphological characterizations of PVA–carbon nanotube composite films. PVA composite films with different carbon nanotubes loadings were fabricated by using the wet-casting method. Raman spectroscopy was used to ensure the presence and track the concentration of CNTs in the composite films, found that Raman spectrum of the pristine MWNTs is also shown in the inset. The CNTs loading levels were clearly detected by characteristic peaks of MWNT tangential modes. The results of tensile tests in terms of Young’s modulus, strength and toughness of the films show that overall mechanical properties of the CNTs composites were significantly improved as compared to the neat PVA film. DSC measurements were shown a large melt peak
19
and the area under the melt peak increases with the nanotube content, which may indicate a growing PVA crystallinity as a result of the polymer/CNTs interaction, where CNTs may act as nucleation sites. SEM observations of fracture surfaces of PVA/MWNTs composites are shows that the MWNTs disperse well through the PVA and exhibit an excellent wetting by the matrix, indicates that a strong interfacial adhesion, which are response for significant enhancements in mechanical properties.
Zheng Peng et al. [3] studied the dynamic mechanical properties of PVA/silica (SiO2) nanocomposites with different SiO2 contents. The nanocomposites were synthesized by employing a novel self-assembly monolayer (SAM) technique and investigated by conducting dynamic mechanical analysis (DMA) and quasi-thermal mechanical analysis (Q-TMA). It’s found that the storage modulus (Eʹ) of pure PVA/SiO2 nanocomposites increases with SiO2 content than Eʹ of pure PVA. The temperature dependence loss factor (tgα) of the nanocomposites is lower than pure PVA, in other words, the loss angle of PVA is bigger than that of prepared nanocomposites. It’s suggests that the ability for absorbing energy of PVA should be stronger than that of nanocomposites. The Tg increases with increasing SiO2 content and reaches a maximum at SiO2 content of 5 wt% like as the activation energy (Ea), then gradually decrease.
Yuezhen Bin et al. [56] studied morphology, mechanical and electrical properties of oriented PVA– vapor growth carbon fiber (VGCFs) and PVA– multi wall carbon nanotubes (MWNTs) composites. PVA/MWNTs and PVA/VGCFs composites were prepared by gelation/crystallization from a mixed solvent of DMSO and water with 60/40 composition. The diffraction of X-ray and SEM observation revealed that VGCFs and MWNTs were highly oriented in the stretching direction in accordance with the orientation of PVA chains. From the SEM patterns, suggested that that the MWNT networks seemed to be better wetting with matrix and without pulling out in the cross-section compared with the PVA/VGCFs composites. The Young’s modulus of PVA/VGCFs composite was increased linearly when VGCFs content increased to 30 wt%. But the Young’s modulus for PVA/MWNTs decreased slightly when MWNT’s content was beyond 3 wt%. Therefore, the mechanical properties of the PVA composite films were improved significantly by adding VGCFs and MWNTs. Thus, the MWNTs may be expected to be more effective to improve the mechanical properties of composites than the VGCFs. The electrical conductivity for the PVA/MWNTs composites containing 5 wt% of MWNTs was independent of the draw ratio up to eight-fold, implying a possibility of improvement of mechanical property and electrical conductivity at the same time. The thermal stability of PVA composite was promoted greatly by adding MWNTs.
Hongmei Wang et al. [57] studied the synthesis and characterization of cadmium sulfide (CdS)/PVA nanocomposite films. CdS/PVA nanocomposite films were prepared by means of the in situ synthesis method via the reaction of Cd2+-dispersed poly vinyl-alcohol (PVA) with H2S. The XRD results indicated the hexagonal phase of CdS nanoparticles in the PVA matrix. The formation of CdS nanoparticles can be also confirmed by photoluminescence (PL) spectroscopy. The UV–Vis spectra of the CdS/PVA nanocomposite films were indicating quantum confinement effect. TEM image directly showed the average particle sizes gradually
20
increased with increasing Cd salt amount. The interaction between Cd(S) and PVA was studied by FTIR spectra, which were used to monitor the formation of CdS/PVA nanocomposite films. The FTIR spectra in different assembly stages were shown two characteristic bands. This finding demonstrated that Cd2+ had reacted with S2- to generate CdS crystalline. The obtained results from TGA indicated that incorporation of CdS nanoparticles significantly altered the thermal properties of PVA matrix. The thermal decomposition temperature of CdS/PVA nanocomposite film lowered compared to pure PVA film. It could be explained as the interactions between PVA with CdS led to the decrease of intermolecular interaction between the PVA chains and the crystalline degree, thus thermal stability of PVA filled with CdS nanoparticles was depressed.
García-Cerda, L.A. et al. [58] studied the preparation and characterization of polyvinyl alcohol (PVA)–cobalt ferrite (CoFe2O4) magnetic nanocomposites. The PVA/ CoFe2O4 nanocomposites were prepared by in situ process and characterized by X-ray diffraction, infrared spectroscopy and vibrating sample magnetometry. The tridimensional networks of PVA acts like a confined space to limits the growth of the CoFe2O4 particles, controls the size and also prevents the agglomeration of the particles. XRD confirmed the presence of CoFe2O4 nanoparticles in the PVA matrix. The temperature causes precipitation of the magnetic phase, which this related directly to the value of the magnetization. The magnetization values were 0.57 and 2.92 emu/g for the samples obtained at 60 and 80°C, respectively. According to changing the temperature of the solution in the obtaining process, we can obtain nanocomposites with different magnetic properties.
Xin Jia et al. [59] studied the preparation and properties of poly(vinyl alcohol)/silica nanoparticles (PVA–SNs) nanocomposites, were prepared by in-situ radical copolymerization of vinyl silica nanoparticles functionalized by vinyltriethoxysilane (VTEOS) and vinyl acetate with benzoyl peroxide, subsequently saponified via direct-hydrolysis with NaOH solution. TEM found the better dispersed in methanol because the agglomeration of original silica nanoparticles was decreased due to the reaction with VTEOS. SEM shown some silica nanoparticles were appeared in PVA–SNs, this indicated copolymerization of PVA and vinyl silica nanoparticles had occurred. DSC trace of PVA and PVA–SNs materials were shown increasing of the content of silica nanoparticles, PVA–SNs materials’ Tg also increased. PVA–SNs materials’ Tm was found to be lower than the bulk PVA. The results implied the crystalline of PVA decreased because silica nanoparticles appended to PVA prevented the interaction of main chain and the formation of hydrogen bond. The mechanical properties were obvious that Young’s modulus and tensile strength increased with increasing silica nanoparticles content. Especially, strong chemical bonds between the polymer and inorganic nanoparticles resulted in significantly improvement of thermal and mechanical properties. It indicated that the interfacial actions between polymer and inorganic components were very important for their enhancement of hybrid properties.
Zheng Peng et al. [60] studied the thermal degradation mechanism of a novel polyvinyl alcohol/silica (PVA/SiO2) nanocomposite. PVA/SiO2 nanocomposites were prepared by combining solution compounding with self-assembly technique. It’s
21
found that two distinct and well-separated turns in the thermogravimetric (TG) curves and two corresponding weight-loss peaks in derivative thermogravimetric (DTG) curves for the pure PVA. Thus, the thermal degradation of PVA can be roughly regarded as a two-step-degradation. Due to the presence of SiO2, the two distinct and well-separated and two corresponding weight-loss peaks of TG/DTG curves of the nanocomposite shift to higher temperatures. Therefore, the PVA/SiO2 nanocomposite is more thermally stable than the pure PVA. Furthermore, it was found that degradation temperature for both PVA and nanocomposite linearly increases with the heating rate. The first degradation step is eliminating reactions of linear and aliphatic polymers including polyvinyl chloride (PVC) and PVA via dehydrochlorination or dehydration. After the first step of degradation, the residuals from elimination reactions mainly include high-molecular-weight polyenes, which are further degraded to low-molecular-weight polyenes. As the second step of thermal degradation occurs at higher temperatures compared to the first step. The main degradation products of this step are acetaldehyde, low-molecular weight polyenes, benzenoid derivatives, furan, acetone and acetic acid, it becomes more complex. At this step, the degradation is dominated by the chain-scission reactions, side-reactions and cyclization reactions.
Krklješ, A.N. et al. [61] studied the synthesis and characterization of Ag-PVA nanocomposites with different contents of inorganic phase. The Ag-PVA nanocomposites were prepared by reduction of Ag+ ions in aqueous PVA solution by gamma irradiation followed by solvent evaporation. IR spectroscopy indicated that Ag nano-filler interact with PVA chain over OH groups, as well as decrease of the content of crystalline PVA phase with the increase of the content of inorganic phase. UV–Vis spectroscopy was using to investigate the optical properties of the colloidal solutions and the nanocomposite films. The decreases of heat resistance upon the increase of the content of inorganic phase are correlated to the adsorption of polymer chains on the surface of Ag nanoparticles, followed by DSC analysis. TEM and XRD show the cubic crystal structural characterization of the Ag nanoparticles.
Lu, Jue et al. [62] studied the preparation of microfibrillated cellulose (MFC)–PVA composite films, and the thermal and mechanical properties of these films. MFC was separated from kraft pulp by a mechanical process, was used as the reinforcement in polyvinyl alcohol (PVA) matrix. MFC–PVA Composite films with different loadings of MFC were prepared by careful mixing of PVA water solution and MFC suspension, followed by film casting and controlled water evaporation. TEM observed, found this MFC reinforcement has an interconnected web-like structure with fibrils having a diameter in the range of 10–100 nm. SEM images show that the transparency of the resulting films confirms the homogeneous dispersion of MFC in PVA. The composites exhibit an increase in the concentration of white dots of MFC on the fractured surface with increasing of fiber loading from 5 to 15 wt%, but the uniform distribution is still preserved. DMA showed an increase of storage tensile modulus in the glassy state with increasing MFC content and also showed that the rubbery modulus of composite films is significantly improved by the incorporation of MFC. The thermal stability of the PVA composite films is slightly increased with the addition of MFC as observed by TGA.
22
Yajuan Yang et al. [63] studied the poly(vinyl alcohol)(PVA)/exfoliated α-zirconium phosphate (e-α-ZrP) nanocomposites of various compositions were prepared by a solution casting method. The α-ZrP compound was synthesized by refluxing. The characteristic properties of the PVA/e- α-ZrP composite films were examined via differential scanning calorimetry (DSC), thermal gravimetric analysis (TGA), X-ray diffraction (XRD), scanning electron microscopy (SEM) and tensile tests. The results from XRD and SEM suggest that the exfoliated α-ZrP layers are dispersed in the PVA matrix. PVA and e-α-ZrP possess good miscibility, which results from hydrogen bonding. TGA and DSC measurements are shown an improvement in the thermal stability of the nanocomposite films containing 1 wt.% of e-α-ZrP. Compared to the neat PVA, tensile tests indicated that with the loading of e-α-ZrP, the tensile strength and the elongation at break were increased.
Gautam, Anurag et al. [64] studied the influence of the silver Ag-content on the mechanical and current–voltage (I–V) characteristic of nanocomposite films with the support of optical and morphological analysis of Ag-PVA nanocomposite films. Metal–polymer hybrid nanocomposites have been prepared from an aqueous solution of PVA and silver nitrate (AgNO3). The silver nanoparticles were generated in PVA matrix by the reduction of silver ions with PVA molecule at 60–70°C over magnetic stirrer. X-ray diffraction analysis reveals that silver metal is present in face centered cubic (fcc) crystal structure. Average crystallite size of silver nanocrystal is 19 nm, which increases to 22 nm on annealing the film at 150°C in air. The UV–Vis spectrum shows a single peak at 433 nm, arising from the surface plasm on absorption of silver nanocolloids. This result clearly indicates that silver nanoparticles are embedded in PVA matrix. An improvement of mechanical properties (storage modulus) was also noticed due to a modification of PVA up to 0.5 wt% of silver content. The current–voltage (I–V) characteristic of nanocomposite films shows increase in current drawn with increasing Ag-content in the films.
3. Polyvinyl alcohol/Titanium dioxide nanocomposites
Yingxu Chen et al. [65] used TiO2 as a mediated of polyvinyl alcohol (PVA) to studied the photocatalytic degradation of PVA in suspension system. PVA/TiO2 suspensions were equilibrated for 1 h in the dark prior to the irradiation experiment with two 6W (Emax= 365 nm) UV lamps as light source. The effects of initial concentration, pH and the addition of H2O2 on the rate of degradation of PVA were studied. The effect of initial PVA concentration on degradation rate was obvious that the rate increases with increasing PVA concentration. PVA at initial concentration (30 mg/l) was degraded after 1 h. This was contrast to 2.1% degradation for the same experiment performed in the absence of TiO2, and only 1.2% when the UV lamps had switched off to occur in the darkness. The effect of pH on the degradation of PVA was found that was more effective for PVA to be degraded under acidic or alkaline condition. For 1 h, the decompositions were above 60% efficiency at acidic and alkaline conditions and there was only 55.3% efficiency at neutral condition. And the photocatalytic degradation rates for adding H2O2 could also be increased efficiently with the addition of H2O2 concentration up to 5 mmol/l. The results indicated that the degradation rates of PVA were obviously affected by the initial concentrations, pH and H2O2 addition.
23
Sairam, Malladi et al. [66] studied the dense PVA/TiO2 mixed matrix membranes for pervaporation separation of water–isopropanol mixtures at 30°C. PVA/TiO2 mixed matrix membranes have been prepared by incorporating nano-sized titanium dioxide and titanium dioxide surface modified with polyaniline (PANI) into PVA and crosslinked with glutaraldehyde (GA). FTIR spectra of TiO2, PVA, PVA/TiO2 mixture and PVA/TiO2 membrane have been scanned, suggests that there is no interaction between TiO2 and PVA. XRD implies that GA crosslinks with the reactive –OH groups of PVA in the crystalline realm resulted in a compression of the amorphous regions of the matrix, thereby making the structure more compact. DSC show that the ordered combination of PVA decreased due to crosslinking as well as the presence of TiO2. The mixed matrix membranes have presented infinite values of selectivity to water. Of all the membranes studied, PVA/TiO2/PANI-0.5 membrane has shown the highest degree of swelling. The membranes of this study are appearing to have great potential for future applications in dehydrating isopropanol by pervaporation.
Chun-Chen Yang [67] studied the synthesis and characterization of the cross-linked PVA/TiO2 composite polymer membrane for alkaline direct methanol fuel cell (DMFC). The PVA/TiO2 composite polymer membrane was prepared by a solution casting method. Glutaraldehyde (GA) was used as a cross-linker for the composite polymer membrane. The properties of the cross-linked composite polymer membrane were characterized by thermal gravimetric analysis (TGA), X-ray diffraction (XRD), scanning surface microscopy (SEM), and ac impedance method. The XRD measurement found the degree of crystallinity is decreased indicates that the cross-linked PVA/TiO2 polymer membrane becomes more amorphous. SEM photographs found that the nano-TiO2 particles were not dispersed well within the PVA polymer matrix. The cross-linked PVA/TiO2 composite membranes show greater thermal properties is observed by TGA and it shows the good electrochemical stability of the DMFC. These cross-linked PVA/TiO2 composite polymer membranes show a highly potential applicant for the DMFC applications.
Mallakpoura, S. et al. [10] studied the efficient preparation of hybrid PVA/TiO2 nanocomposite coatings with different TiO2 nanoparticle content by ultrasonic irradiation process. The surface of TiO2 nanoparticles was modified with γ-aminopropyl triethoxysilane as a coupling agent. These nanocomposites coating were used for fabrication of PVA/TiO2 films via solution casting method. TEM and SEM results indicated that the surface modified nanoparticles were dispersed homogeneously in PVA matrix on nanoscale. The surface of TiO2 nanoparticle was modified with silane coupling agent to avoid the aggregation and dispersed homogeneously within the polymer matrix. TGA confirmed that the heat stability of the nanocomposite was improved. The thermal decomposition of pure PVA and its nanocomposites are similar. But the nanocomposites have higher thermal stability than that of pure PVA. The degradation temperature of the nanocomposites was slightly increased with TiO2 content. The UV absorption spectra show that the typical steep absorption of titania nanoparticles was seen below 350 nm. The increase in TiO2 nanoparticle loadings leads to increased absorption percentage in UV wavelength region. The results showed that this type of films could be used as a coating to shield against UV light. The characterizations of the molecular structure of the

24
nanocomposites indicate that chemical interaction occurs between the modified inorganic and organic counterpart. These mean the PVA/TiO2 nanocomposites synthesized by this novel method might be potentially applied in the industrial coating to shield against UV light.
4. Polymer nanocomposites with surfactant
Scienza, Lisete C. et al. [68] studied the preparation and surface analysis of polypyrrole (PPY)/sodium dodecyl benzenesulfonate (SDBS) films on aluminum substrates. PPY films were created on high purity aluminum substrates under polarization from electrolytes contained of pyrrole and SDBS. The procedure employed to characterize the polymer films included scanning electron microscopy (SEM), Fourier-transform infrared (FTIR) and X-photoelectron spectroscopy (XPS) and X-ray diffraction (XRD). SEM images of the PPY/SDBS film on aluminum are shown three-dimensional growth of hemispherical deposits for the PPY film formed. In the XPS survey spectrum for the PPY/SDBS film, revealed that nitrogen occurs in two different oxidation states in polymer, amine-like and positively charged nitrogen. The protonation occurs favorably at imine nitrogen groups and the dodecyl benzenesulfonate anion is present in excess associated to the positively charged nitrogen. FTIR spectra showed the presence of organic groups expected in PPY films. The occurrence of the peak corresponding to N-H indicates that pyrrole moieties are possibly present. The XRD diffractogram for PPY/SDBS films shows a highly amorphous structure. The high intensity of the low-angle peak signify a relatively degree of anion order in this system.
Su, Shengpei et al. [69] studied the thermal stability of polystyryl surfactants and their modified clay nanocomposites. The thermal stability does vary based on the identity of the nitrogen or phosphorus mean to which the oligomeric styrene unit is attached. Five oligomeric styrene surfactants, N,N,N-trimethyl polystyrylammonium (TMA), N,N-dimethyl-N-benzyl polystyrylammonium (DMBA), N,Ndimethyl-N-hexadecyl polystyrylammonium (DMH), 1,2-dimethyl-3-polystyrylimidazolium (DMID), and triphenyl polystyrylphosphonium chlorides (TPP) were choose. Five surfactants were synthesized and used to prepare organically modified clays. The nanocomposites were prepared by melt blending and the type of nanocomposite was evaluated by X-ray diffraction and transmission electron microscopy. Thermogravimetric analysis (TGA) was used to study the thermal stability of the modified clay nanocomposites. TGA results are shown that the COPS itself has higher thermal stability than do any of the surfactants. The order of thermal stability of 10% mass loss is CTPP>CDMID>CDMH>CTMA>CDMBA. And the thermal stability of the clays is same to that of the salts, except that the imidazolium is more stable than the triphenyl phosphonium, so the degradation pathway is changed and the imidazolium-substituted clay becomes the most stable. Therefore, all of these clays, except the imidazolium, give exfoliated polystyrene nanocomposites. These may prove useful when polymers must be processed at high temperatures to make nanocomposites.
Limpanart, S. et al. [70] studied the effect of the surfactant coverage on the preparation of polystyrene (PS)/clay nanocomposites. The melt intercalation of PS into organoclay with variation in the degree of surfactant coverage by melt
25
intercalation was investigated. The surfactant used in this study is a mixture of dioctadecyl dimethyl ammonium chloride salts with alkyl chain lengths of 18 (58%) and often referred as tallow alkyl ammonium (D18). The controlling of the surface coverage was done by treating the clay with the same surfactant but using a different surfactant loading. Two loading levels at 0.5 (D1805) and 2.0 (D1820) mmol were used. The total weight loss of D1805 and D1820 organoclay due to the surfactant are around 24% and 46%, respectively. Based on the interlayer spacing, they are believed to be single layer packing for D1805 and double layer paraffin like structure for D1820. This suggests a higher coverage of D18 on the clay surface when compared to D1805. XRD shown the D1820 does not exhibit any change in the interlayer spacing in an extruded sample. This indicates that the organoclay stays as microcomposite or conventional composites. TEM image shows a high stacking of the clay layer with the aggregation in micrometer size. The XRD of PS/D1805, representing the nanocomposites with a lower surface coverage organoclay, shows a less ordered structure than PS/D1820. This was confirmed by the TEM where the aggregation in the micrometer size was still observed. This can be explained by fact that the polystyrene shows an affinity toward the organoclay with the low surface coverage.
Mandalia, Tushar et al. [71] studied the effect of surfactant/cation exchange capacity (CEC) ratio of organo clay mineral–melted polyolefin nanocomposites. Montmorillonite (Mt)–polymer nanocomposites are prepared by dispersing solid organoclay minerals in two different melted polyolefin matrices, namely polyethylene (PE) and ethylene vinyl acetate (EVA). The organoclay minerals are prepared by adding different amounts of surfactant corresponding to the CEC of the pristine clay mineral. The XRD diagrams show that increasing the surfactant amount results in a continuous and almost linear increase in the intensity. FTIR result found the intensity increases with increasing initial surfactant content, indicating the intercalation of higher amount of surfactant in the Mt with increasing initial amount. For CEC value, the OMt exchanged which corresponds to a surfactant/CEC ratio. For the higher CEC values, this intensity again increases slightly and becomes higher than the intensity in the pristine Mt. XRD indicated the comparison between the two polymers studied shows that the polar EVA intercalates more easily than the non-polar PE. For all the studied polymers, they can deduced that an addition of a surfactant/CEC ratio corresponding to a range of 1–1.5, always leads to the most interesting compromise between mechanical and thermal properties of the modified clay–polymer nanocomposites. An optimal surfactant/CEC ratio about 1.2 leads to an interlayer distance at the boarder of two configurations, which allows maximum disorder and high entropy.
Chigwada, Grace et al. [72] studied the quinolinium (QC16) and pyridinium (PyC16) surfactants were employed to modify montmorillonite in polystyrene nanocomposites. Polystyrene nanocomposites were prepared by in situ bulk polymerization and direct melt blending process. Two organically-modified clays were prepared by using the pyridinium and quinolinium salts. XRD result suggested that the presence of quinoline as part of the organically-modified clay plays a significant role in enhancing compatibility between the clay and polystyrene. The same result was observed with nanocomposites prepared using PyC16 modified clay. TEM images were found nanocomposites prepared using QC16 modified clay showed
26
tactoids for bulk polymerization while the samples prepared by melt blending had better dispersion. Samples prepared using the PyC16 modified clay show fewer tactoids than the QC16 clay, it seems the melt blended samples have better nano-dispersion than samples prepared by bulk polymerization. TGA analysis shows that the quinolinium modified clay has a higher thermal stability than the pyridinium modified clay. The 50% degradation temperature of the nanocomposites is increased and so is the amount of char from TGA analysis compared to the virgin polymer. The flammability parameters evaluated by cone calorimetric. The results indicate that clay reduces the peak heat release rate and average mass loss rate and thus lowers the flammability of the polymer.
Yan Geng et al. [73] studied the effects of surfactant treatment on mechanical and electrical properties of carbon nanotubes (CNTs) /epoxy nanocomposites. CNTs were treated with a nonionic surfactant, polyoxyethylene octyl phenyl ether (Triton X-100) was chosen as it has been improved on CNT dispersion. The use of a Triton X-100 is proposed to treat CNTs surface for nanocomposite fabrication, which can serve as a bridge between CNTs and epoxy without disturbing CNTs structure. The FTIR analysis was confirm the chemical structure of Triton X-100, the hydrophobic octyl group can interact with CNT through adsorption, while the hydrophilic segment can interact with the epoxy via hydrogen bonding. The microscopic observation using TEM, found significantly loosened after the surface treatment without breakage or shortening of CNTs. And the use of high concentration (10 CMC) had even better dispersion state than the low concentration (1 CMC). DMA analysis was found the glass transition temperatures, Tg, the CNT/epoxy nanocomposites treated with surfactant shown much higher values than the untreated counterpart for the same CNT content. The mechanical and fracture properties displayed significant improvements after the surfactant treatment of CNTs, indicating the surfactant serving as a dispersant and an interfacial coupling agent. The electrical conductivity of the nanocomposites increased with increasing CNT content. For the CNTs without surfactant treatment was slightly lower than the nanocomposites with surfactant treated, indicating little adverse effect due to wrapping of CNTs with surfactant.
Goh, P.S. et al. [74] studied the dispersion of multi-walled carbon nanotube (MWCNTs) in polyetherimide (PEI) nanocomposite membrane with surfactant. Nanocomposite membranes have been fabricated through solution casting by embedding MWCNTs within PEI polymer host matrix. The nanotubes were first treated with surfactants of different charges, namely anionic sodium dodecyl chloride (SDS), cationic cetyl trimethyl ammonium chloride (CTAB) and non-ionic Triton X100, in order to achieve fine dispersion of nanotubes and facilitate strong interfacial adhesion with the polymer matrix. FESEM and AFM confirmed the well distribution of MWCNTs in N-methyl-2-pyrrolidone solvent that the agglomeration and entanglement of the nanotubes were greatly reduced upon the addition of Triton X100. TGA analysis found that the thermal stability of the nanocomposite membranes has been improved upon the addition of the nanotubes. Mechanical strength has proven the capacity of the Triton X100 dispersed in improving the mechanical stability that related to the better dispersion of the nanotubes. The increase in both thermal stability and mechanical strength of the MWCNT/PEI nanocomposite with Triton X100 indicated the improved interaction between MWCNTs and PEI.
27
Donghua Zhou et al. [75] studied the synthesis of polyaniline (PANI) nanofibers with high electrical conductivity from cetyltrimethyl ammonium bromide (CTAB)–sodium dodecyl benzylsulfonate (SDBS) mixed surfactants. The mixed surfactant solution is used to prepare PANI, play double roles of soft templates and dispersion reagents. The influence of CTAB–SDBS ratio is 2:1, which is favorable for the formation of longer PANI fibers with good dispersion. The highest electrical conductivity is achieved in the same ratio of CTAB–SDBS system (2:1), which generated uniformly branched fibers with higher aspect ratio. Therefore, the optimizing of morphology as well as electrical conductivity of PANI can be achieved in a preferable CTAB–SDBS ratio. FT-IR spectra measurement indicated the mixed surfactants have significant effect on the electron density of whole structure as well as the PANI molecular orientation. Hung-Han Ko et al. [76] studied of surfactant modified multiwall carbon nanotubes (MWNTs)/polyiminde (PI) composites by in-situ polymerization to enhance the electrical conductivity of PI. MWNTs were oxidized and modified with anionic surfactant, sodium dodecyl benzenesulfonate (SDBS), to improve their dispersion in PI matrix. The composites were characterized by FTIR, SEM and UV-Vis spectroscopy. From FTIR spectra, the adsorption peak of SDBS can be observed indicating that CNTs was successfully treated with SDBS. SEM images of composites suggest that the aggregation of CNTs can be reduced through the treatment of SDBS surfactant. UV-Vis spectroscopy can detected the absorption peaks, presents the highest absorbance suggests that centrifuge procedure can be uniformly dispersed in the 1-methyl-2-pyrrolodinone (NMP) solution. Thermal stability of the PI composites has improved, observed by TGA analysis. Mechanical properties of PI composite films form tensile strength and elongation suggests that SDBS effectively de-bundle CNTs.
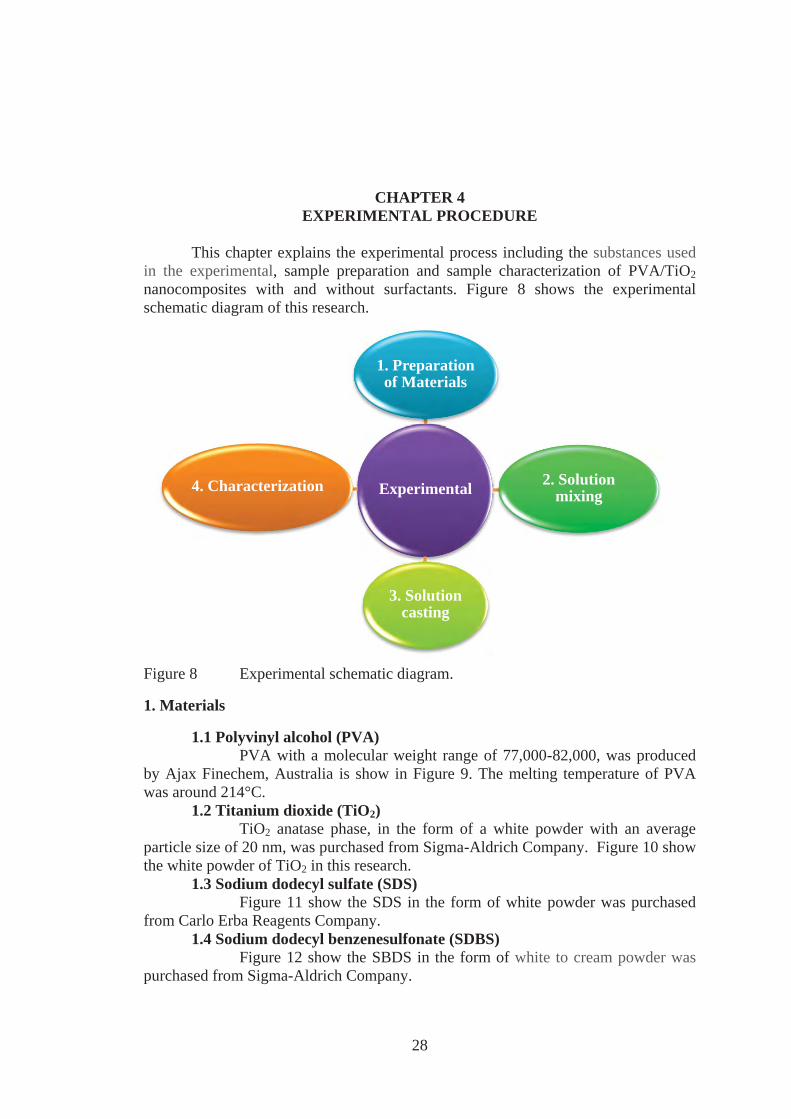
28
CHAPTER 4 EXPERIMENTAL PROCEDURE
This chapter explains the experimental process including the substances used in the experimental, sample preparation and sample characterization of PVA/TiO2 nanocomposites with and without surfactants. Figure 8 shows the experimental schematic diagram of this research.
Figure 8 Experimental schematic diagram.
1. Materials
1.1 Polyvinyl alcohol (PVA) PVA with a molecular weight range of 77,000-82,000, was produced
by Ajax Finechem, Australia is show in Figure 9. The melting temperature of PVA was around 214°C.
1.2 Titanium dioxide (TiO2) TiO2 anatase phase, in the form of a white powder with an average
particle size of 20 nm, was purchased from Sigma-Aldrich Company. Figure 10 show the white powder of TiO2 in this research.
1.3 Sodium dodecyl sulfate (SDS) Figure 11 show the SDS in the form of white powder was purchased
from Carlo Erba Reagents Company. 1.4 Sodium dodecyl benzenesulfonate (SDBS) Figure 12 show the SBDS in the form of white to cream powder was
purchased from Sigma-Aldrich Company.
Experimental
1. Preparation of Materials
2. Solution mixing
3. Solution casting
4. Characterization
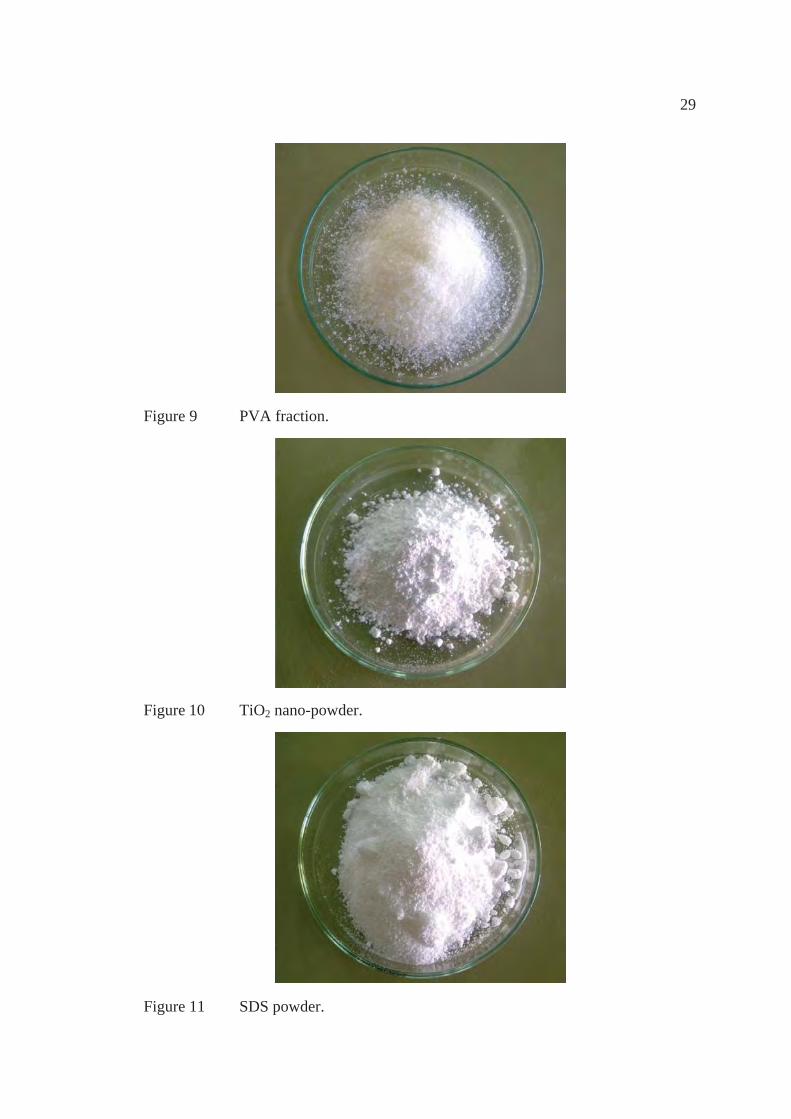
29
Figure 9 PVA fraction.
Figure 10 TiO2 nano-powder.
Figure 11 SDS powder.
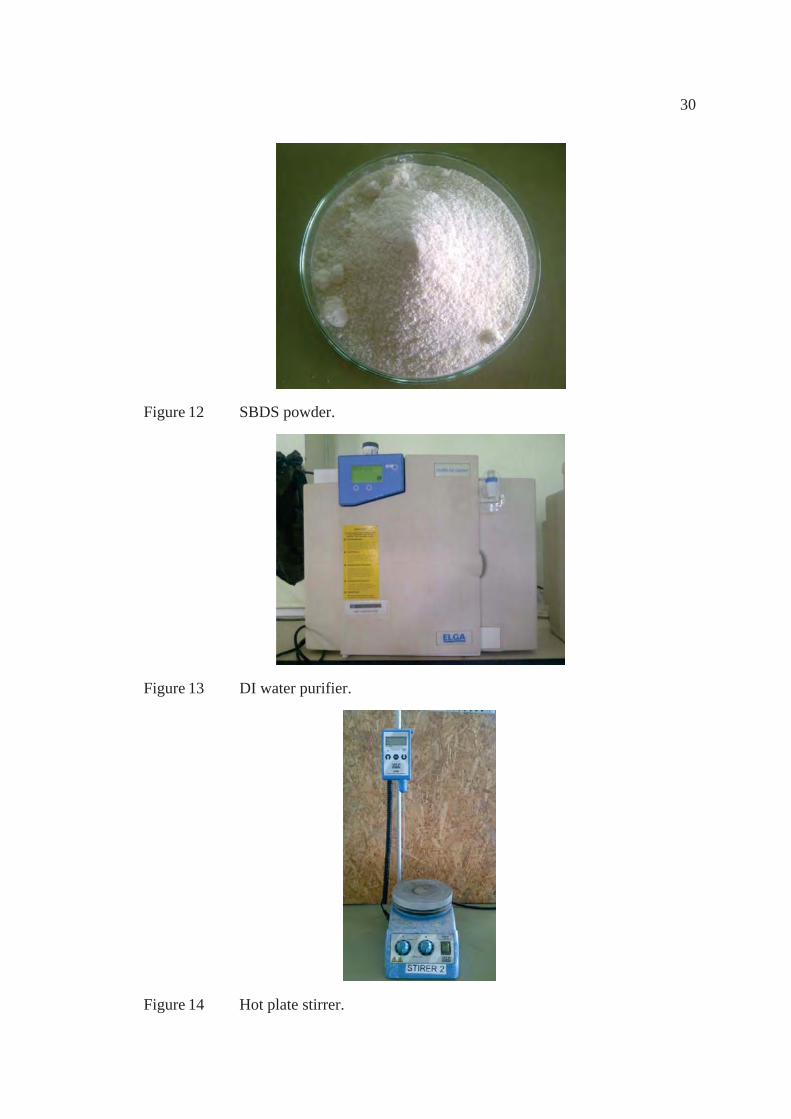
30
Figure 12 SBDS powder.
Figure 13 DI water purifier.
Figure 14 Hot plate stirrer.
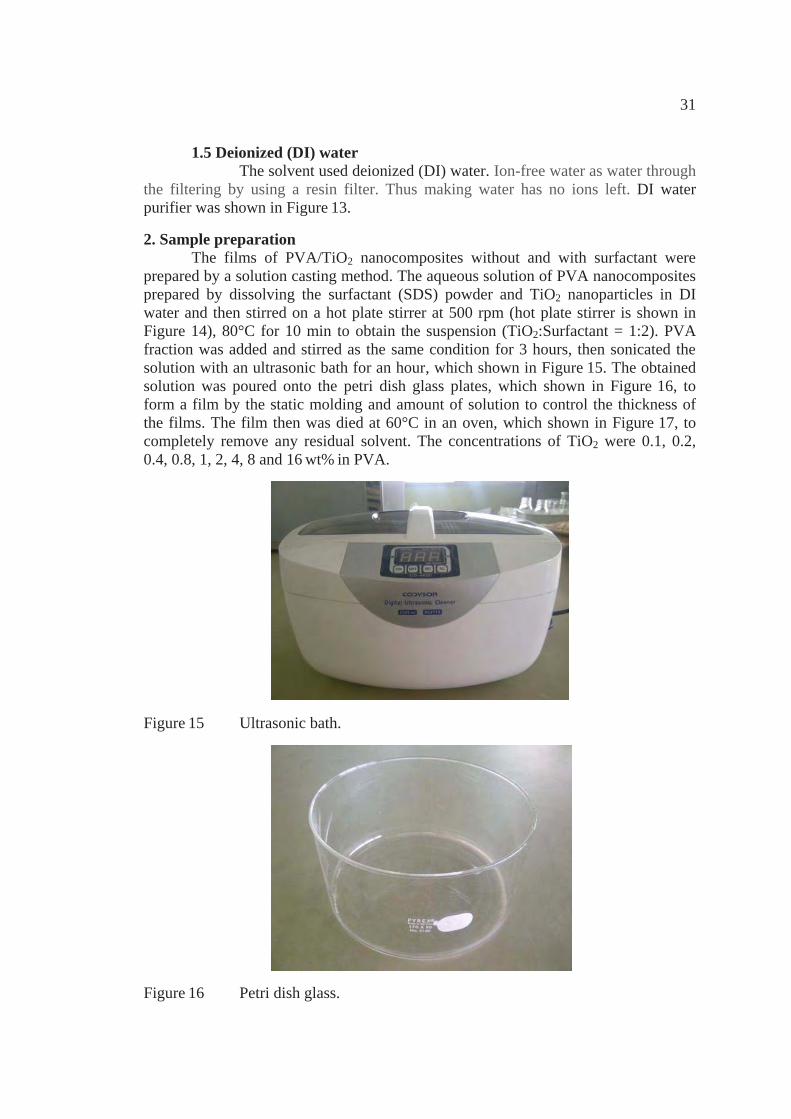
31
1.5 Deionized (DI) water The solvent used deionized (DI) water. Ion-free water as water through
the filtering by using a resin filter. Thus making water has no ions left. DI water purifier was shown in Figure 13.
2. Sample preparation The films of PVA/TiO2 nanocomposites without and with surfactant were prepared by a solution casting method. The aqueous solution of PVA nanocomposites prepared by dissolving the surfactant (SDS) powder and TiO2 nanoparticles in DI water and then stirred on a hot plate stirrer at 500 rpm (hot plate stirrer is shown in Figure 14), 80°C for 10 min to obtain the suspension (TiO2:Surfactant = 1:2). PVA fraction was added and stirred as the same condition for 3 hours, then sonicated the solution with an ultrasonic bath for an hour, which shown in Figure 15. The obtained solution was poured onto the petri dish glass plates, which shown in Figure 16, to form a film by the static molding and amount of solution to control the thickness of the films. The film then was died at 60°C in an oven, which shown in Figure 17, to completely remove any residual solvent. The concentrations of TiO2 were 0.1, 0.2, 0.4, 0.8, 1, 2, 4, 8 and 16 wt% in PVA.
Figure 15 Ultrasonic bath.
Figure 16 Petri dish glass.
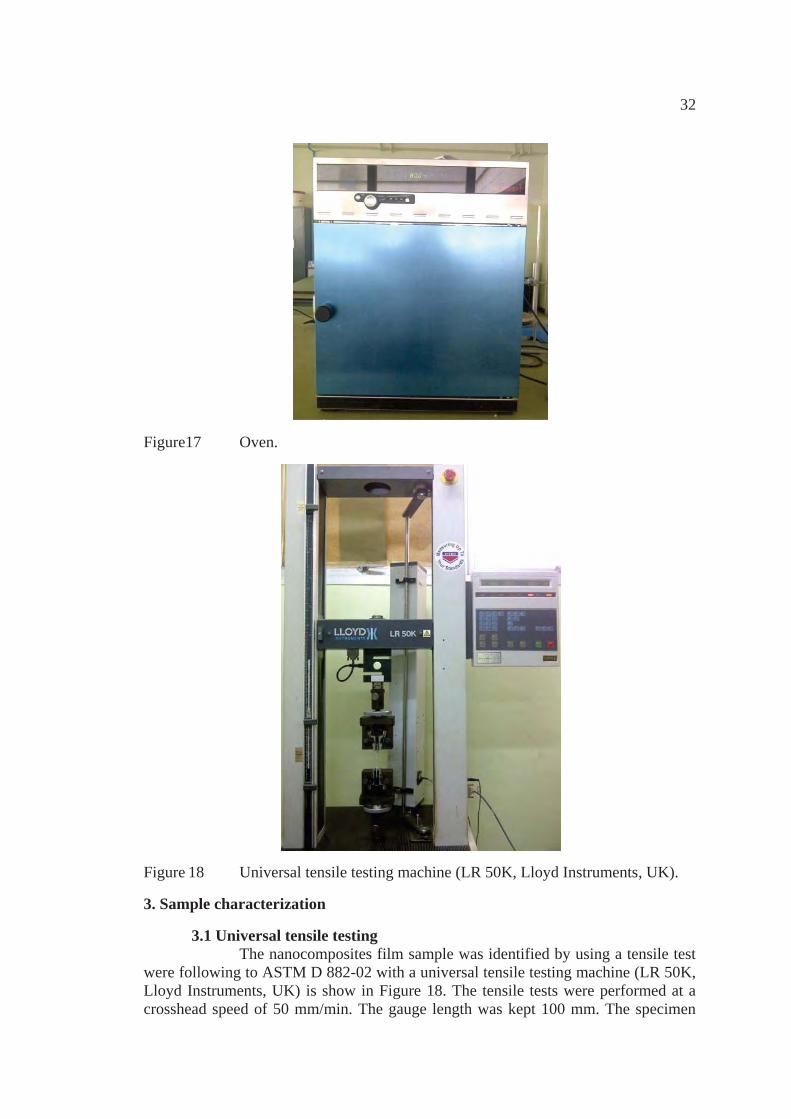
32
Figure17 Oven.
Figure 18 Universal tensile testing machine (LR 50K, Lloyd Instruments, UK).
3. Sample characterization
3.1 Universal tensile testing The nanocomposites film sample was identified by using a tensile test were following to ASTM D 882-02 with a universal tensile testing machine (LR 50K, Lloyd Instruments, UK) is show in Figure 18. The tensile tests were performed at a crosshead speed of 50 mm/min. The gauge length was kept 100 mm. The specimen
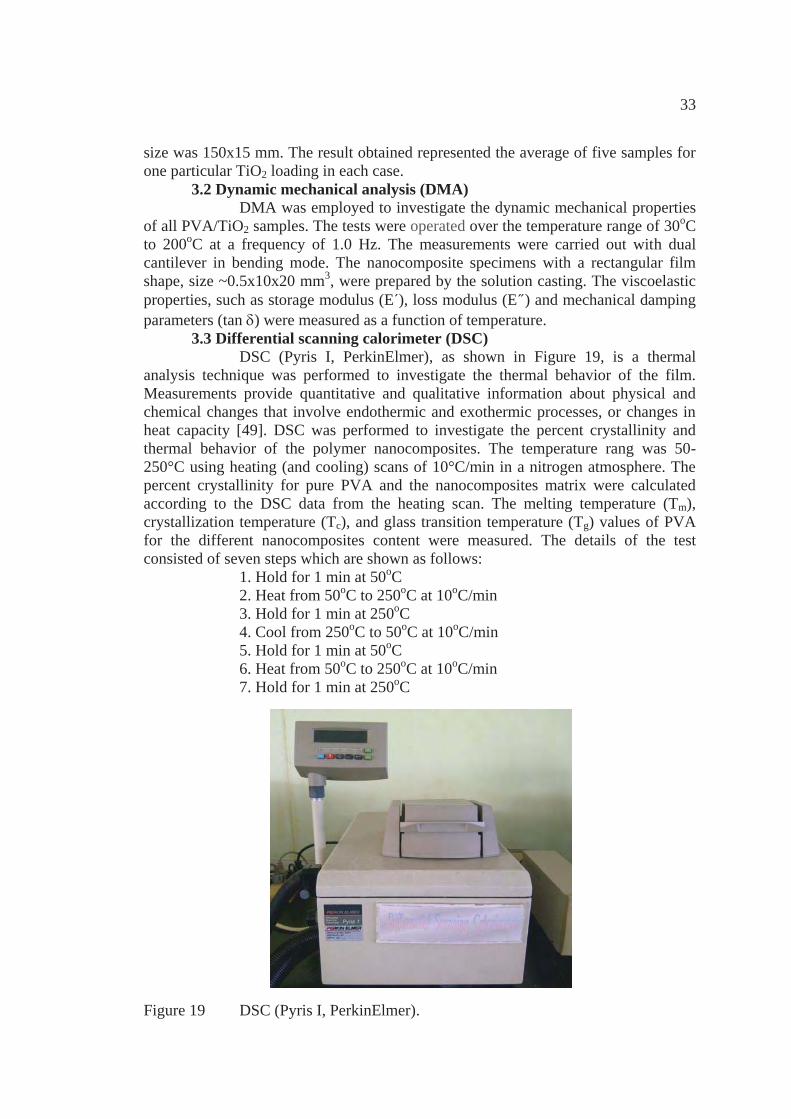
33
size was 150x15 mm. The result obtained represented the average of five samples for one particular TiO2 loading in each case. 3.2 Dynamic mechanical analysis (DMA)
DMA was employed to investigate the dynamic mechanical properties of all PVA/TiO2 samples. The tests were operated over the temperature range of 30oC to 200oC at a frequency of 1.0 Hz. The measurements were carried out with dual cantilever in bending mode. The nanocomposite specimens with a rectangular film shape, size ~0.5x10x20 mm3, were prepared by the solution casting. The viscoelastic properties, such as storage modulus (E´), loss modulus (E˝) and mechanical damping parameters (tan ) were measured as a function of temperature. 3.3 Differential scanning calorimeter (DSC) DSC (Pyris I, PerkinElmer), as shown in Figure 19, is a thermal analysis technique was performed to investigate the thermal behavior of the film. Measurements provide quantitative and qualitative information about physical and chemical changes that involve endothermic and exothermic processes, or changes in heat capacity [49]. DSC was performed to investigate the percent crystallinity and thermal behavior of the polymer nanocomposites. The temperature rang was 50-250°C using heating (and cooling) scans of 10°C/min in a nitrogen atmosphere. The percent crystallinity for pure PVA and the nanocomposites matrix were calculated according to the DSC data from the heating scan. The melting temperature (Tm), crystallization temperature (Tc), and glass transition temperature (Tg) values of PVA for the different nanocomposites content were measured. The details of the test consisted of seven steps which are shown as follows:
1. Hold for 1 min at 50oC 2. Heat from 50oC to 250oC at 10oC/min 3. Hold for 1 min at 250oC 4. Cool from 250oC to 50oC at 10oC/min 5. Hold for 1 min at 50oC 6. Heat from 50oC to 250oC at 10oC/min 7. Hold for 1 min at 250oC
Figure 19 DSC (Pyris I, PerkinElmer).
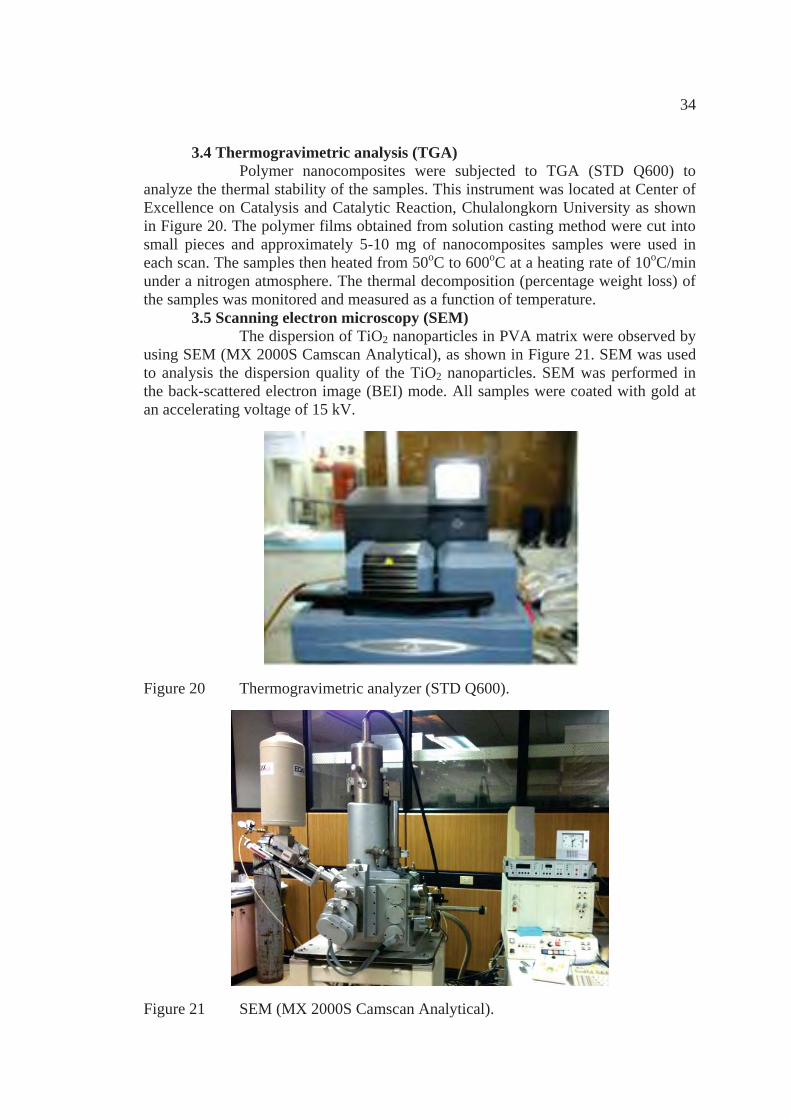
34
3.4 Thermogravimetric analysis (TGA) Polymer nanocomposites were subjected to TGA (STD Q600) to analyze the thermal stability of the samples. This instrument was located at Center of Excellence on Catalysis and Catalytic Reaction, Chulalongkorn University as shown in Figure 20. The polymer films obtained from solution casting method were cut into small pieces and approximately 5-10 mg of nanocomposites samples were used in each scan. The samples then heated from 50oC to 600oC at a heating rate of 10oC/min under a nitrogen atmosphere. The thermal decomposition (percentage weight loss) of the samples was monitored and measured as a function of temperature. 3.5 Scanning electron microscopy (SEM)
The dispersion of TiO2 nanoparticles in PVA matrix were observed by using SEM (MX 2000S Camscan Analytical), as shown in Figure 21. SEM was used to analysis the dispersion quality of the TiO2 nanoparticles. SEM was performed in the back-scattered electron image (BEI) mode. All samples were coated with gold at an accelerating voltage of 15 kV.
Figure 20 Thermogravimetric analyzer (STD Q600).
Figure 21 SEM (MX 2000S Camscan Analytical).
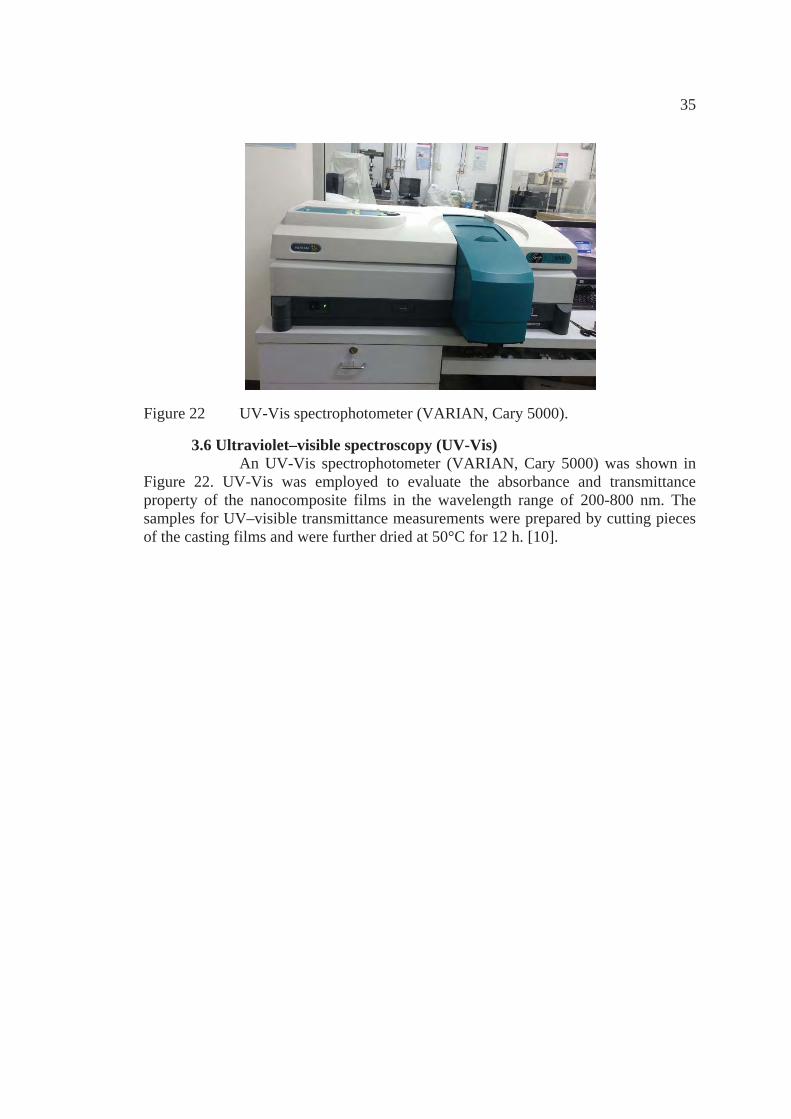
35
Figure 22 UV-Vis spectrophotometer (VARIAN, Cary 5000).
3.6 Ultraviolet–visible spectroscopy (UV-Vis) An UV-Vis spectrophotometer (VARIAN, Cary 5000) was shown in Figure 22. UV-Vis was employed to evaluate the absorbance and transmittance property of the nanocomposite films in the wavelength range of 200-800 nm. The samples for UV–visible transmittance measurements were prepared by cutting pieces of the casting films and were further dried at 50°C for 12 h. [10].
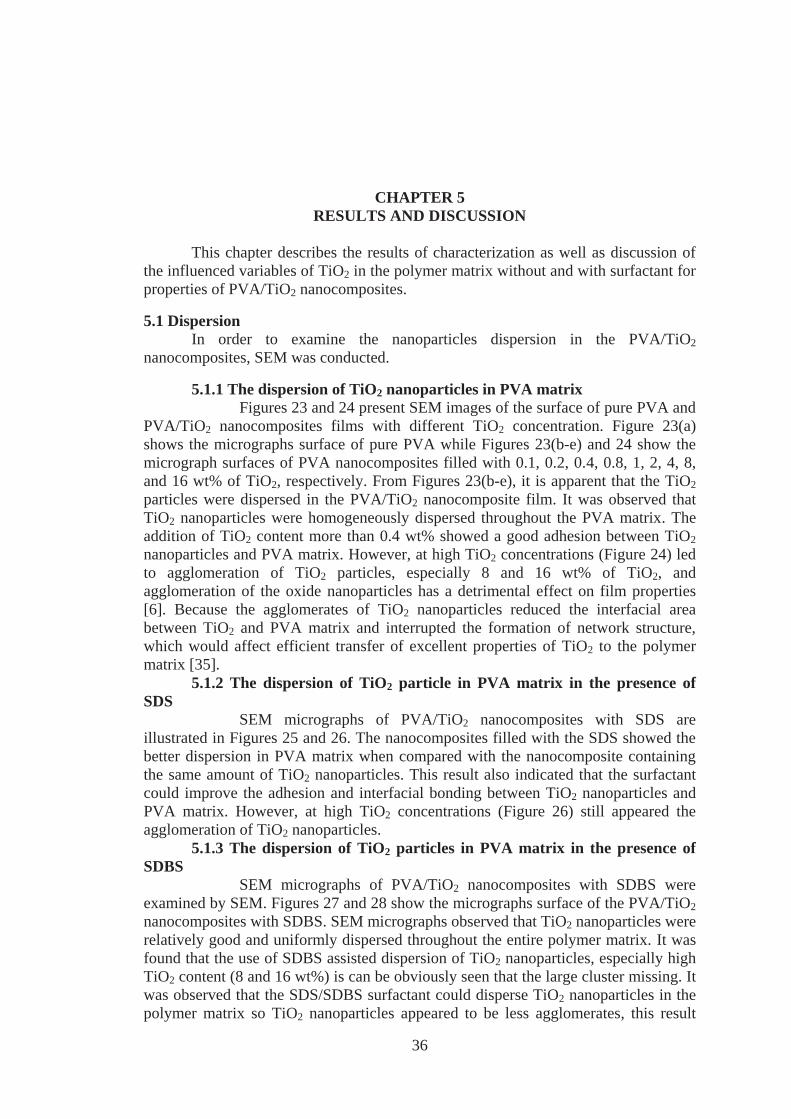
36
CHAPTER 5 RESULTS AND DISCUSSION
This chapter describes the results of characterization as well as discussion of the influenced variables of TiO2 in the polymer matrix without and with surfactant for properties of PVA/TiO2 nanocomposites.
5.1 Dispersion In order to examine the nanoparticles dispersion in the PVA/TiO2 nanocomposites, SEM was conducted.
5.1.1 The dispersion of TiO2 nanoparticles in PVA matrix Figures 23 and 24 present SEM images of the surface of pure PVA and PVA/TiO2 nanocomposites films with different TiO2 concentration. Figure 23(a) shows the micrographs surface of pure PVA while Figures 23(b-e) and 24 show the micrograph surfaces of PVA nanocomposites filled with 0.1, 0.2, 0.4, 0.8, 1, 2, 4, 8, and 16 wt% of TiO2, respectively. From Figures 23(b-e), it is apparent that the TiO2 particles were dispersed in the PVA/TiO2 nanocomposite film. It was observed that TiO2 nanoparticles were homogeneously dispersed throughout the PVA matrix. The addition of TiO2 content more than 0.4 wt% showed a good adhesion between TiO2 nanoparticles and PVA matrix. However, at high TiO2 concentrations (Figure 24) led to agglomeration of TiO2 particles, especially 8 and 16 wt% of TiO2, and agglomeration of the oxide nanoparticles has a detrimental effect on film properties [6]. Because the agglomerates of TiO2 nanoparticles reduced the interfacial area between TiO2 and PVA matrix and interrupted the formation of network structure, which would affect efficient transfer of excellent properties of TiO2 to the polymer matrix [35]. 5.1.2 The dispersion of TiO2 particle in PVA matrix in the presence of SDS SEM micrographs of PVA/TiO2 nanocomposites with SDS are illustrated in Figures 25 and 26. The nanocomposites filled with the SDS showed the better dispersion in PVA matrix when compared with the nanocomposite containing the same amount of TiO2 nanoparticles. This result also indicated that the surfactant could improve the adhesion and interfacial bonding between TiO2 nanoparticles and PVA matrix. However, at high TiO2 concentrations (Figure 26) still appeared the agglomeration of TiO2 nanoparticles. 5.1.3 The dispersion of TiO2 particles in PVA matrix in the presence of SDBS SEM micrographs of PVA/TiO2 nanocomposites with SDBS were examined by SEM. Figures 27 and 28 show the micrographs surface of the PVA/TiO2 nanocomposites with SDBS. SEM micrographs observed that TiO2 nanoparticles were relatively good and uniformly dispersed throughout the entire polymer matrix. It was found that the use of SDBS assisted dispersion of TiO2 nanoparticles, especially high TiO2 content (8 and 16 wt%) is can be obviously seen that the large cluster missing. It was observed that the SDS/SDBS surfactant could disperse TiO2 nanoparticles in the polymer matrix so TiO2 nanoparticles appeared to be less agglomerates, this result
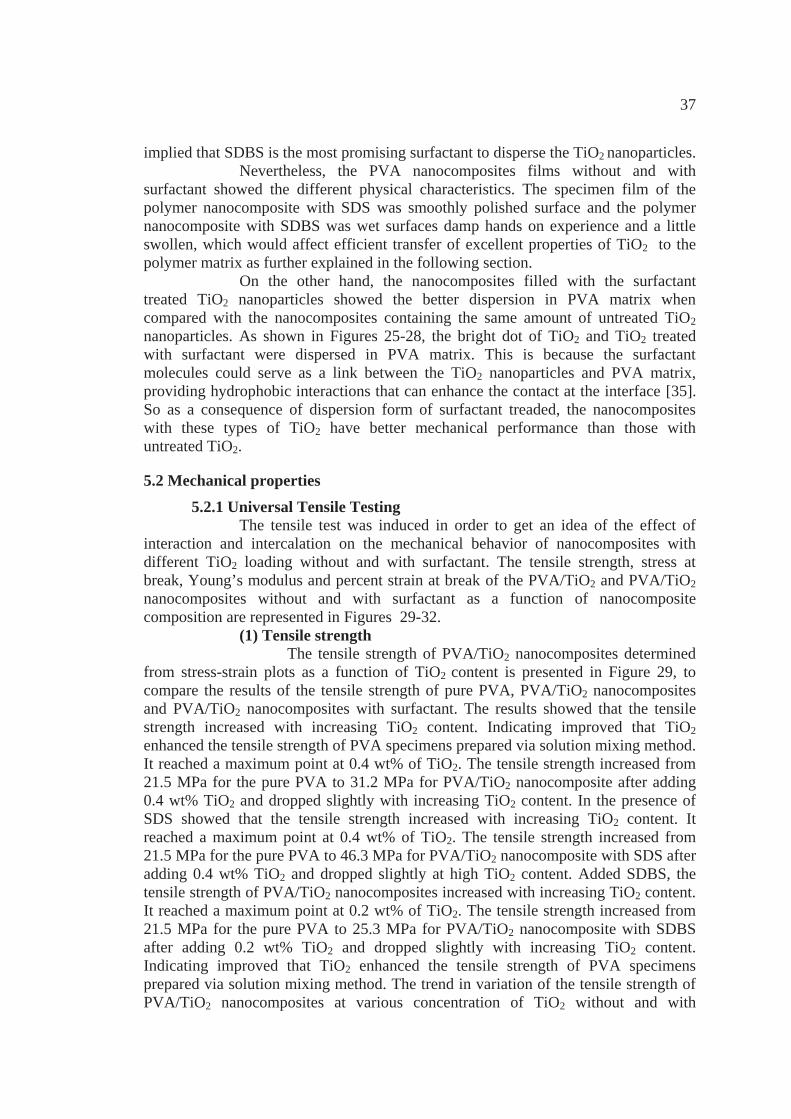
37
implied that SDBS is the most promising surfactant to disperse the TiO2 nanoparticles. Nevertheless, the PVA nanocomposites films without and with surfactant showed the different physical characteristics. The specimen film of the polymer nanocomposite with SDS was smoothly polished surface and the polymer nanocomposite with SDBS was wet surfaces damp hands on experience and a little swollen, which would affect efficient transfer of excellent properties of TiO2 to the polymer matrix as further explained in the following section. On the other hand, the nanocomposites filled with the surfactant treated TiO2 nanoparticles showed the better dispersion in PVA matrix when compared with the nanocomposites containing the same amount of untreated TiO2 nanoparticles. As shown in Figures 25-28, the bright dot of TiO2 and TiO2 treated with surfactant were dispersed in PVA matrix. This is because the surfactant molecules could serve as a link between the TiO2 nanoparticles and PVA matrix, providing hydrophobic interactions that can enhance the contact at the interface [35]. So as a consequence of dispersion form of surfactant treaded, the nanocomposites with these types of TiO2 have better mechanical performance than those with untreated TiO2.
5.2 Mechanical properties 5.2.1 Universal Tensile Testing The tensile test was induced in order to get an idea of the effect of interaction and intercalation on the mechanical behavior of nanocomposites with different TiO2 loading without and with surfactant. The tensile strength, stress at break, Young’s modulus and percent strain at break of the PVA/TiO2 and PVA/TiO2 nanocomposites without and with surfactant as a function of nanocomposite composition are represented in Figures 29-32. (1) Tensile strength The tensile strength of PVA/TiO2 nanocomposites determined from stress-strain plots as a function of TiO2 content is presented in Figure 29, to compare the results of the tensile strength of pure PVA, PVA/TiO2 nanocomposites and PVA/TiO2 nanocomposites with surfactant. The results showed that the tensile strength increased with increasing TiO2 content. Indicating improved that TiO2 enhanced the tensile strength of PVA specimens prepared via solution mixing method. It reached a maximum point at 0.4 wt% of TiO2. The tensile strength increased from 21.5 MPa for the pure PVA to 31.2 MPa for PVA/TiO2 nanocomposite after adding 0.4 wt% TiO2 and dropped slightly with increasing TiO2 content. In the presence of SDS showed that the tensile strength increased with increasing TiO2 content. It reached a maximum point at 0.4 wt% of TiO2. The tensile strength increased from 21.5 MPa for the pure PVA to 46.3 MPa for PVA/TiO2 nanocomposite with SDS after adding 0.4 wt% TiO2 and dropped slightly at high TiO2 content. Added SDBS, the tensile strength of PVA/TiO2 nanocomposites increased with increasing TiO2 content. It reached a maximum point at 0.2 wt% of TiO2. The tensile strength increased from 21.5 MPa for the pure PVA to 25.3 MPa for PVA/TiO2 nanocomposite with SDBS after adding 0.2 wt% TiO2 and dropped slightly with increasing TiO2 content. Indicating improved that TiO2 enhanced the tensile strength of PVA specimens prepared via solution mixing method. The trend in variation of the tensile strength of PVA/TiO2 nanocomposites at various concentration of TiO2 without and with
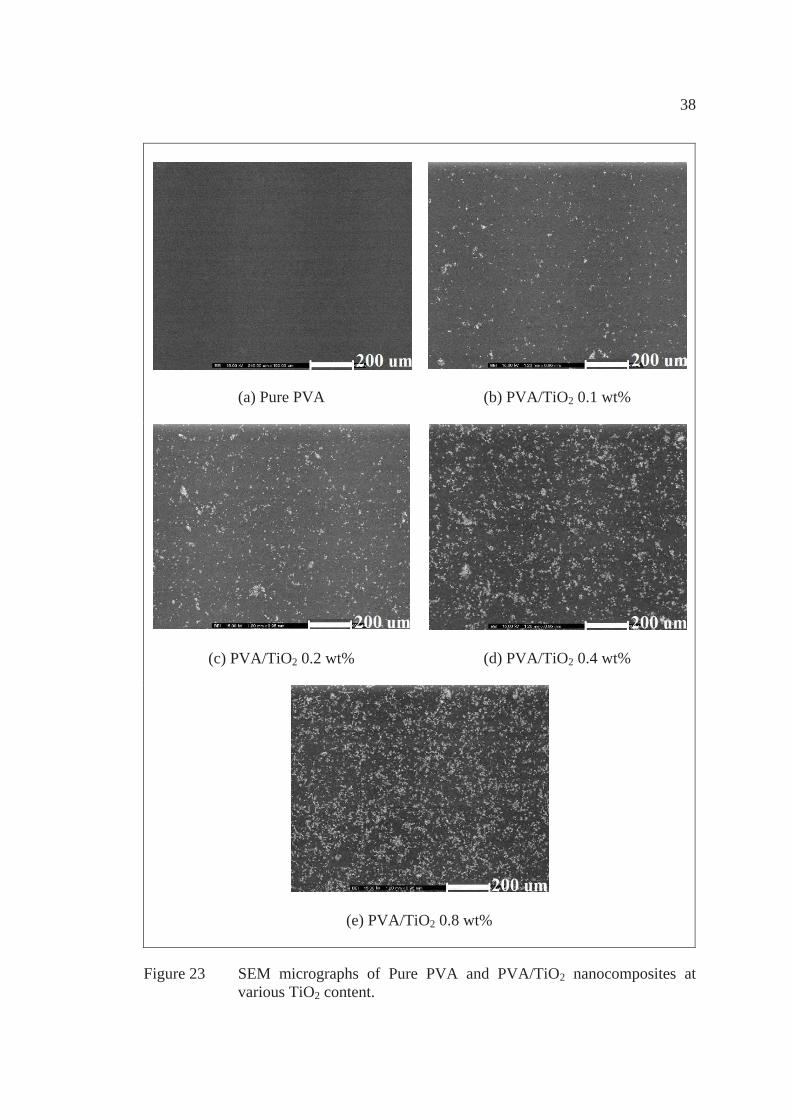
38
(a) Pure PVA
(b) PVA/TiO2 0.1 wt%
(c) PVA/TiO2 0.2 wt%
(d) PVA/TiO2 0.4 wt%
(e) PVA/TiO2 0.8 wt%
Figure 23 SEM micrographs of Pure PVA and PVA/TiO2 nanocomposites at various TiO2 content.
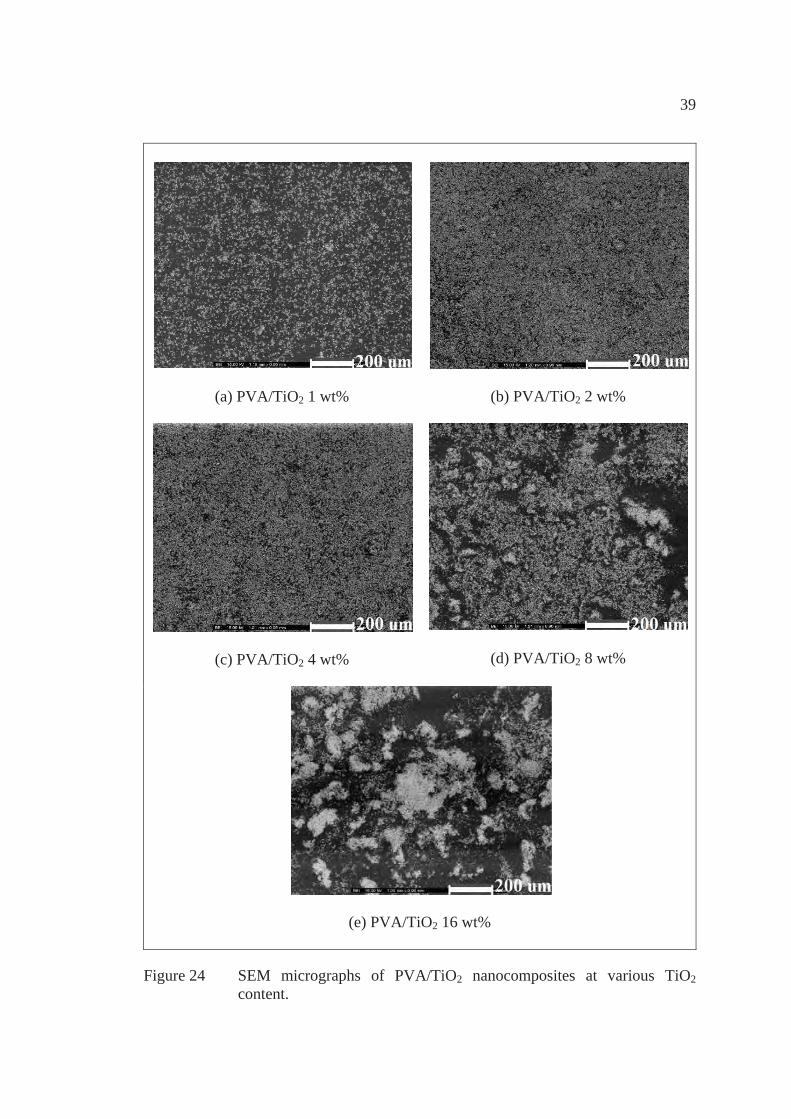
39
(a) PVA/TiO2 1 wt%
(b) PVA/TiO2 2 wt%
(c) PVA/TiO2 4 wt%
(d) PVA/TiO2 8 wt%
(e) PVA/TiO2 16 wt%
Figure 24 SEM micrographs of PVA/TiO2 nanocomposites at various TiO2 content.
40
(a) PVA/TiO2/SDS 0.1 wt%
(b) PVA/TiO2/SDS 0.2 wt%
(c) PVA/TiO2/SDS 0.4 wt%
(d) PVA/TiO2/SDS 0.8 wt%
Figure 25 SEM micrographs of PVA/TiO2 nanocomposites in the presence of SDS at various TiO2 content.

41
(a) PVA/TiO2/SDS 1 wt%
(b) PVA/TiO2/SDS 2 wt%
(c) PVA/TiO2/SDS 4 wt%
(d) PVA/TiO2/SDS 8 wt%
(e) PVA/TiO2/SDS 16 wt%
Figure 26 SEM micrographs of PVA/TiO2 nanocomposites in the presence of SDS at various TiO2 content.
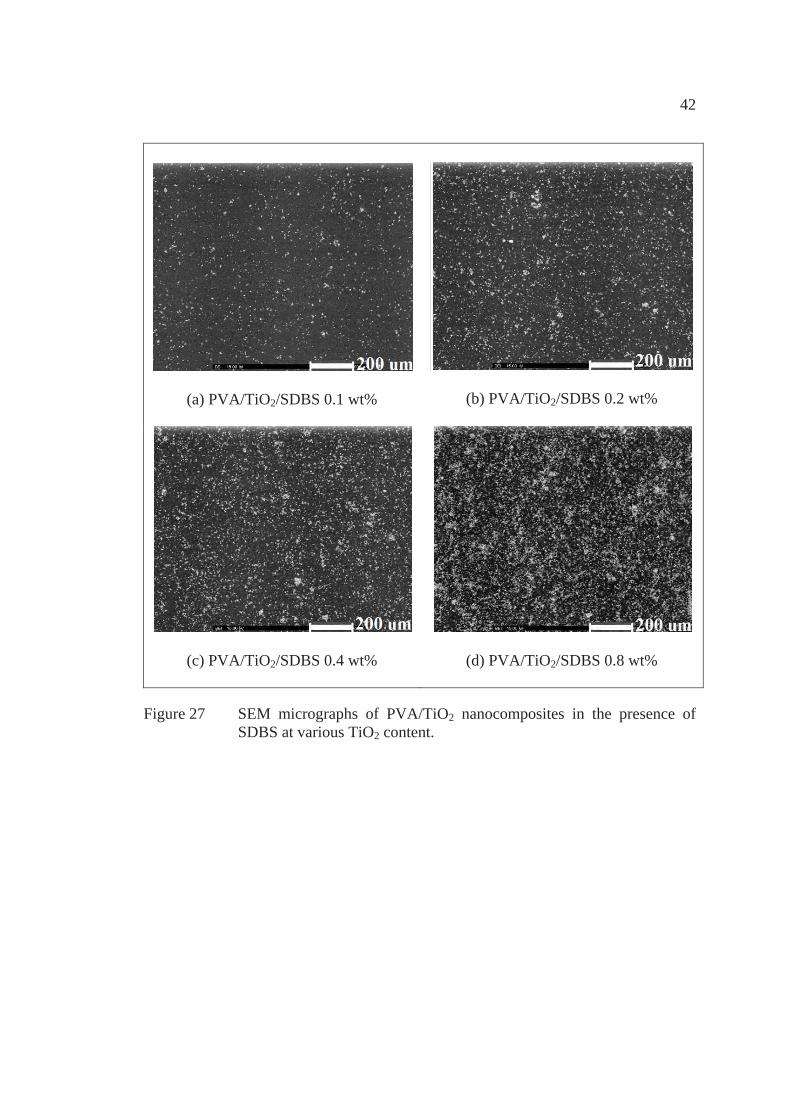
42
(a) PVA/TiO2/SDBS 0.1 wt%
(b) PVA/TiO2/SDBS 0.2 wt%
(c) PVA/TiO2/SDBS 0.4 wt%
(d) PVA/TiO2/SDBS 0.8 wt%
Figure 27 SEM micrographs of PVA/TiO2 nanocomposites in the presence of SDBS at various TiO2 content.
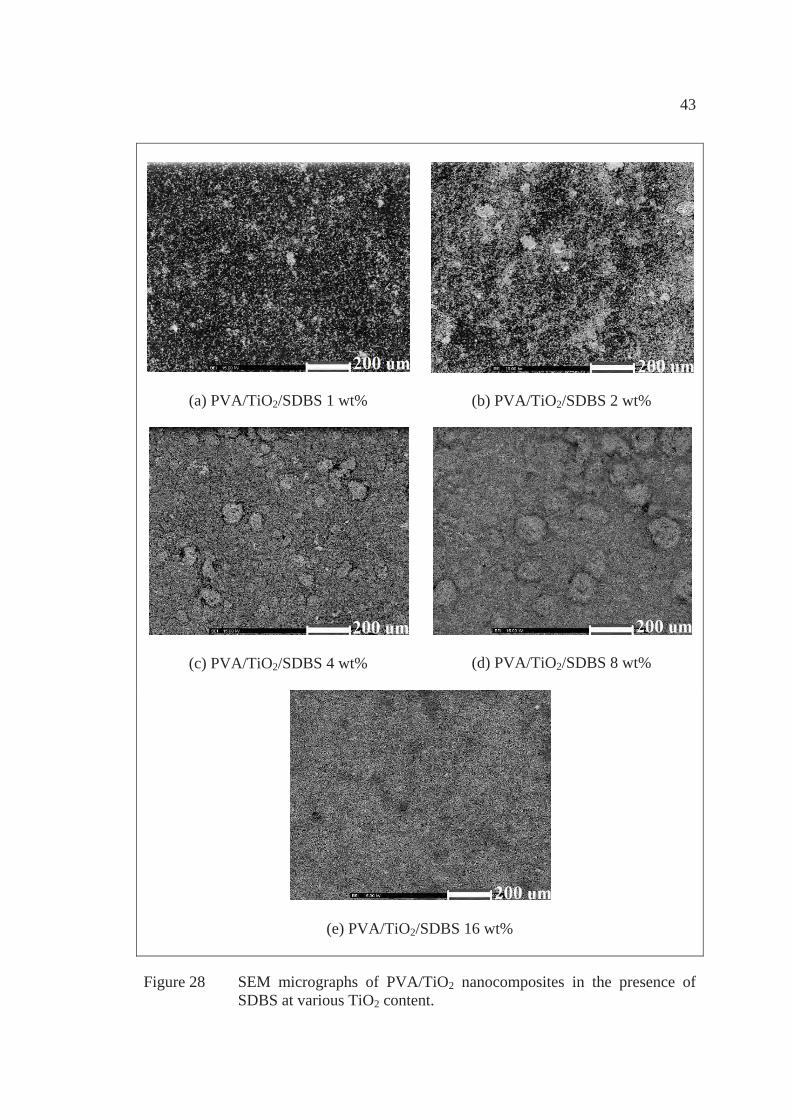
43
(a) PVA/TiO2/SDBS 1 wt%
(b) PVA/TiO2/SDBS 2 wt%
(c) PVA/TiO2/SDBS 4 wt%
(d) PVA/TiO2/SDBS 8 wt%
(e) PVA/TiO2/SDBS 16 wt%
Figure 28 SEM micrographs of PVA/TiO2 nanocomposites in the presence of SDBS at various TiO2 content.
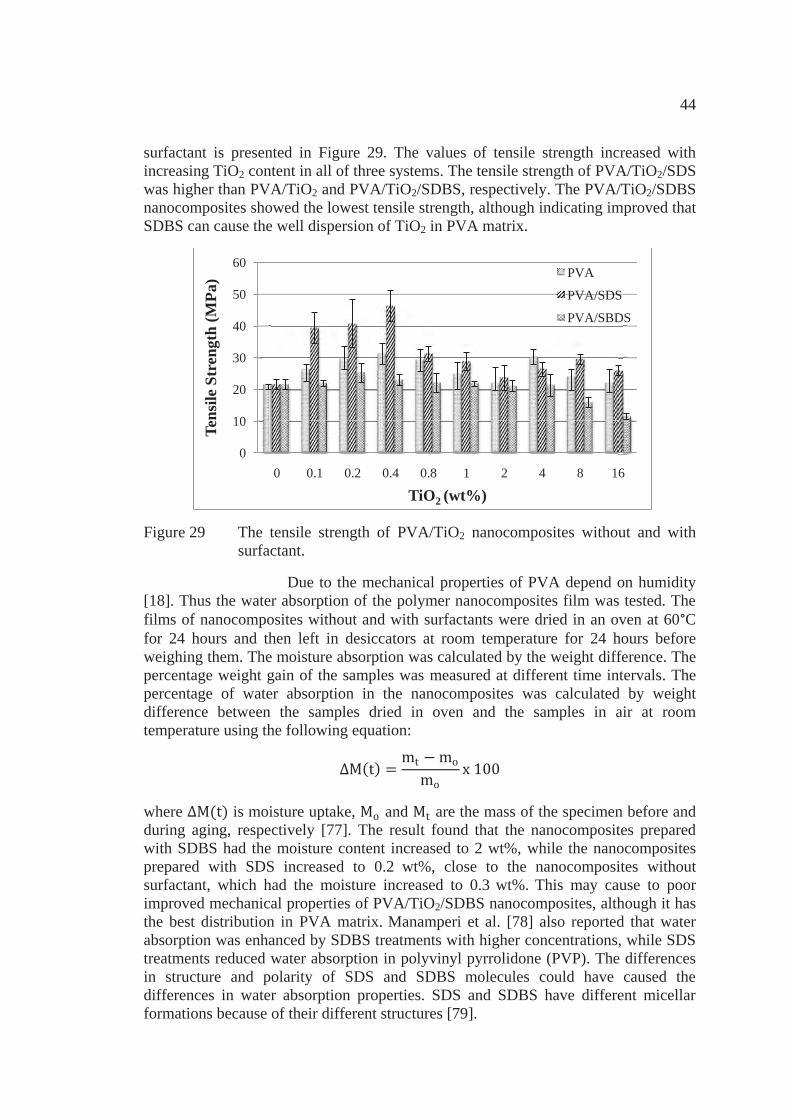
44
surfactant is presented in Figure 29. The values of tensile strength increased with increasing TiO2 content in all of three systems. The tensile strength of PVA/TiO2/SDS was higher than PVA/TiO2 and PVA/TiO2/SDBS, respectively. The PVA/TiO2/SDBS nanocomposites showed the lowest tensile strength, although indicating improved that SDBS can cause the well dispersion of TiO2 in PVA matrix.
Figure 29 The tensile strength of PVA/TiO2 nanocomposites without and with surfactant.
Due to the mechanical properties of PVA depend on humidity [18]. Thus the water absorption of the polymer nanocomposites film was tested. The films of nanocomposites without and with surfactants were dried in an oven at 60°C for 24 hours and then left in desiccators at room temperature for 24 hours before weighing them. The moisture absorption was calculated by the weight difference. The percentage weight gain of the samples was measured at different time intervals. The percentage of water absorption in the nanocomposites was calculated by weight difference between the samples dried in oven and the samples in air at room temperature using the following equation:
where is moisture uptake, and are the mass of the specimen before and during aging, respectively [77]. The result found that the nanocomposites prepared with SDBS had the moisture content increased to 2 wt%, while the nanocomposites prepared with SDS increased to 0.2 wt%, close to the nanocomposites without surfactant, which had the moisture increased to 0.3 wt%. This may cause to poor improved mechanical properties of PVA/TiO2/SDBS nanocomposites, although it has the best distribution in PVA matrix. Manamperi et al. [78] also reported that water absorption was enhanced by SDBS treatments with higher concentrations, while SDS treatments reduced water absorption in polyvinyl pyrrolidone (PVP). The differences in structure and polarity of SDS and SDBS molecules could have caused the differences in water absorption properties. SDS and SDBS have different micellar formations because of their different structures [79].
0
10
20
30
40
50
60
0 0.1 0.2 0.4 0.8 1 2 4 8 16
Tens
ile S
tren
gth
(MPa
)
TiO2 (wt%)
PVA
PVA/SDS
PVA/SBDS
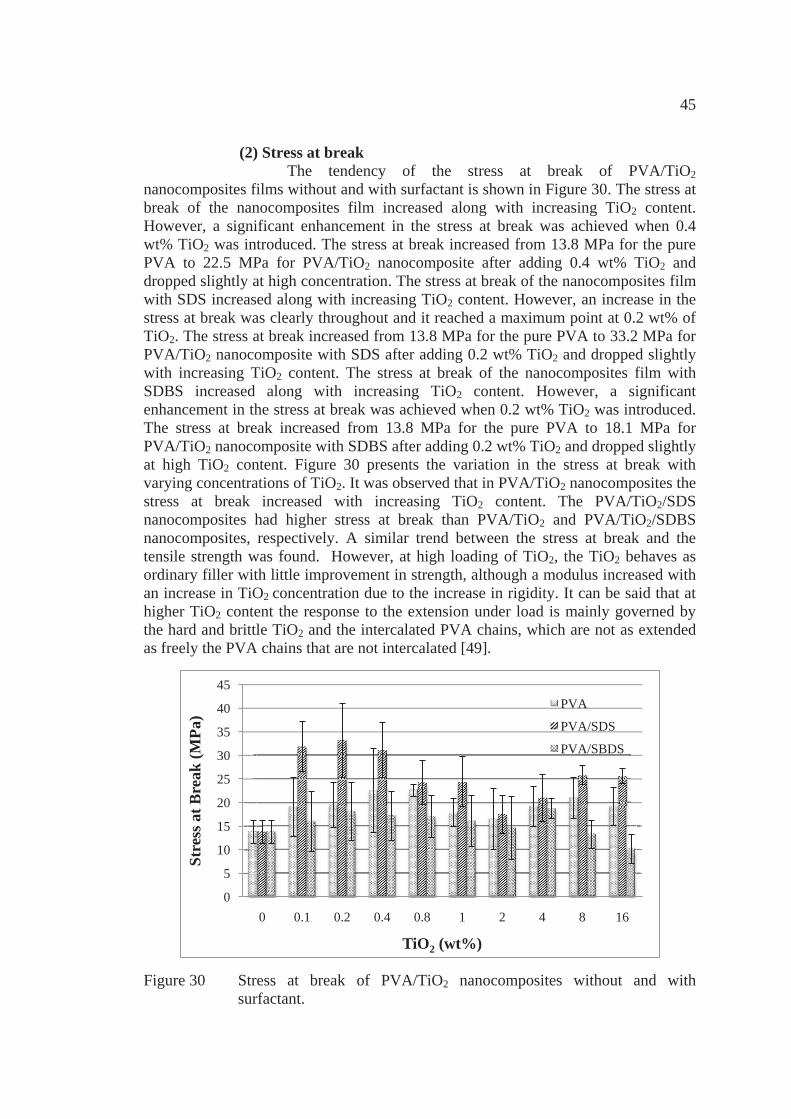
45
(2) Stress at break The tendency of the stress at break of PVA/TiO2 nanocomposites films without and with surfactant is shown in Figure 30. The stress at break of the nanocomposites film increased along with increasing TiO2 content. However, a significant enhancement in the stress at break was achieved when 0.4 wt% TiO2 was introduced. The stress at break increased from 13.8 MPa for the pure PVA to 22.5 MPa for PVA/TiO2 nanocomposite after adding 0.4 wt% TiO2 and dropped slightly at high concentration. The stress at break of the nanocomposites film with SDS increased along with increasing TiO2 content. However, an increase in the stress at break was clearly throughout and it reached a maximum point at 0.2 wt% of TiO2. The stress at break increased from 13.8 MPa for the pure PVA to 33.2 MPa for PVA/TiO2 nanocomposite with SDS after adding 0.2 wt% TiO2 and dropped slightly with increasing TiO2 content. The stress at break of the nanocomposites film with SDBS increased along with increasing TiO2 content. However, a significant enhancement in the stress at break was achieved when 0.2 wt% TiO2 was introduced. The stress at break increased from 13.8 MPa for the pure PVA to 18.1 MPa for PVA/TiO2 nanocomposite with SDBS after adding 0.2 wt% TiO2 and dropped slightly at high TiO2 content. Figure 30 presents the variation in the stress at break with varying concentrations of TiO2. It was observed that in PVA/TiO2 nanocomposites the stress at break increased with increasing TiO2 content. The PVA/TiO2/SDS nanocomposites had higher stress at break than PVA/TiO2 and PVA/TiO2/SDBS nanocomposites, respectively. A similar trend between the stress at break and the tensile strength was found. However, at high loading of TiO2, the TiO2 behaves as ordinary filler with little improvement in strength, although a modulus increased with an increase in TiO2 concentration due to the increase in rigidity. It can be said that at higher TiO2 content the response to the extension under load is mainly governed by the hard and brittle TiO2 and the intercalated PVA chains, which are not as extended as freely the PVA chains that are not intercalated [49].
Figure 30 Stress at break of PVA/TiO2 nanocomposites without and with surfactant.
0
5
10
15
20
25
30
35
40
45
0 0.1 0.2 0.4 0.8 1 2 4 8 16
Stre
ss a
t Bre
ak (M
Pa)
TiO2 (wt%)
PVA
PVA/SDS
PVA/SBDS
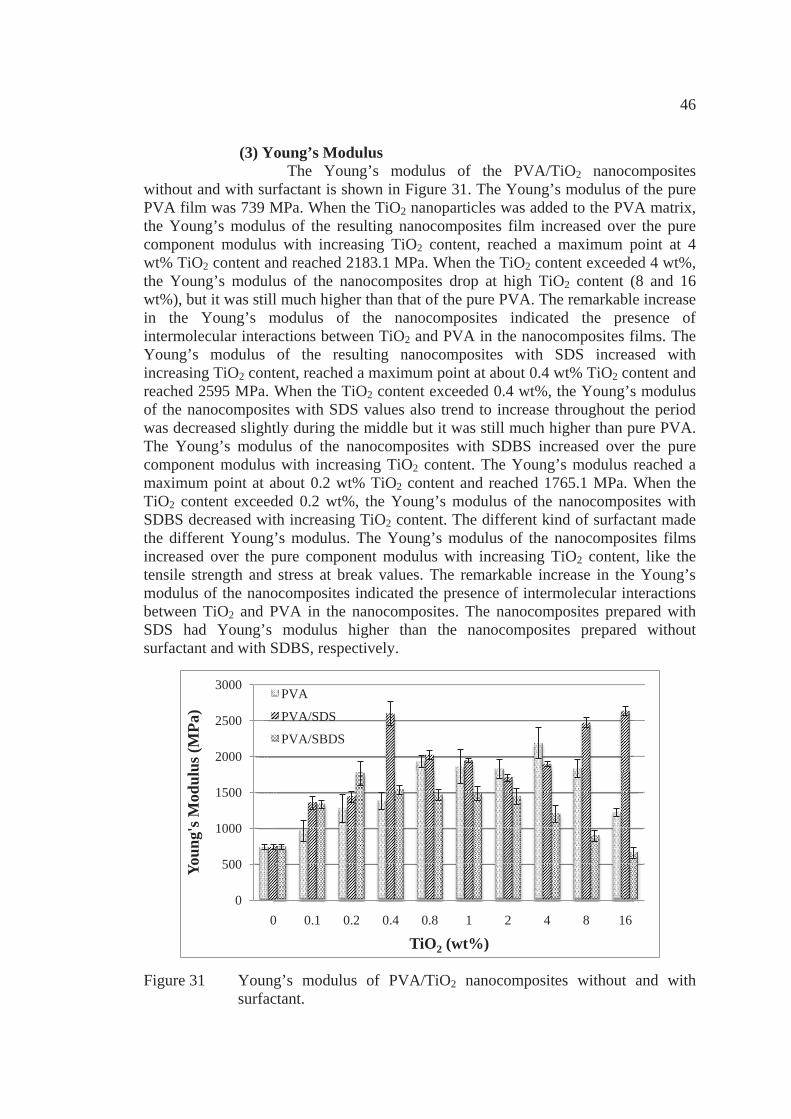
46
(3) Young’s Modulus The Young’s modulus of the PVA/TiO2 nanocomposites without and with surfactant is shown in Figure 31. The Young’s modulus of the pure PVA film was 739 MPa. When the TiO2 nanoparticles was added to the PVA matrix, the Young’s modulus of the resulting nanocomposites film increased over the pure component modulus with increasing TiO2 content, reached a maximum point at 4 wt% TiO2 content and reached 2183.1 MPa. When the TiO2 content exceeded 4 wt%, the Young’s modulus of the nanocomposites drop at high TiO2 content (8 and 16 wt%), but it was still much higher than that of the pure PVA. The remarkable increase in the Young’s modulus of the nanocomposites indicated the presence of intermolecular interactions between TiO2 and PVA in the nanocomposites films. The Young’s modulus of the resulting nanocomposites with SDS increased with increasing TiO2 content, reached a maximum point at about 0.4 wt% TiO2 content and reached 2595 MPa. When the TiO2 content exceeded 0.4 wt%, the Young’s modulus of the nanocomposites with SDS values also trend to increase throughout the period was decreased slightly during the middle but it was still much higher than pure PVA. The Young’s modulus of the nanocomposites with SDBS increased over the pure component modulus with increasing TiO2 content. The Young’s modulus reached a maximum point at about 0.2 wt% TiO2 content and reached 1765.1 MPa. When the TiO2 content exceeded 0.2 wt%, the Young’s modulus of the nanocomposites with SDBS decreased with increasing TiO2 content. The different kind of surfactant made the different Young’s modulus. The Young’s modulus of the nanocomposites films increased over the pure component modulus with increasing TiO2 content, like the tensile strength and stress at break values. The remarkable increase in the Young’s modulus of the nanocomposites indicated the presence of intermolecular interactions between TiO2 and PVA in the nanocomposites. The nanocomposites prepared with SDS had Young’s modulus higher than the nanocomposites prepared without surfactant and with SDBS, respectively.
Figure 31 Young’s modulus of PVA/TiO2 nanocomposites without and with surfactant.
0
500
1000
1500
2000
2500
3000
0 0.1 0.2 0.4 0.8 1 2 4 8 16
Youn
g's M
odul
us (M
Pa)
TiO2 (wt%)
PVA
PVA/SDS
PVA/SBDS
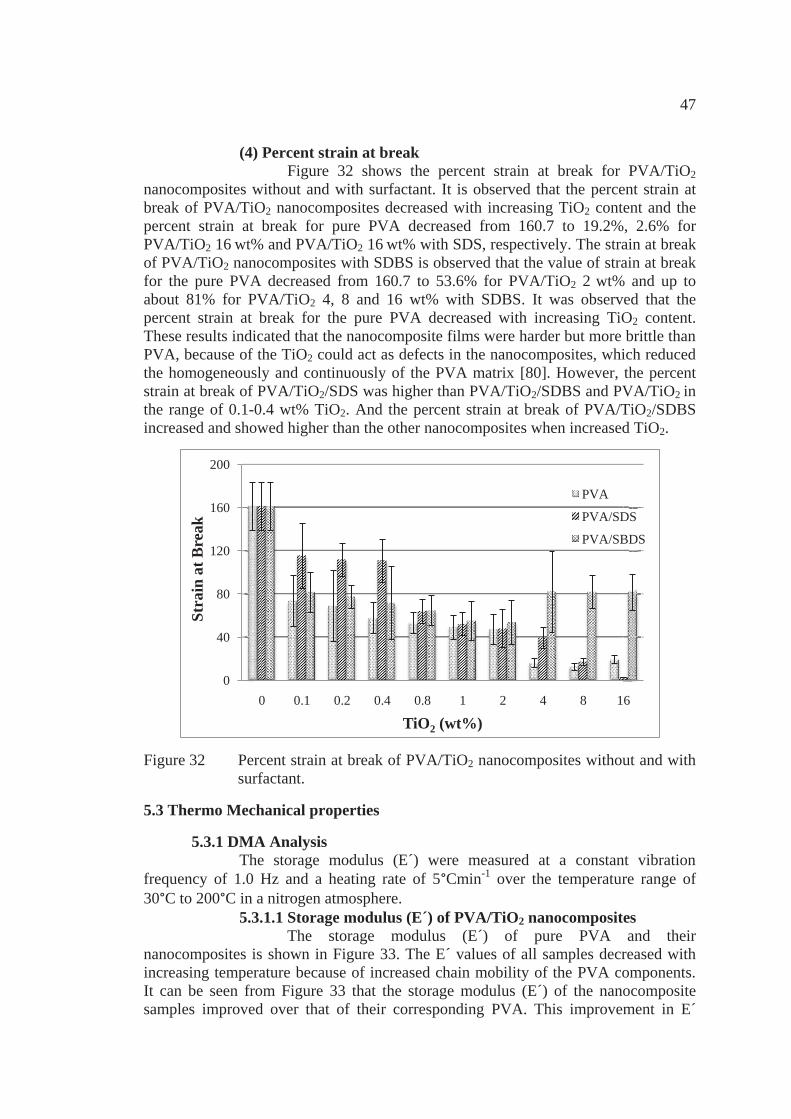
47
(4) Percent strain at break Figure 32 shows the percent strain at break for PVA/TiO2 nanocomposites without and with surfactant. It is observed that the percent strain at break of PVA/TiO2 nanocomposites decreased with increasing TiO2 content and the percent strain at break for pure PVA decreased from 160.7 to 19.2%, 2.6% for PVA/TiO2 16 wt% and PVA/TiO2 16 wt% with SDS, respectively. The strain at break of PVA/TiO2 nanocomposites with SDBS is observed that the value of strain at break for the pure PVA decreased from 160.7 to 53.6% for PVA/TiO2 2 wt% and up to about 81% for PVA/TiO2 4, 8 and 16 wt% with SDBS. It was observed that the percent strain at break for the pure PVA decreased with increasing TiO2 content. These results indicated that the nanocomposite films were harder but more brittle than PVA, because of the TiO2 could act as defects in the nanocomposites, which reduced the homogeneously and continuously of the PVA matrix [80]. However, the percent strain at break of PVA/TiO2/SDS was higher than PVA/TiO2/SDBS and PVA/TiO2 in the range of 0.1-0.4 wt% TiO2. And the percent strain at break of PVA/TiO2/SDBS increased and showed higher than the other nanocomposites when increased TiO2.
Figure 32 Percent strain at break of PVA/TiO2 nanocomposites without and with surfactant.
5.3 Thermo Mechanical properties
5.3.1 DMA Analysis The storage modulus (E´) were measured at a constant vibration frequency of 1.0 Hz and a heating rate of 5°Cmin-1 over the temperature range of 30°C to 200°C in a nitrogen atmosphere. 5.3.1.1 Storage modulus (E´) of PVA/TiO2 nanocomposites
The storage modulus (E´) of pure PVA and their nanocomposites is shown in Figure 33. The E´ values of all samples decreased with increasing temperature because of increased chain mobility of the PVA components. It can be seen from Figure 33 that the storage modulus (E´) of the nanocomposite samples improved over that of their corresponding PVA. This improvement in E´
0
40
80
120
160
200
0 0.1 0.2 0.4 0.8 1 2 4 8 16
Stra
in a
t Bre
ak
TiO2 (wt%)
PVA
PVA/SDS
PVA/SBDS

48
value for nanocomposite samples may be due to the better interface interaction between PVA and TiO2 nanoparticle. However, the E´ values were fluctuating by rising temperature. The 0.4, 0.8 and 8 wt% of TiO2 samples were slightly higher than pure PVA and other samples. 5.3.1.2 Storage modulus (E´) of PVA/TiO2 nanocomposites with SDS The storage modulus (E´) of PVA and their nanocomposites with SDS is shown in Figure 34. The E´ values of all samples decreased with increasing temperature because of increased chain mobility of the PVA components. This dropping trend in modulus is typical of the viscoelastic behavior of polymer in general. It can be seen from Figure 34 that the storage modulus (E´) of the nanocomposites with SDS samples improved considerably over that of their corresponding PVA. This improvement in E´ value for nanocomposites with SDS samples may be due to the better dispersion between PVA and TiO2 nanoparticle, which allowed greater stress transfer at the interphase. However, the E´ values of the 0.2 and 0.4 wt% of TiO2 with SDS samples were significantly higher than pure PVA and other samples. This can be ascribed to the incorporation of nanoparticle inside the polymer matrix which provided additional support, which in turn acted as reinforcement, resulting in improved surface compatibility between TiO2 nanoparticle and polymer matrix [81]. 5.3.1.3 Storage modulus (E´) of PVA/TiO2 nanocomposites with SDBS The storage modulus (E´) of PVA and their nanocomposites with SDBS is shown in Figure 35. The E´ values of all samples decreased with increasing temperature because of increased chain mobility of the PVA components. This dropping trend in modulus is typical of the viscoelastic behavior of polymer in general. It can be seen from Figure 35 that the storage modulus (E´) of the nanocomposites with SDBS samples improved considerably over that of their corresponding PVA. This improvement in E´ value for nanocomposites with SDBS samples may be due to the better dispersion between PVA and TiO2 nanoparticle, which allowed greater stress transfer at the interphase. However, the E´ values of the 1, 2 and 4 wt% of TiO2 with SDBS samples were significantly higher than pure PVA and other samples. This can be ascribed to the incorporation of nanoparticle inside the polymer matrix which provided additional support, which in turn acted as reinforcement, resulting in improved surface compatibility between TiO2 nanoparticle and polymer matrix [81]. From the results of storage modulus (E´) of all system, found that E´ of PVA/TiO2/SDS was higher than PVA/TiO2 and PVA/TiO2/SDBS, respectively.
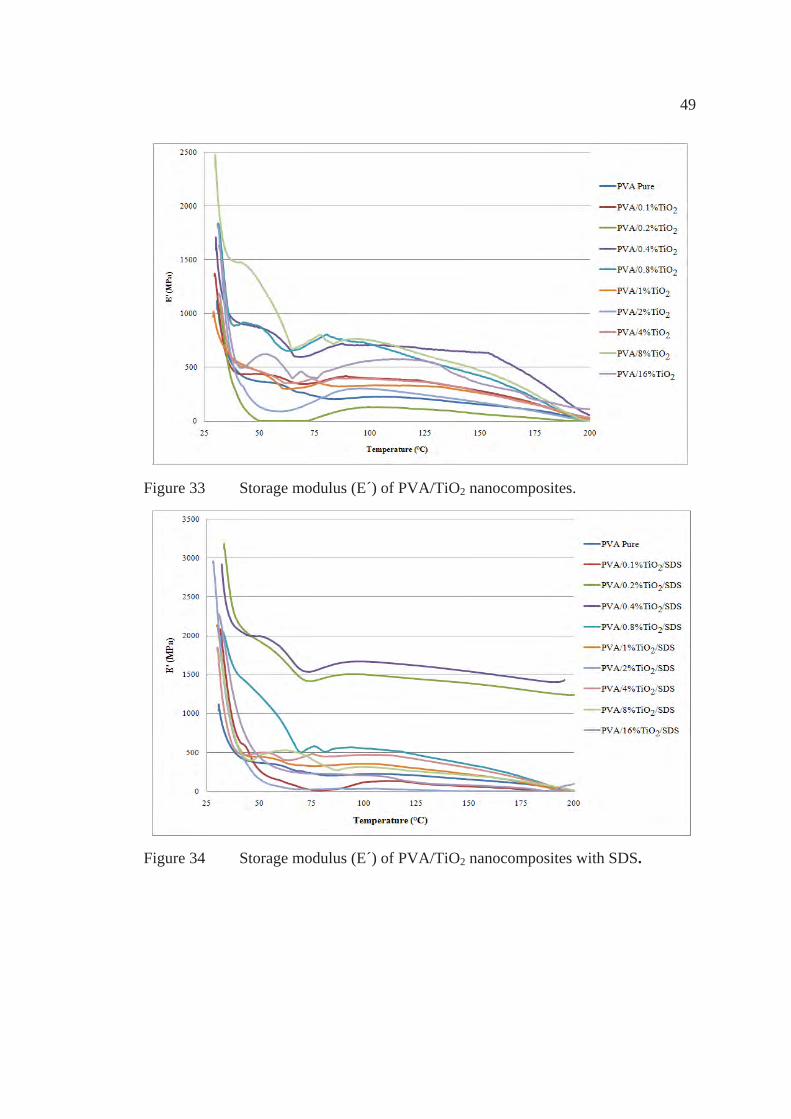
49
Figure 33 Storage modulus (E´) of PVA/TiO2 nanocomposites.
Figure 34 Storage modulus (E´) of PVA/TiO2 nanocomposites with SDS.
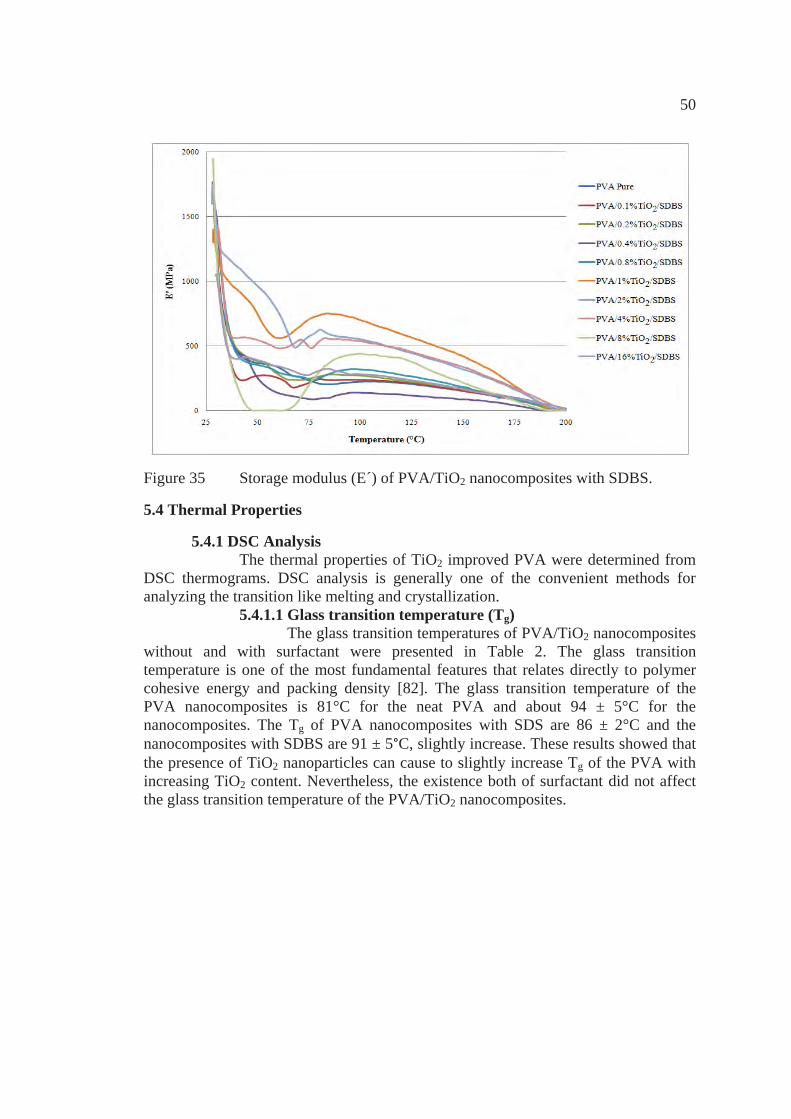
50
Figure 35 Storage modulus (E´) of PVA/TiO2 nanocomposites with SDBS.
5.4 Thermal Properties
5.4.1 DSC Analysis The thermal properties of TiO2 improved PVA were determined from DSC thermograms. DSC analysis is generally one of the convenient methods for analyzing the transition like melting and crystallization. 5.4.1.1 Glass transition temperature (Tg) The glass transition temperatures of PVA/TiO2 nanocomposites without and with surfactant were presented in Table 2. The glass transition temperature is one of the most fundamental features that relates directly to polymer cohesive energy and packing density [82]. The glass transition temperature of the PVA nanocomposites is 81°C for the neat PVA and about 94 ± 5°C for the nanocomposites. The Tg of PVA nanocomposites with SDS are 86 ± 2°C and the nanocomposites with SDBS are 91 ± 5°C, slightly increase. These results showed that the presence of TiO2 nanoparticles can cause to slightly increase Tg of the PVA with increasing TiO2 content. Nevertheless, the existence both of surfactant did not affect the glass transition temperature of the PVA/TiO2 nanocomposites.
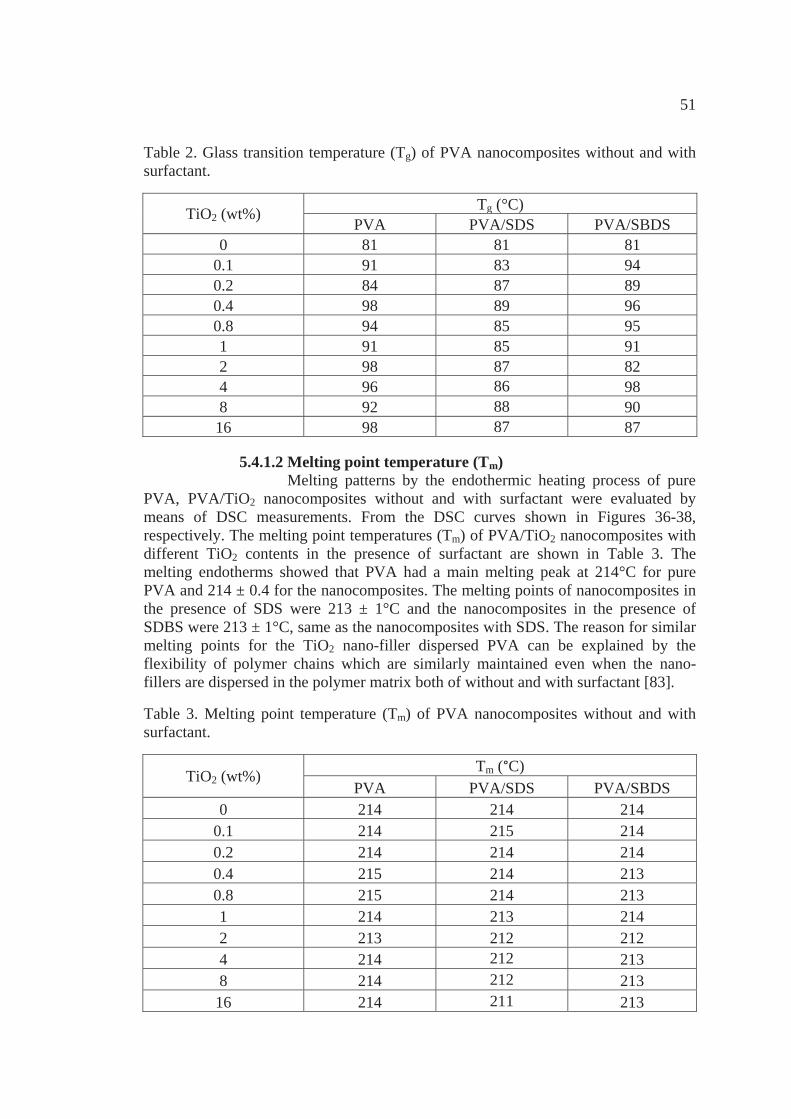
51
Table 2. Glass transition temperature (Tg) of PVA nanocomposites without and with surfactant.
TiO2 (wt%) Tg (°C) PVA PVA/SDS PVA/SBDS
0 81 81 81 0.1 91 83 94 0.2 84 87 89 0.4 98 89 96 0.8 94 85 95 1 91 85 91 2 98 87 82 4 96 86 98 8 92 88 90 16 98 87 87
5.4.1.2 Melting point temperature (Tm) Melting patterns by the endothermic heating process of pure PVA, PVA/TiO2 nanocomposites without and with surfactant were evaluated by means of DSC measurements. From the DSC curves shown in Figures 36-38, respectively. The melting point temperatures (Tm) of PVA/TiO2 nanocomposites with different TiO2 contents in the presence of surfactant are shown in Table 3. The melting endotherms showed that PVA had a main melting peak at 214°C for pure PVA and 214 ± 0.4 for the nanocomposites. The melting points of nanocomposites in the presence of SDS were 213 ± 1°C and the nanocomposites in the presence of SDBS were 213 ± 1°C, same as the nanocomposites with SDS. The reason for similar melting points for the TiO2 nano-filler dispersed PVA can be explained by the flexibility of polymer chains which are similarly maintained even when the nano-fillers are dispersed in the polymer matrix both of without and with surfactant [83].
Table 3. Melting point temperature (Tm) of PVA nanocomposites without and with surfactant.
TiO2 (wt%) Tm (°C) PVA PVA/SDS PVA/SBDS
0 214 214 214 0.1 214 215 214 0.2 214 214 214 0.4 215 214 213 0.8 215 214 213 1 214 213 214 2 213 212 212 4 214 212 213 8 214 212 213 16 214 211 213
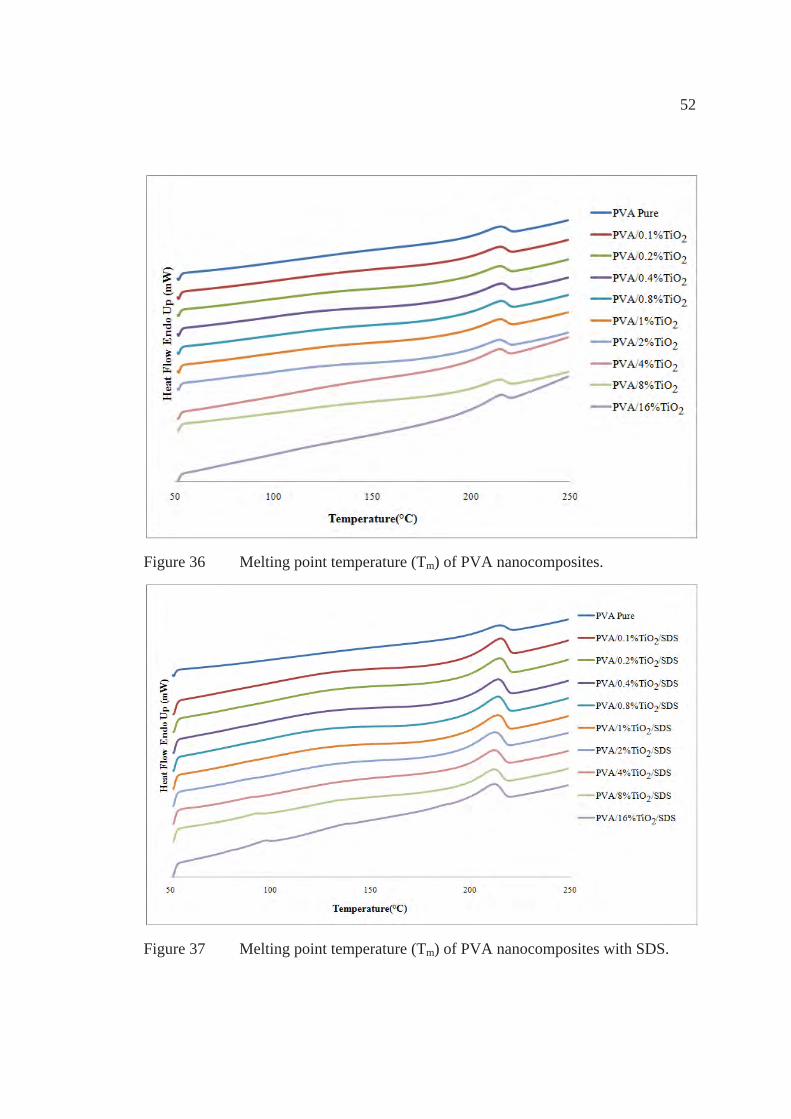
52
Figure 36 Melting point temperature (Tm) of PVA nanocomposites.
Figure 37 Melting point temperature (Tm) of PVA nanocomposites with SDS.
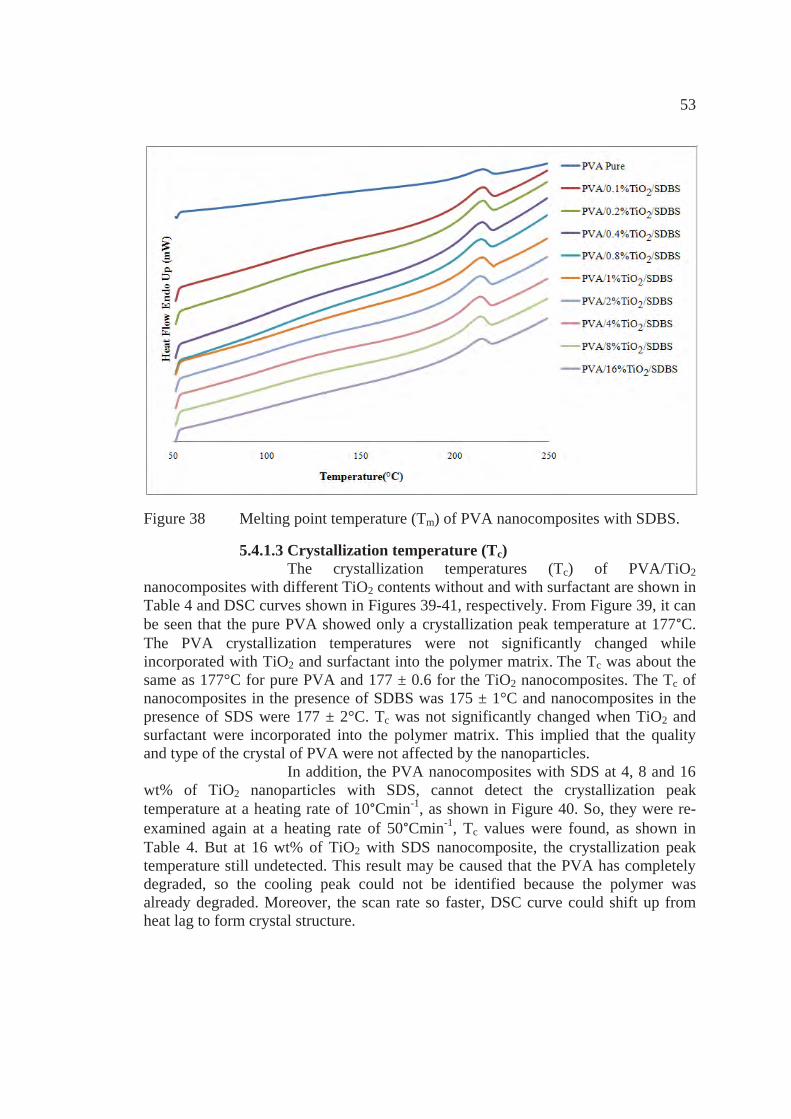
53
Figure 38 Melting point temperature (Tm) of PVA nanocomposites with SDBS.
5.4.1.3 Crystallization temperature (Tc) The crystallization temperatures (Tc) of PVA/TiO2 nanocomposites with different TiO2 contents without and with surfactant are shown in Table 4 and DSC curves shown in Figures 39-41, respectively. From Figure 39, it can be seen that the pure PVA showed only a crystallization peak temperature at 177°C. The PVA crystallization temperatures were not significantly changed while incorporated with TiO2 and surfactant into the polymer matrix. The Tc was about the same as 177°C for pure PVA and 177 ± 0.6 for the TiO2 nanocomposites. The Tc of nanocomposites in the presence of SDBS was 175 ± 1°C and nanocomposites in the presence of SDS were 177 ± 2°C. Tc was not significantly changed when TiO2 and surfactant were incorporated into the polymer matrix. This implied that the quality and type of the crystal of PVA were not affected by the nanoparticles. In addition, the PVA nanocomposites with SDS at 4, 8 and 16 wt% of TiO2 nanoparticles with SDS, cannot detect the crystallization peak temperature at a heating rate of 10°Cmin-1, as shown in Figure 40. So, they were re-examined again at a heating rate of 50°Cmin-1, Tc values were found, as shown in Table 4. But at 16 wt% of TiO2 with SDS nanocomposite, the crystallization peak temperature still undetected. This result may be caused that the PVA has completely degraded, so the cooling peak could not be identified because the polymer was already degraded. Moreover, the scan rate so faster, DSC curve could shift up from heat lag to form crystal structure.
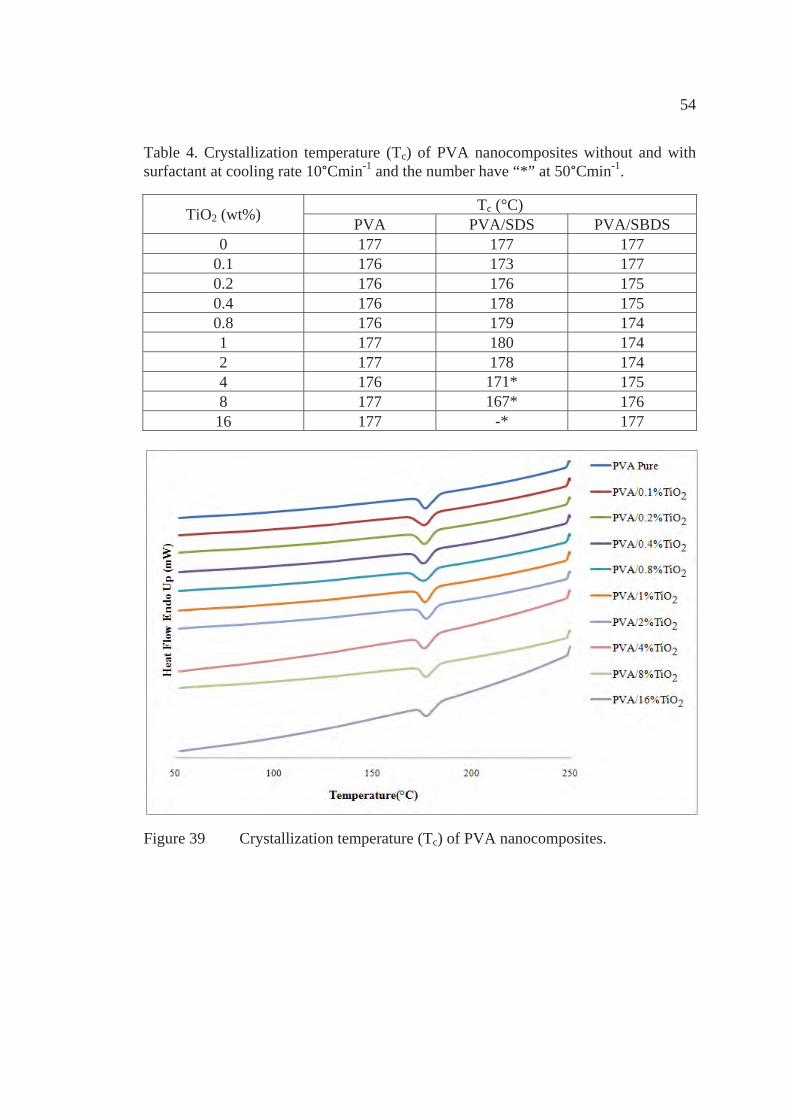
54
Table 4. Crystallization temperature (Tc) of PVA nanocomposites without and with surfactant at cooling rate 10°Cmin-1 and the number have “*” at 50°Cmin-1.
TiO2 (wt%) Tc (°C) PVA PVA/SDS PVA/SBDS
0 177 177 177 0.1 176 173 177 0.2 176 176 175 0.4 176 178 175 0.8 176 179 174 1 177 180 174 2 177 178 174 4 176 171* 175 8 177 167* 176 16 177 -* 177
Figure 39 Crystallization temperature (Tc) of PVA nanocomposites.
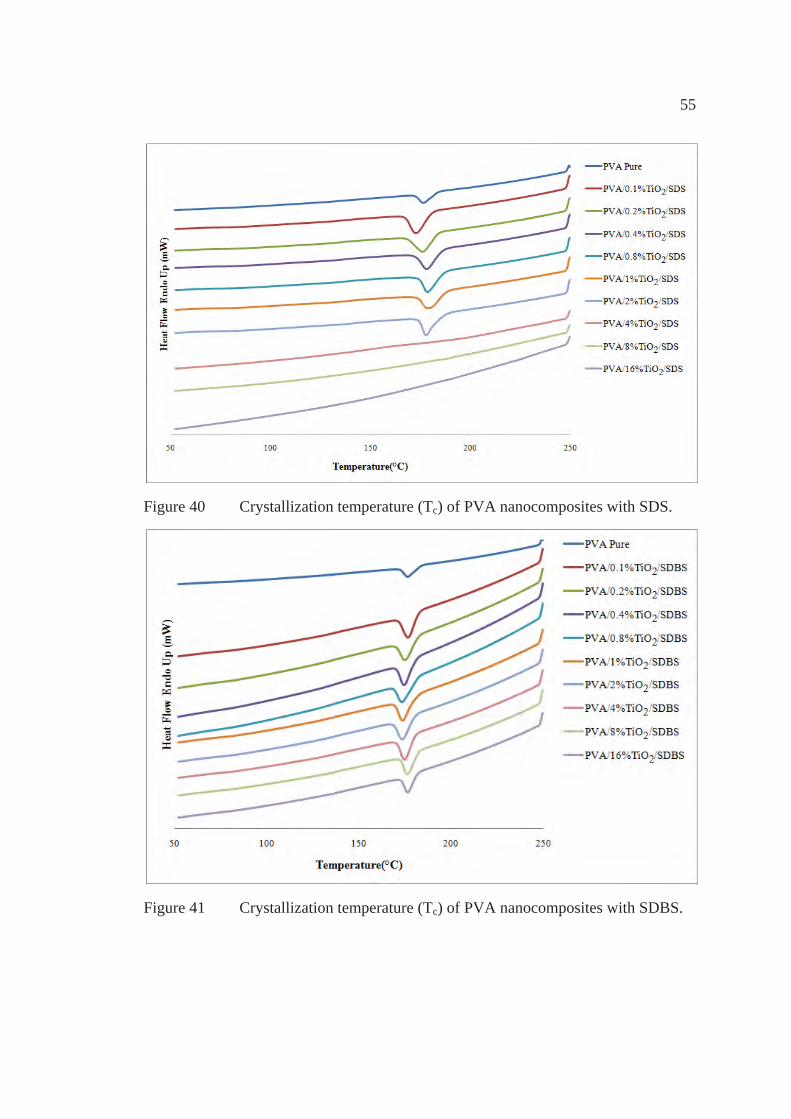
55
Figure 40 Crystallization temperature (Tc) of PVA nanocomposites with SDS.
Figure 41 Crystallization temperature (Tc) of PVA nanocomposites with SDBS.
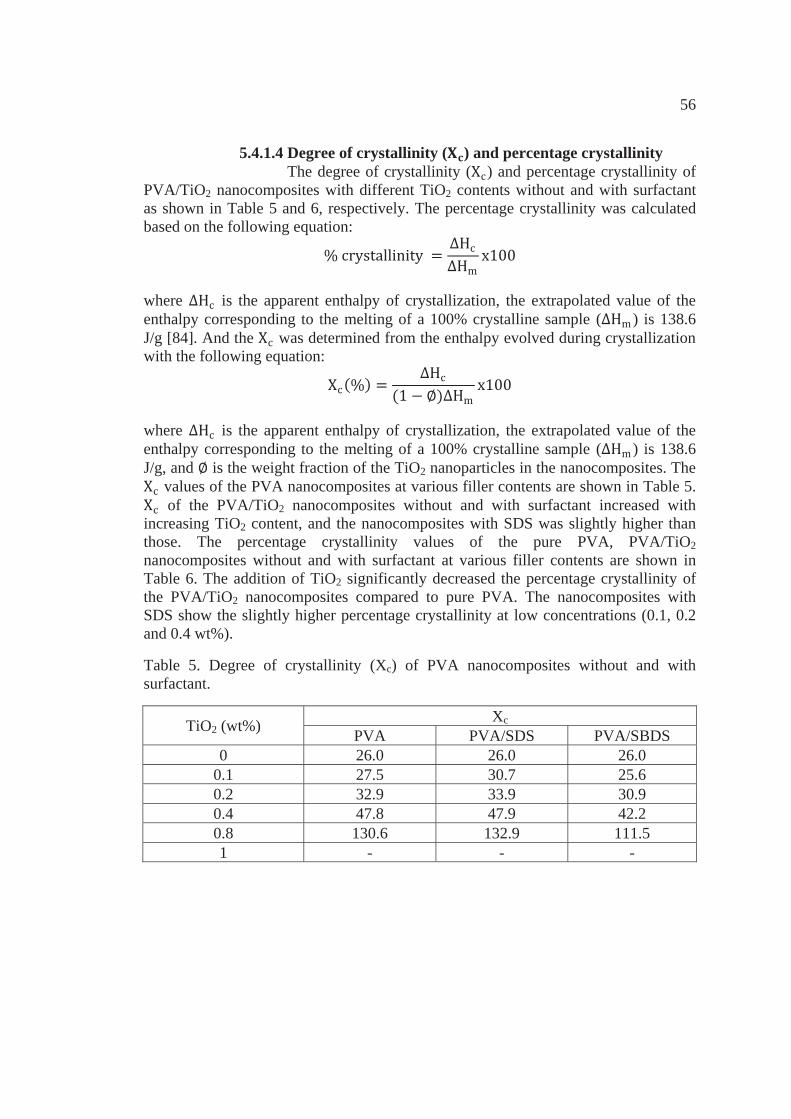
56
5.4.1.4 Degree of crystallinity ( ) and percentage crystallinity The degree of crystallinity ( ) and percentage crystallinity of PVA/TiO2 nanocomposites with different TiO2 contents without and with surfactant as shown in Table 5 and 6, respectively. The percentage crystallinity was calculated based on the following equation:
where is the apparent enthalpy of crystallization, the extrapolated value of the enthalpy corresponding to the melting of a 100% crystalline sample ( ) is 138.6 J/g [84]. And the was determined from the enthalpy evolved during crystallization with the following equation:
where is the apparent enthalpy of crystallization, the extrapolated value of the enthalpy corresponding to the melting of a 100% crystalline sample ( ) is 138.6 J/g, and is the weight fraction of the TiO2 nanoparticles in the nanocomposites. The
values of the PVA nanocomposites at various filler contents are shown in Table 5. of the PVA/TiO2 nanocomposites without and with surfactant increased with
increasing TiO2 content, and the nanocomposites with SDS was slightly higher than those. The percentage crystallinity values of the pure PVA, PVA/TiO2 nanocomposites without and with surfactant at various filler contents are shown in Table 6. The addition of TiO2 significantly decreased the percentage crystallinity of the PVA/TiO2 nanocomposites compared to pure PVA. The nanocomposites with SDS show the slightly higher percentage crystallinity at low concentrations (0.1, 0.2 and 0.4 wt%).
Table 5. Degree of crystallinity (Xc) of PVA nanocomposites without and with surfactant.
TiO2 (wt%) Xc PVA PVA/SDS PVA/SBDS
0 26.0 26.0 26.0 0.1 27.5 30.7 25.6 0.2 32.9 33.9 30.9 0.4 47.8 47.9 42.2 0.8 130.6 132.9 111.5 1 - - -
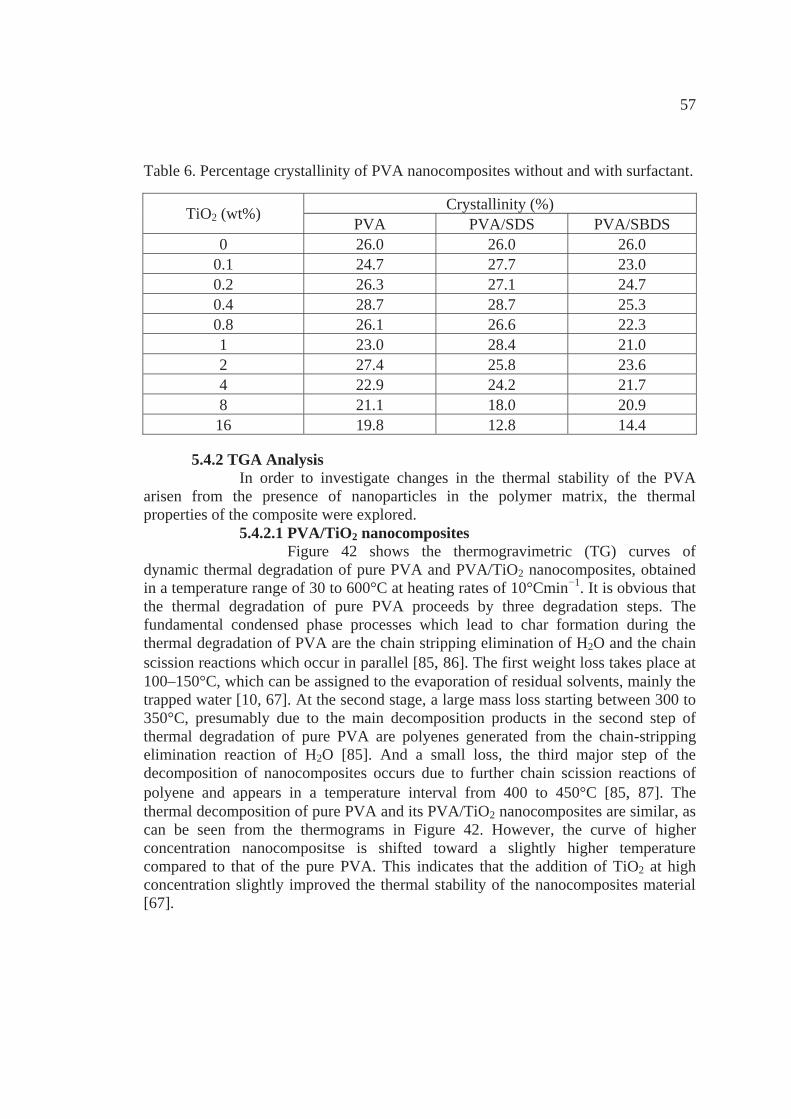
57
Table 6. Percentage crystallinity of PVA nanocomposites without and with surfactant.
TiO2 (wt%) Crystallinity (%) PVA PVA/SDS PVA/SBDS
0 26.0 26.0 26.0 0.1 24.7 27.7 23.0 0.2 26.3 27.1 24.7 0.4 28.7 28.7 25.3 0.8 26.1 26.6 22.3 1 23.0 28.4 21.0 2 27.4 25.8 23.6 4 22.9 24.2 21.7 8 21.1 18.0 20.9 16 19.8 12.8 14.4
5.4.2 TGA Analysis In order to investigate changes in the thermal stability of the PVA arisen from the presence of nanoparticles in the polymer matrix, the thermal properties of the composite were explored. 5.4.2.1 PVA/TiO2 nanocomposites Figure 42 shows the thermogravimetric (TG) curves of dynamic thermal degradation of pure PVA and PVA/TiO2 nanocomposites, obtained in a temperature range of 30 to 600°C at heating rates of 10°Cmin−1. It is obvious that the thermal degradation of pure PVA proceeds by three degradation steps. The fundamental condensed phase processes which lead to char formation during the thermal degradation of PVA are the chain stripping elimination of H2O and the chain scission reactions which occur in parallel [85, 86]. The first weight loss takes place at 100–150°C, which can be assigned to the evaporation of residual solvents, mainly the trapped water [10, 67]. At the second stage, a large mass loss starting between 300 to 350°C, presumably due to the main decomposition products in the second step of thermal degradation of pure PVA are polyenes generated from the chain-stripping elimination reaction of H2O [85]. And a small loss, the third major step of the decomposition of nanocomposites occurs due to further chain scission reactions of polyene and appears in a temperature interval from 400 to 450°C [85, 87]. The thermal decomposition of pure PVA and its PVA/TiO2 nanocomposites are similar, as can be seen from the thermograms in Figure 42. However, the curve of higher concentration nanocompositse is shifted toward a slightly higher temperature compared to that of the pure PVA. This indicates that the addition of TiO2 at high concentration slightly improved the thermal stability of the nanocomposites material [67].
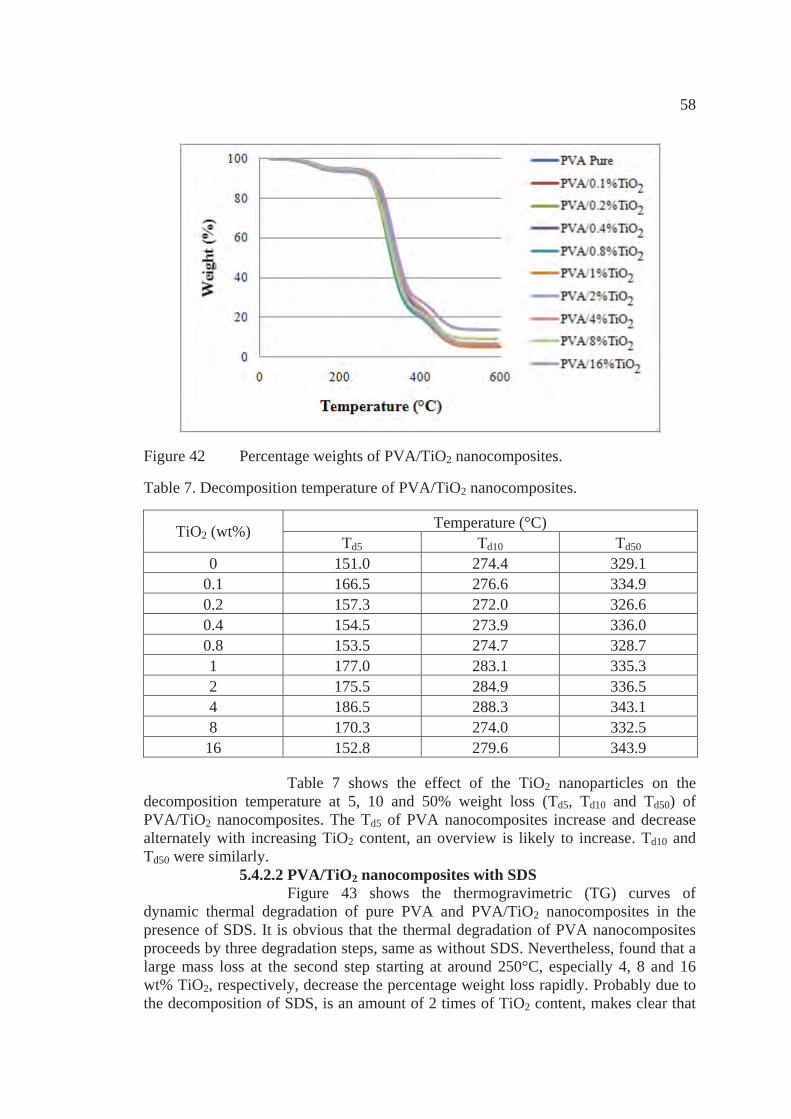
58
Figure 42 Percentage weights of PVA/TiO2 nanocomposites.
Table 7. Decomposition temperature of PVA/TiO2 nanocomposites.
TiO2 (wt%) Temperature (°C) Td5 Td10 Td50
0 151.0 274.4 329.1 0.1 166.5 276.6 334.9 0.2 157.3 272.0 326.6 0.4 154.5 273.9 336.0 0.8 153.5 274.7 328.7 1 177.0 283.1 335.3 2 175.5 284.9 336.5 4 186.5 288.3 343.1 8 170.3 274.0 332.5 16 152.8 279.6 343.9
Table 7 shows the effect of the TiO2 nanoparticles on the decomposition temperature at 5, 10 and 50% weight loss (Td5, Td10 and Td50) of PVA/TiO2 nanocomposites. The Td5 of PVA nanocomposites increase and decrease alternately with increasing TiO2 content, an overview is likely to increase. Td10 and Td50 were similarly. 5.4.2.2 PVA/TiO2 nanocomposites with SDS Figure 43 shows the thermogravimetric (TG) curves of dynamic thermal degradation of pure PVA and PVA/TiO2 nanocomposites in the presence of SDS. It is obvious that the thermal degradation of PVA nanocomposites proceeds by three degradation steps, same as without SDS. Nevertheless, found that a large mass loss at the second step starting at around 250°C, especially 4, 8 and 16 wt% TiO2, respectively, decrease the percentage weight loss rapidly. Probably due to the decomposition of SDS, is an amount of 2 times of TiO2 content, makes clear that
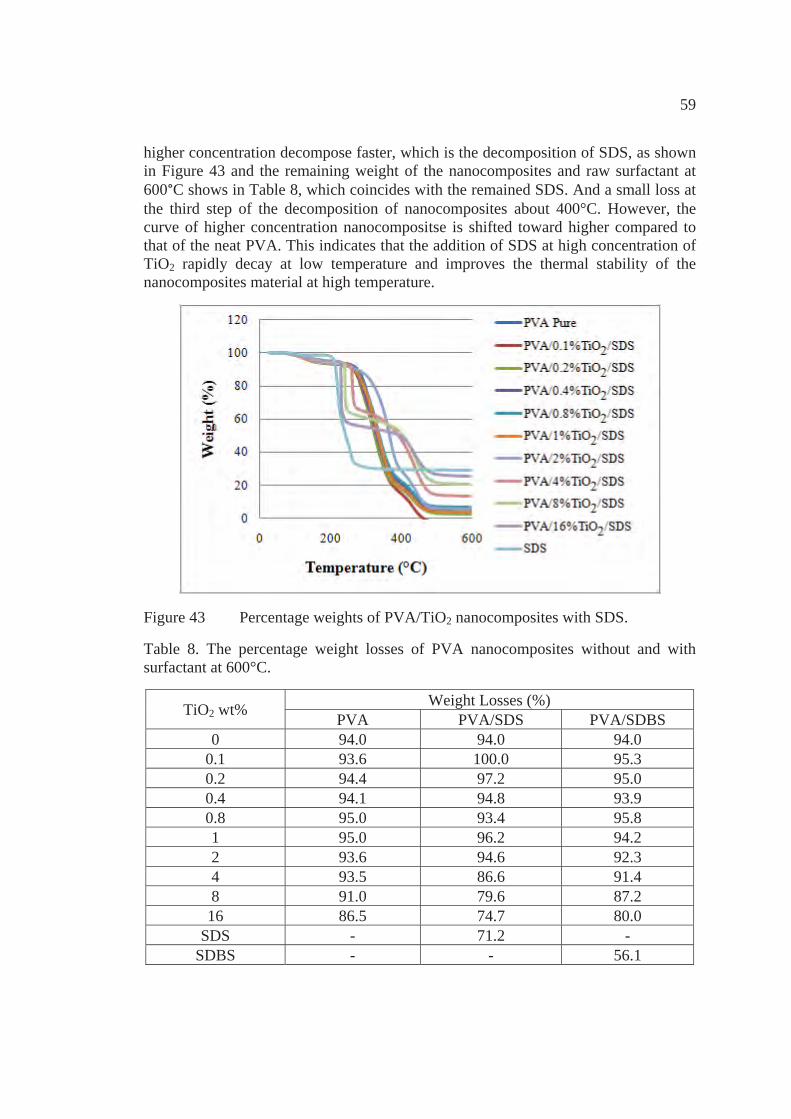
59
higher concentration decompose faster, which is the decomposition of SDS, as shown in Figure 43 and the remaining weight of the nanocomposites and raw surfactant at 600°C shows in Table 8, which coincides with the remained SDS. And a small loss at the third step of the decomposition of nanocomposites about 400°C. However, the curve of higher concentration nanocompositse is shifted toward higher compared to that of the neat PVA. This indicates that the addition of SDS at high concentration of TiO2 rapidly decay at low temperature and improves the thermal stability of the nanocomposites material at high temperature.
Figure 43 Percentage weights of PVA/TiO2 nanocomposites with SDS.
Table 8. The percentage weight losses of PVA nanocomposites without and with surfactant at 600°C.
TiO2 wt% Weight Losses (%) PVA PVA/SDS PVA/SDBS
0 94.0 94.0 94.0 0.1 93.6 100.0 95.3 0.2 94.4 97.2 95.0 0.4 94.1 94.8 93.9 0.8 95.0 93.4 95.8 1 95.0 96.2 94.2 2 93.6 94.6 92.3 4 93.5 86.6 91.4 8 91.0 79.6 87.2 16 86.5 74.7 80.0
SDS - 71.2 - SDBS - - 56.1
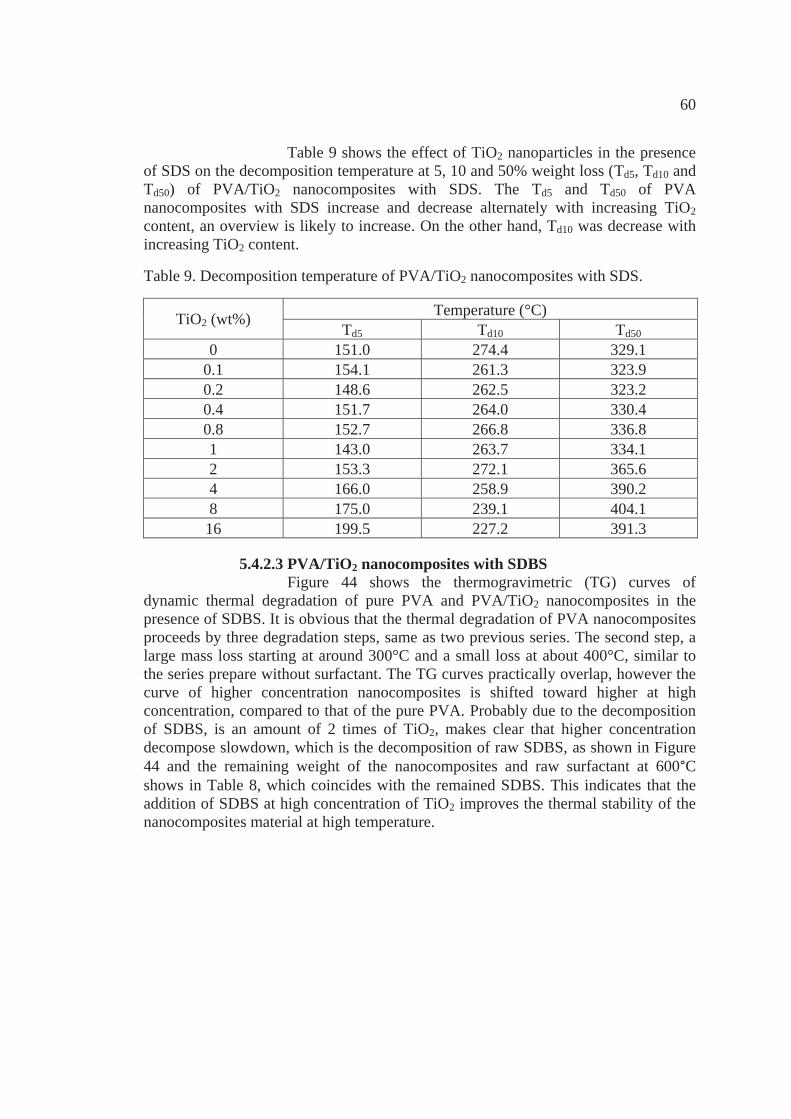
60
Table 9 shows the effect of TiO2 nanoparticles in the presence of SDS on the decomposition temperature at 5, 10 and 50% weight loss (Td5, Td10 and Td50) of PVA/TiO2 nanocomposites with SDS. The Td5 and Td50 of PVA nanocomposites with SDS increase and decrease alternately with increasing TiO2 content, an overview is likely to increase. On the other hand, Td10 was decrease with increasing TiO2 content.
Table 9. Decomposition temperature of PVA/TiO2 nanocomposites with SDS.
TiO2 (wt%) Temperature (°C) Td5 Td10 Td50
0 151.0 274.4 329.1 0.1 154.1 261.3 323.9 0.2 148.6 262.5 323.2 0.4 151.7 264.0 330.4 0.8 152.7 266.8 336.8 1 143.0 263.7 334.1 2 153.3 272.1 365.6 4 166.0 258.9 390.2 8 175.0 239.1 404.1 16 199.5 227.2 391.3
5.4.2.3 PVA/TiO2 nanocomposites with SDBS Figure 44 shows the thermogravimetric (TG) curves of dynamic thermal degradation of pure PVA and PVA/TiO2 nanocomposites in the presence of SDBS. It is obvious that the thermal degradation of PVA nanocomposites proceeds by three degradation steps, same as two previous series. The second step, a large mass loss starting at around 300°C and a small loss at about 400°C, similar to the series prepare without surfactant. The TG curves practically overlap, however the curve of higher concentration nanocomposites is shifted toward higher at high concentration, compared to that of the pure PVA. Probably due to the decomposition of SDBS, is an amount of 2 times of TiO2, makes clear that higher concentration decompose slowdown, which is the decomposition of raw SDBS, as shown in Figure 44 and the remaining weight of the nanocomposites and raw surfactant at 600°C shows in Table 8, which coincides with the remained SDBS. This indicates that the addition of SDBS at high concentration of TiO2 improves the thermal stability of the nanocomposites material at high temperature.
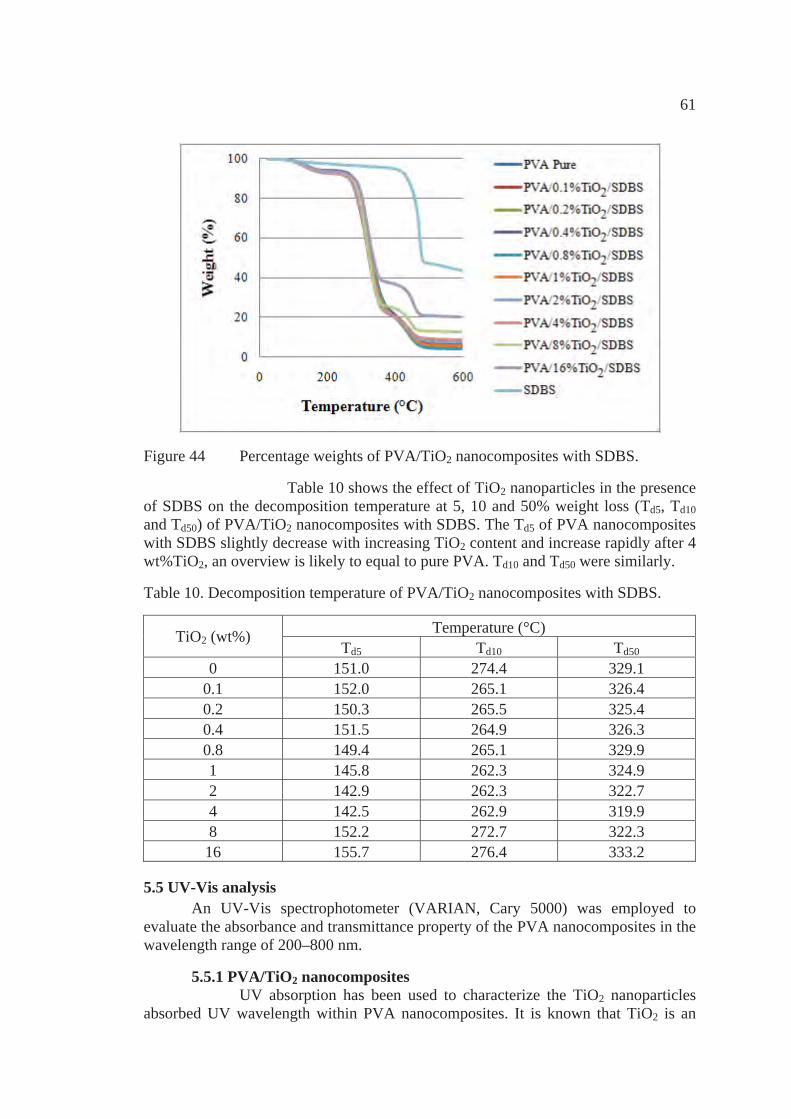
61
Figure 44 Percentage weights of PVA/TiO2 nanocomposites with SDBS.
Table 10 shows the effect of TiO2 nanoparticles in the presence of SDBS on the decomposition temperature at 5, 10 and 50% weight loss (Td5, Td10 and Td50) of PVA/TiO2 nanocomposites with SDBS. The Td5 of PVA nanocomposites with SDBS slightly decrease with increasing TiO2 content and increase rapidly after 4 wt%TiO2, an overview is likely to equal to pure PVA. Td10 and Td50 were similarly.
Table 10. Decomposition temperature of PVA/TiO2 nanocomposites with SDBS.
TiO2 (wt%) Temperature (°C) Td5 Td10 Td50
0 151.0 274.4 329.1 0.1 152.0 265.1 326.4 0.2 150.3 265.5 325.4 0.4 151.5 264.9 326.3 0.8 149.4 265.1 329.9 1 145.8 262.3 324.9 2 142.9 262.3 322.7 4 142.5 262.9 319.9 8 152.2 272.7 322.3 16 155.7 276.4 333.2
5.5 UV-Vis analysis An UV-Vis spectrophotometer (VARIAN, Cary 5000) was employed to
evaluate the absorbance and transmittance property of the PVA nanocomposites in the wavelength range of 200–800 nm.
5.5.1 PVA/TiO2 nanocomposites UV absorption has been used to characterize the TiO2 nanoparticles absorbed UV wavelength within PVA nanocomposites. It is known that TiO2 is an
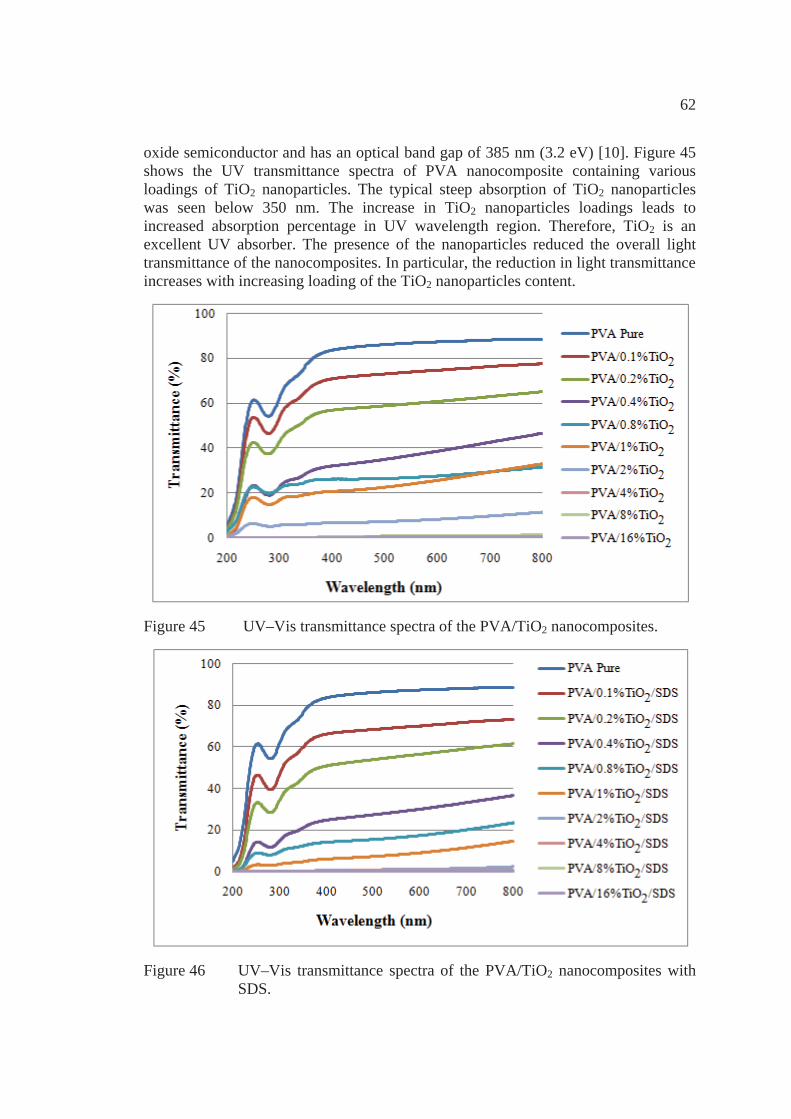
62
oxide semiconductor and has an optical band gap of 385 nm (3.2 eV) [10]. Figure 45 shows the UV transmittance spectra of PVA nanocomposite containing various loadings of TiO2 nanoparticles. The typical steep absorption of TiO2 nanoparticles was seen below 350 nm. The increase in TiO2 nanoparticles loadings leads to increased absorption percentage in UV wavelength region. Therefore, TiO2 is an excellent UV absorber. The presence of the nanoparticles reduced the overall light transmittance of the nanocomposites. In particular, the reduction in light transmittance increases with increasing loading of the TiO2 nanoparticles content.
Figure 45 UV–Vis transmittance spectra of the PVA/TiO2 nanocomposites.
Figure 46 UV–Vis transmittance spectra of the PVA/TiO2 nanocomposites with SDS.
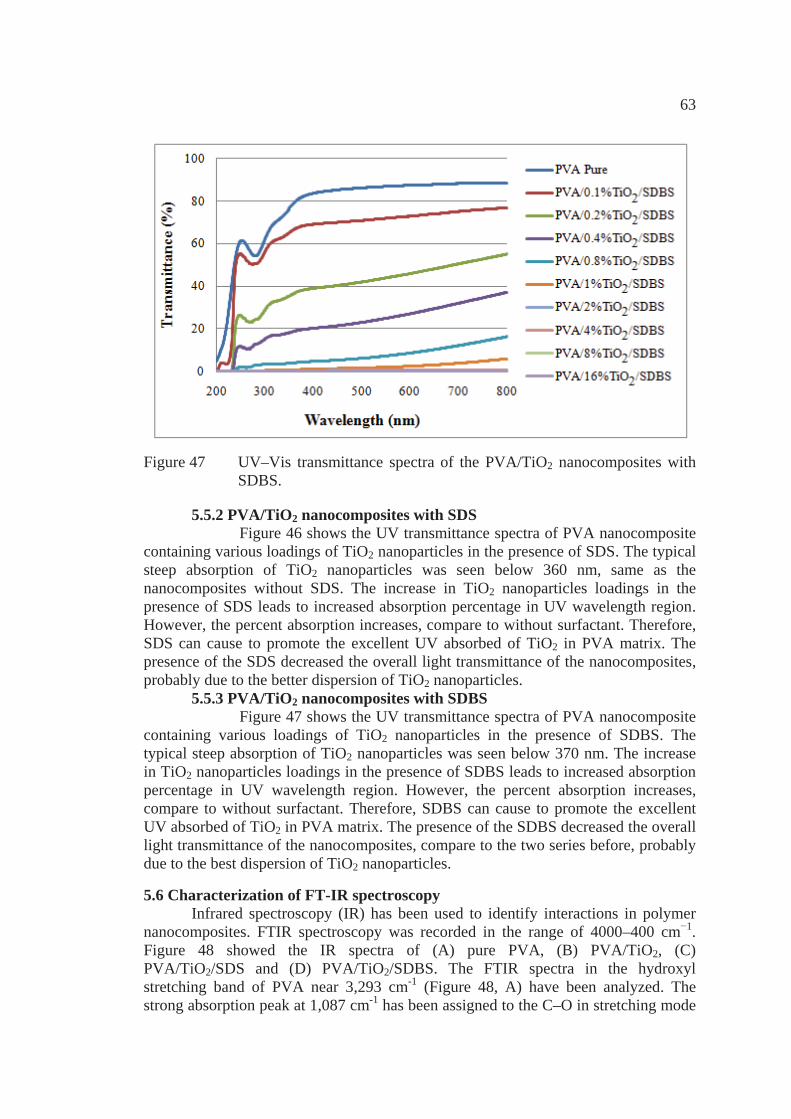
63
Figure 47 UV–Vis transmittance spectra of the PVA/TiO2 nanocomposites with SDBS.
5.5.2 PVA/TiO2 nanocomposites with SDS Figure 46 shows the UV transmittance spectra of PVA nanocomposite containing various loadings of TiO2 nanoparticles in the presence of SDS. The typical steep absorption of TiO2 nanoparticles was seen below 360 nm, same as the nanocomposites without SDS. The increase in TiO2 nanoparticles loadings in the presence of SDS leads to increased absorption percentage in UV wavelength region. However, the percent absorption increases, compare to without surfactant. Therefore, SDS can cause to promote the excellent UV absorbed of TiO2 in PVA matrix. The presence of the SDS decreased the overall light transmittance of the nanocomposites, probably due to the better dispersion of TiO2 nanoparticles. 5.5.3 PVA/TiO2 nanocomposites with SDBS Figure 47 shows the UV transmittance spectra of PVA nanocomposite containing various loadings of TiO2 nanoparticles in the presence of SDBS. The typical steep absorption of TiO2 nanoparticles was seen below 370 nm. The increase in TiO2 nanoparticles loadings in the presence of SDBS leads to increased absorption percentage in UV wavelength region. However, the percent absorption increases, compare to without surfactant. Therefore, SDBS can cause to promote the excellent UV absorbed of TiO2 in PVA matrix. The presence of the SDBS decreased the overall light transmittance of the nanocomposites, compare to the two series before, probably due to the best dispersion of TiO2 nanoparticles.
5.6 Characterization of FT-IR spectroscopy Infrared spectroscopy (IR) has been used to identify interactions in polymer nanocomposites. FTIR spectroscopy was recorded in the range of 4000–400 cm−1. Figure 48 showed the IR spectra of (A) pure PVA, (B) PVA/TiO2, (C) PVA/TiO2/SDS and (D) PVA/TiO2/SDBS. The FTIR spectra in the hydroxyl stretching band of PVA near 3,293 cm-1 (Figure 48, A) have been analyzed. The strong absorption peak at 1,087 cm-1 has been assigned to the C–O in stretching mode
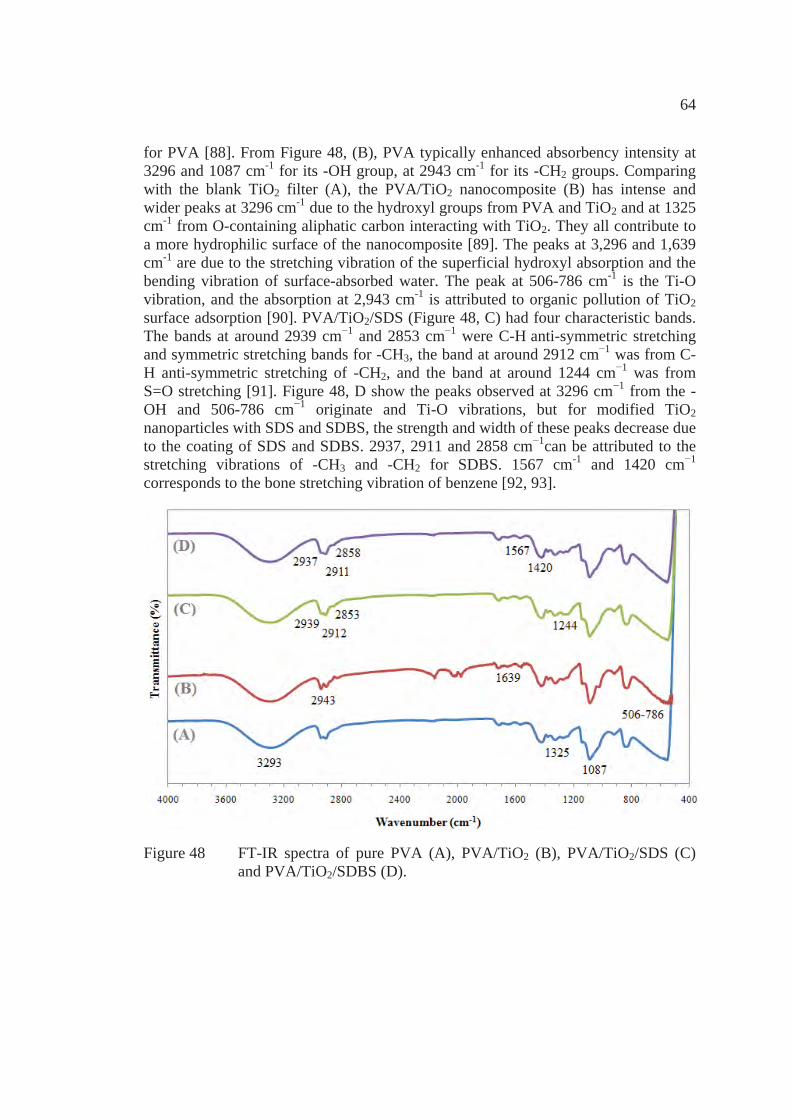
64
for PVA [88]. From Figure 48, (B), PVA typically enhanced absorbency intensity at 3296 and 1087 cm-1 for its -OH group, at 2943 cm-1 for its -CH2 groups. Comparing with the blank TiO2 filter (A), the PVA/TiO2 nanocomposite (B) has intense and wider peaks at 3296 cm-1 due to the hydroxyl groups from PVA and TiO2 and at 1325 cm-1 from O-containing aliphatic carbon interacting with TiO2. They all contribute to a more hydrophilic surface of the nanocomposite [89]. The peaks at 3,296 and 1,639 cm-1 are due to the stretching vibration of the superficial hydroxyl absorption and the bending vibration of surface-absorbed water. The peak at 506-786 cm-1 is the Ti-O vibration, and the absorption at 2,943 cm-1 is attributed to organic pollution of TiO2 surface adsorption [90]. PVA/TiO2/SDS (Figure 48, C) had four characteristic bands. The bands at around 2939 cm−1 and 2853 cm−1 were C-H anti-symmetric stretching and symmetric stretching bands for -CH3, the band at around 2912 cm−1 was from C-H anti-symmetric stretching of -CH2, and the band at around 1244 cm−1 was from S=O stretching [91]. Figure 48, D show the peaks observed at 3296 cm−1 from the -OH and 506-786 cm−1 originate and Ti-O vibrations, but for modified TiO2 nanoparticles with SDS and SDBS, the strength and width of these peaks decrease due to the coating of SDS and SDBS. 2937, 2911 and 2858 cm−1can be attributed to the stretching vibrations of -CH3 and -CH2 for SDBS. 1567 cm-1 and 1420 cm−1 corresponds to the bone stretching vibration of benzene [92, 93].
Figure 48 FT-IR spectra of pure PVA (A), PVA/TiO2 (B), PVA/TiO2/SDS (C) and PVA/TiO2/SDBS (D).
65
CHAPTER 6 CONCLUSIONS
This study examined the effect of surfactant on the dispersion of TiO2 nanoparticles in PVA matrix and its influence on TiO2 distribution. PVA/TiO2 nanocomposites without and with surfactant have been successfully prepared by simple and inexpensive solution mixing and ultrasonic process.
The dispersion of TiO2 in PVA matrix Solution casting method can homogeneously dispersed of TiO2 nanoparticles, only few aggregates exist. However, at high concentrations led to agglomeration of TiO2 particles, especially 8 and 16 wt% of TiO2. Participation of surfactant being well distributed TiO2 throughout the entire polymer matrix, especially SDBS is can be obviously seen that the large cluster at high concentration (8 and 16 wt%) were missing.
Mechanical properties The results of the experiment showed that the presence of TiO2 in PVA matrix had enhanced in tensile strength, stress at break and Young’s modulus after adding a low content of TiO2 and dropped slightly with increasing TiO2 content nanoparticles. But percent strain at break decreased with increasing TiO2 content. Moreover, the nanocomposites prepared with the use of SDS had mechanical properties higher than the nanocomposites prepared without surfactant and with SDBS, respectively. On the other hand, the presence of SDBS can improve the mechanical properties was less than each other, because the presence of SDBS increased moisture, water absorption, to the nanocomposites. Although, the existing participant of surfactant was promoted the distribution of TiO2 nanoparticles in PVA matrix, preferably existing participant of SDBS.
Thermo mechanical property The storage modulus (E´) of pure PVA and their nanocomposites of all sample decreased with increasing temperature because of increased chain mobility of the PVA components. The storage modulus (E´) of all system, found that E´ of PVA/TiO2/SDS was higher than PVA/TiO2 and PVA/TiO2/SDBS, respectively.
Thermal properties The addition of TiO2 nanoparticles to produced PVA/TiO2 nanocomposites without and with surfactant, the decomposition temperatures of the nanocomposites increase with increasing TiO2 content. The addition of TiO2 nanoparticles significantly decreased the percentage crystallinity and slightly increased the glass transition temperatures of the PVA/TiO2 nanocomposites. Nevertheless, the existence both of surfactant did not affect the percentage crystallinity and Tg. Addition of TiO2 nanoparticles and surfactant in PVA matrix did not affect on the melting point temperature and crystallization temperature.
66
UV-Vis analysis UV absorption of PVA/TiO2 nanocomposites increased absorption percentage with increasing TiO2 content. And the nanocomposites with SDS had absorption percentage higher than the nanocomposites prepared without. However, the presence of the SDBS increased the overall light transmittance of the nanocomposites, compare to the two series before, probably due to the best dispersion of TiO2 nanoparticles.
Recommendation 1. To improve the experimental it is recommended as determine appropriate balance of SDBS in helping the dispersion of TiO2 nanoparticles. 2. Prevent water absorption of the specimen by adding the desiccant in the PVA/TiO2/SDBS nanocomposites.
67
REFERENCES
[1] Majdzadeh-Ardakani, K., and B. Nazari. (2010). “Improving the mechanical properties of thermoplastic starch/poly(vinyl alcohol)/clay nanocomposites.” Composites Science and Technology 70, 10 (September): 1557–1563.
[2] Wei Zhang et al. (2011). “Mechanochemical activation of cellulose and its thermoplastic polyvinyl alcohol ecocomposites with enhanced physicochemical properties.” Carbohydrate Polymers 83, 1 (January): 257–263.
[3] Zheng Peng, Ling Xue Kong, and Si Dong Li. (2005). “Dynamic mechanical analysis of polyvinyl alcohol/silica nanocomposite.” Synthetic Metals 152, 1-3 (September): 25-28.
[4] Roohani, M. et al. (2008). “Cellulose whiskers reinforced polyvinyl alcohol copolymers nanocomposites.” European Polymer Journal 44, 8 (August): 2489–2498.
[5] DeMerlis, C.C., and D.R. Schoneker. (2003). “Review of the oral toxicity of polyvinyl alcohol (PVA).” Food and Chemical Toxicology 41, 3 (March): 319–326.
[6] Wetzel, B., Frank Haupert, and Ming Qiu Zhang. (2003). “Epoxy nanocomposites with high mechanical and tribological performance.” Composites Science and Technology 63, 14 (November): 2055–2067.
[7] Song Ie Song, and Byoung Chul Kim. (2004). “Characteristic rheological features of PVA solutions in water-containing solvents with different hydration states.” Polymer 45, 7 (March): 2381–2386.
[8] Seoudi, R., S. Abd El Mongy, and A.A. Shabaka. (2008). “Effect of polyvinyl alcohol matrices on the structural and spectroscopic studies of CdSe nanoparticles.” Physical B 403, 10-11 (May): 1781–1786.
[9] Mallakpour, S., and Samaneh Soltanian. (2010). “Studies on syntheses and morphology characteristic of chiral novel poly(esterimide)/TiO2 bionanocomposites derived from L-henylalanine based diacid.” Polymer 51, 23 (October): 5369-5376.
[10] Mallakpoura, S., and Abdolvahid Barati. (2011). “Efficient preparation of hybrid nanocomposite coatings based on poly(vinyl alcohol) and silane coupling agent modified TiO2 nanoparticles.” Progress in Organic Coatings 71, 4 (August): 391–398.
[11] Jia-cheng GAO et al. (2006). “Characteristics and properties of surface coated nano-Ti02.” Transactions of Nonferrous Metals Society of China 16, 6 (December): 1252-1258.
[12] García-González, Carlos A. et al. (2009). “Preparation of silane-coated TiO2 nanoparticles in supercritical CO2.” Journal of Colloid and Interface Science 338, 2 (October): 491–499.
[13] Shah, Rhutesh K., and D.R. Paul. (2004). “Nylon 6 nanocomposites prepared by a melt mixing masterbatch process.” Polymer 45, 9 (April): 2991–3000.
[14] Koji Nakane et al. (2004). “Properties of poly(vinyl butyral)/TiO2 nanocomposites formed by sol–gel process.” Composites Part B: Engineering 35, 3 (January): 219–222.
68
[15] Chunlei Wang et al. (2010). “Preparation and characterization of magnetic hollow PMMA nanospheres via in situ emulsion polymerization.” Colloids and Surfaces A: Physicochemical and Engineering Aspects 363, 1-3 (June): 71–77.
[16] Saikia, D. et al. (2011). “Synthesis and characterization of CdS/PVA nanocomposite thin films from a complexing agent free system.” Materials Chemistry and Physics 131, 1-2 (December): 223–229.
[17] Price, Gareth J., Emma J. Lenz, and Christopher W.G. Ansell. (2002). “The effect of high intensity ultrasound on the synthesis of some polyurethanes.” European Polymer Journal 38, 8 (August): 1531–1536.
[18] Biron, Michel. (2007). Thermoplastics and Thermoplastic Composites: Technical Information for Plastics Users. China: Butterworth-Heinemann, Elsevier, Oxford.
[19] Ramirez, Anibal M. et al. (2010). “Titanium dioxide coated cementitious materials for air purifying purposes: Preparation, characterization and toluene removal potential.” Building and Environment 45, 4 (April): 832–838.
[20] Supin Sangsuk (2007). Nanotechnology and Security: Titanium dioxide. Accessed January 20. Available from http://www.chemtrack.org/News-Detail.asp?TID=5&ID=3
[21] Markowska-Szczupak, A., K. Ulfig, and A.W. Morawski. (2011). “The application of titanium dioxide for deactivation of bioparticulates: An overview.” Catalysis Today 169, 1 (July): 249–257.
[22] Fumio Furukawa et al. (2011). “Lack of skin carcinogenicity of topically applied titanium dioxide nanoparticles in the mouse.” Food and Chemical Toxicology 49, 4 (April): 744–749.
[23] Akira Fujishima, Tata N. Rao, and Donald A. Tryk. (2000). “Titanium dioxide photocatalysis.” Journal of Photochemistry and Photobiology C: Photochemistry Reviews 1, 1 (June): 1–21.
[24] Edenbaum, Jess. (1992). Plastics Additives and Modifiers Handbook. New York: Van Nostrand Reinhold.
[25] Carp, O., C.L. Huisman, and A. Reller. (2004). “Photoinduced reactivity of titanium dioxide.” Progress in Solid State Chemistry 32, 1-2: 33–177.
[26] Natthakarn Romyen, Supakanok Thongyai, and Piyasan Praserthdam. (2010). “Surfactant-Dispersed Carbon Black in Polyimide Nanocomposites: Spectroscopic Monitoring of the Dispersion State in the Polymer Matrix.” Journal of Applied Polymer Science 115, 3 (February): 1622-1629.
[27] Banat, I.M., R.S. Makkar, and S.S. Cameotra. (2000). “Potential commercial applications of microbial surfactants.” Apply Microbiological Biotechnology 53, 5 (May): 495–508.
[28] Micelle. (2010). Accessed January 22. Available from http://chemistry.tutorvista.com/biochemistry/micelle.html
[29] FLEXISOLV™ solvent solutions. (2012). Sodium Dodecyl Sulfate. Accessed January 22. Available from http://chemistry.about.com/od/factsstructures/ig/ Chemical-Structures---S/Sodium-Dodecyl-Sulfate.htm
[30] Rosen, Milton J. (2004). Surfactants and interfacial phenomena. 3rd ed. Hoboken, New Jersey: John Wiley & Sons, Inc.
69
[31] Piret, J., A. Désormeaux, and M.G. Bergeron. (2002). “ Sodium Lauryl Sulfate, a Microbicide Effective Against Enveloped and Nonenveloped Viruses.” Current Drug Targets 3, 1 (February): 17-30.
[32] Adams, Michael A. (1985). “Substances That Modify the Perception of Sweetness: Characterization and Measurement of Flavor Compounds.” ACS Symposium Series 289 (November): 11-25.
[33] SIGMA-ALDRICH® (2012). Sodium dodecylbenzenesulfonate. Accessed January 28. Available from http://www.sigmaaldrich.com/catalog/product/ aldrich/289957?lang=en®ion=TH
[34] Zhang, Chunlong et al. (1999). “Aerobic biodegradation kinetics of four anionic and nonionic surfactants at sub- and supra-critical micelle concentration (CMCs).” Water Research 33, 1 (January): 115-124.
[35] Henry Kuo Feng Cheng et al. (2012). “Improvement in Properties of Multiwalled Carbon Nanotube/Polypropylene Nanocomposites Through Homogeneous Dispersion with the Aid of Surfactants.” Journal of Applied Polymer Science 124, 2 (April): 1117-1127.
[36] Niramon Sanguanwong, Vitsarut Khamnonwat, and Angsumon Sangkhaphan. (2008). “Effect of Titanium dioxide on the Properties of Polyoxymethylene/ Titanium dioxide Nanocomposites.” B.Eng. dissertation, Department of Chemical Engineering, Faculty of Engineering and Industrial Technology, Silpakorn University.
[37] Harper, Charles A. (2006). Handbook of Plastic Processes. Hoboken, New Jersey: John Wiley & Sons, Inc.
[38] KEY to METALS (2012). Engineering Stress-strain Curve. Accessed May 29. Available from http://www.keytometals.com/page.aspx?ID=CheckArticle& site=ktn&NM=107
[39] Larson, B.F. (2012). Tensile properties. Accessed May 29. Available from http://www.ndt-ed.org
[40] Grellmann, Wolfgang, and Sabine Seidler. (2007). Polymer testing. Germany: Hanser Publications.
[41] Pilato, Louis. (2010). Phenolic Resins: A Century of Progress. Heidelberg, Dordrecht, London, New York: Springer.
[42] UNIVERSITY of WASHINGTON (2012). Differential Scanning Calorimeter. Accessed May 29. Available from http://depts.washington.edu/cidb4bio/ dsc.shtml
[43] FLEMING Polymer Testing & Consultancy (2008). Improving profitability through testing: Differential Scanning Calorimetry & Thermo-Gravimetric Analysis. Accessed September 30. Available from http://www.flemingptc.co.uk/our-services/dsc-tga/
[44] Russell, Scott D., and Charles P. Daghlian. (2005). “Scanning electron microscopic observations on deembedded biological tissue sections: Comparison of different fixatives and embedding materials.” Journal of Electron Microscopy Technique 2, 5 (February): 489–495.
[45] Gan, Yong X. (2012). “Review: Structural assessment of nanocomposites.” Micron 43, 7 (July): 782–817.
70
[46] Ultraviolet–visible spectroscopy. (2012). Accessed July 18. Available from http://www.monzir-pal.net/Lab%20Manuals/Practical%20Instrumental% 20Analysis/Instrument%20Book/Instbook/UV_Vis%20Spect.htm
[47] UV-Vis Spectrophotometer. (2012). Accessed July 18. Available from http://www.nanotec.or.th
[48] Selvin, Thomas P., Joseph Kuruvilla, and Thomas Sabu. (2004). “Mechanical properties of titanium dioxide-filled polystyrene microcomposites.” Materials Letters 58, 3-4 (January): 281– 289.
[49] Ratna, D. et al. (2006). “Poly(ethylene oxide)/clay nanocomposite: Thermo mechanical properties and morphology.” Polymer 47, 11 (May): 4068–4074.
[50] Ismail, H. et al. (2008). “Morphological, thermal and tensile properties of halloysite nanotubes filled ethylene propylene diene monomer (EPDM) nanocomposites.” Polymer Testing 27, 7 (October): 841–850.
[51] Lee, J. et al. (2008). “Properties of nano-ZnO/poly(vinyl alcohol)/poly(ethylene oxide) composite thin films.” Current Applied Physics 8, 1 (January): 42–47.
[52] Gong, Guan et al. (2011). “Tensile behavior, morphology and viscoelastic analysis of cellulose nanofiber-reinforced (CNF) polyvinyl acetate (PVAc).” Composites Part A: Applied Science and Manufacturing 42, 9 (September): 1275–1282.
[53] Zidan, H.M. (1999). “Effect of AgNO3 filling and UV-irradiation on the structure and morphology of PVA films.” Polymer Testing 18, 6 (September): 449–461.
[54] Jayasekara, R. et al. (2004). “Preparation, surface modification and characterisation of solution cast starch PVA blended films.” Polymer Testing 23, 1 (February): 17–27.
[55] Wei Chen et al. (2005). “Enhanced mechanical properties and morphological characterizations of poly(vinyl alcohol)–carbon nanotube composite films.” Applied Surface Science 252, 5 (December): 1404–1409.
[56] Yuezhen Bin et al. (2006). “Morphology and mechanical and electrical properties of oriented PVA–VGCF and PVA–MWNT composites.” Polymer 47, 4 (February): 1308–1317.
[57] Hongmei Wang et al. (2007). “Synthesis and characterization of CdS/PVA nanocomposite films.” Applied Surface Science 253, 20 (August): 8495–8499.
[58] García-Cerda, L.A., M.U. Escareño-Castro, and M. Salazar-Zertuche. (2007). “Preparation and characterization of polyvinyl alcohol–cobalt ferrite nanocomposites.” Journal of Non-Crystalline Solids 353, 8-10 (April): 808–810.
[59] Xin Jia et al. (2007). “Preparation and properties of poly(vinyl alcohol)/silica nanocomposites derived from copolymerization of vinyl silica nanoparticles and vinyl acetate.” European Polymer Journal 43, 4 (April): 1123–1131.
[60] Zheng Peng, and Ling Xue Kong. (2007). “A thermal degradation mechanism of polyvinyl alcohol/silica nanocomposites.” Polymer Degradation and Stability 92, 6 (June): 1061-1071.
[61] Krklješ, A.N. et al. (2007). “Dynamic thermogravimetric degradation of gamma radiolytically synthesized Ag–PVA nanocomposites.” Thermochimica Acta 460, 1-2 (August): 28–34.
71
[62] Lu, Jue, Tao Wang, and Lawrence T. Drzal. (2008). “Preparation and properties of microfibrillated cellulose polyvinyl alcohol composite materials.” Composites Part A: Applied Science and Manufacturing 39, 5 (May): 738–746.
[63] Yajuan Yang, Changhua Liu, and Haixia Wu. (2009). “Preparation and properties of poly(vinyl alcohol)/exfoliated α-zirconium phosphate nanocomposite films.” Polymer Testing 28, 4 (June): 371–377.
[64] Gautam, Anurag, and S. Ram. (2010). “Preparation and thermomechanical properties of Ag-PVA nanocomposite films.” Materials Chemistry and Physics 119, 1-2 (January): 266–271.
[65] Yingxu Chen et al. (2001). “Heterogeneous photocatalytic oxidation of polyvinyl alcohol in water.” Journal of Photochemistry and Photobiology A: Chemistry 142, 1 (August): 85–89.
[66] Sairam, Malladi et al. (2006). “Novel dense poly(vinyl alcohol)–TiO2 mixed matrix membranes for pervaporation separation of water–isopropanol mixtures at 30°C.” Journal of Membrane Science 281, 1-2 (September): 95–102.
[67] Chun-Chen Yang. (2007). “Synthesis and characterization of the cross-linked PVA/TiO2 composite polymer membrane for alkaline DMFC.” Journal of Membrane Science 288, 1-2 (February): 51–60.
[68] Scienza, Lisete C., and George E. Thompson. (2001). “Preparation and Surface Analysis of PPY/SDBS Films on Aluminum Substrates.” Polímeros: Ciência e Tecnologia 11: 142-148.
[69] Su, Shengpei, David D. Jiang, and Charles A. Wilkie. (2004). “Study on the thermal stability of polystyryl surfactants and their modified clay nanocomposites.” Polymer Degradation and Stability 84, 2 (May): 269-277.
[70] Limpanart, S. et al. (2005). “Effect of the surfactant coverage on the preparation of polystyrene–clay nanocomposites prepared by melt intercalation.” Materials Letters 59, 18 (August): 2292 – 2295.
[71] Mandalia, Tushar, and Faїza Bergaya. (2006). “Organo clay mineral–melted polyolefin nanocomposites Effect of surfactant/CEC ratio.” Journal of Physics and Chemistry of Solids 67, 4 (April): 836–845.
[72] Chigwada, Grace, Dongyan Wang, and Charles A. Wilkie. (2006). “Polystyrene nanocomposites based on quinolinium and pyridinium surfactants.” Polymer Degradation and Stability 91, 4 (April): 848-855.
[73] Yan Geng et al. (2008). “Effects of surfactant treatment on mechanical and electrical properties of CNT/epoxy nanocomposites.” Composites Part A: Applied Science and Manufacturing 39, 12 (December): 1876–1883.
[74] Goh, P.S. et al. (2010). “Surfactant dispersed multi-walled carbon nanotube/polyetherimide nanocomposite membrane.” Solid State Sciences 12, 12 (December): 2155-2162.
[75] Donghua Zhou et al. (2011). “Synthesis of polyaniline nanofibers with high electrical conductivity from CTAB–SDBS mixed surfactants.” Materials Letters 65, 23-24 (December): 3601–3604.
[76] Hung-Han Ko, Yao-Yi Cheng, and Ching-Wei Wang. (2013). “Study of Surfactant Modified MWNT/Polyimide Composites by In-Situ Polymerization.” 2013 IEEE 5th International Nanoelectronics Conference (INEC): 492-494.
72
[77] Dhakal, H.N., Z.Y. Zhang, and M.O.W. Richardson. (2007). “Effect of water absorption on the mechanical properties of hemp fibre reinforced unsaturated polyester composites.” Composites Science and Technology 67, 7-8 (June): 1674-1683.
[78] Manamperi, Wajira A.R., and Scott W. Pryor. (2012). “Properties of Canola Protein-based Plastics and Protein Isolates Modified Using SDS and SDBS.” Journal of the American Oil Chemists’ Society 89, 3 (March): 541-549.
[79] Lin Li, Minoru Mizuhata, and Shigehito Deki. (2005). “Preparation and characterization of alkyl sulfate and alkylbenzene sulfonate surfactants/TiO2 hybrid thin films by the liquid phase deposition (LPD) method.” Applied Surface Science 239, 3-4(January): 292–301.
[80] Henry Kuo Feng Cheng et al. (2012). “Improvement in Properties of Multiwalled Carbon Nanotube/Polypropylene Nanocomposites Through Homogeneous Dispersion with the Aid of Surfactants.” Journal of Applied Polymer Science 124, 2 (April): 1117–1127.
[81] Islam, Md. Saiful et al. (2012). “Tropical wood polymer nanocomposite (WPNC): The impact of nanoclay on dynamic mechanical thermal properties.” Composites Science and Technology 72, 16 (November): 1995–2001.
[82] Feldstein, Mikhail M. et al. (2003). “Relation of glass transition temperature to the hydrogen bonding degree and energy in poly(N-vinyl pyrrolidone) blends with hydroxyl-containing plasticizers: 3. Analysis of two glass transition temperatures featured for PVP solutions in liquid poly(ethylene glycol).” Polymer 44, 6 (March):1819–1834.
[83] Jung, Jinwoo et al. (2010). “Preparations and thermal properties of micro- and nano-BN dispersed HDPE composites.” Thermochimica Acta 499, 1-2 (February): 8–14.
[84] Sirirat Wacharawichanant et al. (2011). “Effect of Vanadium Pentoxide on the Mechanical, Thermal, and Electrical Properties of Poly(vinyl alcohol)/ Vanadium Pentoxide Nanocomposites.” Journal of Applied Polymer Science 121, 5 (September): 2870-2876.
[85] Krklješ, Aleksandra N. et al. (2007). “Radiolytic synthesis and characterization of Ag-PVA nanocomposites.” European Polymer Journal 43, 6 (June): 2171–2176.
[86] Gilmanl, Jeffrey W., David L. VanderHart, and Takashi Kashiwagi. (1994). “Fire and PoLymers II: Materials and Test for Hazard Prevention: Thermal Decomposition Chemistry of Poly(vinyl alcohol).” ACS Symposium Series 599 (August): 161-185.
[87] Katančić, Zvonimir et al. (2013). “Thermal decomposition of fire-retarded high-impact polystyrene and high-impact polystyrene/ethylene–vinyl acetate blend nanocomposites followed by thermal analysis.” Journal of Elastomers & Plastics (March): 1-20.
[88] Abd El-Mohdy, H.L., and S. Ghanem. (2009). “Biodegradability, antimicrobial activity and properties of PVA/PVP hydrogels prepared by γ-irradiation.” Journal of Polymer Research 16, 1 (January): 1–10.
[89] Lifen Liu, Chuanqi Zhao, and Fenglin Yang. (2012). “TiO2 and polyvinyl alcohol (PVA) coated polyester filter in bioreactor for wastewater treatment.” Water research 46, 6 (April): 1969-1978.
73
[90] Weiwei Zou et al. (2009). “A simple approach for preparing a visible-light TiO2 photocatalyst.” Research on Chemical Intermediates 35, 6-7 (December): 717–726.
[91] Xiuxiu Ruan et al. (2013). “Sorption of aqueous organic contaminants onto dodecyl sulfate intercalated magnesium iron layered double hydroxide.” Applied Clay Science 72 (February): 96–103.
[92] Bao-Xiang Wang, Yan Zhao, and Xiao-Peng Zhao. (2007). “The wettability, size effect and electrorheological activity of modified titanium oxide nanoparticles.” Colloids and Surfaces A: Physicochemical and Engineering Aspects 295, 1-3 (March): 27–33.
[93] Viana, R.B., Albérico B. F. da Silva, and André S. Pimentel. (2012). “Infrared Spectroscopy of Anionic, Cationic, and Zwitterionic Surfactants.” Advances in Physical Chemistry 2012 (June): 1-14.
APPENDIX
APPENDIX A
NOMENCLATURE
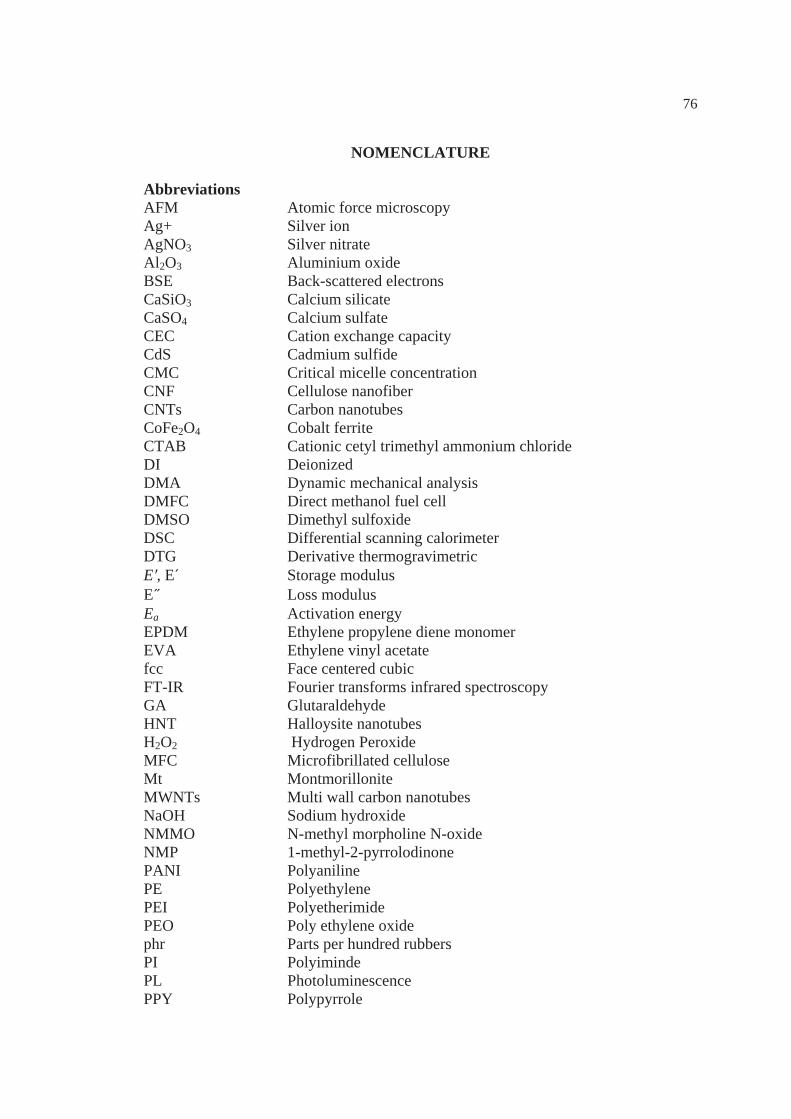
76
NOMENCLATURE
Abbreviations AFM Atomic force microscopy Ag+ Silver ion AgNO3 Silver nitrate Al2O3 Aluminium oxide BSE Back-scattered electrons CaSiO3 Calcium silicate CaSO4 Calcium sulfate CEC Cation exchange capacity CdS Cadmium sulfide CMC Critical micelle concentration CNF Cellulose nanofiber CNTs Carbon nanotubes CoFe2O4 Cobalt ferrite CTAB Cationic cetyl trimethyl ammonium chloride DI Deionized DMA Dynamic mechanical analysis DMFC Direct methanol fuel cell DMSO Dimethyl sulfoxide DSC Differential scanning calorimeter DTG Derivative thermogravimetric Eʹ, E´ Storage modulus E˝ Loss modulus Ea Activation energy EPDM Ethylene propylene diene monomer EVA Ethylene vinyl acetate fcc Face centered cubic FT-IR Fourier transforms infrared spectroscopy GA Glutaraldehyde HNT Halloysite nanotubes H2O2 Hydrogen Peroxide MFC Microfibrillated cellulose Mt Montmorillonite MWNTs Multi wall carbon nanotubes NaOH Sodium hydroxide NMMO N-methyl morpholine N-oxide NMP 1-methyl-2-pyrrolodinone PANI Polyaniline PE Polyethylene PEI Polyetherimide PEO Poly ethylene oxide phr Parts per hundred rubbers PI Polyiminde PL Photoluminescence PPY Polypyrrole
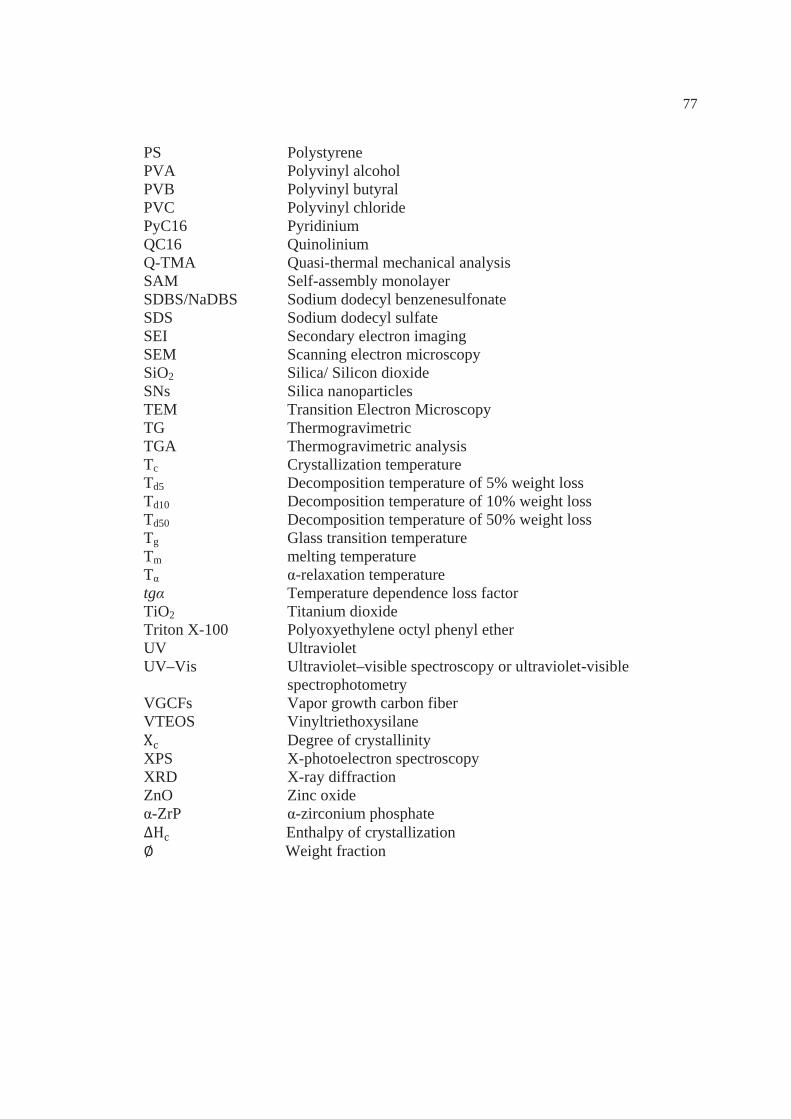
77
PS Polystyrene PVA Polyvinyl alcohol PVB Polyvinyl butyral PVC Polyvinyl chloride PyC16 Pyridinium QC16 Quinolinium Q-TMA Quasi-thermal mechanical analysis SAM Self-assembly monolayer SDBS/NaDBS Sodium dodecyl benzenesulfonate SDS Sodium dodecyl sulfate SEI Secondary electron imaging SEM Scanning electron microscopy SiO2 Silica/ Silicon dioxide SNs Silica nanoparticles TEM Transition Electron Microscopy TG Thermogravimetric TGA Thermogravimetric analysis Tc Crystallization temperature Td5 Decomposition temperature of 5% weight loss Td10 Decomposition temperature of 10% weight loss Td50 Decomposition temperature of 50% weight loss Tg Glass transition temperature Tm melting temperature Tα α-relaxation temperature tgα Temperature dependence loss factor TiO2 Titanium dioxide Triton X-100 Polyoxyethylene octyl phenyl ether UV Ultraviolet UV–Vis Ultraviolet–visible spectroscopy or ultraviolet-visible spectrophotometry VGCFs Vapor growth carbon fiber VTEOS Vinyltriethoxysilane
Degree of crystallinity XPS X-photoelectron spectroscopy XRD X-ray diffraction ZnO Zinc oxide α-ZrP α-zirconium phosphate
Enthalpy of crystallization Weight fraction
APPENDIX B
International Proceeding
79
International Proceeding
Niramon Sanguanwong and Sirirat Wacharawichanant, “Effect of Titanium Dioxide on Mechanical, Thermal and Morphological Properties of Polyvinyl alcohol/Titanium dioxide Nanocomposites,” Pure and Applied Chemistry International Conference 2012 (PACCON 2012), Chiang Mai, Thailand, 11-13 Jan, 2012 (Poster presentation)
Niramon Sanguanwong and Sirirat Wacharawichanant, “Preparation and Properties of Polyvinyl Alcohol/Titanium Dioxide Nanocomposites in the Presence of Surfactant,” TIChE International Conference 2012, Nakornratchasima, Thailand, 25-26 Oct, 2012 (Oral presentation) Received the Certificates Second-Place Outstanding Paper.
80
Biography
Name-Family name Miss Niramon Sanguanwong Birth 21st May 1986 in Nakhon Pathom, Thailand Address 59/1 M.5 T. Thungnoi A. Mueang Nakhon Pathom, Nakhon
Pathom, Thailand, 73000. Tel. 089-6127741 Education 2005 High school certificate from Phrapathom Wittayalai School. 2008 Received the degree of the Bachelor of Engineering, Faculty of
Engineering and Industrial Technology, Silpakorn University, Nakhon Pathom, Thailand.
2012 Further studied in the degree of the master of Chemical Engineering at graduate school, Faculty of Engineering and Industrial Technology, Graduate School, Silpakorn University, Thailand.


![Titanium dioxide and modified titanium dioxide by silver ...cdmf.org.br/wp-content/uploads/2019/02/Titanium-dioxide...zinc oxide [6,7], titanium dioxide [8,9], hydroxyapatite and chlorhexidine,](https://img.pdfslide.us/doc/110x75/60ff91e8d40a2e46c9475976/titanium-dioxide-and-modified-titanium-dioxide-by-silver-cdmforgbrwp-contentuploads201902titanium-dioxide.jpg)