Embed Size (px)
Citation preview
Journal of Engineering Science and Technology Vol. 8, No. 1 (2013) 34 - 43 © School of Engineering, Taylor’s University
34
EFFECTS OF TIN ON HARDNESS, WEAR RATE AND COEFFICIENT OF FRICTION OF CAST CU-NI-SN ALLOYS
S. ILANGOVAN*, R. SELLAMUTHU
Amrita Vishwa Vidyapeetham, Amrita School of Engineering,
Amrita University, Ettimadai Campus, Coimbatore, Tamilnadu, India
*Corresponding Author: [email protected]
Abstract
An investigation was carried out to understand the effects of Sn on hardness,
wear rate and the coefficient of friction of spinodal Cu-Ni-Sn alloys. Alloys of
appropriate compositions were melted in a crucible furnace under argon
atmosphere and cast into sand moulds. Solution heat treated and aged
specimens were tested for hardness, wear rate and the coefficient of friction. It
was found that the hardness increases when the Sn content increases from 4% to
8% in the solution heat treated conditions. The peak aging time is found to
decrease with an increase in the Sn content. Further, the coefficient of friction is
independent of hardness whereas the wear rate decreases linearly with hardness
irrespective of Sn content.
Keywords: Cu-Ni-Sn alloy, Coefficient of friction, Spinodal decomposition,
Wear rate, Heat treatment.
1. Introduction
The strength of materials can be enhanced by using various common techniques
such as grain size refinement, strain hardening, solid solution hardening, quench
hardening, dispersion strengthening and precipitation hardening [1]. Spinodal
hardening is an emerging technique by which the strength of bronze alloys can
also be enhanced [2-5]. It refers to a process in which a supersaturated solid
solution decomposes into solute-rich and solute-depleted regions when it is aged
at a suitable temperature [6]. As a result, a modulated structure forms within the
solid and subsequent aging results in the formation of an ordered structure [6-8].
The strain field around the modulated structure produced by spinodal
decomposition along with the ordered structure impedes the dislocation motion
and thereby causes hardening to occur [5]. During the aging process, it has been
Effects of Tin on Hardness, Wear Rate and Coefficient of Friction of …… 35
Journal of Engineering Science and Technology February 2013, Vol. 8(1)
Nomenclatures
Cu Copper
DO22 Microstructure of ordering reaction
DO3 Microstructure of grain boundary precipitates
HRC Rockwell Hardness in C scale
Ni Nickel
Ra Roughness average value
Sn Tin
wt.% Weight Percentage
Greek Symbols
α Alpha phase
µ Coefficient of friction
reported that the strength of the alloy increases up to three times depending on (i)
alloy composition (ii) amount of cold work prior to aging and (iii) aging
temperature [4].
A number of studies were conducted on spinodal bronze (Cu-Ni-Sn) alloys to
assess the microstructures and the mechanical properties, but a limited studies
were conducted to determine the wear behavior as these alloys are potential
candidates likely to be used in high performance wear applications [9, 10].
Deyong et al. have reported the effect of Sn content on the hardness of Cu-Ni-Sn
alloys while keeping Ni fixed at 10 wt. % [11]. Zhang et al. [9, 10] have studied
the wear behavior of Cu-15Ni-8Sn spinodal alloy in relation to the hardness
whereas Singh et al. [12] have investigated the wear behavior of Cu-15Ni-8Sn
alloy with respect to the type of debris that formed during wear testing. Further,
Deyong et al. [11] have used both rapid and normal cooling method to prepare
their alloys. They have specified melt-spinning as the technique to obtain
extremely high cooling rate while they have not stated how they made the normal
cooling rate alloys.
Since Cu-Ni-Sn alloys are likely candidates to be used in bearings, wear plates
etc., in critical applications, it is necessary to evaluate the wear behavior with
respect to various alloy compositions, aging temperature and time. Since casting
is the most economical manufacturing process, an investigation with reference to
a specific casting method is highly warranted. This will lead to wide application
for these alloys. Therefore, in this present study, the effects of Sn on hardness,
wear rate and the coefficient of friction of Cu-Ni-Sn alloys while keeping Ni
content constant is discussed. Additional information sought in this work is the
contributing effect of Sn to the spinodal process when it is increased from a low
to a high concentration. Further, green sand casting method has been used to
make the specimens for this study.
2. Experimental Procedures
The sand mould was prepared by using metal pattern. Cu-Ni-Sn alloys of
compositions Cu-6Ni-4Sn, Cu-6Ni-6Sn and Cu-6Ni-8Sn were melted in a graphite
crucible using a muffle type melting furnace under inert argon atmosphere. The
molten metal was poured at 1250°C into the sand molds. The cast specimens were
36 S. Ilangovan and R. Sellamuthu
Journal of Engineering Science and Technology February 2013, Vol. 8(1)
of the size diameter 0.016 m × 0.15 m lengths. After the casting process, the
chemical compositions of the castings were analyzed using spectrometer. The
spectroscopy results are reported in Table 1. The alloy compositions were found to
be within a variation of ± 0.2 wt. % from the nominal composition.
Table 1. Spectroscopy Results of the Alloy Compositions.
Element Cu-6Ni-4Sn Cu-6Ni-6Sn Cu-6Ni-8Sn
Ni 6.2 6.2 6.2
Sn 3.9 5.8 8.0
Cu Balance Balance Balance
The cast specimens were homogenized at 820°C for 10 hours and cooled in
the furnace itself. Solution heat-treatment was performed for 1 hour at 820°C and
rapidly quenched in water in order to maintain the α phase (solid solution of Sn
and Ni in Cu) in the supersaturated condition. Solution heat treated specimens
were then aged for 1 to 5 hours at 350±5°C and water quenched. All the above
heat treatment procedures were performed under inert nitrogen atmosphere. Test
specimens were prepared from as cast, homogenized, solution treated and aged
conditions for various measurements.
The Mitutoyo make (USA) hardness tester was used to measure the micro-
hardness of the specimens at various locations and an average value was
calculated from several readings.
The specimens required for friction and wear tests were machined to a size of
diameter 0.01m × 0.035 m lengths. The Ducom make (Bangalore, India) pin-on-
disc tribometer was used to conduct the test in dry sliding condition in air. The
counter-part rotating disc was made from EN31 alloy steel stock and hardened to
63 HRC with surface roughness of Ra 0.15 µm. Table 2 shows the fixed
parameters used for conducting the tests.
Table 2. Friction and Wear Testing Parameters.
Test Parameters Unit Test Values
Speed rpm 636
Velocity m/s
3
Track Radius m 0.045
Time s 600
Sliding Distance m 1800
Load Applied N 20
Following were determined using the data obtained from the data acquisition
system available in the tribometer: (i) height loss, µm versus time, sec (ii)
coefficient of friction versus time, sec and (iii) frictional force versus time, sec.
The wear rate expressed as m3/m (volume loss per meter sliding distance).
Carl-Zeiss Inverted Metallurgical Microscope (Germany) with a CCD camera
attachment was used for the microscopic study. Standard metallographic
procedure was used for the specimen preparation and etched.

Effects of Tin on Hardness, W
Journal of Engineering Science and Technology
3. Results and Discussion
A typical as-cast dendritic microstructure of
The dendritic structure was fully eliminated by the homogenization and the
solution heat treatments as shown in Fig
Fig. 1. Typical As-Cast Micro
structure of Cu-6Ni-8Sn Alloy
As reported previously, the spinodal decomposition (modulated structure) and
an ordering reaction (DO22 structure) take
8]. The modulated and the ordered structures are very fine and cannot be resolved
by the optical microscopy [9].
Figure 3 shows the microstructure of Cu
When the specimen is over-aged, precipitates started to form along the grain
boundaries, an observation in agreement with that of Zhang et al. in the case of
Cu-15Ni-8Sn alloy [9]. It has been reported that the grain boundary precipitates
are equilibrium α and γ (DO3) phases [4, 6, 7, 9] and completely fills the structure
upon prolonged aging [9]. We have aged our specimens for a short period and
therefore Fig. 3 does not show complete
Zhang et al. [9] have noted that equilibrium precipitates form within one hour of
aging whereas it took three hours in our case and the difference in this behavior is
attributed to the difference in the Ni content
Fig. 3. Microstructure of 3
Alloy Showing
Figure 4 shows the variation in the hardness of Cu
function of aging time. As the aging progre
, Wear Rate and Coefficient of Friction of …… 37
Journal of Engineering Science and Technology February 2013, Vol. 8(1)
cast dendritic microstructure of Cu-6Ni-8Sn alloy is shown in Fig. 1.
The dendritic structure was fully eliminated by the homogenization and the
solution heat treatments as shown in Fig. 2.
Micro- Fig.2 Typical homogenized and
lloy. Solution Heat Treated Micro-
structure of Cu-6Ni-8Sn Alloy.
As reported previously, the spinodal decomposition (modulated structure) and
structure) takes place during the aging process [4, 6-
The modulated and the ordered structures are very fine and cannot be resolved
Figure 3 shows the microstructure of Cu-6Ni-8Sn alloy aged for 3 hours.
aged, precipitates started to form along the grain
boundaries, an observation in agreement with that of Zhang et al. in the case of
has been reported that the grain boundary precipitates
) phases [4, 6, 7, 9] and completely fills the structure
upon prolonged aging [9]. We have aged our specimens for a short period and
3 does not show complete filling with equilibrium phases. Further,
Zhang et al. [9] have noted that equilibrium precipitates form within one hour of
aging whereas it took three hours in our case and the difference in this behavior is
attributed to the difference in the Ni content.
Microstructure of 3 Hours Aged Cu-6Ni-8Sn
howing Grain Boundary Precipitates.
Figure 4 shows the variation in the hardness of Cu-6Ni-xSn alloys as a
function of aging time. As the aging progresses, the hardness increases, reaches a
38 S. Ilangovan and R. Sellamuthu
Journal of Engineering Science and Technology
maximum and decreases as can be noted in Fig
attributed to the change in microstructure of the specimen during aging. The
formation of modulated and ordered meta
hardness to a maximum value during the aging process and subsequently, the
formation of grain boundary precipitates (equilibrium
hardness [4, 6, 7, 9].The trend observed in this study is in agreement with th
Zhang et al. [9] for Cu-15Ni-8Sn alloy and Deyong et al. [
be concluded that the hardness of a given alloy is dependent on the aging time.
Fig. 4. Variation of
Figure 5 shows the variation of peak hardness with Sn content of this study.
Included in the figure are the data of Deyong et al. [
pertaining to (i) rapid solidification by melting spinning (Data
conventional ingot casting (Data
10, 12 wt. percentages of Sn with fixed Ni content of 10 wt. %. It is observed from
the plot that in all the three cases the peak hardness increases with Sn content. The
behavior observed in this study is in agreement with Deyong et al. data 1 and 2.
Also it is to be noted that the magnitude of the peak hardness observed is marginally
different from each other and this difference is attributed to the difference in Ni
content and aging temperature. Therefore, it is concluded from the results that an
increase in Sn content increases the peak hardness of the alloy.
Fig. 5. Variation of
The variation of the peak aging time is plotted against the Sn content in
along with the data of Deyong et al. taken from their results. It is observed from
Fig. 6 that the peak aging time decreases when Sn content increases in all the
three cases. It is observed for a particular wt. % Sn alloy, the peak aging time
marginally varies between this study and that of Deyong et al. This variation may
ellamuthu
Journal of Engineering Science and Technology February 2013, Vol. 8(1)
maximum and decreases as can be noted in Fig. 4. The variation in the hardness is
attributed to the change in microstructure of the specimen during aging. The
formation of modulated and ordered meta-stable (DO22) structures increases the
hardness to a maximum value during the aging process and subsequently, the
formation of grain boundary precipitates (equilibrium α and γ (DO3)) reduces the
hardness [4, 6, 7, 9].The trend observed in this study is in agreement with that of
8Sn alloy and Deyong et al. [11]. Therefore, it can
be concluded that the hardness of a given alloy is dependent on the aging time.
Variation of Hardness with Aging Time.
Figure 5 shows the variation of peak hardness with Sn content of this study.
Included in the figure are the data of Deyong et al. [11] taken from their results
pertaining to (i) rapid solidification by melting spinning (Data -1) and (ii)
casting (Data-2) for aging at 400°C of various alloys having 6, 8,
10, 12 wt. percentages of Sn with fixed Ni content of 10 wt. %. It is observed from
the plot that in all the three cases the peak hardness increases with Sn content. The
in this study is in agreement with Deyong et al. data 1 and 2.
Also it is to be noted that the magnitude of the peak hardness observed is marginally
different from each other and this difference is attributed to the difference in Ni
erature. Therefore, it is concluded from the results that an
increase in Sn content increases the peak hardness of the alloy.
Variation of Peak Hardness with Sn Content.
The variation of the peak aging time is plotted against the Sn content in Fig. 6
along with the data of Deyong et al. taken from their results. It is observed from
6 that the peak aging time decreases when Sn content increases in all the
three cases. It is observed for a particular wt. % Sn alloy, the peak aging time
inally varies between this study and that of Deyong et al. This variation may
Effects of Tin on Hardness, W
Journal of Engineering Science and Technology
be due to the variation in the Ni content between these two studies (this study
Ni and Deyong-10% Ni). So we may conclude from this result that an increase in
Sn content reduces the peak aging time of the alloy. However, it is not clear from
the studies whether rapid solidification contributes to a decrease in the peak aging
time or not. Hence, a further study to assess the effect of cooling rate on the aging
time is necessary.
Fig. 6. Variation of
In order to know the effect of Sn on the hardening process, it is necessary to
look at two different aspects of strengthening mechanisms: (i) solid solution
hardening due to dissolved Sn solutes in the matrix, (ii) spinodal hardening due to
the formation of modulated structure along with ordering reaction. As a way to
deduce the contribution by Case (i) from the experimental values, we have plotted
the hardness against the Sn content in t
Fig. 7. It can be seen from the figure that the hardness increases with the Sn
content, thereby illustrating its contributing effect to the solution hardening
aspect. Next, we have also plotted the experimental val
treatment in the same figure (Fig. 7) in order to assess the Sn contribution to the
spinodal hardening, Case (ii). In
with the Sn content. An important point to be noted is that the tr
cases are almost parallel and therefore, it can be inferred that there is no
incremental contribution due to spinodal hardening by increasing the Sn content
from 4 to 8 wt%.
Fig. 7. Variation of H
Figure 8 shows the same type of trend lines corresponding to Cases (i) and (ii)
for the data of Delong et al. in the case of rapidly solidified ribbons of Cu
alloys and these lines are also parallel to each other. Based on the results of this
study and the data of Delong et al., it can be concluded that (i) Sn induces
spinodal hardening when its content is around 4 wt. %, (ii) further increase in the
, Wear Rate and Coefficient of Friction of …… 39
Journal of Engineering Science and Technology February 2013, Vol. 8(1)
be due to the variation in the Ni content between these two studies (this study-6%
10% Ni). So we may conclude from this result that an increase in
es the peak aging time of the alloy. However, it is not clear from
the studies whether rapid solidification contributes to a decrease in the peak aging
time or not. Hence, a further study to assess the effect of cooling rate on the aging
Variation of Peak Aging Time with Sn Content.
In order to know the effect of Sn on the hardening process, it is necessary to
look at two different aspects of strengthening mechanisms: (i) solid solution
solutes in the matrix, (ii) spinodal hardening due to
the formation of modulated structure along with ordering reaction. As a way to
deduce the contribution by Case (i) from the experimental values, we have plotted
the hardness against the Sn content in the solution treated condition as shown in
7. It can be seen from the figure that the hardness increases with the Sn
content, thereby illustrating its contributing effect to the solution hardening
aspect. Next, we have also plotted the experimental values pertaining to aging
treatment in the same figure (Fig. 7) in order to assess the Sn contribution to the
spinodal hardening, Case (ii). In the Case (ii) also, the peak hardness increases
with the Sn content. An important point to be noted is that the trend lines for both
cases are almost parallel and therefore, it can be inferred that there is no
incremental contribution due to spinodal hardening by increasing the Sn content
Hardness with Sn Content (This Study).
Figure 8 shows the same type of trend lines corresponding to Cases (i) and (ii)
for the data of Delong et al. in the case of rapidly solidified ribbons of Cu-Ni-Sn
alloys and these lines are also parallel to each other. Based on the results of this
and the data of Delong et al., it can be concluded that (i) Sn induces
spinodal hardening when its content is around 4 wt. %, (ii) further increase in the
40 S. Ilangovan and R. Sellamuthu
Journal of Engineering Science and Technology
Sn content does not contribute significantly to the increase in hardness due
spinodal/order hardening and (iii) Sn contributes significantly to the increase in
hardness due solution hardening effect.
Fig. 8. Variation of Hardness with Sn
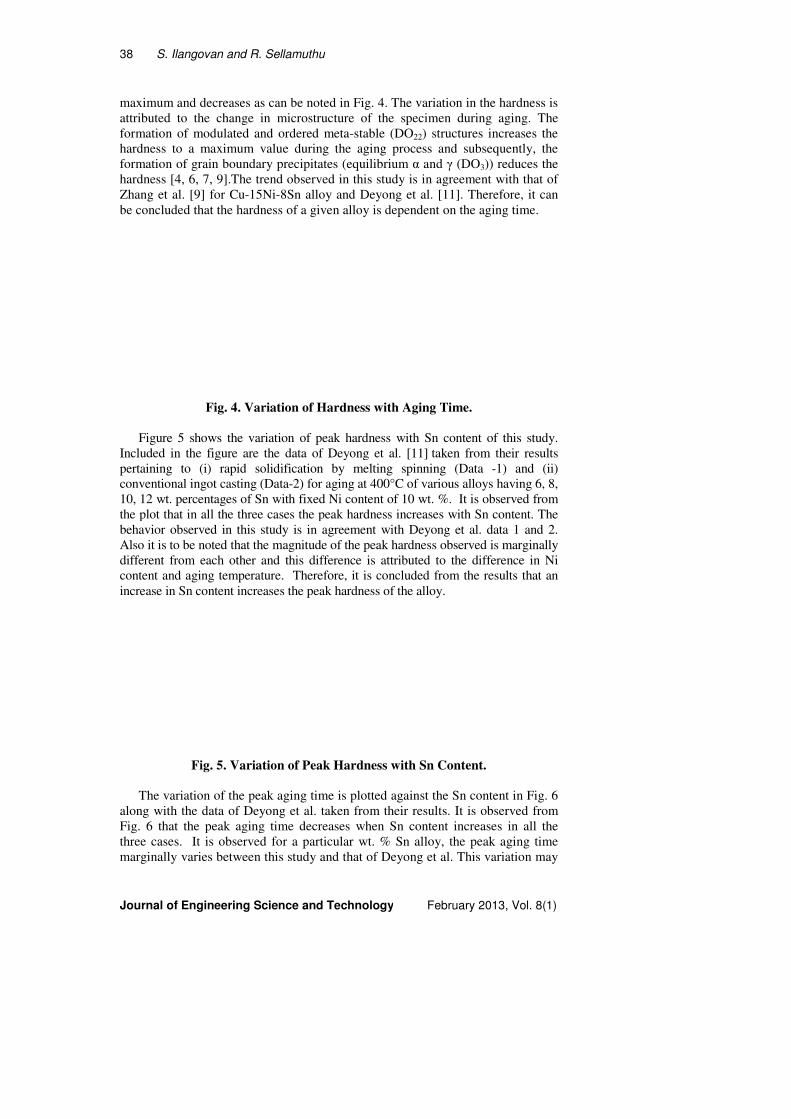
Frictional force versus time plot (Fig.
frictional force remains constant after a short period of time. The frictional force
initially increases rapidly due to uneven contact between specimen and
counterpart mating surface. Once perfect contact is achieved,
remains constant.
Fig. 9. Frictional
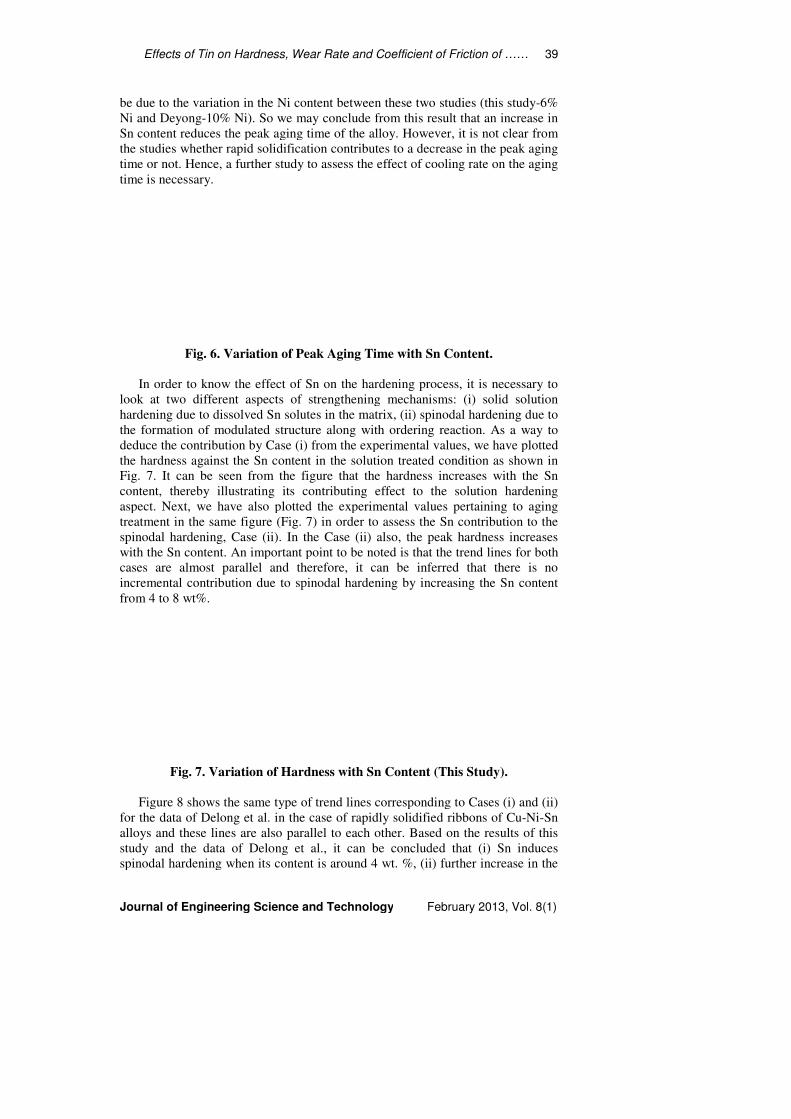
A typical plot of coefficient of friction (µ) versus time for Cu
shown in Fig. 10. The plot shows both transient period and single steady
regime. The effect of work-hardening and/or accumulation of debris
reasons for the transient behavior [1
around 0.43 as shown in Fig. 10.
Fig. 10. Coefficient of
ellamuthu
Journal of Engineering Science and Technology February 2013, Vol. 8(1)
Sn content does not contribute significantly to the increase in hardness due
g and (iii) Sn contributes significantly to the increase in
hardness due solution hardening effect.
ardness with Sn Content (Deyong Data-1).
Frictional force versus time plot (Fig. 9) of Cu-6Ni-8Sn alloy shows that the
frictional force remains constant after a short period of time. The frictional force
initially increases rapidly due to uneven contact between specimen and
counterpart mating surface. Once perfect contact is achieved, the frictional force
Frictional Force vs. Time Plot.
A typical plot of coefficient of friction (µ) versus time for Cu-6Ni-8Sn alloy is
shown in Fig. 10. The plot shows both transient period and single steady-state
hardening and/or accumulation of debris may be the
reasons for the transient behavior [12]. The COF value is constant and is equal to
10.
Coefficient of Friction vs. Time Plot.
Effects of Tin on Hardness, W
Journal of Engineering Science and Technology
Figure 11 shows the variation of COF with hardness of Cu
The value of COF is found to be around 0.43 with marginal variation. Hardness of
the alloy does not affect the COF value. An observation of this study is in
agreement with that of Zhang et al. [9, 1
noted that the COF value differ from each author (Singh:0.3 and Zhang:0.7),
which may be due to use of different counter face materials and its hardness,
surface finish, working atmosphere etc. Hence, we may conclude
that COF value is not affected by the hardness of the alloy. The present study, in
line with the previous research findings in this regard, indicates that there is no
need for aging treatment for Cu
maintained /specified.
Fig. 11. Variation of COF with
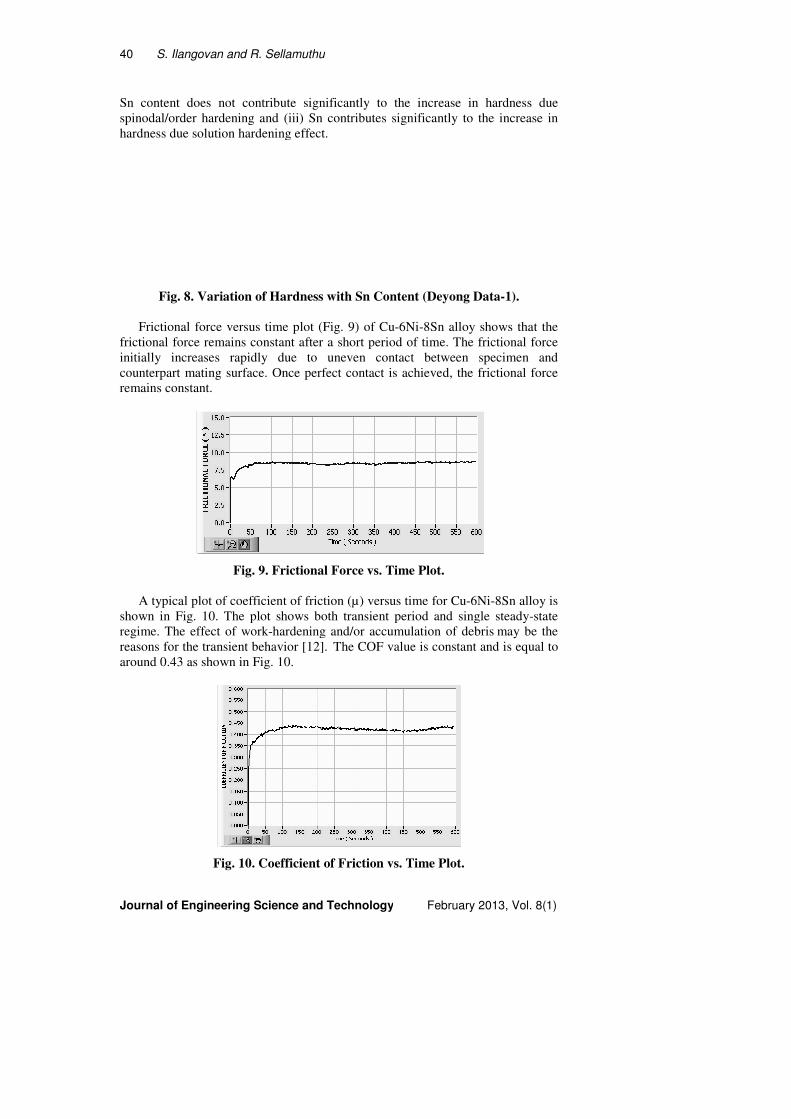
Wear versus time plot (Fig. 12) of Cu
linearly increases with sliding time. This behavior is in agreement with that of
Singh et al. [12].
Fig. 12. A Typical W
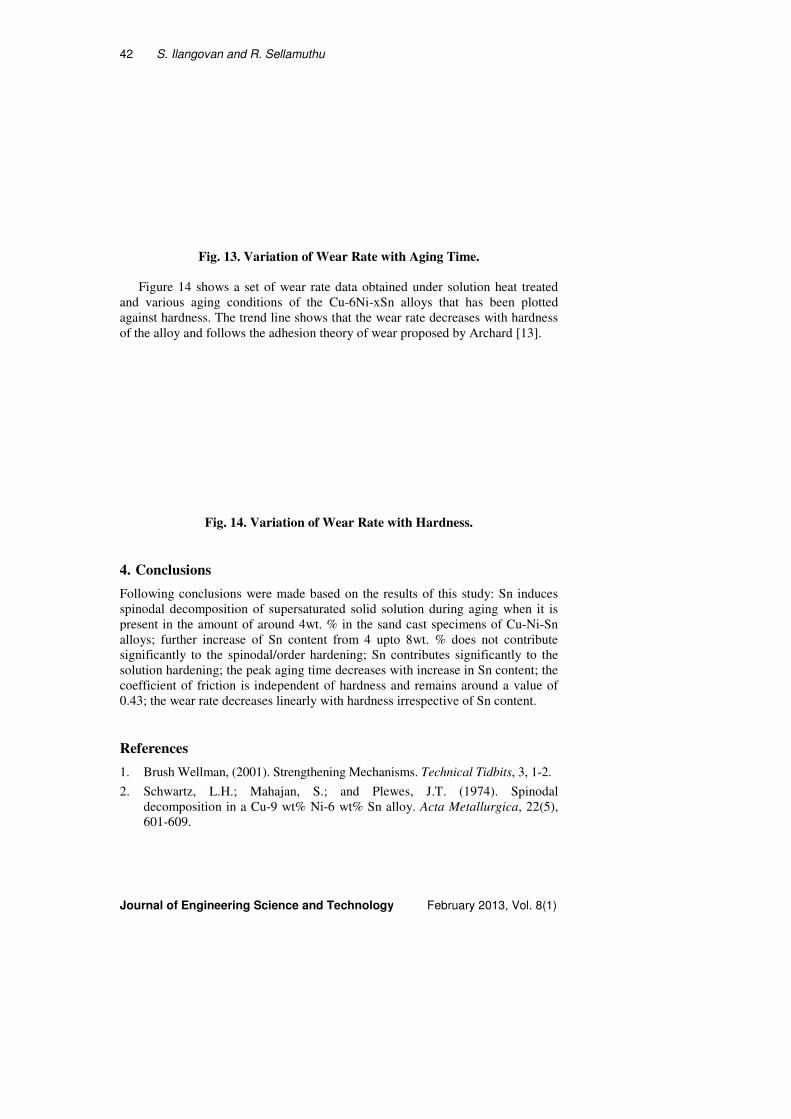
Figure 13 shows the variation of wear rate with aging time of Cu
alloys. It is observed from the figure that the wear rate varies with both aging time
and alloy compositions. The variation in w
alloy, which varies with aging time. The behavior observed in this study is
consistent with that of Zhang. Therefore, it is concluded from the result that the
addition of Sn content reduces wear rate by increasing th
varies with aging time in the case of Cu
, Wear Rate and Coefficient of Friction of …… 41
Journal of Engineering Science and Technology February 2013, Vol. 8(1)
variation of COF with hardness of Cu-6Ni-xSn alloys.
The value of COF is found to be around 0.43 with marginal variation. Hardness of
the alloy does not affect the COF value. An observation of this study is in
agreement with that of Zhang et al. [9, 10] and Singh et al. [12]. It is also to be
noted that the COF value differ from each author (Singh:0.3 and Zhang:0.7),
which may be due to use of different counter face materials and its hardness,
surface finish, working atmosphere etc. Hence, we may conclude from the results
that COF value is not affected by the hardness of the alloy. The present study, in
line with the previous research findings in this regard, indicates that there is no
need for aging treatment for Cu-Ni-Sn alloys, if COF is the only factor to be
Variation of COF with Hardness.
Wear versus time plot (Fig. 12) of Cu-6Ni-8Sn alloy shows that the wear
linearly increases with sliding time. This behavior is in agreement with that of
Wear vs. Time Plot of Cu-6Ni-8Sn Alloy.
Figure 13 shows the variation of wear rate with aging time of Cu-6Ni-xSn
alloys. It is observed from the figure that the wear rate varies with both aging time
and alloy compositions. The variation in wear rate corresponds to hardness of the
alloy, which varies with aging time. The behavior observed in this study is
consistent with that of Zhang. Therefore, it is concluded from the result that the
addition of Sn content reduces wear rate by increasing the hardness and wear rate
varies with aging time in the case of Cu-Ni-Sn alloy system.
42 S. Ilangovan and R. Sellamuthu
Journal of Engineering Science and Technology
Fig. 13. Variation of
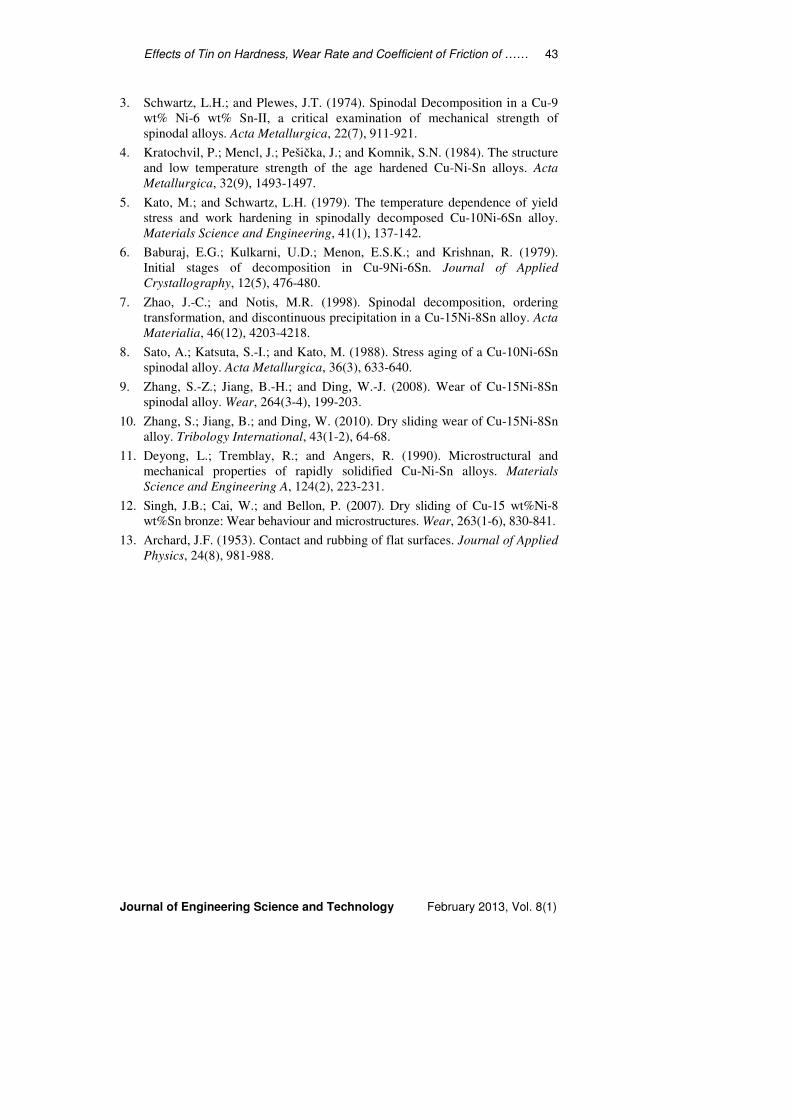
Figure 14 shows a set of wear rate data obtained under solution
and various aging conditions of
against hardness. The trend line shows that the wear rate decreases with hardness
of the alloy and follows the adhesion theory of wear proposed by Archard [13].
Fig. 14. Variation of
4. Conclusions
Following conclusions were made based on the results of this study: Sn induces
spinodal decomposition of supersaturated solid solution during aging when it is
present in the amount of around 4wt. % in the sand cast specimens of Cu
alloys; further increase of Sn content from 4 upto 8wt. % does not contribute
significantly to the spinodal/order hardening; Sn contributes significantly to the
solution hardening; the peak aging time decreases with increase in Sn content; the
coefficient of friction is independent of hardness and remains around a value of
0.43; the wear rate decreases linearly with hardness irrespective of Sn content.
References
1. Brush Wellman, (2001). Strengthening Mechanisms.
2. Schwartz, L.H.; Mahajan, S.; and Plewes, J.T. (1974).
decomposition in a Cu-9 wt% Ni
601-609.
ellamuthu
Journal of Engineering Science and Technology February 2013, Vol. 8(1)
Variation of Wear Rate with Aging Time.
Figure 14 shows a set of wear rate data obtained under solution heat treated
and various aging conditions of the Cu-6Ni-xSn alloys that has been plotted
against hardness. The trend line shows that the wear rate decreases with hardness
of the alloy and follows the adhesion theory of wear proposed by Archard [13].
Variation of Wear Rate with Hardness.
Following conclusions were made based on the results of this study: Sn induces
spinodal decomposition of supersaturated solid solution during aging when it is
present in the amount of around 4wt. % in the sand cast specimens of Cu-Ni-Sn
further increase of Sn content from 4 upto 8wt. % does not contribute
significantly to the spinodal/order hardening; Sn contributes significantly to the
solution hardening; the peak aging time decreases with increase in Sn content; the
ion is independent of hardness and remains around a value of
0.43; the wear rate decreases linearly with hardness irrespective of Sn content.
Brush Wellman, (2001). Strengthening Mechanisms. Technical Tidbits, 3, 1-2.
, L.H.; Mahajan, S.; and Plewes, J.T. (1974). Spinodal
9 wt% Ni-6 wt% Sn alloy. Acta Metallurgica, 22(5),
Effects of Tin on Hardness, Wear Rate and Coefficient of Friction of …… 43
Journal of Engineering Science and Technology February 2013, Vol. 8(1)
3. Schwartz, L.H.; and Plewes, J.T. (1974). Spinodal Decomposition in a Cu-9
wt% Ni-6 wt% Sn-II, a critical examination of mechanical strength of
spinodal alloys. Acta Metallurgica, 22(7), 911-921.
4. Kratochvil, P.; Mencl, J.; Pešička, J.; and Komnik, S.N. (1984). The structure
and low temperature strength of the age hardened Cu-Ni-Sn alloys. Acta
Metallurgica, 32(9), 1493-1497.
5. Kato, M.; and Schwartz, L.H. (1979). The temperature dependence of yield
stress and work hardening in spinodally decomposed Cu-10Ni-6Sn alloy.
Materials Science and Engineering, 41(1), 137-142.
6. Baburaj, E.G.; Kulkarni, U.D.; Menon, E.S.K.; and Krishnan, R. (1979).
Initial stages of decomposition in Cu-9Ni-6Sn. Journal of Applied
Crystallography, 12(5), 476-480.
7. Zhao, J.-C.; and Notis, M.R. (1998). Spinodal decomposition, ordering
transformation, and discontinuous precipitation in a Cu-15Ni-8Sn alloy. Acta
Materialia, 46(12), 4203-4218.
8. Sato, A.; Katsuta, S.-I.; and Kato, M. (1988). Stress aging of a Cu-10Ni-6Sn
spinodal alloy. Acta Metallurgica, 36(3), 633-640.
9. Zhang, S.-Z.; Jiang, B.-H.; and Ding, W.-J. (2008). Wear of Cu-15Ni-8Sn
spinodal alloy. Wear, 264(3-4), 199-203.
10. Zhang, S.; Jiang, B.; and Ding, W. (2010). Dry sliding wear of Cu-15Ni-8Sn
alloy. Tribology International, 43(1-2), 64-68.
11. Deyong, L.; Tremblay, R.; and Angers, R. (1990). Microstructural and
mechanical properties of rapidly solidified Cu-Ni-Sn alloys. Materials
Science and Engineering A, 124(2), 223-231.
12. Singh, J.B.; Cai, W.; and Bellon, P. (2007). Dry sliding of Cu-15 wt%Ni-8
wt%Sn bronze: Wear behaviour and microstructures. Wear, 263(1-6), 830-841.
13. Archard, J.F. (1953). Contact and rubbing of flat surfaces. Journal of Applied
Physics, 24(8), 981-988.