Embed Size (px)
Citation preview

Molecules 2010, 15, 5354-5368; doi:10.3390/molecules15085354
molecules ISSN 1420-3049
www.mdpi.com/journal/molecules
Article
Effects of Time Point Measurement on the Reconstruction of Gene Regulatory Networks
Wenying Yan, Huangqiong Zhu, Yang Yang, Jiajia Chen, Yuanyuan Zhang and Bairong Shen *
Center for Systems Biology, Soochow University, 1st Shizi Street, Suzhou, Jiangsu 215006, China
* Author to whom correspondence should be addressed; E-Mail: [email protected];
Tel.: +86-512-651-109-51; Fax: +86-512-651-109-51.
Received: 5 July 2010; in revised form: 30 July 2010 / Accepted: 2 August 2010 /
Published: 4 August 2010
Abstract: With the availability of high-throughput gene expression data in the post-
genomic era, reconstruction of gene regulatory networks has become a hot topic.
Regulatory networks have been intensively studied over the last decade and many software
tools are currently available. However, the impact of time point selection on network
reconstruction is often underestimated. In this paper we apply the Dynamic Bayesian
network (DBN) to construct the Arabidopsis gene regulatory networks by analyzing the
time-series gene microarray data. In order to evaluate the impact of time point
measurement on network reconstruction, we deleted time points one by one to yield 11
distinct groups of incomplete time series. Then the gene regulatory networks constructed
based on complete and incomplete data series are compared in terms of statistics at
different levels. Two time points are found to play a significant role in the Arabidopsis
gene regulatory networks. Pathway analysis of significant nodes revealed three key
regulatory genes. In addition, important regulations between genes, which were insensitive
to the time point measurement, were also identified.
Keywords: dynamic Bayesian networks; time points; gene regulatory network; network
statistics; network reconstruction
OPEN ACCESS

Molecules 2010, 15
5355
1. Introduction
Most biological networks, such as gene regulatory networks, protein-protein interaction networks
and metabolic networks, are known to be complex and dynamic systems. However, many gene
expression data in current microarray databases are static, which can hardly describe the life
phenomenon well. Fortunately, time series gene microarray data, which contains the temporal
information, could help with the dynamic network reconstruction, as is indicated in the gene knock-out
experiments by Geier et al. [1]. In those experiments, the smaller the time interval is, the more accurate
the result becomes. Accordingly, more data and costs are required. However, it is not desirable to
make the interval too small, since the experiment data would be far more than enough when it comes
to numerous gene observations.
Recently, many popular methods of gene regulatory network reconstruction were developed,
including Boolean networks, multiple regression analyses [1], differential equations [2,3], mutual
information [4,5], Bayesian networks (BNs) [6], etc. A Boolean network is a simple model that is
suitable for qualitative research. The differential equations method, which models the gene network
from an accurate mathematical point of view, lacks anti-noise ability and robustness. Researchers now
pay more attention to Bayesian networks, including the static Bayesian network and the dynamic
Bayesian network (DBN). The static Bayesian network, in which nodes represent random variables,
models static probabilistic dependency relations among genes from its expression data with noise [6].
Although the method is considered to be effective, it constrains the network to be acyclic, which is
contrary to the situation of real gene networks that have cyclic regulatory pathways such as feedback
loops. Hence, DBN is a more promising choice for handling time series microarray data since it can
construct cyclic pathways and describe feedback information of a system. The method represents a
directed graphical model of a stochastic process. So far, some models are proposed based on the
probability models of the dynamic Bayesian network model, such as the discrete model [7,8], vector
autoregressive regression [9], the hidden Markov model [10-13], and so forth. The gene regulatory
networks in this paper were constructed using a DBN approach with Arabidopsis time series gene
microarray data. However, for the reconstruction of a gene regulatory network, two related issues are
still unresolved. Firstly, the effect of time point measurements on the reconstruction of gene regulatory
networks, such as the number of time points, and the measurement intervals, remain to be explored.
Secondly, what kind of properties of the constructed network are robust and less sensitive to the time
point measurements, i.e. what kind of properties obtained from the constructed networks are more
credible, even when the time point measurement is not enough. To answer these two questions would
be very helpful for the design of time course data measurements and the application of gene regulatory
networks constructed with time series data. In this work, the reconstruction of the Arabidopsis gene
regulatory network was taken as a case study to answer the above questions.
2. Experimental
2.1. Data and software
The data were derived from the microarray experiments performed in the laboratory of Smith
(Edinburgh, UK) [14]. Arabidopsis were cultivated to growth stage 3.90 (Rosette growth complete)

Molecules 2010, 15
5356
[15] and labeled for leaf harvesting. It involved sampling leaves at 11 different time points: 0, 1, 2, 4,
8, 12, 13, 14, 16, 20, and 24 h (the 24 h time point is a repeat of the 0 h one), where 0 h is the onset of
dark and 12 h is the onset of light. The data are available in the NASCArrays database
(http://affymetrix.arabidopsis.info/) [16] as experiment reference NASCARRAYS-60. We used R
scripting to construct the Arabidopsis gene regulatory networks. The R package G1DBN was used to
perform Dynamic Bayesian Network reconstruction [17,18]. Other R packages, such as sna, igraph, etc
(http://mirrors.geoexpat.com/cran/) [17], were also used to analyze the network. All the related R
scripts are listed and described in the online supplementary materials (http://www.sysbio.org.cn/
Molecules2010_SupplementaryScripts.htm)
2.2. Method
2.2.1. Dynamic Bayesian network method
DBN, in which a time factor is introduced, is an extension of the Bayesian network. More precisely,
it uses time series data to construct causal connections among random variables and uses time lapse
information to construct circular regulation [19]. The network structure can be denoted as S and P,
where S is the structure of network and P is a set of conditional distribution on S. S represents a
directed acyclic graph (DAG) and its nodes correspond to the time series dynamic variables. They can
be defined as:
1 2 11 1 1 2, ,..., , ,..., ,..., ,...,p j p p
i i nX X X X X X X X (1)
where: jiX is the jth variable at time i and j
ix is the value of jth variable at time i, 1 2, ,..., pi i i iX X X X
is the vector composed by variables at time i and 1 2, ,...,j j j jnX X X X is the vector composed by jth
variable at all times.
The arc between two nodes of S represents the probabilistic relationship or causality between them.
If there is an arc, the relationship of the two nodes will be conditional dependence. Then, the DBN
model can be obtained:
11 1
1 1
,..., |pn
p j jn i i
i j
P X X P X Pa
(2)
where 0jPa , iaP
denotes the random variables that correspond to the parents of node i.
If the structure is unknown, the network will be constructed by some learning rules and relevant
criterion, which can measure networks from observed data. Given an observed data set D of variables
X, search for a network ',S such that it best matches the set D, where S′is the network structure and
θ is parameters in network. Then, a score function can express how well it matched, that is, make the
formula to be maximum:
' | ', | '' | '|
P S P D S P S dP S P D SP S D
P D P D
(3)
So far, compared to parameter learning, structure learning of DBN is much more difficult. In
general, DBN structure learning approaches are transplanted and extended from the BN approaches

Molecules 2010, 15
5357
and can be divided into two types. One is based on search and scoring method. At first, a primary
network structure is given, and then edges are added or subtracted so that the model can be improved.
Finally a network that best matches the dataset can be picked out. Another method is based on
dependent relationships and uses statistical measurements to estimate the dependence among nodes
and then construct a network based on the results. In the present work, we used the second method to
construct gene networks from the Arabidopsis gene microarray data.
2.2.2. Network structure analysis
The network structure can be analyzed using different statistics based on the analysis of nodes,
edges or the whole network. Various statistics could be analyzed for different goals. These statistics
and other of the same type are commonly known as centrality measures, connectivity indices, and/or
topological indices. The applications of these statistics cover drug molecular graphs [20,21], protein
residue networks or protein interactions networks [22], host-parasite networks or cerebral cortex
networks [23], social networks and internet [24] and other complex systems; including metabolic
networks as one of the more interesting applications [25-28]. The basic statistics for nodes are degree,
indegree and outdegree, which are defined as follows. Let , 'S V E be a directed network. V is the
set of nodes and 'E is the set of edges of network S , then the degree of a node v is the number of edges
at node v [29], which belongs to V . The indegree or outdegree of a node v is the number of edges
pointing to or out from node v in S [30]. Moreover, the diameter (Dia) is the longest shortest path of a
network[30]. Here it is calculated by using a breadth-first search like method. Some of the other statistics
adopted in this study are listed in Table 1.
Table 1. Network statistics used in this paper.
Statistics Definition Descriptions
Average degree K[29] 1
v V
K de vN
de v : the degree of node v
N: the number of nodes in network S
Average path length l [30, 32] ,
1
1 iji j
l dN N
ijd : the shortest path between iv and jv
Betweenness vB [33] , ,
/v ivj iji j i v j v
B g g
ivjg : the number of shortest paths from i
to j that pass through a node v
ijg : the number of shortest geodesic
paths from i to j.
Clustering coefficient CC[34]
t
tn
NCC
N
Nt: number of closed triplets Ntn: number of connected triples of nodes
Centralization
Ce S [35]
maxv V S
i V S
Ce S C v C i
C(v): the degree centrality for node v
and 1
de vC v
N
Global efficiency of the network E [36]
1 1
1 i j ij
EN N d
dij : shortest path length
Maximum vulnerability of the networks Vu[37]
max iE EVu
E
E: the efficiency of the network Ei : the efficiency of the network without the node i and all edges connecting it with other vertices

Molecules 2010, 15
5358
2.2.3. Arabidopsis gene regulatory networks reconstruction based on different time point deletion
To compare the effect of different time points on the reconstruction of network, groups of time
series data should be used. However it is difficult to obtain abundant time point data in an experiment.
Hence, we deleted the time points one by one to simulate the distinct groups of time series microarray
data, which included 800 genes expression level at 11 time points, recording time 0, 1, 2, 4, 8, 12, 13,
14, 16, 20 and 24 h. Each time, we deleted one time point and constructed the gene regulatory network
using the remaining time points. The networks were designated as G1, G2, G3 and G11. For instance,
the network G1 was made up by time points 1, 2, 4, 8, 12, 13, 14, 16, 20 and 24. Additionally, the
network with all the time points is denoted as G0. In order to express undulatory property of those
statistics, for example, to find which statistics are more insensitive to the time points, we defined the
relative diversity score of one statistics as follows:
| |_
| |k
k
ave Qd score
ave
(4)
where {0,1, 2,3,...,11}k , kQ is a statistics of network kG and ave is the average of kQ . It is obvious
that a low diversity score denotes a low undulatory property and here indicating the insensitivity to the
time point measurement.
3. Results and Discussion
3.1. The analysis of constructed Arabidopsis gene regulatory networks
The Arabidopsis gene regulatory network built by the DBN method using the R software is shown
in Figure 1. It consists of 800 genes and 447 gene regulations.
Figure 1. The directed network of Arabidopsis gene regulation. Red nodes represent genes
and arcs represent the regulation between genes.
Molecules 2010, 15
5359
As shown in Table 2 the Clustering Coefficient is 0.0019 (<<1) and the centralization is 0.0093.
These data indicate that the small community phenomenon was not obvious. The maximum
vulnerability of the network is 0.0302. In Table 2 related statistics for Arabidopsis gene regulatory
networks are listed. N0 is the node number whose degree is 0. Rn is the number of linear regulation
between genes. The definition of other statistics can be found in Table 1.
Table 2. The statistics of Arabidopsis gene regulatory network.
K Dia l N0 Rn E Vu CC Ce 1.1175 12 3.0467 306 447 0.0013 0.0302 0.0019 0.0093
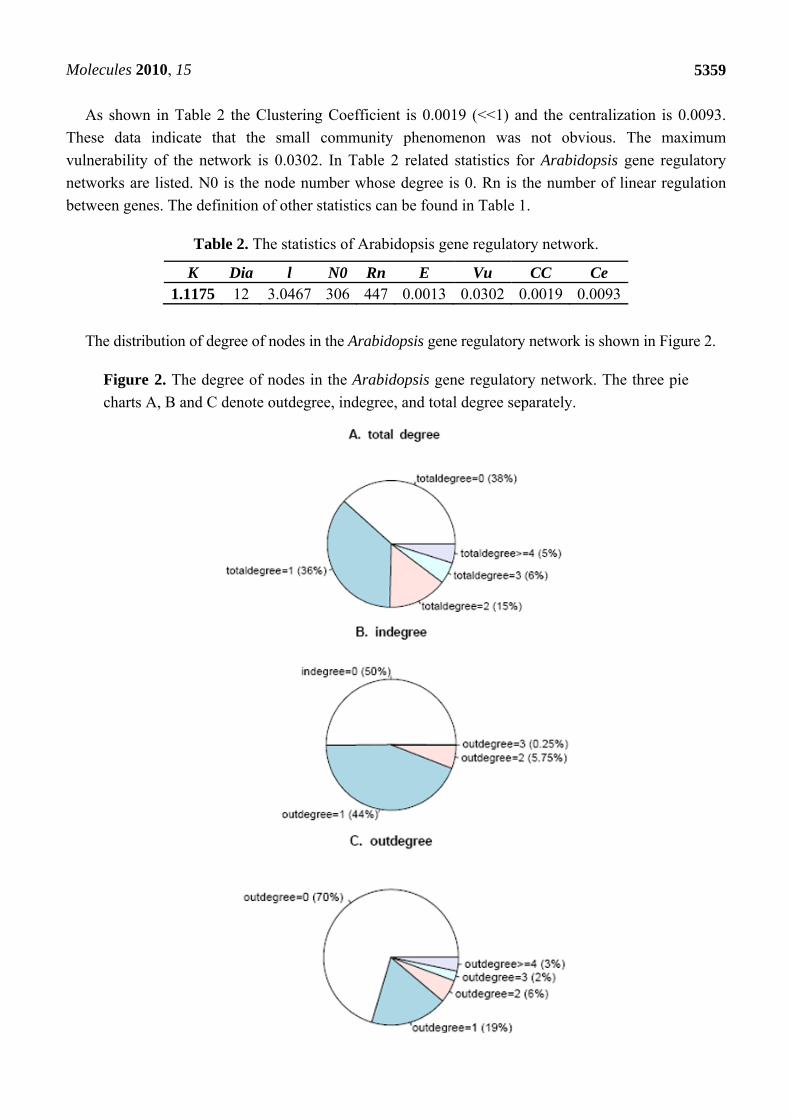
The distribution of degree of nodes in the Arabidopsis gene regulatory network is shown in Figure 2.
Figure 2. The degree of nodes in the Arabidopsis gene regulatory network. The three pie
charts A, B and C denote outdegree, indegree, and total degree separately.

Molecules 2010, 15
5360
It can be seen that over half the genes have regulatory relationships with others. About 36% of the
nodes’ degree is 1, while about 5% of them are equal or greater than 4. That is to say 39 genes have
regulation relationships with no less than four other genes. The gene with the maximum degree is
disproportionating enzyme 2 (AT2G40840). It encodes a cytosolic protein during transglucosidase and
amylomaltase activity, which suggests an essential role of the pathway carbohydrate metabolism in
leaves at night [31]. Thus, most genes in the Arabidopsis gene regulatory network regulate or are
regulated by other genes. The betweeness of gene nodes in the network was also calculated and the top-
forty nodes were picked up. These genes were then mapped to KEGG database and 21 enriched
pathways were identified and three key genes, At2g21330, At1g43670 and At2g29690, were observed to
participate in most of these pathways.
The three genes are all significant in life progress of Arabidopsis and corresponding proteins in
other species also have the similar important biological functions. They participate in fundamental
metabolic pathways. Both At1g43670 and At2g21330 are involved in the carbohydrate metabolism: D-
fructose-1,6-bisphosphate 1-phosphohydrolase (At1g43670) hydrolyzes the fructose-1,6-bisphosphate
(F-1,6-P2) to fructose-6-phosphate (F-6-P) and inorganic phosphate; fructose-bisphosphate aldolase
(At2g21330) catalyzes an aldol cleavage and its reversible aldol condensation of fructose-1,6-
bisphosphate. Anthranilate synthase (At2g29690) takes part in the amino acid metabolism and is a key
enzyme in the synthesis of tryptophan (Trp), indole-3-acetic acid, and indole alkaloids. O three genes,
AT3g01920 (which encodes the yrdC family of proteins) AT3g57600 (encodes a member of the
DREB subfamily A-2 in ERF/AP2 transcription factor family that responds to various types of biotic
and environmental stress [38]) and AT1G51110 were found to have loops in the network.
3.2. Identification of network statistics insensitive to time points measurement
Several network statistics of the 12 networks were calculated and are shown in Table 3. To find the
network statistics that do not change much with different time points, we computed the diversity score
of those statistics. From Table 3, it shows that diversity score of the average degree K (p < 0.05) and
the number of regulations Rn (p < 0.05) are relatively small, while the diversity score of centralization
Ce (p < 0.05) is larger. This indicated that average degree K and the number of linear regulation
between genes Rn are less sensitive to time points and the centralization are sensitive to time points..
Therefore, gene regulatory networks based on these properties are more robust since they will not vary
with time point measurements.
Table 3. Statistics values in 12 networks.
Network K Dia l Ce Rn E Vu G0 1.1175 12 3.0467 0.0093 447 0.001258 0.0302 G1 0.9750 10 2.4462 0.0101 390 0.000944 0.0397 G2 0.8725 6 1.6998 0.0095 349 0.000726 0.0499 G3 0.9175 6 1.9530 0.0076 367 0.000849 0.0366 G4 0.9525 11 2.3965 0.0101 381 0.000859 0.0602 G5 0.9625 5 1.8720 0.0289 385 0.000919 0.0809 fG6 0.9425 7 2.0107 0.0076 377 0.000811 0.0344 G7 0.8475 10 2.5515 0.0083 339 0.000804 0.0396
Molecules 2010, 15
5361
Table 3. Cont.
G8 0.9250 7 2.4457 0.0082 370 0.000892 0.0472 G9 0.8625 7 2.2134 0.0139 345 0.000784 0.0590
G10 0.9200 7 2.0985 0.0239 368 0.000863 0.0728 G11 0.9500 5 1.7365 0.0126 380 0.000806 0.0466 ave 0.9371 7.7500 2.2059 0.0125 374.8300 0.000876 0.0497
d_score 0.5785 2.7400 1.4780 4.6882 0.5800 1.07808 2.5885
In Table 3, each column is one set of statistics of the networks and each row represents all the
statistics of one network. The two bottom rows illustrate the average and the relative diversity score of
statistics in all 12 networks.
3.3. Comparison of the influence of different time points on the networks reconstruction
The maximum vulnerability is a valid statistic based on the whole network. It quantifies the
maximum loss if one node is deleted from the network. The larger the value of the maximum
vulnerability is, the less stable the network becomes. The maximum vulnerabilities of G5, G10, G4 and
G9, rank among the top-four maximum vulnerabilities (Table 3). These networks get more loss than
the left networks in performance because of the deletion of time point 8, 20, 4 and 16.
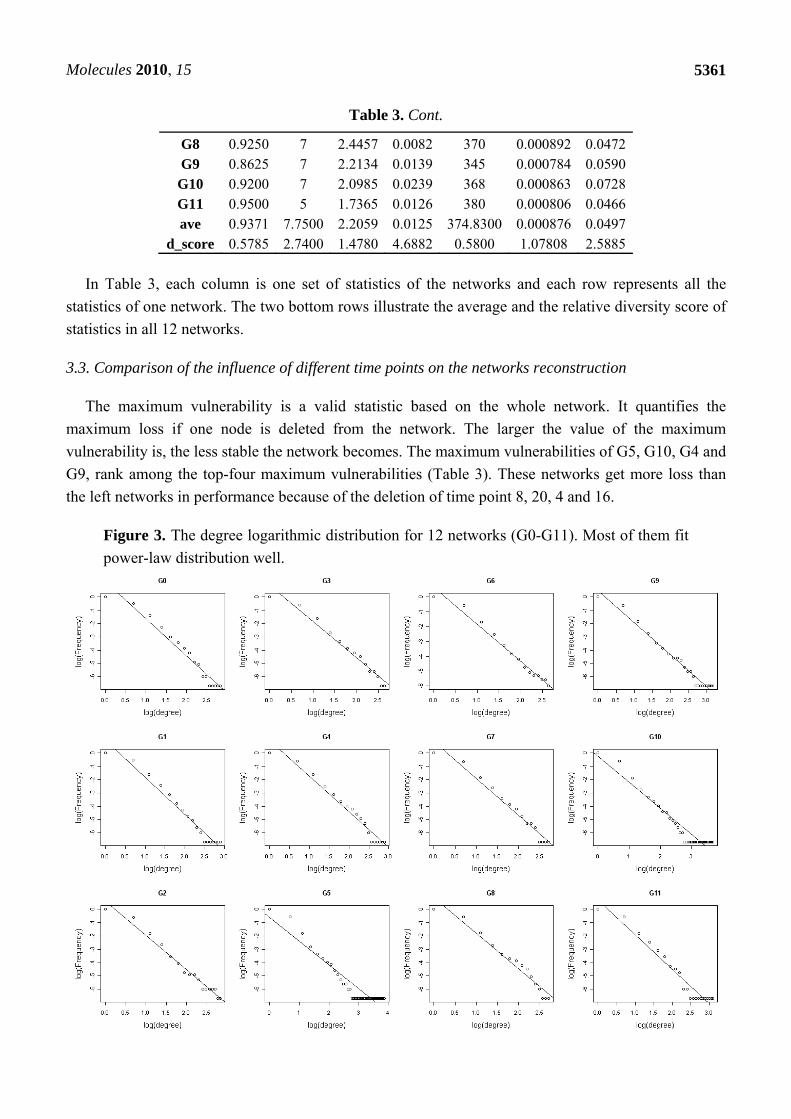
Figure 3. The degree logarithmic distribution for 12 networks (G0-G11). Most of them fit
power-law distribution well.

Molecules 2010, 15
5362
In order to get the degree circumstances of the 12 networks, degree logarithmic distributions are
considered (Figure 3). It is noteworthy that all of them fit the power-law distribution, which is a
characteristic of scale-free networks [39]. Structures of the 12 networks are coherent on the whole.
This may suggest that Arabidopsis gene regulatory networks deduced from time series microarray data
are robust. Goodness of fit can be a crucial criterion to judge the robustness and stability of a network.
From Figures 3 and 4, the degree distribution of G0, G3, G6 and G8 fit better than other networks. It
indicates that the deletion of the time points 2, 12 and 14 may not influence the networks’ degree
distribution property significantly, or the networks are robust for these time points. Hence, the time
points 2, 12 and 14 could be less important for the network reconstruction. On the other hand,
distributions of G5, G9, G10 and G11 do not fit the power-law as well as others and their
corresponding time points 8, 16, 20 and 24 are significant in the network degree properties. Network
G0 is regarded as the standard network and the remaining 11 networks’ sensitivity and precision can
then be obtained. The definitions of sensitivity and precision [40] are listed in Table 4.
Table 4. The definition of sensitivity, precision and F-measure.
Measurement Definition Descriptions
sensitivity tp
tp fn
Nse
N N
(1)
tpN : number of true positives
fnN : number of false negatives
fpN : number of false positives precision
tp
tp fp
Npr
N N
(2)
F-measure 2pr se
Fpr se
(3)
True positive: existent regulation correctly diagnosed as existent; False positive: nonexistent regulation wrongly identified as existent; True negative: nonexistent regulation correctly diagnosed as nonexistent; False negative: existent regulation wrongly identified as nonexistent.
The values of sensitivity, precision and F-measure are all calculated for the eleven networks, and
shown in Figure 4. The fact that all the values are not too large, suggests that almost every time point
may have a considerable contribution to the network structure. By comparative analysis, we found that
the sensitivity, precision and F-measure of G9, G4, G6 and G10 are smaller than those of the others.
This shows that many regulations in those four networks are not recognized correctly just because of
the deletion of these time points. By contrast, the three values of G1, G11, G2 and G3 are much larger,
which means that regulations in these networks didn’t change much though they lack a time point.
Combining the maximum vulnerability, degree distribution, sensitivity, precision and F-measure
data of these eleven networks, the time points 16 (G9) and 20 (G10) are found to play a significant role
in the Arabidopsis gene regulatory networks. Hence these time points should not be neglected for both
the network reconstruction and biological experiments. In the same way, the time point 2 (G3) is found
to be not as important as others.
Moreover, we evaluated the impact of time period on network construction by deleting two adjacent
time points. The networks G2_3 and G9_10 were reconstructed by the data without two points, that is,
1h and 2h and 16h and 20h.

Molecules 2010, 15
5363
Figure 4. A is sensitivity of 11 time point removing networks with G0 as the standard
network. B is precision of 11 networks and C shows F-measure.
As is shown in Figures 5 and 6, the deletion of two adjacent time points damages the constructed
network, especially in the case of G9_10.
Figure 5. The degree logarithmic distribution for G2_3 and G9_10.

Molecules 2010, 15
5364
Figure 6. A is sensitivity of G2, G3, G9, G10, G2_3 and G9_10 with G0 as the standard
network. B is precision of these 6 networks and C shows F-measure.
Its maximum vulnerability is 0.0881, larger than the other networks (G0, G1, G2, G3, G4, G5, G6,
G7, G8, G9, G10, G11, and G2_3). However the statistics such as maximum vulnerability (0.0769)
and sensitivity of network G2_3 are not as significant as G9_10’s. This indicates that the period
between 1h and 2h maybe not so important as 16h and 20h to the reconstruction of network.
Figure 7. The number of overlapping edges in different networks.
Molecules 2010, 15
5365
3.4. Detection of key regulatory modules
On further analysis, occurrence of gene regulations in 12 networks should be considered. From
Figure 7, the overlapping edges in the networks become less with the number of networks., and it is
observed that four key gene regulations appear in 11 networks and ten in 10 networks (Tables 5 and 6),
showing that these regulations are insensitive with time, i.e. they happen during the most time in the
experiment and they should be significant regulations in a sense. On the other hand, from these two
tables, we can find that gene regulations were absent frequently in network G9 than in other networks,
which is in agreement with the previous sensitivity and precision analysis. Gene regulations and
signals in this time period are much more important and should be sampled more densely.
Table 5. Four common gene regulations among 11 different networks.
Table 6. Ten common gene regulations among 10 different networks.
4. Discussion and Conclusions
In the systems biology era, it has become necessary to study the dynamic behavior of a biological
network with the time course data for a correct understanding of biological systems [41]. The
measurement of time course data will become more and more popular, especially with the
development of next generation sequencing technologies, which make the measurement of time course
data cheaper and easier than ever before. However, to the best of our knowledge, until now, few works
focused on the effect of time point measurements on the reconstruction of biological networks were
reported. In this paper, the gene regulatory networks based on Arabidopsis time series data were
Predictor Target Networks with the regulation Network
without the regulation
At1g77510 At1g17430 G0, G1, G2, G3, G5, G6, G7, G8, G9, G10, G11 G4 At3g02720 At2g30010 G0, G1, G2, G3, G4, G5, G6, G7, G8, G9, G10 G11 At5g06280 At1g77510 G0, G1, G2, G3, G4, G5, G6, G7, G9, G10, G11 G8 At5g58870 At5g38510 G0, G1, G2, G3, G4, G5, G6, G7, G8, G10, G11 G9
Predictor Target Networks with the regulation Network without
the regulation At1g01250 At4g16780 G0, G2, G3, G4, G5, G7, G8, G9, G10, G11 G1, G6 At1g36390 At4g09570 G0, G1, G4, G5, G6, G7, G8, G9, G10, G11 G2, G3 At1g07180 At3g01060 G0, G1, G2, G3, G5, G6, G7, G8, G9, G11 G4, G10 At1g07180 At5g35970 G0, G1, G2, G3, G5, G6, G7, G8, G9, G11 G4, G10 At3g5490 At3g10720 G0, G1, G2, G4, G5, G7, G8, G9, G10, G11 G3, G6 At5g40890" At3g11710 G0, G1, G2, G3, G4, G6, G7, G8, G10, G11 G5, G9 At5g56900 At4g02380 G0, G2, G3, G4, G5, G6, G7, G8, G9, G10 G1, G11 At5g56900 At5g66920 G0, G1, G2, G3, G4, G6, G7, G8, G10, G11 G5, G9 At1g51110 At3g12760 G0, G1, G2, G3, G4, G5, G6, G7, G8, G10 G9, G11 At2g40890 At4g35090 G0, G1, G2, G3, G5, G6, G7, G8, G10, G11 G4, G9

Molecules 2010, 15
5366
constructed, and then the effect of the time point measurements on the network reconstruction was
investigated.
We have proposed a novel method to detect the effects of time point measurements, i.e.
reconstruction of networks based on the deletion of different time points and then comparison of
networks statistics at three different levels: degree, edges and networks. The time point deletion
method can help us to detect the importance of different time points, to find the robust network
properties and to identify key biological modules which are insensitive to time point measurement.
According to our analysis, the network statistics such as the average degree (K) and the number of
linear regulation between genes (Rn), are less sensitive to time point measurement, indicating that
these statistics are more meaningful than others when even the time point measurement may not be
enough. With our time point deletion method, we found that the time points 16 (G9), 20 (G10) in the
Arabidopsis time course data are more important for the correct reconstruction of the Arabidopsis
biological network, while the time point 2 (G3) is less important. In addition we also identified key
biological regulations by the comparison of different time point deletion data sets.
The method proposed in this paper is based on the assumption that the networks statistics are more
comparable if they were generated by the same network reconstruction method. We take the network
G0 based on all time points as the standard network. Moreover, there are no perfectly correct networks
that can be considered as the golden-standard reference. Of course, there are some other choices, such
as take the independent network as the golden-standard network to validate. Further research should be
done for this purpose. We could consider other network construction methods based on the time-series
gene microarray data to validate the result, such as the reconstruction method by integrating several
time course datasets [42].
Acknowledgements
This work is supported by the National Nature Science Foundation of China (20872107).
References
1. Kato, M.; Tsunoda, T.; Takagi, T. Inferring genetic networks from DNA microarray data by
multiple regression analysis. Genome Inform. Ser. Workshop Genome Inform. 2000, 11, 118-128.
2. Chen, T.; He, H.L.; Church, G.M. Modeling gene expression with differential equations. Pac.
Symp. Biocomput. 1999, 29-40.
3. de Hoon, M.J.; Imoto, S.; Kobayashi, K.; Ogasawara, N.; Miyano, S. Inferring gene regulatory
networks from time-ordered gene expression data of Bacillus subtilis using differential equations.
Pac. Symp. Biocomput. 2003, 17-28.
4. Basso, K.; Margolin, A.A.; Stolovitzky, G.; Klein, U.; Dalla-Favera, R.; Califano, A. Reverse
engineering of regulatory networks in human B cells. Nat. Genet. 2005, 37, 382-390.
5. Liang, S.; Fuhrman, S.; Somogyi, R. Reveal, a general reverse engineering algorithm for inference
of genetic network architectures. Pac. Symp. Biocomput. 1998, 18-29.
6. Friedman, N.; Linial, M.; Nachman, I.; Pe'er, D. Using Bayesian networks to analyze expression
data. J. Comput. Biol. 2000, 7, 601-620.

Molecules 2010, 15
5367
7. Ong, I.M.; Glasner, J.D.; Page, D. Modelling regulatory pathways in E. coli from time series
expression profiles. Bioinformatics 2002, 18 (Suppl. 1), S241-S248.
8. Zou, M.; Conzen, S.D. A new dynamic Bayesian network (DBN) approach for identifying gene
regulatory networks from time course microarray data. Bioinformatics 2005, 21, 71-79.
9. Opgen-Rhein, R.; Strimmer, K. Learning causal networks from systems biology time course data:
an effective model selection procedure for the vector autoregressive process. BMC Bioinformatics
2007, 8 Suppl 2, S3.
10. Beal, M.J.; Falciani, F.; Ghahramani, Z.; Rangel, C.; Wild, D.L. A Bayesian approach to
reconstructing genetic regulatory networks with hidden factors. Bioinformatics 2005, 21, 349-356.
11. Perrin, B.E.; Ralaivola, L.; Mazurie, A.; Bottani, S.; Mallet, J.; d'Alche-Buc, F. Gene networks
inference using dynamic Bayesian networks. Bioinformatics 2003, 19 (Suppl. 2), ii138-ii148.
12. Rangel, C.; Angus, J.; Ghahramani, Z.; Lioumi, M.; Sotheran, E.; Gaiba, A.; Wild, D.L.; Falciani,
F. Modeling T-cell activation using gene expression profiling and state-space models.
Bioinformatics 2004, 20, 1361-1372.
13. Wu, F.X.; Zhang, W.J.; Kusalik, A.J. Modeling gene expression from microarray expression data
with state-space equations. Pac. Symp. Biocomput. 2004, 581-592.
14. Smith, S.M.; Fulton, D.C.; Chia, T.; Thorneycroft, D.; Chapple, A.; Dunstan, H.; Hylton, C.;
Zeeman, S.C.; Smith, A.M. Diurnal changes in the transcriptome encoding enzymes of starch
metabolism provide evidence for both transcriptional and posttranscriptional regulation of starch
metabolism in Arabidopsis leaves. Plant Physiol. 2004, 136, 2687-2699.
15. Boyes, D.C.; Zayed, A.M.; Ascenzi, R.; McCaskill, A.J.; Hoffman, N.E.; Davis, K.R.; Gorlach, J.
Growth stage-based phenotypic analysis of Arabidopsis: A model for high throughput functional
genomics in plants. Plant Cell 2001, 13, 1499-1510.
16. May, S. NASC's International Affymetrix Service. http://affymetrix.arabidopsis.info/ (accessed on
13 October 2009).
17. The Comprehensive R Archive Network. http://mirrors.geoexpat.com/cran/ (accessed on 10 May
2010).
18. Lèbre, S. Inferring Dynamic Genetic Networks with Low Order Independencies. Stat. Appl.
Genet. Mol. Biol. 2009, 8, 9.
19. Murphy, K.; Mian, S. Modelling Gene Expression Data using Dynamic Bayesian Networks;
University of California, Computer Science Division: Berkeley, CA, USA, 1999.
20. Carlson, J.M.; Chakravarty, A.; Khetani, R.S.; Gross, R.H. Bounded search for de novo
identification of degenerate cis-regulatory elements. BMC Bioinformatics 2006, 7, 254.
21. Todeschini, R.; Consonni, V.; Mannhold, R.; Kubinyi, H.; Timmerman, H. Handbook of
Molecular Descriptors; Wiley-VCH: Weinheim, Germany, 2000.
22. Gonzalez-Diaz, H.; Gonzalez-Diaz, Y.; Santana, L.; Ubeira, F.M.; Uriarte, E. Proteomics,
networks and connectivity indices. Proteomics 2008, 8, 750-778.
23. González-Díaz, H.; Munteanu, C.R. Topological Indices for Medicinal Chemistry, Biology,
Parasitology, Neurological and Social Networks; Transworld Research Network: Kerala, India,
2010; p. 212.
24. Stefan, B.; Heinz Georg, S. Handbook of Graphs and Networks: From the Genome to the
Internet; John Wiley & Sons, Inc.: New York, NY, USA, 2003; p. 401.
Molecules 2010, 15
5368
25. Mrabet, Y.; Semmar, N. Mathematical methods to analysis of topology, functional variability and
evolution of metabolic systems based on different decomposition concepts. Curr. Drug Metab.
2010 11, 315-341.
26. Chou, K.C. Graphic rule for drug metabolism systems. Curr. Drug Metab. 2010, 11, 369-378.
27. Gonzalez-Diaz, H. Network topological indices, drug metabolism, and distribution. Curr. Drug
Metab. 2010, 11, 283-284.
28. Gonzalez-Diaz, H.; Duardo-Sanchez, A.; Ubeira, F.M.; Prado-Prado, F.; Perez-Montoto, L.G.;
Concu, R.; Podda, G.; Shen, B. Review of MARCH-INSIDE & complex networks prediction of
drugs: ADMET, anti-parasite activity, metabolizing enzymes and cardiotoxicity proteome
biomarkers. Curr. Drug Metab. 2010, 11, 379-406.
29. Diestel, R. Graph theory. In Graduate Texts in Mathematics; 1997; Volume 173, p. 410.
30. West, D. Introduction to Graph Theory, 2nd ed.; Prentice Hall: Englewood Cliffs, NJ, 1996.
31. Chia, T.; Thorneycroft, D.; Chapple, A.; Messerli, G.; Chen, J.; Zeeman, S.C.; Smith, S.M.;
Smith, A.M. A cytosolic glucosyltransferase is required for conversion of starch to sucrose in
Arabidopsis leaves at night. Plant J. 2004, 37, 853-863.
32. Albert, R.; Barabasi, A.-L. Statistical mechanics of complex networks. Rev. Mod. Phys. 2002, 74,
47-97.
33. Freeman, L.C. A set of measures of centrality based on betweenness. Sociometry 1977, 40, 35-41.
34. Wasserman, S.; Faust, K. Social Network Analysis: Methods and Applications (Structural
Analysis in the Social Sciences), 1st ed.; Cambridge University Press: New York, NY, USA,
1994; p. 857.
35. Freeman, L. Centrality in social networks: Conceptual clarification. Soc. Networks 1979, 1, 215-
239.
36. Latora, V.; Marchiori, M. Efficient behavior of small-world networks. Phys. Rev. Lett. 2001, 87,
198701.
37. Gol'dshtein, V.; Koganov, G.A.; Surdutovich, G.I. Vulnerability and Hierarchy of Complex
Networks. 2004, arXiv: preprint cond-mat/0409298.
38. Riechmann, J.L.; Meyerowitz, E.M. The AP2/EREBP family of plant transcription factors. Biol.
Chem. 1998, 379, 633-646.
39. Barabasi, A.L.; Bonabeau, E. Scale-free networks. Sci. Am. 2003, 288, 60-69.
40. Altman, D.G.; Bland, J.M. Diagnostic tests. 1: Sensitivity and specificity. BMJ 1994, 308, 1552.
41. Dzeroski, S.; Todorovski, L. Equation discovery for systems biology: finding the structure and
dynamics of biological networks from time course data. Curr. Opin. Biotechnol. 2008, 19,
360-368.
42. Wang, Y.; Joshi, T.; Zhang, X.S.; Xu, D.; Chen, L. Inferring gene regulatory networks from
multiple microarray datasets. Bioinformatics 2006, 22, 2413-2420.
Sample Availability: Samples of the compounds are available from the authors.
© 2010 by the authors; licensee MDPI, Basel, Switzerland. This article is an Open Access article
distributed under the terms and conditions of the Creative Commons Attribution license
(http://creativecommons.org/licenses/by/3.0/).