Embed Size (px)
Citation preview

Effects of Thermal Processing on the Stability of Fumonisin B2 in anAqueous SystemKeywords: Fumonisin B2; thermal processing; stability; decomposition
INTRODUCTION
Fusarium moniliforme, a prevalent fungal contami-nant of corn, has been implicated in several animaldiseases including equine leukoencephalomalacia (ELEM)(Thiel et al., 1991), porcine pulmonary edema (PPE)(Harrison et al., 1990), liver toxicity and liver cancer inrats (Voss et al., 1993), and esophageal cancer inhumans (Sydenham et al., 1991; Rheeder et al., 1992).The fumonisins, which are secondary metabolites of F.moniliforme, are believed to be responsible for many ofthe toxicological effects in animals and humans (Mara-sas et al., 1988; Wilson et al., 1992; Colvin et al., 1993,Gelderblom et al., 1991; Sydenham et al., 1991).Toxicological studies have shown that purified fumo-
nisin B1 (FB1) causes ELEM (Marasas et al., 1988;Wilson et al., 1992), PPE (Colvin et al., 1993), and livertumors (Gelderblom et al., 1991) in rats. FB2 has beenshown to cause ELEM in ponies (Ross et al., 1994) andcytotoxicity in mammalian cell lines (Gelderblom et al.,1993). FB1 and FB2 have been found to inhibit sphin-golipid biosynthesis by blocking the conversion of sphin-ganine to ceramide (Wang et al., 1991; Norred et al.,1992).Fumonisins are diesters of propane-1,2,3-tricarboxylic
acid and a pentahydroxyicosane containing a primaryamino group. To date, seven different fumonisin ana-logues have been identified and characterized (Be-zuidenhout et al., 1988; Branham and Plattner, 1993;Cawood et al., 1991; Gelderblom et al., 1992; Plattneret al., 1992). Of the seven, FB1 and FB2 are the majortoxins in contaminated corn. In corn contaminated withFusarium proliferatum, the ratio of FB1 to FB2 isapproximately 3 to 1 (Ross et al., 1992). Structurally,FB2 differs from FB1 in its lack of a hydroxyl group onthe C-10 position of the 22-carbon backbone.Several surveys have shown that thermally processed
corn products (e.g., tortillas, ready-to-eat cereal, andmuffins) generally contain lower concentrations of fu-monisins than unprocessed products (e.g., cornmeal andgrits) (Stack and Eppley, 1992; Pittet et al., 1992). Fewstudies, however, have focused on the effects of thermalprocessing on the fumonisin content of food. Alberts etal. (1990) reported that boiling culture material of F.moniliforme in water for 60 min resulted in no loss ofFB1. In contrast, baking (190 and 220 °C) muffins fromcontaminated cornmeal resulted in a partial apparentloss of FB1 (Scott and Lawrence, 1994). Dupuy et al.(1993) and Jackson et al. (1996) reported that the lossof FB1 in dry corn and in an aqueous model system,respectively, followed pseudo-first-order kinetics. Stud-ies by Bordson et al. (1993) and Scott and Lawrence(1994) suggest that the observed losses of fumonisin inthermally processed food may be due to matrix-relateddifficulties of recovery and detection, rather than actualfumonisin decomposition. Murphy et al. (1996) reportedthat the primary amine group of fumonisins can bechemically blocked when foods are heated. This resultsin loss of the availability of the amine group to reactwith derivitizing agents that are used to analyze fumo-nisins.To date, little information is available concerning the
effects of time, temperature, and pH on the stability ofFB2. The objective of this study was to determine thethermal stability of FB2 in an aqueous matrix-freeenvironment at acidic, neutral, and basic pH levels.
MATERIALS AND METHODS
FB2 and o-phthaldialdehyde (OPA) were purchased fromSigma Chemical Co. (St. Louis, MO). Fully and partiallyhydrolyzed FB2 qualitative standards were prepared by incu-bating pure FB2 with 1 N KOH (Rice and Ross, 1994). Allreagents were of analytical grade, and solvents were of high-performance liquid chromatography (HPLC) grade.FB2 solutions (5 ppm) were prepared in Teorell and Sten-
hagen’s citrate-phosphate-borate buffer (CRC, 1968) adjustedto pH 4, 7, or 10. This buffer was chosen since it has a broadpH range (2-12). The solutions (500 mL) were placed in a1-L stainless steel pressure vessel (Parr Instrument Co.,Moline, IL) and heated to processing temperatures of 100-200 °C with an electric heating mantle (Jackson et al., 1996).Use of the pressurized vessel enabled solution temperaturesof >100 °C to be reached. A Parr Model 4841 proportionalcontroller was used to maintain each reaction mixture at thedesired temperature while it was agitated at a constant speed.The come-up times, i.e. the lengths of time necessary for FB2
solutions to reach the desired processing temperatures, were18, 29, 32, 40, and 44 min for temperatures of 100, 125, 150,175, and 200 °C, respectively. Once the desired processingtemperature was attained, aliquots of the reaction mixturewere removed at 10-min intervals for 60 min and analyzedfor FB2 levels as previously described by Jackson et al. (1996).HPLC Determination of FB2. Losses of FB2 in the
processed solutions were measured according to the methodof Shephard et al. (1990) with modifications (Jackson et al.,1996). Because FB2 was processed in aqueous buffer, stepsnormally used to extract and purify fumonisin from corn wereomitted. Consequently, the FB2 solutions required minimalpreparation for analysis by HPLC, and recovery correction wasnot necessary. A 10-µL aliquot of the FB2/OPA mixture wasused for HPLC determination. A Waters (Milford, MA) HPLCequipped with a Model 600 pump, a Rheodyne (Cotati, CA)injector, and a Model 740 fluorescence detector (335-nmexcitation wavelength and 440-nm emission wavelength) andMillenium 2010 software (Waters) was used to identify andquantify FB2 in the solutions. Separations were carried outat 23 °C on a Supelco (Bellefonte, PA) ODS-80 column (4.6mm × 25 cm) with an LC-18-DB (Supelco) precolumn. Themobile phase was methanol/1 M sodium dihydrogen phosphate(80:20) adjusted to pH 3.3 with concentrated phosphoric acidat a flow rate of 1.0 mL/min.Kinetic Calculations. Kinetic constants were calculated
according to the procedure of Jackson et al. (1996).Statistical Analysis. All processing runs were performed
in duplicate. Processed solutions were analyzed for FB2 induplicate. Means and standard deviations were calculatedwith Minitab (State College, PA) statistical software. Linearregression analyses, used to determine reaction constants, half-lives of FB2, and correlation coefficients, were performed byusing Psiplot graphics software (Poly Software International,Salt Lake City, UT). Minitab statistical software was used toverify significant differences between rate constants and half-lives by one-way analysis of variance (ANOVA) followed byleast significance difference (lsd) tests at 95% confidence. Athree-way analysis of variance (ANOVA) was used to deter-mine if processing variables (time, temperature, and pH)significantly affected loss of FB2.Safety Precaution. FB2 is a suspected carcinogen and
should be handled with care.
1984 J. Agric. Food Chem. 1996, 44, 1984−1987
S0021-8561(96)00172-0 CCC: $12.00 © 1996 American Chemical Society

RESULTS AND DISCUSSION
Thermal Decomposition Products of FB2. HPLCchromatograms for FB2 processed at 200 °C (pH 10) areshown in Figure 1. The chromatograms indicate thatthe concentration of FB2 (retention time of approxi-mately 15.7 min) decreased during processing, while thelevels of three apparent decomposition products (reten-tion times of 14.1, 14.7, and 16.9 min) generally in-creased. Because the decomposition products had simi-lar retention times as partially (14.1 and 14.7 min) andfully hydrolyzed (16.9 min) FB2 standards, they weretentatively identified as PHFB2 and HFB2 in Figure 1.Several researchers (Bezuidenhout et al., 1988; Jack-
son and Bennett, 1990; Sydenham et al., 1990a,b) havereported that fumonisins hydrolyze to the C22 aminopo-lyol backbone and tricarballylic acid in the presence ofheat and strong acid or base. For example, fullyhydrolyzed FB1 can be found in tortillas prepared fromcorn treated with calcium hydroxide and heat (Hendrichet al., 1993). Hopmans and Murphy (1993) detectedHFB1 in tortilla chips, masa, and canned corn. How-ever, little is known about the levels of hydrolyzed FB2in these and other thermally processed corn-based foods.The data presented here (Figure 1) indicate that the
thermal processing of FB2 in the presence of waterresults primarily in the formation of hydrolysis prod-ucts. The pH had an effect on the types of hydrolysisproducts detected in the processed solutions. At pH 10,
the major species throughout the process was HFB2,while at pH 4 and 7, PHFB2 was also present.Effect of pH, Time, and Temperature on the
Stability of FB2. Statistical analysis of the processingdata was performed to determine if independent vari-ables (time, temperature, and pH) were related to thedependent variable (percent FB2 remaining after pro-cessing). Results of a three-way ANOVA indicate highlysignificant effects (p < 0.01) of pH, time, and temper-ature on loss of FB2 (Table 1). In addition, Table 1indicates that there was a highly significant three-wayinteraction (p < 0.01) between these independent vari-ables.Figures 2-4 and Table 1 indicate that decomposition
of FB2 during thermal processing depended on the pHof the solution. Overall, FB2 was least stable at pH 4(Figure 2) and most stable at pH 7 (Figure 3). Atprocessing temperatures <200 °C, the decomposition ofFB2 was most rapid and extensive at pH 4, followed bypH 10 (Figure 4) and 7, respectively. At 200 °C, pH hadlittle effect on the rate of loss of FB2. After 60 min ofprocessing at 200 °C, all FB2 was decomposed at eachpH level.Figures 2-4 and Table 1 indicate that the rate of
decomposition of FB2 was highly temperature dependent
Figure 1. HPLC chromatograms using fluorescence detection(335-nm excitation wavelength and 440-nm emission wave-length) for FB2 dissolved in an aqueous buffer at pH 10.Chromatograms A, B, C, and D refer to the FB2 solution beforeprocessing, the solution after reaching 200 °C, the solutionafter 30 min at 200 °C, and the solution after 60 min at 200°C, respectively. FB2, partially hydrolyzed FB2 (PHFB2), andfully hydrolyzed FB2 (HFB2) are indicated by arrows. Peakswith retention times of less than 10 min have not beenidentified.
Table 1. Statistical Analysis of Variance of Time,Temperature, and pH on the Loss of FB2 duringProcessing
source DFsum ofsquares
meansquares F value Pr > F
I. Dependent Variable: Percent FB2 Remaining(Model with Interaction)
pH 2 11971 5985 96.60 0.0001temp 4 266335 66584 1074.58 0.0001time 6 33505 5584 90.12 0.0001pH × temp 8 8067 1008 16.27 0.0001pH × time 12 276 23 0.37 0.9710temp × time 24 29296 1220 19.70 0.0001pH × temp × time 48 9289 194 3.12 0.0001error 105 6506 62
total 209 365243
II. Dependent Variable: Percent FB2 Remaining(Model with Main Effect Only)
pH 2 11971 5985 22.07 0.0001temp 4 266335 66584 245.49 0.0001time 6 33505 5584 20.59 0.0001error 197 53432 271
total 209 365243
Figure 2. Effects of processing temperature and time on thedecomposition of FB2 in an aqueous buffer at pH 4. Each pointrepresents the average of two replicates, and error barsindicate one standard deviation of the mean.
Rapid Communications J. Agric. Food Chem., Vol. 44, No. 8, 1996 1985
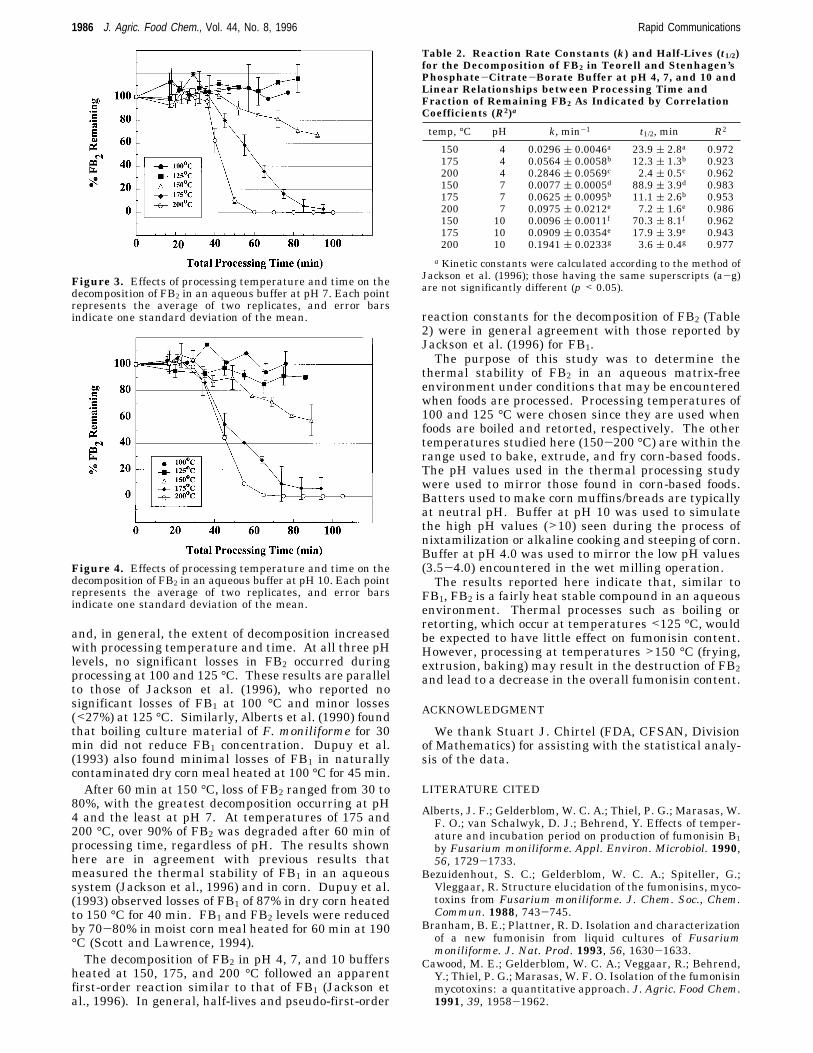
and, in general, the extent of decomposition increasedwith processing temperature and time. At all three pHlevels, no significant losses in FB2 occurred duringprocessing at 100 and 125 °C. These results are parallelto those of Jackson et al. (1996), who reported nosignificant losses of FB1 at 100 °C and minor losses(<27%) at 125 °C. Similarly, Alberts et al. (1990) foundthat boiling culture material of F. moniliforme for 30min did not reduce FB1 concentration. Dupuy et al.(1993) also found minimal losses of FB1 in naturallycontaminated dry corn meal heated at 100 °C for 45 min.After 60 min at 150 °C, loss of FB2 ranged from 30 to
80%, with the greatest decomposition occurring at pH4 and the least at pH 7. At temperatures of 175 and200 °C, over 90% of FB2 was degraded after 60 min ofprocessing time, regardless of pH. The results shownhere are in agreement with previous results thatmeasured the thermal stability of FB1 in an aqueoussystem (Jackson et al., 1996) and in corn. Dupuy et al.(1993) observed losses of FB1 of 87% in dry corn heatedto 150 °C for 40 min. FB1 and FB2 levels were reducedby 70-80% in moist corn meal heated for 60 min at 190°C (Scott and Lawrence, 1994).The decomposition of FB2 in pH 4, 7, and 10 buffers
heated at 150, 175, and 200 °C followed an apparentfirst-order reaction similar to that of FB1 (Jackson etal., 1996). In general, half-lives and pseudo-first-order
reaction constants for the decomposition of FB2 (Table2) were in general agreement with those reported byJackson et al. (1996) for FB1.The purpose of this study was to determine the
thermal stability of FB2 in an aqueous matrix-freeenvironment under conditions that may be encounteredwhen foods are processed. Processing temperatures of100 and 125 °C were chosen since they are used whenfoods are boiled and retorted, respectively. The othertemperatures studied here (150-200 °C) are within therange used to bake, extrude, and fry corn-based foods.The pH values used in the thermal processing studywere used to mirror those found in corn-based foods.Batters used to make corn muffins/breads are typicallyat neutral pH. Buffer at pH 10 was used to simulatethe high pH values (>10) seen during the process ofnixtamilization or alkaline cooking and steeping of corn.Buffer at pH 4.0 was used to mirror the low pH values(3.5-4.0) encountered in the wet milling operation.The results reported here indicate that, similar to
FB1, FB2 is a fairly heat stable compound in an aqueousenvironment. Thermal processes such as boiling orretorting, which occur at temperatures <125 °C, wouldbe expected to have little effect on fumonisin content.However, processing at temperatures >150 °C (frying,extrusion, baking) may result in the destruction of FB2and lead to a decrease in the overall fumonisin content.
ACKNOWLEDGMENT
We thank Stuart J. Chirtel (FDA, CFSAN, Divisionof Mathematics) for assisting with the statistical analy-sis of the data.
LITERATURE CITED
Alberts, J. F.; Gelderblom, W. C. A.; Thiel, P. G.; Marasas, W.F. O.; van Schalwyk, D. J.; Behrend, Y. Effects of temper-ature and incubation period on production of fumonisin B1
by Fusarium moniliforme. Appl. Environ. Microbiol. 1990,56, 1729-1733.
Bezuidenhout, S. C.; Gelderblom, W. C. A.; Spiteller, G.;Vleggaar, R. Structure elucidation of the fumonisins, myco-toxins from Fusarium moniliforme. J. Chem. Soc., Chem.Commun. 1988, 743-745.
Branham, B. E.; Plattner, R. D. Isolation and characterizationof a new fumonisin from liquid cultures of Fusariummoniliforme. J. Nat. Prod. 1993, 56, 1630-1633.
Cawood, M. E.; Gelderblom, W. C. A.; Veggaar, R.; Behrend,Y.; Thiel, P. G.; Marasas, W. F. O. Isolation of the fumonisinmycotoxins: a quantitative approach. J. Agric. Food Chem.1991, 39, 1958-1962.
Figure 3. Effects of processing temperature and time on thedecomposition of FB2 in an aqueous buffer at pH 7. Each pointrepresents the average of two replicates, and error barsindicate one standard deviation of the mean.
Figure 4. Effects of processing temperature and time on thedecomposition of FB2 in an aqueous buffer at pH 10. Each pointrepresents the average of two replicates, and error barsindicate one standard deviation of the mean.
Table 2. Reaction Rate Constants (k) and Half-Lives (t1/2)for the Decomposition of FB2 in Teorell and Stenhagen’sPhosphate-Citrate-Borate Buffer at pH 4, 7, and 10 andLinear Relationships between Processing Time andFraction of Remaining FB2 As Indicated by CorrelationCoefficients (R2)a
temp, °C pH k, min-1 t1/2, min R2
150 4 0.0296 ( 0.0046a 23.9 ( 2.8a 0.972175 4 0.0564 ( 0.0058b 12.3 ( 1.3b 0.923200 4 0.2846 ( 0.0569c 2.4 ( 0.5c 0.962150 7 0.0077 ( 0.0005d 88.9 ( 3.9d 0.983175 7 0.0625 ( 0.0095b 11.1 ( 2.6b 0.953200 7 0.0975 ( 0.0212e 7.2 ( 1.6e 0.986150 10 0.0096 ( 0.0011f 70.3 ( 8.1f 0.962175 10 0.0909 ( 0.0354e 17.9 ( 3.9e 0.943200 10 0.1941 ( 0.0233g 3.6 ( 0.4g 0.977
a Kinetic constants were calculated according to the method ofJackson et al. (1996); those having the same superscripts (a-g)are not significantly different (p < 0.05).
1986 J. Agric. Food Chem., Vol. 44, No. 8, 1996 Rapid Communications
Colvin, B. M.; Cooley, A. J.; Beaver, R. W. Fumonisin toxicosisin swine: clinical and pathologic findings. J. Vet. Diagn.Invest. 1993, 5, 232-241.
CRC. Handbook of Biochemistry; Sober, H. A., Ed.; ChemicalRubber Co.: Cleveland, OH, 1968; pp J234-J237.
Dupuy, J.; Le Bars, P.; Boudra, H.; Le Bars, J. Thermostabilityof fumonisin B1, a mycotoxin from Fusarium moniliforme,in corn. Appl. Environ. Microbiol. 1993, 59, 2864-2867.
Gelderblom, W. C. A.; Kriek, N. P. J.; Marasas, W. F. O.; Thiel,P. G. Toxicity and carcinogenicity of the F. moniliformemetabolite, FB1, in rats. Appl. Environ. Microbiol. 1991, 12,1247-1251.
Gelderblom, W. C. A.; Marasas, W. F. O.; Vleggaar, R.; Thiel,P. G.; Cawood, M. E. Fumonisins: isolation, chemicalcharacterization and biological effects.Mycopathologia 1992,117, 11-16.
Gelderblom, W. C. A.; Cawood, M. E.; Snyman, S. D.; Vleggaar,R.; Marasas, W. F. O. Structure-activity relationships offumonisins in short-term carcinogenesis and cytotoxicityassays. Food Chem. Toxicol. 1993, 31, 407-414.
Harrison, L. R.; Colvin, B. M.; Greene, T. J.; Newman, L. E.;Cole, R. J. Pulmonary edema and hydrothorax in swineproduced by fumonisin B1, a toxic metabolite of Fusariummoniliforme. J. Vet. Diagn. Invest. 1990, 2, 217-221.
Hendrich, S.; Miller, K. A.; Wilson, T. M.; Murphy, P. A.Toxicity of Fusarium proliferatum-fermented nixtamilizedcorn-based diets fed to rats: effect of nutritional status. J.Agric. Food Chem. 1993, 41, 1649-1654.
Hopmans, E. C.; Murphy, P. A. Detection of fumonisins B1, B2
and B3 and hydrolyzed fumonisin B1 in corn-containingfoods. J. Agric. Food Chem. 1993, 41, 1655-1658.
Jackson, L. S.; Hlywka, J. J.; Senthil, K. R.; Bullerman, L. B.;Musser, S. M. Effects of time, temperature and pH on thestability of fumonisin B1 in an aqueous model system. J.Agric. Food Chem. 1996, 43, 906-912.
Jackson, M. A.; Bennett, G. A. Production of fumonisin B1 byFusarium moniliforme NRL 13616 in submerged culture.Appl. Environ. Microbiol. 1990, 56, 2296-2298.
Marasas, W. F. O.; Kellerman, T. S.; Gelderblom, W. C. A.;Coetzer, J. A. W.; Thiel, P. T.; van der Lugt, J. J. Leukoen-cephalomalacia in a horse induced by fumonisin B1 isolatedfrom Fusarium moniliforme. Onderstepoort J. Vet. Res.1988, 55, 197-203.
Murphy, P. A.; Hendrich, S.; Hopmans, E. C.; Hauck, C. C.;Lu, Z.; Buseman, G.; Munkvold, G. Effect of processing onfumonisin content of corn. In Fumonisins in Food; Jackson,L. S., DeVries, J. W., Bullerman, L. B., Eds.; Plenum Pub-lishing: New York, 1996; pp 223-234.
Norred, W. P.; Wang, E.; Yoo, H.; Riley, R. T.; Merrill, A. H.,Jr. In vitro toxicology of fumonisins and the mechanisticimplications. Mycopathologia 1992, 117, 73-78.
Pittet, A.; Parisod, V.; Schellenberg, M. Occurrence of fumo-nisins B1 and B2 in corn-based products from the Swissmarket. J. Agric. Food Chem. 1992, 40, 1352-1354.
Plattner, R. D.; Weisleder, D.; Shackelford, D. D.; Peterson,R.; Powell, R. G. A new fumonisin from solid cultures ofFusarium moniliforme. Mycopathologia 1992, 117, 23-28.
Rheeder, J. P.; Marasas, W. F. O.; Thiel, P. G.; Sydenham, E.W.; Shephard, G. S.; Van Schalkwyk, D. J. Fusariummoniliforme and fumonisins in corn in relation to humanesophageal cancer in Transkei. Phytopathology 1992, 82,353-357.
Rice, L. G.; Ross, P. F. Methods for detection and quantitationof fumonisins in corn, cereal products and animal excreta.J. Food Prot. 1994, 57, 536-540.
Ross, P. F.; Rice, L. G.; Osweiler, G. D.; Nelson, P. E.; Richard,J. L.; Wilson, T. M. A review and update of animal toxicosesassociated with fumonisin-contaminated feds and productionof fumonisins by Fusarium isolates. Mycopathologia 1992,114, 129-135.
Scott, P. M.; Lawrence, G. A. Stability and problems inrecovery of fumonisins added to corn-based foods. J. AOACInt. 1994, 77, 541-545.
Shephard, G. S.; Sydenham, E. W.; Thiel, P. G.; Gelderblom,W. C. A. Quantitative determination of fumonisin B1 andB2 by high performance liquid chromatography with fluo-rescence detection. J. Liq. Chromatogr. 1990, 13, 2077-2087.
Stack, M. E.; Eppley, R. M. Liquid chromatographic determi-nation of fumonisins B1 and B2 in corn and corn products.J. AOAC Int. 1992, 75, 834-837.
Sydenham, E. W.; Thiel, P. G.; Marasas, W. F. O.; Shephard,G. S.; Van Schalkwyk, D. J.; Koch, K. R. Natural occurrenceof some Fusarium mycotoxins in corn from low and highesophageal cancer prevalence areas of the Transkei, SouthAfrica. J. Agric. Food Chem. 1990a, 38, 1900-1903.
Sydenham, E. W.; Gelderblom, W. C. A.; Thiel, P. G.; Marasas,W. F. O. Evidence for the natural occurrence of fumonisinB1, a mycotoxin produced by Fusariummoniliforme, in corn.J. Agric. Food Chem. 1990b, 38, 285-290.
Sydenham, E. W.; Shephard, G. S.; Thiel, P. G.; Marasas, W.F. O.; Stockenstrom, S. Fumonisin contamination of com-mercial corn-based human foodstuffs. J. Agric. Food Chem.1991, 25, 767-771.
Thiel, P. G.; Shephard, G. S.; Sydenham, E. W.; Marasas, W.F. O.; Nelson, P. E.; Wilson, T. M. Levels of fumonisins B1
and B2 in feeds associated with confirmed cases of equineleukoencephalomalacia. J. Agric. Food Chem. 1991, 39,109-111.
Voss, K. A.; Chamberlain, W. J.; Bacon, C. W.; Norred, W. P.A preliminary investigation on renal and heptic toxicity inrats fed purified fumonisin B1. Nat. Toxins 1993, 1, 222-228.
Wang, E.; Norred, W. P.; Bacon, C. W.; Riley, R. T.; Merrill,A. H., Jr. Inhibition of sphingosine biosynthesis by fumo-nisins. Implications for diseases associated with Fusariummoniliforme. J. Biol. Chem. 1991, 266, 14486-14490.
Wilson, T. M.; Ross, P. R.; Owens, D. L.; Rice, L. G.; Green, S.A.; Jenkins, S. J.; Nelson, H. A. Experimental reproductionof ELEM. Mycopathologia 1992, 117, 115-120.
Received for review March 27, 1996. Accepted June 10, 1996.This publication was supported by the USDA and by Coopera-tive Agreement FD-000431 from the U.S. Food and DrugAdministration (and the National Center for Food Safety andTechnology). Its contents are solely the opinions of the authorsand do not necessarily represent official views of the U.S. Foodand Drug Administration. Published as Paper 11453, JournalSeries, Agricultural Research Division, Lincoln, NE. Researchwas conducted under Project 16056.
Lauren S. Jackson,*,† Jason J. Hlywka,‡Kannaki R. Senthil,§ and Lloyd B. Bullerman‡
Food and Drug Administration, National Center forFood Safety and Technology, Summit-Argo,Illinois 60501, Department of Food Science andTechnology, University of Nebraska, Lincoln,Nebraska 68583, and Illinois Institute of Technology,National Center for Food Safety and Technology,Summit-Argo, Illinois 60501
JF9601729
* Author to whom correspondence should be ad-dressed.
† Food and Drug Administration.‡ University of Nebraska.§ Illinois Institute of Technology.
Rapid Communications J. Agric. Food Chem., Vol. 44, No. 8, 1996 1987


![Recent Developments in Aqueous Soluble Organic Flow ... · Recent Developments in Aqueous Soluble Organic Flow ... MV2+ MV+ 4 -HO-TEMPO [4 -HO-TEMPO] + ... Chemical Stability of MV•─](https://img.pdfslide.us/doc/110x75/5b3b7a557f8b9a986e8c3996/recent-developments-in-aqueous-soluble-organic-flow-recent-developments.jpg)