Embed Size (px)
Citation preview

EFFECTS OF THE TRANSPARENCY OF OVERVIEW MAPS AND GENDER DIFFERENCES ON WAYFINDING IN A
VIRTUAL ENVIRONMENT
Meng-Xi Chen*, Chien-Hsiung Chen**
National Taiwan University of Science and Technology Da'an Dist., Taipei City 10607, Taiwan
Abstract: This study verified the effects of the transparency of overview maps and gender differences on wayfinding performance and subjective evaluations in a Virtual Environment (VE). The research variables were the transparency of overview maps (0%, 50%, and 100% transparency) and gender (males and females). Sixty young adults participated in this study. The results are as follows: (1) The wayfinding performance of the 50% and 100% transparency overview maps were significantly better than the 0% transparency overview map in the task of judging perceptual information. (2) Males showed significantly better wayfinding performance than females in the more difficult task. (3) The 50% transparency overview map was of significantly higher subjective rationality than the 100% transparency overview map. (4) Females gave the 50% transparency overview map significantly higher SUS scores than the 0% transparency overview map. (5) Females with the 50% transparency overview map showed significantly stronger subjective preference and higher SUS scores than males. Keywords: Virtual Environments, Wayfinding, Overview Map, Visual Design, Gender
1. Introduction Virtual Environments (VEs) have great potential to be
applied in various fields and industries like educational game, tourism, real estate, health care, engineering, architecture, design and so forth. In a physical environment, signs, service points, maps, computers, arrangement of furniture, lighting, and even olfactory and tactile cues can help people find their ways from one place to another. While in an unfamiliar VE, wayfinding is further complicated for users as there is fewer spatial cues that are commonly used in the physical environment [1]. People obtain the spatial knowledge about their position and surroundings through wayfinding aids which is in accordance with human cognition [2]. Overview maps provide users a wealth of information in an easily digestible format [3] and an aid in learning the layout of the information space [4]. The differences between VEs and the real world could make the use of maps in VEs different. However, very few research studies on the design of wayfinding maps have been conducted in VEs.
Maps should be readable and well-layered, and also be able to properly handle figure-ground relationships. Sometimes the only feasible way to a mapping problem is
to use transparency as a visual variable to demonstrate layers of information. Nonetheless, whether to use transparency has always been determined by personal preference, convenience or artistic appreciation instead of some experimental results [5]. Using transparency to represent spatial information may affect the effectiveness of overview maps. Our work contributes to existing studies on overview maps by examining the effect of the transparency of overview maps on wayfinding in VEs.
Performance of individuals was quite different, from the perspective of the ability to use a map, task completion time and accuracy [6]. Previous studies have found that gender differences play a crucial role in the wayfinding process [7] and have effects on users’ wayfinding performance and feelings in VEs [8]. Gender differences in spatial ability are important causes of various individual performance in spatial knowledge acquisition in VEs [9]. The use of overview maps requires higher spatial visualization ability [4]. Transparency may minimize cognitive load and decrease the difficulty of understanding the overview map, but the figure-ground relationship becomes ambiguous. Gender differences in map-learning strategies [10], spatial ability [11] and wayfinding strategies
Original paper
Journal of the Science of Design Vol. 4 No. 1 2020 9
Original ArticlesReceived June 13, 2019; Accepted September 13, 2019
[8] may have effects on wayfinding in VEs using overview maps with different transparency levels. Wu et al. [12] suggested that the design of wayfinding aids in VEs should consider individual differences in users’ spatial ability. Therefore, it is important to consider gender as a critical referential factor for the design of overview maps. To the best of our knowledge, little has been reported about the effect of gender differences on wayfinding with an overview map.
This study aims to find better overview map interfaces which can aid both male and female users to accurately reach their destinations in VEs. The goals of this research study are: (1) To investigate the effects of the overview maps with different transparency levels in wayfinding tasks with different difficulties in VEs; (2) To test a possible relation between gender differences and the effectiveness of the considered overview maps in VEs. The findings of this study can serve as references for the visual design of overview maps in VEs. 1.1. Virtual Environments
VEs are created by Virtual Reality (VR), which simulates realistic-looking 3D space on a computer display [13]. Almost all kinds of environments can be simulated [14], and people are able to interact with them. A VE can be considered as a complex and complete combination of 3D geometrical entities or images with an overall view [15]. VEs can be quickly varied, easily posted online and widely spread. Using a mixture of 3D models and 2D images to render VEs can reduce time and efforts to model and save the expenses for special purpose rendering hardware, integrate interactivity and simulation, make scenes more natural and stereoscopic, and enhance user experience.
VEs are characterized by interaction, immersion and imagination, which can make sure that users feel involved [13]. Burdea and Coiffet [16] considered the three characters as a VR triangle. The three elements work as the three vertices that are mutually related in an orderly manner. Users can browse and search for the information they need in VEs, adjust parameters to control environment variables, and check or move the objects in VEs. All these interactions are difficult to be realized in physical environments. Rebelo et al. [13] also proposed that immersion is related to users’ feelings when they are in a VE. The authors put forward that the extent of perceiving the real world is a key factor of the physical level of immersion. It means that if users are fully immersed in a VE, they have low perception (e.g., see, hear, and touch) of the real world. Imagination is associated with users’ abilities to perceive objects in VEs, even while knowing they are in the real world [16]. The levels of interactivity and immersion have direct influence on one’s imagination [13]. 3D virtual scenes, wayfinding aids,
interactions, virtual actors, artificial intelligence, customization are crucial elements in VEs.
The quality of user experience in a VE depends on various factors, including equipment type, realism of the VE, interaction mode, field of view, individual differences and so on [17]. A previous study has provided strong evidence that efficiency of completing the wayfinding, searching, and comparing tasks in VEs with abundant information by using large high-resolution displays is higher than using small low-resolution displays [18]. 1.2. Design issues of wayfinding maps
Wayfinding refers to the process of human accurately orienting and navigating themselves from the origin to the destination [19, 20]. Wayfinding tasks can be categorized as exploratory navigation, travel to familiar destination, and travel to new destinations [19]. In this study, wayfinding guided by overview maps is a typical wayfinding task of traveling to new destinations. Route knowledge and survey knowledge can be considered as the basis of wayfinding [20]. Route knowledge, the knowledge about a sequence of points, means a series of directive information users obtain about how to move from one position to the next. Survey knowledge, the knowledge about an area, contains a cognitive map of the environment, in which all routes are organized like a unified network jointed by locations [20, 21]. Route knowledge is easily disrupted by any change and cannot take any new route. Conversely, survey knowledge is more flexible [21].
Various visual designs of wayfinding aids, such as halo, arrow, wedge, landmark, and map, illustrate visualized information regarding distance and direction [1, 12]. Maps should highlight both local features and global features to support users in the acquisition of spatial knowledge of VEs [22]. Overview and detailed interfaces are often used to display the entirety and details of the virtual space. A detailed map shows various types of information about the virtual space. It is always used to control position at a short distance and undertake diagnostic tasks. An overview map is a sketch of geographic information, which involves general descriptions of the space and supports monitoring, exploring, and wayfinding tasks [23]. Overviews of spaces are beneficial to users in navigating tasks [6, 12, 23]. A number of studies have found that users with an overview map have better sense of direction, higher satisfaction, preference, and efficiency than those without an overview map [4, 6]. The overview map has three distinct advantages: (1) It helps increase wayfinding efficiency; (2) Tracking user’s location in VEs while providing task relevant information; (3) Giving users a feeling of control [6]. Nevertheless, the authors note that the overview map might strain memory, occupy screen space [6], and demand
Journal of the Science of Design Vol. 4 No. 1 202010

more cognitive processing [4] than interfaces without an overview map. As an important wayfinding aid, the overview map was the main object of this study.
Bertin [24] put forward the concept of visual variables including size, value, grain, color, orientation, and shape. MacEachren [25] suggested the addition of fuzziness, resolution, and transparency. Visual variables can be used to describe the perceptual properties of map symbols and help understand spatial layout [26]. These variables are combined in various ways so that data features and relationships can be rationally represented on maps. Earlier studies have evaluated the effectiveness and efficiency of various map-design elements. Devlin and Bernstein [27] indicated that high or low detail, color or monochrome make no significant difference in terms of wayfinding performance; the efficiency of names listed at the site of the landmarks were significantly higher than landmarks identified by numbers and labeled in a legend to locate a landmark. Garlandini and Fabrikant [28] found that the visual variable size is more efficient and effective to guide users’ attention than color and orientation in 2D maps, and orientation is the least efficient and effective variable. Some principles of map design in physical environments can be applied in VEs. Wu et al. [12] suggested to render few details on overview maps to show the relative position of the user and the destination in VEs. 1.3. Transparency
Different from brightness, hue, saturation, and other color properties, transparency can provide human a feeling of reality or fiction and give an apparent order perception of area cartographic symbols. Guiberson [5] suggested that the presences of non-transparent visual cues determine the perception of transparency. If there exist no non-transparent objects underlying, the transparent objects will show up as opaque. Mitsudo [29] conducted a series of experiments which pointed out that the combination of changes in figural cues (e.g., shape, and size intersection) and luminance can improve the efficiency and accuracy of transparency perception.
There exist few studies about effects of the transparency, size, layout, or other design elements of overview maps on wayfinding. MacEachren [25] first proposed to use transparency as a visual variable for representing spatial data on maps. Transparency can increase the display space in navigation scenarios, and earn a stronger user preference [30]. Kraak and Brown [31] suggested that transparency can attract users’ attention, emphasize figure-ground relationships, give a sense of depth or distance, and produce shadow effect. Put a transparent overview map on an opaque background and keep reducing the transparency of the map, the result is that the contrast between the overview
map and background becomes obvious. The visibility of map itself becomes highlighted, while the coverage part by the map turns into obscurity. On the contrary, as the transparency is increased, the contrast between the map and background is not clear, and the light color of the map makes the covered information become evident. Map users are unaware of the existence of the transparent interface and entirely concentrating on the task [32]. Transparency of the display can be changed by moving a slider bar in many interactive maps. Generally, the purpose of using transparency is to improve the overall visual effect of the map, to minimize working memory load, and to reduce the difficulty of understanding and creating graphical representation. However, to some extent, the contents on different layers have mutual effects on each other, which may lead to the result that it is difficult to figure out the position of the objects making the figure-ground relationship ambiguous. Guiberson [5] proved by experiments that transparency level can be efficiently and accurately estimated if only a few categories are adopted on a map. In order to deeply discuss the influence of transparency of overview maps on users’ wayfinding performance and feelings, this study made comparisons between overview maps with different transparency levels. 1.4. Gender
Males and females have certain individual differences in information input organs (eyes, ears, skins, internal organs, etc.) and information output organs (mouth, hands, feet, etc.). Information input organs have direct influence on production of sensory memory. Differences in information output organs can affect how users respond to the system by movement control. Therefore, gender is one of importance personal traits that makes a difference in individuals’ information processing and decision-making. Males are significantly better than females in spatial ability on the aspect of mental rotation [11].
Previous studies have found that males and females performed differently in wayfinding tasks on strategies, efficiency, accuracy, satisfaction, etc. Males are more likely to use an orientation strategy, prefer using visual-spatial cues, and maintain a sense of their own position in relation to environmental reference points; whereas females are more likely to use a route strategy, attend to instructions on how to get from place to place, and better at memorizing the landmark cues to change orientation and location in a step-by-step sequence [7, 8, 21]. Several studies have showed that females take significantly longer to indicate which path to follow and complete wayfinding tasks, have less directional accuracy, and make more errors than males [27]. While a review of the studies on gender differences in spatial orientation suggested that 18.42% of the
Journal of the Science of Design Vol. 4 No. 1 2020 11

experiments found a female advantage in the environment which is represented by a map [8]. Females were reported to have more spatial anxiety [21] and frustration [27] in performing the wayfinding tasks.
Discussions on gender differences pertinent to wayfinding in VEs are less than in physical environments. Males and females have different advantages in wayfinding in VEs [33]. Gender effects on wayfinding performance are not the same in different experiments. Coluccia and Louse [8] concluded in a review that males outperform females in 57.14% of VE experiments. They suggested that males perform better than females in a high percentage (85.71%) of the cases in which participants can freely explore a VE. When participants cannot control their movements and actively decide where to go, only 28.57% of the experiments found a male advantage. In the above situations, females never perform better than males. It is unknown whether gender differences affect wayfinding in VEs using overview maps with different transparency levels. 2. Materials and Methods 2.1. Experiment design
This experiment implemented a 3 (the transparency of an overview map) x 2 (gender) between-subjects design. According to different transparency levels of the overview map, participants were divided into three groups, and each group was divided into male group and female group, there were 6 groups in total. The hypotheses of the research are as follows: (1) Using overview maps with different transparency levels may lead to significant differences in wayfinding performance. (2) Using overview maps with different transparency levels for wayfinding may lead to significant differences in subjective evaluation. (3) Users’ performance may be affected by gender differences when using overview maps for wayfinding. (4) Subjective
evaluations of overview maps for wayfinding may be affected by gender differences. 2.2. Participants
Sixty participants were invited to take part in the experiment by using convenient sampling method. Thirty of them are females and thirty are males aged from 16 to 30 years. All participants had received high school education, and most of them are university students. All participants were familiar with tablet computers that were used in our experiments. 2.3. Materials and Apparatus
A virtual exhibition area was created with 3DS Max software and virtual models were set up for this study (see Figure 1). Objects in the exhibition were photographic images. An overview map of the virtual exhibition was created with Photoshop software. The virtual model and exhibit images were imported to the Unity 3D game engine, then the mode of operation was configured.
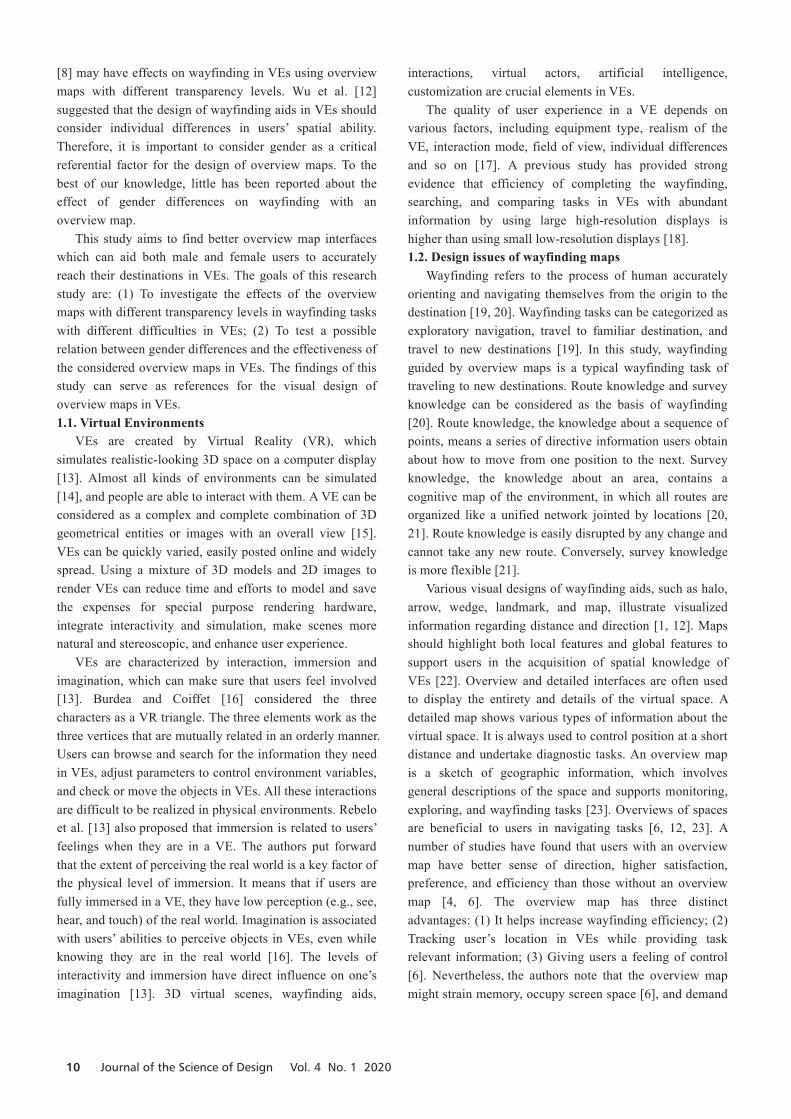
Comparative experiments were performed in accordance with three transparency levels of the overview map, i.e., the 0% transparency overview map is an opaque
Figure 1. The 50% transparency overview map on the virtual exhibition interface
Figure 2. Overview maps used for wayfinding: (a) The 0% transparency overview map; (b) The 50% transparency overview map; (c) The 100% transparency overview map
(c) (a) (b)
Journal of the Science of Design Vol. 4 No. 1 202012

image (see Figure 2a), the median value is 50% transparency (see Figure 2b), and the 100% transparency overview map is with a wire frame (see Figure 2c). The goal of this experiment is to explore whether the transparency of overview maps could help integrate spatial information and improve wayfinding performance time.
The experiment was conducted on an iPad Air 2 tablet computer with screen size of 9.7 inches and resolution of 2048×1536, iOS 9.3 operating system. 2.4. Procedure
Wayfinding performance was evaluated in accordance with the results of participants’ operation of overview maps and assessments to subjective feelings were made. The experiment was supplemented with a System Usability Scale (SUS) questionnaire and multiple interviews with participants after the experiment.
Most current VEs focus on reproducing user’s perceptual experience of colors, textures, sounds, shapes, distances, and other information [34]. Users usually change positions, alter the angle of view, and check the details of exhibits on the interface of a virtual museum. In this experiment, participants were asked to perform four tasks featuring various conditions a user is likely to experience in VEs. Participants could move fingers across the screen to alter view angles and directly click the icons on the overview map to change positions.
Four tasks with increasing difficulty were arranged according to their complexities. The first task was to find the farthest profile exhibition area. Participants needed to compare the distances using the overview map to change their positions as necessary. This task was easy to complete. The second task was to count the number of works in the Chinese calligraphy exhibition area. Participants not only needed to change their positions, but also to make a judgement on the quantity of perceptual information by altering visual directions and visual coverage. The difficulty of the task was increased. The third task was to look for all Chinese painting exhibition areas and then point out the longest Chinese painting. To complete the task, participants needed to get to three places that met the requirement, and then changed the angle of view to make a judgement on the size of perceptual information, memorizing and comparing what they perceived. This task was relatively difficult to complete. The fourth task was to find two introduction exhibition areas both located the nearest to the entrance, and then find out which area was exhibited with more exhibits. Participants needed to get to two places that met the requirement, and then changed the angle of view to judge, memorize, and compare two kinds of perceptual information, i.e., distance and quantity. This task was much more difficult for participants to fulfill than
the above three ones. When users feel confused in the environment, they may
slow down speed, stop to observe the surroundings or retreat, making wrong turns more frequently than usual. Different wayfinding tasks, wayfinding aids, and experimental scenes may lead to different statistic results. In general, the results can be reflected in time spent on wayfinding. According to Coluccia and Louse [8], task completion time is widely used for measurement of objective performance in recent studies.
After the time spent on each task was recorded, participants were interviewed to find out their feelings and suggestions. Seven-point Likert scale measurement questionnaires were made to evaluate subjective rationality and preferences about the overall task operation.
Finally, participants were required to fill out the SUS questionnaire in order to reveal the usability of the interface. According to Rebelo et al. [13], usability refers to interactions that are usable, safe, effective, comfortable, and easy to learn, and also indicates that participants make few errors. John Brooke developed SUS, which was widely used as a scale to assess the usability of any type of user interface, including product systems, applications, websites, and so forth [35]. It is composed of ten positive and negative statements, which has a strong reliability. Each statement is given five-level Likert item including strongly disagree, disagree, neither agree nor disagree, agree and strongly agree. Participants choose one option for each question, and then transfer their choices into scores. The basic value of positive statement is “the score minus 1”, while for the negative statement is “5 minus the score”. All responses can be summed to get a total number, which multiply by 2.5, then the final score (0 to 100) of the questionnaire can be calculated.
3. Results 3.1. Analysis of task completion time
The result generated from the descriptive statistics and two-way ANOVA of the Task 1 completion time is shown in Table 1 and Table 2. It revealed no significant main effect of the transparency of an overview map in terms of the Task 1 completion time (F(2,54)=1.405, p=0.254>0.05). No significant difference was found in the main effect of gender (F(1,54)=0.165, p=0.686>0.05). There existed no significant interaction effect between the variables of gender and the transparency of an overview map (F(2,54)=0.027, p=0.973>0.05). Some participants visited an exhibition area multiple times to pin down its distance during the first task.
In Task 2, users stopped to observe the contents of VE when they feel confused. As is shown in Table 2, analysis
experiments found a female advantage in the environment which is represented by a map [8]. Females were reported to have more spatial anxiety [21] and frustration [27] in performing the wayfinding tasks.
Discussions on gender differences pertinent to wayfinding in VEs are less than in physical environments. Males and females have different advantages in wayfinding in VEs [33]. Gender effects on wayfinding performance are not the same in different experiments. Coluccia and Louse [8] concluded in a review that males outperform females in 57.14% of VE experiments. They suggested that males perform better than females in a high percentage (85.71%) of the cases in which participants can freely explore a VE. When participants cannot control their movements and actively decide where to go, only 28.57% of the experiments found a male advantage. In the above situations, females never perform better than males. It is unknown whether gender differences affect wayfinding in VEs using overview maps with different transparency levels. 2. Materials and Methods 2.1. Experiment design
This experiment implemented a 3 (the transparency of an overview map) x 2 (gender) between-subjects design. According to different transparency levels of the overview map, participants were divided into three groups, and each group was divided into male group and female group, there were 6 groups in total. The hypotheses of the research are as follows: (1) Using overview maps with different transparency levels may lead to significant differences in wayfinding performance. (2) Using overview maps with different transparency levels for wayfinding may lead to significant differences in subjective evaluation. (3) Users’ performance may be affected by gender differences when using overview maps for wayfinding. (4) Subjective
evaluations of overview maps for wayfinding may be affected by gender differences. 2.2. Participants
Sixty participants were invited to take part in the experiment by using convenient sampling method. Thirty of them are females and thirty are males aged from 16 to 30 years. All participants had received high school education, and most of them are university students. All participants were familiar with tablet computers that were used in our experiments. 2.3. Materials and Apparatus
A virtual exhibition area was created with 3DS Max software and virtual models were set up for this study (see Figure 1). Objects in the exhibition were photographic images. An overview map of the virtual exhibition was created with Photoshop software. The virtual model and exhibit images were imported to the Unity 3D game engine, then the mode of operation was configured.
Comparative experiments were performed in accordance with three transparency levels of the overview map, i.e., the 0% transparency overview map is an opaque
Figure 1. The 50% transparency overview map on the virtual exhibition interface
Figure 2. Overview maps used for wayfinding: (a) The 0% transparency overview map; (b) The 50% transparency overview map; (c) The 100% transparency overview map
(c) (a) (b)
Journal of the Science of Design Vol. 4 No. 1 2020 13
of the Task 2 completion time revealed a significant main effect of the transparency of an overview map (F(2,54)=3.190, p=0.049<0.05). The results of post hoc comparison using the LSD identified a significant difference between the 0 and 50% transparency overview map (p=0.024<0.05). A significant difference was also found between the 0% and 100% transparency overview map (p=0.049<0.05). The Task 2 completion time for the 0% transparency overview map (M=9.079, Sd=5.503) was significantly longer than those for the 50% transparency overview map (M=6.244, Sd=2.249) and the 100% transparency overview map (M=6.633, Sd=3.165). As Table 2 shows, no significant difference was found in the main effect of gender (F(1,54)=0.473, p=0.494>0.05). It revealed no significant interaction between the variables of gender and the transparency of an overview map (F(2,54)=1.857, p=0.166>0.05).
In Task 3, two females with the 0% transparency overview map and one male with the 100% transparency overview map pointed out a wrong painting. Table 2 shows that there was no significant main effect of the transparency of an overview map on the Task 3 completion time (F(2,54)=2.111, p=0.131>0.05). Only the main effect of gender showed a significant difference (F(1,54)=4.112, p=0.048<0.05). Males (M=9.490, Sd=4.531) took less time than females (M=12.623, Sd=7.304) to complete the task. There existed no significant interaction effect between the variables of gender and the transparency of an overview map (F(2,54)=0.821, p=0.445>0.05).
Analysis of the Task 4 completion time is shown in Table 2, there was no significant main effect of the transparency of an overview map (F(2,54)=0.317, p=0.729>0.05). We found no significant main effect of gender (F(1,54)=0.697, p=0.407>0.05). It indicated that there existed no significant interaction effect between the variables of gender and the transparency of an overview map (F(2,54)=1.792, p=0.176>0.05). The most complex task became easy for participants after a series of exploration, because of their familiarity with the VE. Some users visited an area multiple times to confirm the amount of contents during the task.
Table 1. Descriptive statistics of task completion time (s)
Variable Task 1 Task 2 Task 3 Task 4
N M SD M SD M SD M SD
The transparency of an overview map 0 6.347 3.109 9.079 5.503 12.600 8.183 10.136 6.073 20
50% 5.192 3.742 6.244 2.249 8.874 3.998 8.676 4.827 20 100% 7.291 4.606 6.633 3.165 11.697 5.443 9.135 6.901 20
Gender Male 6.068 3.647 6.976 3.695 9.490 4.531 8.676 4.874 30
Female 6.485 4.188 7.660 4.368 12.623 7.304 9.954 6.841 30
Table 2. The two-way ANOVA of task completion time
Source SS df MS F P Post Hoc (LSD) Task1
Transparency 44.205 2 22.103 1.405 .254 Gender 2.600 1 2.600 .165 .686
Transparency × gender .864 2 .432 .027 .973
Task2 Transparency 94.476 2 47.238 3.190 .049* 0>50%, 0>100%
Gender 7.011 1 7.011 .473 .494 Transparency × gender 54.992 2 27.496 1.857 .166
Task3 Transparency 151.119 2 75.559 2.111 .131
Gender 147.173 1 147.173 4.112 .048* Female > Male Transparency × gender 58.770 2 29.385 .821 .445
Task4 Transparency 22.312 2 11.156 .317 .729
Gender 24.499 1 24.499 .697 .407 Transparency × gender 125.987 2 62.993 1.792 .176
α=0.05, *p<0.05.
3.2. Analysis of subjective rationality Rationality refers to the quality of overview map design
that is based on reason. In order to find out which overview map was most logical and easiest to be adopted, comparisons and analysis of subjective rationality were made after users completed tasks. The maximum value is 7 which means strong rationality, while the minimum value is 1 which means strong irrationality. The median value is 4. The two-way ANOVA of rationality is shown in Table 3. In this experiment, the mean value of rationality in each group was over five, and the mean value of rationality (M=6.100, Sd=0.877) means that the overview maps were inclined to be rational.
Table 3. The two-way ANOVA of rationality
Source SS df MS F P Post Hoc
(LSD) Transparency 4.900 2 2.450 3.410 .040* 50%>100%
Gender .067 1 .067 .093 .762 Transparency × gender 1.633 2 .817 1.137 .328 α=0.05, *p<0.05.
The result regarding subjective rationality revealed a significant main effect of the transparency of an overview map (F(2,54)=3.410, p=0.040<0.05). The results of post hoc comparison using the LSD showed a significant difference between the 50% and 100% transparency overview maps (p=0.012<0.05). The rationality score of the 50% transparency overview map (M=6.450, Sd=0.826) was higher than the 100% transparency overview map (M=5.750, Sd=0.786). No significant difference was found in the main effect of gender (F(1,54)=0.093, p=0.762>0.05).
Journal of the Science of Design Vol. 4 No. 1 202014

It pointed out that there existed no significant interaction effect between the variables of gender and the transparency of an overview map (F(2,54)=1.137, p=0.328>0.05). 3.3. Analysis of subjective preference
In order to recognize which overview map was most popular and possible to be chosen by participants, comparisons and analysis of subjective preference were made after users completed tasks. The maximum value is 7 which means to strongly like, while the minimum value is 1 which means to strongly dislike, the median value is 4. The two-way ANOVA of preference is shown in Table 4. The mean value of preference given by participants in each group was more than 5, and the mean value of preference (M=5.917, Sd=0.944) showed that participants like to use overview maps.
Table 4. The two-way ANOVA of preference
Source SS df MS F P Transparency .533 2 .267 .325 .724
Gender .817 1 .817 .995 .323 Transparency × gender 6.933 2 3.467 4.226 .020*
α=0.05, *p<0.05.
The result pertinent to subjective preference indicated that there was no significant difference in the main effect of the transparency of an overview map (F(2,54)=0.325, p=0.724>0.05). We found no significant main effect of gender (F(1,54)=0.995, p=0.323>0.05). Significant interaction existed between the variables of gender and the transparency of an overview map (F(2,54)=4.226, p=0.020<0.05).
According to Figure 3, females (M=6.500, Sd=0.707) gave significantly higher preference scores than males (M=5.600, Sd=0.966) after using the 50% transparency
overview map (p=0.031<0.05). In addition, males gave quite similar preference scores after using the 50% and 100% transparency overview maps. As Figure 3 shows, males preferred the 0% transparency overview map (M=6.200, Sd=0.789) to the others; whereas females liked to use the 50% and 100% (M=6.100, Sd=0.876) transparency overview maps better than the 0% transparency overview map (M=5.500, Sd=1.080). 3.4. Analysis of SUS
After analyzing the system usability evaluations, the two-way ANOVA is shown in Table 5. The mean value of SUS scores in each group was above 80, and the mean value of SUS scores (M=85.958, Sd=11.322) showed that the interfaces have good usability. Participants commented that the overview maps are intuitive, easy to understand, and simple to use.
Table 5. The two-way ANOVA of SUS
Source SS df MS F P
Transparency 250.208 2 125.104 1.047 .358 Gender 37.604 1 37.604 .315 .577
Transparency × gender 821.458 2 410.729 3.436 .039*
α=0.05, *p<0.05.
The generated results of the SUS questionnaire identified that there existed no significant difference in the main effect of the transparency of an overview map (F(2,54)=1.047, p=0.358>0.05). The main effect of gender revealed no significant difference (F(1,54)=0.315, p=0.577>0.05). Significant interaction existed between the variables of gender and the transparency of an overview map (F(2,54)=3.436, p=0.039<0.05).
According to the interaction diagram illustrated in Figure 4, females (M=94.500, Sd=6.325) gave the
Figure 3. The interaction diagram of the transparency of an overview map and gender in terms of preference
Figure 4. The interaction diagram of the transparency of an overview map and gender in terms of SUS
of the Task 2 completion time revealed a significant main effect of the transparency of an overview map (F(2,54)=3.190, p=0.049<0.05). The results of post hoc comparison using the LSD identified a significant difference between the 0 and 50% transparency overview map (p=0.024<0.05). A significant difference was also found between the 0% and 100% transparency overview map (p=0.049<0.05). The Task 2 completion time for the 0% transparency overview map (M=9.079, Sd=5.503) was significantly longer than those for the 50% transparency overview map (M=6.244, Sd=2.249) and the 100% transparency overview map (M=6.633, Sd=3.165). As Table 2 shows, no significant difference was found in the main effect of gender (F(1,54)=0.473, p=0.494>0.05). It revealed no significant interaction between the variables of gender and the transparency of an overview map (F(2,54)=1.857, p=0.166>0.05).
In Task 3, two females with the 0% transparency overview map and one male with the 100% transparency overview map pointed out a wrong painting. Table 2 shows that there was no significant main effect of the transparency of an overview map on the Task 3 completion time (F(2,54)=2.111, p=0.131>0.05). Only the main effect of gender showed a significant difference (F(1,54)=4.112, p=0.048<0.05). Males (M=9.490, Sd=4.531) took less time than females (M=12.623, Sd=7.304) to complete the task. There existed no significant interaction effect between the variables of gender and the transparency of an overview map (F(2,54)=0.821, p=0.445>0.05).
Analysis of the Task 4 completion time is shown in Table 2, there was no significant main effect of the transparency of an overview map (F(2,54)=0.317, p=0.729>0.05). We found no significant main effect of gender (F(1,54)=0.697, p=0.407>0.05). It indicated that there existed no significant interaction effect between the variables of gender and the transparency of an overview map (F(2,54)=1.792, p=0.176>0.05). The most complex task became easy for participants after a series of exploration, because of their familiarity with the VE. Some users visited an area multiple times to confirm the amount of contents during the task.
Table 1. Descriptive statistics of task completion time (s)
Variable Task 1 Task 2 Task 3 Task 4
N M SD M SD M SD M SD
The transparency of an overview map 0 6.347 3.109 9.079 5.503 12.600 8.183 10.136 6.073 20
50% 5.192 3.742 6.244 2.249 8.874 3.998 8.676 4.827 20 100% 7.291 4.606 6.633 3.165 11.697 5.443 9.135 6.901 20
Gender Male 6.068 3.647 6.976 3.695 9.490 4.531 8.676 4.874 30
Female 6.485 4.188 7.660 4.368 12.623 7.304 9.954 6.841 30
Table 2. The two-way ANOVA of task completion time
Source SS df MS F P Post Hoc (LSD) Task1
Transparency 44.205 2 22.103 1.405 .254 Gender 2.600 1 2.600 .165 .686
Transparency × gender .864 2 .432 .027 .973
Task2 Transparency 94.476 2 47.238 3.190 .049* 0>50%, 0>100%
Gender 7.011 1 7.011 .473 .494 Transparency × gender 54.992 2 27.496 1.857 .166
Task3 Transparency 151.119 2 75.559 2.111 .131
Gender 147.173 1 147.173 4.112 .048* Female > Male Transparency × gender 58.770 2 29.385 .821 .445
Task4 Transparency 22.312 2 11.156 .317 .729
Gender 24.499 1 24.499 .697 .407 Transparency × gender 125.987 2 62.993 1.792 .176
α=0.05, *p<0.05.
3.2. Analysis of subjective rationality Rationality refers to the quality of overview map design
that is based on reason. In order to find out which overview map was most logical and easiest to be adopted, comparisons and analysis of subjective rationality were made after users completed tasks. The maximum value is 7 which means strong rationality, while the minimum value is 1 which means strong irrationality. The median value is 4. The two-way ANOVA of rationality is shown in Table 3. In this experiment, the mean value of rationality in each group was over five, and the mean value of rationality (M=6.100, Sd=0.877) means that the overview maps were inclined to be rational.
Table 3. The two-way ANOVA of rationality
Source SS df MS F P Post Hoc
(LSD) Transparency 4.900 2 2.450 3.410 .040* 50%>100%
Gender .067 1 .067 .093 .762 Transparency × gender 1.633 2 .817 1.137 .328 α=0.05, *p<0.05.
The result regarding subjective rationality revealed a significant main effect of the transparency of an overview map (F(2,54)=3.410, p=0.040<0.05). The results of post hoc comparison using the LSD showed a significant difference between the 50% and 100% transparency overview maps (p=0.012<0.05). The rationality score of the 50% transparency overview map (M=6.450, Sd=0.826) was higher than the 100% transparency overview map (M=5.750, Sd=0.786). No significant difference was found in the main effect of gender (F(1,54)=0.093, p=0.762>0.05).
Journal of the Science of Design Vol. 4 No. 1 2020 15

interfaces significantly higher SUS scores than males (M=82.500, Sd=6.972) after using the 50% transparency overview map (p=0.017<0.05), thus the usability was better from the viewpoint of females. Nonetheless, Figure 4 also shows that males gave the 0% and 100% transparency overview maps higher SUS scores than females, but the difference was not found noticeable in the current experiment. Females gave the 50% transparency overview map significantly higher SUS scores than the 0% transparency overview map (M=81.250, Sd=16.255) (p=0.027<0.05). The system usability evaluation results were consistent with the subjective preference result. 4. Discussion
The results of this study showed that the task completion time with the 50% transparency overview map was the least in all tasks. The 50% transparency overview map have been found useful in helping participants recognize positons and objects in a VE. For the task of judging perceptual information, the task completion time with the 0% transparency overview map was significantly longer than the 50% and 100% transparency overview maps. The results confirmed the first hypothesis (i.e., Using overview maps with different transparency levels may lead to significant differences in wayfinding performance) is accepted. The reason might be that the opaque overview map covered some of the exhibits in the VE and then increased the difficulty of judging the quantity of virtual objects. This conclusion is in line with previous studies which proposed that transparency could increase the display space in VEs [30] and help users concentrate on the task [32].
The results of this study pointed out that male participants showed better wayfinding performance in each task. In the moderately difficult task of judging, memorizing, and comparing perceptual information, males performed significantly faster than females. This result confirmed the third hypothesis (i.e., Users’ performance may be affected by gender differences when using overview maps for wayfinding). The reason could be that males have better spatial ability than females who are more cautious and need more time to make visual-spatial decisions [11, 27]. Another possible explanation is that males, who are more likely to use an orientation strategy in wayfinding tasks [7, 8], benefit more than females from the information provided by overview maps in the VE. This phenomenon is coherent with previous empirical work on the effects of gender differences on wayfinding performance [27].
All the users have completed wayfinding tasks with the overview maps in the VE. Results indicated that gender
differences and the transparency of an overview map make no significant difference in wayfinding performance of easy tasks.
In this study, empirical evidence on how the transparency of overview maps affected subjective evaluation is provided. The results of this study indicated that the rationality of the 50% transparency overview map was significantly better than the 100% transparency overview map. The result identified that the second hypothesis (i.e., Using overview maps with different transparency levels for wayfinding may lead to significant differences in subjective evaluation) is accepted. The reason might be that the 50% transparency overview map with more changes in figure and luminance was easier to be efficiently and accurately estimated and read than the 100% transparency overview map [6]. Moreover, the crucial information on the 100% transparency overview map with a wire frame was easily disturbed by the virtual objects in the background. Thus, participants considered the 50% transparency overview map to be more logical. It is also consistent with Wu et al. [12] who suggested to display few details on an overview maps to aid wayfinding in VEs.
Regarding subjective preference, there was a significant interaction between gender differences and the transparency of overview maps. Females like to use the 50% transparency overview map much more than males, which confirmed the fourth hypothesis (i.e., Subjective evaluations of overview maps for wayfinding may be affected by gender differences). The reason could be explained by gender differences in wayfinding strategies [7, 8], that is, males preferred to use an orientation strategy, while females tend to use a route strategy, which resulted in preference differences. Males might be distracted with the virtual objects displayed on the 50% transparency overview map. Another possible reason could be that transparency allow more virtual space to be seen by females who are more anxious and more uncertain than males in wayfinding [21], and thus the 50% transparency overview map could help females relieve their spatial anxiety.
The result generated from the SUS questionnaire pointed out that significant interaction existed between gender differences and the transparency of overview maps. Females gave significantly higher SUS scores than males after using the 50% transparency overview map, which again proved that males and females exhibit significant differences in subjective evaluations of overview maps for wayfinding. Since interference was caused by the contents of VE presented on the 50% transparency overview map for males who prefer using an orientation strategy to know their positions. In addition, females gave the 50% transparency overview map significantly higher SUS scores
Journal of the Science of Design Vol. 4 No. 1 202016

than the 0% transparency overview map. It also proved that using overview maps with different transparency levels for wayfinding leads to significant differences in subjective evaluation. The reason might be that the 50% transparency overview map provided more parts of the VE to assist participants to know the surroundings. Females’ spatial anxiety and confusion caused by being in an unfamiliar environment could be mitigated. Thus, females who are more likely to use a route strategy in wayfinding tasks believed that the 50% transparency overview map was of significantly better usability. This finding is consistent with McGookin et al. [30] who suggested that users strongly prefer the transparency conditions in mobile navigation.
This study is limited to the size and complexity of our virtual exhibition model, which restricts the range of task difficulty. Moreover, the limitations of the visual design of overview maps (e.g., size, color, shape and structure) should be considered. Furthermore, our participants were all young people, thus, it could be a question whether the relationship between gender and the transparency of overview maps from this study is representative enough.
5. Conclusions
This study mainly explored how the transparency of overview maps and gender differences affected users’ objective performance and subjective feelings when completing wayfinding tasks in VEs. Participants’ overall rating was satisfactory to the interface, and they had a smooth operation experience and indicated that overview maps were helpful for wayfinding in VEs. The major conclusions are as follows: (1) Using overview maps with different transparency levels leads to significant differences in wayfinding performance. The wayfinding performance of the 50% and 100% transparency overview maps are significantly better than the 0% transparency overview map in the task of judging perceptual information. (2) Users’ performance can be affected by gender differences when using overview maps for wayfinding. Males perform significantly better than females in the more difficult wayfinding task of judging, memorizing, and comparing perceptual information. (3) Using overview maps with different transparency levels for wayfinding leads to significant differences in subjective evaluation. Participants using the 50% transparency overview map feel significantly more rational than those who use the 100% transparency overview map. Females’ system usability evaluations of the 50% transparency overview map are significantly better than the 0% transparency overview map. (4) Subjective evaluations of overview maps for wayfinding can be affected by gender differences. Females’ preferences for the 50% transparency overview map are significantly stronger
than males. Additionally, females’ system usability evaluations of the 50% transparency overview map are significantly better than males.
Users show better wayfinding performance and subjective evaluations with the 50% transparency overview map which perspicuously exhibits both virtual objects and crucial information on the map. Especially for females, they have significantly stronger preferences and better system usability evaluations for the 50% transparency overview map than males in VEs. We propose preliminary design recommendations on the transparency of overview maps for future work. This study is limited in scope which suggests that further research may include more visual elements of overview maps. The complexity of the VE, age, and 3D-application experience can also be taken into consideration as factors. Acknowledgments
The authors would like to thank all the reviewers for their helpful comments and suggestions.
References [1] Burigat, S. and Chittaro, L., Navigation in 3D Virtual
Environments: Effects of User Experience and Location-pointing Navigation Aids, International Journal of Human-Computer Studies, 65(11), 945-958, 2007
[2] Ramloll, R. and Mowat, D., Wayfinding in Virtual Environments Using An Interactive Spatial Cognitive Map. Proceedings of International Conference on Information Visualization 2001 (2001)
[3] Darken, R.P. and Peterson, B., Spatial Orientation, Wayfinding, and Representation, In Stanney K.M.(Ed.). Handbook of Virtual Environments: Design, Implementation and Applications, Lawrence Erlbaum Associates Publishers, Mahwah, NJ, 493-518, 2002
[4] Sjölinder, M., Höök, K., et al., Age Differences and The Acquisition of Spatial Knowledge in A Three-dimensional Environment: Evaluating The Use of An Overview Map as A Navigation Aid, International Journal of Human-Computer Studies, 63(6), 537–564, 2005
[5] Guiberson, P.F., An Examination of Transparency as A Visual Variable for The Mapping Sciences, The University of Nebraska, 2007
[6] Hornbæk, K., Bederson, B.B., et al., Navigation Patterns and Usability of Zoomable User Interfaces with and without An Overview, ACM Transactions on Computer-Human Interaction, 9(4), 362-389, 2002
[7] Wang, C., Chen, Y., et al., Gender and Age Differences in Using Indoor Maps for Wayfinding in Real
interfaces significantly higher SUS scores than males (M=82.500, Sd=6.972) after using the 50% transparency overview map (p=0.017<0.05), thus the usability was better from the viewpoint of females. Nonetheless, Figure 4 also shows that males gave the 0% and 100% transparency overview maps higher SUS scores than females, but the difference was not found noticeable in the current experiment. Females gave the 50% transparency overview map significantly higher SUS scores than the 0% transparency overview map (M=81.250, Sd=16.255) (p=0.027<0.05). The system usability evaluation results were consistent with the subjective preference result. 4. Discussion
The results of this study showed that the task completion time with the 50% transparency overview map was the least in all tasks. The 50% transparency overview map have been found useful in helping participants recognize positons and objects in a VE. For the task of judging perceptual information, the task completion time with the 0% transparency overview map was significantly longer than the 50% and 100% transparency overview maps. The results confirmed the first hypothesis (i.e., Using overview maps with different transparency levels may lead to significant differences in wayfinding performance) is accepted. The reason might be that the opaque overview map covered some of the exhibits in the VE and then increased the difficulty of judging the quantity of virtual objects. This conclusion is in line with previous studies which proposed that transparency could increase the display space in VEs [30] and help users concentrate on the task [32].
The results of this study pointed out that male participants showed better wayfinding performance in each task. In the moderately difficult task of judging, memorizing, and comparing perceptual information, males performed significantly faster than females. This result confirmed the third hypothesis (i.e., Users’ performance may be affected by gender differences when using overview maps for wayfinding). The reason could be that males have better spatial ability than females who are more cautious and need more time to make visual-spatial decisions [11, 27]. Another possible explanation is that males, who are more likely to use an orientation strategy in wayfinding tasks [7, 8], benefit more than females from the information provided by overview maps in the VE. This phenomenon is coherent with previous empirical work on the effects of gender differences on wayfinding performance [27].
All the users have completed wayfinding tasks with the overview maps in the VE. Results indicated that gender
differences and the transparency of an overview map make no significant difference in wayfinding performance of easy tasks.
In this study, empirical evidence on how the transparency of overview maps affected subjective evaluation is provided. The results of this study indicated that the rationality of the 50% transparency overview map was significantly better than the 100% transparency overview map. The result identified that the second hypothesis (i.e., Using overview maps with different transparency levels for wayfinding may lead to significant differences in subjective evaluation) is accepted. The reason might be that the 50% transparency overview map with more changes in figure and luminance was easier to be efficiently and accurately estimated and read than the 100% transparency overview map [6]. Moreover, the crucial information on the 100% transparency overview map with a wire frame was easily disturbed by the virtual objects in the background. Thus, participants considered the 50% transparency overview map to be more logical. It is also consistent with Wu et al. [12] who suggested to display few details on an overview maps to aid wayfinding in VEs.
Regarding subjective preference, there was a significant interaction between gender differences and the transparency of overview maps. Females like to use the 50% transparency overview map much more than males, which confirmed the fourth hypothesis (i.e., Subjective evaluations of overview maps for wayfinding may be affected by gender differences). The reason could be explained by gender differences in wayfinding strategies [7, 8], that is, males preferred to use an orientation strategy, while females tend to use a route strategy, which resulted in preference differences. Males might be distracted with the virtual objects displayed on the 50% transparency overview map. Another possible reason could be that transparency allow more virtual space to be seen by females who are more anxious and more uncertain than males in wayfinding [21], and thus the 50% transparency overview map could help females relieve their spatial anxiety.
The result generated from the SUS questionnaire pointed out that significant interaction existed between gender differences and the transparency of overview maps. Females gave significantly higher SUS scores than males after using the 50% transparency overview map, which again proved that males and females exhibit significant differences in subjective evaluations of overview maps for wayfinding. Since interference was caused by the contents of VE presented on the 50% transparency overview map for males who prefer using an orientation strategy to know their positions. In addition, females gave the 50% transparency overview map significantly higher SUS scores
Journal of the Science of Design Vol. 4 No. 1 2020 17
Environments, ISPRS International Journal of Geo-Information, 8(1), 11-30, 2019
[8] Coluccia, E. and Louse, G., Gender Differences in Spatial Orientation: A Review, Journal of Environmental Psychology, 24(3), 329-340, 2004
[9] Waller, D.A., An Assessment of Individual Differences in Spatial Knowledge of Real and Virtual Environments, University of Washington, 1999
[10] Coluccia, E., Iosue, G., et al., The Relationship between Map Drawing and Spatial Orientation Abilities: A Study of Gender Differences, Journal of Environmental Psychology, 27(2), 135-144, 2007
[11] Silverman, I., Choi, J., et al., The Hunter-gatherer Theory of Sex Differences in Spatial Abilities: Data from 40 Countries, Archives of Sexual Behavior, 36(2), 261-268, 2007
[12] Wu, A., Zhang, W., et al., Evaluation of Wayfinding Aids in Virtual Environment, International Journal of Human-Computer Interaction, 25(1), 1-21, 2009
[13] Rebelo, F., Noriega, P., et al., Using Virtual Reality to Assess User Experience, Human Factors: The Journal of the Human Factors and Ergonomics Society, 54(6), 964-982, 2012
[14] Jansen-Osmann, P. and Wiedenbauer, G., The Representation of Landmarks and Routes in Children and Adults: A Study in A Virtual Environment, Journal of Environmental Psychology, 24, 347-357, 2004
[15] Chen, S.E., QuickTime VR-An Image-based Approach to Virtual Environment Navigation. Proceedings of SIGGRAPH’95 (1995)
[16] Burdea, G.C. and Coiffet, P., Virtual Reality Technology, John Wiley & Sons, 2003
[17] Wu, F.G., Lin, H., et al., Direct-touch vs. Mouse Input for Navigation Modes of The Web Map, Displays, 32(5), 261-267, 2011
[18] Ni, T., Bowman, D.A., et al., Increased Display Size and Resolution Improve Task Performance in Information-rich Virtual Environments. Proceedings of the Graphics Interface 2006 (2006)
[19] Allen, G., Spatial Abilities, Cognitive Maps, and Wayfinding: Bases for Individual Differences in Spatial Cognition and Behavior, In Golledge, R.G.(Ed.). Wayfinding Behavior: Cognitive Mapping and Other Spatial Processes, Johns Hopkins University Press, Baltimore, MD, 46-80, 1999
[20] Wiener, J.M., Büchner, S.J., et al., Taxonomy of Human Wayfinding Tasks: A knowledge-based Approach, Spatial Cognition & Computation, 9, 152-165, 2009
[21] Lawton, C.A., Gender Differences in Way-finding Strategies: Relationship to Spatial Ability and Spatial
Anxiety, Sex Roles, 30, 765-779, 1994 [22] Löwen, H., Krukar, J., et al., Spatial Learning with
Orientation Maps: The Influence of Different Environmental Features on Spatial Knowledge Acquisition, ISPRS International Journal of Geo-Information, 8(3), 149-164, 2019
[23] Hornbæk, K. and Hertzum, M., The Notion of Overview in Information Visualization, International Journal of Human-Computer Studies, 69(7-8), 509-525, 2011
[24] Bertin, J., Semiology of Graphics: Diagrams, Networks, Maps, The University of Wisconsin Press, 1983
[25] MacEachren, A.M., Visualizing Uncertain Information, Cartographic Perspectives, 13, 10-19, 1992
[26] Andrienko, G.L. and Andrienko, N.V., Interactive Maps for Visual Data Exploration, International Journal of Geographical Information Science, 13(4), 355-374, 1999
[27] Devlin, A.S. and Bernstein, J., Interactive Wayfinding: Map Style and Effectiveness, Journal of Environmental Psychology, 17(2), 99-110, 1997
[28] Garlandini, S. and Fabrikant, S.I., Evaluating the Effectiveness and Efficiency of Visual Variables for Geographic Information Visualization, In Hornsby, K.S., Claramunt, C., et al.,(Eds.). Spatial Information Theory, Springer-Verlag, Berlin, 195-211, 2009
[29] Mitsudo, H., Information Regarding Structure and Lightness Based on Phenomenal Transparency Influences the Efficiency of Visual Search, Perception, 32, 53-66, 2003
[30] McGookin, D., Herteleer, I., et al., Transparency in Mobile Navigation. Proceedings of CHI'11 Extended Abstracts on Human Factors in Computing Systems (2011)
[31] Kraak, M.J. and Brown, A., Web Cartography: Developments and Prospects, Taylor and Francis, 2001
[32] Norman, D., The Psychology of Everyday Things, Basic Books, 1988
[33] Lin, C.T., Huang, T.Y., et al., Gender Differences in Wayfinding in Virtual Environments with Global or Local Landmarks, Journal of Environmental Psychology, 32, 89-96, 2012
[34] Bolter, J., Hodges, L.F., et al., Integrating Perceptual and Symbolic Information in VR, IEEE Computer Graphics & Applications, 15(4), 8-11, 1995
[35] Brooke, J., SUS: A Quick and Dirty Usability Scale. In Usability Evaluation in Industry, In Jordan, P. W., Thomas, B., et al.,(Eds.). Taylor and Francis, 189-194, 1996
Journal of the Science of Design Vol. 4 No. 1 202018