Embed Size (px)
Citation preview
EFFECTS OF THE PISCICIDES, MAHUA OIL CAKE AND CROTON SEED ON THE
PRAWN CULTURE SYSTEM
THESIS SUBMITTED TO THE COCHIN UNIVERSITY OF SCIENCE AND TECHNOLOGY
IN PARTIAL FULFILMENT OF THE REQUIREMENTS FOR THE DEGREE OF
DOCTOR OF PHILOSOPHY
IN
MARINE BIOLOGY
K. ASOKAKUMARAN UNNITHAN
DEPARTMENT OF MARINE BIOLOGY. MICROBIOLOGY AND BIOCHEMISTRY
SCHOOL OF MARINE SCIENCES
CO CHIN UNIVERSITY OF SCIENCE AND TECHNOLOGY
COCHIN - 682 016
AUGUST 1997.
CERTIFICATE
This is to certify that this thesis in all ;ullhcntic record of the research work
carried out by Shri. K. ASOKAKUMARAN UNNITHAN under our Scientific supervi-
si on and guidance in the School of Marine Sciences. Cochin University of Science and
Technology, in partial fulfilment of the requirements for the degree of Doctor of Phi
losophy of the Cochin University of Science and Technology, and no part thereof has
been presented before for the award of any other degree, diploma or associateship in
any University.
Cochin - 16.
~\V~ Dr. N.R. MENON Supervising Guide and Director
School of Marine Sciences
Cochin University of
Science and Technology
Cochin - 16.
~<.~ ~tL~':'L~UYlJJ--------,," Dr. V.J. KUTTYAMMA Co-Guide alld Reader
School of Marine Sciences
Cochin University of
Science & Technology
Cochin - 682 016.

DECLARATION
I, K. ASOKAKUMARAN UNNITHAN, do hereby declare that this thesis entitled
"EFFECTS OF THE PISCICIDES, MAHUA OIL CAKE AND CROTON SEED ON
THE PRAWN CULTURE SYSTEM" is a genuine record of research work carried out
by me under the supervision and guidance of Dr. N.R. Menon, Director, School of the
Marine Sciences and Dr. V.J. Kuttyalllma, Reader, Department of Marine Biology, Mi
crobiology and Biochemistry. School of Marine Sciences. Cochin University of Science
and Technology, Cochin - 16, and that it has nOl previously formed the basis of the
award of any degree, diploma or associaleship in any University.
\\QJj:~\0~ Cochin - 16. K. ASOKAKUIVIARAN UNNITHAN.

ACKNOWLEUGElVlENT
I am greatly indebted to my Supervising Teachers, Dr. N.R. Menoll. Director, School of
Marine Sciences and Dr. V.J. Kuttyamma. Reader. Department of Marine Biology. Microbiology
and Biochemistry. School of Marine Scicnccs. Cocilill University of Science and Technology,
Cochin - 16 for the professional guidance, invaluahle scientific tips, correctives and constant
encouragement given by them during the entire tenure of my study and also in the preparation of
the thesis. Besides, the love and affection given by them is whole-heartedly acknowledged.
All along the course of my studies and preparation of thesis I have received immense help
from Or. Philip Mathew, Lecturer. S.H. College. Thevara. Cochin. for which I thank him very
much.
I take this opportunity to thank Dr. P.S.B.R. James. former Director. Central Marine Fish
eries Research Institute, Cochin for granting me leave to undertake the present study. I also
thankfully acknowledge the guidance extended to me hy Dr. K. Gopakumar. Director, and Dr. K.G.
Ramachandran Nair and Or. H.K. Iyer, Scientists, Central Institute of Fisheries Technology,
Cochin.
I wish to place on record my sincere gratitude to Or. M. Ocvaraj, Director, CMFRI. Or.
M.M. Thomas, former Head of Krishi Vigyan Kendra and Or. Y.K. Pillai, Head of Trainers' Train
ing Centre. and the staff of K. Y.K. and T.T.C of CMFRI, Cochin, for the constant help and
encouragement given to me.
The timely help extended by Or. K.S. Gopalakrishnan and Dr. e.G. Rajendran, former stu
dents of the School of Marine Sciences is also remembered with thanks.
1 also wish to express my gratitude to Srnt. Krupa Gopakumar, Mr. Sathyanandan and Mr.
Pavithran, Scientists of CMFRI for the help extended to me during the analysis of data.
Sincere thanks are also due to the staff of M/S. Aqua Software, Cherai, Cochin and M/S.
Coastal Impex, Cochin for the Computation of data and preparation of thesis.
K.Asokakumaran Unnithan.
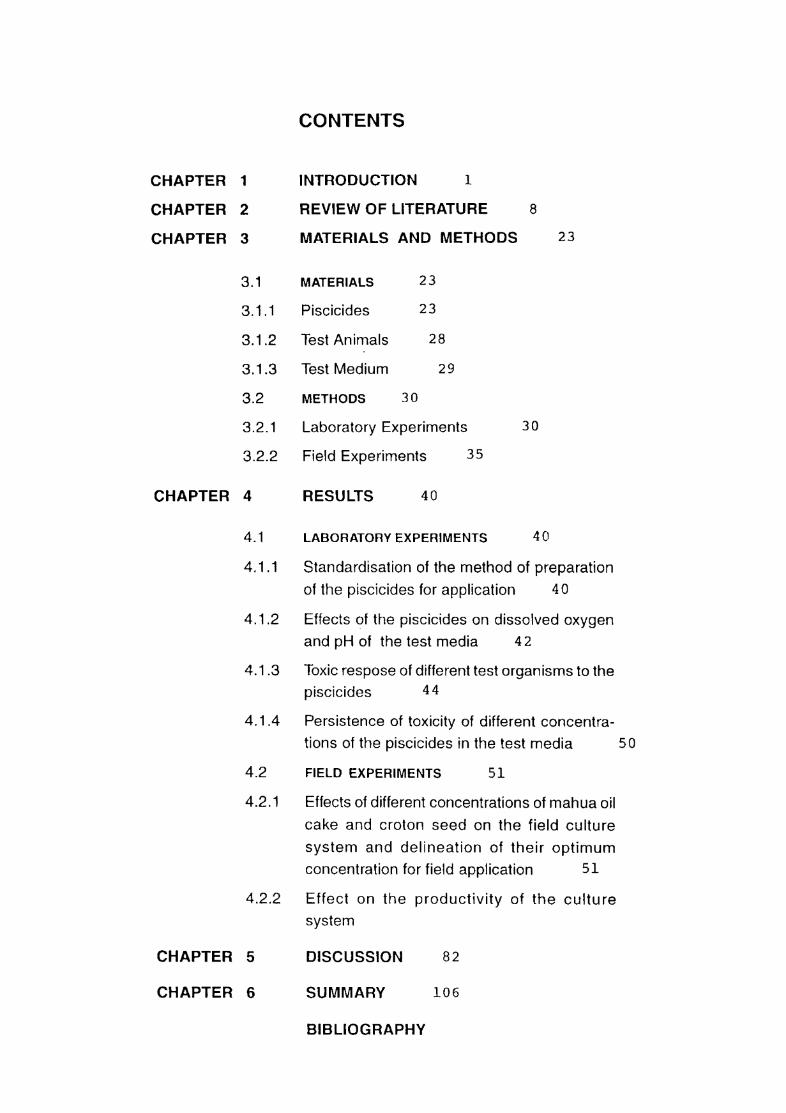
CONTENTS
INTRODUCTION 1 CHAPTER 1
CHAPTER 2
CHAPTER 3
REVIEW OF LITERATURE 8
MATERIALS AND METHODS 23
3.1 MATERIALS 23
3.1.1 Piscicides 23
3.1.2 Test Animals 28
3.1.3 Test Medium 29
3.2 METHODS 30
3.2.1 Laboratory Experiments 30
3.2.2 Field Experiments 35
CHAPTER 4 RESULTS 40
4.1 LABORATORY EXPERIMENTS 40
4.1 .1 Standardisation of the method of preparation
of the piscicides for application 40
4.1.2 Effects of the piscicides on dissolved oxygen
and pH of the test media 42
4.1.3 Toxic respose of different test organisms to the piscicides 44
4.1.4 Persistence of toxicity of different concentra-
tions of the piscicides in the test media 50
4.2 FIELD EXPERIMENTS 51
4.2.1 Effects of different concentrations of mahua oil
cake and croton seed on the field culture
system and delineation of their optimum concentration for field application 51
4.2.2 Effect on the productivity of the culture
system
CHAPTER 5 DISCUSSION 82
CHAPTER 6 SUMMARY 106
BIBLIOGRAPHY
INTRODUCTION Fish including many species of shellfish represent an excellent source of animal
protein and are bioenergetically cheaper to produce when compared to agricultural
livestock. Qualitatively human being can utilise at least 83% of the raw weight of a fish
(Bell and Can Terbery, 1976). much more than agricultural livestock. Fishery holds
considerable promise for enhancing world protein production.
The physical geography of our country with its long coastline along the east and
west and the network of rivers, backwaters, lakes and lagoons have been responsible for
fishing becoming an important occupation providing employment and income for the rural
poor, principal source of food for the people and valuable foreign exchange for the
country. The estimated average per capita availability of total proteins in the Indian diet is
only about 48.5 g of which 5.3 comes from animal source with a mere 0.8 g from fish
(Bardach and Santerre, 1981). This strongly indicates that food quality as well as total
calorie intake is a major problem in India. Per capita nutritional food fish requirement is
about 11 kg/ year with an availability of only about 4 kg/capital year (Sinha, 1979).
Obviously, supply does not meet the demand. While this is the national scenario, the
demand for quality fish and fish products in international markets is also ever increasing.
Fishing industry also plays a vital role in providing livelihood for thousands of families by
way of extending employment opportunities at different stages such as production,
processing, transportation, marketing etc. Given this national and international
importance to fish and fish products, the relevance of any step taken towards increasing
the fish production cannot be overlooked.
Generally, attempts towards achieving increased fish production are aimed at (1)
exploiting new resources, (ii) increasing the exploitation of under- exploited resources
3
shrimp industry as an organised industry of considerable importance. These changes have
raised India to the status of one of the foremost prawn exporting countries of the world
and till recently India had the proud privilege of being the world leader in prawn
production and export by virtue of rich prawns grounds in the sea. However, the
situation has changed, pushing down India's position because of the sudden spurt in the
supply of prawns through aquaculture from other countries(4l1orl )990 ~"9~)'
Healthy growth and survival of the prawn industry depend on the uninterrupted
production and supply of quality prawns. It is highly essential to safeguard the
production trend against any fluctuation or decline, and at the same time effective steps
have to be taken to boost the production to meet the fast increasing demand. In view of
this, priority attention has been given to the development of coastal aquaculture and
utilisation of brackish water areas for productive purposes in our Fisheries plan Schemes.
The yield from the traditional brackishwater aquaculture, by , trapping and
holding', practised over decades in the impoundments of the extensive backwater systems
of the Sunderban mangrove swamps of West Bengal and in the low-lying fields adjoining
the Vembanad Lake in Kerala, is only nominal. This practice is not dependable as far as
the present and future demands are concerned. In this context innovative approaches of
raising commercially important species of prawns by selective farming of the desirable
ones alone is a solution. The programme envisages efficient utilisation of the culture
systems by way of producing maximum quantity of the most desirable species of prawns
such as Penaelts mO/lodo/l and P. indiclIs.
Encouraged by the expansion of prawn market year after year and the resultant
hike in the price structure in spite of the increased supply from many other nations,
introduction of selective farming in the traditional culture systems and adopting the
4
package of practices for extensive, semi-intensive or intensive pattern, IS gaining
momentum in India. In addition to this, efforts ar~ also under way to convert the vast
stretches of coastal land strips, saline swamps and shallow backwater areas into
productive prawn farms along the east and west coasts. Equally rewarding is the
enterpreneurship developing presently in setting up hatcheries in different parts of the
country for the mass production of seeds of commercially important species for
selective farming.
To obtain maximum survival and growth of the prawn seeds stocked in the culture
pond, it is absolutely essential that pests including predators, competitors and other
weed organisms be eliminated from the culture system before stocking with the desirable
species. Prawn farmers have long been aware of the fact that production from the pond is
adversely affected by pests. Simple innovative practices for the removal of pests have
been tried with varying degrees of success. The traditional method of netting the pond
with a fine meshed drag net does not ensure satisfactory results as good many of the pest
organisms escape from being caught. The possibility of draining the fields completely for
eliminating the undesirable organisms is also dependent on topographical aspects of the
locality. Therefore it becomes necessary to apply fish toxicants.
Generally, piscicides are either inorganic chemicals or toxins of plant origin.
Inorganic chemicals like organochlorine insecticides, even in lower doses affect majority
of the pond organisms and their toxicity lasts for a longer duration. There is also a great
risk in the use of such materials because of the residual toxicity, if given in overdose or
applied repeatedly. Increasingly widespread use of chlorinated hydrocarbon
insecticides is becoming a source of real danger to fish and other aquatic and wild life
Chaudhuri, 1975) In view of this grave situation it is advisable to look for piscicides of
5
plant origin which at certain concentrations destroy pest organisms and are naturally
degradable and environment friendly.
A large number of plant species growing in the wild in India are reported to be
poisonous to fishes. Though many of these plants or plant products have been subjected
to research on their piscicidal properties under freshwater conditions, the information
available are fragmentary. Similar studies concerned with brackishwater environment are
also sparse.
The present research programme envisages a comparative study of the effects of
two piscicides of plant origin, viz., mahua oil cake, a derivative from the plant Bassia
latifolia and croton seed, a product from the plant Croton tiglium Although some reports
on the effects of mahua oil cake and croton seed on fresh water pond culture systems are
available, information on their effect on brackishwater culture systems are rather scanty.
This was the guiding principle for launching the present study. It is hoped that the findings
will enable aquaculturists to make use of the piscicides in a more rational and efficient
way, and will go a long way towards realising the maximum return Horn culture systems
without hampering the environment.
The thesis is presented in seven chapters such as Introduction, Review of
literature, Materials and Methods, Results, Discussion, Summary and Bibliography.
The Introductory chapter details out the importance, traditional practices, present
status and prospects of prawn fanning in India and also the relevance of the present
study. Reports on the effects of various piscicides under laboratory and field conditions
and the information available on the environmental aspects of prawn culture systems
including prawn culture operation are briefly reviewed in the second chapter. The third
chapter on Materials and Methods provides detailed descriptions on the different test
6
organisms, toxicanls, testmedia employed and the methodology followed during the
laboratory and field experimentation. The results of the experiments conducted under the
laboratory and field conditions are presented separately under the chapter on Results.
Under laboratory inve~tigation~. the results of experiments such as, refinement of the
method of preparation of the toxicant for application, study of the toxic effects of the
two piscicides on selected finfish penaeid prawn and clam species; study of the effect of
the piscicides on the physio-chemical parameters of the test media; assessment of the
persistence of toxicity of the piscicides in the ambient media under different
concentrations; haematological effects of the piscicides on the selected test fish species
etc., are covered.
Results of the experiments on the toxic response of different fin fish and shell fish
species, zooplankton and macrobenthos under diflerent concentrations of the piscicides;
delineation of the effective dose of the two piscicides for absolute mortality of weed
fishes under field conditions; effects of the piscicides on the hydrographic parameters of
the culture systems under different concentrations; persistence of toxicity and progressive
degradation of the piscicidcs under difIerent concentrations; field culture of the penaeid
prawn, Penacus jndi(;us, in ponds treated with the optimum dose of the two piscicides
with regular monitoring of the hydrographic parameters including depth, temperature,
salinity, dissolved oxygen, pH, nutrients, primary production etc. and soil characteristics
such as texture, pH, nutrients, dynamics of benthic fauna and also the growth, survival
and production of prawn etc. are described under the section on field studies. Under the
chapter on Discussion, the results of the present study carried out under laboratory and
field conditions are critically discussed and explained in the light of the information
available. The salient flndings made during the present study, including the laboratory and

7
field investigations are summarised under the chapter on Summary, followed by the
Bibliography containing the list of literature cited in the text.
8
2 REVIEW OF LITERATURE
Historically, the development ofIndian aquaculture can be divided into three phases
(Bimachar and Tripathi, 1966) beginning from 1147 A D. The rearing of Indian major carps
in natural or man-made impoundments were the primary activity. The second phase between
1850's and the early 1960's was a period characterised by the introduction of exotic
freshwater fishes for culture. During the later stages of this phase a number of important
innovative aquacultural procedures were adopted or developed for the first time in India.
These include the use of hypophysation for induced spawning, artificial fertilisation of fish
ponds, and the use of sewage for enchancing the primary productivity of the fish ponds. It
was also at this stage that systematic efforts were initiated to establish and improve
brackishwater aquaculture in certain parts of India. Alagarswami (1990) has made an
elaborate review of literature on the origin and development of brackishwater aquaculture
in India over the past decades. The inunense scope for an organised system of salt water fish
farming in our country was originally conceived by James Hornel who suggested the
development of coastal saline swamps, backwaters, estuaries, deltaic marshes and even salt
pan channels for the purpose of fish farming (Tampi,1958).
Among marine products, prawns occupy the most prominent place both in the
domestic and international markets. In India, traditionatly a system of prawn farming
popularly described as 'trapping and holding' has been prevalent in the low-lying
brackishwater impoundments adjoining the Vembanad Lake in Kerala known as 'pokkali
fields and in the Sunderban mangrove swamps of West Bengal known as 'bheries',since
decade!!. '" this system juveniles of prawns and fishes ascending from the sea along with the
9
tidal current are periodically let into brackishwater impoundments during the high tide and
they are harvested periodically during low tide. The system followed in Kerala, popularly
known as prawn filtration was described as early as 1937 by Panikkar (1937) and later on
redescribed by others (Menon, 1954; George et ai, 1968 and George, 1974).
The traditional system of trapping and holding followed in West Bengal, locally
known as bhasabadha or bheries has been described by Hora and Nair (1944), Pillai
(1962) and Saha et aJ., (1986). Prawn farming practices in traditional lines had also spread
to certain other maritime states of the country such as Karnataka, Goa and Orissa also in
due course (Alagarswami, 1990).
In view of the fact that the commercially more important and fast growing species of
prawns are represented only in small proportions in the yield by the traditional practice,
Menon (1954) remarked as early as 1954 that 'unless prawn can be shown to lead to an
improvement in production, it has little chance of being adopted by those engaged in the
industry'. He has also suggested that improvement could be effected if the proportion of
Penaeus indicus could be appreciably raised, or if they could be made to grow larger than
at present in the fields.
While evaluating the merits and demerits, ecological and techno-economic aspects
of the traditional practices, Muthu (] 978) highlighted the scope for improving the culture
practices and production trend by way of propagating the method of selective farming of the
desired species of prawns. Among the different species of commercially important penaeid
prawns, ~. indicus and ~.monodon are the prize species because of their fast growth, large
size and high economic value (Alagarswami, 1981). The principle of the improved method
of selective farming can be summarised as the technology that involves the exclusive
10
stocking of the seeds of commercially more important species of prawns such as f. indicus
or f. monodon proportionate to the area and productivity of the fields and growing them
for definite periods to achieve good quality and maximum quantity of prawns for more
profitability than the conventional practice. Operational guidelines for selective farming
have been presented in various publications (Ramamurthy, 1978; Kartha & Naif, 1980;
Rajyalakshmi, 1980; Unnithan,1985 & 1996 and Anon, 1992). Based on the quantum of
input requirement, package of practices and the resultant production target, selective
farming systems are classified as extensive, semi-inlensive and intensive in diflerent parts
of the world, although there is no clear cut demarcation among these systems.
Selective farming operations are done in the seasonal and perennial fields which had
been used formerly for the conventional trapping and holding system and also in other
backwater and estuarine areas including the shallow brackishwater canals in coconut
groves, the derelict water bodies in salt pan areas along the coastline etc. The dynamics of
such brackish water ecosystems including hydrographic as well as faunistic aspects have
been studied by many workers. Primary productivity and related hydrographic parameters,
the epifauna and benthic fauna, chemical constituents of the bottom soil etc of the prawn
culture fields adjacent to the Vembanad Lake, the largest in Kerala, have been studied in
detail by Gopinathan et aI., (1982), and on the basis of the observations on the primary
production, the fields have been classified as highly productive (> 1500 mg C/m3/day),
moderately productive (500-1500 mg C/m3/day) and low productive «500 mg
C/m3/day). Sheeba (1992) studied the ecological characteristics of the prawn culture fields
of Cochin area. Anirudhan (1980) investigate~ into the nutrient chemistry of Vembanad
Lake. Nutrient distribution in the Cochin harbour and its vicinity, forming part of the
11
Vembanad Lake, have been stl.ldiJ.by Sankaranarayanan and Panampunnayil (1979) and
Murthyand Veerayya (1972).Nair et al., (1988) looked into the environmental conditions of
p~ddy-cum-prawn culture fields of Co chin backwaters.
The organic carbon content of the bottom soil of the three brackishwater culture
system in Cochin region, namely the seasonal fields, perennial fields and canal systems in
coconut groves has been reported to be 4.44%,2.37% and 1.67% respectively, indicating
the order of fertility standard of the three systems (Easwara Prasad, 1982) Following the
method developed by Pillai and Do ( 1985), Joscph Gilbert and Pillai ( 1987) estimated the
lime requirement of different seasonal and perennial prawn culture ponds around the Cochin
backwaters for the pre-monsoon and monsoon seasons, based on exchange and potential
acidity of the bottom soil. Suseelan (1978) explained the environmental parameters
conducive for the culture of marine prawns. Water quality management in aquaculture Md BorJ('?89)"
systems has been dealt with by PilIai and Bord (1985a.} Sivakami (1988) demonstrated the
beneficial effects of fertilizer and feed application on the growth of~. indicus in marine
microcosms.
Reports on the production and distribution of plankton in relation to hydrographic
parameters of the Vembanad Lake are also available (Haridas et aI, 1973; Madhupratap and
Haridas, 1975; Pillai et aI, 1975 Madhupratap and Rao, 1979; Madhupratap, 1979 and Jose
et al 1988). Phytoplankton and zooplankton of paddy-cum-prawn culture fields around
Cochin have been studied by Gopalakrishnan et al (1988). Gopalakrishna PilIai (1977)
studied the distribution and abundance of macrobenthos of the Cochin backwaters.
Requirements of prawn seeds for culture are met either by the natural wild resources
or through hatchery production. Considerable work has been done on the distribution and

12
seasonal abundance of penaeid prawn larvae along the coasts of India (Kuttyamrna, 1975;
Rao, 1980; Kuttyamma and Kurien, 1980 & 1982; Victor Chandra Bose et ai, 1980;
Thampy et aI, 1982~ George and Susce\an, 1982; Suseelan and Kathirvel, 1982;
Ramamurthy, 1982 and Rao, 1983). MaLhew et al (1982) developed a simple device for the
quantitative assessment of prawn seed resources in the estuarine areas. Mohamed et al
(1968) and Muthu (1978a) outlined the identification characters of postlarvae of penaeid
prawns found in brackishwater areas. Simple methods of collection, sorting, counting and
transportation have been described by Selvaraj et ai, (1980) and Unnithan (1985).
The rapid and widespread expansion of prawn farming along the east and west
coasts of India necessitated large scale production of seeds of commercially important
species under controlled conditions. The success achieved in the hatchery production of
prawn seeds in India has been reviewed by Mohamed (1983).
Detailed studies have been made in India on the food and feeding habits of prawns
(Gopalakrishnan, 1952; Panikkar, 1952; Panikkar and Menon, 1956; Thomas, 1972 & 1973
and Kuttyamma, 1974). Considerable differences have been noticed in the food preferences
of the larval stages, juveniles and adult prawns. Panikkar (1952) stated that the food of
young penaeids consisted of organic detritus found in the mud, algal material and other
extremely small organisms contained in the mud. Adult prawns are reported to feed on a
variety of animal and plant material available in the area where they live. They feed on
crustaceans, polychaetes, molluscs, radiolarians, foraminiferans, pisces, diatoms, algae etc
along with considerable quantities of organic detritus from the bottom of the sea or
backwater (Thomas, 1978) According to Gopalakrishnan (1952), food of E. indicus
includes vegetable matter, crustaceans, polychaetes echinoderm larvae, hydroids,
13
trematodes etc. or whatever suitable material they come across. Hall (1962) found that the
food of the juveniles of £,. indic115 from Malayan prawn ponds consisted of crustacea,
vegetable matter and polychaeta.
Farming trials carried out by various agencies in India during the past two decades
have yielded valuable information on the production profile of commercially important
species of prawns under different eco-geographical conditions. Suseelan (1975) reported
the production data out of two culture operations of £,. indicus undertaken during the
period, Jan-Dec., 1973 in the salt pan area near Manakkudy estuary in Kanyakumari
District. The first crop yielded 625 kg/ha with a survival rate of 82% while the second crop
yielded 509 kg/ha with a survival rate of 71 %; total production being 1134 kg/ha/year with
a stocking density ranging from 38000-50000 nos/ha. No feeding was done. George (1980)
obtained a production of 521 kg of £..indicus Iha/lOS days without feeding, from a
brackishwater pond at Narakkal, using wild collection of juveniles, stocked @ 40000
nos/ha, recording a survival of 75%. Culture of £,. indicus during 1978-79 @ 5 seeds/m2 in
the coastal ponds at Mandapam, Tamilnadu, fed with clam meat and trash fish showed a
growth of 121 mm/11g in 158 days recording a survival of 44.05% and a total yield of
231.53 kg/haJ5 months (Nandakumar, 1982). £'.indicus juveniles cultured in polyethylene
lined beach ponds at Calicut attained mean size of 124.3 mmJ 13 .3 g in 115 days (Lazarus
and Nandakumaran, 1986). Culture of f.indicus in newly developed ponds adjacent to the
salt pan areas along the Kallar River at Veppalodai, north of Tuticorin in Tamilnadu under
a stocking density of 1.2-1.5 lakh noslha yielded production upto 1604 kg/haJ224 days with
a survival of 95.4% (Marichamy and Motha, 1986). Poultry manure @ 750 kg/ha was
applied at the bottom at the preparation stage of the pond and later the optimum
14
productivity was maintained by applying organic manure @ 20 kg/ha and fertilizers like urea
and superphosphate, each @ 5 kg/ha, whenever required. The prawns were fed with
pelletised feed twice a day @ 7-10 % of body weight. Lipton (1995) reported a production
of 4.5 tonnes of r,.monodon Iha/crop under a stocking density of 1.4 - 1.5 lakh seedslha
with Taiwanese feed and paddle wheel aeration, in a private semi-intensive farm at
Kanjiramkudi in Ramanathapuram District of Tamilnadu.
Shrimp farmers have long been aware that production from their ponds is adversely
a1Tected by pests. To obtain the maximum survival and growth of the prawn or fish seeds
stocked in the culture pond, it is absolutely essential that the existing population of pest
organisms be eliminated before stocking the culture system with the desired species.
Therefore, eradication of pests including predators, competitors and other weed organisms
from the culture system is an essential prerequisite for a scientific management of the
culture operation. Pest organisms may be native to the culture systems or may be
entering the system through the mesh screen at the sluice gate while in the egg or larval
stages. Simple practices for their prevention and eradication have been tried with varying
degrees of success However, in recent years more scientific methods have been applied to
the problem. The traditional method of netting the pond with a fine meshed drag net does
not ensure satisfactory clearance as good many of the pest organisms escape being caught
(Bhuyan, 1967) This necessitates the application of fish toxicants which at certain
concentration specifically destroy pest organisms and are naturally degradable.
Das (1969) has suggested that fish loxicants should have the following qualities; (a)
effective in killing the fishes at low doses, (b) not injurious to men and cattle, © may not
render the affected fishes unsuitable for consumption, (d) leaves no cumulative adverse
15
effect in the pond, (e) quick detoxification of the pond water and (t) easy availability.
Generally, piscicides may be either inorganic chemicals or toxins of plant origin.
Among chemical piscicides, RADA (Rosin Amine Dacetate), PCP-Na (agricultural
chemical) and Malachite green are commonly used as fish-removing agents in Japan
(Shigueno, 1975). Until recently synthetic insecticides like Tafdrin- 20 with 20% Endrin
was commonly used as piscicides (Shirgur, 1975). Chaudhuri (1975) has studied the
suitability and economics of organochlor insecticides for clearing nursey ponds of
miscellaneous predatory and weed fishes and other harmful organisms like predatory
insects, tad poles, prawns, crabs, etc.; the presence of which is highly undesirable in nursery
ponds. (Alikunhi et a!., 1955). His observations indicated that organochlor insecticides
such as Aldrin, Dieldrin and Endrin are highly toxic to fish, prawns and insects. Even lower
doses of the chemicals affected majority of the pond organisms and the toxicity lasted for a
long time even at slightly higher doses. He is of the view that there is a great risk in the use
of endrin in nursery ponds because of the residual toxicity of the chemical. if given in over
dose or applied repeatedly.
Increasingly widespread use of the chlorinated hydrocarbon insecticides viz., DDT,
Benzene hexachloride (BHC), Lindane, Garnrnexane, Chlordane, Methoxychlor,
Toxaphene, Heptachlor ete and the organochlor insecticides like Aldrin, Dieldrin and
Endrine is becoming a source of real danger to fish and other aquatic and wild life
(Chaudhuri, 1975). Studies on the effects of these insecticides on fish, fish food organisms
and wild life are many (Cottam & Higgins, 1946; Cope et aI, 1947; Surber, 1948; Hoffman
& Surber, 1949; Lawrence, 1950; Young & Nicholson, 1951; Dondoroff et al 1954 and
Harrington & Bidtingmayer, 1958).
16
Ramachandran (1963) observed that the practice of directly applying anhydrous
ammonic into water bodies for weed control is also effective in killing fishes and other
aquatic animals. He recommended this technique for eliminating pest fishes in aquaculture
management. From his observations he arrived at the conclusion that the toxic effect of
anunonia is marked by stoppage of photosynthesis; the chlorophyll seeming to be quickly
destroyed even at lowest doses. Ammonia is reported to remain for several days at higher
concentration in the water. Another clue he has arrived at is that the toxicity of ammonia
seems to be due to the unionised molecular ammonia. He also suggested the technique
requires well- experienced judgement to give satisfactory results. The toxicity of ammonia
has been ascribed (Hasan & Macintosh, 1986) to the fact that the unionised fonn of
ammonia can readily diffuse across gill membranes due to its lipid solubility and lack of
charge, whereas the ionised form occurs as a larger hydrated form with charged entities
which cannot readily pass through the hydrophobic micropores in the gill membrane.
However, it has been shown that ammonium may also have considerable toxicity under low
pH conditions. The toxicity of ammonia varies among species. Increased ammonia
concentrations adversely affect enzyme-catalysed reactions, membrane stability and gill
function, resulting in fish mortality (Colt and Armstrong, 1979)
Modifying the earlier technique of direct injection of anhydrous ammoma as
described by Ramachandran (1963), Subramanian (1983) described a simple method for the
eradication of undesirable lishes from fish culture ponds by application of ammonia, in
which ammonia is released by the application of solutions of calcium hydroxide and
ammonium sulphate in the ratio, 1: 1.8. Ammonia released at a concentration of 15 ppm
(12.4 ppm N) killed plankton, minnows and predatory fishes including the air breathing
17
species. He is of the view that the usefulness of this method is limited to unbuffered, soft
water environments, where ammonia will raise the pH and remain unionised and toxic to
kill the fish
Utilisation of commercial bleaching powder as a fish toxicant has been described by
Tripahy et a!. (\980). Free chlorine, even at low concentrations (0.028 to 0.079 mgl) in
mitural waters has been reported to be toxic to fish by upseting osmotic imbalance (White,
1955; Tompkins and Tsai, 1976). With a view to accentuate the effects of liberated
chlorine in the presence of ammonia, Ram et a!., (1988) made an attempt to develop an
appropriate combination of bleaching powder and urea as a fish toxicant. Combination of
commercial bleaching powder (at 5 mg chlorinell) and urea (at 5 rug total ammonia = NH/
+NH~ 11) proved effective in killing murrel fry (Channa pun_ctatus) under laboratory
conditions. When a similar combination was tried under field conditions, the best results
were obtained in ponds where urea had been broadcast 24 to 47 he before the application of
bleaching powder.
In shrimp farms, the necessity of applying a toxicant which at certain concentrations
kills only the fin fishes, retaining the prawns and which is naturally degradable has been
thought of by various workers. None of the inorganic pesticides meets the requirement of
specificity. Further more, these chemicals, particularly the chlorinated hydrocarbons remain
persistent in the environment, resulting in cumulative effects on other organisms (Minsalan
& Chin, 1986). Toxicants which naturally occur in plants are degradable and fin fish can be
more sensitive to its toxic properties than crustaceans
18
Considerable number of plant species growing in the wild in India are reported to be
poisonous to fishes by Chopra et al. 91956 & 1965), Nayar (1955), Nadkarni (1954) and
Kirtikar & Basu (1975).
Conventionally, fishery workers in India had been using imported "Derris" powder,
produced from the plant Derris eUiptica (Family; Legurninosae) till import restrictions were
enforced. Roark (1932) and Shepard (1951) have dealt with the commercial exploitation of
D.elliptica species (South East Asian countries, East Indies and Latin American countries)
for production of insecticidal preparations. Derris powder contains 5-7% rotenone, which
is the toxic principle (Shirgur, 1972). Rotenone, derived from Derris sp. was demonstrated
to eradicate Oreochrornis mossambicus without affecting the survival of shrimps (Peterson,
1976). Shirgur (1972>4 &- 7G'c>..)worked on the feasibility of developing Derris powder from
the Indian strain of Derris elliptica (Roxb) Benth. He also made a comparative evaluation of
the powder prepared from D.elliptia (Roxb) Benth, D.trifoliate var uligunosa Lour; (Roxb.
ex Wild) and the imported Derris powder.
Shirgur (1975) made preparations of piscicidal powder from different parts of a
number of indigenous plants like Albizzia lebbeck (Linn) Benth, Balanites roxburghii
planch and R~ndi"~ dumentorum Lam. Babu (t 965) has reported the results of his laboratory
studies on the use of Croton tiglium Linn. as a fish poison. Bhuyan (1968) described the
use of C. tiglium seed as fish poison in field trials. According to Horra & Pillai (1962)
powdered eNton seeds were used to by Chinese tlsh eulturists for eradication of unwanted
fishes from nurseries before stocking of prawn and fry.
Bhuyan (1967) catried out laboratory and tleld investigations using the plant 'Rulei'
(Milletia Imchycarpa). In its effects on fish, the toxic principle in the roots of M. pachycarpa
19
appeared more or less the same as rotenone. As in Derris, the poisonous part of'Rulei' is
also the roots. According to Nandy and Chakraborthy (1976), the unripe fruits of the plant,
B,.. dumentorum being a cheap source of fish poison, can be collected without destroying the
plant. Chakraborty et af. (1972) and Bhuyan and Lakshmanan ( cited by Nandy and
Chakraborty, 1976) studied the usefulness of Barringtonia acutangula and Milletia piscidia.
respectively, as fish poisons at the Pond Culture Division of the Central Inland Fisheries
Research Institute, W.Bengal.
Sharma and Simlot (1971) studied the piscicidal properties of the fruit of bitter
temru (Diospyros cordifolia Roxb. Syn. D. montana Roxb.), a shrub of the family
Ebenaceae, which is distributed in many parts of Rajasthan, commonly used to stun fishes.
The plant is distributed throughout tropical India extending to Ceylon, Burma and North
Australia (Anon, 1944). The experiments were conducted using partially purified active
component of the fruit. The material was found to be quite effective in killing many types
of fishes including the hardy air-breathing species like Channa striatus and Heteropneustes
fossilis at a concentration of 6.6 ppm. It also lowered the dissolved oxygen content of
water appreciably at higher concentrations. Skin appeared to be the most affected part at all
concentrations tested, showing decolourisation, peeling off and also slime secretion at
higher concentrations just prior to death. It has also been suggested that the application of
temru extract is quite promising as a piscicide. At low concentrations (0 9 ppm) the fish
was not killed, but remained on the surface and therefore could be easily netted out. This
has been pointed out as an advantage especially with fishes like C striatus, which normally
remains hidden in the mud and hard to catch The results obtained with temru is comparable
with the findings of Babu (1965) in Croton tiglium. Temru did not seem to have any
20
deleterious effect upon the health of workers. It has been suggested that since this material
can be inactivated in a highly alkaline solution, it is possible to destroy its activity, so that
the ponds may be made inhabitable afler its use without resorting to dilution or changing
of the pond water.
Jena (1986) studied the effect of powdered tamarind (Tamarindus indica,L) seed
husk, as a piscicide. The studies indicated that at a dose of 5-10 rng! I, it was effective in
obtaining a total kill of a wide variety of fishes like Indian major carps, O. mossambica,
Channa marulius etc. within 2 hrs under laboratory conditions. It was also observed that the
lethal action of temarind seed husk was independent of water temperature. There was no
significant difference in pH, dissolved oxygen and carbondioxide throughout the
experiments. According to Chopra et a/ (1949) the tamarind seed husk contains Saponin
like ingredient, possessing strong haemolytic properties markedly toxic to fish. Requirement
in relatively small quantities coupled with its effectiveness both at fairly low and high
temperatures, quick action and short duration of toxicity have been cited as advantages in
favour of this material (Jena, 1986).
Culturists in Taiwan have customarily used the tea seed cake as a toxin to kill
undesirable fishes in ponds before stocking with fingerlings. The cake is made ft'OIll the
brewer's grains of a wild tea (Camellia sp.) after extraction of its oil (Tang, 1967 and
Terazaki et al 1980) and it contains 5.2 - 7.2% Saponin. Recommended levels for use in
eradicating undesirable fish in shrimp ponds is 10 - 25 ppm (Cook, 1976). Tarasaki et at
(1980) studied the toxicity of crude saponin extracted from the cake to the shrimp Penaeus
merguiensis; fishes, Scatophagus argus, Tilapia mossambic~, M.u-&il tade, Eleutheronema
tetradactylum and Mystus sp; crab Dca sp and food organisms, Brachionus plicatilis
21
(rotifer), Colurella sp. (rotifer), Sehizopera subteranea (copepod), and Artemia salina (brine
shrimp). Experiments indicated that LT 50 for Tmossambica and Mystus sp. was more
than 6 hr. in 1.1 ppm of saponin (salinity: I sto) and E.!etradactyll,lJ.!! died within 1 hr. The
LT 50 for I.mossambica shortened as the concentration of saponin increased, and was
less than Ihr. at concentrations above 4.7ppm. Larger fish had greater resistance than
smaller ones under same concentration. Resistance of Tilapia mossambica to saponin
weakened as salinity increased. Shrimp and crab survived more than 30 hr. in concentration
exceeding lOppm. The 24-h Tlm of shrimp was 50.4 ppm For larval shrimps (PL 11) less
than 30ppm was harmless while a concentration less than 7ppm was harmless to rotifers.
The lethal dose for Artemia ~alina was higher than that of shrimp and crabs.
Minsalan and Chin ( 1986) made a series of studies to refine the methods of applying
tea seed cake in shrimp ponds. The experiments were conducted with two species of fin
fishes, Oreochromis mossambicus and Glossogobius giurus and two species of crustaceans,
Metapenaeus ensis and Penaeus monodon. Results indicated that lSppm was required for
the complete eradication of finfishes within six hours. It is also suggested that a
concentration of IOppm can be used with the same effects if the toxicant is applied about
noon time when the temperature is highest. This would result in savings by 33% of the
cost of tea seed cake. As the rate of degradation was found to be slow, it was also
advantageous to dilute pond water as soon as possible, so that shrimp' production will not
be affected by the application of tea seed cake. It is recommended that the water level in the
pond be reduced to one third before application, that the cake be applied in minimum
quantity towards noon when water temperature is higher and the water depth be restored
after about six hours of application.
22
Lakshman (1983) described the usefulness of mahua oil cake as a fish poison and
manure in freshwater environments. Bhatia (1970) reported the threshold concentration for
the effect of cake to several species of freshwater fishes to be 60 ppm. Nath (1979)
described the changes in hydrographic parameters and the time taken for the
detoxification of the cake in fresh water under laboratory conditions. Sumit Home
Chaudhuri et al.,( 1986) studied the effect of mahua oil cake on the blood cells and blood
v.alues of an air-breathing fish and a carp species.
23
3. MATERIALS AND METHODS
3.1. MATERIALS
Materials such as piscicides, test animals and test media having relevance with field
applications were employed for the laboratory as well as field investigations and were
procured locally.
3. 1. 1. Piscicides
Mahua oil cake and croton seed were selected as piscicides for the present study.
3.1.1.1. Mahua oil cake
Mahua oil cake used for piscicidal purposes is a product from the perennial madhuka
(Bassia Koenig ex Linn.) tree species, Bassia latifolia Roxb (Syn.Madhuca latifolia;
Mindica J. F. Gmel) belonging to the family Sapotaceae (Bhatia, 1970 and Lakshman,
1983).
Mahua tree is known by different names in the different parts of the country: English
- mahua; Hindi - mahua; Telugu - ippa, ippachettu madhuukamu etc; Tamil - iluppai, iruppai
ete; Malayalam - iluppa, iruppa ete Canarese - ippe mara; Bengali - maua and Sanscrit -
madhuka.
Mahua, a deciduous tree reaching 12 to ISm high, distributed in Central India,
Gujarat, Bengal, Konkan, North Kanara and other South Indian forests, and is cultivated
and self-sown (Kirtikar et aI., 1975 and Nadkarni, 1954). The fruit of mahua is a berry
containing 1-3 seeds. The thick, soft and sugary pericarp forming 70% of the weight of the
berry is edible. The seed is oblong, dull brown in colour and contains almond shaped
creemish yellow kernel which form 70% of the weight of the seed. Flowers, seed oil and
24
cake, leaves, bark etc are also used. Flowers contain sugar, cellulose, albuminous
substances, enzymes, ash, water etc. Seeds contain fatty oil, fat tannin, extractive matter,
bitter principle saponin, albumen, gum starch, mucilage and ash. Ash contains salicic,
phosphoric and sulphuric acids, lime and iron, potash and traces of soda. Oil is a mixture of
stearin and olein. Leaves also contain a glycosidic saponin different from that obtained from
the seeds (Nadkarni, 1954).
The various parts of mahua tree have been known in ancient Indian and folk
medicines for curing various ailments. The bark is used for the treatment of rheumatism,
ulcers, itches, bleeding and spongy gums, tonsillitis and diabetes mellites. The roots are also
employed to treat ulcers. The dried flowers are used for fomentation in orchitis for their
sedative effect. The flowers fried in ghee are eaten by persons suffering from piles. The
sugary syrup or honey obtained by extracting the flowers is reported to be useful for
treating eye diseases.
The flowers containing high amount of fermentable sugars are used for distilling
country liquor. The distilled spirit from the flowers is an appetising, cooling nuritive tonic
used for coughs in the form of dicoction (Wealth oflndia, 1962). The oil from the seeds has
emollient properties and has been used in skin diseases, rheumatism and head ache (Chopra
et al., 1956). It is also used as laxative in piles and haemorrhoids and as an emetic. Because
of tannin content, leaves and bark have astringent properties. The oil is used by natives for
cooking. Major part of the oil, however, goes for soap making and cosmetic industry.
Suitable modifications of its fat give products which are regarded as potential cocoa butter
substitutes that may be useful as extenders in high-priced confectionery fats, vanaspathi and
margarine (Bhattachary and Banerjee, 1983; Ghosh et ai, 1983). The cake is used as a
25
manure either alone or in mixture with other cakes and fertilisers and also as a piscicide.
The piscicidal property of mahua oil cake is attributed to its saponin or mowrin content.
Saponins are poisonous towards the lower forms of life and are used for killing fish by the
aborigins of South America (The Merck Index IX Edn., 1976 - Review and Bibliography
:R.J.McUroy; The plant glycosides (Edward Arnold & Co, London 1951 Chapter IX).
Saponins are toxic bitter principles present widely in plant kingdom and a few lower
classes of animals like echinodermata and in snake venom. They are found in various plant
parts like leaves, stem, roots, flowers and fruits. The content may vary from 0.1 - 30% in
plants or in different parts of the same plant (Tschesche and wulff, 1973). Chemically they
are glycosides with a steroid (C27), triterpenoid (C30) or steroid - alkaloid ring structure
called the 'Sapogenin' or aglycone, with a carbohydrate moiety attached to it. Saponins are
present in more than 90 plant families, of which triterpenoid saponins constitute the major
group (Chandel and Rastogi, 1980)
Mahua oil cake contains 6-8 % saponin (Mulky, 1976) which is soluble in water
(Lakshman, 1983). Mahua oil cake procured from the Marine Products Export
Development Authority, Cochin was used for the present studies.
3.1.1.2. Croton seed
Croton seed is a product from the plant genus Croton, belonging to the family
Euphorbiacease. Four species, viz., Croton reticulatus , ~.oblongifolius, r,;,. caudatus and
r,;,. tiglium are co III III on in India. Among these, ~. tiglium Linn. found throughout India, and
plentiful in eastern Bengal, extending to Assam and Burma yields the croton seed having
piscicidal properties (Nadkarni, 1954)
26
Croton tiglium is an evergreen shrub, the young shoots sprinkled with stellate hairs;
bark smooth, ash coloured; flowers small; capsules oblong and obtusely three lobed and
seeds smooth, about 13 mm long or longer (Kirtikar et ai, 1975).
C. tiglium is known by different names in the different parts of the country: English -
Croton oil seed, purgative croton etc; Sanskrit - Naepala, Jayapala, Kanakaphala,
Titteriphala etc; Gujarati - Nepal Bengali Nepala vitua etc; Tamil and Malayalam
Neervalam (Nadkarni, 1954)
Seed kernels contain 55-57 % croton oil (Chopra et ai, 1956). Croton oil is
composed of: (I) Crotonoleic acid, (ii) Tiglic acid or Methyl crotonic acid, (iii) Crotonol
which is nonpurgative, but an irritant to the skin, (iv) several volatile acids to which the
odour is due and several fatty acids (Nadkarni, 1954).
Fats present in croton oil are glycerides of stearic, palmitic, myristic and lauric acids
and of several volatile acids of the same series like acetic, butyric, valerianic and tiglic
acids (Nadkami, 1954).
Seeds, leaves, bark and root, all possess drastic purgative properties. Seeds
are powerful drastic purgative and vermifuge; in over doses it acts as an acronarcotic
poison. Oil is a powerful hydrogogue cathartic and externally vesicant producing irritation,
inflammation, popular and pustular eruption. The activity of croton oil as a vesicant
externally and as a purgative internally is attributed to the presence of crotonoleic acid
which is said to occur in the free state in which it is freely soluble in alcohol and in
combination as a glyceride. The glyceride does not possess poisonous properties, but the
free acid acts as a powerful irritant to the skin and as a purgative in the intestine. The
crotonol glyceride is attacked and split up like other glycerides by the juices of the stomach
27
and the crotoneleic acid is set free which then exercises its purgative influence (Nadkarni,
1954). The oil from the seed is useful in diseases of the abdomen, mental troubles,
convulsions, fever, insanity, inflammations, bronchitis (Ayurveda). The oil is cathartic,
tonic; removes pus and bad matter from the body (Yunani). It is also useful in dropsy,
obstinate constipation, intestinal obstructions, lead poisoning and as a preliminary laxative
in leprosy and as a rivulsive in apoplexy. The oil is applied to the scalp in acute cerebral
diseases and to the cord in spinal meningitis. The oil has been tried as a counter irritant and
vesicant in rheumatism, synovitis, paralysis and painful conditions of joints and limbs
(Nadkarni, 1954). Seeds have bitter bad taste, causing a burning sensation~ expectorant,
emetic; good in sore eyes, excessive phlegm and leucoderma.
When eaten, the seeds cause nausea and ecuctation, followed by flatulent
distentions of the abdomen, colic and diarrhoea. A single seed itself has been proved fatal.
The oil in a dose of one drop causes burning sensation in the oesophagus and stomach,
nausea and vomiting. In an hour or two some gurgling or slight colic is perceived in the
bowels, followed somewhat suddenly by a watery stool and heat about the anus. Within 24
hours eight or ten more stools follow with considerable weakness. Also cause epigastric
uneasiness and oppression, palpitation of the heart, headache, feverishness, perspiration and
sleep (Nadkarni, 1954).
On account of their drastic purgative properties, the seeds and oil were regarded by
the Chinese as entirely poisonous. According to Hora and Pillai (1962), powdered croton
seeds are used by Chinese fish culturists for eradication of unwanted fishes from nurseries
before stocking of spawn and fry. The fruits are employed by Dayaks in Borneo to poison
fish and in Lakhimpllr the seeds arc ground in water and the infusion is used to kill insect
28
pests (Kirtikar, et al., 1975). The seeds are reported to be used in Java for killing fish
(Nadkarni, 1954). In Assam (local name: Konibin) and N.E.F.A. (local names: Engosinum
and Kusere) it is frequently used by tribals for killing fish in streams and ponds (Bhuyan,
1965). In Kerala it is used by rural people to catch fishes from streams and pools (Babu,
1965).
The piscicidal property of C. tiglium seed is attributed to its content of the
toxalbumin, Crotin, as cited by Babu (1965). However, according to Chopra et al.,
(1956)seeds of croton contain 2 toxic proteins, Croton globulin and Croton albumin, which
are essentially blood poisons (Chopra et al., 1949).
For the present experimental purpose, C. tiglium seeds were purchased locally from
hill produce merchants at A1waye.
3.1.2. Test animals
While selecting the test organisms, weed fishes having widespread distribution in
brackishwater prawn culture systems adjoining Cochin backwater and their ready
availability for collection were taken into account. Since pilot experiments revealed that
larger specimens were more tolerant to the toxicants than smaller ones, only larger
individuals were employed for the study.
To delineate the relative tolerance of finfishes to the selected toxicants, toxicity
studies were carried out employing common weed fishes such as Tilapia mossambica (17-
20cm), Etroplus maculatus (8-9cm), Tachysurus maculatus (l6-1Scm), Ambassis
gymnocephal~s (6-7cm), Glossogobius giuf!..!~ (6-Scm), M(.tgalQP~ ~p'~:!noi_q~~ (20-24cm),
Elops saures (22-26cm), Macropodus cupanus (S-6cm), Aplochylus lineatus (5-7cm),
Ga_T.nbusi.~ afliD~ (S-6cm), and the borrowing snake eel Ophi~j1thy~ borQ(30-40a) and
29
O.microcephalus (45-50cm). I.mossambica was then chosen for further detailed studies and
represented the most tolerent group of finfishes. Among prawns, individuals of postlarval
stages of the species, r~_na~Y1! i!lcli.~lI.s (1.4 - 2.0 cm) were selected for the study; while
Villorita cyprinoides var.cocrunensis (4 - 4.5 cm) was the animal of choice from among the
molluscan species.
Healthy individuals of the test species were collected from the brackishwater areas,
causing minimum stress and transported to the laboratory in well aerated water. The animals
were acclimated to the laboratory condition in large collapsible plastic pools containing
well aerated water of habitat salinity. The lots showing disease symptoms or any abnormal
behaviour were totally discarded. During the acclimatisation period of two weeks, the
animals were fed regularly and the salinity was gradually adjusted to the experimental
salinity (15 % 0 ).
3.1.3. Test medium
Laboratory experiments were carried out in brackishwater of salinity, 15 0/00
collected from Cochin backwaters. The water was transported to the laboratory in large
plastic carbouys and kept in total darkness for ageing. The water was filtered through a
9fass wouf {filter, aerated to full saturation before use and the optimum salinity was maintained
throughout the experiments. Dilution or concentration of the test medium to the
experimental salinity was done by adding tap water or sea water as required.
Field experiments were conducted in Vypeen Island that form a part of Ernakulam
District. The island, about 25 km long with an average breadth of 2 km is bordered by the
Arabian sea and Cochin backwaters along the western and eastern side. The Azhikkodu
30
and Cochin bar mouths form the northern and southern boundaries respectively. The
extensive prawn culture systems in the island including the perennial fields, seasonal
pokkali fields and canal systems in coconut groves arc fed by a net work of canals
running transversely and longitudinally having confluence with the Cochin backwaters
which in turn is confluent with the Arabian sea through the two bar mouths.
Brackishwater impoundments, forming part of a canal system in a coconut grove
at Narakkal village (760 14' E and 10° 3'N) situated in Vypeen Island about 10 km north
of Cochin barmouth were selected for the present study. The ponds were confluent with
one of the main feeder canals running longitudinally along the island.
3.2. METHODS
3.2.1. Laboratory experiments
3.2.1.1. Preparation of the toxicants for application
Mahua oil cake:
With a view to standardise the method of preparation of the maximum potent form
of the toxicant for application, different preparations of the material such as (a) freshly
powdered cake and (b) aqueous suspension from pre-soaked cake were employed during
the study. Lethal time for absolute mortality of the fish was used as an indicator of the
efficiency of the preparation. Since pre-soaked material was found to be more toxic than the
other, experiments were carried out to evaluate the influence of soaking time on the potency
of the toxicant.
31
Croton seed:
Toxicity studies involving pre-soaked as well as unsoaked croton seed as aqueous
suspension were carried out to evaluate the relative potency. Pre-soaking was found
beneficial in that it helped easy and effective grinding of the seed. Experiments were also
carried out to evaluate the influence of duration of soaking on toxicity as in the case of
mahua oil cake.
3.2.1.2. Toxicity studies
Laboratory conditioned animals of uniform size were exposed to test solutions
containing graded concentrations of the toxicants following standard method (Sprague,
1973). In order to evaluate the relative tolerance of different fish species, selected finfishes
were separately exposed to a lethal concentration of 200 ppm of mahua oil cake and 4
ppm of croton seed. The lethal time (LT 100) of each species was considered as the
indicator of its tolerance against the toxican! Among the different species tested, those
which required the maximum and minimum time to reach lethality were considered the most
and least tolerant, respectively.
Experiments were carried out in fibre glass tanks of 50 1 capacity coated with
chemical resistant epoxy resin inside and ten animals each of the test species were exposed
to the selected toxicant concentrations. The experimental tanks were covered to minImIse
external disturbances. The experiments were carried out at room temperature (28 °C±l QC)
and the animals were not fed during the course of experimentation. Appropriate duplicates
and controls were maintained for all the experiments. The animals were inspected at
37
regular intervals and all dead individuals which failed to respond to mechanical stimulation
were removed.
Behavioural responses such as body movements, swimming pattern, opercular
movements and maintenance of equilibrium were observed to identify stress symptoms
among individuals of the test species exposed to the toxicants. Failure to respond to
physical stimulus and stoppage of gill movements were accounted for ascertaining
mortality.
Studies were also conducted to determine the lethal dose (LD 100) of the most
tolen,mt fish species tested, within 6 hours. A period of over 6 hrs involves the risk of any
dilution of the medium under field conditions which may occur due to an increase in tide
level and seepage, likely in low lying backwater impoundments, influencing the toxicity of
the piscicide. On the other hand, a duration of less than 6 hrs was also not preferred since it
may necessitate a higher dose of the toxicant which may be disastrous to the entire
ecosystem including the desirable species. Further, biodegradability of the piscicide also
may be delayed in the case of higher doses.
The toxic responses of postlarvae of r.. indicus and the clam V.~yprinoides were
also studied ronowing exposure to different concentrations of mahua oil cake and croton.
Test media containing different concentrations of the two toxicants were observed
for a period of 96 hrs to assess the impact of the toxicants on the physice-chemical
parameters of the test media such as temperature, pH and dissolved oxygen. While mahua
oil cake was applied in the form of pre-soaked powder, in the case of croton seed, its
aqueous suspension from pre-soaked material was put to experimentation With a view to
33
understand the nature of restoration of dissolved oxygen in the test medium, experiments
were carried out employing mahua oil cake and croton seed and the medium covered by
liquid parafin to prevent contact with atmosphere.
The persistence of toxicity of mahua oil cake and croton seed suspension in the
ambient medium was determined by exposing the finfish A. gymnocephala which
represented the least tolerent group of fin fishes, to selected concentrations of the toxicants
every 24 hours till the media was no longer lethal to fishes due to progressive degradation
of the toxicants.
3.2.1.3. Haematological studies
For haematological studies blood samples were collected from the caudal vein in
asceptic condition by severing the caudal peduncle (Hesser, 1960). The collected blood
samples were treated with 3:2 mixture of ammonium oxalate and potassium oxalate at the
rate of 0.5 - 1.0 ml per ml of blood to prevent coagulation. AIiquotes of pooled blood
samples from 3 to 5 fishes were used for the different estimations. The different
haematological parameters were estimated employing standard techniques (Hesser, 1960;
Blaxhall and Daisley, 1973).
The technique employed for the erythrocyte counts of fish blood were similar in
most respects to those used in mammalian counts except for a change in the RBe diluting
fluid. Hendrick's RBC diluting fluid was used during the present study (Hendrick, 1952).
Neubauer type of haemocytometer was used for the purpose of RBC counting. The total
erythrocyte count is expressed in millions of RBC per cubic mm of blood.
34
Cyanomethaemoglobin method described by Ortho Diagnostic Systems (1986) was
followed for estimating the haemoglobin content. To O. 02 ml of blood 5 m1 of aculte
reagent (modified Drabkin reagent) was added and stirred well. The potassium ferricyanide
present in the reagent converts the haemoglobin iron from the ferrous to ferric state to
form methaemoglobin and this in turn combines with potassium cyanide of the aculute
reagent to produce a stable pigment or the cyanomethaemoglobin which represents the sum
of oxyhaemoglobin, carboxihaemolobin and methaemoglobin. The cyanomethaemoglobin
formed was measured spectrophotometrically at 540 mm. The calibration curve was
prepared using the Human Haemoglobin standard provided with the aculute reagent. The
haemoglobin content is expressed as g % (or gm/dl).
Haematocrit values (or packed cell volume - Ht %) was measured by applying the
method of Mc1eay and Gordan (1977). Blood was drawn into heparinised
micro haematocrit tube ( 0.55 ± 0.05 mm diameter). One end of the tube was sealed and
centrifuged in micro haematocrit centrifuge at I 1500 rpm for 5 minutes. Haematocrit value
was estimated after measuring the red cell column using a haematocrit counter provided
along with the microhaematocrit centrifuge, and expressed as the percentage of whole
blood.
From the values of Hb content (Hb %), haematocrit (Ht %) and total erythrocyte
count (millions/mm') the following erythrocyte constants were calculated using the
respective fomlUla (Lamberg and Rothstein, 1978). a. Mean corpuscular volume (MCV) :
MCV represents the average volume of individual erythrocyte in cubic microns (.IJ"5) and
computed by the formula,
35
MCV= Ht% x 10 RBC (in millions/mm3
)
b. Mean Corpuscular Haemoglobin (MCH) : MCH represents the average weight of
haemoglobin in individual erythrocyte in picograms (pg) and calculated by the formula,
MCH= Hb% x 10 RBC (in millions/mm3
)
3.2.2. Field experiments
Preparation of the ponds for experiment
Ponds for the present study were prepared by erecting earthen bunds across the
canals in the coconut grove and placing wooden sluice gates of O. 5 m width for regulation
of tidal flow. Ten ponds prepared on similar lines were used for experimentation. The area
ofthe ponds ranged from 229-447m2 having an average depth range ofOAlm - O.S2m with
salinity ranging from 15.81 %0 - 18.07 %0
On the previous day of the experiment, water in the ponds was let out to the
maximum possible extent during the low tide and the sluice gates were sealed with hard clay
and the volume of water in each pond was calculated by multiplying the area of pond by
average depth, for the purpose of quantifying the piscicides.
Close-meshed nylon net enclosures (hapa) were erected within the ponds for
introducing the finfish and prawn species to study their toxic responses during the
experiment. Specimens of the clam species, Vcyprinoides were maintained buried at the
bottom in perforated plastic bins with lid, filled with pond soil.
Preparation and apl)lication of the piscicides
The piscicides quantified on the basis of the volume of water in the experimental
ponds were taken in separate containers on the previous day of the experiment and kept
36
k4c<~w:...-",-,L c:Ju< IAI1J c-'f'f>tol'1 !>'"~ fey b hOuY5.
soaked in water- for 12 hoursLThe pre-soaked mahua oil cake was used as such for the /1..
experiment, whereas the pre-soaked croton seed was ground well in a wet grinder and the
aqueous suspension used for application.
Mahua oil cake was broadcast all over the water surface. The aqueous suspension
of the croton seed was diluted with pond water and sprinkled uniformly throughout the
pond surface. After application of the piscicides, the pond water was mixed thoroughly by
dragging a nylon net all along the water area.
3.2.2.1. Determination of the minimum concentration of the piscicides elTective for the
absolute mortality of weed fishes
In order to determine the minimum concentration of the piscicides effective in
destroying the weed fishes completely, graded concentrations of the piscicides, namely 150,
200, 250 and 300 ppm in the case of mahua oil cake and 2,3,4 and 5 ppm in the case of
croton seed were applied in different ponds and the toxic responses of the test organisms
were examined. Among the different concentrations tested, the minimum concentration of
the piscicides capable of killing all the fishes tested was selected as the optimum one for
application in the prawn culture fields.
3.2.2.2. Progressive degradation of the piscicides and restoration of the normal
conditiol1s in the·field culture system.
In order to evaluate the persistence of toxicity of the piscicides in the ponds, test
fishes were introduced every 24 hours, into nylon hapas erected in the experimental ponds
treated with different concentrations of the piscicides till the water ceased to be lethal to
the fish life. Postlarvae of ~. indicus were also introduced into the medium every 24 hours
37
to study their toxic response and survival rate till the water was ascertained to be ready for
stocking with prawn seeds for culture.
Hydrographic parameters of the ponds treated with different concentrations of the
piscicides were studied daily for a period of ten days from the time of application to assess
their fluctuation and final restoration to the normal condition. Temperature of water was
measured using a 0 - 50° C mercury thermometer. pH was determined using a digital pH
meter. Mohr - titration method (Strickland & Parsons, 19"17) was adopted for determining
the salinity of water, using the formula,
Salinity of water sample (0 I 00) = ~~ x S
where, VI = Volume of Silver nitrate required for 10 ml ofStandrad Sea Water
V 2 = Volume of Silver nitrate required for 10 ml of water sample
S = Salinity of Standard Sea Water.
Dissolved oxygen content was estimated by Winkler method (Strickland & parsons, 1917)
3.2.2.3. Effects of the piscicides on the zooplankton and benthos
Samples of zooplankton and macrobenthos were taken from the experimental ponds
treated with the two piscicides at intervals 0,24,120 and 240 hours.
Zooplankton samples were collected using a 0 75m long conical plankton net with a
25 cm square mouth. The anterior 10 cm portion of the net was formed of canvas followed
by a 50 cm long organdy cloth of mesh size, 0.3 nun The cod end of the net was stitched to
38
a polythene bucket with a lid functioning as a filter made of organdy cloth of 0.3 mm
mesh size, stitched to the bucket with the help of a canvas portion of 5 cm length (Menon
et a!., 1977)
The net was hauled manually from the shore of the pond for 5 minutes covering a
distance of 20 meters. The samples collected in the bucket portion were transferred into a
container by removing the lid, followed by repeated washing. The quantity of water filtered
was determined by multiplying the mouth area of the net by the distance covered; ie., 0.625
m2 X 20 cm. The samples were preserved in 5% formalin and stored in plankton bottles for
later analysis. The organisms were identified upto group level and quantified in terms of
numbers per cubic metre.
Collection of macrobenthos was made using a Van Veen Grab of 20 X 20cm size.
Fauna retained by a sieve of 0.5 mm mesh size were preserved in 5% formalin containing
Rosebengal and were subjected to qualitative and quantitative analysis. Organisms were
identified upto group level. Quantification was made in terms of the numbers and wet
weight of each group per 012 of pond area.
3.2.2.4. Experimental culture of prawn in ponds treated with the optimum
concentration of the piscicides.
Culture of the penaeid prawn Penaeus indicus in ponds treated with the optimum
concentration of 200ppm and 4ppm in the case of mahua oil cake and croton seed
respectively was carried out for a period of 3 months in duplicates.
The ponds were stocked with early juveniles of e.. jndi~us collected from the wild,
39
on the fifth day of the treatment with the piscicides after ascertaining that the water
characteristics had returned to the normal condition and that no more weed fishe were
present in the treated ponds.
Studies on the water and soil characteristics were made at fortnightly intervals
starting from the date of application of the piscicides. Water characteristics such as depth,
temperature, salinity, pH, dissolved oxygen, nutrients and primary production and soil
characteristics such as organic carbon, phosphate, potassium and pH were also studied at
fortnightly intervals. Correspondingly, zooplankton and macrobenthos samples were also
taken for study. Samples of prawn were col1ected at the same intervals for analysing their
growth in length and weight. Specimens were released back into the pond after taking the
measurements. Determinations of temperature, salinity, pH and dissolved oxygen were
done following standard methods as described catlier.
Among water nutrients, Nitrite-Nitrogen (No2-N) was determined by the
Azo-dye method (Bendschneider and Robinson, 1952), Nitrate- Nitrogen (N03-N)
by the method of Morris and Riley as described by Strickland and Parsons (1977),
inorganic phosphorus by the method given by Murphy and Riley (1962) and
Ammonia - Nitrogen (NH3-N) by the phenol - hypochlorite method ( Solarzano,
1969). The light and dark bottle technique given by Gaarder and Gran (1927) was
used for the estimation of primary production. Water samples collected in light and
dark bottles were incubated for 3 hours from )) am to 2.. pm. Assuming that
photosynthesis takes place for 1 0 hours during a day, primary production was
calculated using the formula:
Primary production (mg Cl m~1 day) '7C
O2 (1ll1) x 0536 )( 1000 PQ y T
where PQ (Photosynthetic Quotient) is taken as 1.25.1', the number of hours of incubation.
40
4 RESULTS
4.1. LABORATORY EXPERIMENTS
Standardisation of the method of preparation of mahua
oil cake and croton seed for application in water, evaluation of
their effect on the hydrography and selected brackishwater
organisms including haematological effects, and the pattern of
their progressive degradation and persistence of toxicity in the
test media were among the laboratory experiments carried out
during the present study. The results obtained are presented in
Tables, 1 - 9 and Figures, 1 - 6.
4.1.1. Standardisation of the method of preparation of the
piscicldes for application.
While standardising the method of preparation of mahua
oil cake for application, it was observed that pre-soaking of the
material in water prior to application was beneficial (Table la &
Fig. la-e). The eftpct of thp durntion (hours, of pre-soaking on
the toxic potency of the cake was tested by exposing Tilapia
mossambica to the media containing 200 ppm of the piscicide pre
soaked for different durations.
As is evident from the Table la & Figs. la-e, no
mortality occurred within 30 miniutes among different
preparations of the cake pre-soaked for varying duration of time
ranging from 6 to 48 hours. After 60 minutes, varying
percentages of mortality were observed among individuals of the
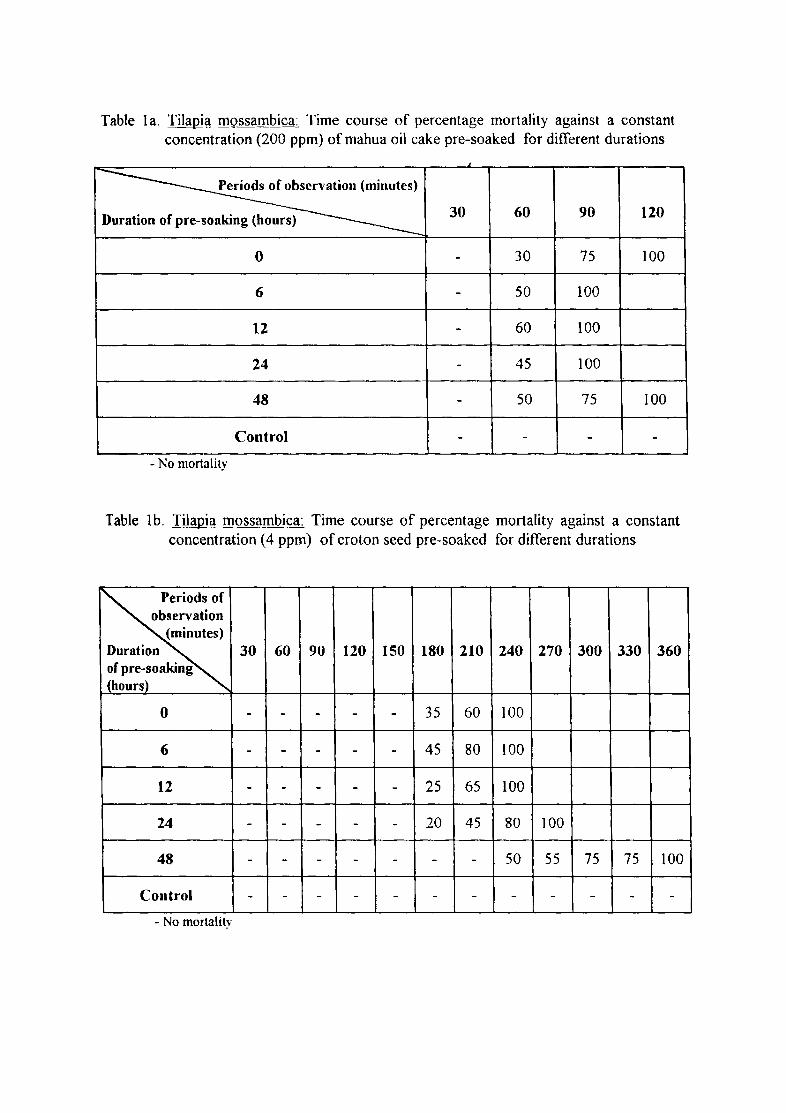
Table 1 a. Tilapi~ mossambica~ Time course of percentage mortality against a constant concentration (200 ppm) of mahua oil cake pre-soaked for different durations
~ Duration of pre-soaking (hours) 30 60 90 120
0 - 30 75 100
6 - 50 100
12 - 60 100
24 - 45 100
48 - 50 75 100
Control - - - -
- No mortality
Table 1 b. Tilapia mossambica: Time course of percentage mortality against a constant concentration (4 ppm) of croton seed pre-soaked for different durations
Periods of observation
(minutes) Duration 30 60 90 120 150 180 210 240 270 300 330 360 of pre-soaking (hours)
0 - - - - - 35 60 100
6 - - - - - 45 80 100
12 - - - - - 25 65 100
24 - - - - - 20 45 80 100
48 - - - - - - - 50 55 75 75 100
Control - - - - - - - - - - - -
- No mortahty
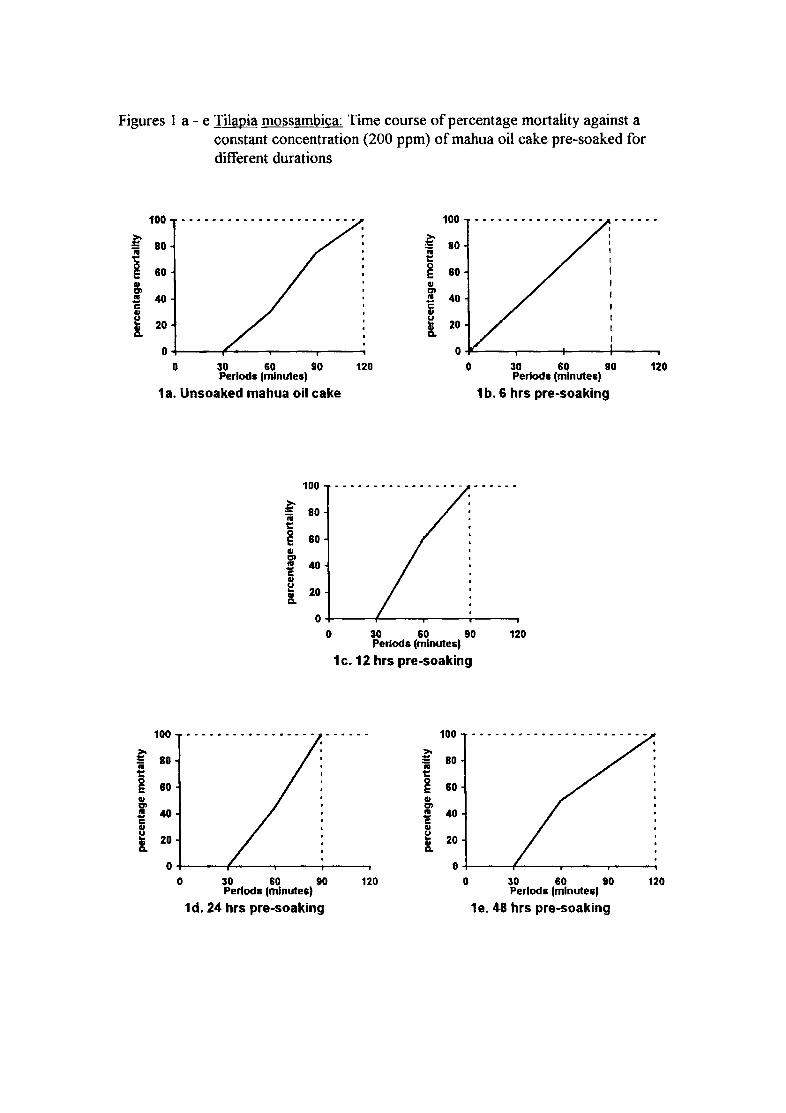
Figures 1 a - e Tilapia mossambica: Time course of percentage mortality against a constant concentration (200 ppm) of mahua oil cake pre-soaked for different durations
100 •••••••••••••••••.••• - • 100
~ 80
~ C 80
~ 80 ii 1::
~ 60 8, III
01
~ 40 ... 40 -t: l 20 III U .. 20 8.
O+-----~----~----r_--~
~ ii
I Cl 01 1'1 ~ III ~ 8.
o 30 60 90 120 Periods Imlnutes)
30 60 90 Penoda (minutes)
1 a. Unsoaked mahua oil cake 1 b. 6 hrs pre-soaking
100
80
80
40
20
0 0 30 60
100
~ 80 ~ ~ 60 III f 40
8. 20
O+-----+-----~----r_---,
o 30 60 90 120 Periods (minutes)
1c.12 hrs pre-soaking
100 :0-= 80 ii 1::
~ 80 III 01 ... 40 -t: III ~ 20 X.
0 90 120 0 30 60
Periods (minutes, Periods (minutes) 90
1d. 24 hrs pre-soaking 1e. 48 hrs pre-soaking
120
120
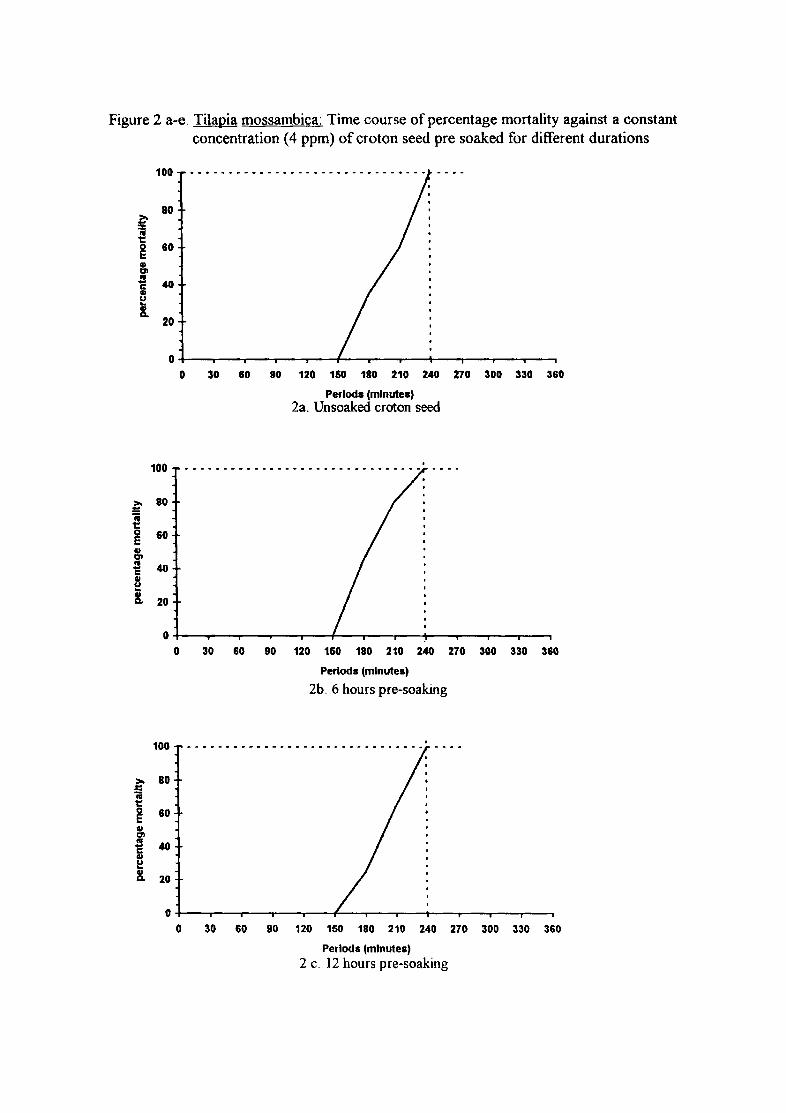
Figure 2 a-e. Tilapia mossambica: Time course of percentage mortality against a constant concentration (4 ppm) of croton seed pre soaked for different durations
100 • • • . • • • • • • . • • • • • • • • • • • • • . • • • . •• • •• -
80
~ t a 60 .. 1:11
" - 40 c: G/ U .. !.
20
O+-----~----~----.-----r_----~ ____ ~ ____ ~_;----~----~----~----_, o 30 60 90 120 150 180 210 240 270 300 330 360
Periods (minutes) 2a. Un soaked croton seed
100
~ 80
~ ~ 60 11 Cl
~ 40
~ !. 20
o 30 60 90 120 160 180 210 240 270 300 330 360
Periods (minutes)
2b. 6 hours pre-soaking
100 - ••• - •••••• - •••••• - •••••• - ••• - -
O+-----~--r---r_--~ ____ ~~~_,--_;--~----~--~----_, o 30 60 90 120 150 180 210 240 270 300 330 360
Periods (minutes)
2 c. 12 hours pre-soaking
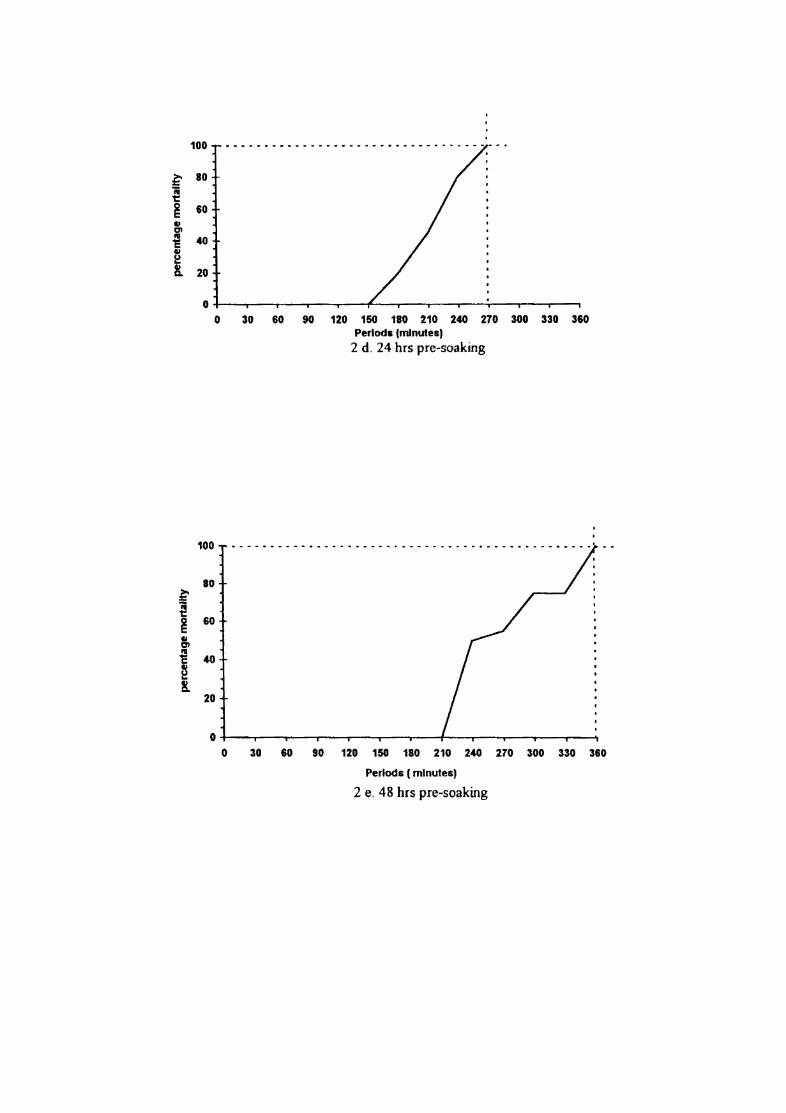
100 •••.••••• - - • - - •••• - ••••• - •• - - ..•• - •••
~ 80
~ ~ 60 11 Cl
~ 40 11 ~ 8. 20
O+---~--~--~--~--~--~--~--r-~r---~~~~
o 30 60 90 120 150 180 210 240 270 300 330 360 Periods (minutes)
2 d. 24 hrs prc-soaking
100
80 ~ ii 1::
~ 60
11 Cl III
C 40
~ X-
20
o 30 60 90 120 150 180 210 240 270 300 330 360
Periods ( minutes)
2 e. 48 hrs pre-soaking
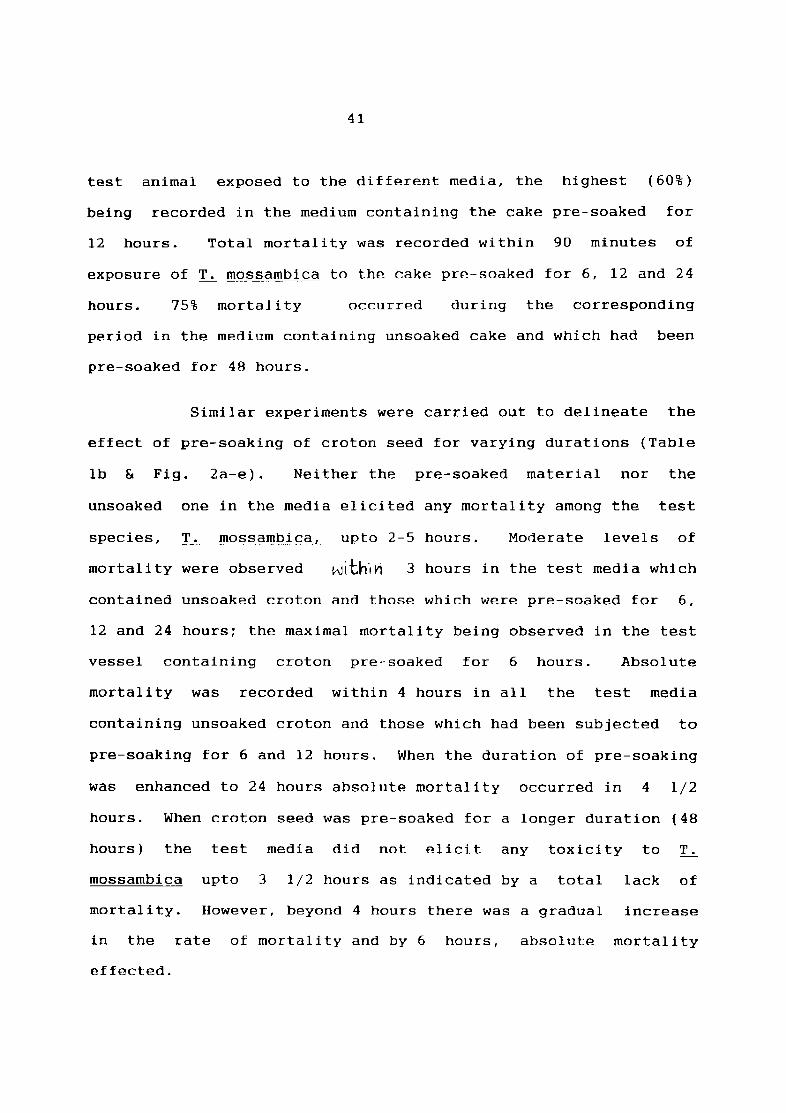
41
test animal exposed to the different media, the highest (60%)
being recorded in the medium containing the cake pre-soaked for
12 hours. Total mortality was recorded within 90 minutes of
exposure of ~ mossam})ica to the cake pre-soaked for 6, 12 and 24
hours. 75% mortality occurred during the corresponding
period in the medium containing unsoaked cake and which had been
pre-soaked for 48 hours.
Similar experiments were carried out to delineate the
effect of pre-soaking of croton seed for varying durations (Table
Ib & Fig. 2a-e). Neither the pre-soaked material nor the
unsoaked one in the media elicited any mortality among the test
species, T. !!tQ$_$.Cll!1p.i~al upto 2-5 hours. Moderate levels of
mortality were observed with~n 3 hours in the test media which
contained unsoaked croton and those which were pre-soaked for 6,
12 and 24 hours; the maximal mortality being observed in the test
vessel containing croton pre-soaked for 6 hours. Absolute
mortality was recorded within 4 hours in all the test media
containing unsoaked croton and those which had been subjected to
pre-soaking for 6 and 12 hours. When the duration of pre-soaking
was enhanced to 24 hours absolute mortality occurred in 4 1/2
hours. When croton seed was pre-soaked for a longer duration (48
hours) the test media did not elicit any toxicity to T.
mossambica upto 3 1/2 hours as indicated by a total lack of
mortality. However, beyond 4 hours there was a gradual increase
in the rate of mortality and by 6 hours, absolute mortality
effected.
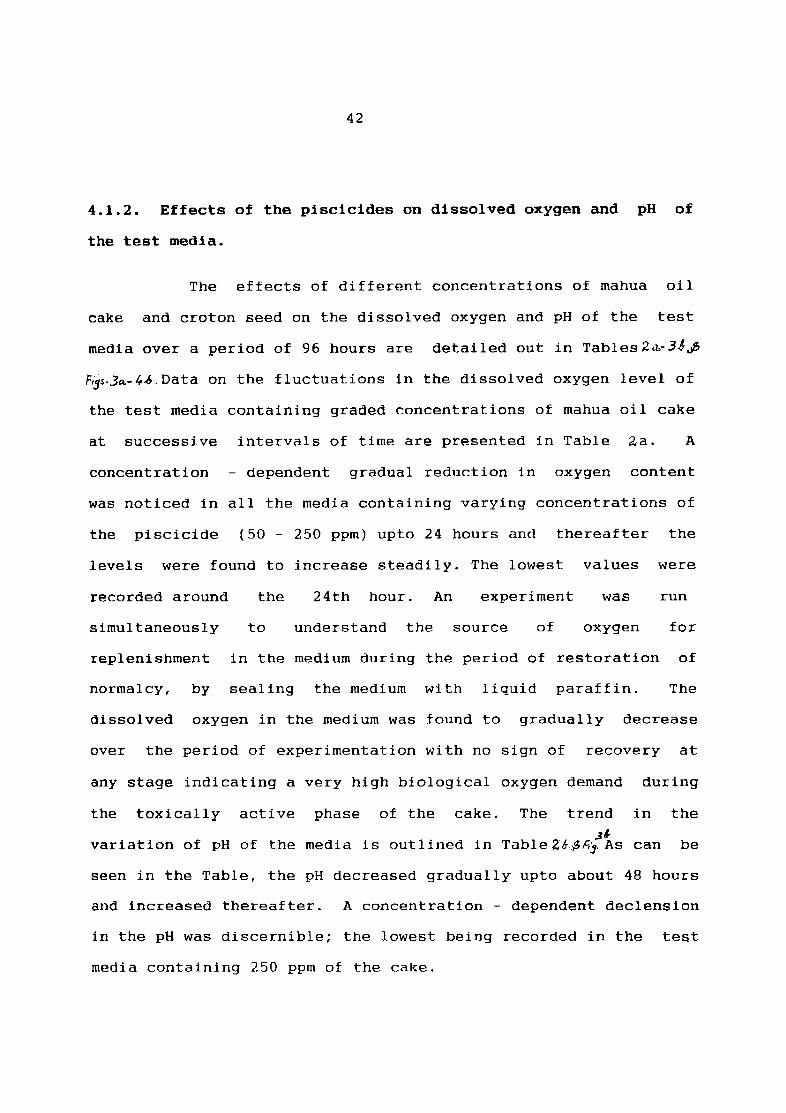
42
4.1.2. Effects of the piscicides on dissolved oxygen and pH of
the test media.
The effects of different concentrations of mahua oil
cake and croton seed on the dissolved oxygen and pH of the test
media over a period of 96 hours are detailed out in Tables2~3J~
F,j.s.3a.- 4..6. Data on the fluctuations in the dissolved oxygen level of
the test media containing graded concentrations of mahua oil cake
at successive intervals of time are presented in Table ~a. A
concentration - dependent gradual reduction in oxygen content
was noticed in all the media containing varying concentrations of
the piscicide (50 - 250 ppm) upto 24 hours and thereafter the
levels were found to increase steadily. The lowest values were
recorded around the 24th hour. An experiment was run
simultaneously to understand the source of oxygen for
replenishment in the medium during the period of restoration of
normalcy, by sealing the medium with liquid paraffin. The
dissolved oxygen in the medium was found to gradually decrease
over the period of experimentation with no sign of recovery at
any stage indicating a very high biological oxygen demand during
the toxically active phase of the cake. The trend in the .31-
variation of pH of the media is outlined in Table 2,6~t:,j. As can be
seen in the Table, the pH decreased gradually upto about 48 hours
and increased thereafter. A concentration - dependent declension
in the pH was discernible; the lowest being recorded in the test
media containing 250 ppm of the cake.
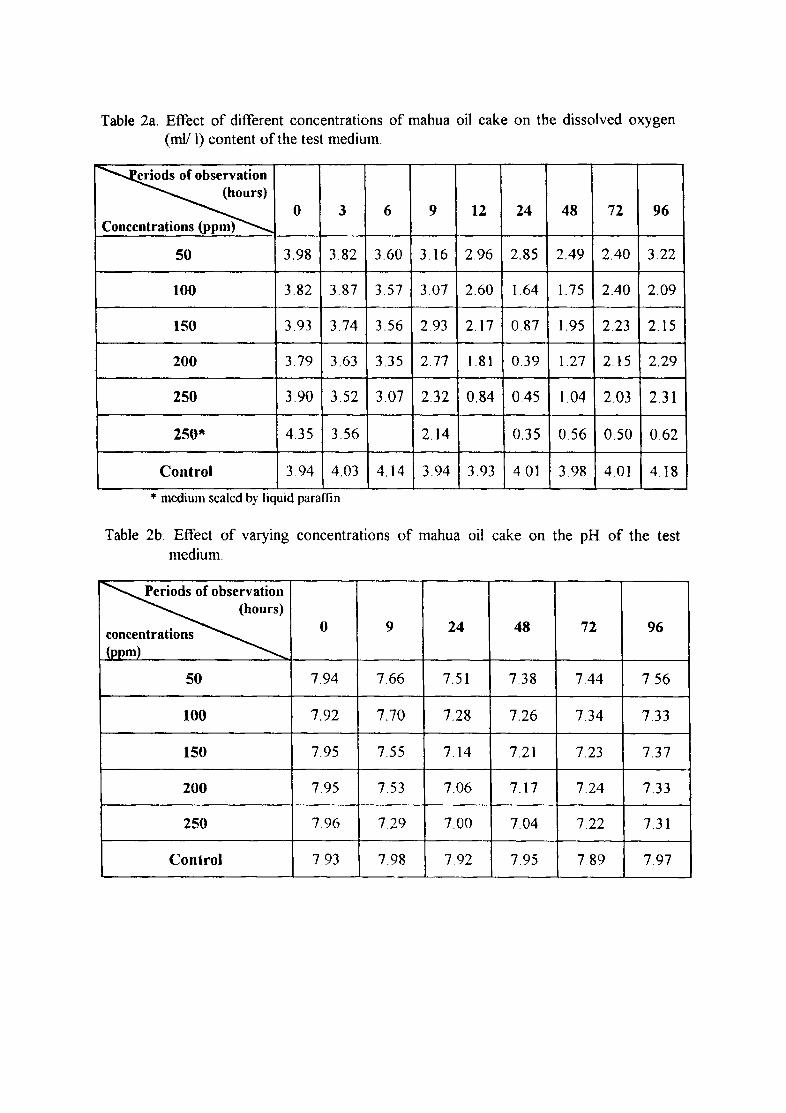
Table 2a. Effect of different concentrations of mahua oil cake on the dissolved oxygen (ml/ 1) content of the test medium.
~ (hours) 0 3 6 9 12 24 48 72 96
Concentrations (ppm)
50 3.98 3.82 3.60 3.16 2.96 2.85 2.49 2.40 3.22
100 3.82 3.87 3.57 3.07 2.60 1.64 1.75 2.40 2.09
150 3.93 3.74 3.56 2.93 2.17 0.87 1.95 2.23 2.15
200 3.79 3.63 3.35 2.77 1.81 0.39 1.27 2.15 2.29
250 3.90 3.52 3.07 2.32 0.84 0.45 1.04 2.03 2.31
250* 4.35 3.56 2.14 0.35 0.56 0.50 0.62
Control 3.94 4.03 4.14 3.94 3.93 4.01 3.98 4.01 4.18
• medIUm scaled by liquid paraffin
Table 2b. Effect of varying concentrations of mahua oil cake on the pH of the test medium.
~ (hours)
concentrations 0 9 24 48 72 96
(ppm)
50 7.94 7.66 7.51 7.38 7.44 7.56
100 7.92 7.70 7.28 7.26 7.34 7.33
150 7.95 7.55 7.14 7.21 7.23 7.37
200 7.95 7.53 7.06 7.17 7.24 7.33
250 7.96 7.29 7.00 7.04 7.22 7.31
Control 7.93 7.98 7.92 7.95 789 7.97
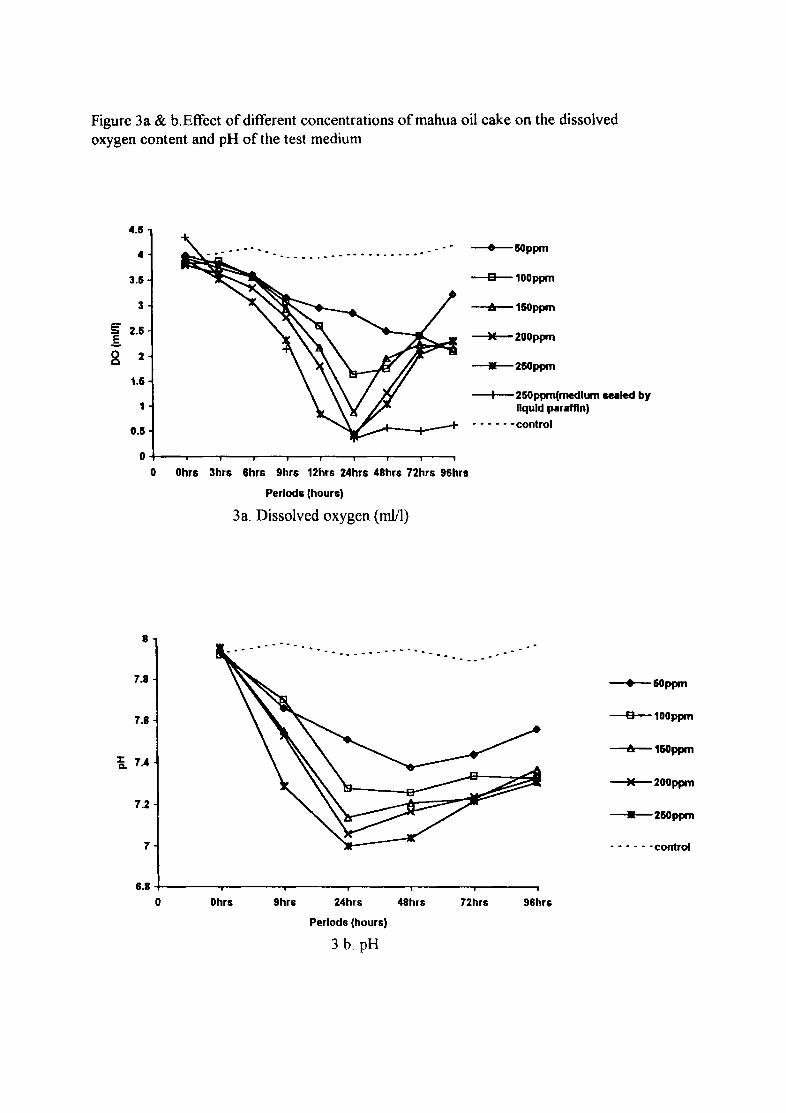
Figure 3a & b.Effect of different concentrations of mahua oil cake on the dissolved oxygen content and pH of the test medium
4.6
4
3.6
3
S ..s 2.5
g 2
1.6
1
0.5
0
8
7.'
7.8
:t: 7.4 11-
7.2
0
_ .. 4 .......
............. - .. --- ..... -_ ...
Ohr. 3hr. 6hrs 9hrs 12hrs 24hrs Uhr. 72hrs 96hra
Periods (hours)
3a. Dissolved oxygen (mUl)
-"'-50ppm
D 100ppm
6 150ppm
M 200ppm
• 250ppm
--+--250ppm(medlum sealed by liquid paraffin)
••••• ·control
• D
6
M
•
60ppm
100ppm
160ppm
200ppm
260ppm
7 - •• - - -control
6.8
0 Dhrs 9hrs 24hrs
Periods (hours)
3 b. pH
4.hrs 72hrs 96hrs
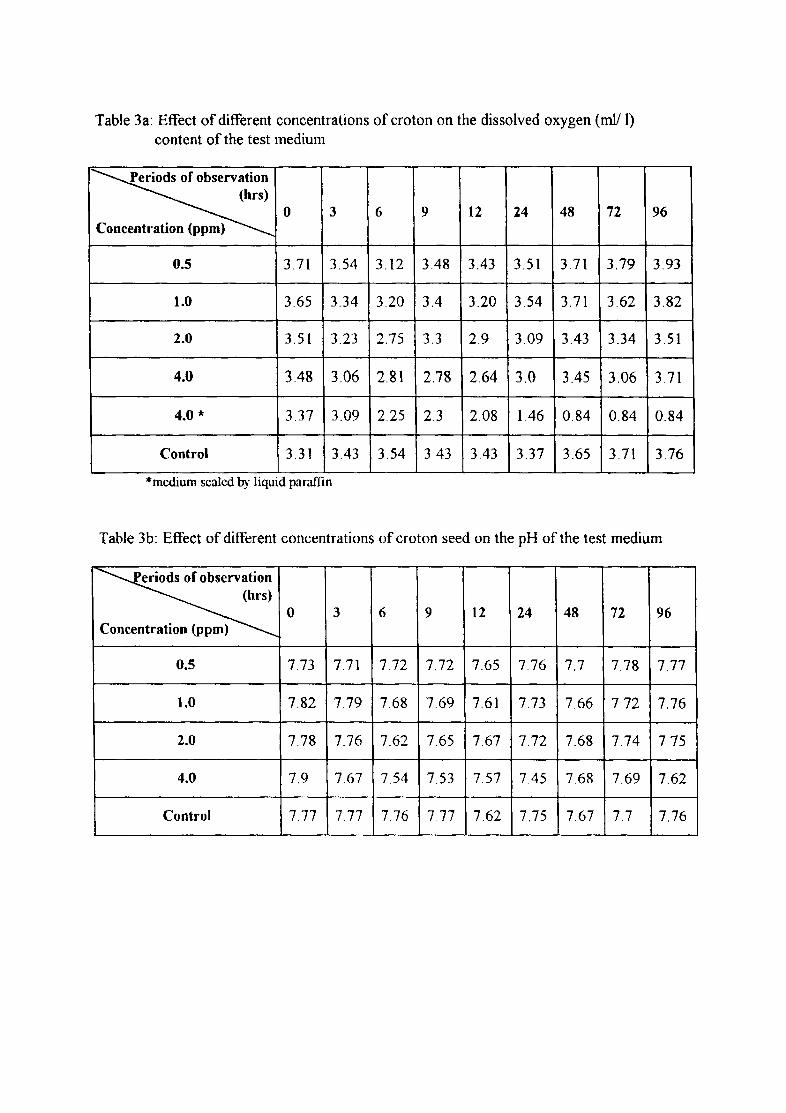
Table 3a: Effect of different concentrations of croton on the dissolved oxygen (ml/ I) content of the test medium
~ (hrs) 0 3 6 9 12 24 48 72
Concentration (ppm)
0.5 3.71 3.54 3.12 3.48 3.43 3.51 3.71 3.79
1.0 3.65 3.34 3.20 3.4 3.20 3.54 3.71 3.62
2.0 3.51 3.23 2.75 3.3 2.9 3.09 3.43 3.34
4.0 3.48 3.06 2.81 2.78 2.64 3.0 3.45 3.06
4.0 '" 3.37 3.09 2.25 2.3 2.08 1.46 0.84 0.84
Control 3.31 3.43 3.54 3.43 3.43 3.37 3.65 3.71
*mcdium scaled by liquid paraffin
96
3.93
3.82
3.51
3.71
0.84
3.76
Table 3b: Effect of different concentrations of croton seed on the pH of the test medium
~ (hrs) 0 3 6 9 12 24 48 72 96
Concentration (ppm)
0.5 7.73 7.71 7.72 7.72 7.65 7.76 7.7 7.78 7.77
1.0 7.82 7.79 7.68 7.69 7.61 7.73 7.66 7.72 7.76
2.0 7.78 7.76 7.62 7.65 7.67 7.72 7.68 7.74 7.75
4.0 7.9 7.67 7.54 7.53 7.57 7.45 7.68 7.69 7.62
Control 7.77 7.77 7.76 7.77 7.62 7.75 7.67 7.7 7.76
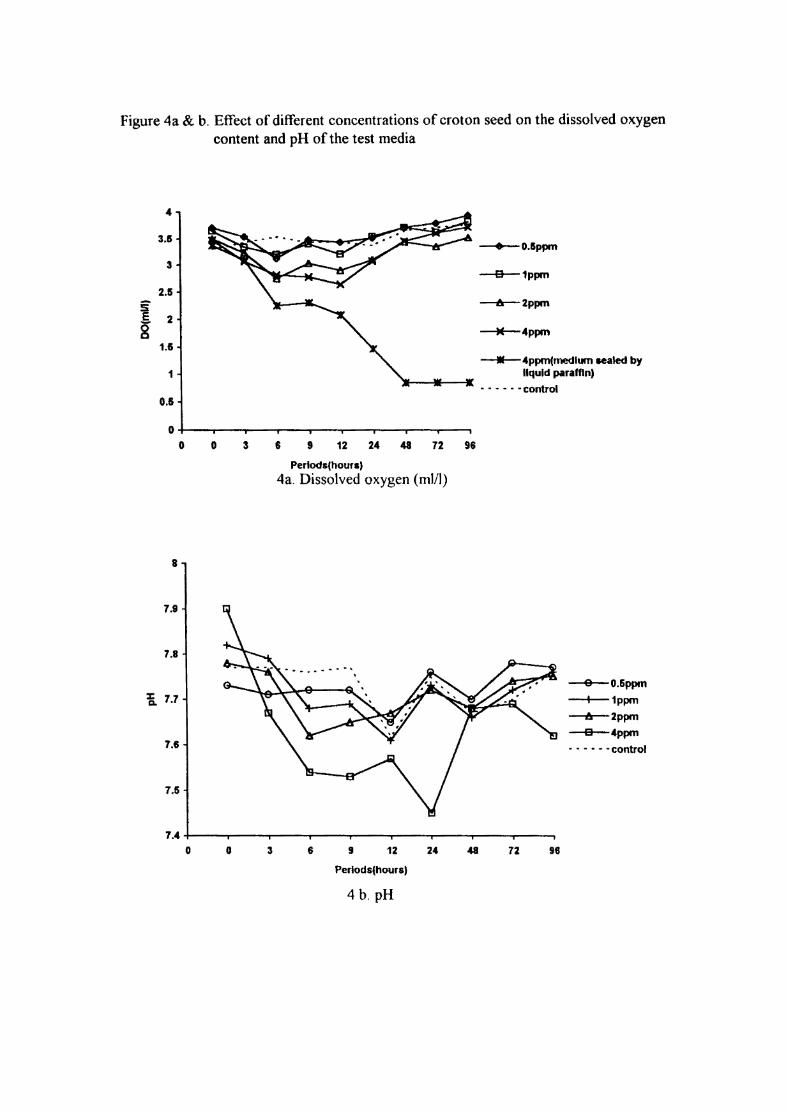
Figure 4a & b. Effect of different concentrations of croton seed on the dissolved oxygen content and pH of the test media
" 3.5
3
2.5
S E 2
8 1.1
1
0.5
0
0 0 3
8
7.9
7.8
i. 7.7
7.6
7.5
6 9 12 24 48 72
Perlodslhours)
4a. Dissolved oxygen (mill)
96
~O.5ppm
~1ppm
--6-2ppm
---M--4ppm
__._"ppmlmedlum aealed by liquid paraffin)
- - - - - -control
~O.5ppm
~1ppm
--6-2ppm
~4ppm
- . - - - -control
7.4 +----r--....,.....-~r--.......---r_-_r_--r_-__._-____, o o 3 6 9 12 24 48 72 96
Period si hours)
4 b. pH
43
Table 30.. ~ Fi.J. ~o. out lines the effects of varying
concentrations of L
aq~ous suspension of croton seed on the
dissolved oxygen content of the test media over a period of 96
hours. In general, the trend in variation of the oxygen content
of the media containing different concentrations of the toxicant
was of a dual nature. The minimal oxygen content of the test
medium containing 0.5 ppm of the piscicide was 3.12 mIll during
the 6th hour. The same was true in the case of the medium with 1
ppm also. In both the cases the level of dissolved oxygen
indicated a gradual fall during the early phases of sampling, to
increase towards the end of the period of experimentation. A
more or less similar trend was obtained in the case of 2 ppm
croton - containing test media. The variation was more clear cut
when 4 ppm croton was added to the ambient water; the lowest
concentration, however, being recorded during the 12th hour of
sampling.Sealing of the test media with liquid paraffin was
found to decrease dissolved oxygen concentration very sharply,
registering a minimal value of 0.84 mIll at 48 hours. The level
of oxygen content in the control registered only marginal
variation when compared to that of the toxicant containing
test media. Further, the oxygen concentration in the control
never decreased below the values recorded during zero hour.
The influence of different concentrations of croton on
the pH of the test media is outlined in Table 3b & Fig. 4b. The
pH of the medium containing 0.5 ppm of the toxicant was more or
less similar at successive samplings over the 96 hour
44
experimental period. The same was true when the concentration of
croton was increased to 1 and 2 ppm. In the test media
containing 4 ppm croton, a slight reduction in pH was observed
during the first quarter; registering a minimal value of 7.45.
The pH was found to increase gradually thereafter. Statistical
analysis revealed significant (p<O.Ol) difference in dissolved
oxygen among different concentrations and control and no
significant difference at 5% level among different periods of
observation.
significant
periods of
The pH also showed significant variation (p<O.Ol)
variation between different concentrations and
observation.
4.1.3. Toxic response of different test organisms to the
piscicides.
4.1.3.1. Finfish
The toxic response of selected weed fishes commonly
inhabiting prawn culture fields was tested by exposing them to a
constant concentration (200 ppm) of mahua oil cake (Table 4a).
Among the different species tested, Ambassis ~mnocephal~,
Megalops
the most
minutes
cyprinoides, Elops saurus and Glossogobius giurus were
sensitive registering absolute mortality within 30
of exposure. Macropodus cuppanus, Etroplus maculatus,
Gambusia affinis and Aplochilus lineatus were moderately tolerant
requiring about an hour before succumbing to the toxicant. Among
the various fish species tested, 9~hichthys microcephalus, ~
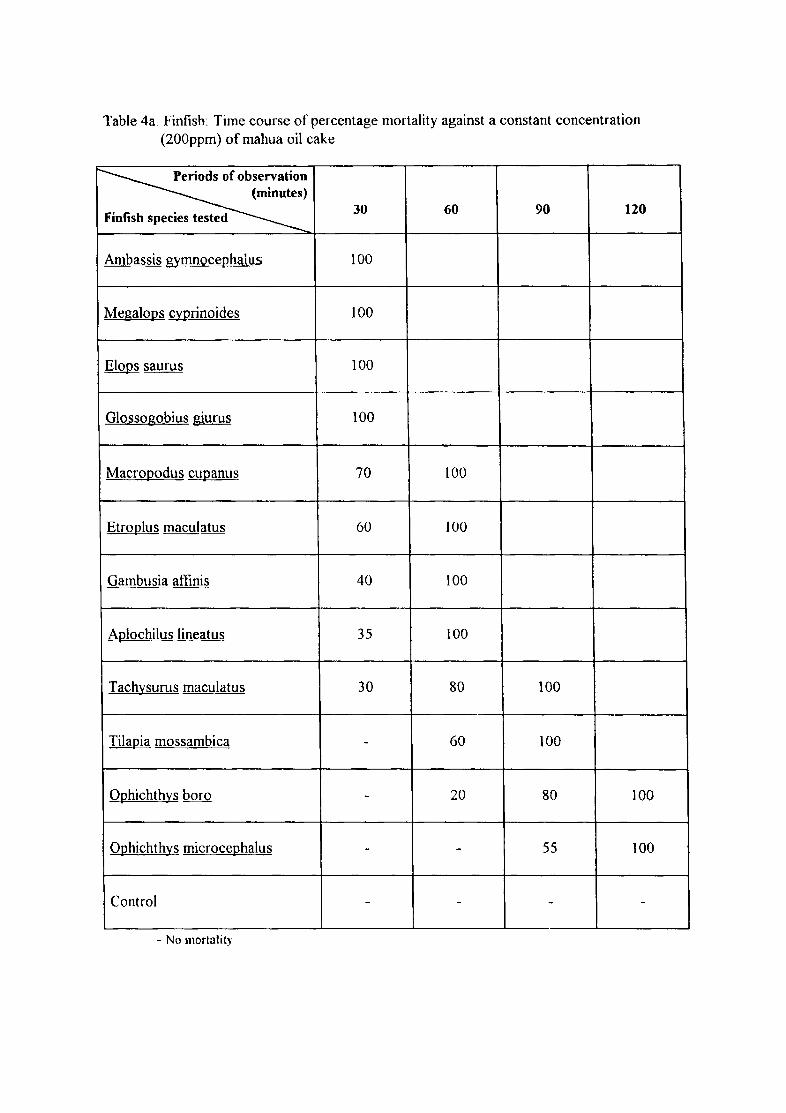
Table 4a. Finfish: Time course of percentage mortality against a constant concentration (200ppm) ofmahua oil cake
~ (minutes)
Finfish species tested 30 60 90 120
Ambassis gymnoceghalU5 100
MegaloI1s wrinoides 100
Elops saurus 100
Glossogobius giurus 100
Macropodus cUQanus 70 100
Etro(1lus maculatus 60 100
Gambusia afIinis 40 100
AQlochilus lineatus 35 100
Tachysurus maculatus 30 80 100
TilaQia mossambica - 60 100
OQhichthys boro - 20 80 100
OQhichthys microceQhalus - - SS 100
Control - - - -
- No mortality
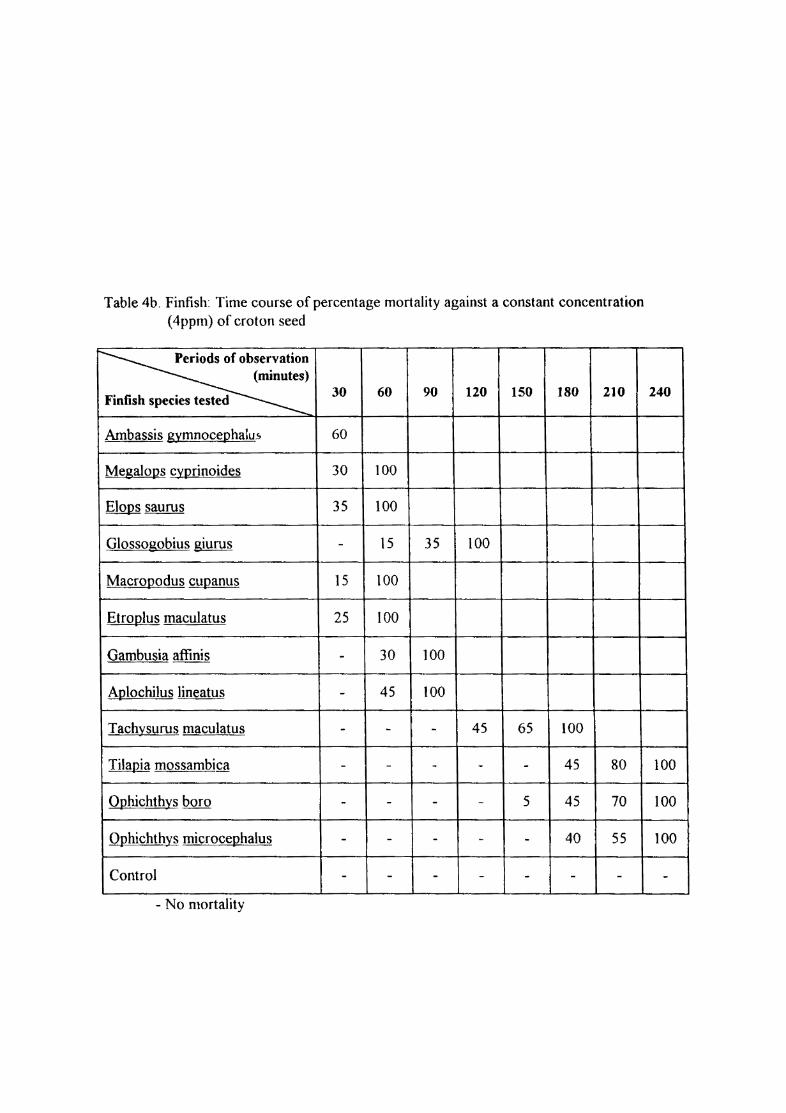
Table 4b. Finfish: Time course of percentage mortality against a constant concentration (4ppm) of croton seed
~ (minutes)
Finfish species tested 30 60 90 120 150 180 210
Ambassis gymnocephalu.s 60
Megalops cyprinoides 30 100
Elops saurus 35 100
Glossogobius giurus - 15 35 100
Macropodus cupanus 15 100
Etroplus maculatus 25 100
Gambusia affinis - 30 100
Aplochilus lineatus - 45 100
Tachysurus maculatus - - - 45 65 100
TilaJ2ill mossambiyJ! - - - - - 45 80
Ophichthys boro - - - - 5 45 70
Ophichthys microcephalus - - - - - 40 55
Control - - - - - - -- No mortality
240
100
100
lOO
-
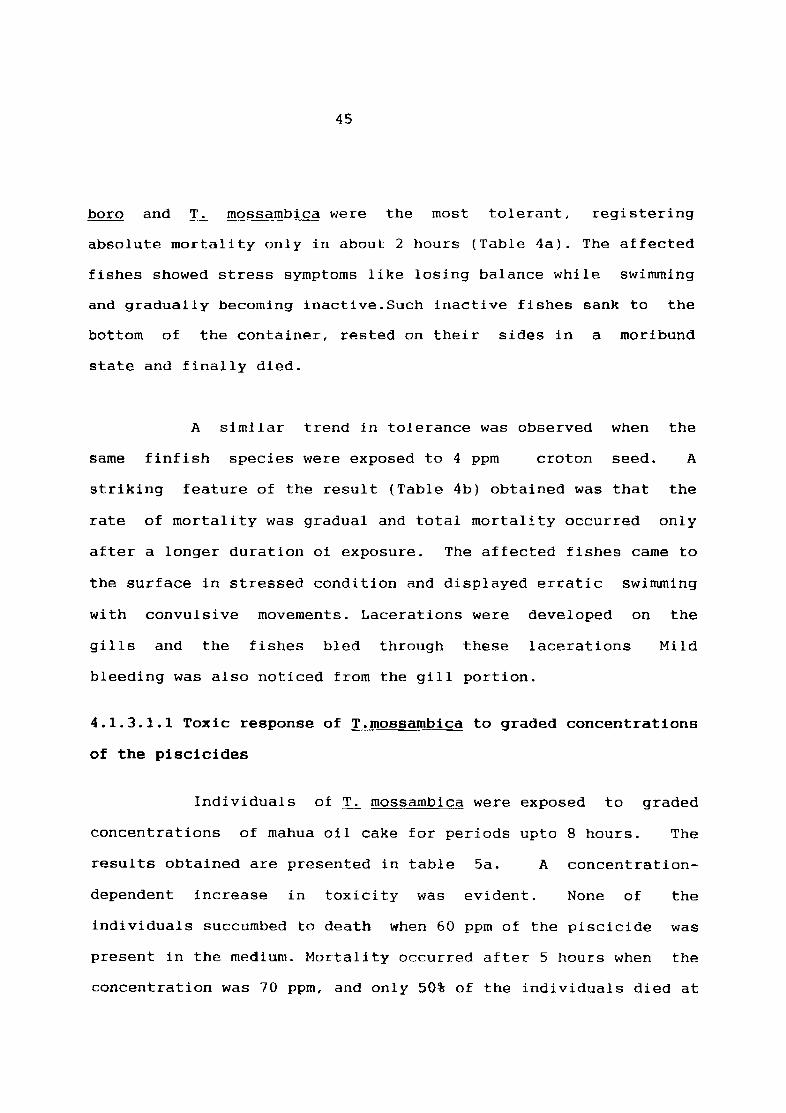
45
boro and T. mossambica were the most tolerant, registering
absolute mortality only in about 2 hours (Table 4a). The affected
fishes showed stress symptoms like losing balance while swimming
and gradually becoming inactive.Such inactive fishes sank to the
bottom of the container, rested on their sides in a moribund
state and finally died.
A similar trend in tolerance was observed when the
same finfish species were exposed to 4 ppm croton seed. A
striking feature of the result (Table 4b) obtained was that the
rate of mortality was gradual and total mortality occurred only
after a longer duration of exposure. The affected fishes came to
the surface in stressed condition and displayed erratic
with convulsive movements. Lacerations were developed
swimming
on
gills and the fishes bled through these lacerations
the
Mild
bleeding was also noticed from the gill portion.
4.1.3.1.1 Toxic response of T.mossambica to graded concentrations
of the piscicides
Individuals of ~ mossambica were exposed to graded
concentrations of mahua oil cake for periods upto 8 hours. The
results obtained are presented in table 5a. A concentration
dependent increase in toxicity was evident. None of the
individuals succumbed to death when 60 ppm of the piscicide was
present in the medium. Mortality occurred after 5 hours when the
concentration was 70 ppm, and only 50% of the individuals died at
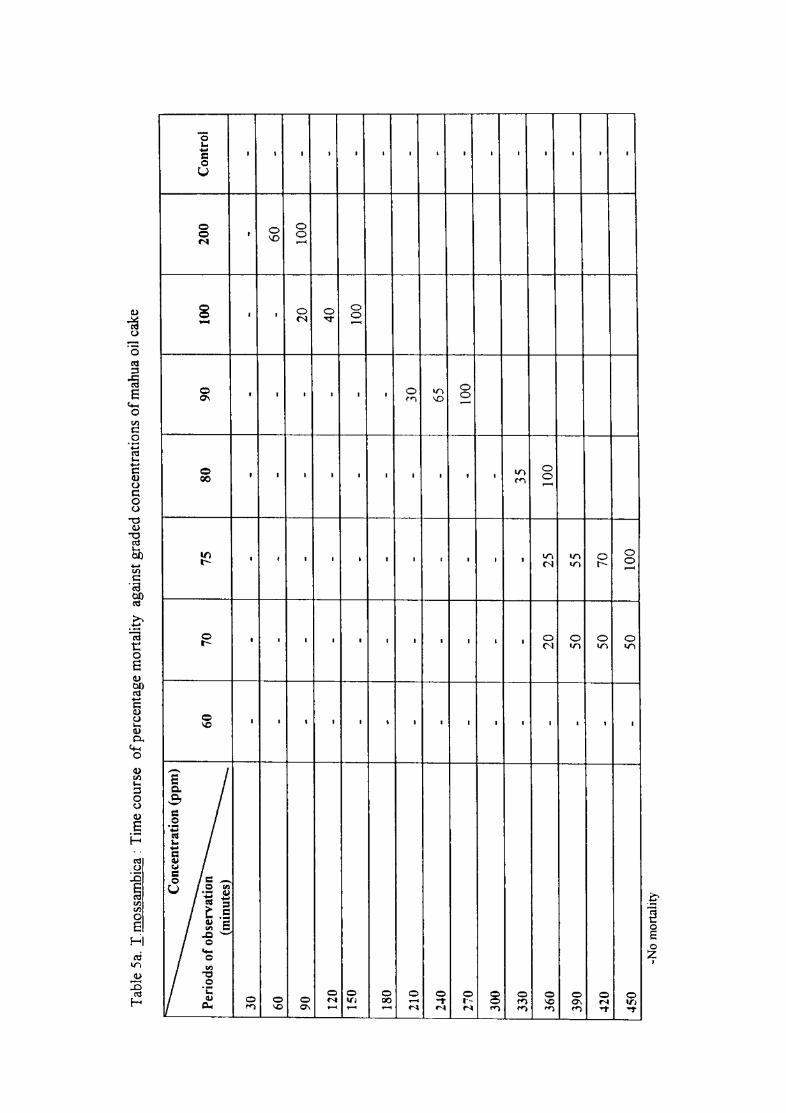
Tab
le 5
a. T
mos
sam
bica
: T
ime
cour
se o
f per
cent
age
mor
talit
y ag
ains
t gra
ded
conc
entr
atio
ns o
fmah
ua o
il ca
ke
~
Per
iods
of
obse
rvat
ion
60
70
75
80
90
100
200
Con
trol
(m
inut
es)
30
--
--
--
--
60
--
--
--
60
-90
-
--
--
20
100
-
120
--
--
-40
-
150
JOO
--
--
--
180
--
--
--
210
--
--
30
-
240
--
--
65
-27
0 -
--
-10
0 -
300
--
--
-
330
--
-35
-
360
-20
25
10
0 -
I
390
-50
55
-
420
-50
70
-
450
-50
10
0 -
-No
mor
tali
ty
46
the end of the experiment. A more or less similar mortality rate
was observed when 75 ppm of mahua oil cake was present in the
medium. However, total mortality was recorded by the end of the
experiment. A sudden spurt of mortality was observed among
individuals of ~ mossambica when exposed to 80 ppm of the
piscicide. The entire lot was found dead between the 5th and
6th hour of exposure. Increased toxicity was observed as
evidenced by absolute mortality was observed when subjected to
higher concentrations of the cake. Four hours were required for
total mortality when individuals were exposed to 90 ppm; the
same being 2.5 and 1.5 hours for 100 and 200 ppm of the cake
respectively.
Table 5b outlines the percentage mortality of T.
mossambica following exposure to selected concentrations (0.5
4ppm) of croton seed. A concentration of 0.5 ppm of the material
in the medium did not elicit lethality to the test species.
When the concentration was doubled, half of the exposed
individuals died in about 6.5 hours. Longer exposure to the same
concentration did not cause any increase in the percentage
mortality. Exposure to 1.5 ppm of croton seed also produced a
more or less similar result. The toxicant could not induce total
mortality during the period of exposure. Enhancement of the
concentration to 2 ppm and above produced absolute mortality
much earlier. A clear cut reduction in lethal time was observed
with an increase in concentration of the toxicant. While 2 ppm
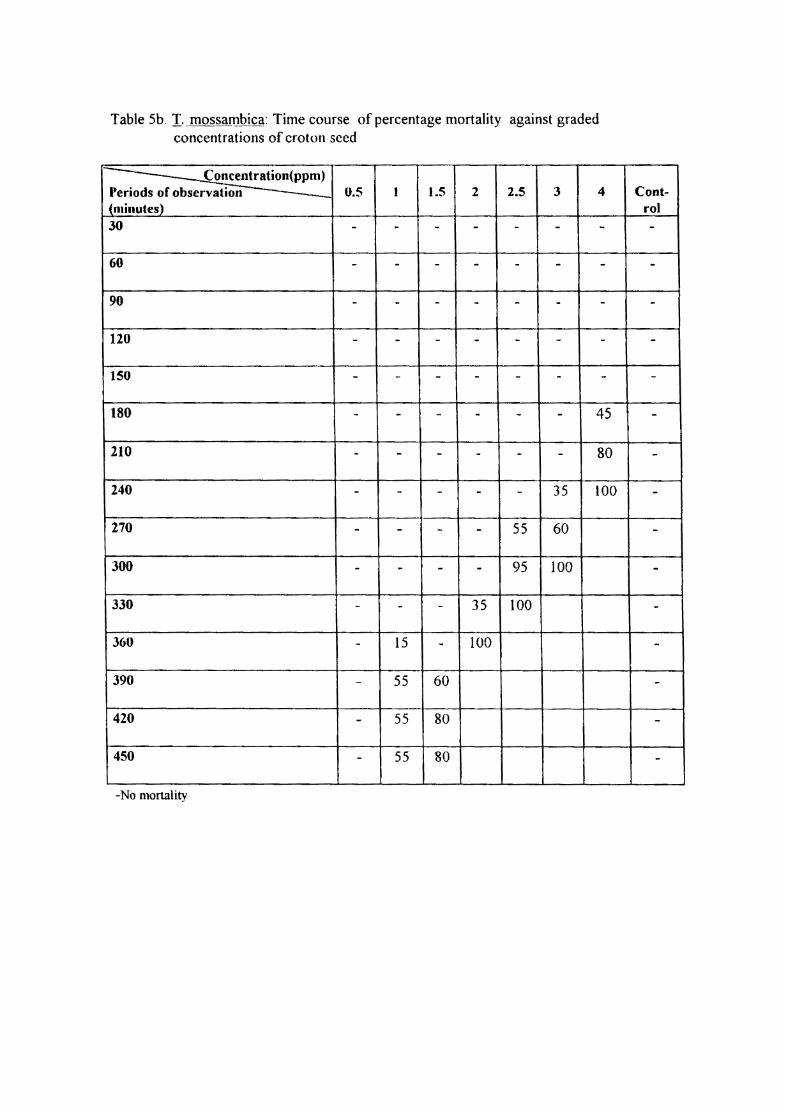
I
Table 5b. 1. mossal1}bic~: Time course of percentage mortality against graded concentrations of croton seed
Periods of observation 0.5 J 1.5 2 2.5 3 4 (minutes) 30 - - - - - - -
60 - - - - - - -
90 - - - - - - -
120 - - - - - - -
150 - - - - - - -
180 - - - - - - 4S
210 - - - - - - 80
240 - - - - - 35 100
270 - - - - 55 60
300 - - - - 9S 100
330 - - - 35 100
360 - 15 - 100
390 - 55 60
420 - 55 80
450 - 55 80
-No mortality
Cont-rol -
-
-
-
-
-
-
-
-
-
-
-
-
-
-
47
of the toxicant needed 6 hours to effect absolute mortality, 2.5
ppm of the same toxicant required only 5 hours to cause the same
effect. The time for absolute mortality in the case of 3 and 4
ppm of the piscicide was about 5 hours and 4 hours respectively.
4.1.3.1.2 Effect of the piscicides on the haematological
parameters of T.mossambica
Experiments were conducted to analyse the effect of 80
ppm mahua oil cake on the blood profile of ~ mossambica over
a period of 6 hours. The data obtained is illustrated in table
6a. It can be seen from the Table that the haemoglobin content
(Hb %) of the exposed individuals decreased significantly when
compared to their counterparts in the control lot. The values
dropped from 11.21 to 7.98. A similar trend in variation was
observed in the case of haematocrit values (Ht %) and total
erythrocyte count (TEC) also. The haematocrit values fell
sharply from 30.49 at the start of the experiment to a
surprisingly low 20.87 at the end. In the case 6 3
of 1=-He ~ o.f 6 3
TEC, the value came down from 1.9xlO /mm to 1.14xlO /mm at the
close of the experiment. The Mean Corpuscular Volume (MCV) and
Mean Corpuscular Haemoglobin (MCH) of the exposed individuals on
the other hand increased steadily when compared to the control
animals during the experimental period.
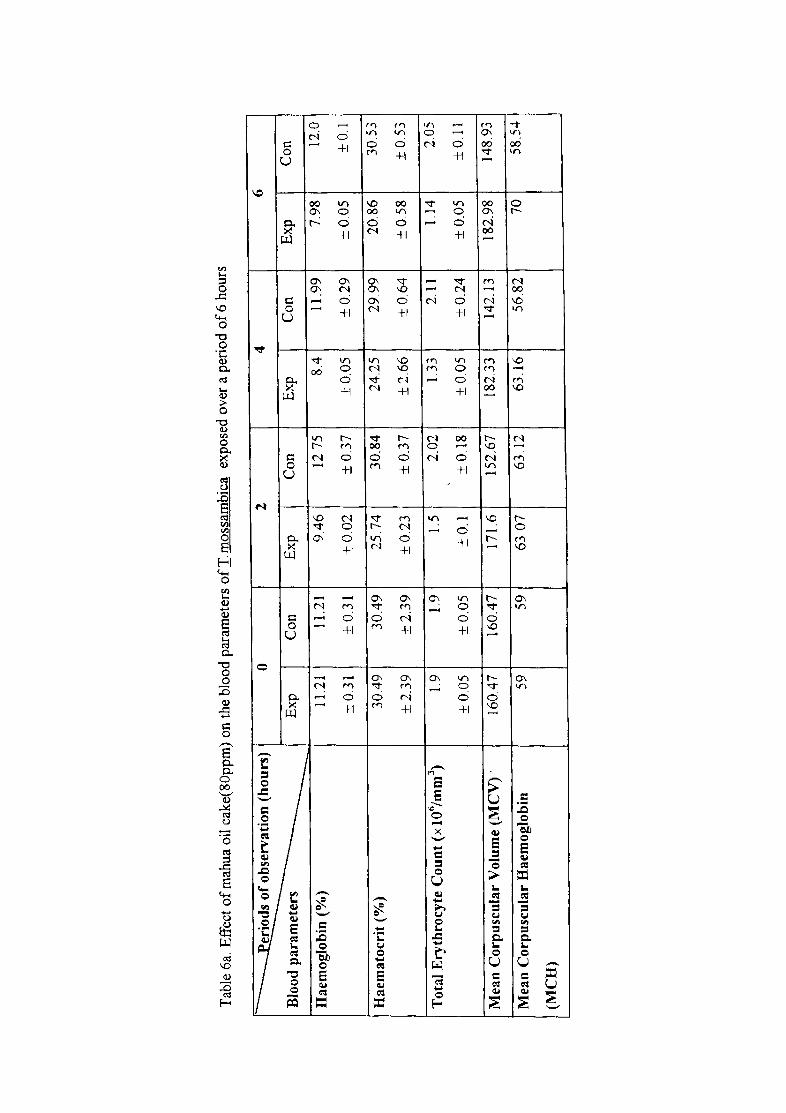
Tab
le 6
a. E
ffec
t o
fmah
ua
oil
cake
(80p
pm)
on t
he b
lood
par
amet
ers
ofT
mo
ssam
bic
a ex
pose
d ov
er a
per
iod
of6
hou
rs
I~)
0 2
4 6
Blo
od p
aram
eter
s E
xp
Co
n
Ex
p
Co
n
Exp
C
on
Ex
p
Con
Hae
mo
glo
bin
(%
) 11
.21
11.2
1 9
.46
12
.7S
8.4
11.9
9 7.
98
12.0
± 0
.31
± 0
.31
±0
.O2
±
0.3
7 ±O
.OS
± 0
.29
±0
.05
±
0.1
Hae
mat
ocr
it (
%)
30.4
9 30
.49
25
.74
30
.84
24.2
5 29
.99
20.8
6 30
.53
± 2
.39
±2
.39
±
0.2
3 ±
0.3
7
±2
.66
±
0.6
4
±0
.58
±
0.5
3 I
To
tal
Ery
thro
cyte
Co
un
t (x
I06/
mm
J)
1.9
1.9
1.5
2.02
1.
33
2.11
1.
14
2.05
±O.O
S ±
0.0
5
± 0
.1
± 0
.18
±0
.05
±
0.2
4
± 0
.05
±O
.ll
I
Mea
n C
orp
usc
ula
r V
olu
me
(MC
V)
. 16
0.47
16
0.47
17
1.6
152.
67
182.
33
142.
13
182.
98
148.
931
Mea
n C
orp
usc
ula
r H
aem
og
lob
in
59
59
63
07
63
.12
63.1
6 56
.82
70
58
.54
I
I (M
CR
) -
-0
0-
-~
-I
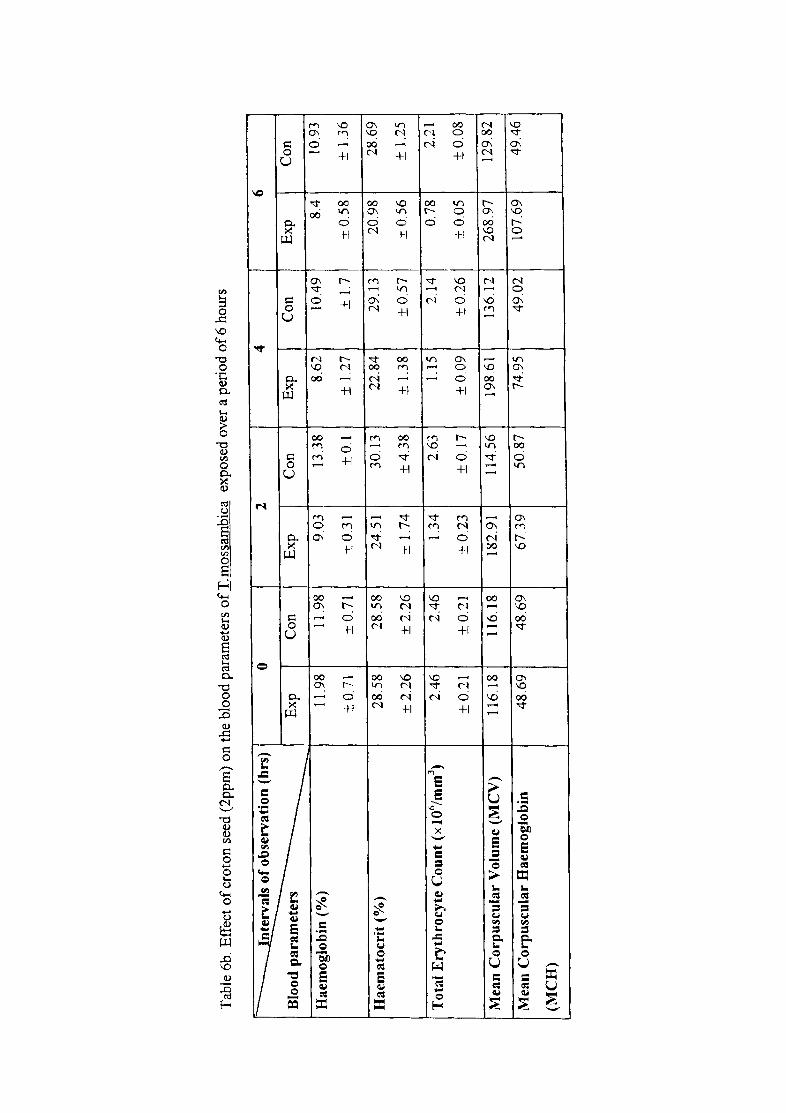
Tab
le 6
b. E
ffec
t o
f cro
ton
seed
(2
pp
m) o
n th
e bl
ood
para
met
ers
of 1
. mos
sam
bica
ex
pose
d ov
er a
per
iod
of 6
hou
rs
!~)
0 2
4 6
Blo
od p
aram
eter
s E
xp
Con
E
xp
C
on
E
xp
Con
E
xp
Con
Hae
mog
lobi
n (%
) 11
.98
11.9
8 9.
03
13.3
8 8.
62
10.4
9 8.
4 10
.93
± 0
.71
±0
.71
±
0.3
1 ±
0.1
±
1.2
7 ±
1.7
±
0.5
8 ±
1.3
6
Hae
mat
ocri
t (%
) 28
.58
28.5
8 24
.51
30.1
3 22
.84
29.1
3 20
.98
28.6
9
±2
.26
±
2.2
6
± 1
.74
± 4
.38
± 1
.38
±0
.57
±
0.5
6 ±
1.2
5
Tot
al E
ryth
rocy
te C
oun
t (x
106
/mm
) 2.
46
2.46
1.
34
2.63
1.
15
2.14
0.
78
2.21
± 0
.21
± 0
.21
±0
.23
±
0.1
7 ±
0.0
9
±0
.26
±
0.0
5 ±
0.O
8
Mea
n C
orp
usc
ula
r V
olum
e (M
CV
) 11
6.18
11
6.18
18
2.91
11
4.56
19
8.61
13
6.12
26
8.97
12
9.82
Mea
n C
orp
usc
ula
r H
aem
oglo
bin
48
.69
48.6
9 67
.39
50.8
7 74
.95
49.0
2 10
7.69
49
.46
' I (M
CH
) I
----
_._
----
--
---.
---
48
Table 6b outlines the data obtained on the blood
parameters of individuals of T. mossambica following exposure to
a constant concentration (2 ppm) of croton seed. The pattern
of variation of the various blood parameters was more or less
similar with that observed in the case of mahua oil cake.
Statistical analysis 01 (lata ~evealed a significant difference
(p<0.05) in the values of Hb, Ht & TEe between the experimental
and control samples following exposure to mahua oil cake and
croton seed.
4.1.3.2 Penaeus indicus
The toxicity of mahua oil cake to the postlarvae of
Penaeu~ indicus was put to detailed investigution. The data
obtained is given in Table 7a. While 200 ppm of the cake did not
effect any mortality among individuals of the prawn species
during the 24 hour period of exposure/ all the other
concentrations tested
concentrations ranging
cause total mortality.
produced total mortality. In fact,
from 300-500 ppm required 24 hours to
Higher doses of the cake (750-1250 ppm)
however required only 12 hours to produce the same effect.
Postlarvae of Penaeus indicus were exposed to selected
concentrations of croton seed (0.25, 0.5, 1, 2, 3, 4 & 5 ppm).
The calculated percentage mortality is outlined in Table 7b.
The lower doses of the toxicant (0.25-1 ppm) were rather
ineffective in bringing about mortality among the postlarvae.
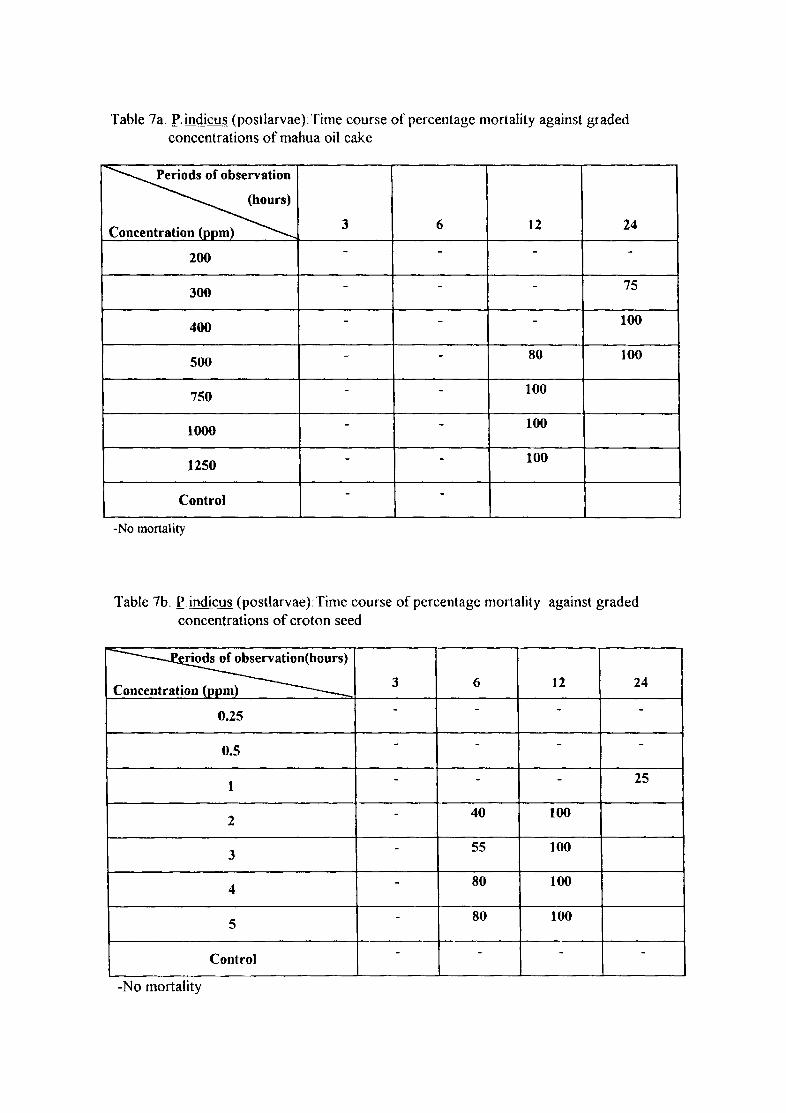
Table 7a. r..indicu~ (postlarvae):Time course of percentage mortality against graded concentrations of mahua oil cake
~ (hours)
Concentration (pp m) 3 6 I2 24
200 - - - -
300 - - - 75
400 - - - 100
-500 - 80 100
750 - - 100
-1000 - 100
1250 - - 100
Control - -
-No mortality
Table 7b. £.indicus (postlarvae):Time course of percentage mortality against graded concentrations of croton seed
--~ Concentration (ppm) 3 6 12 24
- - - -0.25
- - - -0.5
1 - - - 25
2 - 40 100
3 - 55 100
4 - 80 100
5 - 80 100
Control - - - -
-No mortality
49
Concentrations ranging from 2 to 5 ppm on the other hand were
highly toxic causing absolute mortality of the individuals in 12
hours. During the first 3 hours of exposure, in fact, no
mortality was recorded in any of the concentrations tested.
4.1.3.3 Villorita cyprinoides
The toxic effect of selected concentrations of mahua
oil cake on the clam Villorita cyprinoides over a duration of 96
hours is given in table 8a. None of the individuals died upto 36
hours in any of the concentrations tested. Neither 50 ppm nor
100 ppm of the cake was capable of inducing mortality among the
individuals of the clam species during the 96 hour exposure
period. However, higher concentrations viz. 200 and 250 ppm were
lethal to the test species from 48 hours onwards, effecting
100% mortality in 72 hours.
The data on the percentage mortality of ~ cyprinoides
following exposure to selected concentrations of croton seed is
given in Table 8b. A notable feature of the result obtained
was a concentration - dependent declension in the lethal time.
While 1 ppm of the piscicide was capable of causing only 50%
mortality among individuals of the clam during 96 hours, 2 ppm
needed only 72 hours to produce absolute mortality. Higher
concentrations of 4 ppm and 5 ppm required only 60 hours and 48
hours respectively to produce the same extent of mortality.
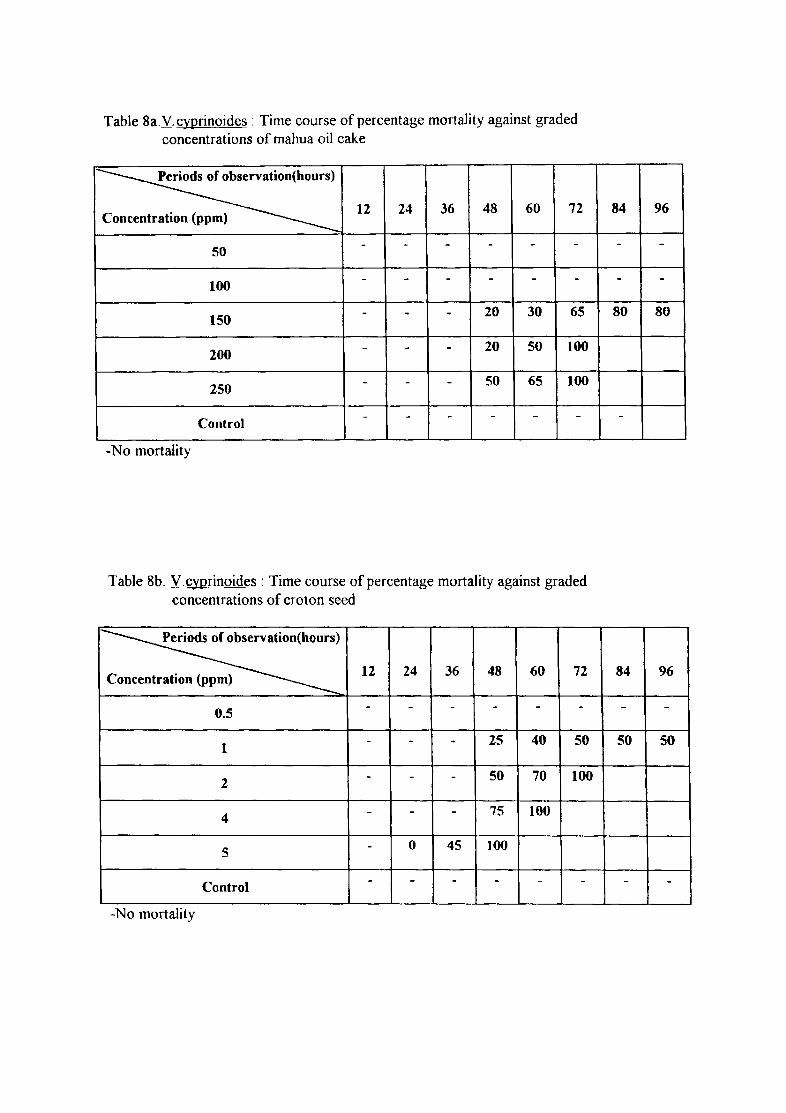
Table Sa. V. cyprinoides : Time course of percentage mortality against graded concentrations of mahua oil cake
~ Concentration (ppm) 12 24 36 48 60 72
- - - - - -50
- - - - - -100
150 - - - 20 30 65
200 - - - 20 50 100
250 - - - 50 65 100
- - - - - -Control
-No mortality
Table 8b. V.cyprinoides : Time course of percentage mortality against graded concentrations of croton seed
I~ Concentration (ppm) 12 24 36 48 60 72
0.5 - - - - - -
1 - - - 25 40 50
2 - - - 50 70 100
-4 - - 7S 100
5 - 0 45 100
Control - - - - - -
-No mortality
84 96
- -
- -
80 80
-
84 96
- -
50 50
- -
50
4.1.4 Persistence of toxicity of different concentrations of the
piscicides in the test media
The persistence of toxicity of different
concentrations of mahua oil cake in the media was tested with a
low tolerant fish species, Ambassis gymnocephal~ as the target
organism. 75 ppm of the cake effected total mortality of the
test individuals on day l(Table 9a & Figs. 5a-e) Exposure of ~
gymnocephalll~ to the same medium from day 2 to day 7 did not cause
any mortality among the individuals. When 100 ppm of the cake
was present, absolute mortality occurred among the experimental
individuals on the first 2 days, about 75% mortality on day 3
and no mortality from day 4 onwards. Increased duration of
persistence of toxicity was seen in the media
concentration was increased to 150,200 and 250 ppm.
when the
Absolute
mortality was recorded upto the 4th day in these concentrations.
On day 5, while marginal mortality was reported in the media
containing 150 and 200 ppm, about 75% mortality was recorded in
the medium containing 250 ppm of the toxicant. From day 6, the
experimental media containing 150 and 200 ppm did not indicate
any toxicity with reference to the test fish. However, 250 ppm
of the cake continued to exert lethal effect to ~ gymnocephal~.
Table 9b & Figs. 6a-f outlines the percentage
mortality among ~ gy~~ocephal~when exposed to 0.5 to 5 ppm
croton seed for a period upto 7 days. A concentration of 0.5 ppm
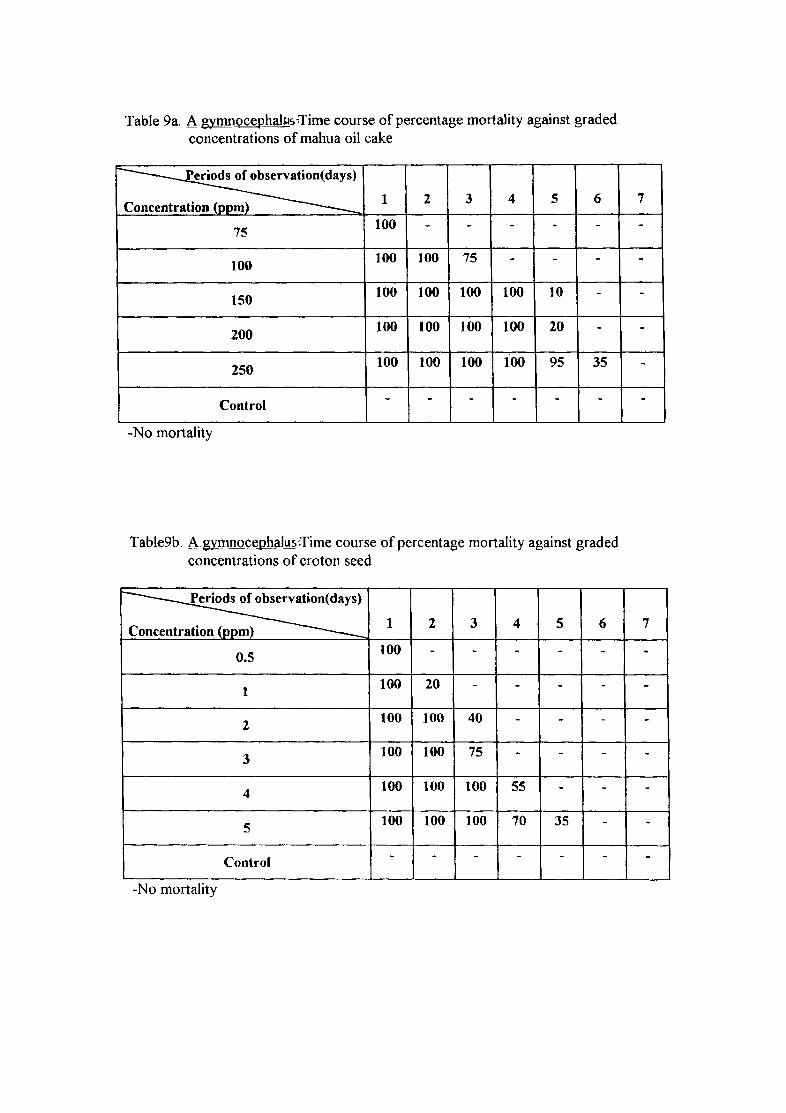
Table 9a. AgymnocephalJ.ls,Time course of percentage mortality against graded concentrations of mahua oil cake
~ Concentration (ppm) 1 2 3 4 5 6
75 100 - - - - -
lOO 100 100 75 - - -
150 100 100 100 100 10 -
200 100 100 100 100 20 -
250 100 100 100 1'00 95 35
Control - - - - - -
-No mortality
Table9b. AgY.mnocephalus:Time course of percentage mortality against graded concentrations of croton seed
~ Concentration (ppm) 1 2 3 4 5 6
0.5 100 - - - - -
1 100 20 - - - -
2 100 100 40 - - -
3 100 100 75 - - -
4 100 100 100 55 - -
5 100 100 100 70 35 -
Control - - - - - -
-No mortalIty
7
-
-
-
-
-
-
7
--
-
-
--
-
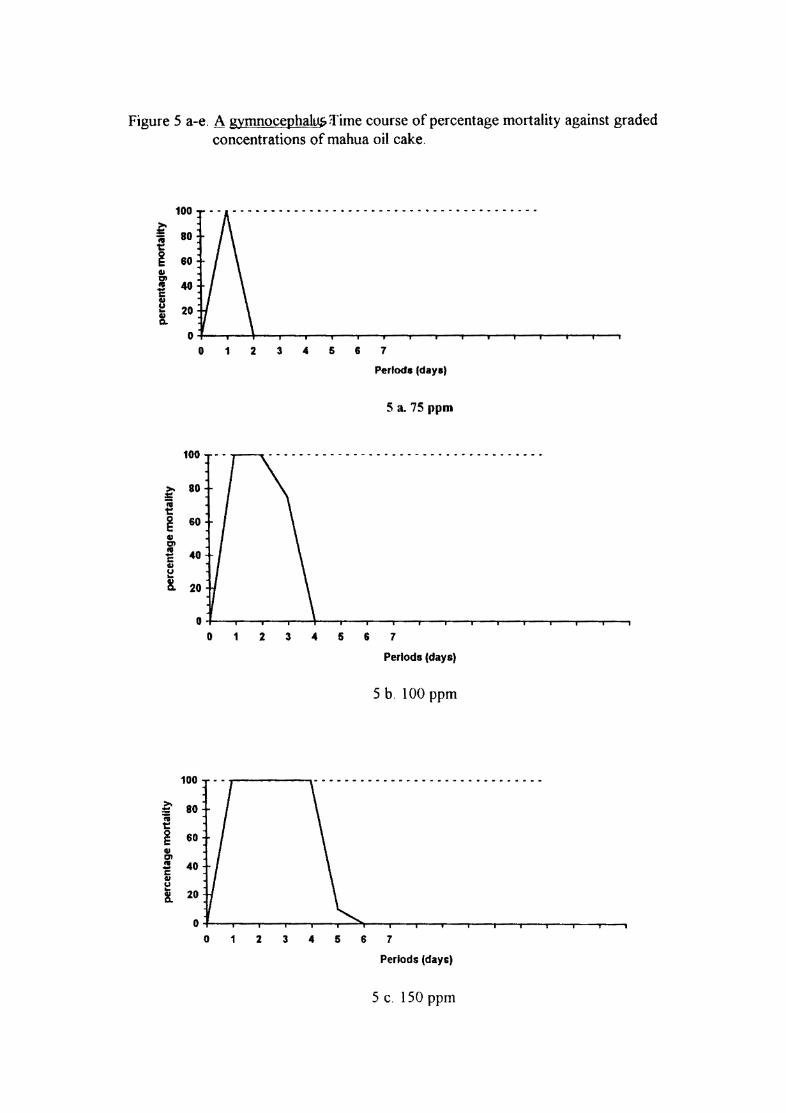
Figure 5 a-e. A gymnocephalup :rime course of percentage mortality against graded concentrations of mahua oil cake.
100
~ BD ~ ~ 60 1\1 01
~ 40 CIJ u 20 t c.
0
0 1 2 3 " 567
Periods (days)
5 a. 75 ppm
100
>- 80 :! ;; t:: ~ 60 III 01
"' 40 -c CIJ
t::! 8. 20
0 0 1 2 3 " 5 6 7
Periods (days)
5 b. 100 ppm
100 r------,- - - - - - - - - - - - - - - - - - - - - - - - - - - - - -
>- 80 == ;; t:: ~ 60 III 01
"' 40 ~ GI U ..
20 8.
0 0 1 2 345 6 7
Periods (days)
5 c. 150 ppm
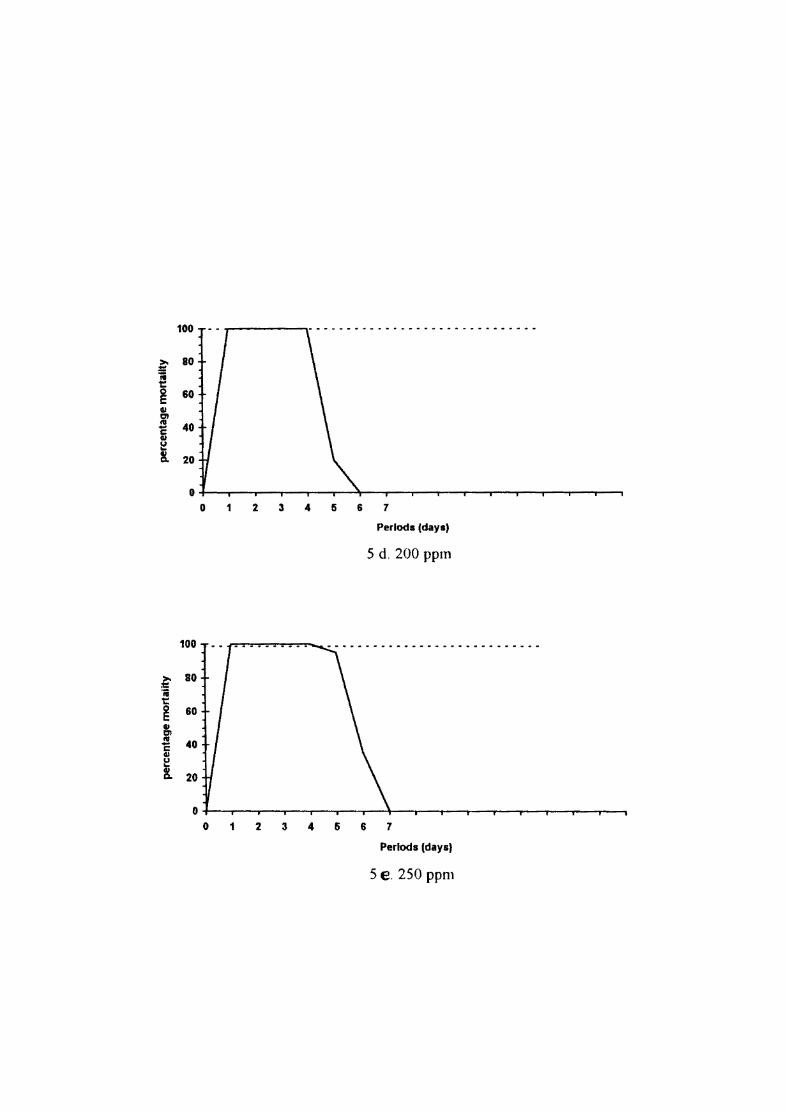
100 ...------...,- - - - - - - - - - - - - - - --- - - - . - . -- - ---
>- 80 := ii t: ~ 60 III Cl
"' 40 -C III
~ ~ 20
0
0 2 3 4 5 6 7
Periods (days)
5 d. 200 ppm
100
~ 80 ii t: ~ 60 tI Cl .l! 40 c III U .. ~ 20
0 0 1 2 3 4 5 6 7
Periods (days)
5 e. 250 ppm
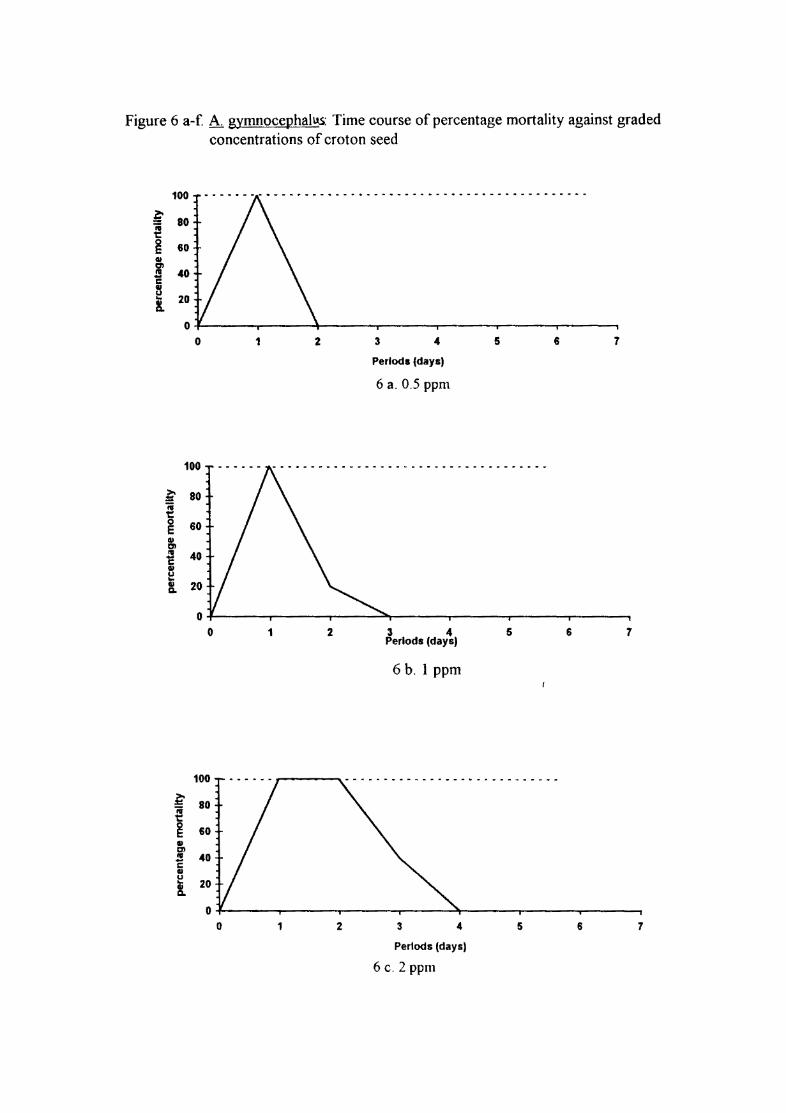
Figure 6 a-f A. gymnocephalu.s: Time course of percentage mortality against graded concentrations of croton seed
100
~ 80 ~ ~ 60 11 Cl la 40 -c l! ... 20 !.
0 0
100
>. 80 .: ii 1: 0 60 E 11 Cl .!! 40 c 11 U ~
11 20 Q.
0
0
100
~ 80 ii 1:
~ 60 11 Cl .!! 40 c 11 U "- 20 !.
0
1
1
0
2
2
3 4
PerIods (days)
6 a. 0.5 ppm
3 4 PerIods (days)
6 h. 1 ppm
5 6
5
r---~--"'- _. - - - - - - - - - . - - - •.. -' - - - . - -'
1 2 3 4
PerIods (days)
6 C. 2 ppm
5
7
6 7
6 7
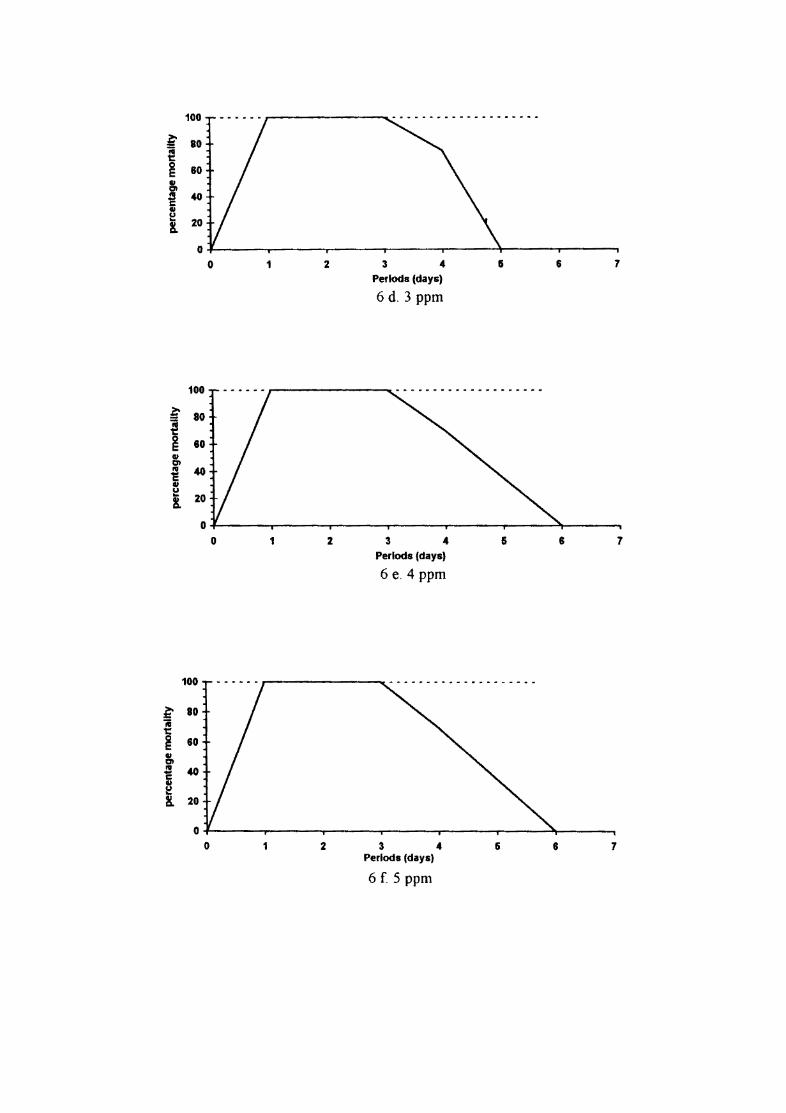
100
~ 80 ~ ~ 80 11
f 40 11 u
i 20
100
~ 80 ~ ~ 60 III tII .. 40 C 11 u ~ 20 !.
0
100
~ BO ii 1:
~ 80 11 tII .. 40 -c:: tI I:! !. 20
0 0
0
1 2 3 4 & Periods (days)
6 d. 3 ppm
r-------------_--------------------
1 2
2
3 4 Periods (days)
6 e. 4 ppm
3 4 Periods (days)
6 f. 5 ppm
5
5
6 7
6 7
6 7
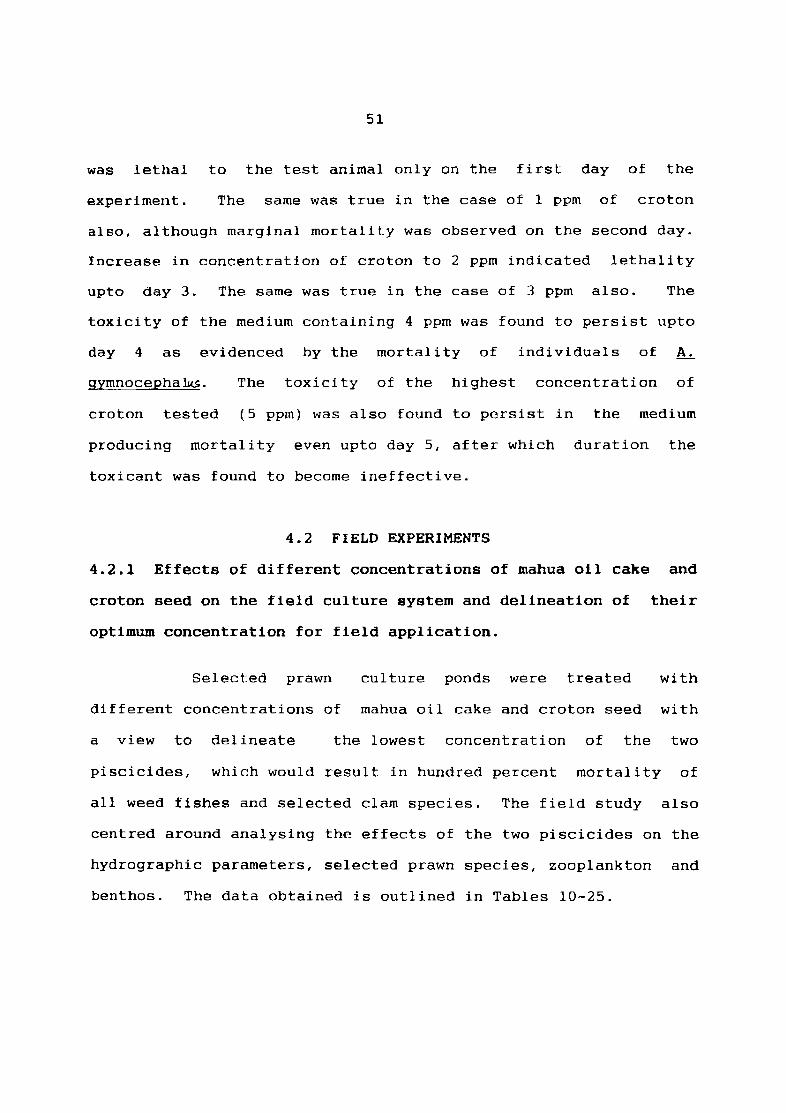
51
was lethal to the test animal only on the first day of the
experiment. The same was true in the case of 1 ppm of croton
also, although marginal mortality was observed on the second day.
Increase in concentration of croton to 2 ppm indicated lethality
upto day 3. The same was true in the case of 3 ppm also. The
toxicity of the medium containing 4 ppm was found to persist upto
day 4 as evidenced by the mortality of individuals of ~
gymnocepha~. The toxicity of the highest concentration of
croton tested (5 ppm) was also found to persist in the medium
producing mortality even upto day 5, after which duration the
toxicant was found to become ineffective.
4.2 FIELD EXPERIMENTS
4.2.1 Effects of different concentrations of mahua oil cake
croton seed on the field culture system and delineation of
optimum concentration for field application.
Selected prawn culture ponds were treated
and
their
with
different concentrations of mahua oil cake and croton seed with
a view to delineate the lowest concentration of the two
piscicides, which would result in hundred percent mortality of
all weed fishes and selected clam species. The field study also
centred around analysing the effects of the two piscicides on the
hydrographic parameters, selected prawn species, zooplankton and
benthos. The data obtained is outlined in Tables 10-25.
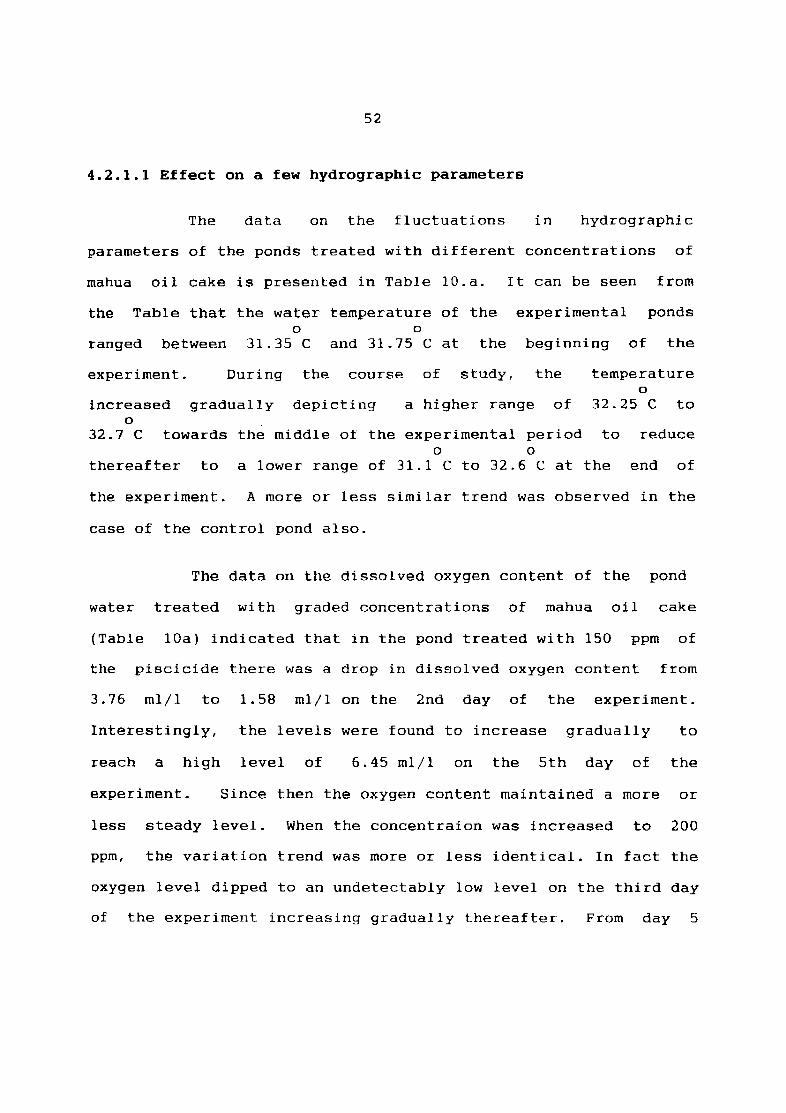
52
4.2.1.1 Effect on a few hydrographic parameters
The data on the fluctuations in hydrographic
parameters of the ponds treated with different concentrations of
mahua oil cake is presented in Table lO.a. It can be seen from
the Table that the water temperature of the experimental ponds o 0
ranged between 31.35 C and 31.75 C at the beginning of the
experiment. During the course of study. the temperature o
increased gradually depicting a higher range of 32.25 C to o
32.7 C towards the middle of the experimental period to reduce o 0
thereafter to a lower range of 31.1 C to 32.6 C at the end of
the experiment. A more or less similar trend was observed in the
case of the control pond also.
The data on the dissolved oxygen content of the pond
water treated with graded concentrations of mahua oil cake
(Table lOa) indicated that in the pond treated with 150 ppm of
the piscicide there was a drop in dissolved oxygen content from
3.76 mIll to 1.58 mIll on the 2nd day of the experiment.
Interestingly. the levels were found to increase gradually to
reach a high level of 6.45 mIll on the 5th day of the
experiment. Since then the oxygen content maintained a more or
less steady level. When the concentraion was increased to 200
ppm, the variation trend was more or less identical. In fact the
oxygen level dipped to an undetectably low level on the third day
of the experiment increasing gradually thereafter. From day 5
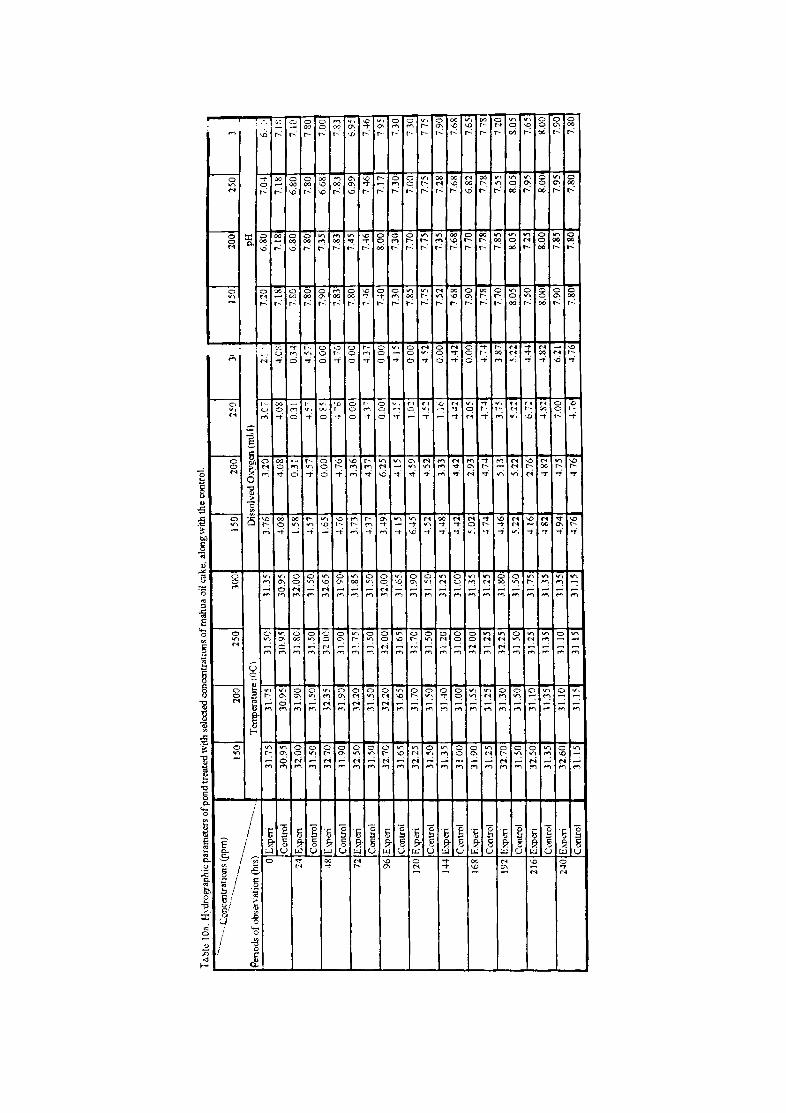
T d
blc
I D
a. H
vdro
grap
hic
para
met
ers
of p
ond
trea
ted
with
sel
ecte
d co
ncm
trat
ions
of m
ahu
a oi
l ca
ke.
alon
g w
ith th
e co
ntro
l.
'-"
----
CQ
n_cr
otra
tion
s (p
pmJ
-"---
150
20
0
25
0
300
ISO
2
00
1~O
3'
150
200
25
0
)0
-.........
.......
.. P
erio
ds o
f ob
serv
atio
n (h
rs)
-.........
......
Tem
pera
ture
(QC
) D
isso
lved
OX
Yge
n (m
L I)
pH
..
o E
xper
i 3
1.7
5
31.7
5 31
.50
31.3
5 3.
76
3.20
3.
0 '
2.'
. 1.
20
6.80
7.
0-1
6·
.
Con
trol
3
0.9
5
30.9
5 30
.95
30.9
5 -1
.08
4.0
8
-1.0
8 4.
e:'
1.18
7.
18
7.18
7
I:;
24
txp
eri
32
.00
31
.90
3l.
80
32
.00
1.58
0.
31
0.31
0.
3-1
7.80
6.
80
6.8
0
7.lC
<
Coo
trol
3
1.5
0
31.5
0 31
.50
31.5
0 ·+
.57
-1.5
7 -I
S~
4.57
7.
80
7.80
7.
80
78
0
-18
hpc'
f'i
32
.70
32
.35
32.0
0 32
.65
1.65
0
.00
0.
85
0.00
7,
90
7.35
6
.68
7.
00
Con
trol
]
1.90
31
.90
31.9
0 31
.90
-1.7
6 4
.76
4
-61
-1.7
6 7.
83
7.83
7.
83
7.83
12 [
:-.:p
eri
32
.50
)2
,20
JU
S
31.8
5 3.
73
3.3
6
00
01
0
00
7.
80
7.45
6
.99
6.
95
Con
trol
3
1.5
0
31
.50
31
.50
31.5
0 4
.37
4
.37
4
.r
-1.3
7 7.
46
7.46
7
.46
7
46
96 E
\'fle
ri 3
2.7
0
32.2
01
32
00
32
.00
3.49
6.
25
0.00
0
00
7.
-10
8.00
7
.17
7.
95
Con
trol
31
.65
31.6
5 31
.65
31.6
5 -1
.15
41
5
... 1
~ ·1
15
7.30
7.
30
7.30
7.
30
120
F.\'
fl~
32
.25
3
1.7
0
31.7
0 3
1.9
0
6.45
4
.59
1.
0~
0.00
7.
85
7.70
7.
00
7.30
C,m
trol
3
1.5
0
3l.
50
31
.50
31.5
0 -1
.52
4.5
2
. .J.~:
4
.52
7.
75
77
5
7.75
7,
75
144
Exp
cri
31
.35
JI
AO
3
UO
3
U5
-1
.48
3.33
1.
16
0.00
7.
52
7.35
7.
28
7.90
Con
trol
3
10
0
31.0
0 3
1.0
0
31
.00
4
-12
-1.4
2 -1
.4:
4012
7.
68
7.68
7.
68
7.68
168
E"t
'eri
3
1.9
0
31.5
5 3
20
0
31.3
5 ~.
02
2.93
2.
05
0.00
7,
90
7.70
6
.82
7.
65
Con
trol
31
.25
J 1.
25
31.2
5 31
.2S
4.74
4
.74
-1
.74
4.74
7.
78
7.78
7,
78
7.78
192
E"t
'c-n
32.7
0 3
1.3
0
32
.25
31
.80
4.-1
6 5
.B
3.~5
3.87
7.
70
7.85
7.
55
7.20
Con
trol
3
1.5
0
3l.
50
JU
O
31
.50
5.
22
5.22
5.
::
5.22
8.
05
8.0S
8.
05
8.05
216
Exp
eri
32.5
0 31
. 10
31.2
5 31
.75
4.1
6
2.7
6
6.i
: 44
-1
7.50
7.
25
7.95
7.
65
Con
trol
3
13
5
31.3
5 3
13
5
31
35
-1
.82
-1.8
2 4
S1
4.
82
8.00
8.
00
8.0
0
8.00
i
240
E.\'fl
~'f'i
32
.60
31
.10
31.1
0 31
.35
4.9
4
4.75
7.
00
6.21
7.
90
7.85
7.
95
7.90
I
Con
trol
J
1.15
31
.15
JU
S
J I.
IS
4.76
-1
.76
-1.7
6 4
76
7.
80
7.80
7
.80
7.
801
'---
53
onwards, the 0 levels were found to vary considerably. In the 2
pond treated with 250 ppm of the cake, the oxygen levels were
below detectable limits on the 3rd and 4th day of the experiment.
From day 5 onwards, a gradual increase in oxygen content was
noticed and a remarkably high level of 7 mIll was recorded on the
final day of the experiment. The variation in oxygen level in
the pond treated with 300 ppm of mahua oil cake was in line with
that observed in the pond treated with 250 ppm. The only
variation observed was the relative absence of oxygen for a
longer duration extending from day 2 to day 7. In the pond
containing 200 ppm of the cake, where the medium was diluted (8-
10%) with tidal water followed by the elimination of weed fishes,
the dissolved oxygen content did not at any point during the
sampling period drop to an undetectably level and the lowest
level of dissolved oxygen recorded was only 1.07 mIll (Table
10.c). Indeed the pattern of fluctuation of dissolved oxygen was
of a similar nature as observed in the undiluted medium, showing
no significant difference between the two on statistical
analysis.
Table lOa also contains the data on the pH of the
pond water exposed to varying concentrations of mahua oil cake
over a period of 10 days. The pH of the experimental ponds at
the beginning of the period of observation was of the range 6.6 -
7.2. From day 1 onwards the pH values revealed an increasing
trend with frequent fluctuation. The highest pH recorded in the
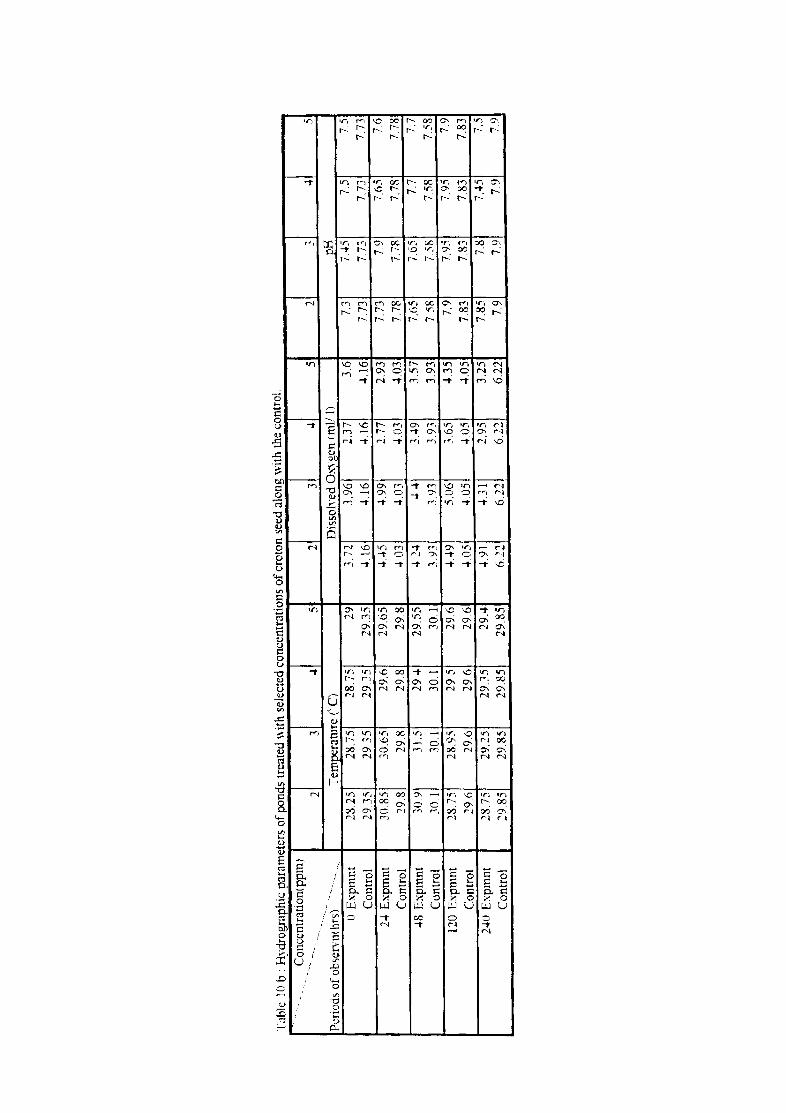
Tab
le l
O.b
: H
Hir
ogra
phic
par
amet
ers
of
pond
s tr
eate
d w
ith
sele
cted
con
cent
rati
ons
of c
roto
n se
ed a
long
wit
h th
e co
ntro
l '.
-.
'.
Con
cent
rati
on( p
pm)
'-'.
'.
---
2 3
4 5
2 3
4 5
2 ,
4 5
-. '-
. '.
----
P'..:
nods
of
obsc
rv\1
1 Iu
s)
-- '--
Tem
pera
ture
(' C
) D
isso
lyed
O:-..
.. yge
n (m
ll ])
pH
'.
D E
xp
mn
t 23
.25
28.7
5 28
.75
29
3.
72
3.96
2.
37
3.6
7.
3 7.
45
7.5
7.5
Con
trol
2
93
5
29.3
5 29
.35
29
.35
4
.16
·U
6
.U6
4
.16
7.
73
7. 7
3 7.
73
7.73
:
24 E
xptn
nt
30.8
5 3
0.6
5
29.6
2
9.6
5
4.4
5
4_99
1 2.
77
2.93
7.
73
7,9
7,65
7.
6
Con
trol
29
.8
29.8
29
.8
29
.8
-1.0
3 -I.
l13
40
3
40
3
7.78
7,
7F,
7.7'
!. 7.
781
48
Exp
mnt
3
0Y
31
.5
29
.4
29
,55
4.
2-1
4.4
3.49
3
.57
7,
(i5
7.65
7.
7 7.7
1 C
ontr
ol
30.1
30
.1
30.1
30
,1
3.93
3,
93
3.93
3.
93
7.58
7.
58
7.58
7.
58
120
Exp
tnnt
28
.75
28.9
5 29
,5
29
.6
4.4
9
5.0
6
3.65
4,
35
7.9
7. 95
7.
95
7.9
Con
trol
29
.6
29,6
29
.6
29
.6
.j. 0
5
-1.0
5 .j
.05
4.05
7.
83
78
3
7.83
7.
83
24
0 E
xp
mn
t 2
8.7
5
29.1
5 29
.35
29
A
-1.91
1 .+3
11 1
.95
3.
25
7.85
7.
8 H
5
7.5
I C
ontr
ol
29.8
5 29
.85
29.8
5 29
.85
62
2
6.12
6.
22
6.22
7.
9 7,
9 7.
9 7.
9
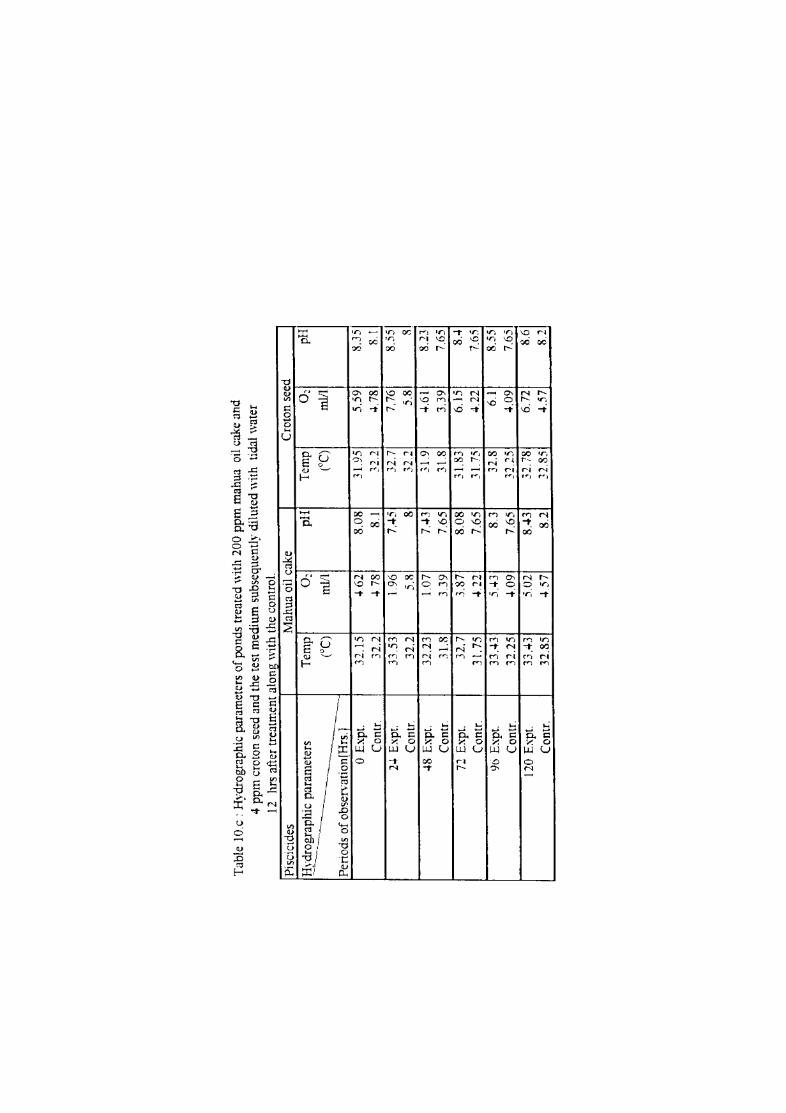
Tab
le 1
O.c
; H
yd
rog
rap
hic
par
amet
ers
of
po
nd
s tr
eate
d w
ith
20
0 p
pm
mah
ua
oil
cake
an
d
4 p
pm
cro
ton
seed
an
d t
he t
est
med
ium
sub
sequ
entl
y d
ilu
ted
wit
h ti
dal
wat
er
12
hrs
afte
r tr
eatm
ent
alo
ng
wit
h t
he
cont
rol
Pis
cici
des
l.."l
ahua
oil
cak
e C
roto
n se
ed
H~'d
rogr
aphi
c p
aram
eter
s T
emp
0"
pH
Tem
p 0"
----
--------
--------
--------
Per
iods
of
obse
rvat
ion[
Hrs
.l ~
(QC
) m
l/l
(QC)
m
l/l
o E
xp
t 32
.15
-+.6
1 8.
08
31.9
5 5.
59
Can
tr.
32.2
-U
S
8.1
32.2
-+
.78
24 h
pt.
33
.53
l. 9
6 7A
5 32
.7
7.76
Can
tI.
32.2
5.
8 8
32.2
5.
8
48 E
XpL
32
.23
10
7
7,..1.
3 31
.9
4.61
Can
tr.
31.8
3.
39
7.65
31
.8
3.39
72 h
pt.
32
.7
3.8
7
8.0
8
31.8
3 6.
15
Con
tr.
31.7
5 ·U
2
7.65
31
.75
4.22
Yb
Exp
t.
n·n
5.
-+3
8.3
32.8
6.
1 C
antI
. 32
.25
-+.0
9 7.
65
32.2
5 4.
09
120
hp
!.
33.4
3 5.
02
8,..j
.3
32.7
8 6.
72
Con
tI.
32.8
5 4.
57
8.2
3285
-+
.57
pH
:U5
8.
1
8.55
8
8.23
7.65
8.4
7.65
8.55
7.65
8.6
8.2
54
different concentrations ranged between 7.9 and 8. The control
pond also displayed a similar pattern of variation ranging in pH
from 7.18 to 8.05.
Table 10.b outlines the variations in hydrographic
parameters of the ponds treated with 5 different concentrations
of croton seed. It is evident from the Table that the
temperature of the ambient water was more or less uniform
throughout the period of study in all the treatment ponds and the
control except at 24 hours and 48 hours where a marginal increase
was noticed. The fluctuation in oxygen content and pH of the
water was also of a similar nature. The data presented in Table
10c also describes the results obtained on the hydrographic
parame~ers of a pond treated with 4 ppm of croton seed and the
medium diluted with tidal water. No pronounced variation in
water temperature, pH and dissolved oxygen was observed when
compared with those observed in the undiluted treatment pond
containing the same concentration.
4.2.1.2 Effect on the test organisms
4.2.1.2.1 Finfish
Results of the field trials carried out to assess the
toxic response of different weed fishes to selected
concentrations of mahua oil cake are presented in Table 11.a.
The different species under test displayed a wide range of
tolerance to the different concentrations of the toxicant. While
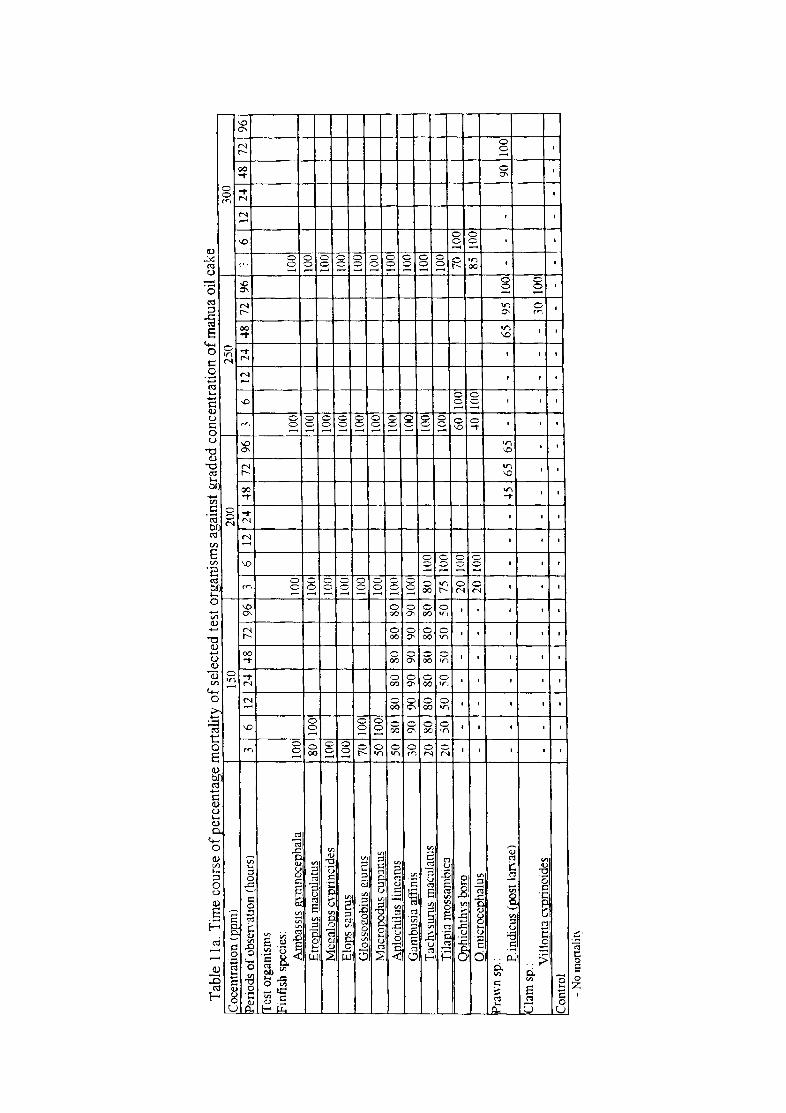
Tab
le l
la. r
f r
--.
---
c_
--
----
<;;
;;}-
-----
------
fsel
--
----
---d
ded
fmah
'1
Coc
entr
atio
n (p
pm)
150
200
250
300
Per
iods
of o
bser
ntJo
n (h
ours
) 3
6 12
2-
l -l8
72
96
3
6 12
24
48
72
96
1 3
6 12
24
-48
72
96
6
12
24
48
72
96
1" es
t or
gani
sms
t:'in
fish
spe
cies
: A
mba
ssis
g\m
noce
phal
a 10
0 10
0 lO
O 10
0 E
tro]2
lus
mac
ulat
us
80
100
100
100
100\
M
ecal
QIls
cyp
rinc
ides
10
0 10
0 10
0 10
01
EI<m
5 sa
urus
10
0 lO
O 10
0 10
0 G
loss
oe.o
bius
eiu
rus
70
100
100
100
100
Mac
rooo
dus
cup:
mus
50
10
0 10
0 10
0 10
0 A
oloc
hilu
s lin
e:m
ls
50
80
80
80
80
80
SO
lOO
100
-100
G
ambu
sla
affi
nis
30
90
90
90
90
90
90
100
100
100\
T
achY
suru
s m
acui
ams
10
80
80
80
80
80
80
80
100
100
100
Til
aoia
mos
sam
bica
20
\ 50
50
50
50
50
50
75
lO
O 10
0 10
0 1
Oph
icht
hys
boro
-
--
--
--
20
100
60
100
70
100
0. m
icro
ceoh
alus
-
--
--
--
20
100
-lO
100
85
100
Pra
wn
sp.: P
.indi
cus
(pos
t ia
rYac
) -
--
--
--
--
--
-l5
65
65
--
--
65
95
100
--
-90
10
0 C
lam
sp.
: Vil
lori
ta c
vpri
noid
es
--
--
--
--
--
--
--
--
--
-30
10
0 20
ntro
l -
--
--
--
--
--
--
--
--
--
--
--
- _ L
-_
'----
-
-N
o rn
orta
htv
55
absolute mortality occurred in the case of Ambassis gymnocephal~,
Megalops cyprinoides and Elops saurus within 3 hours of treatment
in the presence of 150 ppm of mahua oil cake, Etroplus maculatus
Glossogobius giurus and Macropodus cupanus required 6 hours to
produce the same result. Aplochilus lineatus, Gambusia affinis,
Tachysurus maculatus and Tilapia mossambica on the other hand
recorded varying percentages of mortality none reaching cent
percent, within the 96 hour duration. In fact, 150 ppm of the
toxicant was insufficient to cause any mortality among
individuals of Ophichthys or O. microcephalus.
Concentrations of 250 ppm and 300 ppm were capable of effecting
absolute mortality among all the finfishes tested, within a
period of 6 hours. In these concentrations O. boro and ~
microcephalus depicted considerable tolerance as evidenced by the 100
highest lethal time (LT ).
Table 11.b. contains data on the toxic response of
selected finfishes to graded concentrations of croton seed.
Among the different species tested, only A. gymnocepha Ius
indicated absolute mortality in the lowest concentration (2 ppm)
of croton seed administered. When the concentration was
increased to 3 ppm, all members of the species, ~ gymnocephal~,
~ maculatus, ~ ~Y.Q..IinoidesL. ~ saurus, ~ cupanus, ~ lineatus
and ~ affinis died within varying durations extending from 3 to
12 hours. Concentrations of 4 ppm and 5 ppm were sufficient to
kill all the experimental finfishes within 3 to 6 hours.
4.2.1.2.2 Penaeus indicus
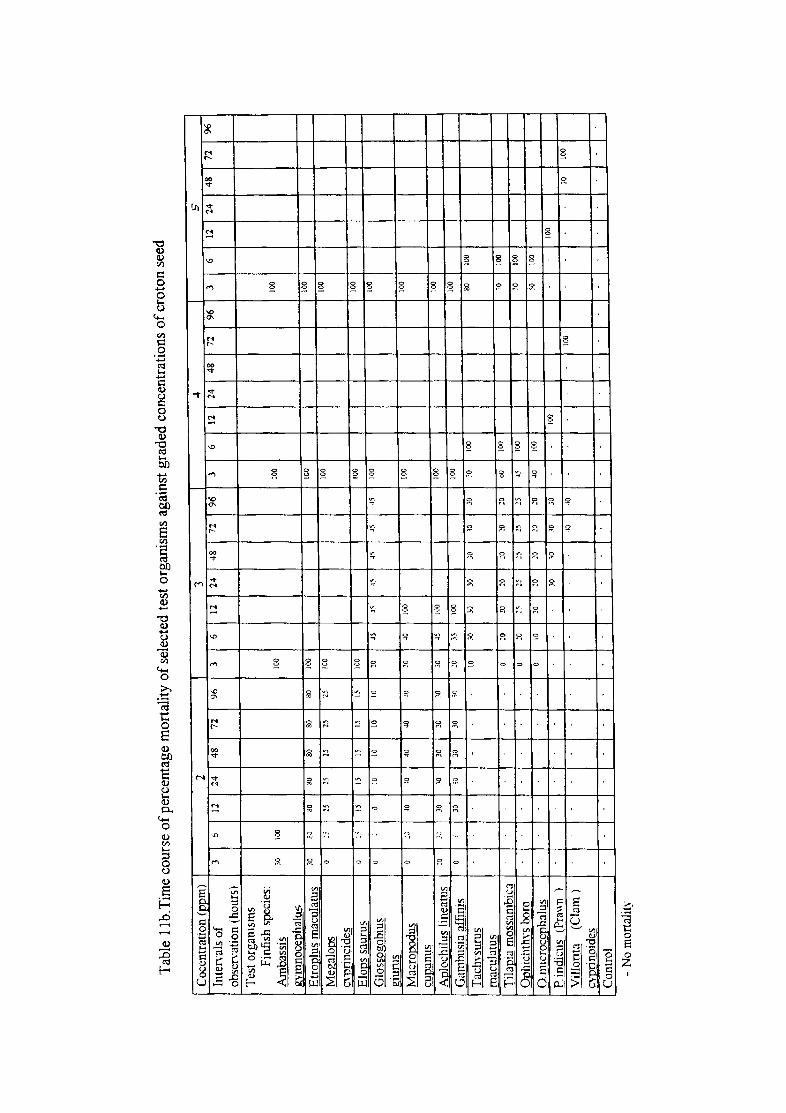
Tab
le 1
1 b .T
ime
cour
se o
f per
cent
age
mor
tali
ty o
f sel
ecte
d te
st o
rgan
ism
s ag
ains
t gr
aded
con
cent
rati
ons
of c
roto
n se
ed
Coc
entr
atio
n (p
pm)
2 3
4 S
Inte
n:al
s o
f 3
6 12
24
48
72
96
3
6 12
24
48
72
96
3
6 12
24
48
72
96
3
6 12
24
48
n
96
obse
n'at
ion
(hou
rs)
Tes
t or
gani
sms
Fin
fish
spe
cies
: A
mba
ssis
30
1,
)1)
100
100
lOO
I!vm
noce
nhal
u=,
Etr
oolu
s m
acul
atus
:10
S
J 8
0
80
80
BO
BO
100
100
lOO
Meg
aloI
;1s
0 ,<
25
:5
25
25
25
10
0 10
0 10
0
cvpr
inci
des
Elo
ps s
auru
s 0
:"
15
15
15
15
1,
100
100
100
Glo
ssog
obiu
s °
0 10
10
10
10
ca
~5
~5
-1~
~,
4,
4,
100
100
giur
us
Mac
rooo
dus
0 -"
~o
'0
40
~
,0
:0
4O
100
lOO
100
I
~J!llilnllS
Aol
ochi
lllS
line
atll
s :0
::-.:
,0
_'0
30
)0
:;0
30
45
10
0 10
0 10
0
Gam
busi
a af
fini
s 0
JO
.'0
30
30
-'0
:0
Jj
100
100
100
Tac
hYsu
rus
la :;0
30
3
0
30
30
3
0
70
100
80
,00
mac
ulat
us
Tilu
12ia
mos
sam
bica
0
;0
,0
:0
:0
~o
;0
00
10
0 70
10
0
Ooh
icht
hys
boro
0
:0
::~
~5
~5
25
25
45
100
70
100
0. m
lcro
cenh
alus
0
10
:0
:0
:0
~o
:0
40
100
50
100
P in
dicu
s (P
ra\\T
I )
30
:;0
30
30
100
100
Vil
lont
a (C
lam
) ~
.10
100
10
10
0
~;yprinojdcs
Con
trol
-_
.-
-N
o m
orta
lity
56
Among individuals of the postlarvae of Penaeus
indicus exposed to different concentrations of mahua oil cake, no
mortality was recorded in 150 ppm during the 96 hours of
observation. While 65% of the individuals died during the same
period in the medium containing a higher concentration (200 ppm),
of mahua oil cake, absolute mortality occurred during 48 to 96
hours following exposure to 250 ppm. Absolute mortality was
found to set in 24 hours earlier in the medium containing 300 ppm
of the cake.
Post larvae of P. indicus exposed to selected
concentrations of croton seed showed varying levels of tolerance
as depicted by their complete survival in 2 ppm, 40% mortality in
3 ppm and absolute mortality in 4 ppm and 5 ppm (Table ll.b).
None of the individuals died within 48 hours in the medium
containing 3 ppm and 4 ppm of croton whereas an early (within 48
hours) onset of mortality was noticed when exposed to 5 ppm
croton seed.
4.2.1.2.3 Villorita cyprinoides
No lethal effect was encountered among individuals of
the clam species, Yillorit~ cyprinoides when subjected to 150 ppm
and 200 ppm of mahua oil cake under field conditions. However,
all individuals of the species died within 72 to 96 hours in a
higher concentration of 250 ppm (Table ll.a). The medium
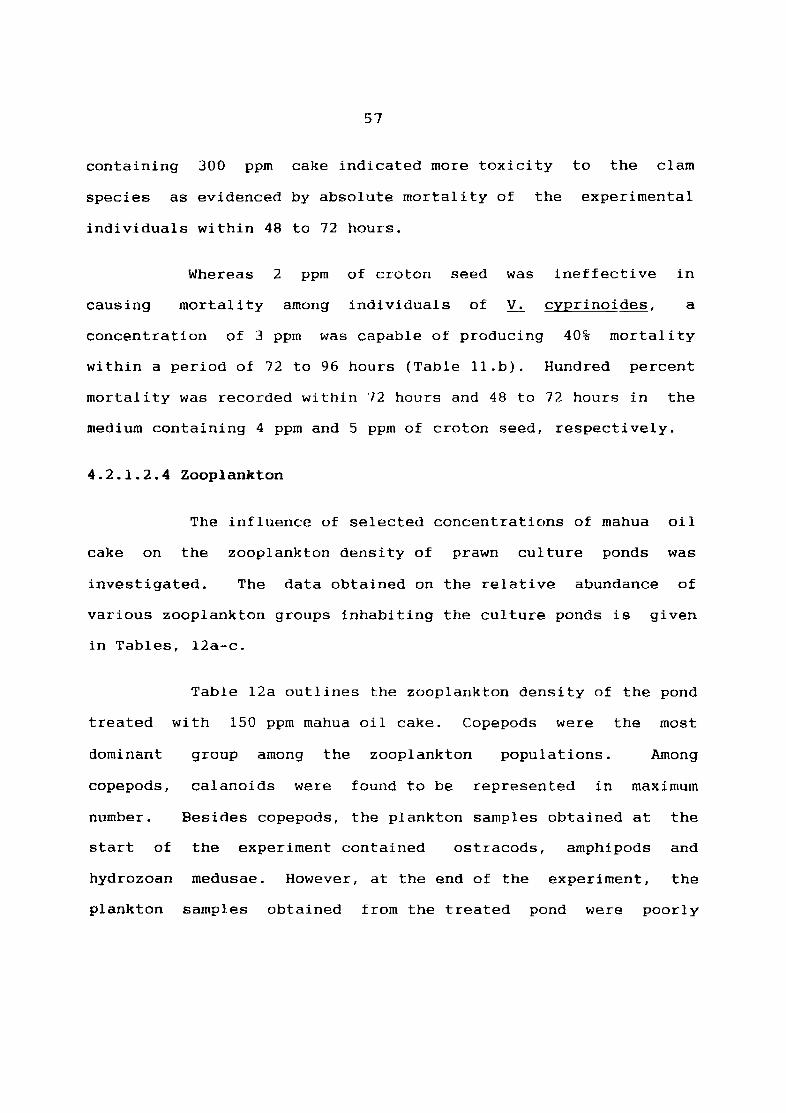
57
containing 300 ppm cake indicated more toxicity to the clam
species as evidenced by absolute mortality of the experimental
individuals within 48 to 72 hours.
Whereas 2 ppm of croton seed was ineffective in
causing mortality among individuals of ~ cyprinoides, a
concentration of 3 ppm was capable of producing 40% mortality
within a period of 72 to 96 hours (Table ll.b). Hundred percent
mortality was recorded within 72 hours and 48 to 72 hours in the
medium containing 4 ppm and 5 ppm of croton seed, respectively.
4.2.1.2.4 Zoop1ankton
The influence of selected concentrations of mahua oil
cake on the zooplankton density of prawn culture ponds was
investigated. The data obtained on the relative abundance of
various zooplankton groups inhabiting the culture ponds is given
in Tables, 12a-c.
Table 12a outlines the zooplankton density of the pond
treated with 150 ppm mahua oil cake. Copepods were the most
dominant group among the zooplankton populations. Among
copepods, calanoids were found to be represented in maximum
number. Besides copepods, the plankton samples obtained at the
start of the experiment contained ostracods, amphipods and
hydrozoan
plankton
medusae. However, at the end of the experiment, the
samples obtained from the treated pond were poorly
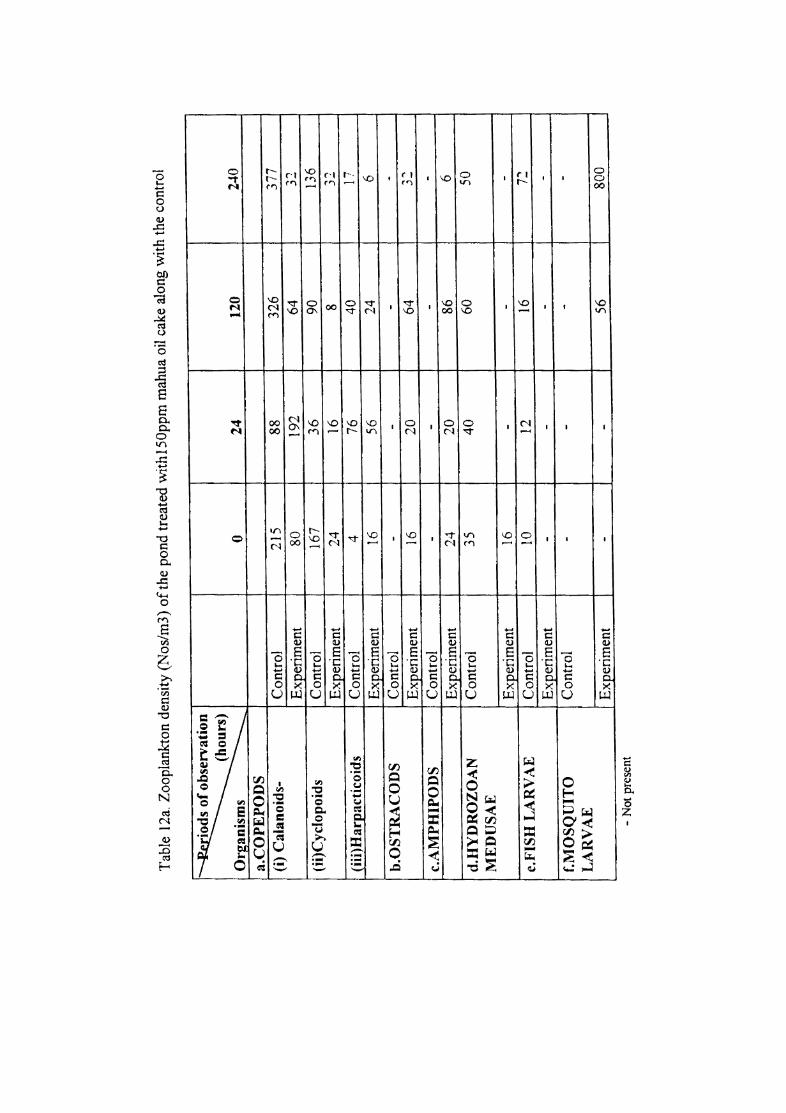
Tab
le 1
2a.
Zoo
plan
kton
den
sity
(N
os/m
3) o
f the
pon
d tr
eate
d w
ith1
50pp
m m
ahua
oil
cake
alo
ng w
ith
the
cont
rol
'~
(hou
rs)
Or~anisms
0 24
12
0 U
O
a.C
OP
EP
OD
S
(i)
Cal
anoi
ds-
Con
trol
21
5 88
32
6 37
7
Exp
erim
ent
80
192
64
.... ,.,
:>..:.
(ii)
Cyc
lopo
ids
Con
trol
16
7 36
90
13
6 E
xper
imen
t 24
16
8
....
.., :>..:.
(iiO
Har
pact
icoi
ds
Con
trol
4
76
40
17
Exp
erim
ent
16
56
24
6 I
b.O
ST
RA
CO
DS
C
ontr
ol
--
--
Exp
erim
ent
16
20
64
........
-'
-c.
AM
PH
IPO
DS
C
ontr
ol
--
--
Exp
erim
ent
24
20
86
6 d.
HY
DR
OZ
OA
N
Con
trol
35
4
0
60
50
ME
DU
SA
E
Exp
erim
ent
16
--
-e.
FIS
H L
A R
V A
E
Con
trol
10
12
16
7'2
Exp
erim
ent
--
--
f.M
OS
QU
ITO
C
ontr
ol
--
--
LA
RV
AE
_
_ Exp~riment_
--
56
800
-_
.
--
-N
ot p
rese
nt
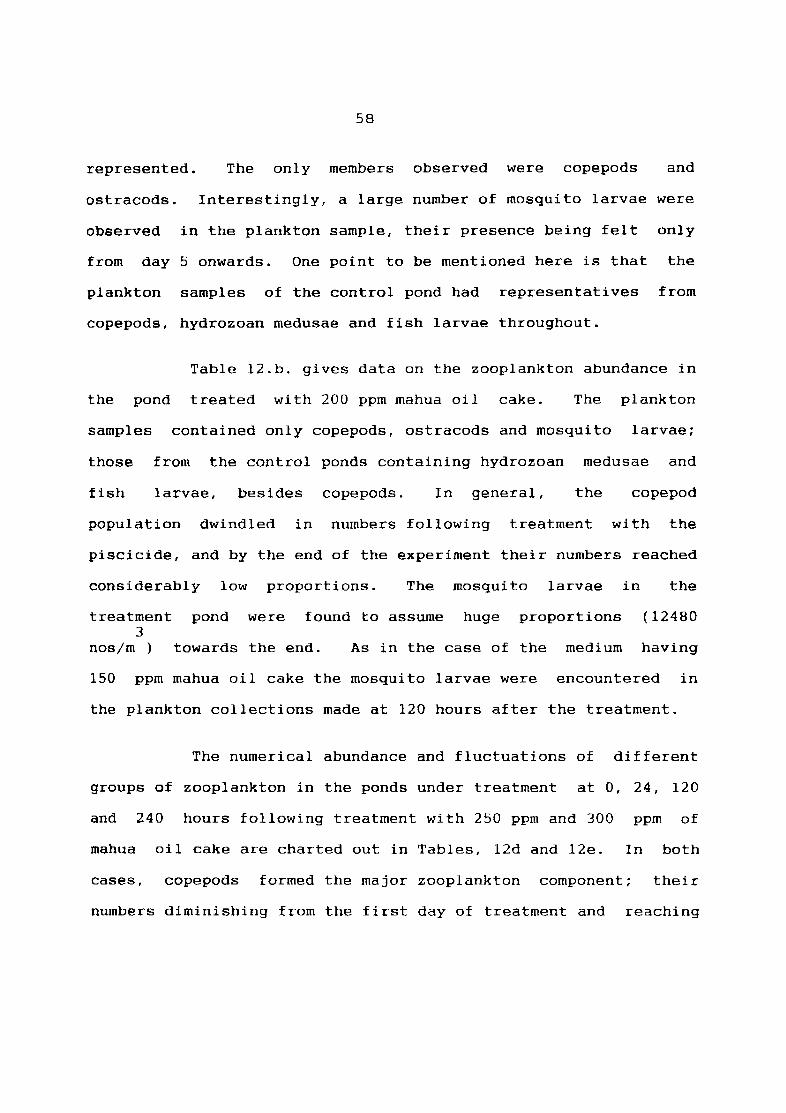
58
represented. The only members observed were copepods and
ostracods. Interestingly, a large number of mosquito larvae were
observed in the plankton sample, their presence being felt only
from day 5 onwards. One point to be mentioned here is that the
plankton samples of the control pond had representatives from
copepods, hydrozoan medusae and fish larvae throughout.
Table 12.b. gives data on the zooplankton abundance in
the pond treated with 200 ppm mahua oil cake. The plankton
samples contained only copepods, ostracods and mosquito larvae;
those from the control ponds containing hydrozoan medusae and
fish larvae, besides copepods. In general, the copepod
population dwindled in numbers following treatment with the
piscicide, and by the end of the experiment their numbers reached
considerably low proportions. The mosquito larvae in the
treatment pond were found to assume huge proportions (12480 3
nos/m) towards the end. As in the case of the medium having
150 ppm mahua oil cake the mosquito larvae were encountered in
the plankton collections made at 120 hours after the treatment.
The numerical abundance and fluctuations of different
groups of zooplankton in the ponds under treatment at 0, 24, 120
and 240 hours following treatment with 250 ppm and 300 ppm of
mahua oil cake are charted out in Tables, 12d and 12e. In both
cases, cope pods formed the major zooplankton component; their
numbers diminishing from the first day of treatment and reaching
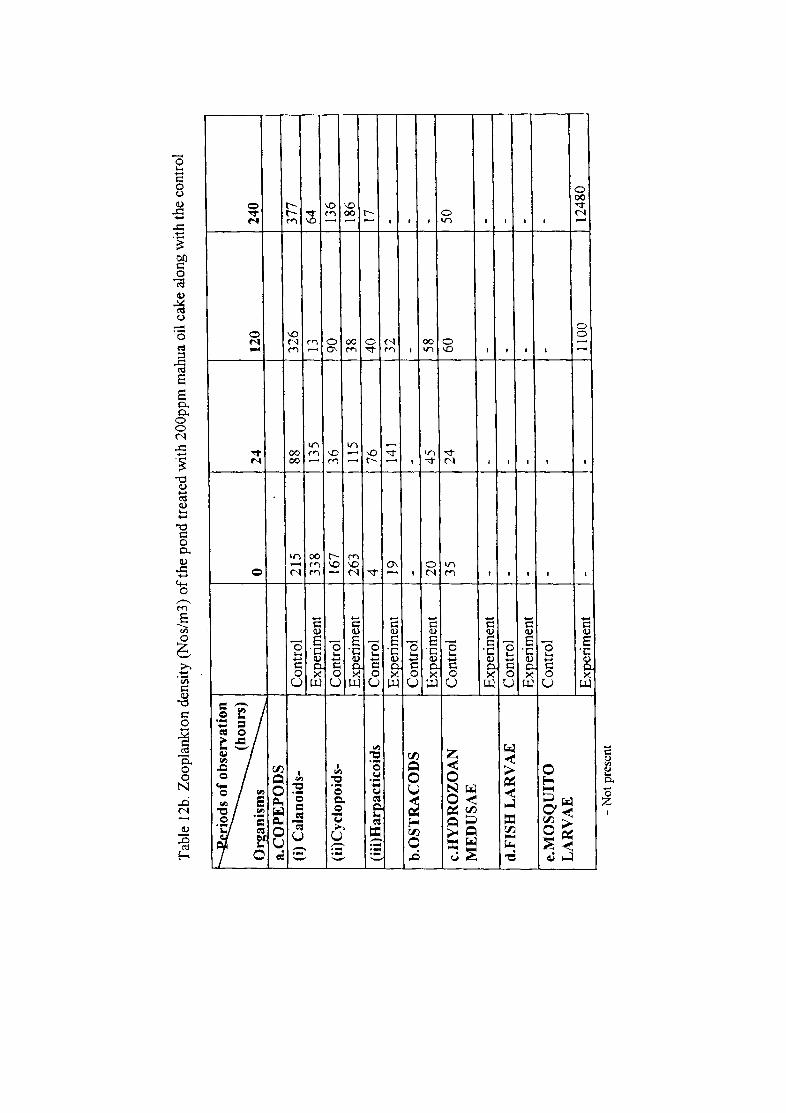
Tab
le 1
2b_
Zoo
plan
kton
den
sity
(N
os/m
3) o
fth
e po
nd t
reat
ed w
ith
200p
pm m
ahua
oil
cake
alo
ng w
ith
the
cont
rol
~
(hou
rs)
Org
anis
ms
0 24
12
0 24
0 a.
CO
PE
PO
DS
(i
) C
alan
oid
s-C
ontr
ol
215
88
326
377
Exp
erim
ent
338
135
13
64
( ii)
Cyc
lop
oid
s-C
ontr
ol
167
36
90
136
I
Exp
erim
ent
263
115
38
186
,
(iii
)Har
pac
tico
ids
Con
trol
4
76
40
17
Exp
erim
ent
19
141
32
-I
b.O
ST
RA
CO
DS
C
ontr
ol
--
--
Exp
erim
ent
20
45
58
-I
c.H
YD
RO
ZO
AN
C
ontr
ol
35
24
60
50
ME
DU
SA
E
Exp
erim
ent
--
--
d.F
ISH
LA
RV
AE
C
ontr
ol
--
--
Exp
erim
ent
--
--
e.M
OS
QU
ITO
C
ontr
ol
--
--
LA
RV
AE
_
__
__
.. _
---,_ExQerimen~
--
1100
12
480
--
--
-N
ot p
rese
nt
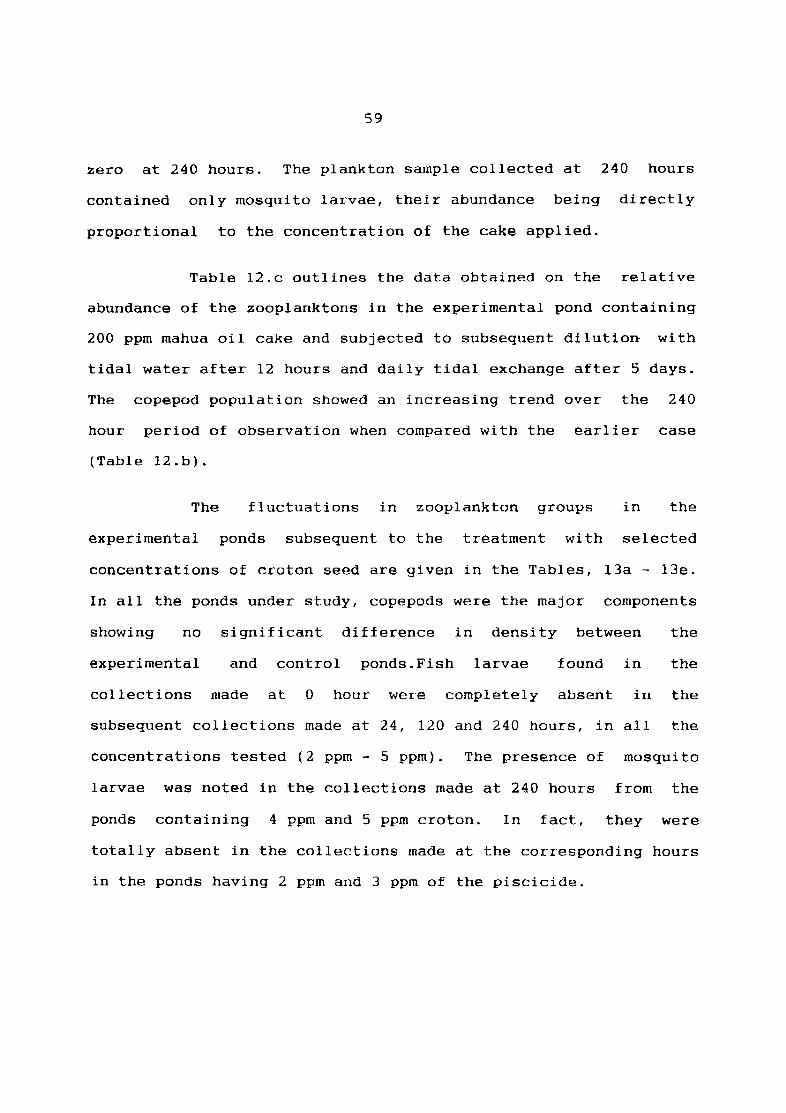
59
zero at 240 hours. The plankton sample collected at 240 hours
contained only mosquito larvae, their abundance being directly
proportional to the concentration of the cake applied.
Table l2.c outlines the data obtained on the relative
abundance of the zooplanktons in the experimental pond containing
200 ppm mahua oil cake and subjected to subsequent dilution with
tidal water after 12 hours and daily tidal exchange after 5 days.
The copepod population showed an increasing trend over the 240
hour period of observation when compared with the earlier case
(Table 12.b).
The fluctuations in zooplankton groups in the
experimental ponds subsequent to the treatment with selected
concentrations of croton seed are given in the Tables, 13a - 13e.
In all the ponds under study, copepods were the major components
showing no significant difference in density between
experimental and control ponds.Fish larvae found in
the
the
collections made at 0 hour were completely absent in the
subsequent collections made at 24, 120 and 240 hours, in all the
concentrations tested (2 ppm - 5 ppm). The presence of mosquito
larvae was noted in the collections made at 240 hours from the
ponds containing 4 ppm and 5 ppm croton. In fact, they were
totally absent in the collections made at the corresponding hours
in the ponds having 2 ppm and 3 ppm of the piscicide.
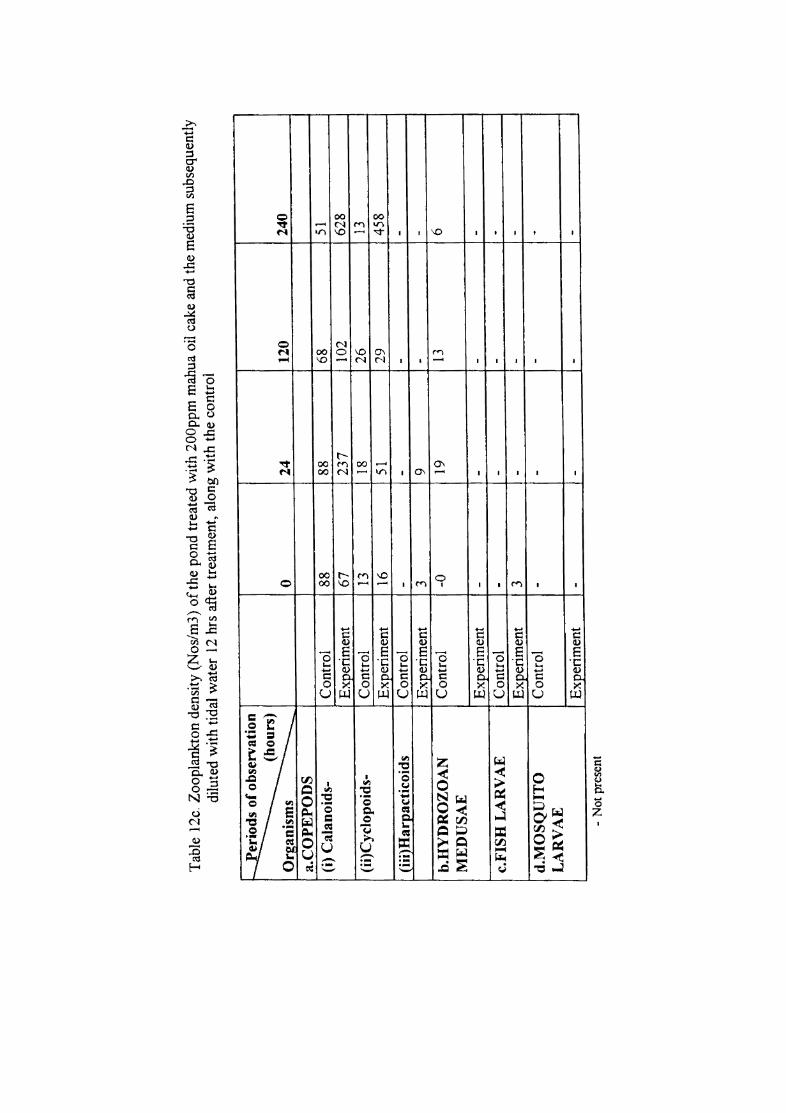
Tab
le 1
2c.
Zoo
plan
kton
den
sity
(N
os/m
3) o
f the
pon
d tr
eate
d w
ith
200p
pm m
ahua
oil
cake
and
the
med
ium
sub
sequ
entl
y di
lute
d w
ith
tidal
wat
er 1
2 hr
s af
ter
trea
tmen
t, a
long
wit
h th
e co
ntro
l
~
(hou
rs)
Org
anis
ms
0 24
12
0 24
0 a.
CO
PE
PO
DS
(i
) C
alan
oid
s-C
ontr
ol
88
88
68
51
Exp
erim
ent
67
237
102
628
(ii)
Cyc
lop
oid
s-C
ontr
ol
13
18
26
13
Exp
erim
ent
16
51
29
458
(iii
)Har
pac
tico
ids
Con
trol
-
--
-E
xper
imen
t 3
9 -
-b
.HY
DR
OZ
OA
N
Con
trol
-0
19
13
6
ME
DU
SA
E
Exp
erim
ent
--
--
I c.F
ISH
LA
RV
AE
C
ontr
ol
--
--
Exp
erim
ent
3 -
--
d.M
OS
QU
ITO
C
ontr
ol
--
--
LA
RV
AE
E
xper
imen
t -
--
--
-
-N
ot p
rese
nt
I
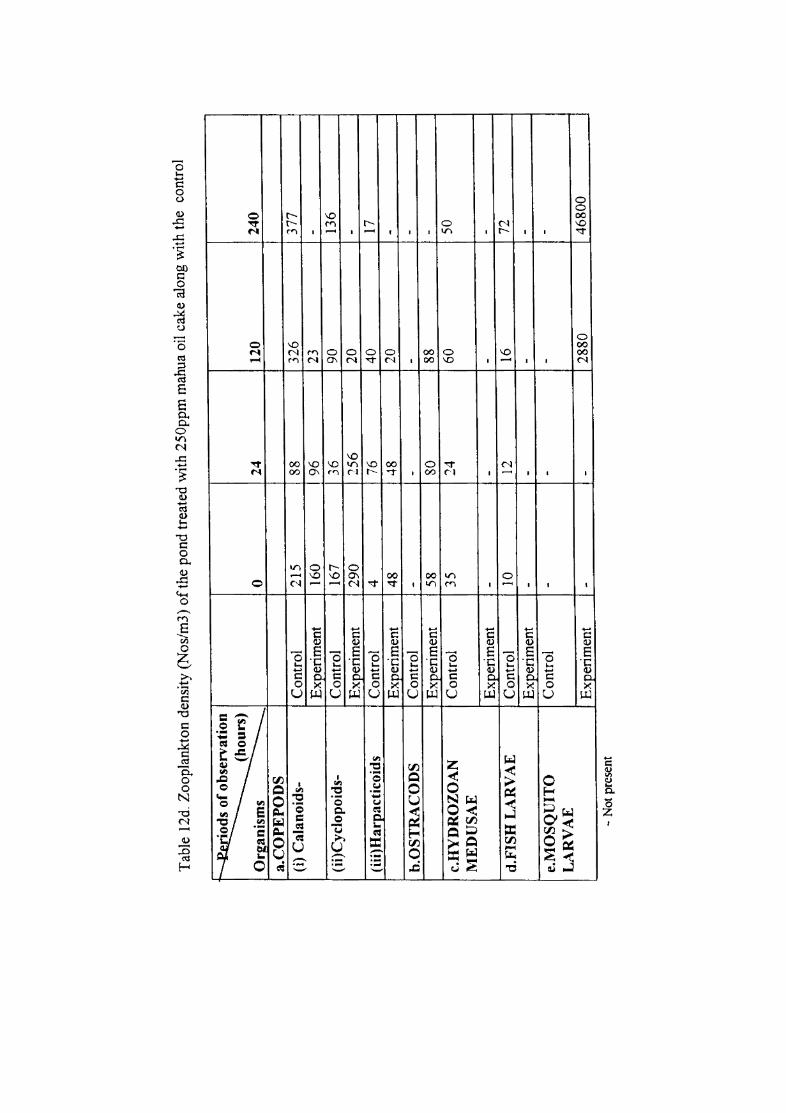
Tab
le 1
2d.
Zoo
plan
kton
den
sity
(N
os/m
3) o
f the
pon
d tr
eate
d w
ith
250p
pm m
ahua
oil
cake
alo
ng w
ith
the
cont
rol
~
(ho
urs
) O
rgan
ism
s 0
24
120
240
a.C
OP
EP
OD
S
(i)
Cal
anoi
ds-
Con
trol
21
5 88
32
6 37
7 E
xper
imen
t 16
0 96
23
-
( ii)
Cyc
lopo
ids-
Con
trol
16
7 36
90
13
6 Ex
~eri
ment
29
0 25
6 20
,
-I
( iii
)Har
pact
icoi
ds
Con
trol
4
76
40
17
I
Exp
erim
ent
48
48
20
-I
b.O
ST
RA
CO
DS
C
ontr
ol
--
--
Exp
erim
ent
58
SO
88
-c.
HY
DR
OZ
OA
N
Con
trol
35
24
60
50
M
ED
US
AE
E
xper
imen
t -
--
-d
.FIS
H L
AR
V A
E
Con
trol
10
12
16
72
E
xper
imen
t -
--
-e.
MO
SQ
UIT
O
Con
trol
-
--
-L
AR
VA
E
Exp
erim
ent
--
2880
46
800
--
---
L __
_ -
-N
ot p
rese
nt
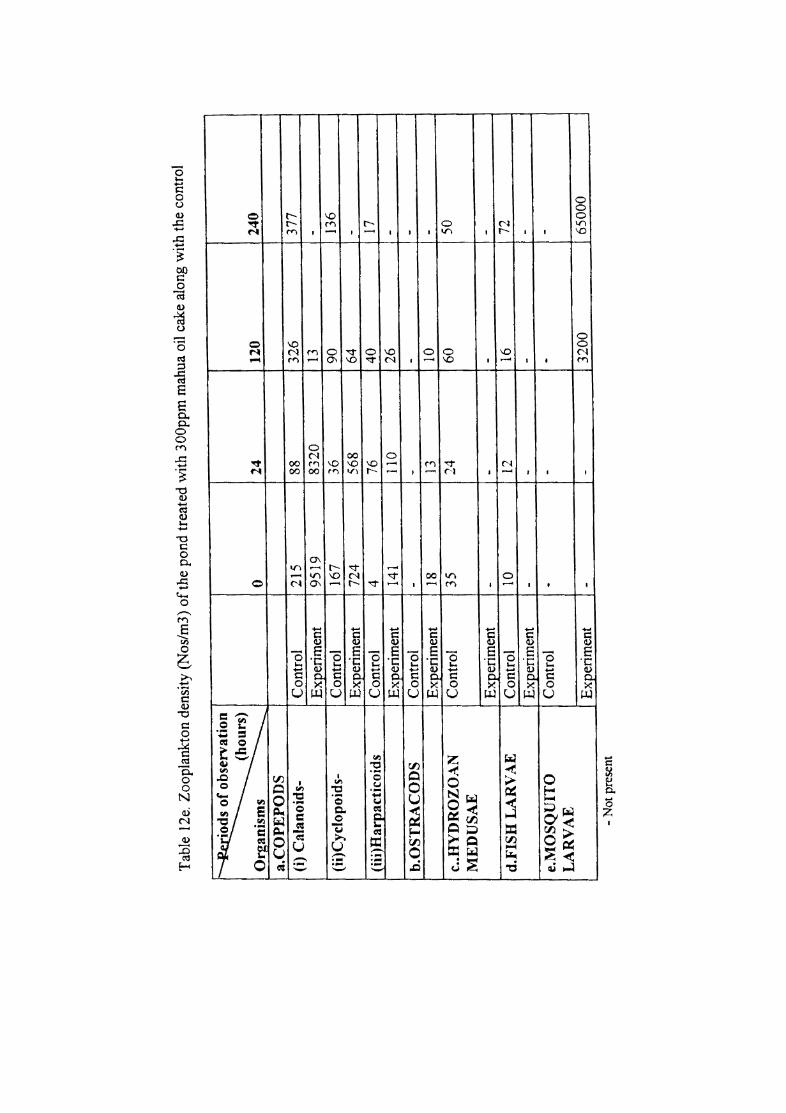
Tab
le 1
2e.
Zoo
plan
kton
den
sity
(N
os/m
3) o
f the
pon
d tr
eate
d w
ith
300p
pm m
ahua
oil
cake
alo
ng w
ith
the
cont
rol
~
(hou
rs)
Org
anis
ms
0 24
12
0 24
0 a.
CO
PE
PO
DS
(i
) C
alan
oid
s-C
ontr
ol
215
88
326
377
Exp
erim
ent
9519
83
20
13
-(i
i)C
yclo
poi
ds-
Con
trol
16
7 36
90
13
6 E
xper
imen
t 72
4 56
8 64
-
(iii
)Har
pac
tico
ids
Con
trol
4
76
40
17
Exp
erim
ent
141
110
26
-b
.OS
TR
AC
OD
S
Con
trol
-
--
-E
xper
imen
t 18
13
10
-
c .. H
YD
RO
ZO
AN
C
ontr
ol
35
24
60
50
I
ME
DU
SA
E
I
Exp
erim
ent
--
--
d.F
ISH
LA
RV
AE
C
ontr
ol
10
12
16
72
Exp
erim
ent
--
--
e.M
OS
QU
ITO
C
ontr
ol
--
--
LA
RV
AE
E
xper
imen
t _
_ -
-32
00
6500
0 ---
--
----
--
-----
---
----
--
-N
ot p
rese
nt
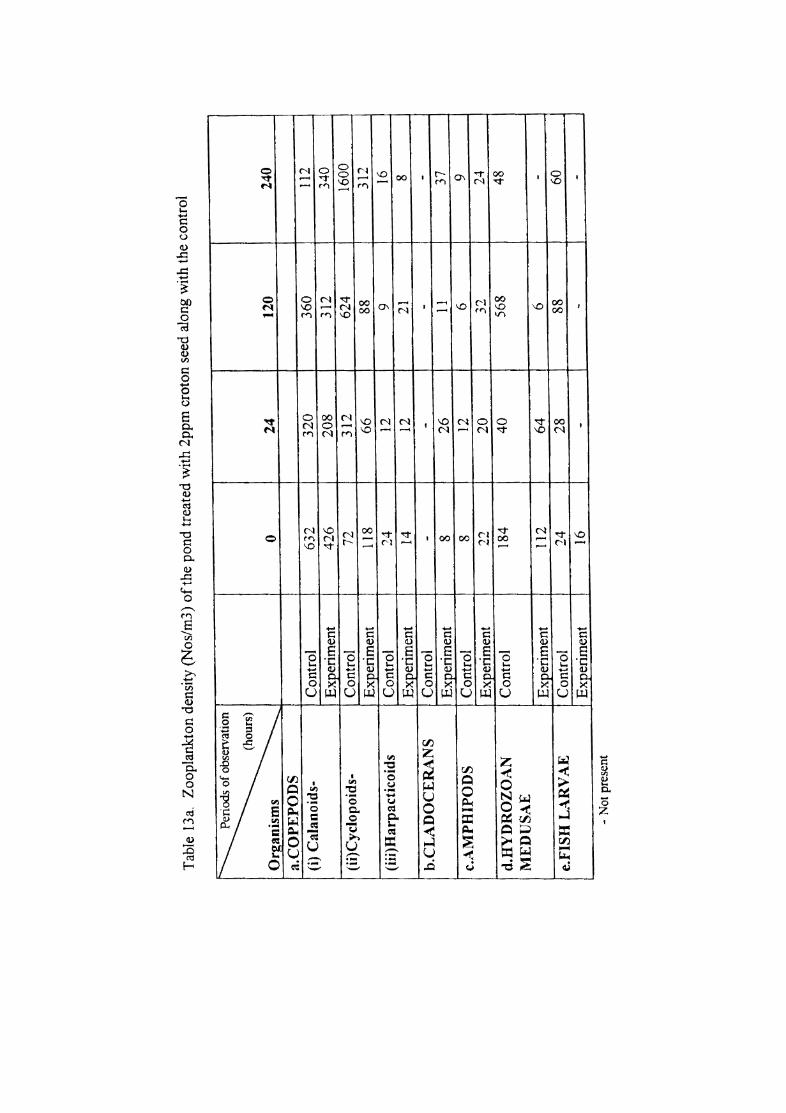
Tab
le l
3a.
Zoo
plan
kton
den
sity
(N
os/m
3) o
f the
pon
d tr
eate
d w
ith
2ppm
cro
ton
seed
alo
ng w
ith
the
cont
rol
~
(hou
rs)
Or~anisms
0 24
12
0 24
0 a.
CO
PE
PO
DS
(i
) C
alan
oid
s-C
ontr
ol
632
320
360
112
Exp
erim
ent
426
208
312
340
(ii)
Cyc
Iop
oid
s-C
ontr
ol
72
312
624
1600
E
xper
imen
t 11
8 66
88
31
2 ( i
ii)H
arp
acti
coid
s C
ontr
ol
24
12
9 16
E
xper
imen
t 14
12
21
8
b.C
LA
DO
CE
RA
NS
C
ontr
ol
--
--
I
Exp
erim
ent
8 26
11
37
c.A
MP
HIP
OD
S
Con
trol
8
12
6 9
Exp
erim
ent
22
20
... "
~-
24
d.H
YD
RO
ZO
AN
C
ontr
ol
184
40
56
8 48
M
ED
US
AE
E
xper
imen
t 11
2 64
6
-e.
FIS
H L
AR
V A
E
Con
trol
24
2
8
88
60
Exp
erim
ent
16
--
--
Not
pre
sent
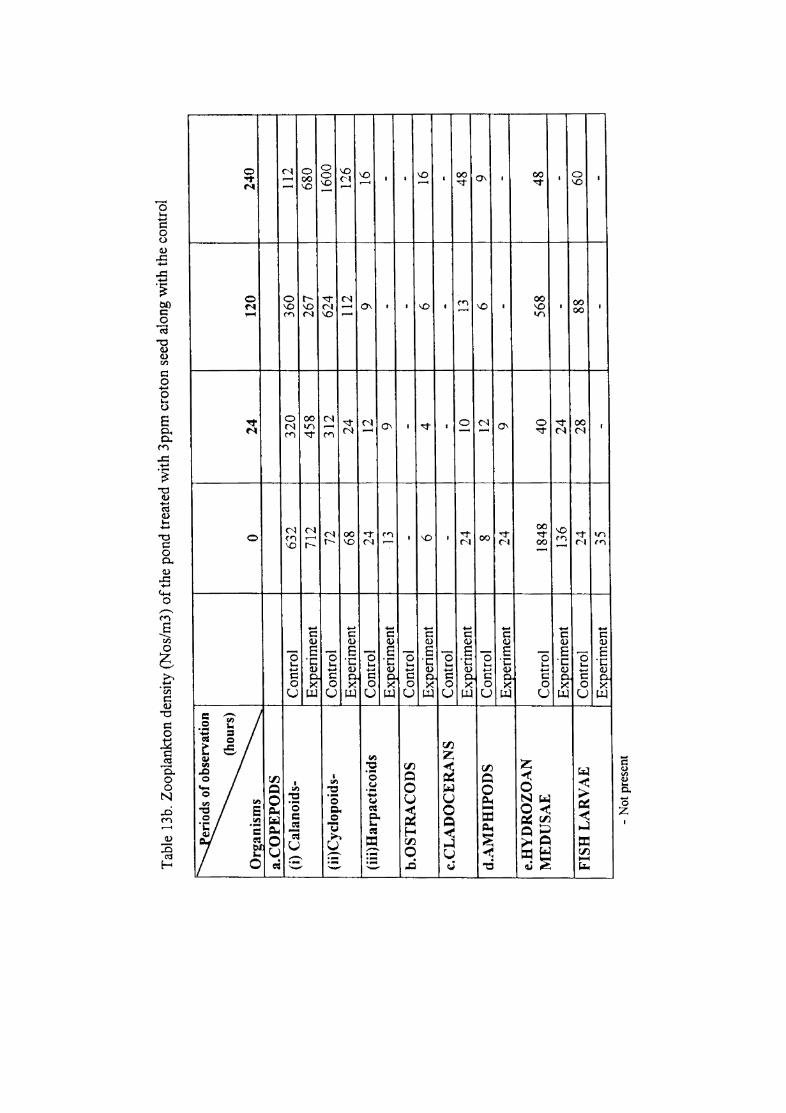
Tab
le l
3b.
Zoo
plan
kton
den
sity
(N
os/m
3) o
f the
pon
d tr
eate
d w
ith
3ppm
cro
ton
seed
alo
ng w
ith
the
cont
rol
~
(hou
rs)
Org
anis
ms
0 24
12
0 24
0 a.
CO
PE
PO
DS
(i
) C
alan
oids
-C
ontr
ol
632
320
360
112
Exp
erim
ent
712
458
267
680
( ii)
Cyc
lopo
ids-
Con
trol
72
31
2 62
4 16
00
Exp
erim
ent
68
24
112
126
(iii
)Har
pact
icoi
ds
Con
trol
24
12
9
16
Exp
erim
ent
13
9 -
-I
b.O
ST
RA
CO
DS
C
ontr
ol
--
--
Exp
erim
ent
6 4
6 16
c.
CL
AD
OC
ER
AN
S
Con
trol
-
--
-E
xper
imen
t 24
10
13
48
d
.AM
PH
IPO
DS
C
ontr
ol
8 12
6
9
Exp
erim
ent
24
9 -
-e.
HY
DR
OZ
OA
N
ME
DU
SA
E
Con
trol
18
48
40
568
48
Exp
erim
ent
136
24
--
FIS
H L
AR
VA
E
Con
trol
24
28
88
60
E~riment
35
--
-.. _--
_.
-N
ot p
rese
nt
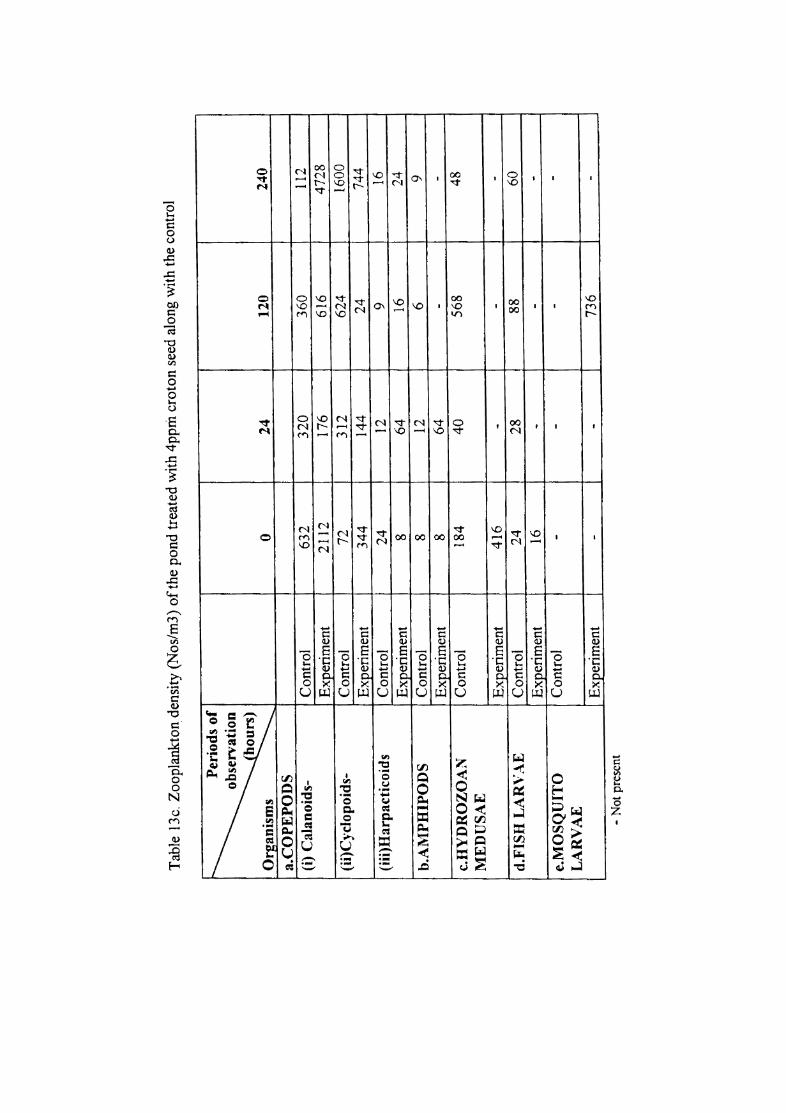
Tab
le 1
3c.
Zoo
plan
kton
den
sity
(N
os/m
3) o
f the
pon
d tr
eate
d w
ith 4
ppm
cro
ton
seed
alo
ng w
ith
the
cont
rol
~
obse
rvat
ion
hour
s)
Or~anisms
0 24
12
0 24
0 a.
CO
PE
PO
DS
(i
) C
alan
oids
-C
ontr
ol
632
320
360
112
Exp
erim
ent
2112
17
6 61
6 47
28
(ii)
Cyc
lopo
ids-
Con
trol
72
31
2 62
4 16
00
Exp
erim
ent
344
144
24
744
(iii
)Har
pact
icoi
ds
Con
trol
24
12
9
16
J Ex
~eri
ment
8
64
16
24
b.A
MP
HIP
OD
S
Con
trol
8
12
6 9
Exp
erim
ent
8 64
-
-c.
HY
DR
OZ
OA
N
Con
trol
18
4 40
56
8 48
M
ED
US
AE
E
xper
imen
t 41
6 -
--
d.F
ISH
LA
RV
AE
C
ontr
ol
24
28
88
60
Exp
erim
ent
16
--
-e.
MO
SQ
UIT
O
Con
trol
-
--
-L
AR
VA
E
Exp
erim
ent
--
736
-.0
-0
_-
--
----
--..
-
-N
ot p
rese
nt
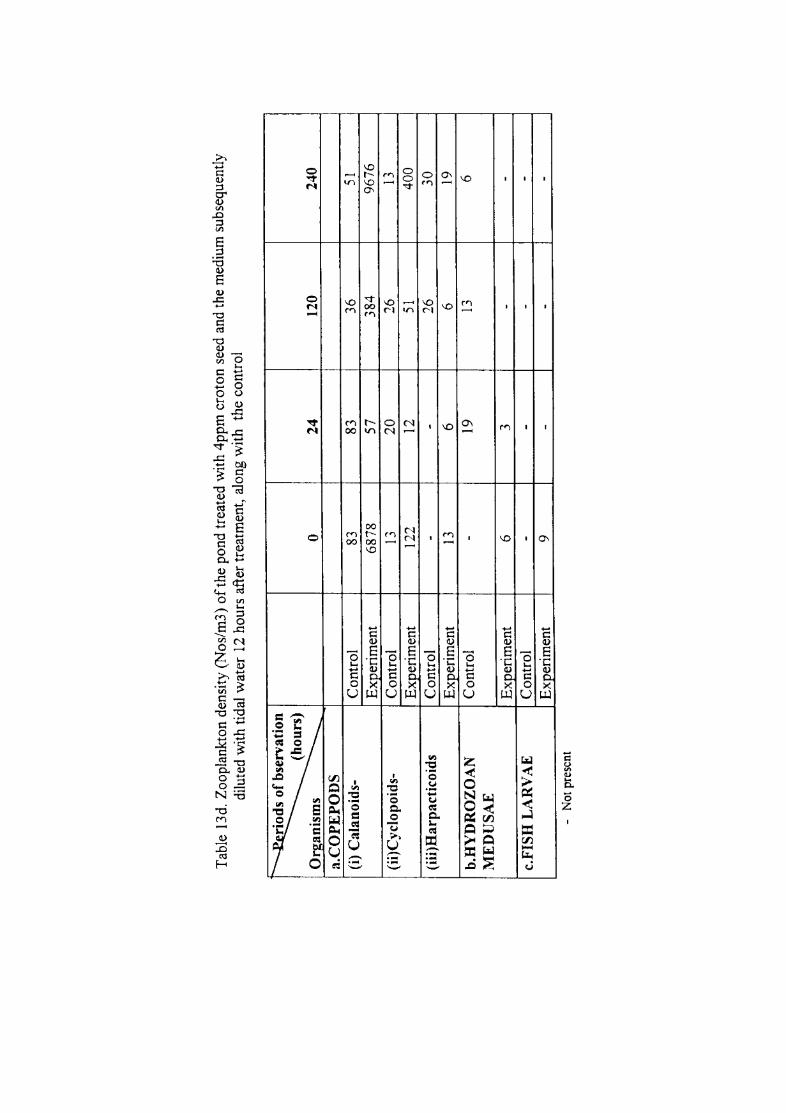
Tab
le 1
3d.
Zoo
plan
kton
den
sity
(N
os/m
3) o
f th
e po
nd t
reat
ed w
ith
4p
pm
cro
ton
see
d an
d th
e m
ediu
m s
ubse
quen
tly
dilu
ted
wit
h ti
dal
wat
er 1
2 ho
urs
afte
r tr
eatm
ent,
alo
ng w
ith
the
cont
rol
~n
(hou
rs)
Org
anis
ms
0 24
12
0 24
0 a.
CO
PE
PO
DS
(i)
Cal
anoi
ds-
Con
trol
83
83
36
51
E
xp_e
rim
ent
6878
57
38
4 96
76
(ii)
Cyc
lopo
ids-
Con
trol
13
20
26
13
E
xper
imen
t 12
2 12
51
40
0 (i
ii)H
arpa
ctic
oids
C
ontr
ol
--
26
30
Exp
erim
ent
13
6 6
19
b.H
YD
RO
ZO
AN
C
ontr
ol
-19
13
6
ME
DU
SA
E
Exp
erim
ent
6 3
--
c.F
ISH
LA
RV
AE
C
ontr
ol
--
--
Exp
erim
ent
9 -
--
--
-----
---
-N
ot p
rese
nt
-
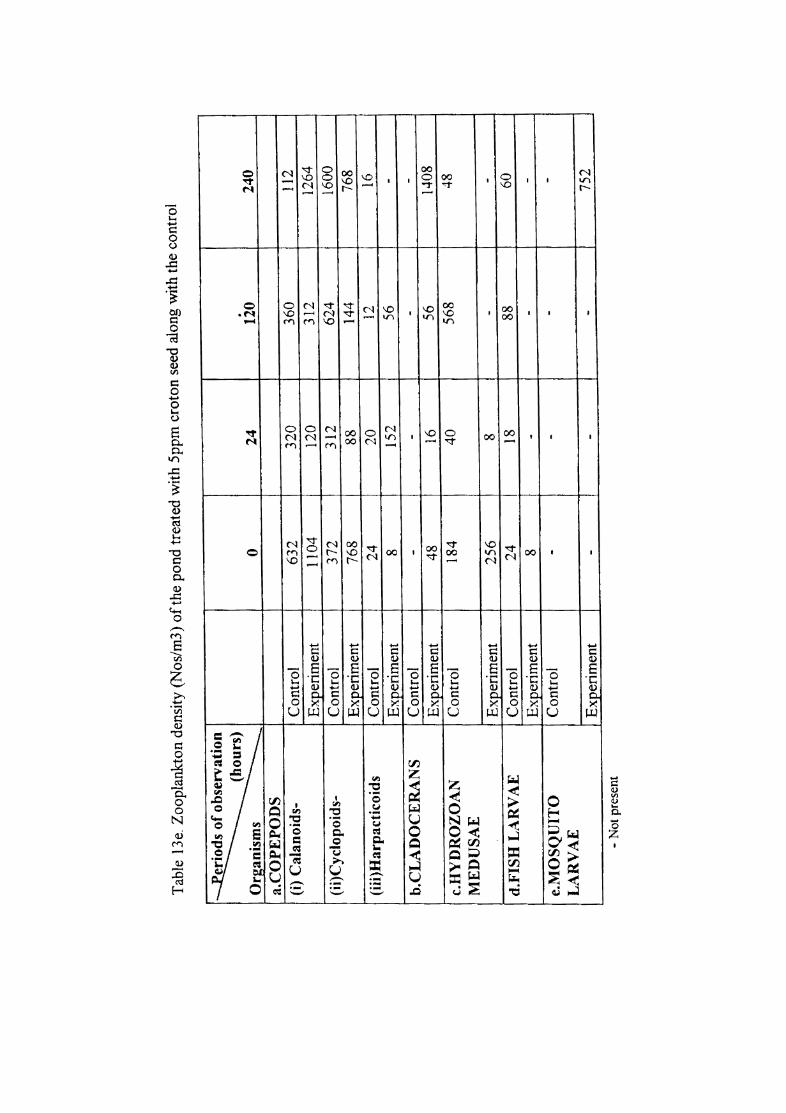
Tab
le 1
3e.
Zoo
plan
kton
den
sity
(N
os/m
3) o
f the
pon
d tr
eate
d w
ith
5ppm
cro
ton
seed
alo
ng w
ith
the
cont
rol
!~
(hou
rs)
. Or~anisms
0 24
12
0 24
0 a.
CO
PE
PO
DS
(i
) C
alan
oid
s-C
ontr
ol
632
320
360
112
Exp
erim
ent
1104
12
0 31
2 12
64
( ii)
Cyc
lop
oid
s-C
ontr
ol
372
312
624
l600
E
xper
imen
t 76
8 88
14
4 76
8 (i
ii)H
arp
acti
coid
s C
ontr
ol
24
20
12
16
J
Exp
erim
ent
8 15
2 56
~
i
b.C
LA
DO
CE
RA
NS
C
ontr
ol
I -
-~
-E
xper
imen
t 48
16
56
l4
08
c.H
YD
RO
ZO
AN
C
ontr
ol
184
40
568
48
ME
DU
SA
E
Exp
erim
ent
256
8 -
~
d.F
ISH
LA
RV
AE
C
ontr
ol
24
18
88
60
Exp
erim
ent
8 -
--
e.M
OS
QU
ITO
C
ontr
ol
--
--
LA
RV
AE
~xperiment
--
-75
2 .-
---_
.
-----
.._
-----
----"-
-N
ot p
rese
nt
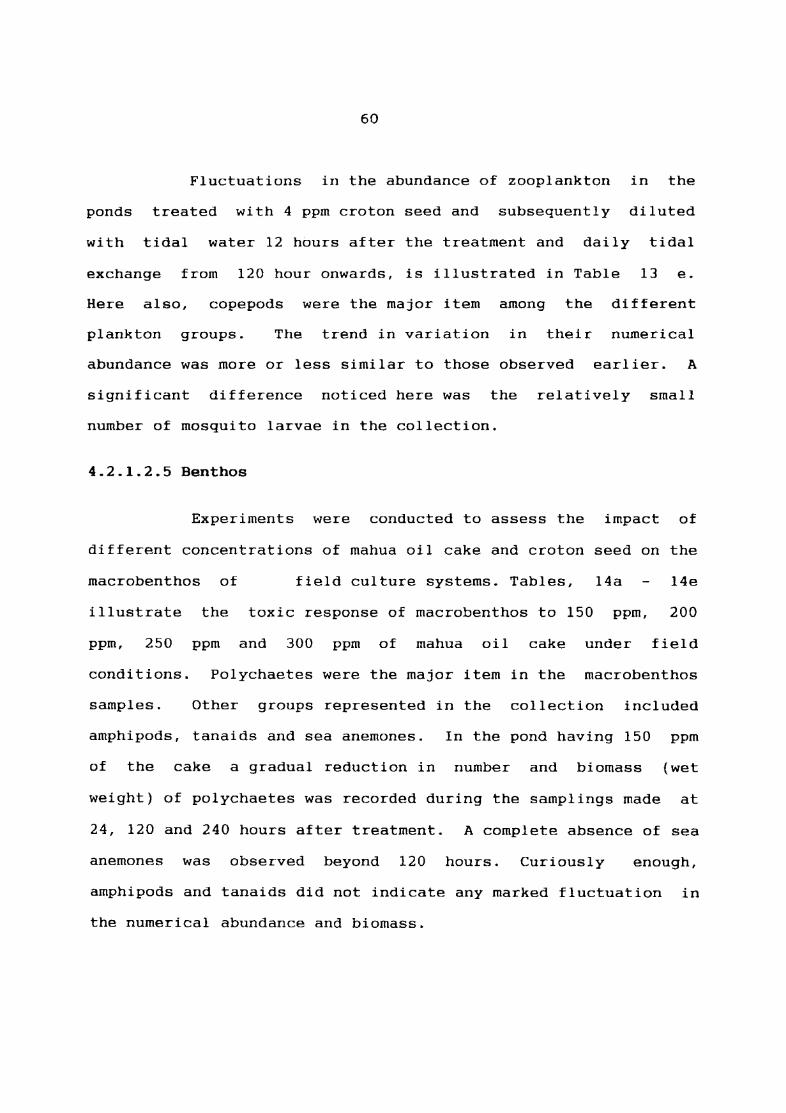
60
Fluctuations in the abundance of zooplankton in the
ponds treated with 4 ppm croton seed and subsequently diluted
with tidal water 12 hours after the treatment and daily tidal
exchange from 120 hour onwards, is illustrated in Table 13 e.
Here also, cope pods were the major item among the different
plankton groups. The trend in variation in their numerical
abundance was more or less similar to those observed earlier. A
significant difference noticed here was the relatively small
number of mosquito larvae in the collection.
4.2.1.2.5 Benthos
Experiments were conducted to assess the impact of
different concentrations of mahua oil cake and croton seed on the
macrobenthos of
illustrate the
ppm, 250 ppm
field culture systems. Tables, l4a 14e
toxic response of macrobenthos to 150 ppm, 200
and 300 ppm of mahua oil cake under field
conditions. Polychaetes were the major item in the macrobenthos
samples. Other groups represented in the collection included
amphipods, tanaids and sea anemones. In the pond having 150 ppm
of the cake a gradual reduction in number and biomass (wet
weight) of polychaetes was recorded during the samplings made at
24, 120 and 240 hours after treatment. A complete absence of sea
anemones was observed beyond 120 hours. Curiously enough,
amphipods and tanaids did not indicate any marked fluctuation in
the numerical abundance and biomass.
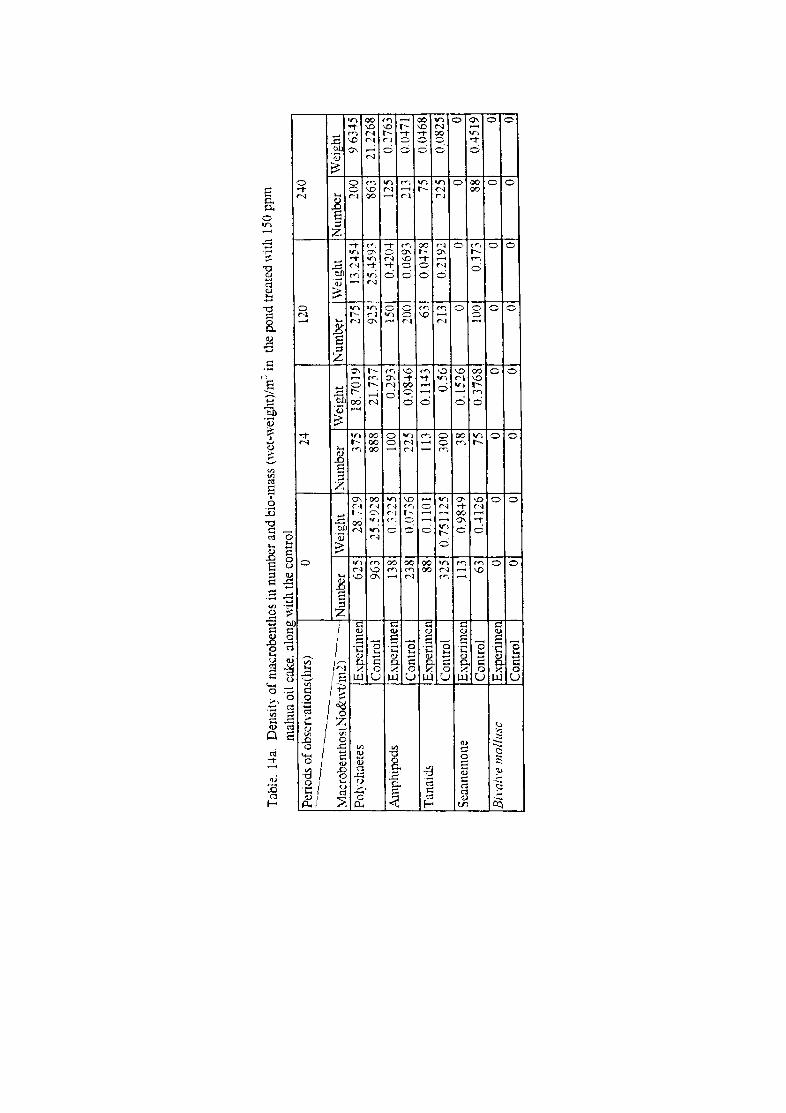
Tab
le.
14a.
D
ensi
ty o
f m
acro
bent
hos
in n
umbe
r an
d b
ie-m
ass
(wet
-wei
ght)
/m:
in t
he p
ond
trea
ted
\\1t
h 15
0 p
pm
m
ahu
a oi
l ca
ke.
alo
ng
wit
h th
e co
ntro
l -
Per
iods
of
obse
rvat
ions
(hrs
) 0
24
120
240
--~-
----
----
--------~
Y1a
crob
enth
os(N
o&"i
!m2)
~---
Num
ber
\Vei
ght
:\u
mb
er
Wei
ght
Num
ber
Wei
ght
Num
ber
Wei
ght
Pol
ychn
etes
E
xper
imen
62
5 28
.i29
37
5 18
.701
9 2.7
5 13
.2-1-5
-1-20
0 9.
6345
C
ontr
ol
963
25.5
928
888
21.7
37
925
25.+
593
863
21.2
268
Am
phip
ods
Expcrjm~
138
lU22
5 lO
O 0.
293
150
0.42
0-1-
125
0.27
631
Con
trol
23
8 O
.Oi3
6 22
.5
0.08
46
200
0.06
93
213
0.04
71
Tan
aids
E:
\-pe
rim~
88
0.
1101
11
3 0.
1143
63
0.
0478
75
0.
0468
1
Con
trol
:1
25
0.75
1125
30
0 0.
56
213
0.21
92
225
0.08
25!
Sea
anem
one
Exp
crim
en
113
0.98
49
38
0.15
26
0 0
0 0
Con
trol
63
O
A12
6 75
0.
3768
10
0 0.
373
88
0.+5
19
Bim
h'e
mol
lusc
E
xper
imen
0
0 0
0 0
0 0
0
~ontrol
0 0
0 0
0 0
0 0
--
-.-
--
--

I
Tab
le.
14b.
D
ensi
ty o
f mac
robe
ntho
s in
num
ber
and
bio-
mas
s (w
et-w
eigh
t)/m
' in
the
pon
d tr
eate
d \v
ith 2
00 p
pm
mah
ua o
il c
ake.
alo
ng ,\
ith
the
cont
rol
Peri
ods
of o
bsen
'ati
ons(
hrs)
0
24
120
240
-----------------~
Mac
robe
ntho
s(N
o&w
tlm
2). -
----
--N
umbe
r W
eigh
t N
umbe
r \V
eigh
t ~umber
Wei
ght
Num
ber
Poly
chae
tes
Exp
erim
en
138
4.74
19
238
8'-+
333
38
0.39
53
25
Con
trol
96
3 25
.592
8 88
R
21.7
37
925
25.4
593
863
Am
phip
ods
Exp
erim
en
88
0.31
81
15
0.20
24
63
0.16
51
38
Con
trol
23
8 0.
0736
21
5 (.l
.O84
6 20
0 0.
0693
21
3 T
anai
ds
E:-"
"Per
imel
63
0.
0096
50
(),
()O69
38
0.
004
25
Con
trol
32
5 0.
7511
25
300
0.56
21
3 0.
2192
22
5 S
eaan
emon
e E
xper
imen
10
0 0.
5852
50
0.
198
0 0
0 C
ontr
ol
63
0.41
26
15
0.37
68
100
0.37
3 88
B
i,'a
h'e
mol
lusc
E
xper
imen
0
()
0 0
0 0
0 C
ontr
ol
-~
0 0
0 °L
_ 0
0 -
------
-
Wei
ght
tU22
9 21
.226
8 0.
1114
0.
0471
0.
0029
1 lU
1825
I 0 04
519 0 0
--
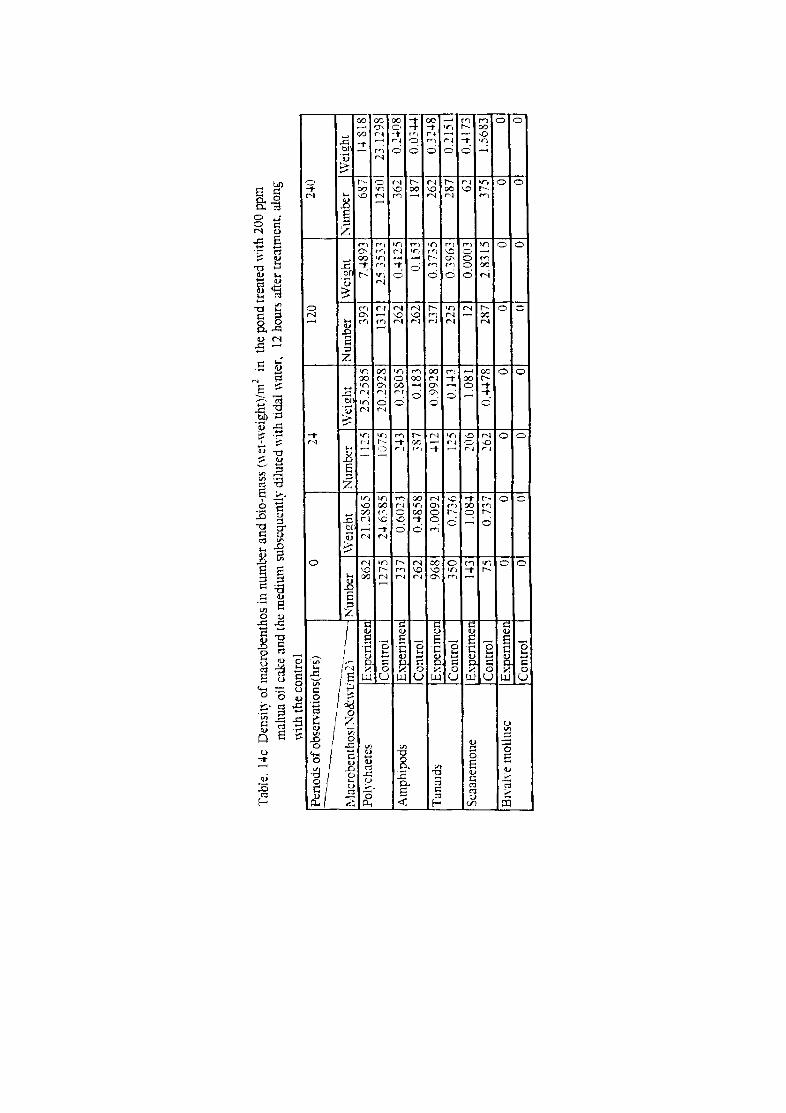
Tab
le.
14c
Den
sity
of m
acro
be n
th os
in
num
ber
and
bio
-mas
s (\
\et-
wei
ght)
!m2
in t
he p
ond
trea
ted
wit
h 20
0 pp
m
mah
ua o
il c
ake
and
the
med
ium
sub
sequ
entl
y di
lute
d w
ith
tida
l w
ater
, 12
hou
rs a
fter
tre
atm
ent
alon
g
"ith
the
cont
rol
P(;r
iods
of o
bser
vati
ons(
hrs)
0
24
120
240
------
~ --------
--l\
lacr
cben
rhos
( "N
o&
wtl
m2
)---
-N
umbe
r \V
eigh
t N
umbe
r W
t:ig
ht
Num
ber
Wei
ght
Nm
nocr
Pol~'cha
etcs
E
xoer
imen
86
2 21
.286
5 11
25
25
,25
S5
39
3 7.
4893
68
71
Con
trol
12
75
24
63
85
10
75
20
.29
28
13
12
25.3
533
1250
1 A
rnpl
llpo
ds
Exn
erim
enl
237
0.60
23
2 .. 3
0.
2805
26
2 0.
4125
36
21
Con
trol
26
2 0.~8581
~S7
0,18
3 26
2 0.
153
187
Tan
mds
E
xoen
men
96
8 3.
0092
-10
12
0.9
92
8
237
0.37
35
2621
Con
trol
35
0 0,
736
1 ~ 'i
0.
143
225
0.39
63
287
Sea
ancm
onc
Exp
erim
en
1~3
1.08
4 20
6 1.
081
12
0.00
03
62
Con
trol
75
0,
737
262
O.~478
287
2.83
15
375
Biy
uhe
mol
lusc
E
xper
imen
0
0 °
° 0
0 0
Con
trol
0
0 0
0 0
0 0
\Vei
ght
14. S
18
23.1
298
0.2
.. 08
0,03
44
0.32
.. 8
0,
2151
~ 0,
.1.1
73
l.56
83 1 Oi 01
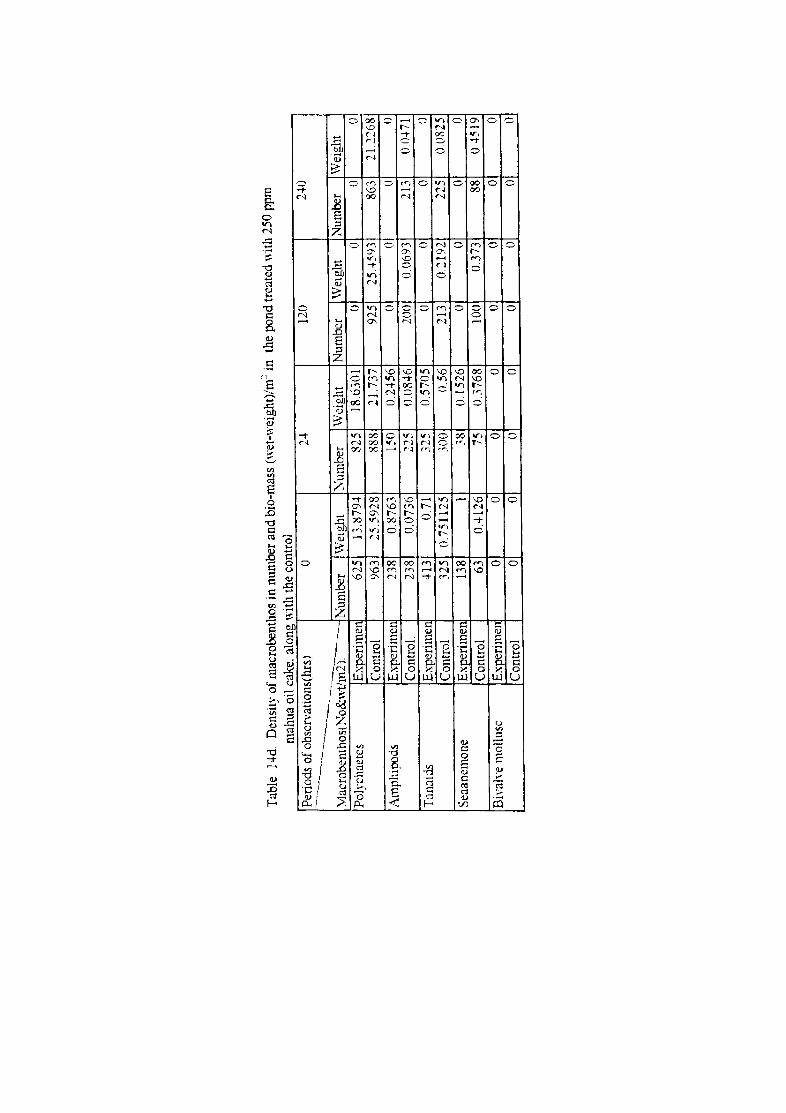
Tab
le.
14d.
D
ensi
ty o
f m
acro
bent
hos
in n
umbe
r an
d bi
o-m
ass (wet-wei
ght)
/m~
in t
he p
ond
trea
ted
"it1
1 25
0 pp
m
mah
ua o
il ca
ke.
alon
g w
ith t
he c
ontr
ol
-
Peri
ods
of o
bser
\'atio
ns(h
rs)
0 2.1
-12
0 2"
\'0
-~----
----
----
-M
acro
bem
ho S(
~o&\,tJln2T----------
Num
ber
Wei
ght
Xum
ber
Wei
ght
Num
ber
Wei
ght
Num
ber
Wei
ght
Poly
chae
tes
Exp
erim
en
625
13.~79.1-
825
18.6
301
0 0
0 0
Con
trol
96
3 25
.592
8 ~88
21.7
37
925
25A
593
863
21.2
268
Am
phip
ods
Exp
erim
en
238
0.87
63
1:0
0.24
56
0 0
0 0
Con
trol
. 23
8 0.
0736
22
5 0.
0846
20
0 0.
0693
21
3 O
O..j.
71
Tan
aids
E
xper
imen
41
3 0.
71
~..,,,
-'''
'~
n.57
05
II 0
()
()
Con
trol
32
5 0.
7511
25
300
0.56
21
3 0.
2192
22
5 0.
0825
Se
aane
mon
e E
xper
ime!
J 13
8 1
38
0.15
26
0 0
0 0
Con
trol
63
0.
-+12
6 .. "
/~
0.37
68
100
0.37
3 88
0.
4519
B
i"ah
'e m
ollu
sc
Exp
erim
en
0 0
0 0
0 0
0 0
Con
trol
0
0 .-
~ _~L
0 0
0 0
---.~ ~----
.-
__
__
.J
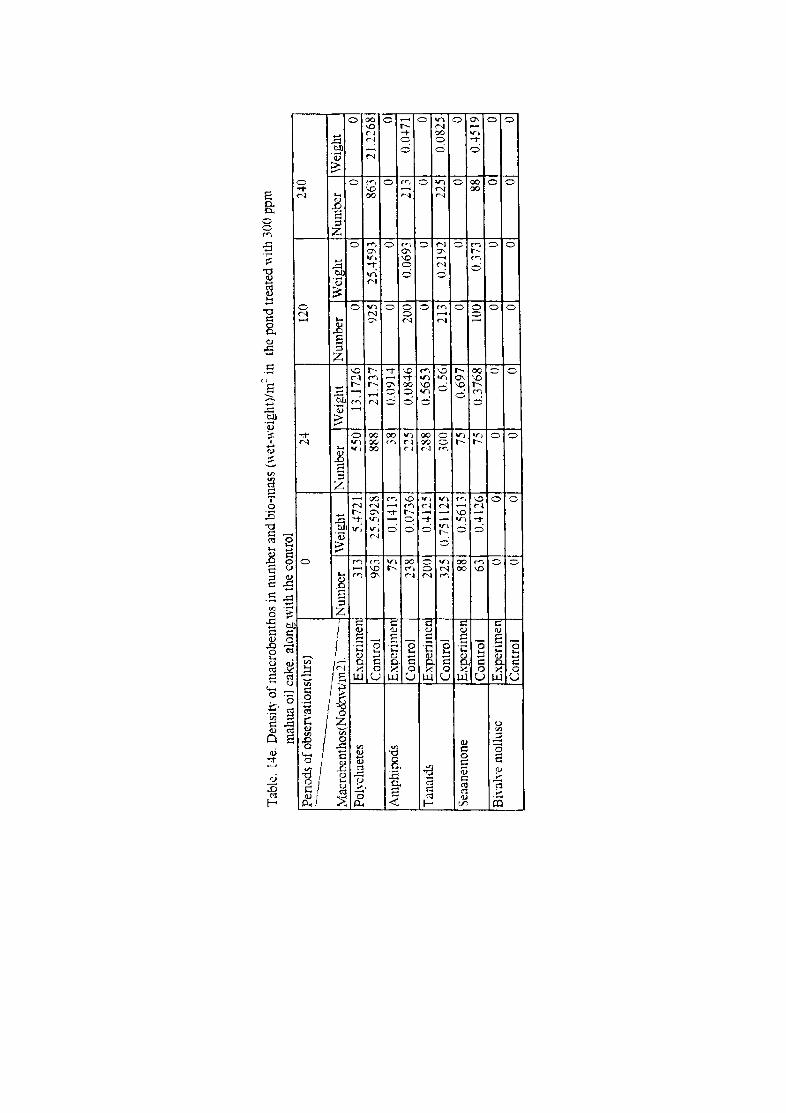
Tab
le.
14e.
Den
sity
of
mac
robe
ntho
s in
num
ber
and
bio
-mas
s (w
et-w
eigh
t)/m
= i
n
the
pond
trea
ted
"ith
300
pp
m
mah
ua
oil
cake
. al
on
g ''
'ith
the
cont
rol
.~
Per
iods
of
obse
r\,a
tion
s(ll
I'S)
0 24
12
0 24
0 ._
- ------- -
-----
Mac
rob
enth
os(
No
&w
tim
2).
----
-N
umbe
r W
eigh
t N
umbe
r W
eig
ht
Nu
mb
er
Wei
ght
Num
ber
Wei
ght
Pol
ycha
etes
E
xp
crim
en
313
5A72
1 55
0 13
.172
6 0
0 0
0 C
on
tro
l 96
3 25
.592
8 88
8 21
.737
92
5 25
.459
3 86
3 21
.226
8 A
mph
ipod
s E
xp
crim
en
75
0.14
13
38
0.09
14
0 0
0 0
Con
trol
23
8 0.
0736
"'''
'0;
0.08
46
200
0.06
93
213
0.04
71
~ ....
.,.,
Tan
alds
Experim~
200
0.41
25
288
0.56
53
0 0
0 0
Con
trol
32
5 0.
7511
25
300
0.56
21
3 0.
2192
22
5 0.
0825
I S
eaan
emon
e E
xp
crim
en
88
0.56
13
i5
0.69
7 0
0 0
01
Con
trol
63
0.
4126
.. -
0.37
68
lOO
0.37
3 88
0,
..1.5
19
/)
Biy
ah'c
mol
lusc
E
xp
erim
en
0 0
0 0
0 0
0 0
Con
trol
0
0 0
0 0
0 0
.. ___
...2.
---
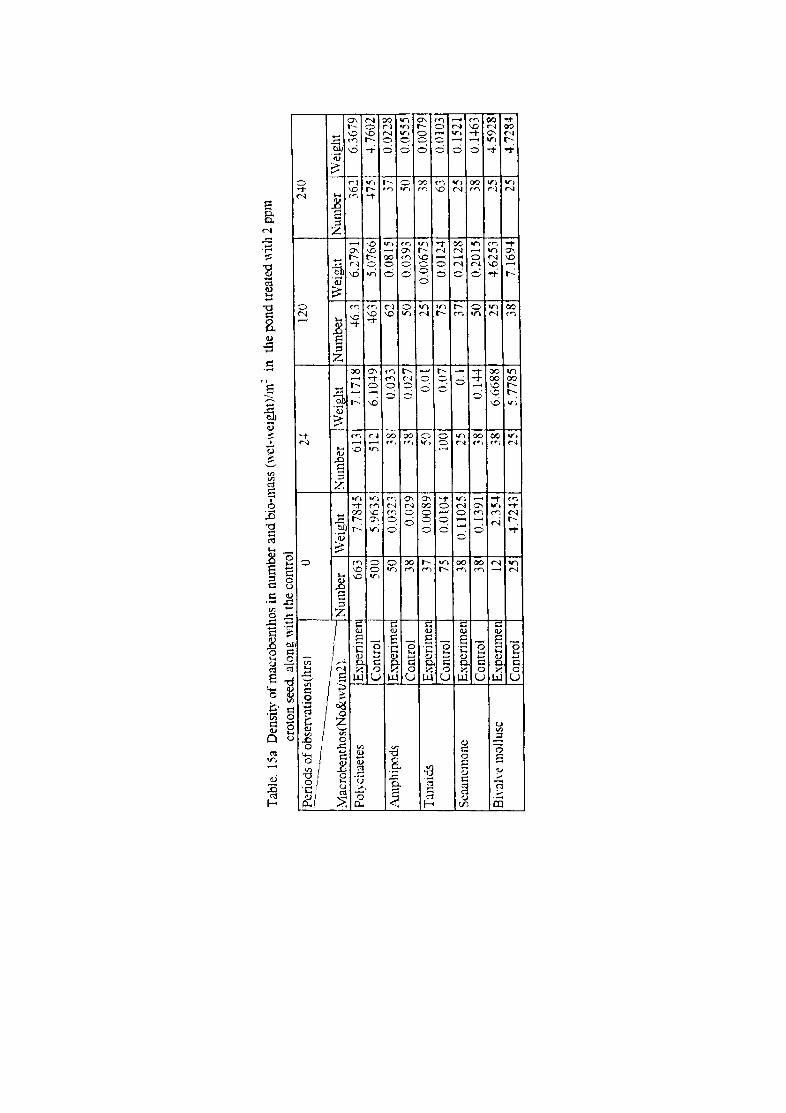
Tab
le.
15a
Den
sity
of m
acro
bent
hos
in n
umbe
r an
d bi
o-m
ass
(wet
-wei
ght)
/m2
in t
he p
ond
trea
ted
,,;tl1
2 p
pm
crot
on s
eed.
alo
ne: "
ith
the
cont
rol
-Pe
riod
s of
obs
en'a
tion
s(hr
s)
0 2-+
12
0 2'
;'0
---- -
-- ----
--------
-M
acro
bem
hos(
No&
wtJ
m2)
. --
Num
ber
Wei
ght
~umber
Wei
ght
Num
ber
Wei
ght
Num
ber
Wei
ght
Po!y
chae
tes
Exp
erim
en]
663
7.78
45
613
7.17
18
46.3
6.
2791
36
21
6.36
i9
Con
trol
50
0 5.
%35
51
21
6.10
49
463
5.07
66
';'75
4.76
02
Am
pllip
ods
E~"Penmen
50
<H)3
23
38
U.0
33
62
0.08
15
37
0.02
28
Con
trol
38
0.
029
38
0.02
7 50
0.
0393
50
0.
0555
T;
lI1ai
ds
Exp
erim
en
37
0.00
89
50
0.01
25
0.
0067
5 38
0.
(107
91
Con
trol
75
0.
010'
+ lO
O 0.
07
75
0.01
2'+
63
0.01
03
Seaa
nem
one
E.x
peri
men
38
0.
1102
5 25
0.
1 37
0.
2128
25
0.
1521
C
ontr
ol
38
0.13
91
38
0.14
4-50
0.
2015
38
0.
1'+6
3 Bi"aJn~
mol
lusc
E
xper
imen
! 12
2.
354
38
6.66
88
25
4.62
53
25
.+.5
928
_ C
ontr
ol _
__
~ _
-!:2
.2.p
25
5.
7785
38
7.
1694
25
4.
7284
-
--
-_._
--
--
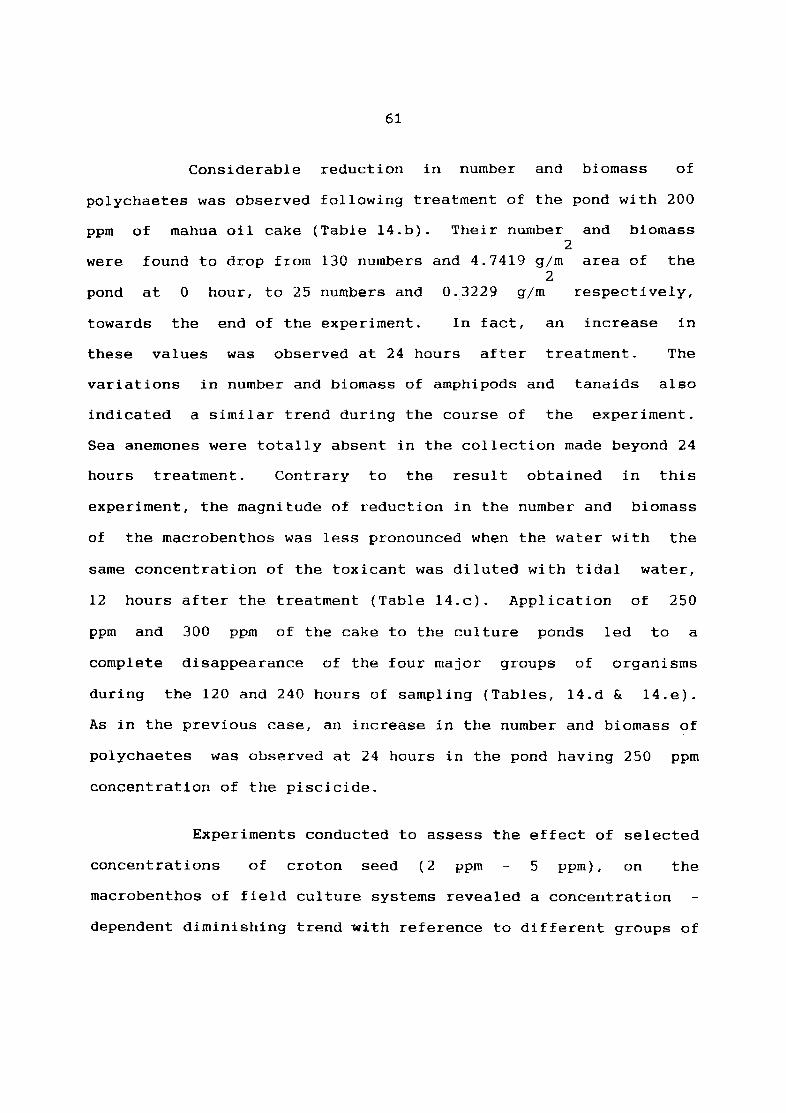
61
Considerable reduction in number and biomass of
polychaetes was observed following treatment of the pond with 200
ppm of mahua oil cake (Table 14.b). Their number and biomass 2
were found to drop from 130 numbers and 4.7419 glm area of the 2
pond at 0 hour, to 25 numbers and 0.3229 glm respectively,
towards the end of the experiment. In fact, an increase in
these values was observed at 24 hours after treatment. The
variations in number and biomass of amphipods and tanaids also
indicated a similar trend during the course of the experiment.
Sea anemones were totally absent in the collection made beyond 24
hours treatment. Contrary to the result obtained in this
experiment, the magnitude of reduction in the number and biomass
of the macrobenthos was less pronounced when the water with the
same concentration of the toxicant was diluted with tidal water,
12 hours after the treatment (Table 14.c). Application of 250
ppm and 300 ppm of the cake to the culture ponds led to a
complete disappearance of the four major groups of organisms
during the 120 and 240 hours of sampling (Tables, 14.d & 14.e).
As in the previous case, an increase in the number and biomass of
polychaetes was observed at 24 hours in the pond having 250 ppm
concentration of the piscicide.
Experiments conducted to assess the effect of selected
concentrations of croton seed (2 ppm 5 ppm), on the
macrobenthos of field culture systems revealed a concentration
dependent diminishing trend with reference to different groups of

Tab
le.
15b
Den
sity
of
mac
robe
ntho
s in
num
ber
and
bio
~mas
s (w
et~w
eigh
t)/m
: in
th
e po
nd tr
eate
d ,,,
ith
3 pp
m
crot
on s
eecl
alo
ng w
ith
the
cont
rol
-
Per
iods
of o
bser
vati
ons(
hrs)
0
24
120
240
------
------
.------
----.
Mac
robe
mho
s(N
o&,W
m2 ).--
Num
ber
Wei
ght
Num
ber
Wei
ght
Num
ber
Wei
ght
Num
ber
Wei
ght
Pol
ycha
etes
E
x-pe
rim
en
425
4.30
06
350
3.59
51
312
3.30
21
262
2.85
44
Con
trol
50
0 5.
9635
51
2 6.
1049
46
3 5.
0766
4"
" 1-4.
7602
A
mph
ipod
s E
xper
imen
75
0.
0539
50
0.
0378
37
0.
029
37
0.03
C
ontr
ol
38
0.02
9 38
0.
027
50
0.03
93
50
0.05
55
Tan
aids
E
x-pe
rim
en
38
0.00
8 38
0.
007
38
0.00
66
25
0.00
51
Con
trol
75
0.
0104
10
0 0.
07
75
O.()
124
63
0.01
03
Sea
anem
one
Exp
erim
en
25
0.10
53
25
0.09
01
38
0.14
66
25
0.10
39
Con
trol
38
0.
1391
38
0.
144
50
0.20
15
38
0.14
63
Eh'
alve
mol
lusc
E
xper
imen
38
7.
4138
38
7.
2409
0
0 0
0
Con
trol
25
4.
7243
25
5.
7785
38
7.
1694
25
4.
7284
-----
--
--
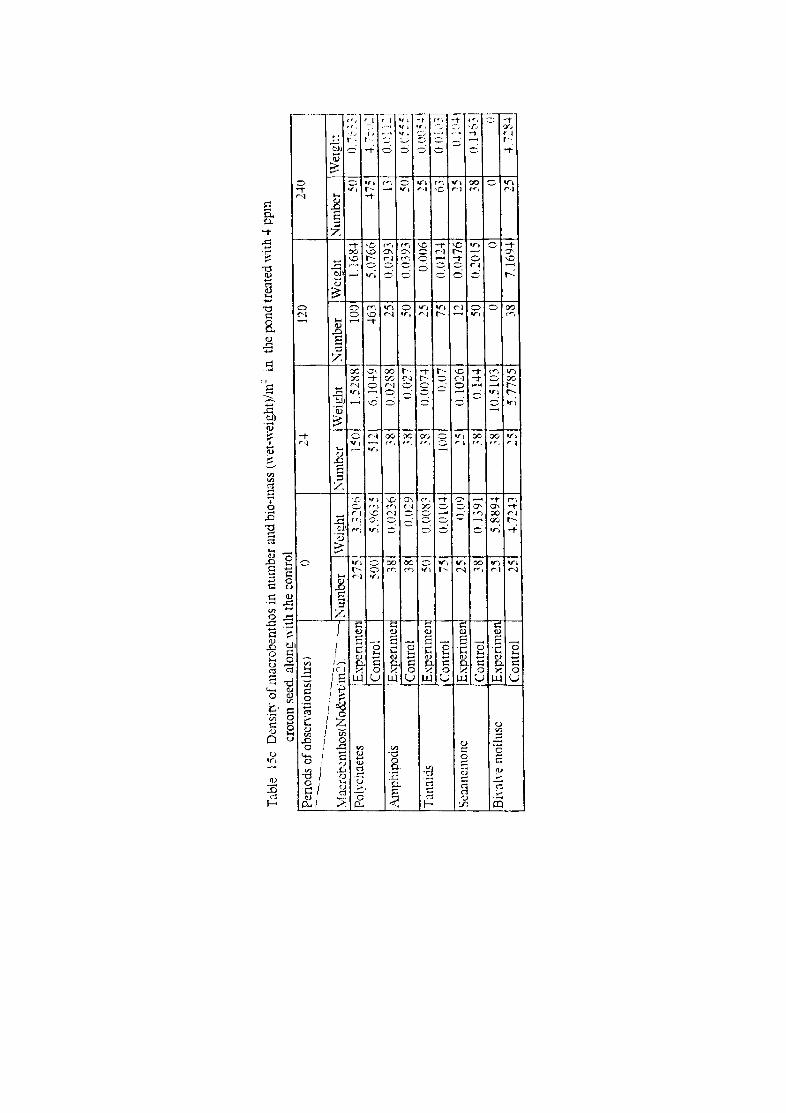
T:l
bk 1
5c
Den
sity
of m
acro
bent
hos
in n
umbe
r an
d bi
e-m
ass
(wet
-wei
ght)
/m:
in t
he p
ond
trea
ted
WiIh
~ p
pm
cret
on s
eed.
alo
ne: ,
,-ith
the
con
trol
Pe
riod
s of
ObS
eIya
tions
( Ius
) 0
2-1-
120
--~-
---------~-------
2-1-0
\lacro
rcnt
hos(
No&"
t!il
12)-
-~~
Num
ber
\Vei
~ht
Num
ber
\Vei
ght
~llmber
Wei
ght
Num
ber
Poly
chae
tes
Exp
enm
en
."!75
3.
3206
1 1 ~
()
l.52
~8
lOO
l.168
-1-
50
Con
trol
:'0
01
5.°6
35
512
6.10
-1-9
-1-
63
5.07
66
-1-""
/ ,
Am
phip
ods
b.l
'en
men
38
1 0.
0236
1 .~
8 (J
.()28
8 25
0.
0293
13
C
ontr
ol
38
oU2S
l ~81
0.02
7 50
0.
0393
SO
T
:lnai
cis
Exp
erim
el
50
O.O
(ll:L
1 _'8
1 0.
007-
1-~ .
-)
0.00
6 25
C
ontr
oi
75
0.01
0-1-
lOO
1)07
75
0.
012-
1-63
Sc
annc
mon
c E
xper
imen
25
0
.09
,-
<;
0.L0
26
12
0.04
76
25
Con
trol
38
0.
1391
.'8
()
144
50
0.20
15
38
Biy
;}lw
mol
lusc
E
xpcr
imen
25
5.
889-
1-38
10
.510
3 0
0 0
Con
trol
25
-1-
.72-1-
3 25
5.
7785
38
7.
169+
25
Wel
gl::
i
O. -:-
:.=-::
I -1
-.-:"'
:": I
(l.o:
l: I
ll.(
1~55
!
O.l~
~'5~
!
(IU
I i'3
I ()
1 U.+ I
O.P"~
()
·U:S
-I-
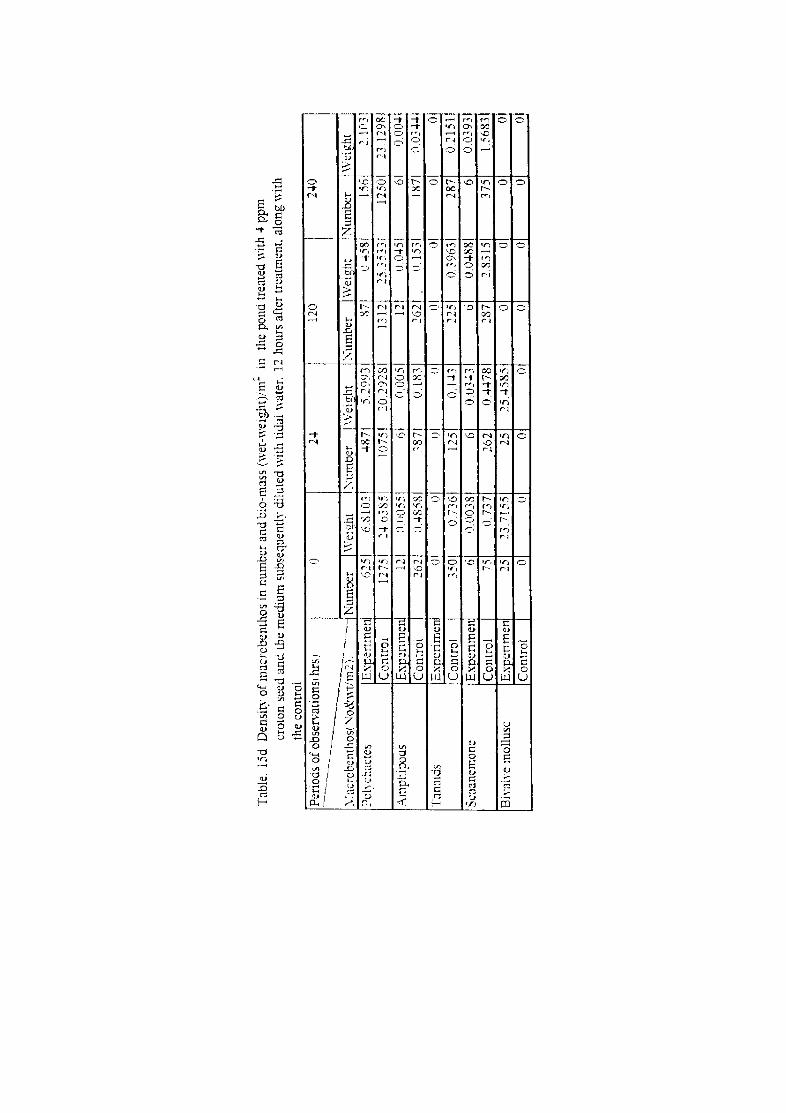
Tab
le.
15d
Densi~'
of
mac
:-ob
enlh
os i
n nu
mbe
r an
d bi
o-m
ass
(wet
-wei
ght)
/m:
in
the
pond
tre
ated
with
4 p
pm
crot
on s
eed
and
the
med
ium
sub
sequ
entl
y di
lute
d w
ith
tida
l w
ater
. 12
hou
rs a
fter
tre
atm
ent.
alo
ng w
ith
the
cont
rol
Per
iods
of o
bser
vati
ons!
hrs
! I)
14
120
240
--~ ----
--------
--:'
Jacr
ob::
ntho
s(~o
&"1!
~ill
----
·--1
Kum
ber
\\'e
wht
I\
'um
bcr
Wei
ght
>Ium
ber
\VC
Ig!U
N
umbe
r l'o
lycn
aetc
s Es
p~ri
mel~
62
51
6.81
031
""R7
1 5.
2993
S7
1 u
-153
1 15
6
Con
trO
l 12
751
2-10
3S51
10
751
20.2
928!
13
121
25.3
53~t
12
50
Am
phip
ods
Esp~rlmenj
121
()(JO
S51
61
0.00
51
12
uO-l5
1 6
Con
troi
I
262
1).-+
858 I
'871
O
.lS
3 26
2 11
.153
18
7
Tan~lld..s
Exp
(;:1
men
I]
Cl
1)1
{)
01
1)1
0
Con
trol
35
0 07
361
125
0.1-
13
nsl
n.39
63
287
St:J
unem
onc
Esp
enm
el
6 0
.00
38
6
0.03
-131
6
UO
-l881
6
Con
trol
75
n
.73
7
262
0.-1
""78
1 28
7 2.
8315
37
5 B
i,'a
!\'e
mol
lusc
E
xp
enm
en
25
23.7
155
25
25.-1
585
I)
0 0
Con
trol
0
0 0
0 ()
0
0
Wei
Q:h
t 2.
1P3
13 1
29R
0.00
""
n.03
-1""
0
0.21
51
0.03
93
U6
83
1
01
01
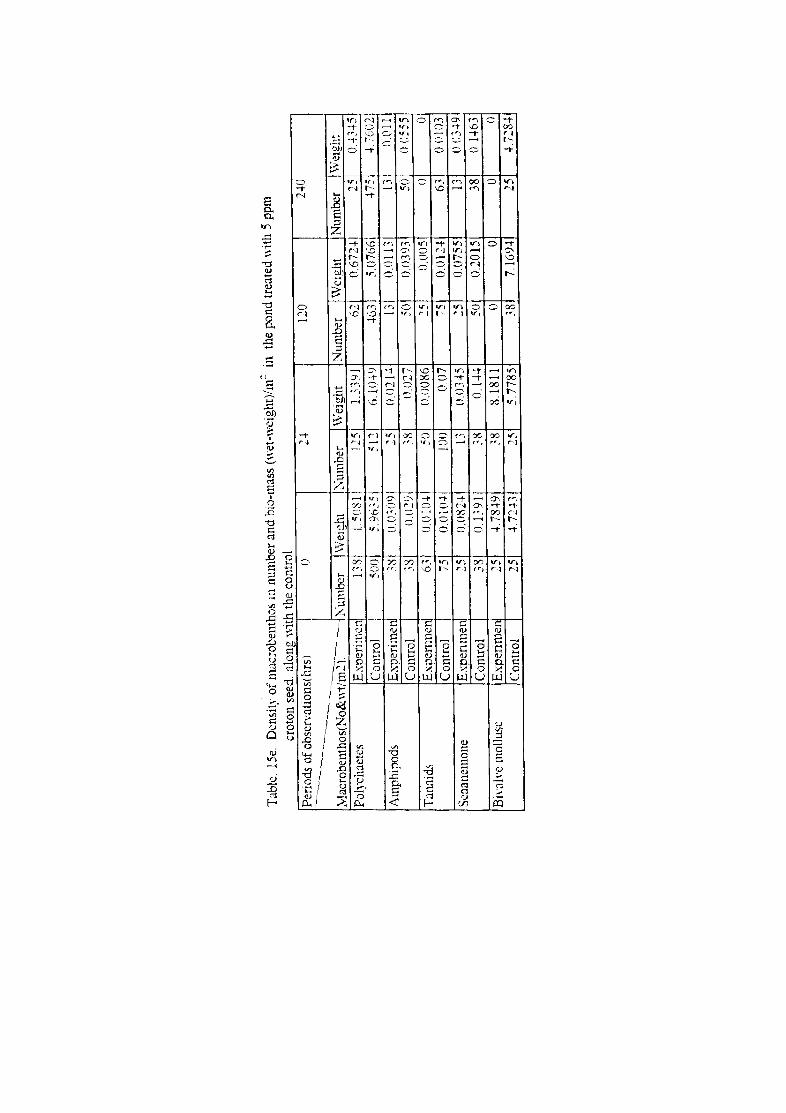
Tab
!c.
15e.
D
ensi
ty o
f m
acro
bent
hos
in n
umbe
r an
d bi
o-m
ass
(wet
-wei
ght)
/m:
in t
he p
ond
trea
ted
,yit
h 5
ppm
cr
oton
see
d_ a
lone
: \"
dth
the
cont
rol
~
Peri
ods
of o
bsen
-ati
ons(
ilrs
) ()
2-1
-12
0 2-1
-0 ----
-- ------
--------
:vla
crob
enth
os(N
o&w
tim2)
" ---
:\u
mlA
;r
Wei
ght
I~um
ber
Wei
ght
Num
ber
\Vel
e:ht
N
umbe
r I\
Vel
ght
Poly
chae
tcs
Exp
erim
cn'
13S
l.~OSll
125
U3
YI
ti2
0.67
2-1-
1 25
1 0"
;'3-1
-5
Con
trol
I
501)
~.%:51
5121
6.
1O-\-
9 -1
63
5.07
661
-1-75
1 -1
-.760
2 i
Am
phip
ods
Exp
erim
enl
3:::!
U.()
:(J~
1
251
0.02
14
13
(U)l1
31
131
n.o 11
C
ontr
ol
38
()U
2SlI
'R
o.un
~O
0.
0393
50
O
.oS5
5 T
anai
ds
Expcrimcl~
6_,
u.ul
O-I1
50
O
.()O
X6
'" 0.
005
()
0 C
ontr
ol
i5
()Ol(l
..J.1
10
0 0.
07
7S
O.O
12-l
631
0.01
03
Seaa
nclll
ollc
E
Xpe
rlln
el
~5
f).(
)~2-
1-13
0.
03-1
5 25
0.
0755
13
(lO
)..J.9
Con
trol
38
0.
1391
:8
(). 1-
1-1-
50
0.20
15
38
0.1-
1-63
B
i\"al
n::
mol
lllsc
E
xper
imen
~.
~"
-t.78
-1-9
38
8.
1811
II
0 0
0 C
ontr
ol
25
·t 72
.+3
25
5.77
1l5
-'8
7. 1
69-l
14
; .. ~ of
.728
-l1
62
organisms over a period of 240 hours (Tables 15a - 15e). In all
the concentrations tested, except 2 ppm, the bivalve molluses
were absent in the collections made beyond 120 hours. No
significant reduction in number and biomass of macrobenthos was
observed when the test medium containing 4 ppm of croton seed was
diluted with tidal water, 12 hours after the treatment (Table
l5d), when compared with the undiluted medium having the same
concentration (Table 15.c).
4.2.1.2.6 Persistence of toxicity of the piscicides in the field
test media
Experiments were conducted to evaluate the persistence
of toxicity of the two piscicides in the field test media with
Ambassis gymnocephalu~ representing the least tolerant group of
finfish species tested, as the target organism. The results
revealed that the duration of persistence of toxicity of the
piscicides in the test media was concentration - dependent. The
toxicity of different concentrations of mahua oil cake such as
150 ppm, 200 ppm, 250 ppm and 300 ppm persisted for 1, 4, 4 and 7
days respectively (Table 16.a). At the same time, the toxicity
of the medium containing 200 ppm of the cake subjected to
dilution with tidal water, 12 hours after treatment, persisted
only for a single day.
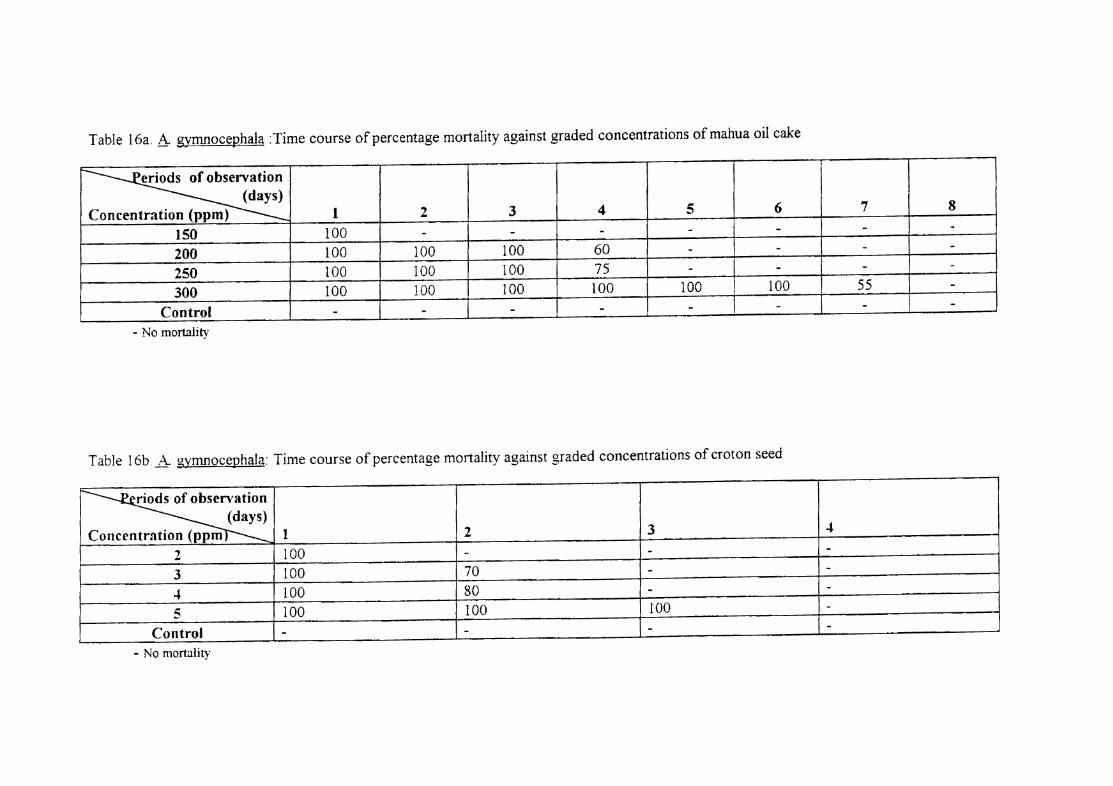
Table 16a. A gymnocephala : Time course of percentage mortality against graded concentrations of mahua oil cake
~ (days) I
Concentration (ppm) 1 2 3 4 5 6 7 8
150 100 - - - - - - -200 100 100 100 60 - - - -250 100 100 100 75 - - - -
I 300 100 100 100 100 100 100 55 -I Control - - - - - - - -
- ---- - -- '--- --
- No mortality
Table 16b A gymnocephala: Time course of percentage mortality against graded concentrations of croton seed
~ (days) Concentration (ppm 1 2 3 ...
2 100 - - -3 100 70 - - I
... 100 80 - -5 100 100 100 -
Control - - - -- - ----- - - --- - .
- No mortality
63
Observations on the persistence of toxicity in the
test media having different concentrations of mahua oil cake with
regard to the postlarvae of the penaeid prawn, Penaeus indicus
are presented in Table 17a. The medium exposed to 200 ppm of
the cake remained lethal to the post larvae, upto day-2. On the
other hand, lethal effects of 250 and 300 ppm of the cake on the
postlarvae persisted upto day-6 and day-7, respectively.
A concentration dependent persistence of toxicity of
graded concentrations of croton seed under field conditions was
observed with reference to the most sensitive finfish species, ~
gymnocephalus (Table 16b). The medium containing 2 ppm of the
toxicant resulted in absolute mortality of the fish species
tested, on the first day, but did not produce any lethal effect
on the species thereafter. Although absolute mortality of the
fish was noticed on the first day of experiment in the medium
containing 3 ppm of the piscicide, only 70% mortality was
recorded on day-2. No incidence of mortality was observed from
day-3 onwards in the medium. A more or less similar result was
obtained when the test medium contained 4 ppm of the piscicide.
The medium containing 5 ppm of the toxicant exhibited lethal
effect upto day-3.
Results of the experiments involving exposure of
postlarval forms of r_~_ iqdicus to media containing different
concentrations of croton seed are illustrated in Table 17.b.
While the medium having 2 ppm of the piscicide did not have any
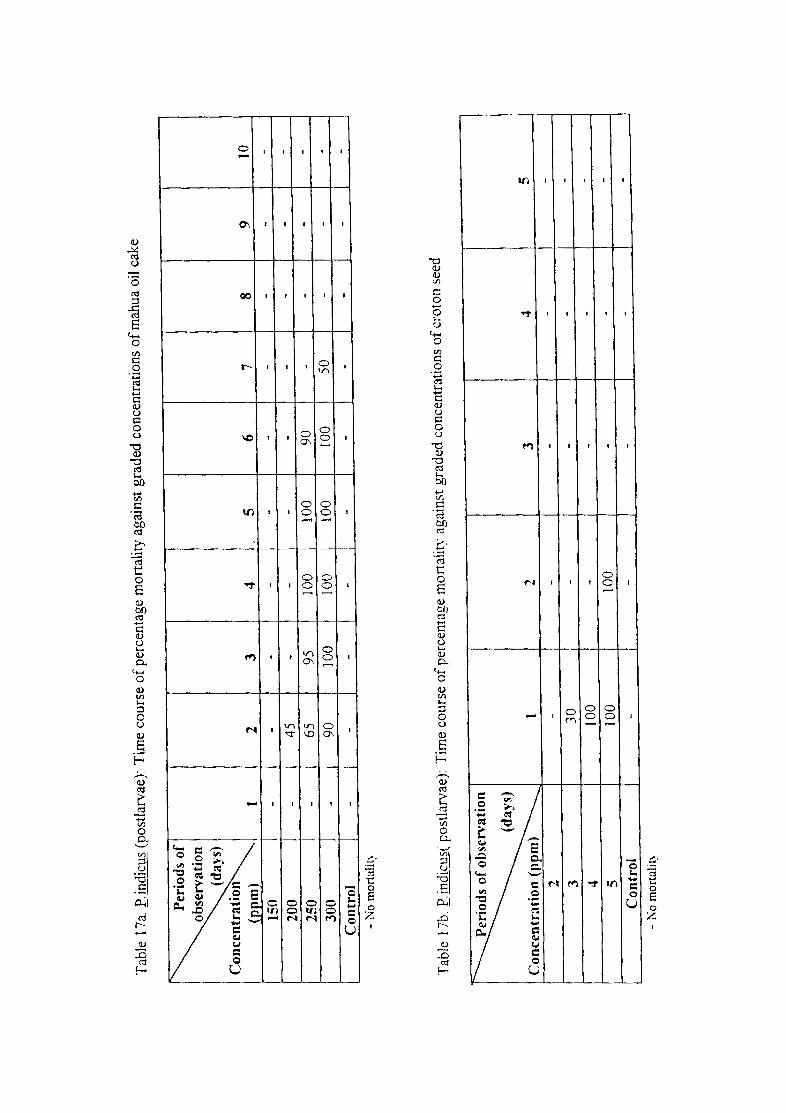
Tab
le 1
7a.
£.in
dicu
s (p
ostl
arva
e):
Tim
e co
urse
of p
erce
ntag
e m
orta
lity
aga
inst
gra
ded
con
cent
rati
ons
ofm
ahu
a oi
l ca
ke
Per
iods
of
obse
rvat
ion
(day
s)
Con
cent
rati
on
(pp
m)
1 2
3 4
5 6
7 8
9 10
I
150
--
--
--
--
--
200
I -
45
--
--
--
--
250
I -
65
95
100
I 10
0 90
-
--
-I
300
I -
90
100
100
\ 10
0 10
0 50
-
--
I
Con
trol
-
--
-1
--
--
--
J --
-' '-
----
-----
--
-N
o m
orta
lity
Tab
le 1
7b.
E. in
dicu
s( p
ostl
arva
e):
Tim
e co
urse
of p
erce
ntag
e m
orta
lity
aga
inst
gra
ded
conc
entr
atio
ns o
f cro
ton
seed
~
(day
s)
Con
cent
rati
on (
pp
m)
1 2
3 ...
5 ., ...
--
--
-3
30
--
--
I
4 10
0 -
--
-I
5 10
0 10
0 -
--
Con
trol
-
--
--
--
--
--
--
-~---
-~o m
orta
lity
64
lethal effect on the postlarvae, those which contained 3 and 4
ppm displayed lethal effect only on the first day. Curiously
enough, the medium exposed to 5 ppm croton seed was found
to exert lethal effect on the postlarvae upto day-2 only.
4.2.2. Effect on the productivity of the culture system
Field experiments were undertaken to evaluate the
influence of mahua oil cake and croton on the productivity of
culture systems, comprising of growth, survival and production
profile of the penaeid prawn, ~ indicus over a prawn culture
period of 90 days.
4.2.2.1. Texture, nutrients and pH of soil
4.2.2.1.1. Soil texture
Results of the preliminary survey conducted for
evaluating the texture of the bottom soil of the ponds employed
for the present study are presented in Table 18. Bottom soil of
the ponds under study were silty sand; sand fraction ranging
from 86.89% to 89.64%, silt 7.82% to 12.69% and clay fraction
0.43 to 2.54%.
4.2.2.1.2. Soil nutrients
Table 19a. contains details of the fluctuations in
soil nutrients at fortnightly intervals over a prawn culture
period of 90 days, in the ponds treated with 200 ppm mahua oil
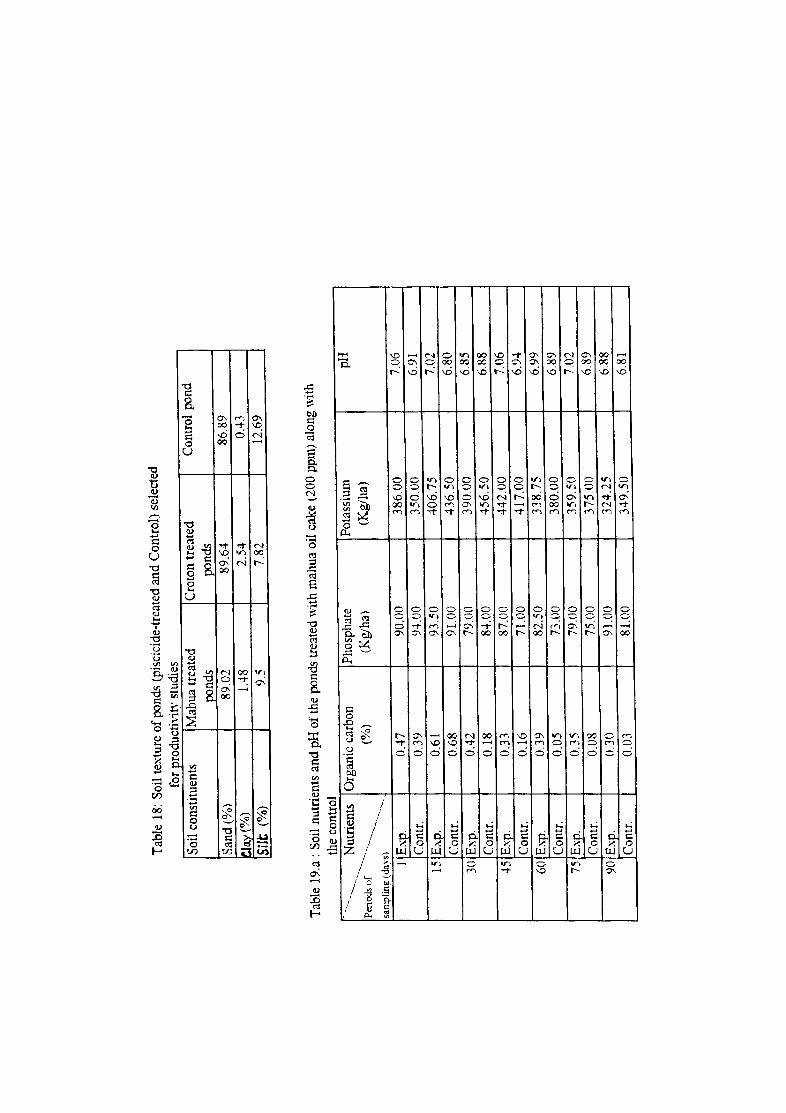
Tab
le 1
8: S
oil
text
ure
of p
onds
(pi
scic
ide-
trea
ted
and
Con
trol
) se
lect
ed
for
prod
ucti
yity
stu
dies
S
oil
cons
titu
ents
M
ahua
tre
ated
C
roto
n tr
eate
d C
ontr
ol p
ond
pond
s po
nds
San
d (%
) 89
.02
89.6
4 86
.89
e!Il.
Y{%
) 1.
48
2.54
0.
43
Silt
(%
) _
_ ---
.2.:5
__
__
_ ~.82_
_ _
'--
12.6
9 -
Tab
le 1
9.a
: S
oil
nutr
ient
s an
d p
H o
f th
e po
nds
trea
ted
"1th
mah
ua
oil
cake
(20
0 pp
m)
alon
g "i
th
the
cont
rol
~
-N
utri
ents
O
rgan
ic c
arbo
n P
hosp
hate
P
otas
sium
--
-""
, -----
Pm
ods
of
....... ~~
(%)
(Kg/
ha)
(Kg/
ha)
sam
plin
l\ (
da\"
s)
.''"'--,
1 E:>
..1'.
0.47
90
.00
386.
00
Con
tr.
0.39
94
.00
350.
00
IS E
xp.
0.61
93
.50
406.
75
Con
tr.
0.68
91
.00
436.
50
30 E
xp.
0.42
79
.00
390.
00
Con
tr.
0.18
84
.00
456.
50
45 E
xp.
0.33
87
.00
442.
00
Con
tr.
0.16
71
.00
417.
00
60 E
:>..1'.
0.
39
82.5
0 33
8.75
C
ontr
. 0.
05
73.0
0 38
0.00
75
Exp
. 0.
35
79.0
0 35
9.50
C
ontr
. 0.
08
75.0
0 37
5.00
90
Exp
. 0.
30
91.0
0 32
4.25
Q>n
!!":..
. 0.
03
81.0
0 34
9.50
---
-
-J
pH
7.06
6.
91
7.02
6.
80
6.85
6.
88
7.06
6.
94
6.99
6.
89
7.02
6.
89
6.88
6.81
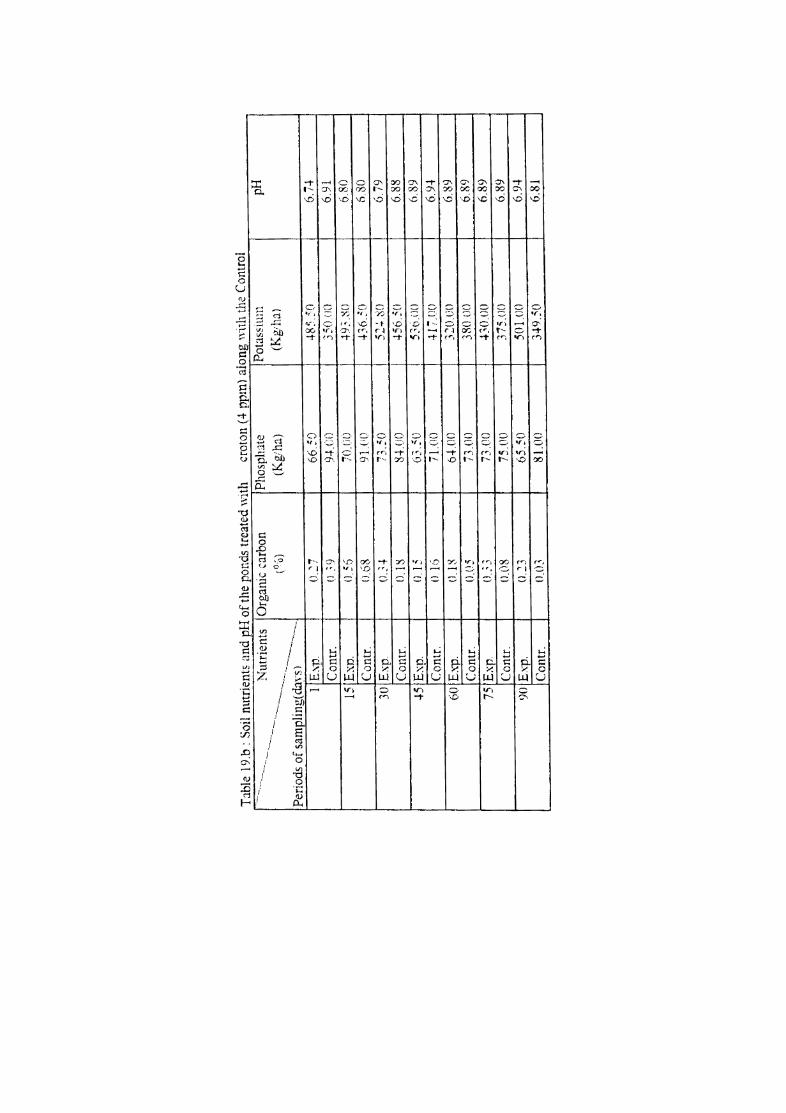
TJb
le 1
9.b
: S
oil ntltrient~ a
nd
pH
of t
he
pond
s tr
eate
d ,y
ith
crot
on (4
-pp
m)
alo
ng
wit
h th
e C
ontr
ol
'.-.
----.
Nut
rien
ts
Org
an.ic
(ar
bo
n
Ph
osp
lute
P
otas
smll
l pH
-.
.. -
---. --
----
--~-
----
Per
iods
of
sam
plin
g(da
.. ~)
---"""
"·~-
( 00)
(K
g/ha
) (K
grh
Jl
1 E
.\.1'
U
27
6
65
0
48
::5
0
6.i4
-C
omr.
()
.~9
94. C
O I
350
[lCl
6.91
15
Exp
. ll:S
70
.(iO
49.:;~()
6~O
Con
tr.
[)68
9
H'O
43
6.:(
) 6.
80
30 E
sp
(l ..
~ .j.
73.:
0 I
52":
'~()
6.
79
Com
r.
lJ.l
~ 84
.00
4565
(l
6.88
4-5
Exp
. 0
1:
63.5
0 53
b(J(
) 6.
89
Con
tr.
01
6
nu
n
417.
[10
6.94
60
b.-
p.
tll~
6.
J..(lO
32
0.U
O
6.89
I
Com
r.
D.O
S no
n 3R
O.(1
0 6.
89
75 E
.xp
O.~-
' 73
.00
430.
DO
6.89
Com
r.
o.ns
75.0
ll 37
5.tH
) 6.
89
90 E
.\.-p
. 0 .
.23
65.5
0 50
l.U
O
6.94
-C
ontr
. O
.tU
81.0
U
349.
50
6.81
._
--._
----_
.
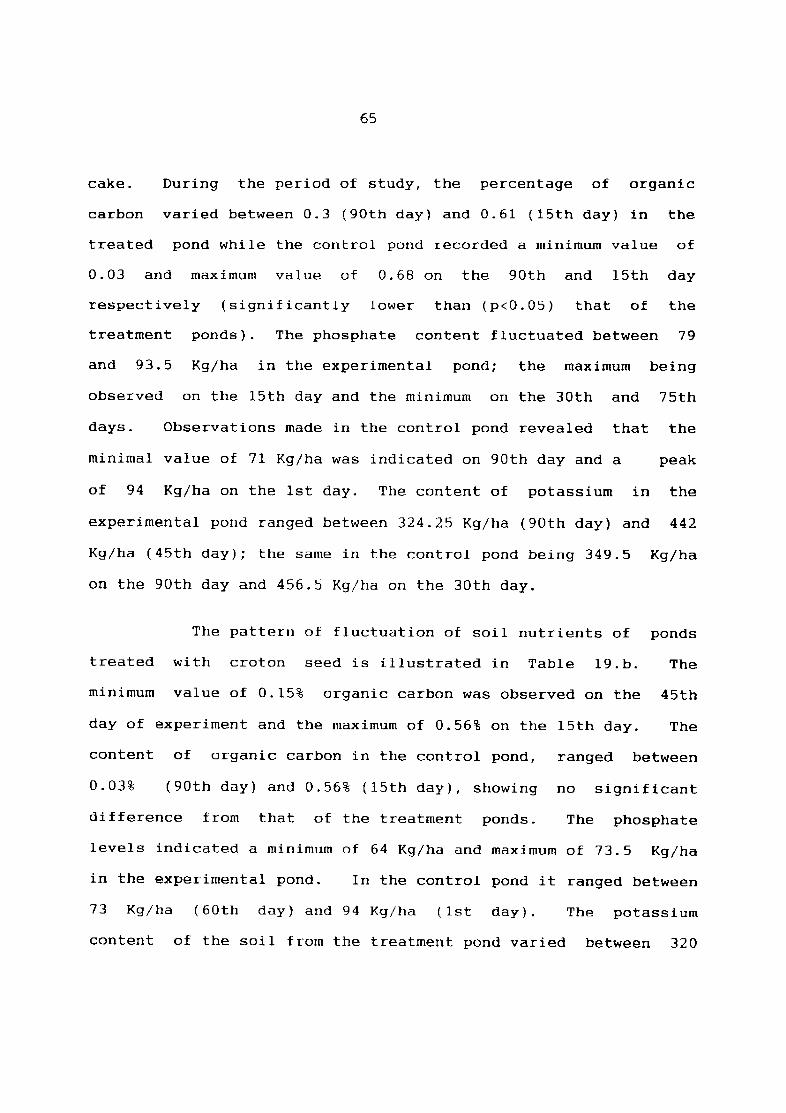
65
cake. During the period of study, the percentage of organic
carbon varied between 0.3 (90th day) and 0.61 (15th day) in the
treated pond while the control pond recorded a minimum value of
0.03 and maximum value of 0.68 on the 90th and 15th day
respectively (significantly lower than (p<O.OS) that of the
treatment ponds). The phosphate content fluctuated between 79
and 93.5 Kg/ha in the experimental pond; the maximum being
observed on the 15th day and the minimum on the 30th and 75th
days. Observations made in the control pond revealed that the
minimal value of 71 Kg/ha was indicated on 90th day and a peak
of 94 Kg/ha on the 1st day. The content of potassium in the
experimental pond ranged between 324.25 Kg/ha (90th day) and 442
Kg/ha (45th day); the same in the control pond being 349.5 Kg/ha
on the 90th day and 456.5 Kg/ha on the 30th day.
The pattern of fluctuation of soil nutrients of ponds
treated with croton seed is illustrated in Table 19.b. The
minimum value of 0.15% organic carbon was observed on the 45th
day of experiment and the maximum of 0.56% on the 15th day. The
content of organic carbon in the control pond, ranged between
0.03% (90th day) and 0.56% (15th day), showing no significant
difference from that of the treatment ponds. The phosphate
levels indicated a minimum of 64 Kg/ha and maximum of 73.5 Kg/ha
in the experimental pond. In the control pond it ranged between
73 Kg/ha (60th day) and 94 Kg/ha (1st day). The potassium
content of the soil from the treatment pond varied between 320
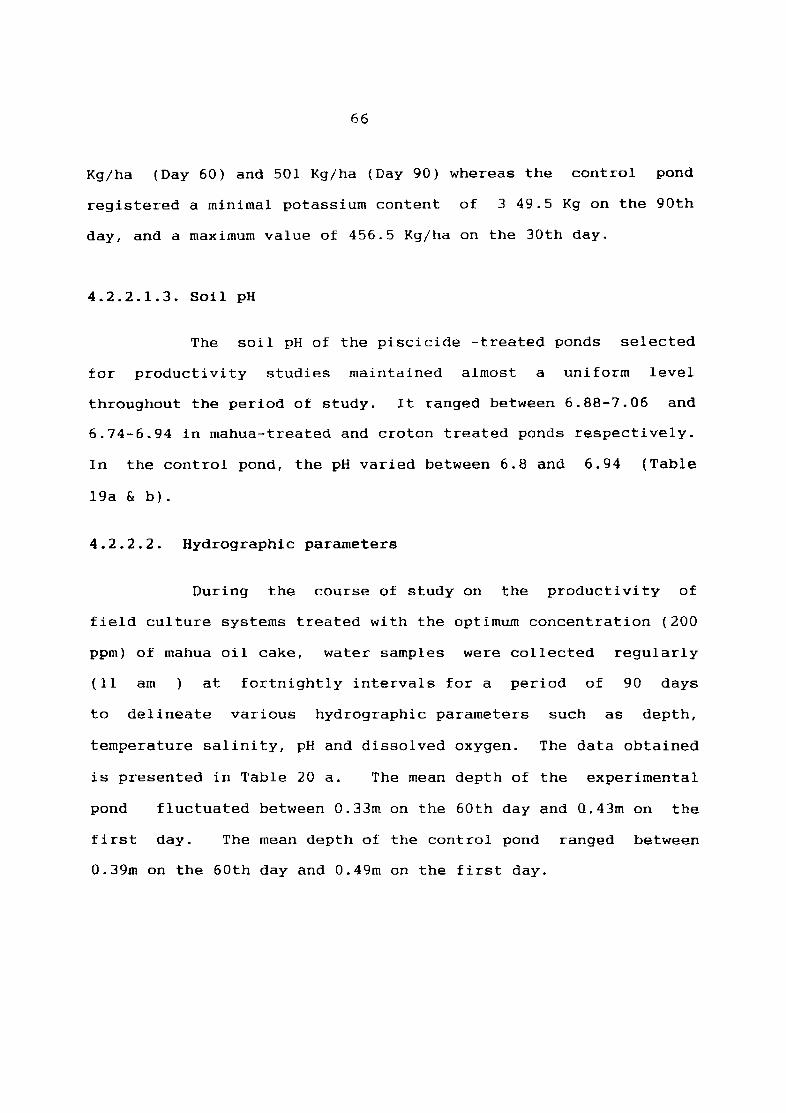
66
Kg/ha (Day 60) and 501 Kg/ha (Day 90) whereas the control pond
registered a minimal potassium content of 3 49.5 Kg on the 90th
day, and a maximum value of 456.5 Kg/ha on the 30th day.
4.2.2.1.3. Soil pH
The soil pH of the piscicide -treated ponds selected
for productivity studies maintained almost a uniform level
throughout the period of study. It ranged between 6.88-7.06 and
6.74-6.94 in mahua-treated and croton treated ponds respectively.
In the control pond, the pH varied between 6.8 and 6.94 (Table
19a & b).
4.2.2.2. Hydrographic parameters
During the course of study on the productivity of
field culture systems treated with the optimum concentration (200
ppm) of mahua oil cake, water samples were collected regularly
(11 am at fortnightly intervals for a period of 90 days
to delineate various hydrographic parameters such as depth,
temperature salinity, pH and dissolved oxygen. The data obtained
is presented in Table 20 a. The mean depth of the experimental
pond fluctuated between 0.33m on the 60th day and Q.43m on the
first day. The mean depth of the control pond ranged between
O.39m on the 60th day and 0.49m on the first day.
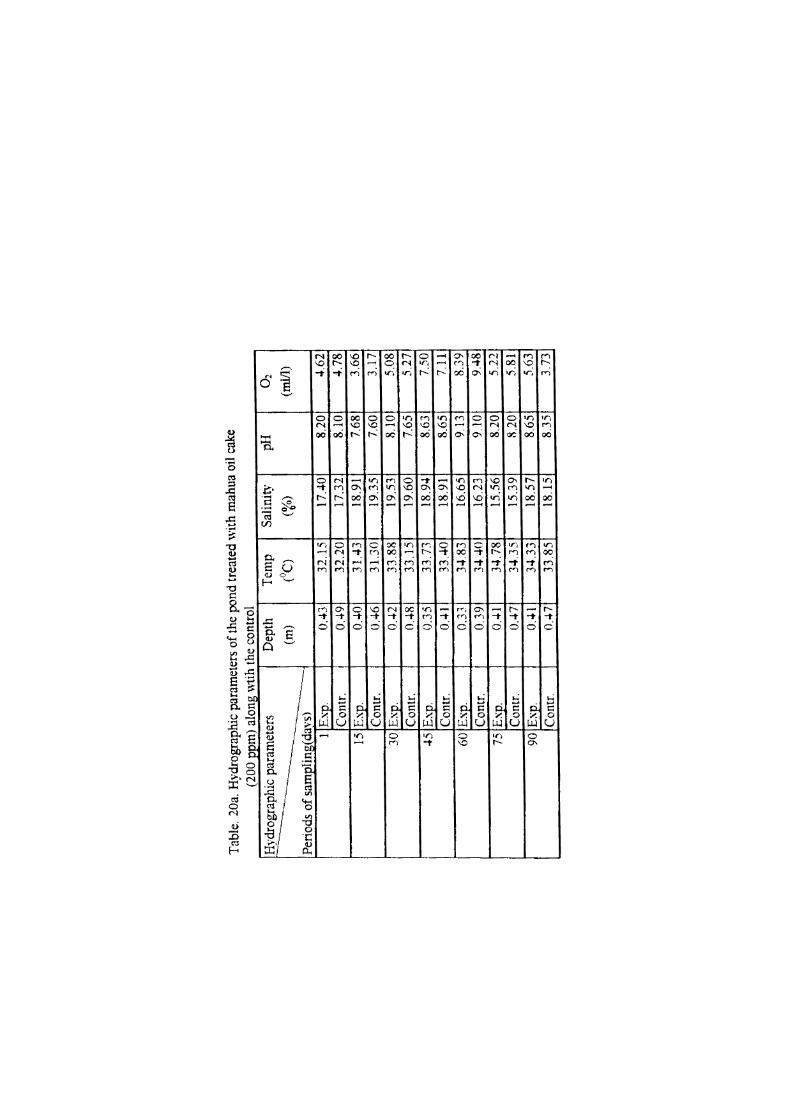
Tab
le.
20a.
Hyd
rogr
aphi
c pa
ram
eter
s o
f the
pon
d tr
eate
d w
ith
mah
ua o
il ca
ke
(200
ppm
) al
ong
\\ti
h th
e co
ntro
l
Hyd
rogr
aphi
c pa
ram
eter
s D
epth
T
emp
S
alin
ity
pH
O2
~~--
(m)
(oC
) (ro
) (m
lJl)
1 E
xp.
0.43
32
.15
17.4
0 8.
20
4.62
Con
tr.
0.49
32
.20
17.3
2 8.
10
4.78
15
Exp
. 0.
40
31.4
3 18
.91
7.68
3.
66
Con
tr.
0.46
31
.30
19.3
5 7.
60
3.17
30
Exp
. 0.
42
33.8~
19.5
3 8.
10
5.08
Con
tr.
0.48
33
.15
19.6
0 7.
65
5.27
45 E
xp.
0.35
33
.73
18.9
4 8.
63
7.50
Con
tr.
0.41
33
.40
18.9
1 8.
65
7.11
i 60
Exp
. 0.
33
34.8
3 16
.65
9.13
8.
39
Con
tr.
0.39
34
.40
16.2
3 9.
10
9.48
75
Exp
. 0.
41
34.7
8 15
.56
8.20
5.
22
Con
tr.
0.·+
7 34
.35
15.3
9 8.
20
5.81
90
Exp
. 0.
41
34.3
3 18
.57
8.65
5.
63
I C
ontr
. 0
.. +7
33.8
5 18
.15
8.35
3.
73
67
The mean water temperature of the mahua-treated ponds o 0
ranged between 31.43 C on day-15 and 35.83 C on day-60. In
general, the water temperature showed an increasing trend from
the beginning to the end of the period of study. The
fluctuations of temperature in the control pond was also along o
similar lines, recording a low value of 31.3 C on the 15th day o
and a peak of 35.4 C on the 60th day of treatment.
The salinity of the pond water under treatment showed
an increasing trend, rising gradually from of 17.4~on day-l to
increase upto 19.53~. on day-30. A decreasing profile was
observed thereafter reaching a minimum of 15.56~on the 75th day,
again to rise gradually to 18.57 on the 90th day of
experimentation. The salinity profile of the control pond also
exhibited the same trend depicting a range of 15.39 - 19.6~.
The pH of the mahua-treated pond water ranged between
7.7 and 9.15. The similar trend in variation of pH in the
control pond was observed in the experimental pond depicting a
range of 7.6-9.1.
The values of dissolved oxygen content of the mahua-
treated ponds during the 90 days culture period varied between
3.66 mIll on the 15th day and 8.39 mIll on the 60th day. In
general, the oxygen levels increased from day-l to the
concluding day. Ranging between 3.17 mIll and 9.48 mIll, the
dissolved oxygen content of the control pond fluctuated on
similar lines as observed in the experimental pond.
6R
Table 20b. contains the data obtained on the
hydrographic parameters of the ponds treated with croton seed and
maintained under observation for a period of 90 days.
The mean depth of the croton-treated ponds ranged
between 0.34 ID (60th day) and 0.44 ID (1st day) . The control
pond on the other hand had a mean depth of 0.39m on day-60 and
O.49m on day-I, the trend in variation being similar to that of
the experimental pond.
During the 90 days culture period the mean water
temperature of the croton-treated ponds showed a peak value of o 0
35.18 C on the 75th day and a minimum value of 30.3 C on the 15th
day after treatment. In the control, the maximum value was 0
recorded on the 60th day (35.4 C) in the control and the minimum 0
on the 15th day (31. 3 C) In general, the temperatures of both the
experimental and control ponds showed an increasing trend from
the begining to the end of the culture period.
The salinity of the experimental pond treated with
croton seed showed an increase from l7.4~on day-l to 19.75~ on
day-30, thereafter declining to l5.64~on the 75th day to again
to rise to 18.62~on the 90th day of treatment. The salinity of
the control pond ranged between 15.39 and 19.6~, fluctuating in
the same line as in the case of the experimental pond.
The pH of the water of the croton-treated pond
fluctuated between 7.7 and 9.15 as recorded on the 15th and 60th
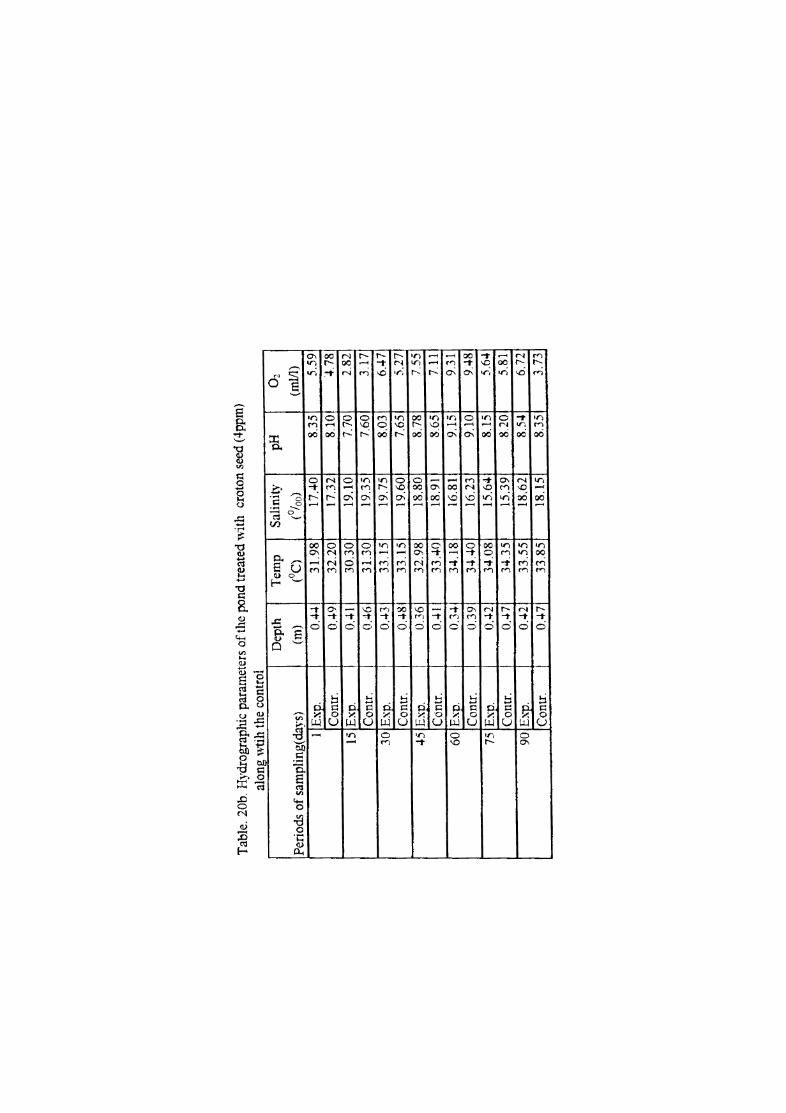
Tab
le.
20b.
Hyd
rogr
aphi
c pa
ram
eter
s o
f the
pon
d tr
eate
d ,,
,ith
cr
oton
see
d (4
ppm
)
alon
g '''
tih
the
cont
rol
Dep
th
Tem
p
Sal
init
y pH
Per
iods
of
sam
plin
g(da
ys)
(m)
(QC
) (%
0)
1 E
xp.
0.44
31
.98
17.4
0 8.
35
Com
r.
0.49
32
.20
17.3
2 8.
10
15 E
xp.
I 0.
41
30.3
0 19
.10
7.70
C
ontr
. 0.
46
31.3
0 19
.35
7.60
30
Exp
. 0.
43
33.1
5 19
.75
8.03
C
ontr
. 0.
48
33.1
5 19
.60
7.65
45
Exp
. I
0.36
32
.98
18.8
0 8.
78
Cci
ntr.
0.41
33
.40
18.9
1 8.
65
60 E~
0.34
34
.18
16.8
1 9.
15
Con
tr.
0.39
3·
U·0
16
.23
9.10
75
Exp
. 0.
42
34.0
8 15
.64
8.15
C
ontr
. 0.
47
34.3
5 15
.39
8.20
90
£.'..
1'.
0.42
33
.55
18.6
2 8.
54
Con
tr.
0.47
33
.85
18.1
5 8.
35
~
(ml/
l)
5.59
4.
78
2.82
3.17
6.
47
5.27
7.55
7.
11
9.31
9.
48,
5.64
' 5.
81
6.72
1 3.
731
69
day, respectively. The water of the control pond had a pH range
of 7.6 (15th day) to 9.1 (60th day). In both the cases, the pH
showed an increasing trend during the course of study.
The dissolved oxygen content of the ponds under
treatment with croton varied between 2.82 mIll as recorded on the
15th day and 9.31 mIll as on the 15th & 60th day respectively.
The control pond also depicted a similar trend with a peak of
9.48 ml/l on the 60th day and the minimum of 3.17 mIll on the
15th day of treatment. In general, higher values of dissolved
oxygen were recorded during the second half of the experimental
period.
Diurnal monitoring of the hydrographic parameters of
the experimental ponds revealed distinct patterns of their
fluctuation (Table 20 C and Figs. 7a-c) In the ponds treated o
with mahua oil cake the minimum temperature (31.6 C) was recorded o
at 09.00 hrs and the maximum (35.4 C) at 15.00 hrs. The same
trend was observed in the case of control pond also recording a o
temperature range of 31.25 - 35.55 C. The maximum pH of 9.1 was
recorded at 15.00 and 18.00 hrs and the minimum value of 7.9 at
06.00 hours, in the mahua-treated pond; the same in the control
pond, being 9 (15.00 hours) and 7.75 (06.00 hours) respectively.
In the mahua-treated ponds, the dissolved oxygen
content displayed a very low value of 1.52 mIll at the start of
observations (06.00 hrs) to increase gradually thereafter,
registering a peak (12.34 ml/l) at 18.00 hours, followed by a
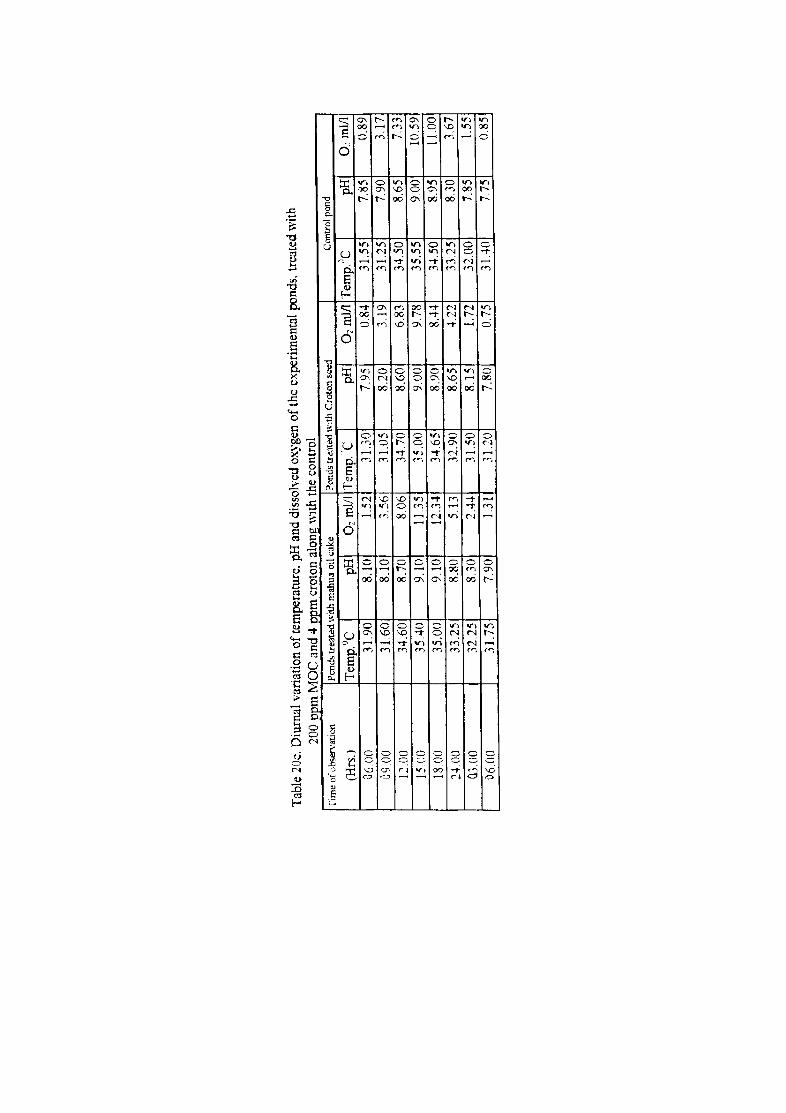
Tab
le 2
0c.
Diu
rnal
var
iati
on o
f tem
pera
ture
. pH
an
d d
isso
lved
oxy
gen
of
the
expe
rim
enta
l po
nds.
tre
ated
wit
h 20
0 no
m M
OC
an
d 4
ro
m c
roto
n al
ong
"ith
the
con
trol
-
-.---~
---
--_
._--
----
. -
y--
--
-.--
Tim
e o
f L·b
serv
atio
n P
onds
trea
ted
wit
h m
ahua
oil
cake
P
,mds
trc;
ned
wit
h C
roto
n se
ed
Con
trol
pon
d
(Hrs
.)
Tem
p.oC
pH
0
: m
lJ1 T
emp.
·c
pH
O:m
l/I T
emp.
,lC
pH
0:,
mlJ1
06
.00
31.9
0 8.
10
1.52
31
.30
7.95
0.
84
31.5
5 7.
85
0.89
09.0
0 31
.60
8.10
3.
56
31.0
5 8.
20
3.19
31
.25
7.90
3.
17
12.0
0 34
.60
8.70
8.
06
34.7
0 8.
60
6.83
34
.50
8.65
7.
33
15.0
0 35
.40
9.10
11
.35
35.0
0 9.
00
9.78
35
.55
9.00
10
.59,
18.0
0 35
.00
9.10
12
.34
34.6
5 8.
90
8..+
4 34
.50
8.95
11
.00
1
2+.0
0 33
.25
8.80
5.
13
32.9
0 8.
65
4.22
33
.25
8.30
3.
671
03.0
0 32
.25
8.30
2.
44
31.5
0 8.
15
1.72
32
.00
7.85
1.
551
06
.00
31
.75
_ 7-
2Q
1.31
31
.20
7.80
0.
75
3H
O
7.75
_~85j
-
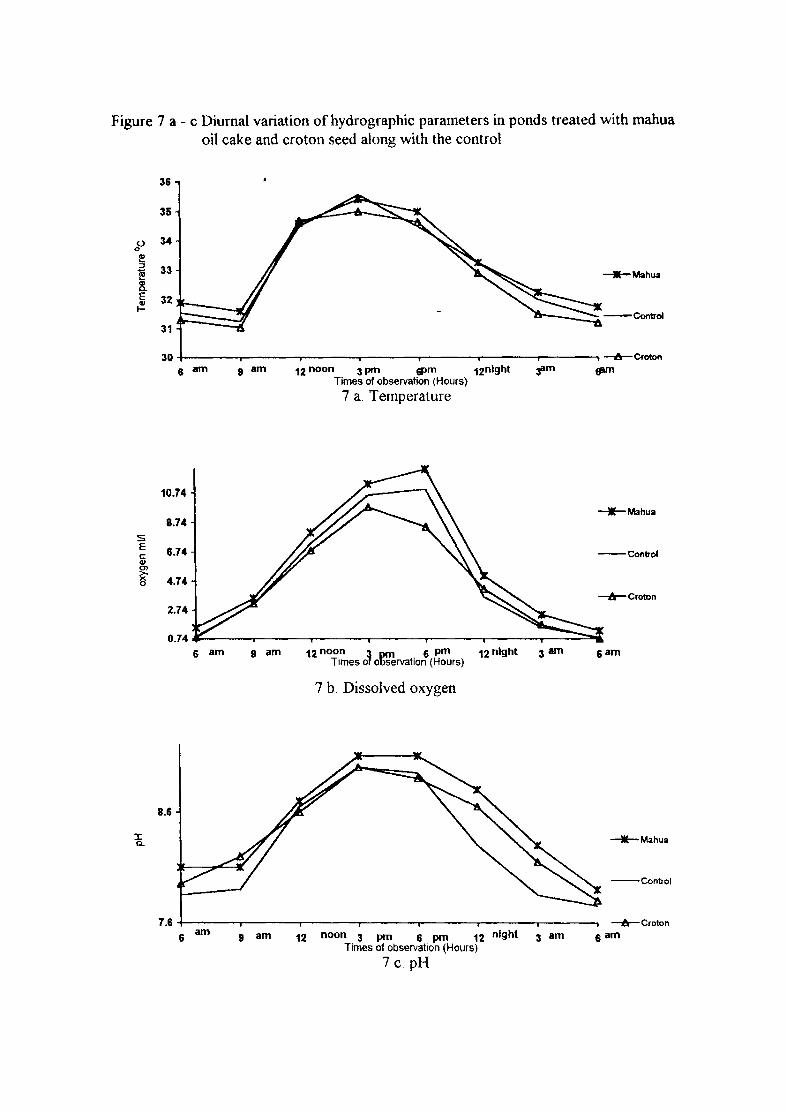
Figure 7 a - c Diurnal variation of hydrographic parameters in ponds treated with mahua oil cake and croton seed along with the control
0 0
!! ::>
~ Cl> a. E Cl> I-
s E c: 41 0)
~ 0
J: a.
36
35
34
33 __ Mahua
32 ~-_~"':. --Control
31
30 6 am 9 am 12 noon 3 pm &pm 12nlght
Times of observation (Hours)
7 a. Temperature
10.74 __ Mahua
8.74
B.74 --Control
4.74 -1\-CrotDn
2.74
0.74 a am 9 am 12 noon 3 pm a pm 12 night 3 am
Times of observation (Hours) aam
7 b. Dissolved oxygen
8.6
-ilr-Mahua
--Control
7.6+-----~r-----~------~------~----_,------_r----~ ~Croton
,am 6 am 9 am 12 noon 3 pm 6 pm 12 night 3 am Times of observation (Hours)
7c. pH
70
gradual decline to reach a minimum of 1.31 ml/l the next day
morning at 06.00 hrs. The dissolved oxygen profile of the
control pond also showed a similar variation pattern, recording a
minimum and maximum of 0.85 ml/l and 11 ml/l respectively.
The trend in the diurnal fluctuation of hydrographic
parameter in the croton-treated ponds revealed a temperature o 0
range of 31.05 C at 09.00 hours and 35.0 C, at 15.00 hours. The
same trend was observed in the control pond also with a range of o
31.25 - 35.55 C.
From a value of 7.95 at 06.00 hours, the pH increased
to 9 at 15.00 hours in the croton - treated pond. A comparable
fluctuation was evinced in the control pond also where the range
was 7.75 - 9.
The dissolved oxygen content of the croton-treated
pond, at the beginning of the diurnal observation (06.00 hours)
was a low 0.84 ml/l, gradually increasing thereafter to
reach a peak value of Q·78ml/l at 18.00 hours. From 18.00 hours
onwards the value showed a declining trend reaching a minimum
of 0.75 ml/l the next day morning at 06.00 hours. The trend in
the control pond was also similar, recording a range of 0.85 - 11
ml/l.
4.2.2.3 Water nutrients and primary production
4.2.2.~.1. Water nutrients
Fortnightly observations on water nutrients such as
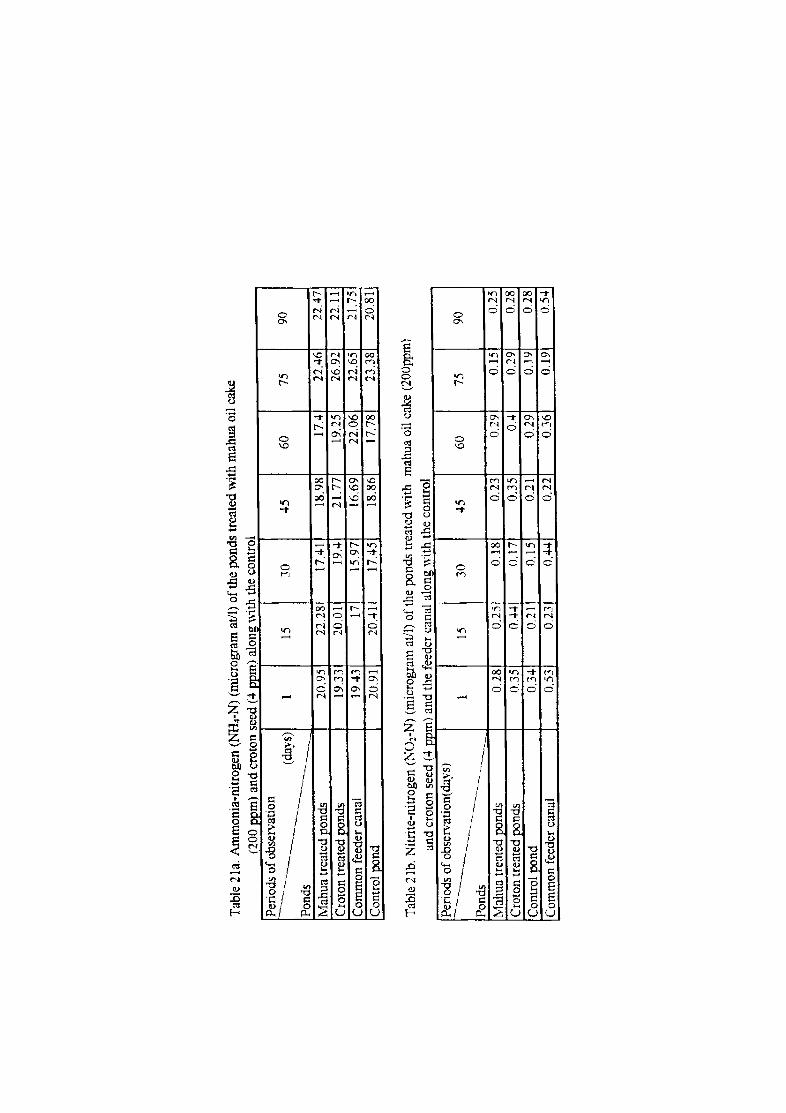
Tab
le 2
1a.
Am
mon
ia.n
itro
gen
(NH
4-N
) (m
icro
gram
atl
l) o
f the
pon
ds t
reat
ed 'W
ith m
ahua
oil
cak
e
(200
pp
m)
and
cro
ton
seed
(4
DP
m)
alon
g \\
ith
the
cont
rol
Per
iods
of o
bser
vati
on
~.
(dav
s)
1 15
30
45
60
75
Pon
ds
--------~
Mah
ua tr
eate
d po
nds
20.9
5 22
.28
17.4
1 18
.98
17.4
22
.46
Cro
ton
trea
ted
pond
s 19
.33
20.0
1 19
.4
21.7
7 19
.25
26.9
2
Com
mon
fee
der
cana
l 19
.43
17
15.9
7 16
.69
22.0
6 22
.65
Con
trol
pon
d 20
.91
20.4
1 17
.45
18.8
6 17
.78
23.3
8 --
Tab
le 2
1b.
Nit
rite
-nit
roge
n (N02-~} (
mic
rogr
am a
tll)
of t
he p
onds
tre
ated
-with
m
ahua
oil
cak
e (2
00pp
m)
---d
cro
ton
seed
(4 p
pm
) an
d th
e fe
eder
can
al a
long
wit
h th
e co
ntro
l P
erio
ds o
f obs
erva
tion
( day
s)
r-----
--__
. 1
15
30
45
60
75
---
Pon
ds
--------
-------
--M
ahua
tre
ated
pon
ds
0.28
0.
25
0.18
0.
23
0.29
0.
15
Cro
ton
trea
ted
pond
s 0.
35
0.44
0.
17
0.35
0.
4 0.
29
Con
trol
pon
d 0.
34
0.21
0.
15
0.21
0.
29
0.19
C
omm
on f
eede
r ca
nal
0.53
0.
23
0.44
0.
22
0.36
0.
19
90
22A
7 22
.11
21.7
5 20
.81
90 0.
25
0.28
0.28
0.
54
71
ammonia Nitrogen, nitrite Nitrogen, nitrate Nitrogen and
inorganic phosphate in the ponds treated with mahua oil cake and
croton seed and in the feeder canal were made and the data
obtained are presented in Tables 21 a-d.
The content of ammonia - Nitrogen in the ponds treated
with mahua oil cake varied between 17.4 pg at/I, (30th and 60th
day) and 22.47 pg at/l (90th day). In croton-treated ponds it
ranged between 19.25 fl9 at/l and 26.92 pg at/Ion the 60th day
and 75th day respectively. Water samples collected from the
feeder canal had an ammonia - Nitrogen content varying from 15.97
pg at/I, on the 30th day to 33.65 pg at/Ion the 75th day. The
ammonia - Nitrogen content of the control pond on the other hand
flutuated between 17.45?9 at/I, (day-30) and 23.38 ~g at/I,
(day-75). In general, the lowest and highest values of ammonia -
Nitrogen were encountered on the 30th and 75th day of treatment
in all the ponds including the feeder canal .
In the case of Nitrite - Nitrogen of mahua-treated
ponds, the minimal value of 0.15 pg at/l was recorded on the 75th
day and the maximum of 0.29 pg at/Ion the 60th day (Table 21 b).
The NO -N dipped from 0.28 pg at/l (day 1) to 0.18 pg at/l on 2
the 30th day increasing again upto the 60th day registering the
highest recorded value during the 90 days of observation.
The value of Nitrite - Nitrogen in the croton-treated
ponds ranged between 0.17 and 0.44 pg at/l with two peaks on the
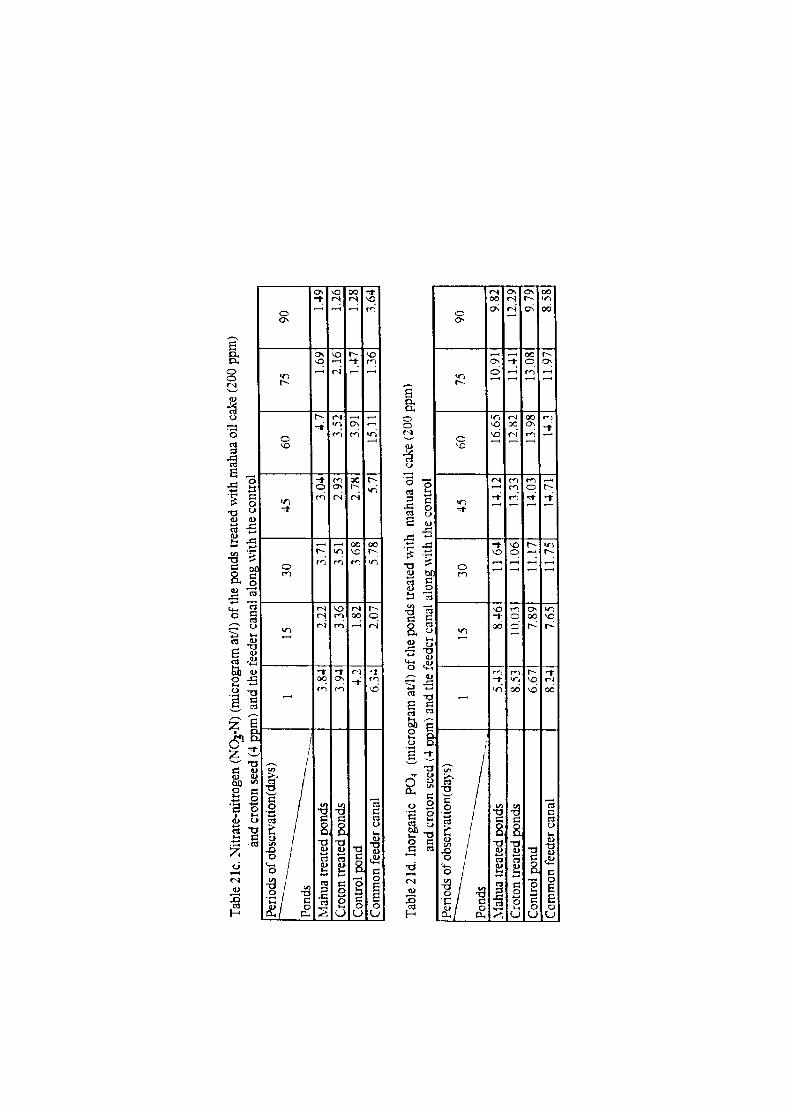
Tab
le 2
1e.
Nit
rate
-nit
roge
n (N
0.1-
N)
(mie
rogr
am a
tll)
of t
he p
onds
tre
ated
wit
h m
ahua
oil
cak
e (2
00 p
pm)
d cr
oton
see
d (4
ppm
) an
d th
e fe
eder
can
al a
long
wit
h th
e co
ntro
l P
erio
ds o
f obs
erva
tion
(day
s)
~~
1 15
30
45
60
75
Mah
ua t
reat
ed p
onds
3.
84
2.22
3.
71
3.04
4.
7 1.
69
Cro
ton
trea
ted
pond
s 3.
94
3.36
3.
51
2.93
3.
52
2.16
C
ontr
ol p
on
d
4.2
1.82
3.
68
2.78
3.
91
1.47
C
omm
on f
eede
r ca
nal
6.34
2.
07
5.78
5.
7 15
.11
1.36
-
._
-
Tab
le 2
1d.
Inor
gani
c P
04
(mic
rogr
am a
tll)
oft
he
pond
s tr
eate
d v,
ith
mah
ua
oil
cake
(20
0 pp
m)
..
d cr
oton
see
d (4
ppm
) an
d th
e fe
eder
can
al a
long
wit
h th
e co
ntro
l P
erio
ds o
f obs
erva
tion
(day
s)
-------.
.
1 15
30
45
60
75
-------~
Pon
ds
____
____
____
Mah
ua t
reat
ed J)
(mds
5.
43
8.46
11
.64
14.1
2 16
.65
10.9
1 C
roto
n tr
eate
d po
nds
8.53
10
.03
11.0
6 13
.33
12.8
2 11
.41
Con
trol
po
nd
6.
67
7.89
11
.17
14.0
3 13
.98
13.0
8 C
omm
on f
eede
r ca
nal
8.24
7.
65
11. 7
5 14
.71
14.3
11
.97
90 1.
49
1.26
1.28
3.
64
90 9.
82
12.2
9 9.
79
8.58
72
30th day (0.44 pg at/Ill and 60th day (0.4 ~g at/I) respectively.
The values of Ammonia - Nitrogen in the control pond
fluctuated between 0.15 pg at/I, and 0.34 pg at/I. From day-l
onwards, a declining trend was observed registering a minimal
-value on the 30th day, to rise again on the 60th day (29 ~g
at/I). The value then dropped to 0.19 pg at/l on the 75th day,
increasing thereafter to reach a value of 0.28 pg at/I, on day
90. In the feeder canal, the fluctuation of Nitrite - Nitrogen
was of an interesting nature, the values decreasing and
increasing on alternate dates of sampling at fortnightly
intervals. Here, the concentration ranged between 0.19 ~g at/I
and 0.53 ?g at/I, indicating 4 peaks, on the first (0.53 pg
at/I), 30th (0.44 pg/I), 60th (0.36 pg at/I) and 90th (0.54 pg
at/I) day.
Table 21 C outlines the data obtained on the
fortnightly fluctuations in Nitrate - Nitrogen (N03-N) of the
ponds treated with mahua oil cake and croton seed. In the mahua
-treated ponds the values of NO - N varied between 1.49 pg at/l 3
and 4.7 pg at/I, on the 90th day and 60th day, respectively.
From the start of the experiment to the 60th day, relatively
higher values of NO - N were recorded while those observed on 3
the 75th and 90th day have relatively lower. In the croton
treated ponds, on the other hand, a declining trend in NO N 3
values was observed from day-l to day-90; the values being 3.94
pg at/l and 1.26 ?g at/I, respectively. In the control pond, the
73
highest value of NO - N (4.2 ~g at/I) was recorded on the 1st 3
day and the lowest (1.28 pg at/l) on the 90th day.
Interestingly, on the 15th day the value was found to decline
sharply to 1.82 pg at/l to go up again and maintain a
comparatively higher level from the 30th to the 60th day. The
value then fell to a minimum on the 90th day. The NO 3
N
concentration of the feeder canal was highly fluctuating,
registering a high value of 15.11 pg at/l (60th day) and a low
of 1.36 ~g at/l (75th day). In general, the NO -N values 3
recorded during the first half of the sampling period were higher
in all the ponds including the feeder canal when compared to
those obtained during the latter part.The fortnightly
fluctuations in inorganic phosphate (PO ) at of the ponds treated 4
with mahua oil cake and croton seed are depicted in table 21d.
The phosphate values of mahua-treated ponds varied between 5.43
pg at/l, (day 1) and 16.65 pg atlll (day 60). Infact, the values
recorded from the 30th to the 75th day were compratively higher.
The same pattern of fluctuation of P04 values were observed in
the case of other ponds also, including the feeder canal. In
the croton-treated ponds, the P04 values ranged between 8.53 pg
at/l (day -1) and 13.33 pg at/l (day -45). In the control pond,
the lowest PO values of 6.67 pg at/l was registered on the 1st 4
day and the highest of 14.03 pg at/l on the 45th day. In the
feeder canal the PO values ranged between 7.65 pg at/l and 14.71 4
pg at/1 on the 15&45 th day respectively. It is evident from the
Table (Table 21d) that in all the ponds and feeder canals, covered
74
under the present study the highest PO concentations were 4
recorded on the 45th day with the exception of the mahua-treated
ponds where it was on the 60th day of treatment.
4.2.2.3.2. Primary production
The variations in primary production in the
control and experimental ponds treated with mahua oil cake and
croton seed were recorded at fortnightly intervals over a period
of 90 days. Table 22 and Figs. 8a-d outlines the results
obtained on the production pattern. It is evident from the Table
that the gross production in the mahua-treated pond increased 3
steadily from an initial value of 1561.55 mg elm ,day recorded on 3
the 1st day, reaching a peak value of 6657.11 mg elm Iday on the 3
60th day to decline thereafter to a value of 4209.38 mf elm Iday
on the 90th day. The variations in gross production in the
control pond also followed the same pattern, registering a higher
magnitude of production on all sampling days when compared to
the treatment pond. The gross production values in the control 3
pond ranged 3
from 1722.35 mg elm Iday at 0 hour to 7132.36 mg
elm Iday on the 60th day, the value 3
elm Iday on the 90th day.
declining to 4488.1 mg
In the case of net production in the treatment ponds, 3
an increasing trend was observed from day-1 (793.28 mg elm Iday),
registering a peak value of production on the 30th day (4491.67 3
elm Iday). Thereafter, the values were of a highly fluctuating
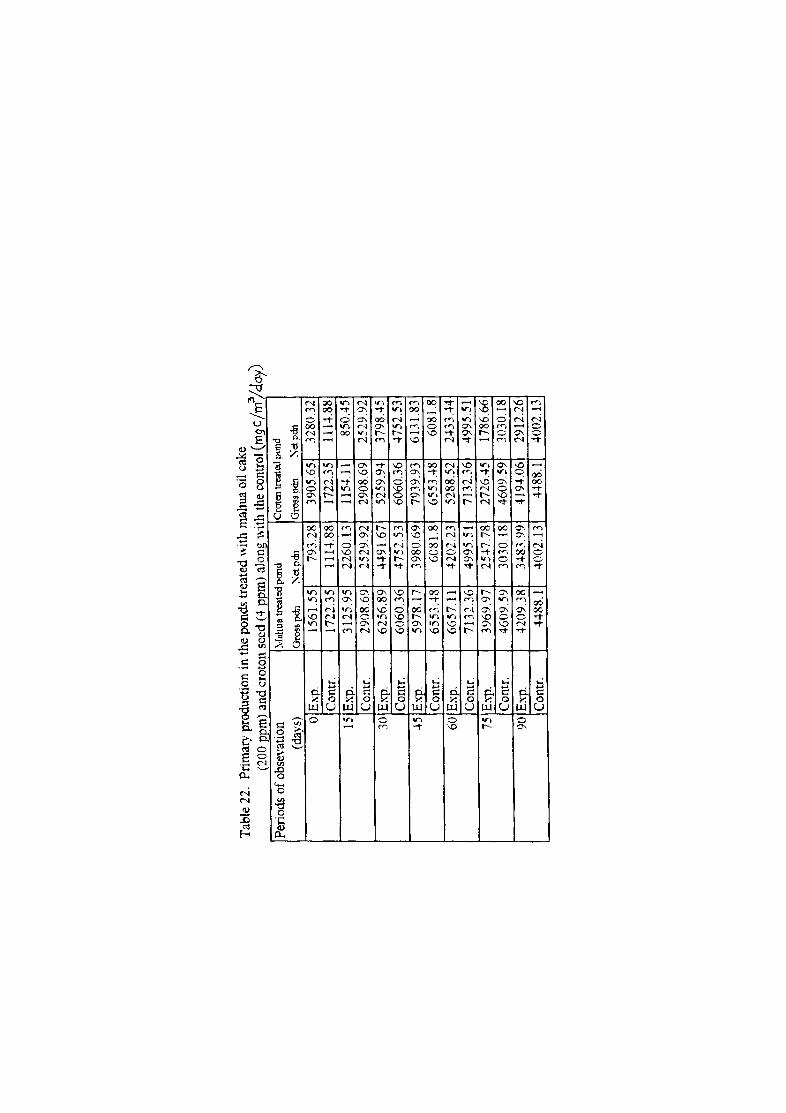
Tab
le 2
2.
Pri
mar
y pr
oduc
tion
in
the
pond
s tr
eate
d w
ith
mah
ua o
il c
ake
(200
ppm
) an
d c
roto
n se
ed (
4 pp
m)
a1(m
g'l;
ith th
~con
trol
(111
9 c/m
3 /do.
y)
Per
iods
of o
bse\
'ati
on
~vlahua
trea
ted
pond
C
rote
n tr
eate
d po
nd
(day
s)
Gro
sspd
n ~apdlJ
Gro
sspd
n ~etpdn
o E:
\-p.
1561
.55
793.
28
3905
.65
3280
.32
Con
tr.
1722
.35
1114
.88
1722
.35
1114
.88:
15 E
xp.
3125
.95
2260
.13
1154
.11
850.
451
Con
tr.
2908
.69
2529
.92
2908
.69
2529
.92
30 E
xp.
6256
.89
4491
.67
5259
.94
3798
.45
Con
tr.
6060
.36
4752
.53
6060
.36
4752
.53
45 E
xp.
5978
.17
3980
.69
7939
.93
6131
.83
Con
tr.
6553
.48
6081
.8
6553
.48
6081
.8
60 E
:\-p.
66
57.1
1 42
02.2
3 52
88.5
2 24
33.4
4 C
ontr
. 71
32.3
6 49
95.5
1 71
32.3
6 49
95.5
1 75
b-p
. 39
69.9
7 25
47.7
8 27
26.4
5 17
86.6
6 C
ontr
. 46
09.5
9 30
30.1
8 46
09.5
9 30
30.1
8 90
Exp
. 42
09.3
8 34
83.9
9 41
9·t0
6 29
12.2
6 C
ontr
. --
--±
-488
.1
4002
.13
4488
.1
4002
.13
--
----
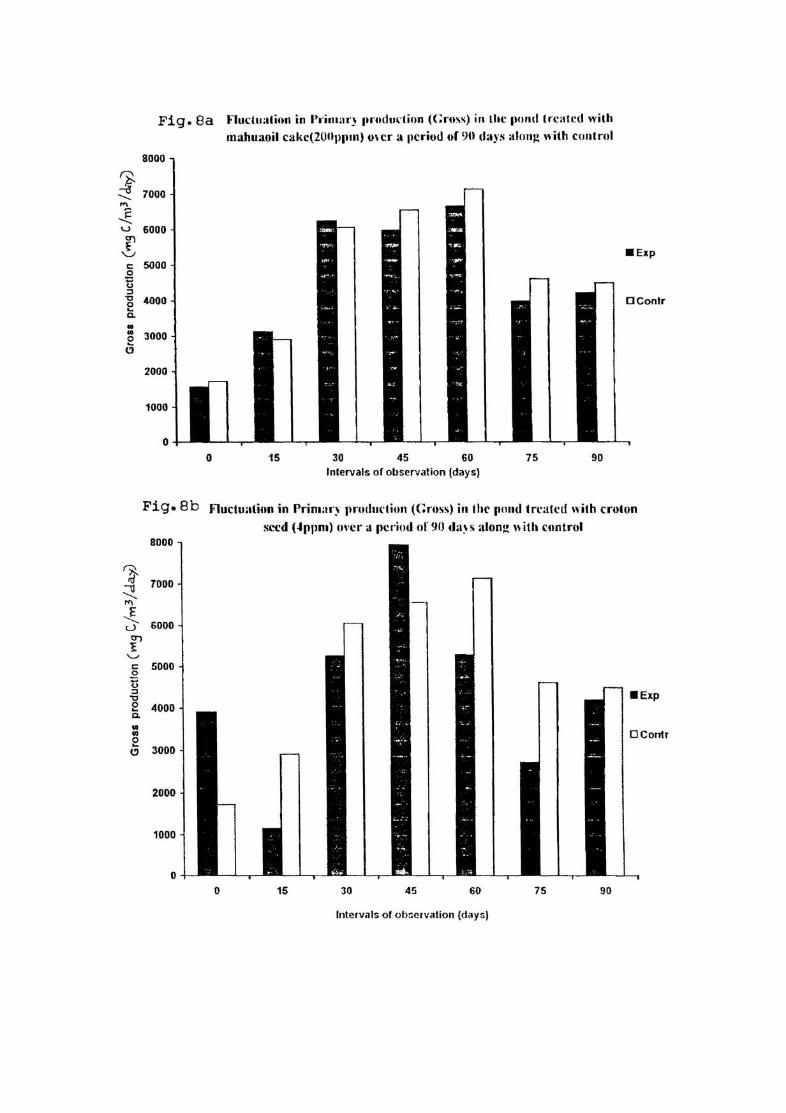
~ .::!! ").
-<' u
r '-'
I ~ 0 -~ • • e "
'X ;; :::!. M
-t '-' r ~
0 0
jj , ~ e ~
• • e "
Fig. Sa nuclU:llitlll ill l'I'illl:l r } 1""IIII1I("tiun «:m,s) ill Ihe 1IIIIId t reated with
rnahuaoil cakc(2UItPIUII ) 0\ er a 11CriotJ or 90 da}'s a lflllJ! "ilh contrul
8000
7000
6000
50 ..
... , 300'
2 .. ,
1000
,
Fig.Sb
8000
7000
6000
!iODO
4000
3000
2 ...
1000
•
_ eap
[] Conlr
• 45 " 75 " Intervals of olIservatkm Iday!»
FlucIlmti4ln in P.-imal'} IH"lIIJm'liull «;ross) illlht' (l llIId in'ah:tJ nilh c,.ohm
sl't:d (~Pllm) (n'c r a I,cl'iml fir 911 IIll,' S :llon2 "ith cuntrol
_Eap
DContr
o ,. 3. 45 " 75 90
Il1lcrVil ls o r O":;c rvillion (dilysl
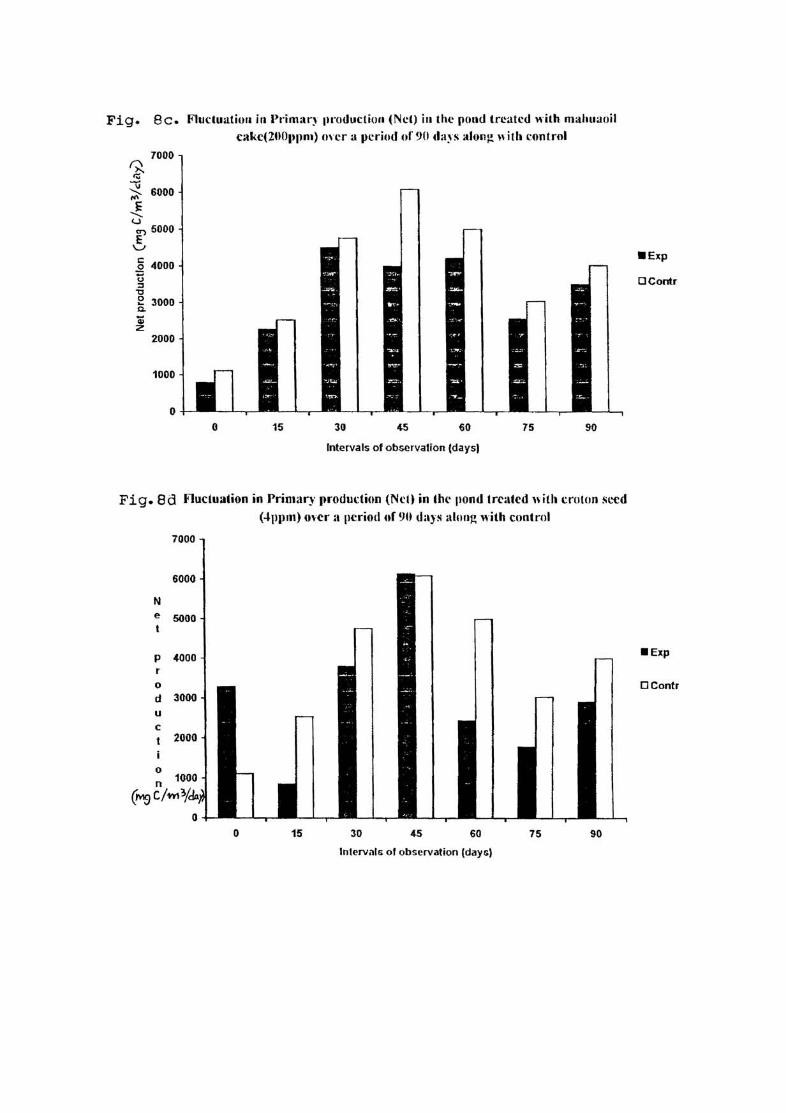
Fig. Bc. F1u~ t u;llilJlI itl Prim;lr, llroductiun (Net) ill tllc pond treated ~"ilh rnahu :.loil
c:'lkct211f11'llnl) m"cr a pcriud IIr 9(1 d:l, S :dt)J1~ ldl h coni rol 7000
r;:. " ~ 6000
~ ~ 5000
~ 0
4000
" ~ , " • ~ ,oo, ~ z
2000
1000
, , 15 3D " 75 " Interv.lIts 01 obsel v.lIlion (d.llys)
Fig. Bd Fluclu.dion in Primary proum:litlJl (Ncil in ,Ill" pond lrC;I'c<I "ilh ~r(l1U1I sl'"Cd (4IJllIn) mer :1 period of 9U (bys .. lung with control
7000
6000
N e SODD
p 4000 , 0
d '000 u , t 2000
0
n 1000
, , Intervals 01 observation (days)
_ Exp
IJContf
oeont r
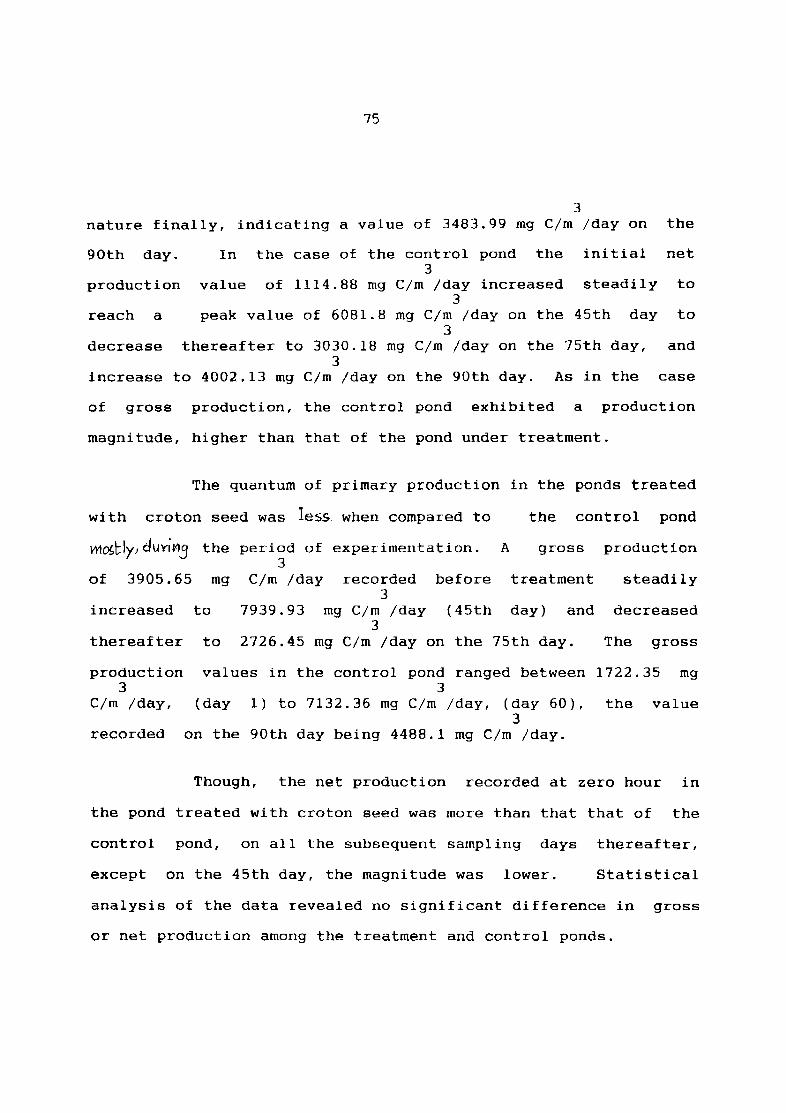
75
3 nature finally, indicating a value of 3483.99 mg elm Iday on the
90th day. In the case of the control pond the initial net 3
production value of 1114.88 mg elm Iday increased steadily to 3
reach a peak value of 6081.8 mg elm Iday on the 45th day to 3
decrease thereafter to 3030.18 mg elm Iday on the 75th day, and 3
increase to 4002.13 mg elm jday on the 90th day. As in the case
of gross production, the control pond exhibited a production
magnitude, higher than that of the pond under treatment.
The quantum of primary production in the ponds treated
with croton seed was less when compared to the control pond
Y\1~tly) duvi¥l3 the period of experimentation. A gross 3
production
of 3905.65 mg ejm Iday recorded before treatment steadily 3
increased to 7939.93 mg elm jday (45th day) and decreased 3
thereafter to 2726.45 mg ejm jday on the 75th day. The gross
production 3
ejm Iday,
recorded
values in the control pond ranged between 1722.35 mg 3
(day 1) to 7132.36 mg ejm jday, (day 60), the value 3
on the 90th day being 4488.1 mg elm Iday.
Though, the net production recorded at zero hour in
the pond treated with croton seed was more than that that of the
control pond, on all the subsequent sampling days thereafter,
except on the 45th day, the magnitude was lower. Statistical
analysis of the data revealed no significant difference in gross
or net production among the treatment and control ponds.
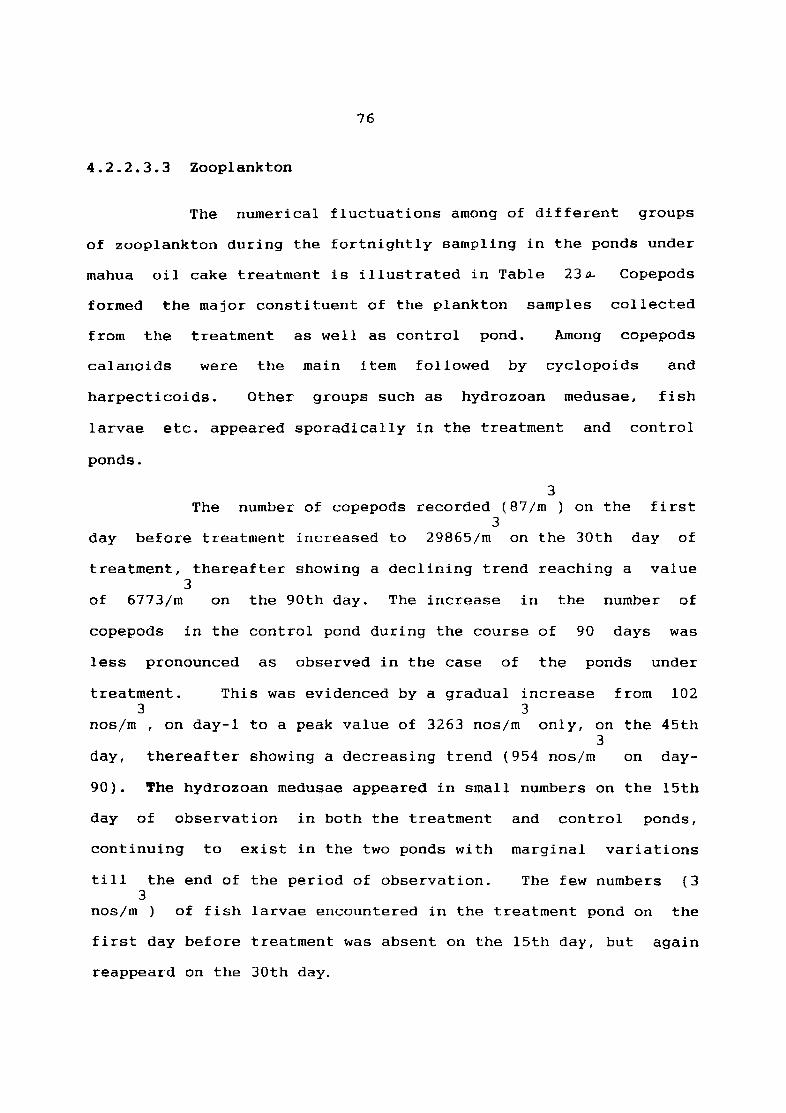
76
4.2.2.3.3 Zooplankton
The numerical fluctuations among of different groups
of zooplankton during the fortnightly sampling in the ponds under
mahua oil cake treatment is illustrated in Table 23~ Copepods
formed the major constituent of the plankton samples collected
from the treatment as well as control pond. Among copepods
calanoids were the main item followed by cyclopoids and
harpecticoids. Other groups such as hydrozoan medusae, fish
larvae etc. appeared sporadically in the treatment and control
ponds.
3 The number of copepods recorded (87/m ) on the first
3 day before treatment increased to 29865/m on the 30th day of
treatment, thereafter showing a declining trend reaching a value 3
of 6773/m on the 90th day. The increase in the number of
copepods in the control pond during the course of 90 days was
less pronounced as observed in the case of the ponds under
treatment. 3
nos/m , on
This was evidenced by a gradual increase from 102 3
day-1 to a peak value of 3263 nos/m only, on the 45th 3
day, thereafter showing a decreasing trend (954 nos/m on day-
90). The hydrozoan medusae appeared in small numbers on the 15th
day of observation in both the treatment and control ponds,
continuing to exist in the two ponds with marginal variations
till the end of the period of observation. The few numbers (3 3
nos/m) of fish larvae encountered in the treatment pond on the
first day before treatment was absent on the 15th day, but again
reappeard on the 30th day.
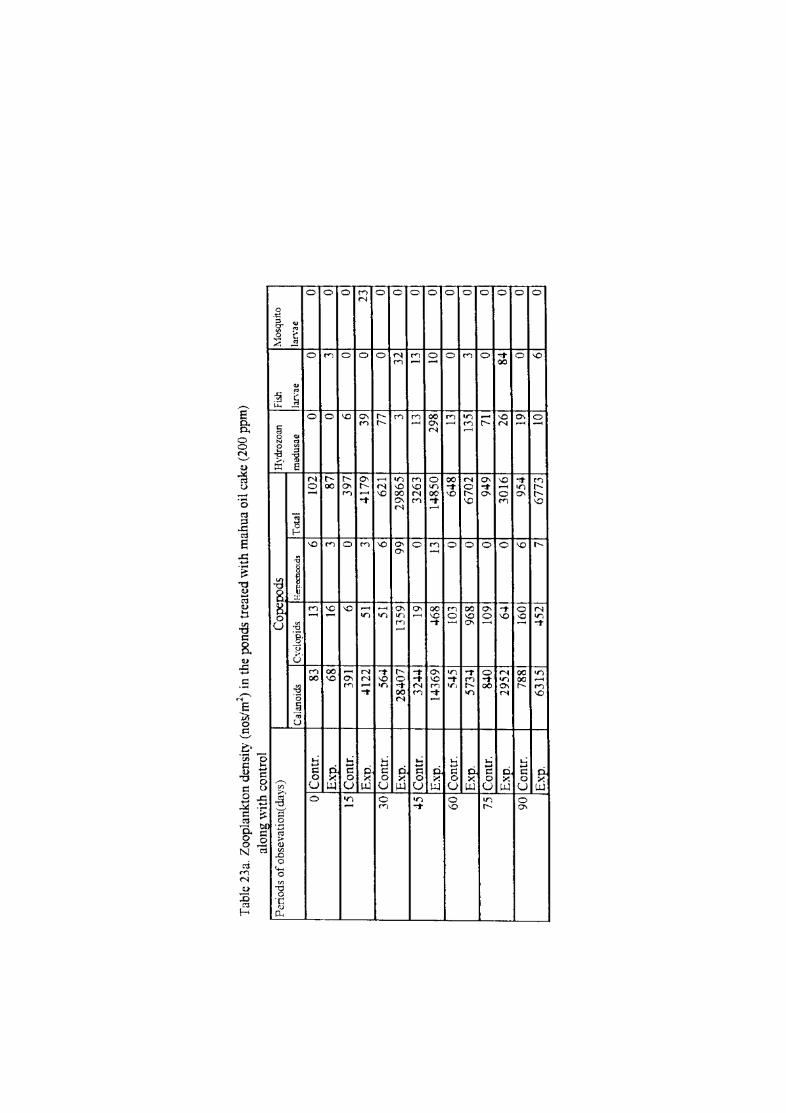
Tab
le 2
3a.
Zoo
plan
kton
den
sity
(no
s/m
2) i
n th
e po
nds
trea
ted
wit
h m
ahua
oil
cak
e (2
00 p
pm)
long
wit
h co
ntro
l -
---
---
-P
erio
ds o
f obs
evat
ion(
day
s)
Cop
epJd
s H
ydro
zoan
Fi
sh
Mos
quit
o
Cal
anoi
ds
C\'c
!opi
ds
E~e;;tJ.OOld!l
Tot
al
med
usae
la
rvae
la
rvae
o C
ontr
. 83
13
6
102
0 0
0
Exp
. 68
16
3
87
0 3
0
15 C
onlr
. 39
1 6
0 39
7 6
0 0
Exp
. 41
22
51
3 41
79
39
0 23
30
Con
tr.
564
51
6 62
1 77
0
0
Exo
. 28
407
1359
99
29
865
3 32
0
45 C
onlr
. 32
44
19
0 32
63
13
13
0 E
xp.
1436
9 46
8 13
14
850
298
10
0 60
Con
tr.
545
103
0 64
8 13
0
0 E
xp.
5734
96
8 0
6702
13
5 3
0
75 C
onlr
. 84
0 10
9 0
949
71
0 0
Exp
. 29
52
64
0 30
16
26
84
0 90
Con
tr.
788
160
6 95
4 19
0
0 E
xp.
6315
45
2 7
6773
10
6
0
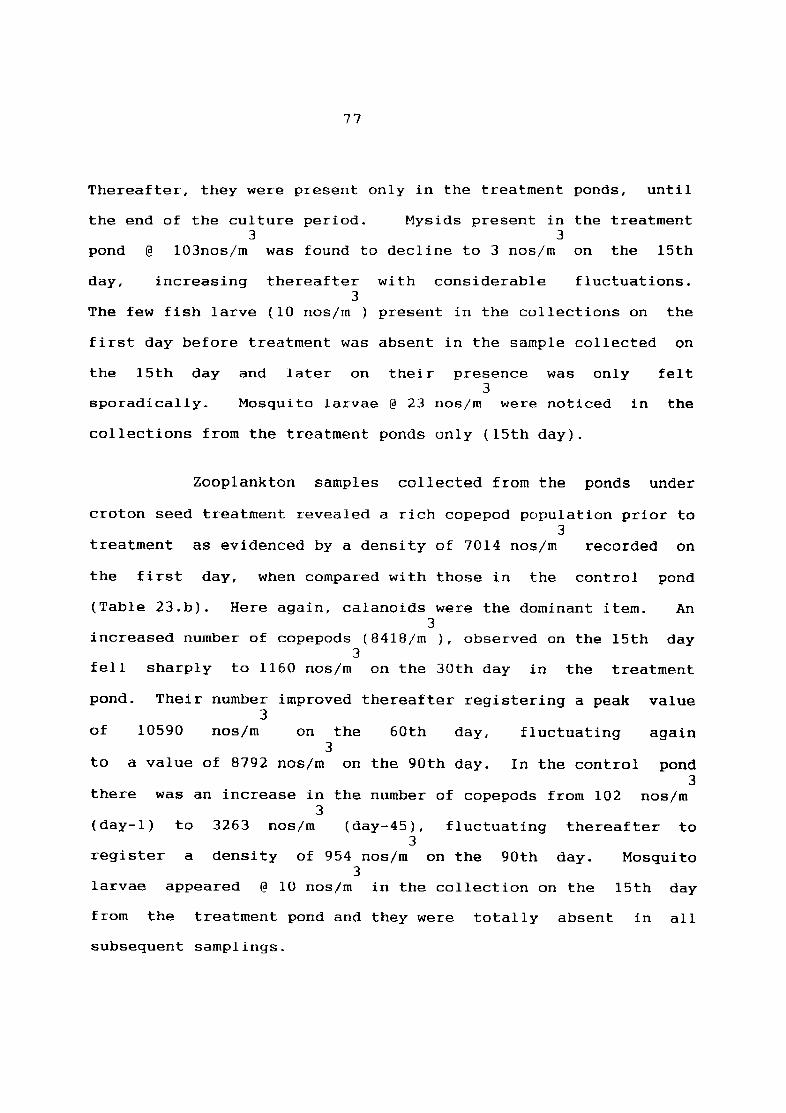
77
Thereafter, they were present only in the treatment ponds, until
the end of the culture period. 3
Mysids present in the treatment 3
pond @ 103nos/m was found to decline to 3 nos/m on the 15th
day, increasing thereafter with considerable fluctuations. 3
The few fish larve (10 nos/m) present in the collections on the
first day before treatment was absent in the sample collected on
the 15th day and later on their presence was only 3
felt
sporadically. Mosquito larvae @ 23 nos/m were noticed in the
collections from the treatment ponds only (15th day).
Zooplankton samples collected from the ponds under
croton seed treatment revealed a rich copepod population prior to 3
treatment as evidenced by a density of 7014 nos/m recorded on
the first day, when compared with those in the control pond
(Table 23.b). Here again, calanoids were the dominant item. An 3
increased number of copepods (8418/m ), observed on the 15th day 3
fell sharply to 1160 nos/m on the 30th day in the treatment
pond. Their number improved thereafter registering a peak value 3
of 10590 nos/m on the 3
60th day, fluctuating again
to a value of 8792 nos/m on the 90th day. In the control pond 3
there was an increase in the number of cope pods from 102 nos/m 3
(day-I) to 3263 nos/m (day-45), 3
fluctuating thereafter to
register a density of 954 nos/m on the 90th day. 3
Mosquito
larvae appeared @ 10 nos/m in the collection on the 15th day
from the treatment pond and they were totally absent in all
subsequent samplings.
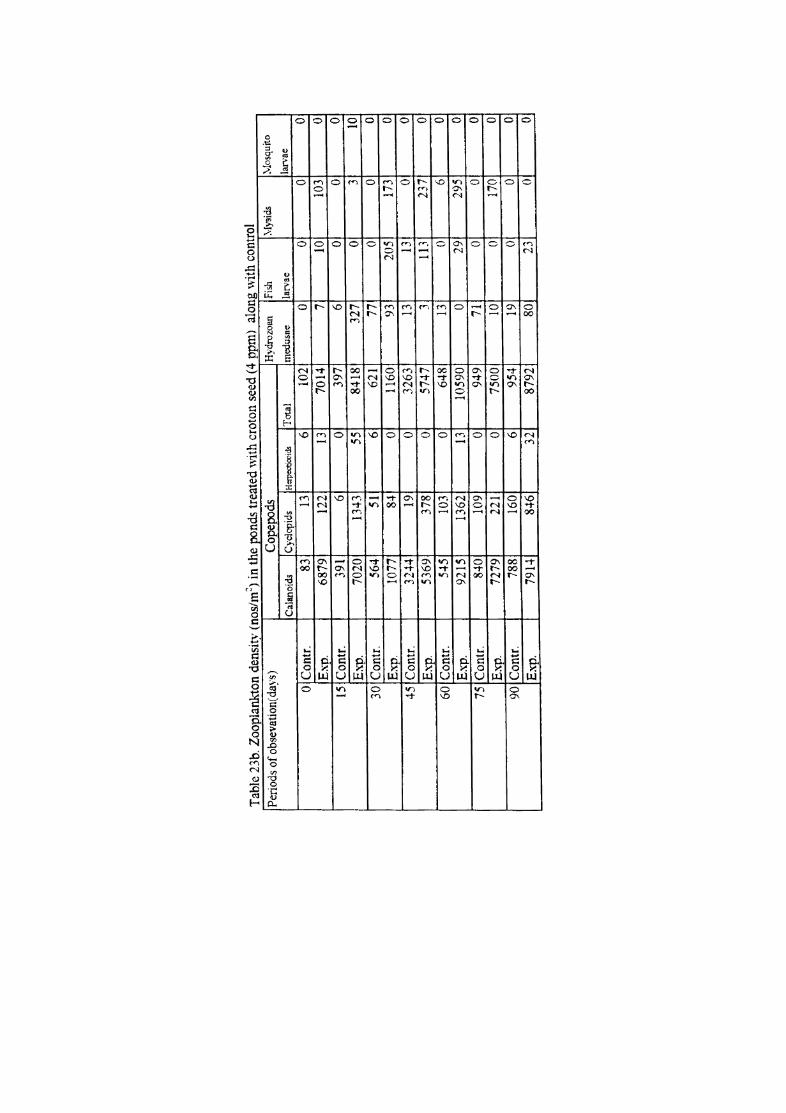
Tab
le 2
3b. Z
oopl
ankt
on d
ensi
ty (
nos/
m:)
in th
e po
nds
trea
ted
wit
h cr
oton
see
d (4
ppm
) al
ong
wit
h c
ontr
ol
Peri
ods
of o
bsev
atio
n( d
ays)
C
opep
ods
Hyd
rozo
an
Fish
~·
Iysi
ds
;vlo
squi
to
Cal
anoi
ds
Cyc
lopi
ds
Her
pect
iroid
s T
otal
m
edus
ae
larv
ae
lar.-
ae
° Con
tr.
83
13
6 10
2 0
0 0
0 E:
'I.-P.
68
79
122
13
7014
7
10
103
0,
15 C
ontr
. 39
1 6
° 39
7 6
0 0
01
Exp
. 70
20
1343
55
84
18
327
0 3
101
30 C
ontr
. 56
4 51
6
621
77
0 0
01
Exp
. 10
77
84
0 11
60
93
205
173
01
45 C
ontr
. 32
-+4
19
0 32
63
13
13
0 01
Exp
. 53
69
378
0 57
47
3 11
3 23
7 0
60 C
ontr
. 54
5 10
3 0
648
13
0 6
0 E
xp.
9215
13
62
13
1059
0 0
29
295
0
I 75
Con
tr.
840
109
0 94
9 71
0
0 0
I E
xp.
7279
22
1 0
7500
10
0
170
0
90 C
ontc
. 78
8 16
0 6
954
19
0 0
0
. E
xp: .
. 79
14
846
32
8792
80
23
0
0
78
4.2.2.3.4 Macrobenthos
As part of the studies on the effect of mahua oil cake
and croton seed on the productivity of prawn culture systems,
fortnightly samples of macrobenthos were collected to understand
their abundance and variations during a prawn culture period of 3
months and the data are presented in tables, 24 a and 24 b.
Table 24 a contains data on the variations of
macrobenthos in number and biomass (wet weight) in ponds treated
with the optimum concentration of mahua oil cake (200 ppm)
delineated
components
during
of the
the present
macrobenthos,
study. Among the various
polychaetes constituted the
dominant item. Within the first fortnight after the application
of mahua oil cake, their number and biomass registered a
considerable reduction, following the same trend thereafter to be
completely absent from day 60 onwards. Though, the declining
trend was noticed among the polychaete population from the
control pond also, their continued presence in the latter pond
was observed upto the 75th day of treatment.
Amphipods and tanaids were uniformly represented in
the collections from the treatment and control ponds upto the
30th day, a gradually declining trend being observed in the case
of amphipods and a sharp reduction among tanaids. Sea anemones
were recorded in the collection upto the 45th and 60th day in the
treatment and control ponds respectively.
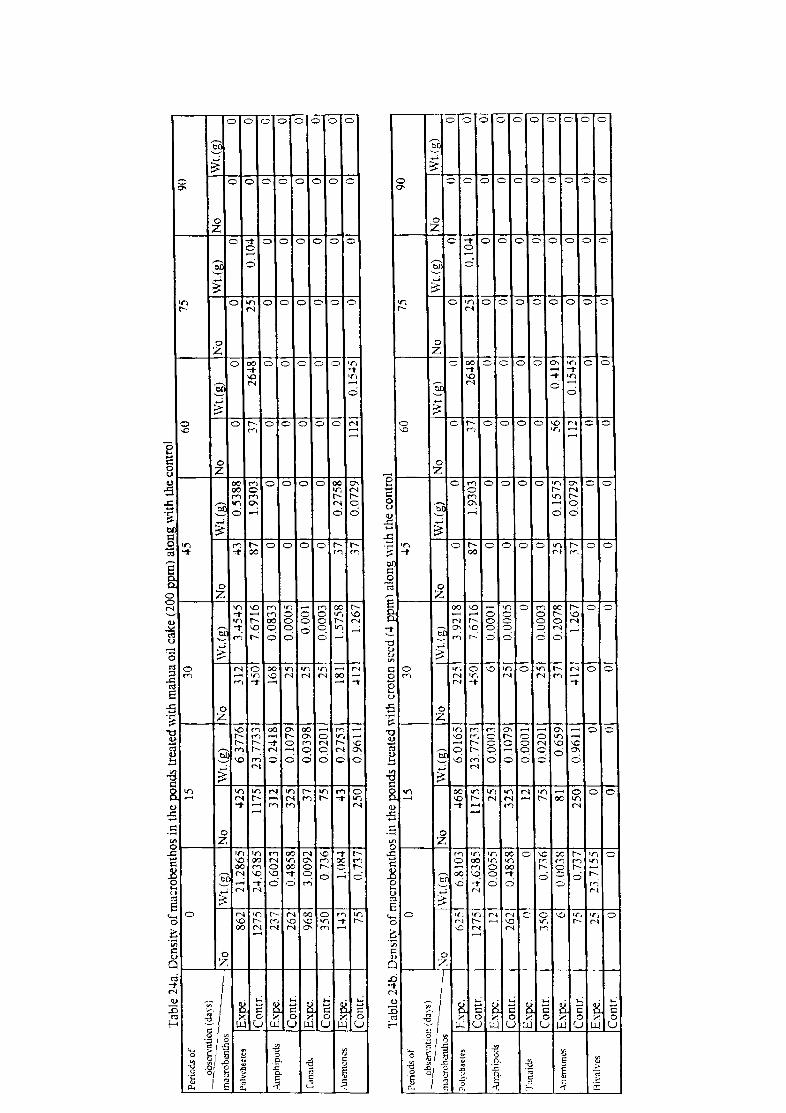
~ ..
---
---.
~-
---~-~--
----
-"
-,
---
-T
able
24a
. D
f
,be n
th
h ds
d
wit
h ak
, h
th
Per
iods
of
0 15
30
45
60
75
90
_~~tion (
da''S
)
mac
robe
nili
os
:\"0
\Vt.
(g)
No
Wt.
(g)
No
\Vt.
(g)
No
Wt.
(g)
No
\Vt.
(g)
No
Wt.{
g)
No
Wt.
(g)
Pol
.wh •
• te,
E
xpe.
86
2 21
.286
5 42
5 6.
3776
31
2 3.
4545
43
0.
5388
0
0 0
0 0
0 C
ontr
. 12
75
24.6
385
1175
23
.773
3 45
0 7.
6716
8
7
1.93
03
37
2648
25
0.
104
0 0
. ..\..m
phip
ods
Exp
e.
237
0.60
23
312
0,24
18
168
0.08
33
0 0
0 0
0 0
0 0
Com
r. 26
2 0.
4858
32
5 0,
1079
25
0.
0005
0
0 0
0 0
0 0
0 T
anai
ds
Exp
e.
968
3,00
92
37
0.
0398
25
0.
001
0 0
0 0
0 0
0 0
Con
tr.
350
0.73
6 75
0,
0201
25
0.
0003
0
0 0
0 0
0 0
0 A
nem
One
s EX
}Je.
143
1.08
4 43
0.
2753
18
1 1.
5758
3
7
0.2
75
8
01
0 0
0 0
0 C
ontr
. 75
0.
737
250
0.96
11
~l~ L-~1.2§7
37
_O,O72~ ,-
--. _
_
11 ~L __
0.15
451
0 0
0 0
--
_. --------
Tab
le 2
4b.
D
---
.---
--
---
--
.... --
-r..~--
f be
nth
h ds
d
with
d
. h t
h
Per
iods
of
0 15
30
45
60
75
90
_-9.P2~ .. ,t
ion
(da
ys)
mac
'mhe
nili
0s -----~ ;-
;0
Wt.
(g)
No
Wt.
{g)
No
\Vt.(
g)
No
Wt.
(g)
No
\V1.
( g)
No
\Vt(
g)
No
Wt.
(g)
Poll·
oh ••
le,
Exp
c.
625
6.81
03
468
6.01
65
225
3.92
18
0 0
0 0
0 0
0 0
Con
tr.
1275
2*
.638
5 11
75
23.7
733
450
7.67
16
87
1. 93
03
37
2648
25
0.
104
0 0
...I,m
phip
ods
Exp
e.
12
O.0
0S5
25
0.00
03
6 0.
0001
0
0 0
0 0
0 0
0 C
ontr
. 26
2 0.
4858
32
5 0.
1079
25
0.
0005
0
0 0
0 0
0 0
0 T
anJi
ds
bR
e,
0 0
12
0,00
01
0 0
0 0
0 0
0 0
0 0
Con
tr.
350
0,73
6 75
0.
0201
25
0.
0003
0
0 0
0 0
0 0
0 AnLmon~~
Exp
e.
6 0,
0038
81
0.
659
37
0.20
78
25
0.15
75
56
0.41
9 0
0 0
0
Con
tr.
75
0.73
7 25
0 0.
9611
41
2 1.
267
37
0.07
29
112
0.15
45
0 0
0 0
Bi\'
,1iv
es
Exp
e.
2S
23.7
155
0 0
0 0
0 0
0 0
0 0
0 0
Con
tr.
0 ()
0
0 0
0 0
0 0
0 0
0 0
0 -

79
The fortnightly variations in numerical abundance and
biomass of macrobenthos in ponds treated with croton seed are
presented in table 24.b. Among the different organisms
polychaetes were the most abundant group. From an initial value 2 2
of 625 nos/m (day 1) their number dwindled to 225 nos/m on the
30th day, disappearing completely thereafter, unlike in the
control pond where polychaetes were present in the collections
upto the 75th day. Tanaids and amphipods were recorded only upto
the 30th day in both treatment and control ponds. Sea anemones
revealed an increasing trend with frequent fluctuations from zero
hour onwards, disappearing altogether from the collections from
the 75th day. Although bivalves were present in the collections
from the pond under treatment at zero hour, they were totally
absent in all subsequent samplings.
4.2.2.3.5. Growth, Survival and Production of Penaeus indicus in
ponds treated with mahua oil cake and croton seed.
Subsequent to the elimination of undesirable organisms
from the culture ponds by treating with the optimum
concentrations of mahua oil cake and croton seed. (200 ppm and 4
ppm, respectively), seeds of the Penaeid prawn, Penaeus indicus
were stocked in the ponds on the fifth day following application
of the piscicides and their daily rate of growth in length and
weight, survival and production profile were followed upto a
period of 85 days (Tables, 25a-c).
Table 25 a & Fig.9 contains details of the growth
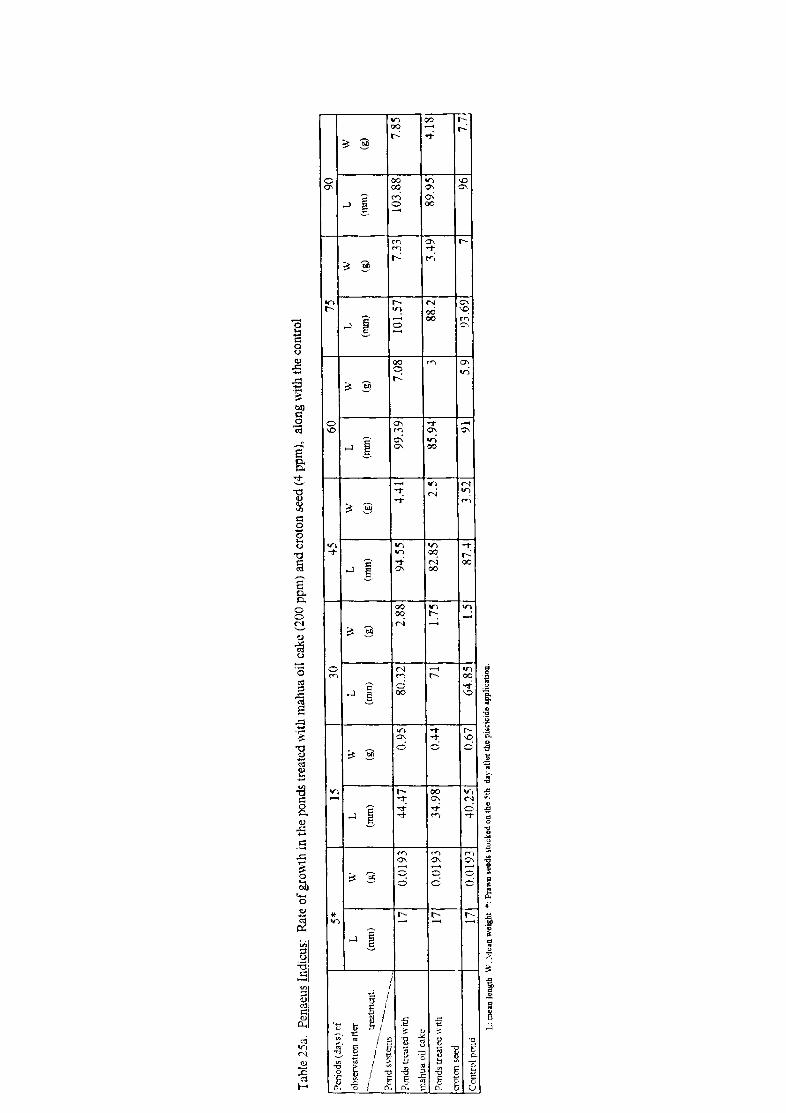
Tab
le 2
5:1.
Pena
eus
Indi
cus:
R
ate
of g
rm,v
th i
n th
e po
nds
trea
ted
",it
h m
ahua
oil
cake
(20
0 pp
m)
and
crot
on s
eed
(4 p
pm),
alon
g \'"
it11
the
cont
rol
Per
iods
(da~s.l c
f 5*
15
30
45
60
7S
90
ob
serv
atio
n al
ter
L \l
,' L
W
L W
L
\l,'
L W
L
W
L w
,
-~-~
----
- ~.
tre'
ltm
::nt
. (n
Ull)
(g
) (m
m)
(g)
(mm
) (g
) (m
m)
(g)
<mm
) (g
) (m
m)
(g)
(mm
) (g
) ---
--.......
P
ond
sv~1erl15
- --------
-P
mci
s tr
e'lt
ed w
ith
17
0.01
93
44,4
7 0.
95
80.3
2 2.
88
94.5
5 4.
41
99.3
9 7.
08
101.
57
7.33
10
3.88
7.
851
mah
ua 0
il ca
ke
Pon
ds t
reat
ed"
ith
17
0.01
93
34.9
8 0.
44
71
1.75
82
.85
2.5
85.9
4 3
88.2
3,
49
89.9
5 4.
181
crot
em s
eed
j
Con
trol
p("
{ld
17
0.01
93
__
·m25
_ 0.
67 L
~4.85 -
1.5
87,4
3.
52
91
5.9
93.6
9 7
96
7.71
--
---
--
...
---"-
-
L: m
ean
leng
th
W, )
,(ea
n w
eigh
t .,
Pu
"" ,.
od
s 'lo
cked
on
tbe ~(
h d.
oy a
fter
the
p"c;
cido
app
li .. t
ion.
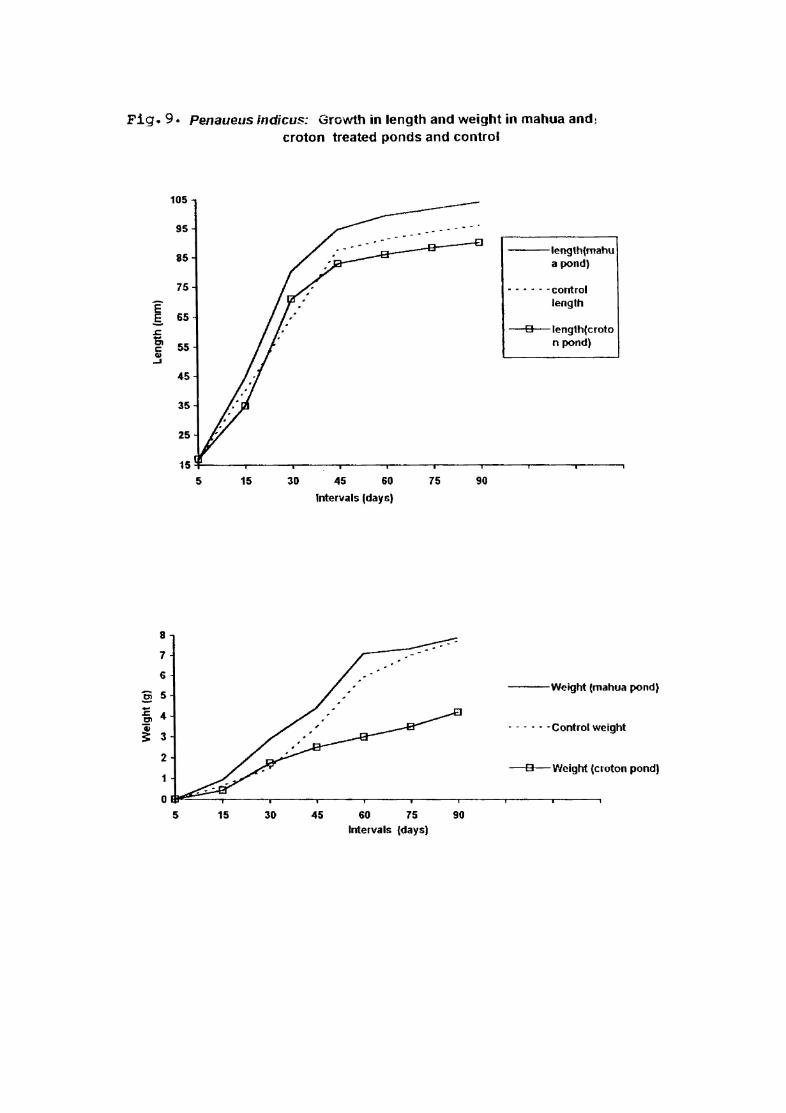
Fig. 9. Penaueus jndicu~; Growth in length and weight in mahua and: croton treated ponds and control
105
95
85
7S
E .§. 65 .s::. 51 55 c:: III
....I
45
35
25
15
8
7
6
§ 5
l:; 4 Cl 'ii ~ 3
2
0
5
5 15 3D 45 60
Intervals (days)
15 30 45 60 75 Intervals (days)
75 90
90
---Iength{mahu a pond)
" " " " " "control length
o length(croto n pond)
---Weight !mahua pond)
..... "Control weight
8 Weight (croton pond)
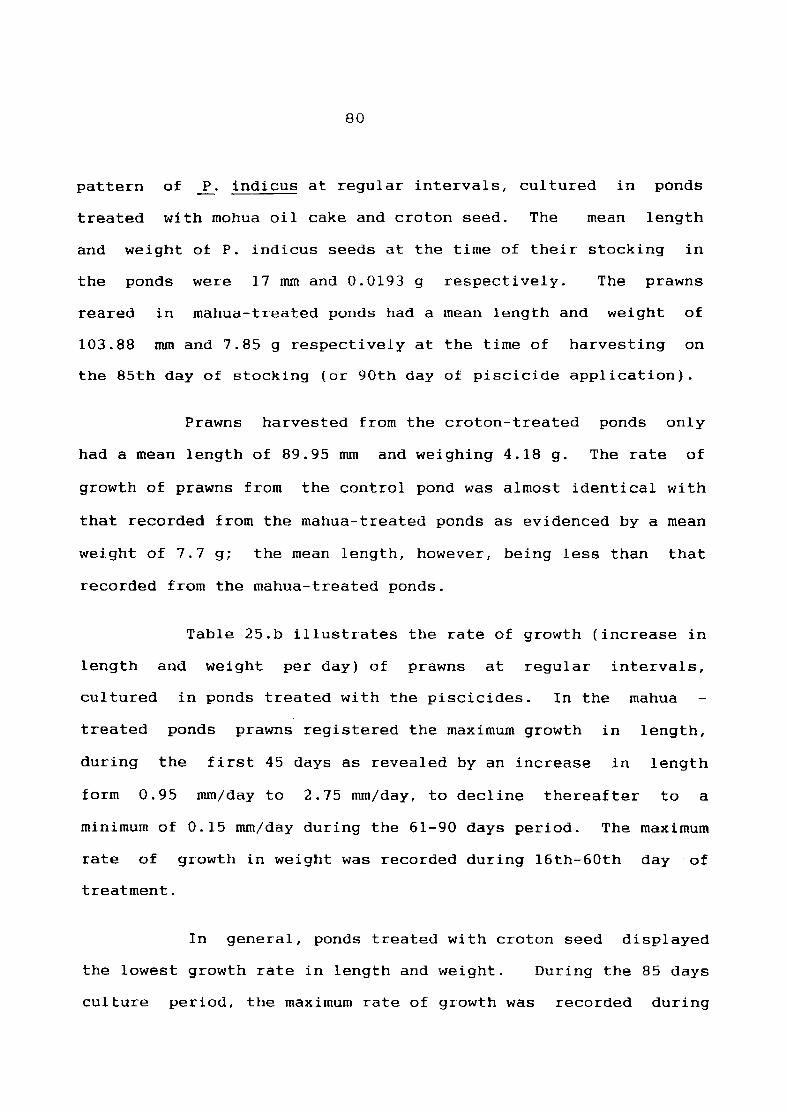
80
pattern
treated
of P. indicus at regular intervals, cultured in ponds
length with mohua oil cake and croton seed. The mean
and weight of P. indicus seeds at the time of their stocking in
the ponds were 17 mm and 0.0193 g respectively. The prawns
reared in mahua-treated ponds had a mean length and weight of
103.88 mm and 7.85 g respectively at the time of harvesting on
the 85th day of stocking (or 90th day of piscicide application).
Prawns harvested from the croton-treated
had a mean length of 89.95 mm and weighing 4.18 g.
ponds
The rate
only
of
growth of prawns from the control pond was almost identical with
that recorded from the mahua-treated ponds as evidenced by a mean
weight of 7.7 g; the mean length, however, being less than that
recorded from the mahua-treated ponds.
Table 25.b illustrates the rate of growth (increase in
length and weight per day) of prawns at regular intervals,
cultured in ponds treated with the piscicides. In the mahua
treated ponds prawns registered the maximum growth in length,
during the first 45 days as revealed by an increase in length
form 0.95 mm/day to 2.75 mm/day, to decline thereafter to a
minimum of 0.15 mm/day during the 61-90 days period. The maximum
rate of growth in weight was recorded during 16th-60th day of
treatment.
In general, ponds treated with croton seed displayed
the lowest growth rate in length and weight. During the 85 days
culture period, the maximum rate of growth was recorded during
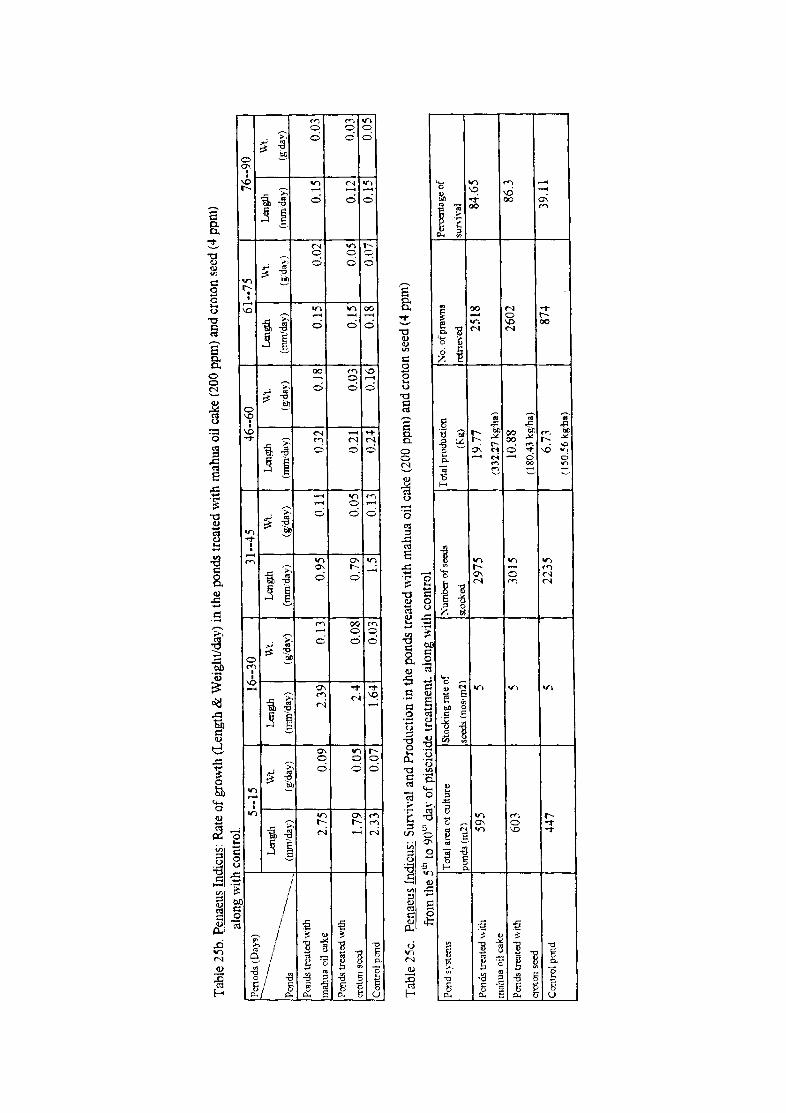
Tab
le 2
5b.
Pen
aeus
Ind
icus
: R
ate
of gro
~th
(Len
gth
& W
eigh
t/da
y) i
n t
he p
onds
tre
ated
wit
h m
ahua
oil
cak
e (2
00 p
pm)
and
crot
on s
eed
(4 p
pm)
alon
g lv
1th
cont
rol
~e.n
ods
(Day
s)
5--1
5 16
--30
31
--45
46
--60
61
--75
76
--90
-~-
Len
gth
Wt.
Len
gth
Wt.
Len
gth
Wt.
Len
gth
Wl.
Len
gth
\l,'t.
L
engt
h W
t.
Pon
ds
~--...
......
. (m
m!d
ay)
(gid
av)
(mm
/day
) (g
1day
) (m
m d
ay)
(gid
ay)
(mm
-day
) (g
day
) (m
m1d
ay)
(gd
ay)
(mm
day
) (g
day
)
Pon
ds tr
eate
d w
ith
,
mah
ua o
il ca
ke
2.75
0.
09
2.39
0.
13
0.95
0.
11
0.32
0.
18
0.15
0.
02
0.15
0.
03
Pon
ds tr
eate
d w
ith
i
crot
on s
eed
1.79
0.
05
2,4
0.08
0.
79
0.05
0.
21
0.03
0.
15
0.05
0.
12
0.03
,
Con
trol
pen
d 2.
33
0.07
1.
64 _
QR
l ___
_ 1-1
__
.°1
1 .
--.2
1.±
0.16
0
.l8
0.
07
0.15
0.
051
--,-
Tab
le 2
5c.
Pen
aeus
Ind
icus
: S
un
iyal
an
d P
rodu
ctio
n in
the
pond
s tr
eate
d "1
th m
ahu
a oi
l ca
ke (
200
ppm
) an
d c
roto
n se
ed (4
ppm
)
from
the
5th
to 9
0th
da"
of p
iSC
iCid
e tr
eatm
ent.
alo
ng \
\1th
con
trol
P
ond
s~'Stems
Tot
al a
rea
of c
ultu
re
Sto
ckin
g ra
te o
f :-
':um
ber
of s
eeds
T
otal
pro
duct
ion
:-':0
. of
pra\
\TIs
P
er=
rtag
e of
pond
s (m
2)
seed
s (n
os!m
2)
stoc
ked
(Kg
) !W
ie-.
'ed
sun
ival
Pond
s tr
-..at
ed w
ith
595
5 29
75
19.7
7 25
18
84.6
5 m
ahua
oil
cake
(3
32.2
7 kg
'ha)
Pon
ds tr
ente
d w
ith
603
5 30
15
10.8
8 26
02
86.3
crot
on s
eed
(180
.43
kg'h
a)
Con
trol
pon
d 44
7 5
2235
6.
73
874
39.1
1
---
,. L
-. _
_ ._
. __
. -~ ,--,~
--
L ..
(1~(
J.~6
kK
hal _
__
__
i
81
the 5th-30th day of treatment, recording a value of 1.79-2.4
mm/day.
As is evident from the Table (Table 25.b) the maximum
growth rate in the control pond was 1.5 to 2.33 mm/day during
5th - 45th day. The minimum growth registered wasO.15 mm/day and
the growth rate in weight ranged between 0.03 and 0.16 g/day. In
general, the growth pattern revealed a gradually decreasing trend
towards the end of the culture period in the treatment and
control ponds as well.
Details of the extent of culture ponds, stocking rate
of prawn seeds, prawn production. percentage of survival, and the
quantity of miscellaneous catch from the different ponds
comprising of different species of fin fishes and prawns are
illustrated in table 25.c Total water area deployed for prawn
culture after treatment with mahua oil cake, croton seed and also 2 2
the control pond, ranged between 447 m and 603 m. Prawn seeds 2
were stocked @ 5 nos/m area. The percentage of survival of
prawns cultured in mahua - treated, croton treated and the
control pond were 84.65/ 86.30 and 39.11 respectively. The
production values were 332.27 kg/ha, 180.43 kg/ha and 150.56
kg/ha, in the order mentioned above. At the time of harvesting,
the control pond yielded a miscellaneous catch of 2.34 kg
comprising of different species of undesirable finfishes and
prawns. A similar catch weighing 0.19 to 0.22 Kg was realized
from the piscicide-treated ponds also, along with the cultured
prawns.
82
5 DISCUSSION
Over the past two decades there has been a general
tendency to intensify the traditional/extensive shrimp
culture and to shift from an uncontrolled "Polyculture" to
"monoculture" of shrimp by replacing traping of wild juveniles,
with stocking (Csavas, 1993). Prawn farmers have long been aware
of the fact that production from the pond is adversely affected
by pests. To obtain the maximum survival and growth of the prawn
seeds stocked in the culture ponds, it is absolutely essential
that all undesirable fishes or weed fishes including predators
and competitors be eliminated from the culturre system, before
stocking with the desirable species; necessitating the
application of suitable toxicants having piscicidal effects.
Piscicides may broadly be classified into inorganic
chemicals and toxins of plants origin. Increasingly widespread
use of chlorinated hydrocarbon insecticides as piscicides is
becoming a source of real danger to fishes of economic importance
and other aquatic and wild life (Choudhuri, 1975) Their highly
toxic and persistent nature poses a threat to shrimp health and
product quality in particular and human health in general and so
their use should be discouraged (Apud et al 1989) Baticados
(1986) found that the use of organotin molluscicide by Philippine
shrimp farmers caused soft shell syndrome in cultured
emphasizing the potential of some of those compounds to
ad.ersely the shrimp culture itself, as well as ~he
shrimps
affect
external
83
environment. The environmental impact of shrimp culture has
become a problem of increasing concern in many tropical and et t..;..C,
subtropical countries (Ong, 1982; Chua et al. 1989; Pullin~ 1989)
It would therefore be sensible to look for piscicides of
plant origin which at certain concentrations would destroy pest
organisms inhabiting culture systems and at the same time be
naturally degradable and eca-friendly. Accordingly, two
piscicides of plant origin, namely mahua oil cake and croton seed
were employed during the present study, which involved laboratory
and field investigations.
A striking feature of the results obtained during the
laboratory experiments was that pre-soaking of the two
piscicides was beneficial with regard to their toxic potency 1a..-e &~t:L- e
(Tables 1 a & band figUresb Mahua oil cake exhibited maximum
toxicity under a pre-soaking period of 12 hours. Further, the
toxicity was found to diminish with an increase in pre-soaking
time of 48 hours similar to that observed in the case of unsoaked
material. These findings seem to suggest that saponin, the
active piscicidal principle (Lakshman, 1983) can readily leach
out when subjected to pre-soaking, gradually losing its toxicity
beyond 12 hours of soaking due to progressive degradation. The
observed increase in the lethal time in the case of unsoaked cake
indicates the relevance of pre-soaking in the leaching process of
the active principle.
84
In the case of croton seed, pre-soaking for 6 hours ;(4.- e
yielded the best result (table 1.b & Fi9Si) Pre-soaking for more
than 12 hour on the other hand reduced the toxic potency of the
material. Pre-soaking, it may be pointed out here, serves a dual
purpose with regard to croton seed. Since the material is
commercially available in the form of seeds, it is necessary that
they be finely ground before application, for which pre-soaking
would be beneficial; in fact, pre-soaking (for not more than 6
hours) enhances the toxicity of the seeds as well.
The effect of piscicides on the hydrographic
parameters of the test media in general was evidenced by a
concentration - bound gradual reduction in oxygen content in all
the media containing graded concentrations of the two toxicants.
Similar observations have been made under laboratory conditions
with mahua oil cake (Banerjee et al. 1979), tea seed cake (De et
al. 1987 and Minsalan and Chiu, 1986) and temru fruit, Diospyros
cordifolia Roxb. (Sharma and Simlot, 1971). Since mahua oil
cake and croton seed are organic and biodegradable, a temporary
depletion of dissolved oxygen in the medium is always likely, due
to the ongoing biodegradation process occurring in the test
medium.
In an attempt to understand the source of oxygen for
replenishment in the medium, the surface of the test medium
containing 250 ppm and 4 ppm of mahua oil cake and croton seed
respectively, was sealed with liquid paraffin. Interestingly, no
85
revival of oxygen content was observed following its decline
contrary to what occurred in the media maintained without 3"- ~ 4-0..-
paraffin sealing (Tables, 2a & 3a figure~ indicating that the
source of oxygen for replacement was atmospheric air.
Experimental observations on the relative tolerance of
weed fishes to the two piscicides suggested that the finfishes
could be classified into 3 groups, viz; least tolerant, medium
tolerant and most tolerant. Ambassis gymnocephalus/ Megalops
cyprinoides, Elops saurus while Glossogobius giurus constituted
the least tolerant group and Macropodus cupanus, Etroplus
maculatus, Gambusia affinis, Aplochilus lineatus and Tachysurus ----- ----. .
maculatus. were the medium tolerant ones. Tilapia mossambica,
Ophichthys boro and O. microceph~us were the most sturdy species.
The highly tolerant nature of T. mossambica has been
observed earlier by Terazki et al. (1980) following exposure to
tea seed cake which also contains saponin, the piscicidal element
of mahua oil cake.
With respect to croton seed, the least tolerant group
of finfishes included~. gymnocephalu.s~~. saurus, M. cyprinoides,
E. maculatus and ~: cupanus. ~~ lineatu~, G. affinis and G.
giurus represented the medium tolerant group whereas T.
maculatus, T. mossambica, ~ boro and O. microcephalus were the
most tolerant finfishes tested. A similar response of T.
mossambica to croton seed treatment has also been reported by
Babu (1965).
86
Finfishes exposed to mahua oil cake showed various
stress symptoms like losing balance while swimming, gradually
becoming inactive, reaching the bottom of the container, lying on
their sides in a state of coma and finally succumbing to death.
Studies on the blood profile of~~ mo~sambica exposed to the
lethal concentration of mahua oil cake over a period of 6 hours
revealed a significant reduction in the total Erythroyte Count,
Haemoglobin content and Haematocrit values. Similar findings
have been made by Roy et al. (1989) in the air breathing climbing
perch, Anabas test~~ineus (Bloch) and Sumit Home chaudhuri et al.
(1986) in the air breathing catfish Heteropneustes £os9i1is and
the carp, Cyprinus carpio when exposed to lethal concentration of
saponin. Sumit Home Chaudhuri et al. (1986) further suggested
that the haemolytic action of saponin would be manifested in
several ways:
i) The viscocity of blood would rise.
ii) Loss of haemoglobin would critically reduce the oxygen
carrying capacity of the blood, thus prodUCing anoxia and
acidocis
iii) Possibility of haemoglobinuria conditions where the
haemoglobin would be excreted through urine, as free urine
has easy access into the glomerular membrane of kidney
tubules as a result of which a serious disturbance in the
kidney functioning will be caused (iv) acute anaemia, which
is a distinct possibility_ All these deleterious effects
87
depend upon the number of RBC haemolysed and
of haemolysis. He further opined that
shrinkage and ultimate disintegration of
the
the
rapidity
gradual
RBC may
contribute to the poor RBC count and haematocrit values.
In the case of croton seed treatment, the stressed
fishes strived to come to the surface by jerking movements.
Falling of scales and mild bleeding from the gill portion were
also observed.
Haematological studies on T. mossambica exposed to the
lethal concentration of croton over a period of 6 hours also
indicated a decline in the RBC count, haemoglobin and haematocrit
values. The observed increase in Mean Corpuscular Haemoglobin
(MCR) and Mean Corpuscular Volume (MCV) could be explained as an
adaptation
the fall in
supply.
on part of the test individuals to compensate for
RBC production and make up the reduced oxygen
The piscicidal property of croton seed has been
attributed to its content of the toxalbumin, crotin as cited by
Babu (1965). However, according to Chopra et al; (1956) seeds of
croton contain 2 toxic proteins, croton globulin and croton
albumin, which are essentially blood poisons (Chopra et al.
194.9). Babu (1965) is of the view that this poison directly or
indirectly affects the respiratory system of fishes~
88
Postlarval forms of the penaeid prawn Penaeus indicus
displayed high degrees of tolerance to mahua oil cake as
evidenced by their ability to withstand very high concentrations
of mahua oil cake (750-125ppm) upto 12 hours. In fact,
concentrations ranging from 300 ppm - 500 ppm required 24 hours
to produce absolute mortality among them. The dissolved oxygen
levels which dipped to surprisingly low levels in the medium 3~
containing higher concentrations of the cake (Table 2a & Fi9i)
might have possibly enhanced the sensitivity of prawn larvae
exposed to these concentrations.
Lakshman (1983) observed high degree of tolerance
among shrimps to mahua oil cake and reported an LD 95 value as
high as 5800 ppm of the cake. Terazaki et al. (1980) also
observed the remarkably high toleran~ of shrimps to relatively
very high concentrations of tea seed cake (contains saponin),
exceeding 10ppm that were lethal to all finfishes. Although,
concentrations, less than 30 ppm of the seed cake was harmless to
the postlarval shrimps, 60% of the individuals could survive in a
medium containing 40 ppm of the toxicant for more than 12 hours.
The tolerance of postlarvae of~. indicus to croton
seed was more than that of T. mossambica, amply illustrated by an
increased duration of time needed for producing absolute
mortality. Since, the hydrographic parameters of the test media
+ (Table 3a & Figj) containing lethal doses of croton did not drop
89
below minimal threshold levels (Suseelan, 1978), they do not seem
to have any role in enhancing the sensitivity of individuals to
the toxicant. Bhuyan (1968) observed that freshwater prawns
could survive in media containing various concentrations of
Croton upto 5.33 ppm, sufficient to kill a variety of freshwater
fishes including the hardiest ones.
The black clam, Villorita cyprinoides var. cochinensis
representing the bivalve molluscs, which often cause much havoc
to shrimp culture operations (Saji Chacko and Thomas, 1993)
seemed to be more tolerant to mahua oil cake than finfishes;
absolute mortality occurring only above a concentration of 200
ppm within 72 hours under laboratory conditions. The time
required for effecting absolute mortality among individuals of
the species could not be shortened even by higher concentration
of 250 ppm.
Lakshman (1983) worked out the LD 95 values of some
common gastropod molluscs inhabiting freshwater systems and was
found to range from 1300 to 3260 kg of mahua oil cake. As in the
case of postlarvae of prawns, the toxicity of the cake as well as
the prolonged state of low oxygen content of the medium might
probably have exerted a cumulative effect in enhancing the
toxicity.
The present study also revealed that the clam V.
cyprinoide~ is almost equally sensitive to croton seed treatment,
90
as finfishes, except that the former takes more time to reach
absolute mortality under the same toxicant concentration.
Persistence of toxicity of mahua oil cake in the test
media appeared to be concentration dependent, with regard to the
finfish, A. gymnocepha~s representing the least tolerant group. I
Toxicity of the test media containing concentrations of 75 ppm to
250 ppm of mahua oil cake presisted for periods ranging from 1 to
6 days (Table 9a) under laboratory conditions. Studies by
Bhatia (1970) showed that toxicity of the medium containing 100
ppm to 500 ppm of mahua oil cake retained their toxicity to
fishes for 48 to 192 hours under laboratory conditions. In the
case of croton seed, concentrations ranging from 0.5 ppm to 5 ppm
in the media exhibited toxicity to~. gymnocephal~for periods of
1 to 5 days. The toxicity of the media containing 1 to 4 ppm of
the piscicide continued upto 3 days (Babu 1965).
Among the two piscicides, only mahua oil cake had
profound effect on tIle dissolved oxygen content of the test media
under field trial. This may perhaps be due to the relatively
higher organic load (150 to 3.00 mg/l) provided by mahua oil cake
on the ecosystem when compared to croton seed (2 to 5 mg/l).
Enhanced consumption of oxygen by the contained microorganisms
for degradation of the organic matter might have lead to the
depletion of dissolved oxygen. Banerjee et al; (1979) has
observed that mahua oil cake applied @ 200 mg/l (the optimum
91
concentration delineated during the present study) led to a BOO
load between 34 and 120 mg/l during the initial 10 days under
field conditions.
Another observation made during the field study was
that immediately after the application of mahua oil cake the
pond water turned dark and turbid probably due to the tannin
content of the cake, (Nadkarni, 1954) leading to a failure of
penitration of sunlight and the progression of photosynthesis.
When BOD exceeds supply, a drop in dissolved oxygen level even
to undetectably low levels can result as observed during the
present study, when the medium contained 200 ppm of MaC and
above. Since the range and duration of oxygen depletion appeared
to be concentration-dependent, the situation calls for a strict
compliance with the optimum quantity of the cake that
used for field application. The attempt made during the
can be
present
way of
hours
investigation
diluting the
to
test
minimise
medium
the depletion of oxygen
with tidal water (after
by
12
following treatment and elimination of weed fishes), yielded
promising results. In this case, the dissolved oxygen content
did not at any point during the sampling period drop below the
minimal threshold level.
The minimum (optimum) concentration of mahua oil cake
capable of effecting absolute mortality among the 12 species of
weed fishes tested under field condition was 200 ppm. As
observed during the laboratory experiments, the least tolerant
92
group of finfishes included A. gymnocephal~.. The snake eels O.
boro and~ microcephalus were the most tolerant species tested.
O. boro often burrows into the bunds of paddy fields and salt
pans causing considerable damange to the bunds (Samuel, 1962). A
concentration of 200 ppm MOC was insufficient to destroy the
clam species, V. cyprinoides whose presence in farms seriously
affects the growth of prawns (Saji Chacko and Thomas, 1991).
Higher concentrations of 250 ppm and 300 ppm on the other hand
could kill the clams within 96 hours and 72 hours respectively
following treatment. Postlarval forms of P. indicus exhibited 65%
mortality within 96 hours in the medium under 200 ppm, whereas
absolute mortality was effected within 48 - 96 hours in the
higher concentrations of 250 and 300 ppm. In short, the prawn
and clam species proved to be more tolerant to the cake. than
finfishes. It seems that the low level of dissolved oxygen in
the media containing 250 ppm and 300 ppm of the mahua oil cake
would have enhanced the sensitivity of the two animals an
observation made during the laboratory studies.
In the case of croton seed 4 ppm was found to be the
minimum (optimum) concentration required for the complete
elimination of weed organisms including different species of fin
fishes (within 6 hrs) and the clam V. cyprinoides (within 72
hrs.). A significant finding made during the studies with croton
seed was that the optimum concentration required for the
elimination of finfishes is applicable to the clam species also.
93
Another observation made in this regard is that the lethal time
of the clam could be cut short to 48 hours by enhancing the
concentration to 5 ppm.
Postlarvae of P. indicus were more sensitive to croton
seed than to mahua oil cake. The optimum field dose of 4 ppm of
croton seed delineated during the course of the present study for
total elimination of weed fishes was sufficient to effect
absolute mortality of the postlarvae also. Interestingly, 4 ppm
and 5 ppm of croton seed had same effect on their lethal time (6-
12 hrs). Since the hydrographic profile of the field test medium
were within normal levels (Table lOb & ~) throughout the period
of experimentation in all the concentrations, the possibility of
their role in influencing the sensitivity of test organisms to
the toxicant can be ruled out.
The dominance of copepode in the plankton collection
appears to be a routine phenomenon as reported earlier by many
workers (Menon et al., 1971; Pillai et al. 1975; Madhupratap &
Haridas, 1975, Madhupratap, 1979; Jose et al. 1988 and Sheeba,
1992). The effect of mahua oil cake on the numerical abundance
of zooplankton is clearly visible in the collections made from
ponds exposed to different concentrations of the piscicide. One
significant observation common to all the concentrations tested
was the disappearance of fish larvae from the ponds from the 24th
hour onwards. This points to the fact that concentrations
ranging from 150 ppm to 300 ppm had a lethal effect on fish
94
larvae. The gradual reduction in the number of zooplankton in
ponds exposed to concentrations of 200 ppm and above can be
correlated with the patterm of decline in the dissolved oxygen
content of the respective ponds. The test media which were
characterised by a complete lack of zooplankton at 240th hour
after treatment happened to be those ponds where the dissolved
oxygen content had gone down to undetectably low levels.
Therefore, it is reasonable to assume that the lethal effect of
mahua oil cake on the zooplankton population is only a secondary
or indirect effect. The presence of mosquito larvae in the
treatment ponds from l20th hour onwards and their absence in the
control pond can be correlated with the absence of finfishes
following eradication especially A. lineatus, G. affinis, M.
cupanus etc.,which are well-known larvivorous fishes. Mosquitos
prefer to breed in stagnant or slow moving shallow water either
sunlit or shaded, clear or turbid and rich in organic material or
polluted. Brackishwater bodies like lagoons, estuaries, canals
and marshes are ideal habitats for the breeding of mosquitos
(Menon, 1991). The observed direct relationship between the
numerical abundance of mosquito larvae and the quantity of mahua
oil cake applied can explaine the preference of mosquitos for
habitats rich in organic matter. It may also be taken into
account the fact that the treatment ponds were maintained as
closed systems throughout the period of experimentation. Above
all the treatment ponds were cleared of all fishes including the
larvivorous species, thus forming an ideal habitat for the
breeding of mosquitos. The comparatively low incidence of
95
mosquito larve in the pond where the medium was diluted with
tidal water after 12 hours of treatment (200ppm mahua oil cake &
4 ppm croton seed) and daily water exchange allowed from 120~
hour onwards, further supports this view.
All the concentrations of croton seed ranging from 2
ppm to 5 ppm were lethal to the larval forms of ~infishes
encountered in the plan~ton collection. Hydrozoan medusae were
also fully susceptible to the different concentrations. Copepods
suffered only marginal reduction, especially during the initial
stages of treatment; but recovered towards the lag phase of the
experiment. The hydrographic parameters, which were within the
normal levels in the treatment ponds, did not appear to have
any influence on the sensitivity of the zooplankton to the
toxicant. Mosquito larvae were not recorded from ponds in which
weedfishes were destroyed only partially. Their occurrence in
the treatment ponds,
concentration-dependent.
though only in small numbers was
The comparatively low organic load
received by the experimental ponds might perhaps be the reason
for the lower number of mosquito larvae encountered in the
plankton collection.
Bhuyan (1968) while investigating into the use of
Croton tiglium seed as a fish poison in ponds observed that
although zooplanktons exposed to croton seed were killed, they
were found to reappear about a week after treatment. Dilution of
the test medium with tidal water following treatment and
96
elimination of weedfishes can restrict the incidence of mosquito
breeding to a great extent as observed during the present study.
The macrobenthic communities of experimental ponds,
especially the polychaetes which constituted the most dominant
group, suffered varying degrees of reduction in terms of their
number and biomass when exposed to graded concentrations of mahua
oil cake. The increase in the number and biomass of polychaetes
observed at 24th hour of treatment can be attributed to their
vertical migration to the upper layers of the sediment, finally
to wriggle out of the burroughs, when stressed. This is further
supported by the fact that polychaetes were found lying dead at
the sediment surface in large numbers during the course of
experimentation. From the pattern of their decline during the
period of study it can be reiterated with certainity that the
extend of damage is maximum between the 24th and 120th hour after
treatment. The complete absence of macrobenthos at the 120th
hour of sampling in concentrations of 250 ppm and above is
indicative of the magnitude of ambient environmental regredation
in the event of application of excessive concentrations of
piscicides.Apart from the direct toxicity of the piscicide, the
accumulation of particulate organic matter at the bottom of the
pond can cause an increase in the BOD of the sediment. Enhanced
consumption of oxygen by the macroorganisms of the sediment can
result in a sudden depletion of oxygen in the waters overlying
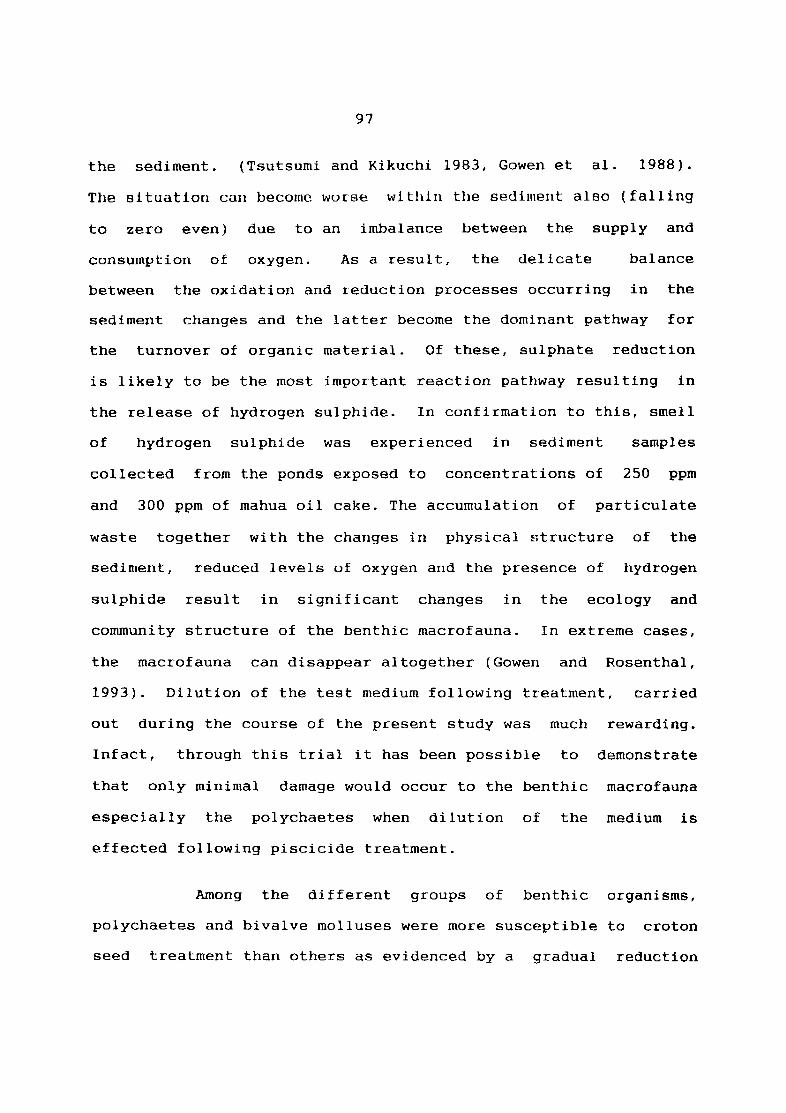
97
the sediment. (Tsutsumi and Kikuchi 1983, Gowen et al. 1988).
The situation call become worse within the sediment also (falling
to zero even) due to an imbalance between the supply and
consumption of oxygen. As a result, the delicate balance
between the oxidation and reduction processes occurring in the
sediment changes and the latter become the dominant pathway for
the turnover of organic material. Of these, sulphate reduction
is likely to be the most important reaction pathway resulting in
the release of hydrogen sulphide. In confirmation to this, smell
of hydrogen sulphide was experienced in sediment samples
collected from the ponds exposed to concentrations of 250 ppm
and 300 ppm of mahua oil cake. The accumulation of particulate
waste together with the changes in physical structure of the
sediment, reduced levels of oxygen and the presence of hydrogen
sulphide result in significant changes in the ecology and
community structure of the benthic macrofauna. In extreme cases,
the macrofauna can disappear altogether (Gowen and Rosenthal,
1993). Dilution of the test medium following treatment, carried
out during the course of the present study was much
Infact, through this trial it has been possible to
rewarding.
demonstrate
that only minimal damage would occur to the benthic macrofauna
especially the polychaetes when dilution of the medium is
effected following piscicide treatment.
Among the different groups of benthic organisms,
polychaetes and bivalve molluses were more susceptible to croton
seed treatment than others as evidenced by a gradual reduction
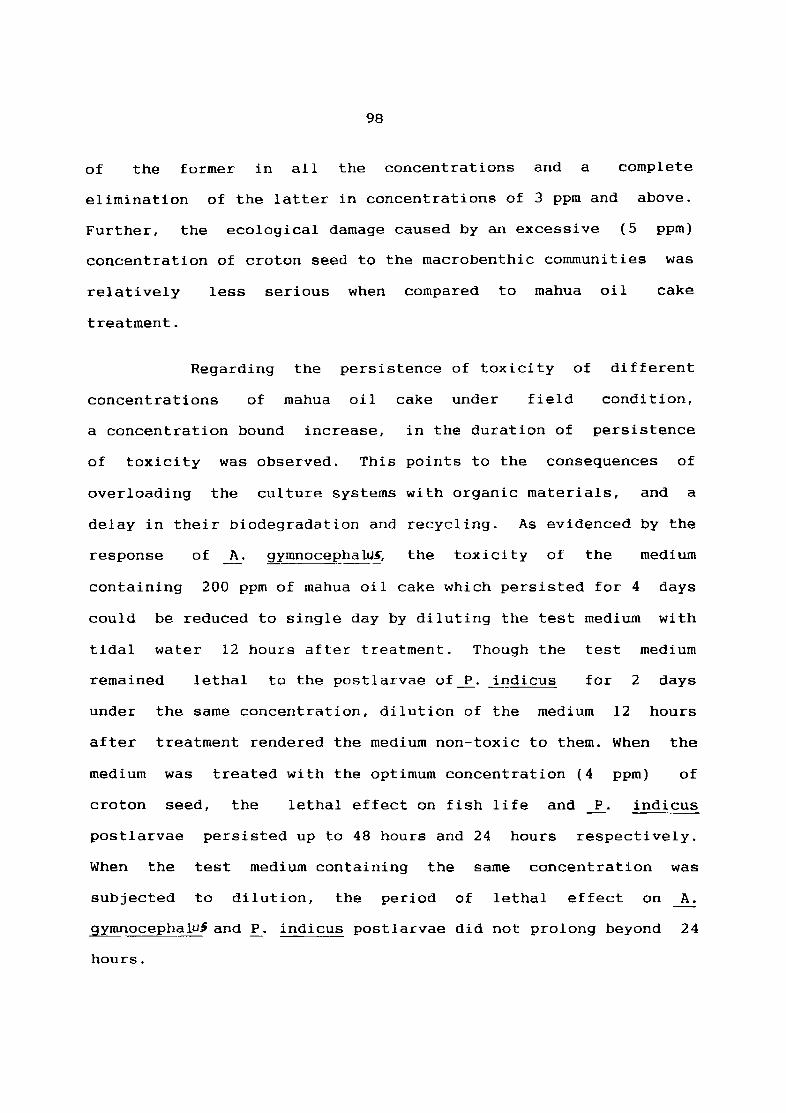
98
of the former in all the concentrations and a complete
elimination of the latter in concentrations of 3 ppm and above.
Further, the ecological damage caused by an excessive (5 ppm)
concentration of croton seed to the macrobenthic communities was
relatively
treatment.
less serious when compared to mahua oil cake
Regarding
concentrations of
the persistence of toxicity of
mahua oil cake under field
different
condition,
a concentration bound increase, in the duration of persistence
of toxicity was observed. This points to the consequences of
overloading the culture systems with organic materials, and a
delay in their biodegradation and recycling. As evidenced by the
response of A. gymnocephaW~ the toxicity of the medium
containing 200 ppm of mahua oil cake which persisted for 4 days
could be reduced to single day by diluting the test medium with
tidal water 12 hours after treatment. Though the test medium
remained lethal to the postlarvae of~. indicus for 2 days
under the same concentration, dilution of the medium 12 hours
after treatment rendered the medium non-toxic to them. When the
medium
croton
was
seed,
treated with the optimum concentration (4
the lethal effect on fish life and
ppm) of
P. indicus
postlarvae persisted up to 48 hours and 24 hours respectively.
When the test medium containing the same concentration was
subjected to dilution, the period of lethal effect on A.
gymnocephalu$ and P. indicus postlarvae did not prolong beyond 24
hours.
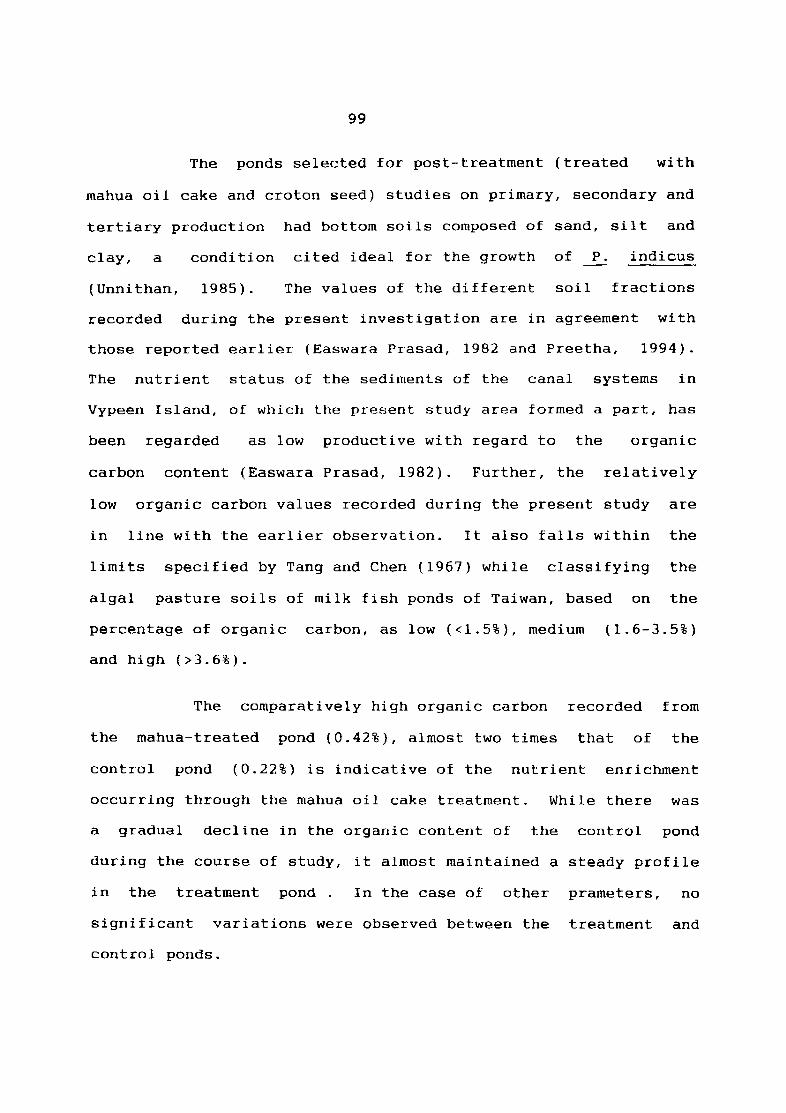
99
The ponds selected for post-treatment (treated with
mahua oil cake and croton seed) studies on primary, secondary and
tertiary production had bottom soils composed of sand, silt and
clay, a
(Unnithan,
condition cited ideal for the growth of P. indicus
1985). The values of the different soil fractions
recorded during the present investigation are in agreement with
those reported earlier (Easwara Prasad, 1982 and Preetha, 1994).
The nutrient status of the sediments of the canal systems in
Vypeen Island, of which the present study area formed a part, has
been regarded as low productive with regard to the organic
carbon content (Easwara Prasad, 1982). Further, the relatively
low organiC carbon values recorded during the present study are
in line with the earlier observation. It also falls within the
limits specified by Tang and Chen (1967) while classifying the
algal pasture soils of milk fish ponds of Taiwan, based on the
percentage of organic carbon, as low «1.5%), medium (1.6-3.S%)
and high (>3.6%).
The comparatively high organic carbon recorded from
the mahua-treated pond (0.42%), almost two times that of the
control pond (0.22%) is indicative of the nutrient enrichment
occurring through the mahua oil cake treatment. While there was
a gradual decline in the organic content of the control pond
during the course of study, it almost maintained a steady profile
in the treatment pond. In the case of other prameters, no
significant variations were observed between the treatment and
control ponds.
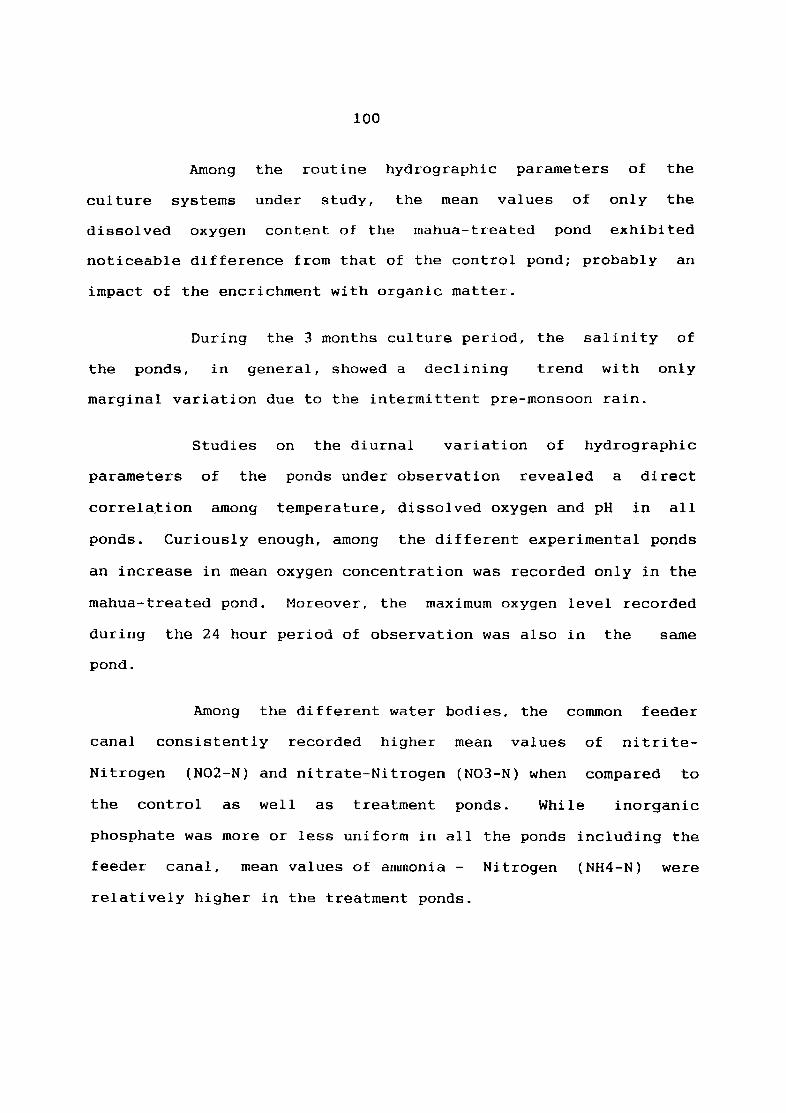
culture
Among
systems
the
under
100
routine
study,
hydrographic
the mean
parameters of
values of only
the
the
dissolved oxygen content of the mahua-treated pond exhibited
noticeable difference from that of the control pond; probably an
impact of the encrichment with organic matter.
During the 3 months culture period, the salinity of
the ponds, in general, showed a declining trend with only
marginal variation due to the intermittent pre-monsoon rain.
Studies on the diurnal variation of hydrographic
parameters of the ponds under observation revealed a direct
correla~ion among temperature, dissolved oxygen and pH in all
ponds. Curiously enough, among the different experimental ponds
an increase in mean oxygen concentration was recorded only in the
mahua-treated pond. Moreover, the maximum oxygen level recorded
during the 24 hour period of observation was also in the
pond.
s~e
Among the different water bodies, the common feeder
canal consistently recorded higher mean values of nitrite
Nitrogen (N02-N) and nitrate-Nitrogen (N03-N) when compared to
the control as well as treatment ponds. While inorganic
phosphate was more or less uniform in all the ponds including the
feeder canal, mean values of ammonia - Nitrogen (NH4-N) were
relatively higher in the treatment ponds.
control
In
pond
101
the case of gross and net primary
recorded relatively high values.
production the
The
increasing trend in primary production pattern observed
mahua-treated ponds and the control upto the 60th day
gradually
in the
may be
considered as a natural phenomena associated with the blocking of
free flowing canals by newly erected earthern bunds and sluice
gates
other
while
hand,
preparing the ponds for
the ponds deployed
experimentation. On the
for croton treatment were
already existing and were characterised by a luxurient growth of
phytoplankton. The observed sharp decline in the quantum of
primary production in these ponds upto the 15th day of treatment
might probably be due to the impact of croton seed application
and the resultant temporary destruction of phytoplankton.
The relatively higher 'load' of nitrate Nitrogen
and inorganic phosphate in the ponds brought in by the conunon
feeder canal during the 30th-60th day period might have possibly
been the source of nutrients for the higher rate of primary
production recorded from them during the corresponding periods.
The sharp increase in primary production in the mahua-treated
ponds within the first fifteen days of treatment could probably
be discerned as a result of the nutrient provided by the mahua
oil cake.
The increase in the numerical abundance of zooplankton
from the 15th day onwards in all the ponds in general, can be
directly correlated with the increase in primary production
102
during the corresponding period. Further, the higher number of
zooplankton density observed in the treatment ponds during the
entire period of study could probably be attributed to the
relatively low level of grazing pressure, in the absence of weed
fishes.
The decreasing trend in the number and biomass of
macrobenthos in both treatment and control ponds from the start
of the experiment suggests the pivotal role played by certain
hydrographic parameters on their recruitment and distribution.
Panikkar (1951) reported that ambient water temperature plays
an important role in the abundance of marine fauna in the
tropical brackishwaters. Crisp and Southward (1958) considered
temperature as the most important factor affecting all the
stages in the life history of organisms and that the trends of
distribution are mainly due to temperature differences. But
SriKrishnadhas et al (1981) commenting on the distribution
pattern of polychaetes in the intertidal region of Vellar estuary
expressed the view that temperature do not seem to play a major
role in their distribution since the variations observed were in o
narrow limits (2 C). Salinity, on the other hand had an
important role in limiting their distribution and density in the
intertidal region. During the present study, covering a prawn
culture period of 3 months, starting from the last week of
February, a steady decline in the benthic communities composed of
polychaetes, amphipods, tanaids and sea anemones, was observed
103
from the very first day onwards in the control and treatment
ponds. In fact, the rate of reduction in the treated ponds was
considerably higher, probably due to the toxic effect of the
piscicides. Also, in the treatment ponds, macrobenthos were not
represented beyond the 45th day of sampling (1st week of April)
except for a few anemones on the 60th day. In the control pond
only polychaetes were represented upto 75th day (1st week of
May) . It should be noted here that during the period of
observation the salinity fluctuated between 15.39 ppt and 19.6
ppt because of intermittent pre-rnonsoon rain fifld ~~ater BQttom and o 0
the water temperature between 30.3 C - 34.83 C. The present study
revealed that macrobenthic communities can decline even at the o 0
initial temperature range of 31.98 C -- 32.15 C.
In fact, the macrobenthic organisms probably could not o
survive in temperatures beyond 34 C. The common feeder canal
which was nearly 1.5m deep with a water temperature less than o
32 C supported a rich and varied fauna of macrobenthos including
several species of polychaetes even when there was none in the
collections from the culture ponds where the temperature was o
above 34 C. Therefore, temperature seems to be the limiting
factor especially in the case of po1ycheates. It is generally
observed that macrobenthos, especially polychaetes are poorly
represented in the collections made during the S.W.monsoon period
in the area be~se of the prevailing freshwater conditions.
Here salinity seern~s to be the limiting factor. Again
recolonisation starts by the beginning of post-monsoon period and
104
thereafter the population steadily increases through recruitment,
recording the maximum during December March (Gopalakrishna
Pillai, 1977). Nair et al. (1988), while investigating into the
environmental conditions of some paddy-cum-prawn culture fields
of Cochin backwaters have came across a declining tendency of
the effect benthic biomass from February and atributed this to
of predation, Gopalakrishna Pil1ai (1977) indicated that the
seaonsal increase in benthic fauna in the area is due primarily
to recruitment. This might possibly be the reason for the
absence of any trace of replenishment of the benthic fauna during
the period of their decline as observed in the present study.
Sreekrishnadhas and Ramamoorthi (1975) reported that the
abundance of polychaete larvae encountered in Porto Novo Waters
during September-October may be considered as an indication of
their active breeding. It can therefore be intered from the
present study that the declining trend observed in the case of
benthic communities from the start of the experiment is only
natural phenomenon governed primarily by the ambient temperature
and secondarily by salinity and that their further recolonisation
is influenced to a large extend by their breeding periodicity
and salinity. In the present case, the sharp reduction trend
and premature disappearance of the benthic fauna in the treatment
ponds may be a direct effect of the piscicides applied, probably
due to the distruction of their younger individuals during the
time of application of the piscicides, preventing their
succession.
105
Although comparable rates of survival were recorded
from the mahua-treated and croton-treated ponds, the relatively
better performance in terms of growth registered by ~ indicus in
mahua-treated and control ponds may will be related to the
abundance of macrobenthos, the main source of food (Panikkar and
Menon, 1956; Hall, 1962; Kurup, 1978 and Thomas, 1978). The poor
percentage of survival observed in the control pond could be
attributed to the predation/competition pressure exerted on the
cultured prawns by the assemblage of weed organisms as evidenced
by the harvest data. The mortality among individuals of P.
indicus recorded from the treatment ponds can be related to the
fact that postlarvae and juveniles of different species of prawns o
including L. if!dicus tolerate temperatures around 35 e, but wi th
varying survival rate (Kuttiyamma, 1981). Kuju (1978) brought to
light the direct relationship between food requirement and the
rate of growth of prawns at different stages. Slower growth rate
due to the non-availability of proper food at particular stages
in P. indicus has been reported by Sampath and Menon (1975) and
abundance of macrobenthos upto the 45th day of sampling and their
absence thereafter in the case of treatment ponds is clearly
reflected in the growth rate of prawns. The continued presence
of macrobenthos, especially the polychaetes upto the 75th day in
the control pond evidently had beneficial effects on the growth
of the prawns.
106
6 SUMMARY
To obtain the maximum survival and growth of prawn
seeds stocked in culture systems, it is absolutely essential that
all undesirable organisms including predators and competitors be
eliminated from the culture systems, before stocking with the
desirable species. Since, the elimination of weed organisms by
a complete drainage of the field is dependent on the
topographical aspects of the locality, it becomes necessary that
piscicides be apllied in the field.
Piscicides are either inorganic chemical pesticides or
toxins of plant origin. The highly toxic and persistent nature
of inorganic chemical pestcides with its residual effect poses a
threat to shrimp health and product quality in particular and
human health in general and so their use should be discouraged.
In these circumstances it would be advisable to look for
piscicides of plant origin which at certain concentrations would
destroy pest organisms inhabiting the culture system and at the
same time be naturally degradable and eeo-friendly. For the
present study two popular piscieides of plant origin namely,
mahua oil cake, a product from the perennial tree, Bassi~
latifolia and the seeds of the croton plant, Croton tiglium were
used for detailed investigations on their effect on field culture
systems.
107
Prior to application of the two piscicides in the
field, laboratory experiments were conducted on the following
aspects (i) refining the method of preparation of the piscicides
for application, (ii) sensitivity of different organisms
including finfishes, prawn and clam species, (iii)
haematological effects of the pisicicides on selected fish and
(iv) progressive degradation and persistence of toxicity of
selected concentrations of the two piscicides with respect to
finfish and cultivable prawn seed.
Pre-soaking of mahua oil cake in water for about 12
hours before application was beneficial, whereas pre-soaking
for an increased duration of 48 hours reduced its toxicity. In
the case of croton seed which needs grinding before use, a pre
soaking time of 6 hours was effective and was found to decrease
its toxicity thereafter.
dissolved
following
A concentration-depemdent gradual reduction in
oxygen content was observed in the test media
application of the piscicides; reversing to
normalcy in due course. Based on the observed lethal time, the
common weed fishes selected for the study could be classified
into least tolerant, medium tolerant and most tolerant groups.
Finfishes such as Ambassis gymno cephal~), Megalops cyprinoides
and Elops saurus represented the least tolerant ones common to
the two piscicides, whereas Tachysurus maculatus, Tilat>ia
108
mossambica, Ophichthys boro and o. microcephalus exhibited
maximum tolerance. ~ mossambica representing the most tolerant
group of finfishes required 80 ppm and 2 ppm of mahua oil cake
and croton seed, respectively for total mortality in 6 hours
under laboratory conditions.
Postlarval forms of the penaeid prawn Penaeus indicus
displayed high degree of tolerance to mahua oil cake registered
total mortality in 24 hours in 400 ppm concentration. The
dissolved oxygen content dipping to below tolerable limits in the
test media at higher concentrations might probably had enhanced
the sensitivity of the prawn larvae exposed to these
concentrations. P. indicus postlarvae were more tolerant to
croton seed also than the finfishes, reaching absolute mortality
in 12 hours in 2 ppm.
A concentration of 200 ppm and above of MOC were
effective in bringing about total mortality of the clam Villorita
cyprinoides var. cochinensis within 72 hours, whereas a
concentration of 2 ppm of croton seed was sufficient to produce
the same effect among their counter parts during the same period
of time. The lethal time could be reduced to 60 hours and 48
hours by applying 4 ppm and 5 ppm of croton seed respectively.
T. mossambica exposed to lethal concentrtations of
mahua oil cake and croton seed caused a gradual reduction in
109
the haematological parameters such as percentage of haemoglobin
and haematocrit and the total erythrocyte count. The persistence
of toxicity of the piscicides in the test media was found to be
concentration-dependent.
The toxicity of the test media containing 75 ppm to
250 ppm of mahua oil cake persisted for periods ranging from 1 to
6 days, with regard to Ambassis gymnocephalus, representing the
least tolerant group. In the case o~ croton seed, the toxicity
of 0.5 ppm to 5 ppm persisted for periods of 1 to 5 days with
regard to the same fish.
The field experiments were centred around two
objectives -(i) delineation of the optimum concentration of the
two piscicides for field application and observations on the
effect of graded concentrations of the piscicides on the
hydrography, zooplankton, macrobenthos, selected finfishes, prawn
and clam species (ii) post-treatment studies on the effect of the
piscicides on the productivity of the culture systems covering
the hydrography, water and soil nutrients, primary production,
zooplankton and macrobenthos and also the growth, survival and
production of prawn, for a period of 3 months.
Between the two piscicides, only mahua oil cake had
profound effect on the dissolved oxygen content of the field
culture system subject to treatment. Concentrations of mahua oil
cake of 200 ppm and above resulted in a reduction in the
110
dissolved oxygen
application. The
content to undetectably low
time taken for the revival
level following
of the oxygen
content was concentration dependent.
Based on the observations made during the course of
the field experiments, concentrations of 200 ppm and 4 ppm were
chosen as the optimum dose for the eradication of undesirable
finfishes in the case of mahua oil cake and croton seed
respectively. Dilution (8-10%) of the medium with tidal water,
12 hours after treatment was beneficial in minimising the
reduction in dissolved oxygen and the number and biomass of
macrobenthos in the case of mahua oil cake treatment.
The clam, V. cyprinoides could be completely destroyed
only by a higher concentration of 250 ppm of mahua oil cake
whereas, 4 ppm of croton seed delineated as the optimum for
destroying
also for
weed fishes was applicable in the case
eradication. In the case of mahua
of
oil
concentrations of 200 ppm and above were toxic to P.
clams
cake,
indicus
postlarvae beyond 24 hrs. of treatment, during which the
dissolved oxygen dipped to undetectably low level.
Concentrations of croton seed, 3 ppm and above were found to be
toxic to the postlarvae.
With regard to the zooplankton and macrobenthos of the
field culture systems under treatment, both the piscicides
exerted a concentration-dependent lethal effect.
111
cake,
The toxicity of different concentrations of mahua oil
150 ppm, 200 ppm, 250 ppm and 300 ppm persisted in the
culture systems for 1,4,4 and 7 days respectively with regard to
the least tolerant finfish A. gymnocephalus. The media containing
2 ppm, 3 ppm, 4 ppm and 5 ppm of croton seed, remained toxic to
the same species of fish for durations of 1,2,2 and 3 days
respectively.
The medium treated with optimum dose (200 ppm) of
mahua oil cake and croton seed (4 ppm) retained their toxic
effect on P. indicus postlarvae upto day-2 and
respectively.
treatment
The bottom soil of the ponds selected for the
studies with reference to the productivity
day-l
post
of the
culture systems was silty-sand with comparatively low orgnic
carbon content. Between the two piscicides, mahua oil cake was
found to enrich the soil nutrient status of the pond
marginally.
Diurnal variation in temperature, dissolved oxygen and
pH of the pond water under experiment showed a direct correlation
among the different parameters. In the case of gross and net
primary production, the control pond recorded higher values
indicating the minimal influence of the piscicides. Moreover,
toe water of the common feeder canal was also equally rich in
nutrients as those in the ponds under experimentation.
112
The magnitude of reduction of macrobenethic organisms
during the course of the 3 months culture period was more
intense in the treatment ponds, in comparison with the control
indicating the direct/indirect toxic effect of the piscicides.
The prawn, P. indicus attained maximum growth in
length and weight (103.88mm : 7.85 g) in the mahua-treated ponds
when compared with those cultured in the control (96mm 7.7g)
and croton-treated (89.95 mm 4.18 g) ponds
Between the treatment ponds, the increased growth noticed in the
mahua-treated pond could be indicative of the comparatively
higher benthos biomass, whereas the predation/competition
pressure within the control pond would have resulted in the lower
grrowth of the prawns cultured there. The increased growth
noticed in the control pond compared to the croton-treated pond
might be due to the continued presence of higher magnitude of
macrobenthos biomass upto the 75th day in the former pond.
The percentage of survival of prawns cultured in
mahua-treated, croton-tryeated and the control pond were 84.65,
86.30 and 39.11 respectively. The production values were 332.27
Kg/ha, 180.43 Kg/ha and 150.56 Kg/ha, in the order mentioned
above.
i
BIBLIOGRAPHY
ALAGARSWAMI, K. 1981. Prospects for coastal aquaculture in India.
Proc. Seminar on Role of Small-scale Fisheries and Coastal
Aquaculture in Integrated Rural Development. 6-9 December,
1978, Madras. CMFRI Bulletin 30-A.
ALAGARSWAMI, K. 1990. status of Coastal Aquaculture in India:
Aquacul ture in Asia (Ed) M. Mohan Joseph Asian Fisheries
society, Indian Branch P 163-190.
ALIKUNHI, K.H., H. CHOUDHURI AND V. RAMACHANDRAN, 1955. On the
mortali ty of carp fry in nursery ponds and the role of
plankton in their survival and growth. Indian J. Fish., 2(2)
: 257-313.
ANIRUDHAN, T.S. 1988. studies on the nutrient Chemistry of a
tropical estuary. Ph.D. Thesis.
Science and Technology.
The Cochin Uni versi ty of
ANON. 1944. Indian forest leaflet (72) : 10 P.
ANON. 1990. World shrimp farming 1989. Aquaculture Digest, San
Diego, California.
ANON. 1992. Handbook on Shrimp farming. The Marine Products
ANON,
APUD,
Export Development Authority, Cochin PP. 74.
1995. World Shrimp Farming 1995. Aquaculture Digest,
Diego, California.
F. , J.H. PRIMAVERA AND P.L. TORES,Jr. 1989. Farming
Prawns and shrimps. Aquaculture Extension Manual No.5,
Third edition. Southeast Asian Fisheries Development
Centre, Aquaculture Development, Tigbauan, Iloilo,
San
of
Philippines. i1
BABU, N. 1965. Observations on the toxicity of the seed of
Croton tiglium Linn. on predatory and weed fishes. Sci. &
Cult., 31(6). 308-310.
BARDACH, J AND R. SANTERRE 1981. Climate and the fish in the
sea. Bio Sci., 31(3) : 206-215.
BATICADOS, M.C.L., R.M. Coloso AND R.C. DUREMDEZ. 1986. Studies
on the chronic soft-shell syndrome in the tiger prawn,
Penaeus monodonFabricius, from brackishwater ponds.
Aquaculture, 56:271-285.
BENDSCHNEIDER, K., AND R.J. ROBINSON, 1952. A new
spectrophotometric method for the determination of nitrate
in water J. Mar. Res., 11(i) : 87-96.
BHATIA, H.L. 1970. Use of mahua oil cake in fishery management
Indian Fmg., 20(4) 39-40.
BHATTACHARYYA, D.K., AND BANERJEE, K. 1983. J. Amer. oil Chem.
Soc., 60(4), 841-845.
BIMACHAR, B.S. AND S.D. TRIPATHI 1966. A Review of Fish Culture
Activities in India. Proc. World Symp. Warmwater Fish
Culture. Fish. Rep., 2(44) : 1-33.
BHUYAN, B.R. 1967. Eradication of unwanted fish from ponds by
using indigenous plant fish poisons. Sci. Cult. 33(2) : 82-
83.
BHUYAN, B.R. 1968. A note on the use of Croton tiglium Linn.
seed as a fish poison in ponds.
65(1) : 236-40.
J. Bombay nat. Hist. Soc.
BOYD CLAUDE.E.1989. Water quality management and aeration in
shrimp
Ui
farming. Fisheries and Alied Aquaculters
Developmental Series No.2, Alabama Agricultural Experiment
Station,Aubwen University, Alabama.
CHAKRABARTY, D.P., NANDY, A.C. AND PHILIPOSE, M.T. (1972)
Barringtonia acutangula (Linn.) Gaertn as a f ish poison.
Ind. J. expt. BioI., 10(1) : 78-80.
CHANDEL, R.S. AND RASTOGI, R.P. 1980. Phytochemistry. 19, 1889-
1908.
CHOUDHURI, H. 1975. Experiments on the effects of organochlor
insecticides Aldrin, Dieldrin and Endrin on fish and other
pond organisms. J. Inland Fish. Soc. India., Vol. VII
189-203.
CHAUDHURI SUMIT HOME, TAPAN PANDIT, SUBHAS PODDAR AND SAMIR
BANERJEE 1986. Effect of mahua oil cake on the blood
values of an air breathing catfish, Heteropneustes fossilis
and a carp, Cyprinus Carpio. Proc. Indian Acad. Sci.
(Anim. sei.) Vol. 95, No. 5 pp. 617-622.
CHOPRA, R.N., R.L. BADHWAR AND S. GHOSH 1949. Poisonous plants
of India, Vol.l, Government of India Press, Calcutta: 762.
CHOPRA, R.N., S.L. NAYAR AND I.e. CHOPRA 1956. Glossary of
Indian Medicinal Plants. CSIR, New Delhi.
CHOPRA, R.N., R.L. BADHWAR AND S. GOSH 1965. Poison plants of
CHUA,
India : ICAR New Delhi 1&2 972 p.
T. E. , J.N. PAW AND E. TECH. 1989 A. Coastal
Aquacul ture development in ASEAN: the need for planning
and environmental management,P 57-70. In T.E.Chua and
D.Pauly (ends.) Coastal aren management in Southeast
Asia:Policies,management strategies and case studies. ICLAru1
iv
Conf.Proc.19,254 P.
COLT, J. AND ARMSTRONG, D. 1979.
Crustaceans and Molluscs.
California, 30 pp.
Ni trogen toxicity to Fish,
Dept. Civil Eng., Univ.
COOK, H, 1976. Problems in
region. SCSjWP/40.
shrimp culture in the South China Sea
29 p. South China Sea Fisher ies
Development and coordinating Programme. Manila, Philippines.
COPE, O.B., C.M. GJULLIN AND A. STORM 1947. Effects of some
insecticides on trout and salmon in Alaska, with reference
to Blackfly control. Trans. Amer. Fish. Soc., 77 : 160-177.
COTTAM, C AND E. HIGGINS 1946. DDT Its effect on fish and
wildlife. U.S. Fish and wild life Service, Circular No. 11 :
1-14.
CRISP,D.J. AND SOUTHWARD, A.J. 1958. The distribution of
intertidal organisms along the coasts of the English channel.
J.mar.boil. Ass. U.K., 37: 157-208.
CSAVAS, 1.1993. Aquacu1ture development and environmental issues
in the developing countries of Asia, P. 74-101. In R.S.V.
pullin,H.Rosenthal and J.L. Maclean (eds.) Environment and
aquaculture in developing countries. ICLARM conf.Proe. 31,
359 p.
DAS, P.R. 1969. A preliminary note on the toxicity of the plant
Derris trifoliata Lour on fishes. J. Indian Pharmac.
Mfr. 7(4) : 197-200.
DOUDOROFF, P., M. KATZ AND C.M. TARZWELL 1954. Toxicity of some
organic insecticides to fish. Sewage and Industrial Wastes,
25 (7) : 840-844.
v
EASWARA PRASAD, P. 1982. Studies on soils of some brackishwater
prawn culture fields around coch!n. M. Sc. Dissertation
University of Cochin, CMFRI Spl. Pub., 19 : 65-68.
GAAIWER, T AND H. H. GRAN 1927. Investigations of the production
of plankton in the Oslo Fjord. Rep. Proc. Verh. Cons. Expl.
Mer. 42. 1-48
GEORGE, K.V. 1974. Some aspects of prawn culture in the seasonal
and perennial fields of Vypeen Island. Indian J. Fish, 21
(1) : 1-19.
GEORGE, M.J. MOHAMMED, K.H. AND PILLAI, N.N. 1968. Observations
on the puddy field prawn filtration of Kerala, India. FAO
Fish. Rep., 57 (2) : 427-442.
GEORGE, M.J. AND C. SUSEELAN, 1982. Distribution of species of
prawns in the backwaters and estuar ies of India wi th
reference to coastal aquaculture. Froc. Symp. Coastal
Aquacu1ture, 1 : 273-284.
GHOSH, C.P., CHAKRABARTHY, M.M. & BHATTACHARYYA, D.K. 1983.
Fette, Seifen, Anstrichm. 85 (6), 224-227, Chem. Abstr., 99:
52082.
GOPALAKRISHNAN, T.C., C.B. LALITHAMBIKA DEVI, P.N. ARAVINDAKSHAN,
K.K.C. NAIR, T. BALASUBRAMANIAN AND M. KRISHNANKUTTY 1988.
Phytoplankton and zooplankton of some paddy-cum-prawn
culture fields in and around Cochin.
No. 2 pp. 85-94.
Mahasagar, Vol. 21,
GOPALAKRISHNAN, V. 1952. Food and feeding habits of Penaeus
indicus, J. Madras univ., (B) 22 (1) : 69-75.
vi
GOPALAKRISHNA PILLAI, N. 1977. Distribution and seasonal
abundance of macrobenthos of the Cochin Backwaters. Indian
Journal of Marine Sciences, Vol; 6 pp. 1-5.
GOPINATHAN, C. P., P. V. R. NAIR, V. KUNJUKRISHNA PILLAI, K.
PARAMESWARAN PILLAI AND V.K. BALACHANDRAN 1982.
Environmental characteristics of the seasonal and perennial
prawn culture fields in the estuarine system of Cochin.
Proc. symp. Coastal Aquaculture, 1 : 369-382.
GOWEN,R.J., J.R.BROWN, N.B. BRADBURY AND D.S. McLUSKY 1988.
Investigations into benthic enrichment, hyper
nutrification and eutrophication associated with
mariculture in scottish coastal waters (1984-1988). Dept.
Bid. sci.,Univ. stirling, Scotland. 289 p.
GOWEN,R.J. AND H. ROSENTHAL. 1993. The environmental consequence
of intensive
countries. What
R.S.V. Pullia,
coastal aquaculture in developed
lessons can be learnt, P.I02-115.
H. Rosenthal and J.L. Maclean (eds.)
In
Environment and aquaculture in developing countries. ICLARM
conf. Proc. 31,359 pI
HALL, D.N.F. 1962. Observations on the taxonomy of some indo-
West-Pacific penaeidae (Crustacea Decapoda). Fish. Publ.
Colonial off., 17 : 1-229.
HARIDAS, P, M. MADHU PRATAP AND T.S.S. RAO 1973.
temperature, oxygen and zooplankton biomass
Salinity,
of the
backwaters from Cochin to Alleppey.
Marine Sciences. Vol. 2 pp. 94-102.
Indian Journal of
HARRINGTON, R.W. AND W.I. BIDLINGMAYER 1958. Effects of
Dieldrin on fishes and invertebrates of a salt marsh. J.
vii
trlildlife Mgmt., 22 (1) : 78-82.
HASAN, 11.R AND MACINTOSH, D.J., 1986. Acute toxicity of
Ammonia to common carp fry. Aquaculture, 54 : 97-107.
HOFFMAN, C.H. AND E.W. SUBER. 1949. Effects of serial
application of DDT on fish and fish food organisms
in two pennsylvania water sheds. prog. Fish Cult.,
11 (4) : 203-211.
HORA,S.L. AND T.V.R. PILLAI. 1962. Handbook of fish culture
in the Indo-Pacific region. FAO. Fish ~liol. Tech.
Pap. (14) : 203 p.
JENA,S • 1986. preliminary observations on the effect of
tamarind seed husk on fish. J. Inland Fish. Society of
India. 18 (1) : 1-4.
p. M.
JOSE, S., P.M. MATHEW, H.M. JOSE AND.<,.t-1RITHUN,JAYAN. 1988. zoo-
plankton and rnacrobenthos in a brackishwater fish farm in
the south-west coast of India.In:M.Mohan Joseph ( Ed )
viii
The First Indian Fisheries Forum, Proceedings. Asian
Fisheries society, Indian Branch, Mangalore : pp. 147-150.
JOSEPH GILBERT AND V.K. PILLAI 1987. Lime requirement for pond
soils for aquaculture around Cochin backwaters. Mar. Fish.
Infor. Serv., T & E Ser., No. 71 : pp. 18-20.
KARTHA, K.N.R. AND P. KARUNAKARAN NAIR 1980. Grow More Prawns.
Krishi Vigyan Patrika : Mariculture Seris 5. CMFRI Cochin.
KIRTIKAR, K.R. & B.O. BASU 1975. Indian Medicinal Plants Vol.
I-IV. M/s. Bishen singh Mahendrapal Singh, Dehra Dun. M/s.
Periodical Experts, D-42, Vivek vihar, Delhi-32.
KUNJU, M.M. 1978. Growth in prawns. SUmmer Institute in Breeding
And Rearing of Marine Prawns. Central Marine Fisheries
Research Institute, Cochin, CMFRI special Publication No.3.
pp.48-57.
KURUP, N. SURENORANATHA, 1978. Features of prawns which
contribute to their suitability for culture. Sumer Institute
in Breeding and Rearing of Marine Prawns. Central Marine
Fisheries Research Institute, Cochin, CMFRI Special
Publication No.3 pp.40-44.
KUTTYAMMA, V.J. 1974. Observations on the food and feeding of
some penaeid prawns of Cochin area. J. Mar. bioI. Ass.
India, 15 (1) : 189-194.
KUTTYAMMA, V.J. 1975. Studies on the relative abundance and
seasonal variations in the occurrence af the postlarvae of
three species of penaeid prawns in the Cochin backwaters.
Bull. Oep. Mar. Sciences, University of Cachin, Vol VII. 1,
1975 pp. 213-219.
KUTTYAMMA, V.J. AND C.V. KURIAN 1980. Prawn fry resources in
ix
the Kayamkulam Lake. Nat. Symp.- Shrimp Farming Bombay 16-18
August 1978. pp. 49-52.
KUTTYAMMA, V.J. & C.V. KURIAN, 1982. Distribution of postlarvae
of Marine praWns in the South west coast of India. Indian
Journal of Marine sciences. Vol. 11 pp. 270-272.
LAKSllMAN, A.K. I 1983. Mahua oil cake in fish culture. Environ. &
Ecol., 1 : 163-167.
LAWRENCE, J. M. 1950. 'l'oxici ty of some new insecticides to
several species of pond fish. Prog. Fish. Cult., 12 (3)
:141-46.
LAZARUS, S. AND NANDAKUMARAN, K. 1986. Experiments on culture of
Penaeus indicus in polyethylene film lined ponds at
Calicut. Mar. Fish. Inf. Serv. T&E. Ser , 70 : 16-i7 central
Marine Fisheries Research Institute, Cochin.
LIPTON, A.P. 1995. An appraisal of a semi intensive prawn farm
at Kanjiramkudi, Ramanathapuram district. Mar. Fish. Infor.
Serv., T&E Ser. 139 : p. 13.
MADIIUPRATAP, M. 1979. Distr ibution I Communi ty structure and
species succession of copepods from cochin backwaters.
Indian Journal of Marine sciences, Vol. 8 pp. 1-8.
MADHUPRATAP, M. AND P. HARIDAS 1975. Composition and Variations
in the abundance of zooplankton of backwaters from Cochin to
Alleppey. Indian Journal of Marine Sciences Vol. 4. pp. 77-
85.
x
MADHUPRATAP, M AND T.S.S. RAO 1979 Tidal and diurnal influence
on estuarine zooplankton. Indian Journal of Marine sciences
Vol. 8, pp. 9-11.
MARICHAMY, R. AND JOHN MOTHA 1986. Prospects of prawn culture
in salt pan areas. Mar. Fish. Infor. serv., T & E Ser., No.
70 1-7.
MATHEW, K. J. , RENGARAJAN, K. ,
GOPALAKRISHNAN, N. 1982. A
SALVARAJ, G.S.D.
simple device for
AND
the
quantitative assessment of prawn and fish seed resources in
the estuarine areas. Proc. symp. coastal aquaculture, 12th-
18th Jan. 1980. Marine BioI. Assoc. India, Cochin, 1: 302-
307.
MENON, A.G.K., 1991. Indigenous larvivorous fishes of India.
Malaria Research Centre, (ICMR), Delhi.
MENON, M.K. 1954. On the paddy field prawn fishery of Travancore
cochin and an experiment in prawn culture Proc. Indo
Pacific Fish. counc., 5th session, section 11. 1-15.
MENON, N.R., P.VENUGOPAL AND S.C. GOSWAMI,1971. Total biomass and
faunistic composition of the zooplankton in Cochin
backwater.J.mar.biol.Ass.lndia,13:220-225.
MENON, N .R., T .R.C. GUPTA, V. HARIHARAN, R.J. KATTI AND H. P.C.
SHETTY. 1977.Marine plankton of MangaIore waters-A pre
pollution assessment. Proc.Symp.Warm Water Zoopl. Spl. Publ.
UNESCO/NlO, 274-283.
MINSALAN, C.L.O. AND Y.N. CHIU. 1986. Effects of tea seed cake on
selective elimination of finfish in shrimp ponds, p. 79-82.
In J.L. Maclean, L.B. Dizon and L.V. Hossillos (eds.) The
first Asian Fisheries Forum. Asian Fisheries Society,
xl
Manila, Philippines.
MOHAMED, K.H. 1983. Hatchery production of prawn seed. Proc.
Nat. Symp. Shrimp seed production and hatchery management
Cochin, 21-22 Jan 1983 pp: 117-137.
MOHAMED, K.H., P. VEDAVYASA RAO AND M.J. GEORGE 1968. Post
larvae of penaeid prawns of south-west coast of India with a
key to their identification. FAO Fish. Rep., 57(2): 487-504.
MULKY M.J. 1976. J. oil Tech. Assoc. India, 8(3), 106-111.
MURTY, P.S.N. AND M. VEERAYYA, 1972. Studies on the Sediments of
Vembanad Lake,
Organic Carbon.
45-51.
Kerala State Part I Distribution of
Indian Journal of Marine Sciences Vol.l. PP
MUTHU, M.S. 1978. A General review of penaeid prawn culture.
Summer Institute in Breeding and rearing of marine prawns.
CMFRI special publication, No.3 : 25-33.
MUTHU, M.S. 1978 a. Larval development - Specific identity of
penaeid postlarvae found in brackishwater areas. Bull
Cent. Mar Fish. Res. Inst, 28(1): 86-90.
NADKARNI, K.M. 1954. The Indian Materia Medica. Vol.l. Popular
Book Depot, Bombay 7.
NAIR, K.K.C, V.N. SANKARANARAYANAN, T.C., GOPALAKRISHNAN, T.
BALASUBRAMANIAN, C.B. LALITHAMBIKA DEVI, P.N. ARAVINDAKSHAN
AND M. KRISHNAN KUTTY I 1988. Environmental conditions of
some paddy-cum-prawn culture fields of Cochin backwaters,
south west coast of India. Indian Journal of Marine
Sciences, Vol 17 pp. 24-30.
xi 1.
NANDAKUMAR, G. 1982. Experimental prawn culture in Coastal ponds
at Mandapam. Proc. symp. Coastal Aquaculture, 1 : 103-111.
NANDY r A. C . and CHAKRABORTY D . P . ( 1976 ) . A note on the use of
unripe fruits of Randia dumentorum Lam. as a fish poison J.
Inland Fish.Soc. rnd., 8 : 134-136.
NATH, D. 1979 Toxicity of mahua oil cake under laboratory and
field conditions. In sympos ium on Inland Aquacul ture
(Abstracts), February 12-14, 1979: CIFRI Barrackpore : 50.
NAYAR, S.L. 1955. Vegetable insecticides. Proc. Symp. Indigenous
drugs and insecticides. Bull Nat. Inst. India, 4 : 137-145.
ONG, J.E.1982.Mangroves and Aquaculture in Malaysia. Ambio
11:253-257.
PANIKKAR, N.K. 1937. The Prawn Industry of the Malabar Coast,
Jour. Bombay Nat. Hist. Soc., Vol.34.
PANIKKAR, N.K. 1951. Physiological aspects of adaptation to
estuarine conditions. Proc. Indo-Pacof. Fish, Counc., 162-
175.
PANIKKAR, N.K. 1952. possibilities of further expansion of fish
and prawn culture practices in India. Curr. Sci., 21(2): 29-
33.
PANIKKAR, N.K. AND M.K. MENON 1956. Prawn fisheries of India.
Proc. Indo-Pacif. Fish Counc., 6(3): 328-344.
PETERSON, P.D. 1976. A review of some botanical fish toxicant and
preliminary observations on the toxicity of Derris sp.( as
a rotenone source) to Tilapia mossambica. Paper presented
at the 12th Annual Convention of the Philippine Federation
of Fish Farm Producers, lnc., 26-28 August, 1976. lloilo
City.
xiii
PILLAI, T.G. 1962. Fish farming methods in the Philippines,
Indonesia and Hong Kong. F.A.O Fish BioI. Tech. Rep., 18: 1-
68.
PILLAI, V.K. AND CLAUDE E. BOYD 1985. Water quality management
in aquaculture. CMFRI special Publ., No.22.
PILLAr V. K., K. J. JOSEPH and A. K. KESAVAN NAIR 1975. The
plankton production in the Vembanad
waters in relation to the environmental
lake and adjacent
parameters. Bull
Dept. Mar. Sci. Univ., Cochin, VII, I, 137-150
PREETHA,K.1994.Benthic ecology of selected prawn culture fields
and ponds near Cochin. ph.D. Thesis. Cochin University of
Science and Technology.
PULLIN, R.S.V., H. ROSENTHAL AND J.L.MACLEAN, Editors. 1993.
Environment and aquaculture in developing countries. ICLARM
Conf. Froc. 31,359 p.
RAJYALAKSHMI, T, 1980. Manual of BrackiSh water Aquaculture in
rndia.CIFRI, Barrackpore, W. Bengal.
RAM, K.J., RAO, G.R.M., AYYAPPAN, S., PURUSHOTHAMAN, C.S., SAHA,
P.K., PANI, K.C. AND MUDULI, H.K., 1988. A combination of
commercial bleaching powder and urea as a potential
piscicide. Aquaculture, 72: 287-293.
RAMACHANDRAN, V. 1963. Indo-Pacific Fish. council Proe., 10(2)
146-153.
RAMAMURTHY, S. 1978. Prawn farm. Summer Institute in Breeding
and rearing of marine prawns. 11th May-9th June 1977.
Cochin CMFRI, Spl Pub., No. 3 pp. 92-103.
RAMAMURTHY, S. 1982. Prawn seed resources of the estuaries in the
Mangalore area. Proc. Symp. Coastal Aquaeulture, 1:160-172.
xiv
RAO, P. V. 1980. Penaeid prawn seed resources in the estuaries
and backwaters of Karnataka and Kerala. Mar. Fish. Infor.
serv., T&E. Ser., 20 9-11, Central Marine Fisheries
Research Institute Cochin.
RAO, P. VEDAVYASA 1983. Studies on Penaeid prawn diseases.
Summer Institute in Hatchery production of prawn seed and
Culture of Marine Prawns. 18th April-17th May 1983.
Central Marine Fisheries Research Institute, Cochin.
ROARK, R.e. 1932. A digest of the Literature of Derris
(Deguella) species used as insecticides, 1747-1931, U.S.
Dept. Agr. Misc. Pub., 120.
ROY,P.K., J.D. MUNSHI AND J.S. DATTA MUNSHI 1989. Effect of
saponin extracts on haematology of air-breathing climbing
perch, Anabas testudineus (Bloch) Proc. Natl. Symp.
Emerg. Tr. Anim. Haematol:44-47.
SAHA, G.N., THAKURTA, S.C., LAHA, G.c.,
H.C., NASKAR, K.R., DAS, P.B. AND
NANDY, A . C. I
CHATTERJEE,
KARMAKAR,
S.K. 1986.
Ecology and fishery management of brackishwater bheries in
west Bengal. Central Inland Fisheries Research Institute,
Barrackpore, Bulletin, No. 46: 23.
SAJI CHACKO AND M.M. THOMAS 1991. Invasion of clams in prawn
culture fields. Effects on the growth of prawns.
Mar. Fish. Infor. Serv.,T & E Ser., No.114.
SAMUEL, C.T. 1962. Morphology of the Eels and Eel like fishes.
ph.D. Thesis. University of Kerala.
SAMPATH, V. AND V.RAMACHANDHA MENON 1975.Preliminary Experiments
in cage culture of prawns at Kovelong in Tamilnadu. Bull.
Dept. Mar. Sci. Univ. Cochin., 7(3): 467-476.
xv
SANKARANARAYANAN, V.N. AND S.U. PANAMPUNNAYIL 1979. studies on
Organic carbon, Nitrogen and Phosphorus in sediments of the
Cochin Backwater. Indian Journal of Marine Sciences, Vol.B
pp. 27-30.
SELVARAJ, G.S.D., K.J. MATHEW AND K.N. GOPALAKRISHNAN 1980.
Techniques for the collection and transportation of prawn
seeds. Mar. Fish Infor. serv. T&E. Ser., 19: 11-12 CMFRI,
Cochin.
SHARMA, K.P. AND M.M. SIMLOT 1971, piscicidal effect of Temru
Diospyros cordifolia Roxb. J. Inland Fish. Soc. India,
Vol III p. 57-62.
SIIEEBA SUSAN MATHEWS 1992. Ecological characteristics of prawn
culture fields in the Cochin area. Ph.D. Thesis. Cochin
University of Science and Technology.
SHEPARD, lLB. 1951. The Chemistry and action of Insecticides.,
Mc-Grow-Hill Book Co. Inc., New York, Toronto, London.,
1-540.
SIIIGUENO, K. 1975. Shrimp culture in Japan. Association for
International Technical Promotion, Tokyo, 153 pp.
SIIIRGUR, G. A. 1972. Development of Indegenous Derris powder
Journal of the Indian Fisheries Association, 2(1&2) 55-59.
SHIRGUR, G.A. 1974. Substitutes for Derris powder FAO
Aquaculture Bullettin : p:10.
SHIRGUR, G.A. 1975. Indication of safe poison materials from
indigenous plants for clearing unwanted fishes from nursery
xvi
ponds. Indian J. Fish., 22(1,2) : 126-132.
SHIRGUR, G. A. 197 5a. A synoptic account of development of
improved methods in Fish Nursery Management. Journal of
Inland Fisheries society of India, 6(1) pp : 194-204.
SINHA, V.R.P. 1979. Aquaculture still an unexploited potential.
Indian Fish Farming. 1979 (July).
SIVAKAMI, S. 1988. Observations on the effects of fertilizer and
feed applications on the growth of Penaeus indicus H. Milne
Edwards. Indian J. Fish., 35 : 1, 18-25.
SOLORZANO, L. 1969. Determination of ammonia in natural waters
by the phenol hypochlorite method. Limnol. Oceanogr., 14:
799-801.
SRIKRISHNADHAS, B., AND K. RAMAMOORTHI, 1975. Studies on some
polychaete larvae of Porto Novo waters. Bull. Dept. Mar. Sci.
Univ. Cochin, 1975,VII,4, 733-749.
SRIKRISHNADHAS, B., N. JAYABALAN AND K. RAMAMOORTHI 1981. Ecology
of the population of polychactes in the intertidal region of
the Vellar estuary. Proc. symp. Ecol. Anim. Populo Zool. Surv.
India, Pt.1:73-81.
STRIKLAND, J.D.H. & Parsons T.R. 1977. A practical hand book of
sea water analysis. Fish. Res. Bd. Can Bull., (2nd Edn.).,
ottawa, 167, 419 pp.
SUBRAMANIAN, S. 1983. Eradication of fishes by application of
Ammonia. Aquaculture. Elsevier science Publishers B.V.
Amsterdam, 35 : 273-275.
SURBER, E.W. 1948. Chemical control agents and their effects on
fish. Prog. Fish. Cult., 10(3) : 125-131.
SUSEELAN, C. 1975. The prawn culture practices in salt pan
xvii
reservoirs at Manakkudy near Cape camorin. Bull. Dep. Mar.
Sci., univ. Cochin, VII 3: 477-486.
SUSEELAN, C. 1978. The environmental requirements for culture of
marine prawns. Summer Institute in Breeding and rearing of
marine prawns. CMFRI Spa Pub.3 pp 103-109.
SUSEELAN, C, AND M. KATHIRVEL 1982. Prawn seed calendars of
Cochin backwater. Proc. Symp. Coastal Aquaculture., 1: 173-
182.
TANG, Y.A. AND S.H. CHEN 1967. A survey of algal pasture soils
of milkfish ponds of Taiwan.FAO Fish Rep., 44(3). 198-209.
TERAZAKI MAKATO, PRAPAN THRNBUPPA AND YASHIHA NAKAYAHA 1980.
Eradication of predatory fishes in shrimp farms by
utilization of Thai tea seed. Aquaculture, 19 . 235-242.
THAMPY, D.M, M.J. SEBASTIAN, SUSHEELA E. ABRAHAM, AND C.G.
RAJENDRAN 1982. Proc. Symp. Coastal Aquacul ture. Mar.
BioI. Assn.
223-228.
India, Cochin 12-18 Jan. 1980. Vol.I. pp.
THOMAS, M.M. 1972. Studies on Indian Decapods Ph.D. Thesis,
Kerala university.
THOMAS, M.M. 1973. Food and feeding habits of Penaeus monodon
Fabricus from Korapuzha Estuary, Indian J. Fish., 19:
204.
202-
THOMAS, M.M. 1978. Food and feeding of prawns. Summer Institute
in Breeding and Rearing of marine prawns. Central Marine
Fisheries Research Institute, Cochin, Special Publication,
No. 3 p.44-48.
TOMPKINS, J.A. AND TSAI, C. 1976. Survival time and lethal
exposure time for the blacknose dace exosed to free chlorine
xviii
and chloramines. Trans. Ami. Fish. Soc., 105: 315-321.
TRIPATHY, N.K., RADHESHYAM, S., SATHAPATHY, B.B., AND KHAN, H.A.
1980. Preliminary observations on the use of bleaching
powder as fish toxicant for preparation of nursery ponds In
Symposium on utilization of Animal Resources of orissa,
utkal University, Bhubaneswar, India, 22-23 Mar, 1980.
TSCHESCHE, R. AND WULFF, G. 1973. In "Progress in the chemistry
of natural products". Vo1.30 (Hertz, W., Grisebach, H. &
Kirby, G.W., eds) Springer - Verlag, New York, pp. 461-606
TsuTsumi, HAND T. KIKUCHI 1983. Benthic ecology of a small cove
with seasonal oxygen bepletion caused by organic pollution.
Publ. Amakusa Mar. BioI. Lab. Kyashu Univ. 7: 17-40.
UNNITHAN, K. ASOKAKUMARAN, 1985. A Guide to Prawn farming in
Kerala~Central Marine Fisheries Research Institute, Cochin,
Special Publication, No.21.
UNNITHAN, K. ASOKAKUMARAN 1996. Sustainable shrimp farming (in,
Malayalam) Extn. Series, -10-A. Central Marine Fisheries
Research Institute, Cochin.
VICTOR CHANDRA BaSE, s., V. VENKATESAN AND D. SUNDARARAJAN 1980.
Prawn seed resources of Adyar Estuary at Madras. Nat. Symp.
Shrimp Farming, Bombay. 16-18 August, 1978 pp. 61-66.
WHITE, C.R. Jr. 1955 Chlorine,its toxicity to goldfish, fathead
minnows, golden shiners and blue gills and its removal from
water. M.S. Thesis, Alabama Polytechnic Institute, Auburn,
A.L. 58 pp.
xix
YOUNG, L.A. AND H.D. NICHOLSON. 1951. stream pollution
resulting from the use of organic insecticides. Prog.
Fish Cult., 13(4) : 193-98.
Addenda
BANERJEE, R.K., B.B. PAKRASI AND P. RAY. 1979. Use of mahua
oil cake and cotton seed waste in fish farming: In
Symposium on Inland Aquaculture (Abstr.) February,12-14,
1979,CIFRI, Barrackpore: 106.
BELL F. AND CANTERBURY. 1976. Agriculture for developing
countries: A feasibility study. Bellinger Publ. Co.,
Cambridge, Mass., USA. 266 pp.
BLAXHALL, P.C. AND K.W. DAISLEY. 1973. J. Fish. 8101.,5:771-781.
DE, D.K., D. NATH AND P.R. SEN. 1987. Preliminar studIes on
tea seed cake as fish toxicant. Indian Journal of Animal
Sciences 57 (7): 781-783.
GEORGE,K.V. 1980. Economics of traditional prawn culture in
Kera1a with a note on the advantages of intensive prawn
culture. Nat. Symp. Shrimp Farming, Bornbay, 16-18 August,
1978 : 131-137.
HENDRICKS, L.J. 1952. Erythrocyte counts and haemoglobin deter
minations for two species of suckers, genus Catostomus
from Colorado. Copeia 4: 265-266.
HESSER, E.F. 1960. Prog. Fish Cult., 22: 164-170.
HORA, S.L. AND K.K. NAIR. 1944. Suggestions for development of
salt water bheris or Bhasabadha fisheries in the Sunderbans.
Fishery Oep. Pamphlet No.1 Dep. of Fisheries, Govt. of
West Bengal, Calcutta.
xx
KUT'I"fAMMA,V.J. 1981. The temperature tolerance of some
penaeid prawns. Bull. Dep. Mar. Sci. Univ. cochin,Vol XII.
1, 29-39.
LM1BERG, S.L. AND ROTHSTEIN, R. 1978. Haematology and urinalysis
A.V.I. Publishing Company, Connecticut, USA.
Mc LEAY, D.J. AND GORDON, M.R. 1977. Leucocrit : A simple
haematological technique for measuring acute stress in
salmonid fish including stressful concentrations of pulp
mill effluents. J. Fish. Res. Bd. Can. 34 : 2164-2175.
MURPHY, J AND J.P.RILEY, 1962. A modified single solution
method for the deteDmination of phosphate in natural waters.
Anal. Chim. Acta., 27 : 31-36.
PILLAI, V.K. AND BOYD, C.E. 1985. A simple method for calculating
liming rates of fish ponds. Aquaculture, 46 : 157-162.
TAMPI, P.R. SADASIVAN. 1958. Marine fish farming. Fisheries of
west coast of India,CMFRI, India, pp.31-86.
TANG, Y.A. 1967. Improvement of milk fish culture in the
Philippines. Curr. Aff. Bull. Indo-Pac. Fish. Counc.,
49 : 14-22.
THE WEALTH OF INDIA. 1962. Raw Materials Vol VI, L-M, CSIR,
New Delhi : 207-216.