Embed Size (px)
Citation preview

EFFECTS OF THE MAILLARD REACTIONS ON CHEMICAL COMPOSITION AND
AMINO ACID DIGESTIBILITY OF FEED INGREDIENTS AND ON PIG GROWTH
PERFORMANCE
BY
FERDINANDO NIELSEN DE ALMEIDA
DISSERTATION
Submitted in partial fulfillment of the requirements
for the degree of Doctor of Philosophy in Animal Sciences
in the Graduate College of the
University of Illinois at Urbana-Champaign, 2013
Urbana, Illinois
Doctoral Committee:
Professor Hans H. Stein, Chair
Professor Emeritus George C. Fahey, Jr.
Professor James E. Pettigrew
Assistant Dean Jason L. Emmert
John E. Thomson, Director of Nutrition and Technical Sales, Evonik Industries
ii
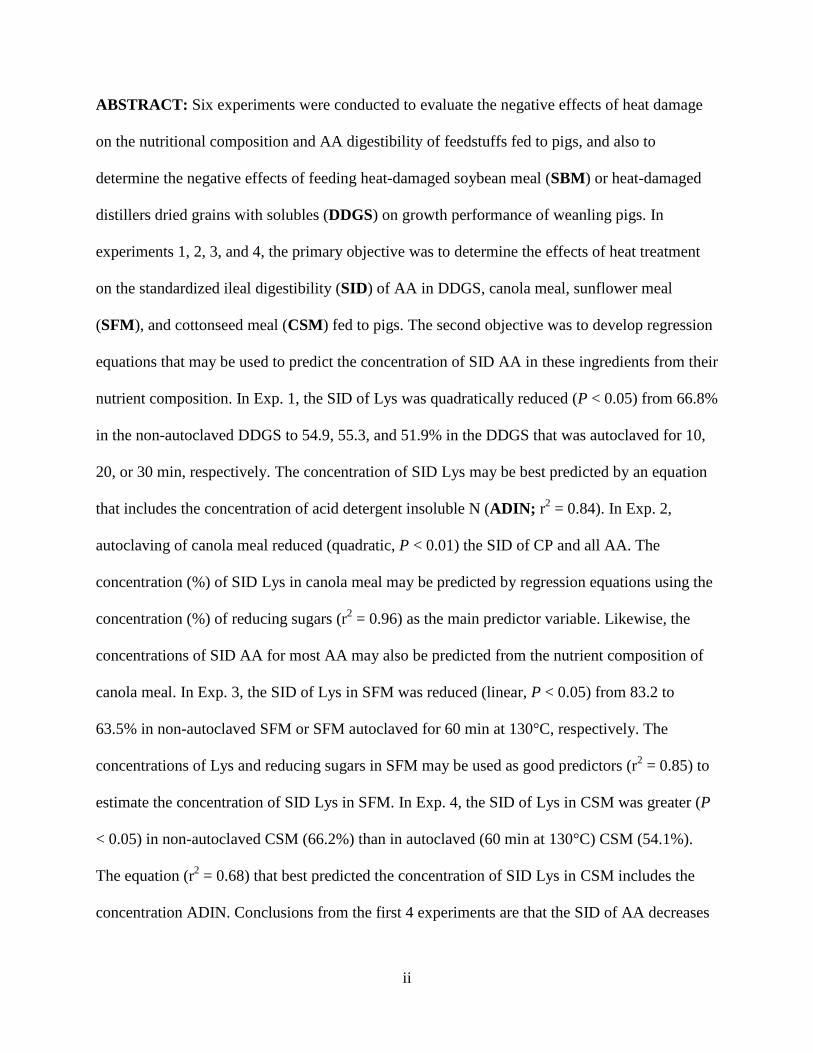
ABSTRACT: Six experiments were conducted to evaluate the negative effects of heat damage
on the nutritional composition and AA digestibility of feedstuffs fed to pigs, and also to
determine the negative effects of feeding heat-damaged soybean meal (SBM) or heat-damaged
distillers dried grains with solubles (DDGS) on growth performance of weanling pigs. In
experiments 1, 2, 3, and 4, the primary objective was to determine the effects of heat treatment
on the standardized ileal digestibility (SID) of AA in DDGS, canola meal, sunflower meal
(SFM), and cottonseed meal (CSM) fed to pigs. The second objective was to develop regression
equations that may be used to predict the concentration of SID AA in these ingredients from their
nutrient composition. In Exp. 1, the SID of Lys was quadratically reduced (P < 0.05) from 66.8%
in the non-autoclaved DDGS to 54.9, 55.3, and 51.9% in the DDGS that was autoclaved for 10,
20, or 30 min, respectively. The concentration of SID Lys may be best predicted by an equation
that includes the concentration of acid detergent insoluble N (ADIN; r2 = 0.84). In Exp. 2,
autoclaving of canola meal reduced (quadratic, P < 0.01) the SID of CP and all AA. The
concentration (%) of SID Lys in canola meal may be predicted by regression equations using the
concentration (%) of reducing sugars (r2 = 0.96) as the main predictor variable. Likewise, the
concentrations of SID AA for most AA may also be predicted from the nutrient composition of
canola meal. In Exp. 3, the SID of Lys in SFM was reduced (linear, P < 0.05) from 83.2 to
63.5% in non-autoclaved SFM or SFM autoclaved for 60 min at 130°C, respectively. The
concentrations of Lys and reducing sugars in SFM may be used as good predictors (r2 = 0.85) to
estimate the concentration of SID Lys in SFM. In Exp. 4, the SID of Lys in CSM was greater (P
< 0.05) in non-autoclaved CSM (66.2%) than in autoclaved (60 min at 130°C) CSM (54.1%).
The equation (r2 = 0.68) that best predicted the concentration of SID Lys in CSM includes the
concentration ADIN. Conclusions from the first 4 experiments are that the SID of AA decreases

iii
as a result of heat damage, but these reductions may be linear or quadratic depending on the type
of ingredient. It is also concluded from these experiments that chemical composition may be
used to predict the concentration of SID Lys in DDGS, canola meal, SFM, and CSM, but the
predictor variables vary depending on the ingredient. Experiments 5 and 6 were conducted to
investigate if adjustments in diet formulations based on either total analyzed AA or standardized
ileal digestible (SID) AA may be used to eliminate negative effects of including heat-damaged
soybean meal (SBM) or heat-damaged distillers dried grains with solubles (DDGS) in diets fed
to weanling pigs. In Exp. 5, 4 corn-SBM diets were formulated. Diet 1 contained non-autoclaved
SBM and this diet was formulated on the basis of analyzed AA concentrations and using SID
values from the AminoDat® (2006) database. Three additional diets were formulated using
autoclaved SBM. Diet 2 was formulated similar to Diet 1 except that the non-autoclaved SBM
was replaced by the autoclaved SBM. Diet 3 was formulated by adjusting AA inclusion in the
diet on the basis of analyzed total AA concentrations in the autoclaved SBM and published SID
values (AminoDat®, 2006). Diet 4 also contained autoclaved SBM, but the formulation of this
diet was adjusted on the basis of analyzed AA in the autoclaved SBM and SID values that were
adjusted according to the degree of heat damage in this source of SBM. The G:F was greater (P
< 0.05) for pigs fed Diet 1 compared with pigs fed the other diets. Pigs fed Diet 4 had greater (P
< 0.05) G:F than pigs fed Diet 2. In Exp. 6, 4 diets containing corn, SBM (8.5%), and DDGS
(non-autoclaved or autoclaved; 22%) were formulated using the concepts described for Exp. 5,
except that heat-damaged DDGS, was used in the diets. Pigs fed Diet 1 had greater (P < 0.05)
G:F than pigs fed the other diets, but no differences were observed for G:F among pigs fed diets
containing autoclaved DDGS. Results demonstrate that the negative effects of heat damage may
be ameliorated if the reduced concentration as well as the reduced digestibility of AA in heat-

iv
damaged SBM is corrected. Diets for weaned pigs containing up to 22% of heat-damaged DDGS
reduces performance of pigs compared with diets containing DDGS that has not been heat-
damaged, but correction for the reduced concentration and the reduced digestibility of AA in
heat-damaged DDGS may not be of practical importance for weaned pigs.
Key words: amino acid, digestibility, heat damage, pig

v
ACKNOWLEDGEMENTS
It is with immense gratitude that I thank my advisor, Dr. Hans H. Stein, whose guidance,
support, encouragement, and patience throughout this part of my life enabled me to grow as a
scientist. It was an honor for me to have had the privilege of working with him.
I thank my committee members, Dr. Jason Emmert, Dr. George C. Fahey, Jr., Dr. James
Pettigrew, and Dr. John Thomson for the many ways you shared your knowledge with me, and
for all of the suggestions that greatly contributed to this research. I also extend my gratitude to
Dr. John Htoo who also advised me throughout the last 3 years. Financial support from Evonik
Industries also was greatly appreciated.
I express my gratitude to our research manager and friend, Kate Horsman, our former and
current post-docs, and to my fellow graduate students who directly contributed to the
accomplishment of this dissertation. I consider it an honor to work with such a team. I also thank
all the professors, laboratory personnel, the farm crew, and feed mill personnel for being
available and ready to help when I needed.
I owe my deepest gratitude to my dad, Alfeno, my mom, Linei, and my sister, Isis, for
their love, care, unrestricted support and prayers throughout my life. To my lovely wife, Juliana,
I cannot find words to describe the appreciation for the wonderful woman that you are. I truly
recognize how important you are, and without your love and support this would not have been
accomplished. THANK YOU SO MUCH for being my helper. To my little daughter, Ester: your
birth served as an extra encouragement for completing this dissertation.

vi
TABLE OF CONTENTS
LIST OF ABBREVIATIONS ...................................................................................................... viii
CHAPTER 1 ................................................................................................................................... 1
INTRODUCTION ...................................................................................................................... 1
CHAPTER 2 ................................................................................................................................... 3
MAILLARD REACTIONS AND THEIR EFFECTS ON THE NUTRITIONAL QUALITY
OF FEED INGREDIENTS FOR PIGS: REVIEW OF LITERATURE ......................................... 3
INTRODUCTION ...................................................................................................................... 3
LYSINE NOMENCLATURE AND FATE IN VIVO ................................................................ 4
MAILLARD REACTION .......................................................................................................... 5
KINETICS OF THE MAILLARD REACTION ........................................................................ 7
METABOLISM OF MAILLARD REACTION PRODUCTS ................................................. 10
AMADORI COMPOUND DEGRADING ENZYMES ........................................................... 12
PROTEIN DISPERSIBILITY INDEX ..................................................................................... 13
CHEMICAL EVALUATION OF REACTIVE LYS IN HEAT DAMAGED PROTEINS ..... 14
PRACTICAL CONSEQUENCES OF HEAT DAMAGE ....................................................... 20
CONCLUSIONS....................................................................................................................... 23
LITERATURE CITED ............................................................................................................. 24
FIGURES .................................................................................................................................. 32
CHAPTER 3 ................................................................................................................................. 38
AMINO ACID DIGESTIBILITY OF HEAT DAMAGED DISTILLERS DRIED GRAINS
WITH SOLUBLES FED TO PIGS .............................................................................................. 38
ABSTRACT:............................................................................................................................. 38
INTRODUCTION .................................................................................................................... 39
MATERIALS AND METHODS .............................................................................................. 40
RESULTS ................................................................................................................................. 43
DISCUSSION ........................................................................................................................... 46
LITERATURE CITED ............................................................................................................. 52
TABLES ................................................................................................................................... 57
CHAPTER 4 ................................................................................................................................. 71

vii
EFFECTS OF HEAT TREATMENT ON THE APPARENT AND STANDARDIZED ILEAL
DIGESTIBILITY OF AMINO ACIDS IN CANOLA MEAL FED TO GROWING PIGS ........ 71
ABSTRACT .............................................................................................................................. 71
INTRODUCTION .................................................................................................................... 72
MATERIALS AND METHODS .............................................................................................. 73
RESULTS ................................................................................................................................. 76
DISCUSSION ........................................................................................................................... 77
LITERATURE CITED ............................................................................................................. 82
TABLES ................................................................................................................................... 87
CHAPTER 5 ................................................................................................................................. 98
AMINO ACID DIGESTIBILITY OF HEAT DAMAGED SUNFLOWER MEAL AND
COTTONSEED MEAL FED TO GROWING PIGS ................................................................... 98
ABSTRACT .............................................................................................................................. 98
INTRODUCTION .................................................................................................................... 99
MATERIALS AND METHODS ............................................................................................ 100
RESULTS ............................................................................................................................... 104
DISCUSSION ......................................................................................................................... 106
LITERATURE CITED ........................................................................................................... 111
TABLES ................................................................................................................................. 115
CHAPTER 6 ............................................................................................................................... 131
EFFECTS OF DIET FORMULATION ON PERFORMANCE OF WEANLING PIGS FED
HEAT DAMAGED SOYBEAN MEAL OR HEAT DAMAGED DISTILLERS DRIED
GRAINS WITH SOLUBLES ..................................................................................................... 131
ABSTRACT ............................................................................................................................ 131
INTRODUCTION .................................................................................................................. 132
MATERIALS AND METHODS ............................................................................................ 134
RESULTS ............................................................................................................................... 137
DISCUSSION ......................................................................................................................... 140
LITERATURE CITED ........................................................................................................... 146
TABLES ................................................................................................................................. 149
GENERAL CONCLUSIONS ..................................................................................................... 164

viii
LIST OF ABBREVIATIONS
a* Redness
AA Amino acid
ADF Acid detergent fiber
ADFI Average daily feed intake
ADG Average daily gain
ADIN Acid detergent insoluble nitrogen
AEE Acid hydrolyzed ether extract
AID Apparent ileal digestibility
Ala Alanine
AOAC Association of Official Analytical Chemists
AOCS American Oil Chemists` Society
Arg Arginine
Asp Aspartate
BW Body weight
b* Yellowness
°C Degrees Celsius
Ca Calcium
CDS Condensed distillers solubles
CM Canola meal
CO2 Carbon dioxide
Corp. Corporation
CP Crude protein

ix
CSM Cottonseed meal
Cu Copper
CV Coefficient of variation
Cys Cysteine
d Days
DDGS Distillers dried grains with solubles
DM Dry matter
DMI Dry matter intake
et al. And others
Exp. Experiment
FAOX Fructosyl amino acid oxidase
FDNB Fluorodinitrobenzene
Fe Iron
FN3K Fructosamine -3-kinase
FN6K Fructosamine-6-kinase
g Grams
G:F Gain to feed ratio
Glu Glutamate
Gly Glycine
h Hour
H Hydrogen
HCl Hydrochloric acid
HD Heat damaged

x
His Histidine
HMF Hydroxymethylfurfural
H2O2 Hydrogen peroxide
HPLC High-performance liquid chromatography
I Iodine
IA Iowa
ICP Inductively coupled plasma
i.e. That is
IL Illinois
Ile Isoleucine
IN Indiana
Int. International
IU International units
K Potassium
kcal Kilocalories
kg Kilograms
L* Lightness
Lys Lysine
Leu Leucine
LLC Limited liability company
M Mole (concentration)
m Meter
ME Metabolizable energy

xi
Met Methionine
min Minutes
mg Milligrams
μmol Micromoles
Mn Manganese
MN Minnesota
N Nitrogen
N Normal (concentration)
n Sample size
Na Sodium
NC North Carolina
ND North Dakota
NDF Neutral detergent fiber
nm Nanometer
NRC National Research Council
OH Ohio
OMIU O-Methylisourea
P Phosphorus
P Probability
PC Positive control
PDI Protein dispersibility index
Phe Phenylalanine
Pro Proline

xii
PUN Plasma urea nitrogen
R2
Coefficient of determination
RL Reactive Lysine
RMSE Root mean square error
rp Coefficient of correlation
rpm Revolutions per minute
RS Reducing sugars
SAS Statistical Analysis System
SBM Soybean meal
SD South Dakota
SFM Sunflower meal
Se Selenium
SE Standard error
Ser Serine
SID Standardized ileal digestibility
Trp Tryptophan
Tyr Tyrosine
U.S. United States
Val Valine
vs. Versus
wk Week
Zn Zinc

1
CHAPTER 1
INTRODUCTION
Feed costs account for the majority of the variable costs of swine production. Protein and
energy are the main nutrients in swine diets and, thus, understanding their utilization by the
animal is important to successful swine production. Many of the feed ingredients used in swine
diets are processed in different ways. Among these ingredients, oilseed meals such as canola
meal, sunflower meal, and cottonseed meal undergo heat processing to improve their nutritional
quality and also to remove solvents that are commonly used during oil extraction. As such, these
oilseed meals are exposed to varying degrees of heat, which, in excess, is deleterious to protein
quality. Amino acids are required for growth and performance of pigs. Lysine, which is the first
limiting AA in most swine diets, is particularly affected by heat processing of feed ingredients
because it reacts with reducing sugars upon heat processing and initiates the Maillard reactions.
Consequently, Lys that participates in the Maillard reactions becomes unavailable for protein
synthesis in vivo and, therefore, reduced growth performance is expected under such conditions.
Because of the variation in feed processing and the potential negative effects caused by heat
processing on protein quality, it is important to develop strategies to evaluate the nutritional
quality of protein and to determine the extent to which heat processing can damage feed proteins.
A review of the literature regarding the Maillard reactions and their effects on feed ingredient
utilization by pigs is provided in Chapter 2. In Chapters 3 to 5, we provide data on the
digestibility of AA in distillers dried grains with solubles, canola meal, sunflower meal, and
cottonseed meal as affected by heat damage, and we also provide suggestions for evaluating the
protein quality of these feed ingredients. Performance of weaning pigs fed diets containing heat-

2
damaged soybean meal or heat-damaged distillers dried grains with solubles is described in
Chapter 6, and different ways to ameliorate negative effects of heat damage also are evaluated.

3
CHAPTER 2
MAILLARD REACTIONS AND THEIR EFFECTS ON THE NUTRITIONAL QUALITY
OF FEED INGREDIENTS FOR PIGS: REVIEW OF LITERATURE
INTRODUCTION
The nutritional value of feed ingredients may be reduced during storage and processing
(Friedman, 1996). This is likely a consequence of a combination of heat and humidity that leads
to the Maillard reaction, which starts with the condensation between an amino group of an AA or
protein and a carbonyl group of a reducing sugar. Lysine is an essential AA that has an ɛ-amino
group that easily condenses with the carbonyl group of a reducing sugar (Nursten, 2005). When
the Maillard reaction occurs, Lys availability is reduced (Pahm et al., 2008; Boucher et al.,
2009). During AA analysis, however, Lys is partially recovered leading to an overestimation of
the available Lys. Because of this overestimation, standard AA analysis procedures may not be
adequate to determine the amount of available Lys in feed ingredients that have been heat
processed. Therefore, it is believed that analysis of reactive Lys is more accurate than standard
Lys analysis (Boucher et al., 2009).
There are several methodologies developed for the calculation of reactive Lys. These
procedures include the guanidination procedure (Rutherfurd et al., 1997), the furosine procedure
(Desrosiers et al., 1989), the fluorodinitrobenzene (FDNB) difference method (Rao et al., 1963),
and the sodium borohydride method (Hurrell and Carpenter, 1974). Despite their advantages and
disadvantages, the 2 most commonly used procedures are the FDNB and homoarginine methods
(Rutherfurd and Gilani, 2009). Because of the complexity of the Maillard reaction as well as the
variety of methods used to determine reactive Lys in heat-damaged feed ingredients, the
objectives of this literature review are to provide information describing the Maillard reaction,

4
factors that affect the rate of the reaction, and metabolism of Maillard reaction products in vivo.
Objectives also include describing methodologies for estimation of reactive Lys in heat-damaged
feed ingredients or diets.
LYSINE NOMENCLATURE AND FATE IN VIVO
The term, total Lys, refers to the concentration of reactive Lys plus the concentration of
blocked Lys (Figure 2.1; Rutherfurd, 2010). Reactive Lys refers to the Lys that has not
undergone Maillard reactions and the ε-amino group is not bound to other molecules. Blocked
Lys is the Lys that was bound to Amadori products as a result of Maillard reactions. Acid
hydrolysis of proteins during standard AA analysis, however, releases some of the blocked Lys
from the Amadori product, which then is called regenerated Lys. This regenerated Lys appears in
the same peak as reactive Lys in the chromatogram and, therefore, is included in the peak for
total Lys. Therefore, in feed ingredients that have been heat processed, the concentration of Lys
determined by standard AA analysis overestimates the concentration of reactive Lys that is
available for protein synthesis by the pig, leading to formulation of diets that do not necessarily
meet the Lys requirement of pigs, and possibly reducing growth or reproductive performance of
pigs.
Reactive Lys has 2 fates in vivo: it may be absorbed and utilized by the animal, or it may
pass through the gastrointestinal tract and be excreted in feces (Rutherfurd, 2010). This is in
agreement with data reported by Pahm et al. (2009) who determined that the standardized ileal
digestibility of reactive Lys in 12 sources of corn distillers dried grains with solubles (DDGS)
was 67% on average. It was suggested that the reason for the relatively low digestibility of Lys
may be that corn DDGS has a relatively high neutral detergent fiber (NDF) concentration, which

5
contributes to increased endogenous losses of Lys. Another reason may be that severe heat
damage can lead to cross-linking of proteins, which is believed to impair digestion of Lys.
MAILLARD REACTION
The Maillard reaction is a series of reactions that starts with the condensation of an amino
group of an AA with a carbonyl group of a reducing sugar (Figure 2.2; Mauron, 1981; Gerrard,
2002). This reaction was first described by Louis Maillard in 1912 when he observed the
formation of brown pigments during heating of glucose and Lys. Because of the complexity of
reactions, the series of reactions is normally divided into 3 main stages: initial, intermediate, and
late stages of the Maillard reaction (Nursten, 2005).
Initial Stage
The initial stage of the Maillard reaction is characterized by formation of glycosylamine,
which is later converted to Amadori compounds (de Kok and Rosing, 1994) in a series of
reactions (Gerrard, 2002). The reaction starts with the condensation of an amino group of an AA
or peptide with the carbonyl group of a sugar. The terminal amino group of all AA is susceptible
to this reaction, as is the epsilon amino group of Lys. If AA are present in proteins, however, the
terminal AA groups are used to form peptide bonds and they are, therefore, not available for
condensation. The epsilon amino group of Lys, however, may condense with reducing sugars,
and Lys is, therefore, often the AA that is most affected by Maillard reactions. Schiff bases are
formed after dehydration of the condensation products. These Schiff bases may undergo
sequential rearrangements (Amadori rearrangements) yielding the cyclic glycosylamine
(Gerrard, 2002). After a protonation of the ring oxygen atom, glycosylamine is converted to
Amadori compounds. All reactions up to the formation of Amadori compounds are reversible

6
depending on the conditions (pH, temperature, and rate of mutarotation) in which the reactions
occur (Yaylayan and Huyghues-Despointes, 1994).
Intermediate Stage
The intermediate stage of the Maillard reaction includes 3 main reactions: sugar
dehydration, sugar fragmentation, and AA degradation (Nursten, 2005). During sugar
dehydration reactions, furfurals (under acid conditions) and reductones (under neutral or alkaline
conditions) are the end-products. Dehydration of xylose yields furfural whereas dehydration of
glucose yields hydroxymethylfurfural (HMF). During these reactions, 3 molecules of water are
lost. In contrast, in the sugar dehydration reactions to form reductones, only 2 molecules of water
are lost (Nursten, 2005).
Depending on the Amadori compound, sugar fragmentation can form various end
products. There are 2 main mechanisms by which sugar fragmentation may occur:
retroaldolisation and oxidative fission (Nursten, 2005). Some of the products from sugar
fragmentation include glycolaldehyde, acetol, ethanol, pyruvic acid, lactic acid, formic acid, and
formaldehyde among others (Nursten, 2005). Amino acid degradation or Strecker degradation
occurs when α-AA are oxidized to form aldehydes, and these reactions involve the transfer of
ammonia to other components in the system as well as liberation of CO2 (Nursten, 2005).
Final Stage
The final stage of the Maillard reaction involves aldol condensations and an aldehydes-amine
condensation reaction leading to the formation of polymeric compounds called melanoidins
(Nursten, 2005). The aldol condensation reactions are initiated by the formation of aldehydes
from the products formed in the intermediate stage of the Maillard reaction, with amines and
carbonyl compounds (probably from lipid oxidation) serving as catalysts. Melanoidins that are

7
formed during this final stage contain 3 to 4% N and their composition may vary depending on
the substrates by which they were formed. The nature of melanoidins is very complex and work
has been conducted to isolate and purify melanoidins from foods (Silván et al., 2006). Thus,
Lindenmeier et al. (2004) were able to identify one melanoidin structure that is formed from the
reaction between the Lys side chains and acetylformoin. This melanoidin, called pronyl-L-Lys,
was isolated from crust and crumbs of bread.
KINETICS OF THE MAILLARD REACTION
Some of the factors affecting the rate of Maillard reactions products formation are
temperature, pH, type of substrate, and water activity. Each of these factors may affect the
kinetics of the reactions in specific ways.
Temperature
The Maillard reaction can be initiated at temperatures similar to that of the human body.
In fact, these reactions happen in vivo at 36˚C (Ledl and Schleicher, 1990). A fraction of
hemoglobin, HbA1c, which is normally present in high concentrations in diabetic patients, has a
hexose bound at the N-terminal Val of the β-chain in the form of 1-amino-1-deoxyfructose. The
formation of HbA1c is a result of the Maillard reaction because in vitro incubation of another
fraction of hemoglobin (HbA0) with glucose yields HbA1c through the addition of glucose to the
N-terminal amino group of hemoglobin, which gives rise to the Schiff`s base and further
Amadori compounds (Ledl and Schleicher, 1990).
Processing of foods and feed ingredients at high temperatures also may lead to the
Maillard reaction. During production of DDGS, corn undergoes several steps under different
temperatures (32 to 100˚C) that may lead to the formation of Maillard reaction products (Pahm et

8
al., 2008). The study of Maillard reaction products originating from food processing, however, is
very complex due to the variety of conditions used in food processing and the many different
products that are formed under each of these conditions (Argirova et al., 2010).
pH
Results of many experiments have indicated that increasing pH favors the Maillard
reaction. The color formation in a Lys-glucose system was increased with a pH increase from 4.0
to 8.0 (Lee et al., 1984), and this conclusion was confirmed by Leahy and Reineccius (1989a)
who observed that formation of pyrazines, which are heterocyclic compounds formed from
Maillard reactions, was 500 times greater at pH 9.0 than at pH 5.0. The Maillard reaction itself
also affects the pH (Delgado-Andrade et al., 2004). When heating glucose-Lys and glucose-
methionine model systems, the pH decreased as heating time increased, which likely was a result
of basic amino group disappearance at the early stages of the reaction. After formation of
Amadori compounds, pH also plays an important role because it determines the pathway of
fragmentation (intermediate stage) in which a low pH favors 1,2 enolisation leading to the
formation of formaldehyde, glycolaldehyde, and glyceraldehyde. In contrast, a high pH favors
2,3 enolisation leading to the formation of other end-products that may include butanedione,
isomaltol, and acetic acid (Nursten, 2005).
Type of Substrate
Alkylpyrazines, which are heterocyclic, N-containing compounds (Leahy and Reineccius,
1989b) may be among the end-products of the Maillard reactions (Hodge, 1953). In an attempt to
investigate effects of both the type of AA and the type of sugar on the formation of pyrazines,
Leahy and Reineccius (1989b) developed model systems in which 2 AA (Asp and Lys) were
tested in combination with 3 sugars (glucose, fructose, and ribose). The formation of pyrazines

9
was evaluated after heating the solutions (pH = 9.0) at 95˚C for 2 h. Results of this study
indicated that Lys systems yielded more pyrazines than Asp systems, especially when reacted
with glucose. When comparing the effects of type of sugar, glucose yielded more pyrazines than
fructose and ribose, regardless of the type of AA used in the system. In another study, Shibamoto
and Bernhard (1977) observed that pentoses yielded more pyrazines than hexoses. These
observations indicate that both the type of AA and the type of reducing sugar in a particular feed
ingredient may have a direct effect on the rate of the Maillard reactions product formation and on
the fate of the AA involved in it.
Water Activity and Relative Humidity
Water activity is the ratio of the water vapor pressure over a product to the water vapor
pressure over pure water and can be converted to relative humidity if multiplied by 100 (Hahn-
Hägerdal, 1986). The rate of Maillard reaction product formation is increased as water activity is
decreased (van Boekel, 2001). This is likely due to the fact that as water activity decreases, the
reactants become more concentrated. At a certain water activity, however, the increase in the
reactant concentration prevents them from easily diffusing, which leads to a decrease in the rate
of Maillard reactions. A maximum rate of reaction has been observed at water activities between
0.3 and 0.7, and as the relative humidity increases, the rate of reaction decreases (Eichner and
Karel, 1972). The maximum rate of reaction occurs between 60 and 80% relative humidity, but
the optimal relative humidity for the Maillard reaction depends on the food or model systems
used (Acevedo et al., 2006).

10
METABOLISM OF MAILLARD REACTION PRODUCTS
A review of the metabolic transit of Maillard reaction products has been published (Faist
and Erbersdobler, 2001). According to this review, Amadori products and advanced glycation
end-products resulting from the Maillard reaction may have 3 fates in vivo: 1) absorption upon
protein release by digestive enzymes or gut microbiota, 2) metabolism by bacteria in the
gastrointestinal tract, and 3) excretion via feces and urine.
Schiff`s Bases
The utilization of Schiff`s bases by rodents is similar to that of free Lys (Finot and
Magnenat, 1981), and when rats were fed ɛ-N-salicylidene-L-lysine and ɛ-N-benzylidine-L-
lysine, the growth responses were similar to those obtained by rats fed free Lys. The reason for
this observation is most likely that the Schiff`s bases are formed by reactions that are reversible
under acidic conditions. Therefore, when feed containing Schiff`s bases reaches the stomach,
Lys may be regenerated because of the acidic conditions in the stomach.
Amadori Compounds
Amadori compounds may be either excreted in feces or absorbed and excreted in urine
(Erbersdobler et al., 1981). Absorption of ɛ-fructose-lysine occurs by passive diffusion and fecal
excretion of ɛ-fructose-lysine has been shown in a narrow range between 1 and 3% of ingested
protein bound ɛ-fructose-lysine (Faist and Erbersdobler, 2001). The excretion of ɛ-fructose-
lysine, however, has shown some variability. Rats that were fed protein bound ɛ-fructose-lysine
excreted 60% of total intake in the urine (Finot and Magnenat, 1981). In humans adults, only 3%
of ingested protein ɛ-fructose-lysine was excreted via urine (Faist and Erbersdobler, 2001),
whereas in human infants, the excretion of protein bound ɛ-fructose-lysine via urine
corresponded to 16% of total intake (Niederweiser et al., 1975).

11
Amadori compounds may be degraded by bacteria (e.g., Pseudomonas spp. in soil;
Gerhardinger et al., 1995), and incubation of protein-bound fructose-lysine with rat intestinal
microorganisms for 48 h resulted in approximately 80% degradation (Erbersdobler et al., 1970).
Amadori compounds cannot be utilized for protein synthesis in the body because formation of
Amadori compounds is an irreversible process and Lys cannot be regenerated from Amadori
compounds. The majority of the absorbed Amadori compounds are, therefore, excreted in urine.
Amadori compounds also may accumulate in different tissues of the body. Fructose-
lysine accumulation in tissues was demonstrated by Finot and Magnenat (1981) who observed
that the majority of accumulation occurs in the kidneys, although fructose-lysine may also
accumulate in other tissues such as liver and pancreas.
Melanoidins
Melanoidins are partially digested and absorbed by the intestines (Faist and Erbersdobler,
2001; Tuohy et al., 2006). The absorbed melanoidins may be retained in the kidneys (Faist and
Erbersdobler, 2001). Low molecular weight non-absorbed melanoidins appear to be degraded in
the intestines while the high molecular weight non-absorbed melanoidins apparently are not
degraded in significant amounts (O`Brien and Morrissey, 1989). Rats that were fed melanoidins
formed by the reaction of Gly with 14
C-glucose excreted on average 0.96 and 92.6% of ingested
radioactivity in the urine and feces, respectively, whereas 1.6% was retained in the carcass and
another 1.5% was expired as 14
CO2 (Finot, 2005). These melanoidins were excreted unmodified
in feces, which indicates that melanoidins are not metabolized by the microbes in the
gastrointestinal tract. Valle-Riestra and Barnes (1970) also observed that melanoidins are
partially absorbed in the small intestine of rats, but the majority (74%) is excreted in feces and
only 3% is excreted in urine. Thus, in feed ingredients that have undergone advanced Maillard

12
reactions, Lys cannot be regenerated in the gastrointestinal tract and, therefore, cannot be utilized
for protein synthesis.
AMADORI COMPOUND DEGRADING ENZYMES
Fructosyl amino acid oxidases (FAOXs) are enzymes present in fungi and bacteria that
have the capacity to cleave the ketoamine bond in the Amadori compounds yielding the
corresponding AA, glucosone, and H2O2 (Deppe et al., 2010; Lin and Zheng, 2011). Although
these enzymes are present in fungi (i.e., Achaetomiella, Achaetomium, Apergillus, and
Fusarium), bacteria (i.e., Arthrobacter and Pseudomonas), and in yeast (i.e., Debaryomyces and
Pichia), no evidence of the presence of FAOXs in mammalian organisms has been reported (Lin
and Zheng, 2011). However, fructosamine 3-kinase (FN3K), which is another class of Amadori
compound degrading enzymes, is present in mammals (Deppe et al., 2010). When fructosamine
is the starting Amadori compound, FN3K phosphorylates the C3 of fructosamine, which yields
fructosamine 3-phosphate. This compound then goes through an autocatalytic degradation that
yields 3-desoxyglucosone, the original amino compound (i.e., amino compound that initially
reacted with glucose), and inorganic phosphate (Deppe et al., 2010). A third class of Amadori
compound degrading enzymes is called fructosamine 6-kinases (FN6K). These enzymes
phosphorylate the C6 of fructosamine to form fructosamine 6-phosphate, which is degraded by
the enzyme, deglycase, to form glucose 6-phosphate and a free amino compound (Deppe et al.,
2010). The practical use of FAOXs has been limited because these enzymes only react with
small glycated substrates (e.g., fructosyl amino acids or dipeptides), but an experiment conducted
by Zheng et al., (2010) indicates that manipulation of FAOXs may be possible so that larger
substrates also may be degraded by the enzyme. Nevertheless, commercial use of FAOXs in the

13
food industry to reduce the concentration of Amadori compounds in food preparations is not
common.
PROTEIN DISPERSIBILITY INDEX
The degree of heat to which feed ingredients are exposed is correlated with the protein
dispersibility index (PDI), which is the percent of total protein that disperses in water and has
been primarily used as an indicator of minimum adequate heat processing of soy products
(Reinitz, 1984; Marsman et al., 1995; Batal et al., 2000; Iwe et al., 2001; Palić et al., 2012). Soy
products are routinely toasted to decrease the concentration of heat labile antinutritional factors,
and the greater the PDI value, the less the degree of destruction of antinutritional factors
(Reinitz, 1984). Conversely, a low PDI value (e.g., 20%, for soy flour) indicates a more complete
destruction of antinutritional factors. Increasing time of autoclaving of soyflakes from 0 to 36
min (121°C) resulted in a linear decrease in PDI values and a concomitant increase in G:F of
chicks, thus indicating that PDI can be used as an indicator of minimum adequate heat
processing of soyflakes (Batal et al., 2000). For SBM, PDI values ranging from 15 to 30%
indicate adequately heat processed SBM. Thus, it is expected that a PDI value for SBM of less
than 15% may indicate excessive heat processing and, consequently, low protein quality. A study
conducted to determine the degree of heat treatment in 5 sources of full-fat soybeans analyzed
for PDI in 6 different laboratories, however, concluded that there was considerable variation in
this analysis, thus suggesting a low precision of this method (Palić et al., 2012).

14
CHEMICAL EVALUATION OF REACTIVE LYS IN HEAT DAMAGED PROTEINS
Most of the chemical methods used to determine the amount of reactive Lys in heat-
damaged proteins are based on specific reactions with the ɛ-amino group of Lys. Among these
methods are the guanidination method, the furosine method, the difluorodinitrobenzene method,
and the sodium borohydride method, which are the most common methods used to determine the
concentration of reactive Lys in heat-damaged proteins (Moughan, 2003).
Guanidination Method
The guanidination procedure, in which feed or food proteins are guanidinated with O-
methylisourea (OMIU), has been used for determination of reactive Lys (Figure 2.3; Fontaine et
al., 2007; Pahm et al., 2008; Boucher et al., 2009). Guanidination results in a reaction between
the ɛ-amino group of Lys and OMIU, which yields homoarginine (Rutherfurd and Moughan,
2007). In this reaction, only Lys that has not undergone Maillard reactions and, thus, has a free
amino group will react with OMIU to form homoarginine (Pahm et al., 2010). Because
homoarginine is acid stable, proteins can be hydrolyzed with HCl and the liberated homoarginine
(using ion-exchange HPLC) is mathematically converted to Lys based on the molecular weight
of homoarginine and Lys. Therefore, this Lys represents the reactive Lys. To ensure accuracy of
this method, conversion of Lys to homoarginine needs to be complete. To achieve complete
conversion of Lys to homoarginine, the guanidination reagent has to be adequately prepared and
the incubation conditions need to be optimized. Optimum conditions may be achieved by varying
pH and reaction time. Using an OMIU solution of 0.6 M, the transformation of Lys to
homoarginine in soy products was shown to be most effective at a pH of 11.5 and reaction time
of 2 d, but for DDGS, the optimum conditions are at a pH of 12.0 and a reaction time of 2.5 d
(Fontaine et al., 2007; Pahm et al., 2010). Nyachoti et al. (2002) concluded that for canola meal

15
and barley, conversion of Lys to homoarginine via guanidination is best achieved using a OMIU
solution of 0.5 M and a 6 d reaction time. The guanidination method may be used to estimate Lys
damage in damaged proteins (Rutherfurd and Moughan, 2007). In damaged proteins containing
early Maillard reaction products that may be partly converted back to Lys (under acid
hydrolysis), total Lys overestimates reactive Lys, but because guanidination occurs prior to acid
hydrolysis, the reactive Lys is converted to homoarginine before its exposition to acid. The
reactive Lys is, therefore, represented by the amount of homoarginine in the sample (Pahm et al.,
2008; 2010).
The guanidination procedure has been used to determine the concentrations of reactive
Lys in blood meal, wheat, meat and bone meal, SBM, and cottonseed meal (Rutherfurd et al.,
1997). The concentrations (mg/g) of reactive Lys in blood meal (88.0), wheat (3.1), meat and
bone meal (34.6), and SBM (32.3) were somewhat similar to the concentrations of total Lys
(89.1, 3.5, 36.5, and 32.3, respectively). Thus, it was suggested that such similarity may be a
result of severe heat damage of the ingredients evaluated, which may cause structurally altered
Lys to become acid stable. Consequently, regeneration of Lys upon acid hydrolysis may be
impaired. These results indicate that the guanidination procedure may not accurately predict the
concentration of reactive Lys in over-processed feed ingredients.
The concentration of reactive Lys determined by the guanidination procedure also has
been reported in soy products (Fontaine et al., 2007). Soy products were autoclaved at 135°C in
3 min intervals from 0 to 30 min. Results indicated that the concentration of reactive Lys in SBM
(47% CP), SBM (43% CP), and in full fat soybeans was less than the total concentration of Lys.
It also was observed that increasing time of autoclaving linearly decreased the concentration of
both the total Lys and the reactive Lys, but the decrease in the concentration of reactive Lys in

16
the 3 soy products was more accentuated, which indicates that the guanidination procedure to
determine the concentration of reactive Lys is, indeed, more sensitive than standard AA analysis.
The main advantage of the guanidination method is that it provides results that are close
to results given by in vivo tests. However, this is a time consuming method, which may take
from 2 to 4 d for completion. There is also some variability in the absolute values that are
obtained using this method (Meade et al., 2005).
Furosine Method
The furosine method may be used to determine the extent of early Maillard reactions
(Figure 2.4; Krause et al., 2003). Formation of furosine is observed when Amadori compounds
are acid hydrolyzed. Hydrolysis of Amadori compounds yields furosine, regenerated Lys, and
pyridosine. Under standard AA analysis conditions (6 M HCl), the yield of furosine is assumed
to be constant (32%; Pahm et al., 2008) although published data show a yield range from 20 to
42% (Krause et al., 2003; Nursten, 2005). Some of this variation may be due to the type of
Amadori compounds present in the sample (Krause et al., 2003). The reaction of Lys with
glucose forms ɛ-N-deoxyfructosyllysine, which under 6 M HCl for 24 h, yields 50% Lys, 20%
furosine, and 10% pyridosine (Nursten, 2005). Hydrolysis of N-1-deoxy-D-
tagatosylhippuryllysine yields 42% furosine (Krause et al., 2003). It may, therefore, be
advantageous to determine the types of Amadori compounds present in a specific feed ingredient
before using an assumed value for the yields of furosine to calculate the amount of reactive Lys.
If the concentration of furosine is determined, it is possible to calculate the concentration
of unreactive Lys (Pahm et al., 2008). The concentration of reactive Lys, therefore, can be
calculated by the difference between total Lys and unreactive Lys, in which total Lys
corresponds to the sum of concentration of reactive and unreactive Lys.

17
The furosine procedure has been used to determine the concentration of reactive Lys in
various feed ingredients. An increase in the concentration of furosine in combination with a
decrease in the concentration of reactive Lys was observed for whey protein that was heat treated
at temperatures that ranged from 75 to 121°C for 3 different time periods (Desrosiers et al.,
1989). The concentration of unreactive Lys (0.28 g/100 g CP) in light colored wheat DDGS,
however, was slightly greater than the concentration of unreactive Lys (0.24 g/100 g CP) in dark
colored wheat DDGS (Cozannet et al., 2010). This is an interesting observation as one should
expect a greater concentration of unreactive Lys in the dark colored wheat DDGS, considering
that color may serve as an indicator of the degree of heat damage and Maillard reactions in a
particular feed ingredient (González-Vega et al., 2011). Furthermore, Cozannet et al. (2011)
observed that the sum of reactive Lys and unreactive Lys does not add to the total Lys in wheat
DDGS. According to Cozannet et al. (2011), this observation indicates that determination of
unreactive Lys by the furosine procedure may underestimate the real concentration of unreactive
Lys and, therefore, overestimates the concentration of reactive Lys. However, these conclusions
were based on the untested assumption that hydrolysis of unreactive Lys yields 32% furosine. As
mentioned, it is possible that this value varies among feed ingredients and research to determine
the furosine yield from unreactive Lys in different feed ingredients is, therefore, needed.
The advantage of the furosine procedure is that it may be used to quantify Lys in the
initial stage of Maillard reactions, but it is assumed that intermediate and late Maillard reaction
products cannot be degraded to form Lys (Meade et al., 2005).
Fluorodinitrobenzene Method
The procedures by which reactive Lys is measured using fluorodinitrobenzene (FDNB)
can be divided into 2 methods: direct and difference methods (Hurrell and Carpenter, 1974). The

18
direct method consists of the conversion of reactive Lys to dinitrophenyl-Lys by reacting a feed
ingredient with FDNB (Rutherfurd and Gilani, 2009). Because dinitrophenyl-Lys is a colored
compound, it can be measured either by spectrophotometry or by reverse-phase HPLC (Pahm,
2008; Rutherfurd and Gilani, 2009). One disadvantage of this method is that during acid
hydrolysis, FDNB may react with carbohydrates in the sample and this may lead to color
deterioration, which may require use of correction factors. Hurrell and Carpenter (1974) used
methoxycarbonyl chloride to correct for the loss of dinitrophenyl-Lys during acid hydrolysis. If
the difference method is used (Figure 2.5; Roach et al., 1967), FDNB also is used to react with
the reactive Lys. After acid hydrolysis, regenerated Lys, which does not react with FDNB, is
estimated. Thus, reactive Lys is calculated by the difference between total Lys and regenerated
Lys. Despite its disadvantages, the FDNB method has been used recently to evaluate the effects
of rendering on protein quality of animal by-products (Pérez-Calvo et al., 2010). Rendered
products from 2 processing plants were evaluated, and it was reported that the concentration of
reactive Lys in a rendered product from one plant (processed at 150°C for 45 min) was 3.75% of
CP, whereas the concentration of reactive Lys in a rendered product from another plant
(processed at 140 °C for 167 min) was 4.20% of CP. The concentration of reactive Lys in the
rendered products, regardless of the processing plant in which they were produced, was less than
the concentration of total Lys. The FDNB procedure also was used to determine the
concentration of reactive Lys in cake mix, and it was observed that the concentration of reactive
Lys was reduced by 63.5% as a result of baking and toasting of the cake mix (Hurrel and
Carpenter, 1977). This result agrees with the results observed by Pérez-Calvo et al. (2010),
which indicates that the FDNB method is a sensitive indicator of heat damage in protein
ingredients. Cereal products also have been evaluated by the FDNB method, and results from

19
this experiment revealed that the concentration of total Lys in 20 breakfast cereal products may
have overestimated the concentration of reactive Lys (Torbatinejad et al., 2005). It was also
observed that reactive Lys determined by both the FDNB method and the guanidination method
had a high degree of correlation (0.99), which indicates that both methods may be used to
determine the concentrations of reactive Lys in breakfast cereals.
The disadvantage of the direct and difference methods include the long acid hydrolysis
step, and an additional disadvantage of the direct method is a slight overestimation of blocked
Lys. It is also possible that samples that contain high concentrations of polysaccharides may
yield results that are inaccurate (Meade et al., 2005).
Sodium Borohydride Method
When Maillard products are treated with sodium borohydride they become acid stable
(Figure 2.6; Hurrell and Carpenter, 1974) because a covalent bond is formed between sodium
borohydride and deoxyketosyl-Lys. As a consequence, Lys is not regenerated during acid
hydrolysis and, therefore, the total Lys that is measured after AA analysis corresponds to the Lys
that did not react with a reducing sugar. Thus, this method allows for the direct measurement of
reactive Lys. This method has been used to determine the reactive Lys in SBM fed to growing
pigs (Pahm, 2008). The concentration of reactive Lys determined by the sodium borohydride
procedure in SBM was 1.14%, and this value was similar to the values for the concentration of
reactive Lys determined by the guanidination and furosine methods (1.19 and 1.06%,
respectively). The concentration of reactive Lys determined by the sodium borohydride
procedure in a mixture of albumin and glucose was reduced as a result of heat damage and, as
expected, the values for the concentration of reactive Lys in these mixtures was less than the
values for the concentration of total Lys in each respective mixture (Hurrell and Carpenter,

20
1974). This observation confirms the sensitivity of the sodium borohydride procedure to evaluate
heat-damaged proteins. Couch and Thomas (1976) compared the use of the sodium borohydride
procedure to determine the concentration of reactive Lys in various proteins with the FDNB
method. No differences in the concentration of reactive Lys in bovine serum albumin were
observed between the 2 methods. Likewise, the concentration of reactive Lys in glandless
cottonseed meal determined by the sodium borohydride procedure was not different from the
concentration of reactive Lys determined by the FDNB method (Couch and Thomas, 1976).
These observations indicate that there is a good agreement between the 2 methods for
determination of reactive Lys; however, the sodium borohydride procedure has the advantage
that it is less time consuming than the FDNB method (Couch and Thomas, 1976).
The advantage of the sodium borohydride method is that reactive Lys can be determined
directly in heat-damaged proteins. The main disadvantage is that the reaction with sodium
borohydride also may reduce the Schiff`s base of Lys, which may be biologically available to
animals (Meade et al., 2005). However, more research is needed to determine if this results in
significant inaccuracies in the estimates of reactive Lys.
PRACTICAL CONSEQUENCES OF HEAT DAMAGE
The concentration and digestibility of AA in feed ingredients and diets may be reduced
due to heat treatment of feed ingredients (Martinez-Amezcua et al., 2007; Boucher et al., 2009).
Distillers dried grains with solubles that were oven-dried at 50, 75, or 100˚C had reduced
concentrations of reactive Lys (Pahm et al., 2008). When autoclaving DDGS for 45 min at
120˚C, the digestibility of AA was reduced, especially that of Lys (Martinez-Amezcua et al.,
2007), and it was suggested that the reduction in the digestibility of AA other than Lys was a

21
result of the formation of Maillard reaction products that interfered with the absorption of other
AA. Heat treatment of whey protein in the presence of lactose at temperatures that ranged from
75 to 121˚C also resulted in a decrease in availability of Lys from 75 to 45% (Desrosiers et al.,
1989). When feeding broiler chicks a diet containing good quality soybean meal (SBM) or heat-
damaged SBM, it was observed that chicks fed the heat-damaged SBM had a decrease in final
BW, ADG, ADFI, and carcass weight compared with chicks fed the good quality SBM
(Redshaw, 2010). These negative effects of heat damage on performance, however, were
partially mitigated by adding crystalline AA to the diets. González-Vega et al. (2011) reported
that the standardized ileal digestibility (SID) of Lys by pigs was reduced from 93% (non-heated
SBM) to 89.3 and 84.2% when SBM was autoclaved for 15 and 30 min, respectively, at a
temperature of 125˚C. In another experiment, Cozannet et al. (2010) observed that the SID of
Lys in wheat DDGS was highly variable and that the samples with the lowest values for SID
were darker and contained less Lys expressed as a percentage of CP than the samples with the
greatest values for SID of Lys, thus indicating that color and the Lys:CP ratio may be used as
indicators of heat damage in wheat DDGS. As observed by Stein and Shurson (2009) and
confirmed by Cozannet et al. (2010), when feed ingredients are heat-damaged, the concentration
of Lys is reduced whereas the concentration of CP remains relatively constant. Therefore, the
concentration of SID Lys in wheat DDGS fed to pigs may accurately be predicted (R2 = 0.86)
from the Lys:CP ratio (Cozannet et al., 2010). Kim et al. (2012) determined the SID of CP and
AA in 21 sources of corn DDGS and observed a positive correlation between the SID of Lys and
the Lys:CP ratio, which further confirms the above theory. The effects of processing conditions
of fish meal on protein digestibility by mink also were evaluated (Opstvedt et al., 2003). It was
observed that protein digestibility was less in fish meal sources produced at higher temperatures

22
(> 100°C) than in fish meal sources produced at lower temperatures (< 100°C). Cysteine and Arg
also have been shown to participate in the Maillard reactions (Ledl and Schleicher, 1990). Heat
processing may cause oxidation of unsaturated lipids leading to formation of hydroperoxides
(Meade et al., 2005). Hydroperoxidases may oxidize Cys, thus limiting its utilization by the
animal. In feed ingredients that have been heat-damaged to a higher degree, pre-melanoidins also
may react with Cys and Arg (Finot et al., 1990). Cysteine also may go through Strecker
degradation reactions producing hydrogen sulfide, ammonia, and acetaldehyde (Mottram and
Mottram, 2002). The products of these reactions serve as intermediates in the formation of
aromatic compounds, such as thiazoles and disulfides, which are associated with the Maillard
reactions (Mottram and Mottram, 2002). The participation of Arg in the Maillard reactions
resulting from heat processing is associated with formation of cross-links with Lys through
imidazopyridinium bridges (Ledl and Schleicher, 1990).
Heat damage also may cause losses in vitamins as observed by Ford et al. (1983). Results
from their research clearly indicated that storage of whole milk powder at 60 and 70°C results in
a reduction in the concentrations of vitamins B6 and thiamine. At 60°C, however, the reduction is
much less pronounced than at 70°C. These observations may be because, at higher temperatures,
the Maillard reactions are favored, which was confirmed by an increase in lactulosyl-lysine
(which is an intermediate of the Maillard reactions) as the concentrations of vitamins decreased
(Ford et al., 1983).
There is, therefore, ample evidence that heat damage to feed ingredients may reduce the
nutritional value of feed ingredients, specifically the concentration and digestibility of most AA
and CP. Because many feed ingredients are heated during manufacturing or preparation, it is

23
necessary to evaluate the nutritional quality of these feed ingredients in a rapid and reliable
manner to accurately use them in feeding programs.
CONCLUSIONS
Processing of feed ingredients involving heat often will result in Maillard reactions
involving the condensation between the amino group of Lys or other AA and the carbonyl group
of reducing sugars. Consequently, Lys becomes unavailable to pigs, thus reducing the
digestibility of this AA. The Maillard reactions are a series of complex reactions that remain to
be fully understood, although much is known about the initial and intermediate stages. Some
enzymes present in fungi and bacteria hydrolyze Amadori reaction products, but little
information is available regarding the practical use of these enzymes in feedstuffs. The majority
of the early work conducted to determine the concentration of reactive Lys in feed ingredients
has used the guanidination or FDNB methods, whereas a relatively large amount of research has
been conducted using the furosine procedure, and the latter procedure has been suggested to
determine the concentration of reactive Lys in commonly fed feed ingredients to pigs.

24
LITERATURE CITED
Acevedo, N., C. Schebor, and M. P. Buera. 2006. Water-solids interactions, matrix structural
properties and the rate of non-enzymatic browning. J. Food Eng. 77:1108-1115.
Argirova, M. D., I. D. Stefanova, A. D. Krustev, and V. I. Turiiski. 2010. Testing biological
activity of model Maillard reaction products: studies on gastric smooth muscle tissues.
Amino Acids 38:797-803.
Batal, A. B., M. W. Douglas, A. E. Engram, and C. M. Parsons. 2000. Protein dispersibility
index as an indicator of adequately processed soybean meal. Poult. Sci. 79:1592-1596.
Boucher, S. E., C. Pedersen, H. H. Stein, and C. G. Schwab. 2009. Evaluation of the furosine and
homoarginine methods for determining reactive Lys in rumen-undegraded protein. J.
Dairy Sci. 92:3951-3958.
Couch, J. R., and M. C. Thomas. 1976. A comparison of chemical methods for the determination
of available lysine in various proteins. J. Agric. Food Chem. 24:943-946.
Cozannet, P., Y. Primot, C. Gady, J. P. Métayer, P. Callu, M. Lessire, F. Skiba, and J. Noblet.
2011. Standardized amino acid digestibility of wheat distillers` dried grains with solubles
in force-fed cockerels. Br. Poult. Sci. 52:72-81.
Cozannet, P., Y. Primot, C. Gady, J. P. Métayer, P. Callu, M. Lessire, F. Skiba, and J. Noblet.
2010. Ileal digestibility of amino acids in wheat distillers dried grains with solubles for
pigs. Anim. Feed Sci. Technol. 158:177-186.
de Kok, P. M. T., and E. A. E. Rosing. 1994. Reactivity of peptides in the Maillard reaction.
Pages 158-179 in Thermally Generated Flavors. ACS Symposium Series. Ed. American
Chemistry Society, Washington, DC.

25
Delgado-Andrade, C., I. Seiquer, R. Nieto, and M. P. Navarro. 2004. Effects of heated glucose-
Lys and glucose-methionine model-systems on mineral solubility. Food Chem. 87:329-
337.
Deppe, V. M., J. Bongaerts, T. O`Connell, K-H. Maurer, and F. Meinhardt. 2011. Enzymatic
deglycation of Amadori products in bacteria: mechanisms, occurrence and physiological
functions. Appl. Microbiol. Biotechnol. 90:399-406.
Desrosiers, T., L. Savoie, G. Bergeron, and G. Parent. 1989. Estimation of lysine damage in
heated whey proteins by furosine determination in conjunction with the digestion cell
technique. J. Agric. Food Chem. 37:1385-1391.
Eichner, K., and M. Karel. 1972. The influence of water content and water activity on the sugar-
amino browning reaction in model systems under various conditions. J. Agric. Food
Chem. 20:218-223.
Erbersdobler, H. F., A. Brandt, E. Scharrer, and B. Vonwangenheim. 1981. Transport and
metabolism studies with fructose amino acids. Prog. Food Nutr. Sci. 5:257-263.
Erbersdobler, H. F., I. Gunsser, and G. Weber. 1970. Degradation of fructoselysine by the
intestinal flora. Zentralbl. Vet. Med. 17:573-575.
Faist, V., and H. F. Erbersdobler. 2001. Metabolic transit and in vivo effects of melanoidins and
precursor compounds deriving from the Maillard reaction. Ann. Nutr. Metab. 45:1-12.
Finot, P. A. 2005. The absorption and metabolism of modified amino acids in processed foods. J.
AOAC Int. 88:894-902.
Finot, P. A., H. U. Aeschbacher, R. F. Hurrel, and R. Liardon. 1990. The Maillard Reaction in
Food Processing, Human Nutrition and Physiology. Birkhaüser Verlag, Berlin, Germany.

26
Finot, P. A., and E. Magnenat. 1981. Metabolic transit of early and advanced Maillard products.
Prog. Food. Nutr. Sci. 5:193-207.
Fontaine, J., U. Zimmer, P. J. Moughan, and S. M. Rutherfurd. 2007. Effect of heat damage in an
autoclave on the reactive Lys contents of soy products and corn distillers dried grains
with solubles. Use of the results to check on Lys damage in common qualities of these
ingredients. J. Agric. Food Chem. 55:10737-10743.
Ford, J. E., R. F. Hurrel, and P. A. Finot. 1983. Storage of milk powders under adverse
conditions. Brit. J. Nutr. 49:355-364.
Friedman, M. 1996. Food browning and its prevention: an overview. J. Agric. Food Chem.
44:631-653.
Gerhardinger, C., M. S. Marion, A. Rovner, M. Glomb, and V. Monnier. 1995. Novel
degradation pathway of glycated amino acids into free fructosamine by a Psedomonas
spp. soil strain extracted. J. Biol. Chem. 270:218-224.
Gerrard, J. A. 2002. New aspects of an ageing chemistry – recent developments concerning the
Maillard reaction. Aust. J. Chem. 55:299-310.
González-Vega, J. C., B. G. Kim, J. K. Htoo, A. Lemme, and H. H. Stein. 2011. Amino acid
digestibility in heated soybean meal fed to growing pigs. J. Anim. Sci. 89:3617-3625.
Hahn-Hägerdal, B. 1986. Water activity: a possible external regulator in biotechnical processes.
Enzyme Microb. Technol. 8:322-327.
Hodge, J. E. 1953. Dehydrated food. Chemistry of browning reactions in model systems. J.
Agric. Food Chem. 15:928-943.
Hurrell, R. F., and K. J. Carpenter. 1977. Mechanisms of heat damage in proteins. 8. The role of
sucrose in the susceptibility of protein foods to heat damage. Brit. J. Nutr. 38:285-297.

27
Hurrell, R. F., and K. J. Carpenter. 1974. Mechanisms of heat damage in protein. Brit. J. Nutr.
32:589-603.
Iwe, M. O., D. J. van Zuilichem, P. O. Ngoddy, and W. Lammers. 2001. Amino acid and protein
dispersibility index (PDI) of mixtures of extruded soy and sweet potato flours. Lebensm.
Wiss. U. Technol. 34:71-75.
Kim, B. G., D. Y. Kil, Y. Zhang, and H. H. Stein. 2012. Concentrations of analyzed or reactive
lysine, but not crude protein, may predict the concentration of digestible lysine in
distillers dried grains with solubles (DDGS) fed to pigs. J. Anim. Sci. 90:3798-3808.
Krause, R., K. Knoll, and T. Henle. 2003. Studies on the formation of furosine and pyridosine
during acid hydrolysis of different Amadori products of Lys. Eur. Food Res. Technol.
216:277-283.
Leahy, M. M., and G. A. Reineccius. 1989a. Kinetics of the formation of alkylpyrazines. Effects
of pH and water activity. ACS Symp. Ser. 409:196-208.
Leahy, M. M., and G. A. Reineccius. 1989b. Kinetics of the formation of alkylpyrazines. Effect
of type of amino acid and type of sugar. ACS Symp. Ser. 388:76-91.
Ledl, F., and E. Schleicher. 1990. New aspects of the Maillard reaction in foods and in the
human body. Angewandte Chem. Int. Ed. Engl. 29:565-594.
Lee, C. M., B. Sherr, and Y. N. Koh. 1984. Evaluation of kinetic parameters for a glucose-Lys
maillard reaction. J. Agric. Food Chem. 32:379-382.
Lin, Z., and J. Zheng. 2010. Occurrence, characteristics, and applications of fructosyl amine
oxidases (amadoriases). Appl. Microbiol. Biotechnol. 86:1613-1619.

28
Lindenmeier, M., and T. Hofmann. 2004. Influence of baking conditions and precursor
supplementation on the amounts of the antioxidant pronyl-l-lysine in bakery products. J.
Agric. Food Chem. 52:350-354.
Marsman, G. J. P., H. Gruppen, D. J. van Zuilichem, J. W. Resink, and A. G. J. Voragen. 1995.
The influence of screw configuration on the in vitro digestibility and protein solubility of
soybean and rapeseed meals. J. Food Eng. 26:13-28.
Martinez-Amezcua, C., C. M. Parsons, V. Singh, R. Srinivasan, G. S. Murthy. 2007. Nutritional
characteristics of corn distillers dried grains with solubles as affected by the amounts of
grains versus solubles and different processing techniques. Poult. Sci. 86:2624-2630.
Mauron, J. 1981. The Maillard reaction in food: a critical review from the nutritional standpoint.
Prog. Food Nutr. Sci. 5:5-35.
Meade, S. J., E. A. Reid, and J. A. Gerrard. 2005. The impact of processing on the nutritional
quality of food proteins. J. AOAC Int. 88:904-922.
Mottram, D. S., and Mottram, H. R. 2002. An overview of the contribution of sulfur-containing
compounds to the aroma in heated foods. Pages 73-92 in Heteroatomic Aroma
Compounds. Reineccius, G. A., and T. A. Reineccius, ed. American Chemical Society,
Washington, DC.
Moughan, P. J. 2003. Amino acid availability: aspects of chemical analysis and bioassay
methodology. Nutr. Res. Rev. 16:127-241.
Niederweiser, A., P. Giliberti, and A. Matasovic. 1975. N-L-deoxyfructosyl-lysine in urine after
ingestion of a lactose-free, glucose-containing milk formula. Pediatr. Res. 9:867-872.
Nursten, H. 2005. The Maillard Reaction. Chemistry, Biochemistry, and Implications. Royal
Society of Chemistry, Cambridge, UK.

29
Nyachoti, C. M., E. M. McNeilage-Van de Wiele, C. F. M. de Lange, and V. M. Gabert. 2002.
Evaluation of the homoarginine technique for measuring true ileal amino acid
digestibilities in pigs fed a barley-canola meal-based diets. J. Anim. Sci. 80:440-448.
O`Brien, J., and P. A. Morrissey. 1989. Nutritional and toxicological aspects of the Maillard
browning reaction in foods. Crit. Rev. Food Sci. Nutr. 28:211-248.
Opstvedt, J., E. Nygård, T. A. Samuelsen, G. Venturini, U. Luzzana, and H. Mundheim. 2003.
Effect on protein digestibility of different processing conditions in the production of fish
meal and fish feed. J. Sci. Food Agric. 83:775-782.
Pahm, A. A., C. Pedersen, D. Simon, and H. H. Stein. 2010. A preliminary study on the length of
incubation needed to maximize guanidination of lysine in distillers dried grains with
solubles (DDGS) and in pig ileal digesta. Anim. Feed Sci. Technol. 159:68-71.
Pahm, A. A., C. Pedersen, and H. H. Stein. 2009. Standardized ileal digestibility of reactive
lysine in distillers dried grains with solubles fed to growing pigs. J. Agric. Food Chem.
57:535-539.
Pahm, A. A., C. Pedersen, and H. H. Stein. 2008. Application of the reactive Lys procedure to
estimate Lys digestibility in distillers dried grains with solubles fed to growing pigs. J.
Agric. Food Chem. 56:9441-9446.
Pahm, S. F. C. 2008. Apparent and standardized ileal amino acid digestibility of processed
soybean products fed to pigs. M.S. Thesis. Univ. of Illinois, Urbana.
Palić, D. V., L. Morey, K. Y. Modika, B. M. Kokić, O. M. Duragić, and N. J. Spasevski. 2012.
Precision of laboratory methods based on protein solubility in quality control of heat
treated feedstuffs. Hemijska Ind. 66:53-57.
30
Pérez-Calvo, E., C. Castrillo, M. D. Baucells, and J. A. Guada. 2010. Effect of rendering on
protein and fat quality of animal by-products. J. Anim. Physiol. Anim. Nutr. 94:e154-
e163.
Purlis, E. 2010. Browning development in bakery products – a review. J. Food Eng. 99:239-249.
Rao, S. R., F. L. Carter, and V. L. Frampton. 1963. Determination of available Lys in oilseed
meal proteins. Anal. Chem. 35:1927-1930.
Reinitz, G. 1984. Protein dispersibility index (PDI) as a quality control measure for soy flour
used in brown trout starter feed. Prog. Fish-Cult. 46:161-164.
Redshaw, M. 2010. AminoNews®. 2010. Aminored
®. Tech. Bull. Degussa AG, Hanau,
Germany.
Roach, A. G., P. Sanderson, and D. R. Williams. 1967. Comparison of methods for the
determination of available Lys value in animal and vegetable protein sources. J. Sci.
Food. Agric. 18:274-278.
Rutherfurd, S. M. 2010. Bioavailability of lysine in heat-treated foods and feedstuffs. PhD Diss.
Wageningen Univ. Wageningen, The Netherlands.
Rutherfurd, S. M., and G. S. Gilani. 2009. Amino acid analysis. Curr. Protoc. Prot. Sci.
58:11.9.1-11.9.37.
Rutherfurd, S. M., and P. J. Moughan. 2007. Development of a novel bioassay for determining
the available Lys contents of foods and feedstuffs. Nutr. Res. Rev. 20:3-16.
Rutherfurd, S. M., P. J. Moughan, and L. van Osch. 1997. Digestible reactive Lys in processed
feedstuffs: application of a new bioassay. J. Agric. Food Chem. 45:1189-1194.
Shibamoto, T., and R. A. Bernhard. 1977. Investigation of pyrazines formation pathways in
sugar-ammonia model systems. J. Agric. Food Chem. 25:609-614.

31
Silván, J. M., J. V. de Lagemaat, A. Olano, and M. D. del Castillo. 2006. Analysis and biological
properties of amino acid derivates formed by Maillard reaction in foods. J. Pharm.
Biomed. Anal. 41:1543-1551.
Stein, H. H., and G. C. Shurson. 2009. Board-invited review: the use and application of distillers
dried grains with solubles in swine diets. J. Anim. Sci. 87:1292-1303.
Torbatinejad, N. M., S. M. Rutherfurd, and P. J. Moughan. 2005. Total and reactive lysine
contents in selected cereal-based food products. J. Agric. Food Chem. 53:4454-4458.
Tuohy, K. M., D. J. S. Hinton, S. J. Davies, M. J. C. Crabbe, G. R. Gibson, and J. M. Ames.
2006. Metabolism of Maillard reaction products by the human gut microbiota –
implications for health. Mol. Nutr. Food Res. 50:847-857.
Valle-Riestra, J., and R. H. Barnes. 1970. Digestion of heat-damaged egg albumen by the rat. J.
Nutr. 100:873-882.
van Boekel, M. A. J. S. 2001. Kinetic aspects of the Maillard reaction: a critical review.
Nahrung. 45:150-159.
Yaylayan, V. A., and A. Huyghues-Despointes. 1994. Chemistry of Amadori rearrangement
products: analysis, synthesis, kinetics, reactions, and spectroscopic properties. Crit. Rev.
Food Sci. Nutr.34:321-369.
Zheng, J., H. Guan, L. Xu, R. Yang, and Z. Lin. 2010. Engineered amadoriase II exhibiting
expanded substrate range. Appl. Microbiol. Biotechnol. 86:607-613.

32
FIGURES
Figure 2.1. Lysine nomenclature.
Protein
Reactive Lys
Acid hydrolysis during standard AA
analysis
Blocked Lys Reactive Lys
Regenerated Lys
Chromatography
Total Lys used in diet formulation

33
+
Figure 2.2. Overview of Maillard reactions, adapted from Purlis (2010).
Amino acid Reducing sugar
N-substituted glycosylamine
(Schiff`s base)
Amadori compounds
Pre-melanoidins Melanoidins
(Brown nitrogenous polymers)
Init
ial
stag
e
Inte
rmed
iate
stag
e F
inal
sta
ge
Hydroxymethylfurfural/Furfural + Amino
compound
Amadori rearrangements
Strecker degradation

34
Figure 2.3. Principle for determination of reactive Lys in heat-damaged protein using the
guanidination method.
Heat damaged protein
Reactive Lys Amadori
compound
Homoarginine
Aci
d h
ydro
lysi
s
Regenerated
Lys
Guanidination
Pyridosine Furosine
Reactive Lys
Chromatography

35
Figure 2.4. Principle for determination of reactive Lys in heat-damaged protein using the
furosine method.
Heat damaged protein
Reactive Lys
Amadori
compound
Aci
d h
ydro
lysi
s
Regenerated Lys
(28 to 56%) Pyridosine
(15 to 35%)
Furosine
(30 to 42%)
Chromatography

36
Figure 2.5. Principle for determination of reactive Lys in heat-damaged protein using the
fluorodinitrobenze (FDNB) method.
Heat damaged protein
Reactive Lys Amadori
compound
Regenerated Lys Pyridosine Furosine
Dinitrophenyl Lys
FDNB
Analyzed using either
spectrophotometry or reverse
phase HPLC
Aci
d h
ydro
lysi
s

37
Figure 2.6. Principle for determination of reactive Lys in heat-damaged protein using the sodium
borohydride method.
Heat damaged protein
Reactive Lys Maillard reaction
products
Sodium borohydride
Acid stable
Maillard reaction
products
Reactive Lys
Aci
d h
ydro
lysi
s
Chromatography
Four unknown
peaks before Lys

38
CHAPTER 3
AMINO ACID DIGESTIBILITY OF HEAT DAMAGED DISTILLERS DRIED GRAINS
WITH SOLUBLES FED TO PIGS
ABSTRACT: The primary objective of this experiment was to determine the effects of heat
treatment on the standardized ileal digestibility (SID) of AA in corn distillers dried grains with
solubles (DDGS) fed to growing pigs. The second objective was to develop regression equations
that may be used to predict the concentration of SID AA in corn DDGS. A source of corn DDGS
was divided into 4 batches that were either not autoclaved or autoclaved at 130˚C for 10, 20, or
30 min. Four diets containing DDGS from each of the 4 batches were formulated with DDGS
being the only source of AA and CP in the diets. A N-free diet also was formulated and used to
determine the basal endogenous losses of CP and AA in the pigs. Ten growing pigs (initial BW:
53.5 ± 3.9 kg) were surgically equipped with a T-cannula in the distal ileum and allotted to a
replicated 5 × 4 Youden square design with 5 diets and 4 periods in each square. The SID of CP
decreased linearly (P < 0.05) from 77.9% in non-autoclaved DDGS to 72.1, 66.1, and 68.5% in
the DDGS samples that were autoclaved for 10, 20, or 30 min, respectively. The SID of Lys was
quadratically reduced (P < 0.05) from 66.8% in the non-autoclaved DDGS to 54.9, 55.3, and
51.9% in the DDGS autoclaved for 10, 20, or 30 min, respectively. The concentrations of SID
Arg, His, Leu, Lys, Met, Phe, or Thr may be best predicted by equations that include the
concentration of acid detergent insoluble N in the model (r2 = 0.76, 0.68, 0.67, 0.84, 0.76, 0.73,
or 0.54, respectively). The concentrations of SID Ile and Val were predicted (r2 = 0.58 and 0.54,
respectively) by the Lys:CP ratio, whereas the concentration of SID Trp was predicted (r2 = 0.70)
by the analyzed concentration of Trp. In conclusion, the SID of AA is decreased as a result of

39
heat damage and the concentration of SID AA in heat-damaged DDGS may be predicted by
regression equations developed in this experiment.
Keywords: amino acids, distillers dried grains with solubles, heat damage, regression equations
INTRODUCTION
Production of corn distillers dried grains with solubles (DDGS) involves a drying step in
which the temperature at the dryer inlet may be above 500°C, while the temperature at the dryer
discharge may be above 100°C (Rosentrater et al., 2012). Application of heat to feed ingredients
may initiate Maillard reactions, which decrease the concentration and digestibility of Lys and
other AA (Pahm et al., 2008; Boucher et al., 2009; González-Vega et al., 2011). Lysine is
particularly susceptible to undergo Maillard reactions because of its free amino group, which
easily reacts with reducing sugars. If the amino group of an AA reacts with a reducing sugar to
form early or advanced Maillard reaction products, it becomes unavailable to pigs (Rutherfurd
and Moughan, 2007; Pahm et al., 2008). During the acid hydrolysis step of AA analysis,
however, Lys that has reacted with reducing sugars is partially recovered, thus leading to an
overestimation of available Lys. For this reason, determination of reactive Lys, color, and the
Lys:CP ratio have been suggested as approaches to estimate the availability of Lys in DDGS
(Fontaine et al., 2007; Pahm et al., 2008; Cozannet et al., 2010; Kim et al., 2012; Stein, 2012).
Heat damage and Maillard reactions have been described in different sources of corn DDGS
(Cromwell et al., 1993; Fastinger and Mahan, 2006; Pahm et al., 2008). However, if different
sources of DDGS are used, it is difficult to distinguish between effects of heat damage and other
factors influencing AA digestibility. Gradual increases in heating of a specific source of DDGS
will result in reduced concentrations of reactive Lys (Fontaine et al., 2007; Pahm et al., 2008).

40
There is, however, no information about effects of increasing time of heating of a specific source
of DDGS on in vivo AA digestibility, and on the changes in color, reactive Lys, and the Lys:CP
ratio. Prediction of the concentration of digestible AA and CP from the concentration of reactive
Lys and the Lys:CP ratio in corn DDGS that was purposefully heat-damaged have not been
reported. Thus, the primary objective of this experiment was to determine effects of heat
treatment on the apparent ileal digestibility (AID) and the standardized ileal digestibility (SID)
of AA in corn DDGS fed to growing pigs. A second objective was to develop regression
equations that may be used to predict the concentration of SID AA in corn DDGS.
MATERIALS AND METHODS
The Institutional Animal Care and Use Committee at the University of Illinois reviewed
and approved the protocol for this experiment. Pigs used in the experiment were the offspring of
G-performer boars and F-25 females (Genetiporc, Alexandria, MN).
Animals, Housing, and Experimental Design
Ten growing pigs (initial BW: 53.5 ± 3.9 kg) were surgically equipped with a T-cannula
in the distal ileum (Stein et al., 1998) and allotted to a replicated 5 × 4 Youden square design
with 5 diets and 4 periods in each square. Pigs were individually housed in a controlled
environment in pens (1.2 × 1.5 m) equipped with a feeder and a nipple waterer.
Diets and Feeding
Distillers dried grains with solubles was obtained from Poet Nutrition (Sioux Falls, SD)
and analyzed for CP and AA. The DDGS was divided into 4 batches that were not autoclaved or
autoclaved at 130˚C for 10, 20, or 30 min (Table 3.1). Four diets containing DDGS from each of
the 4 batches were formulated, with DDGS being the only source of AA and CP in the diets
41
(Tables 3.2 and 3.3). A N-free diet also was formulated and used to determine the basal
endogenous losses of CP and AA in the pigs. Diets were supplied with vitamins and minerals to
meet or exceed the requirement estimates for growing pigs (NRC, 1998). Chromic oxide also
was included (0.4%) in diets and used as an indigestible marker.
The amount of feed provided was calculated as 2.5 times the maintenance requirement of
energy (i.e., 106 kcal of ME/kg BW0.75
; NRC, 1998). Pigs were fed once daily at 0800 h. At the
beginning of each period, feed allowance was adjusted based on the BW of each pig. Water was
available at all times.
Sample Collection
Each period consisted of 7 d. The initial 5 d were considered an adaptation period to the
diet. On d 6 and d 7, ileal digesta were collected for 8 h using standard operating procedures. A
plastic bag was attached to the cannula barrel and digesta flowing into the bag were collected.
Bags were replaced whenever they were filled with digesta, or at least once every 30 min and
immediately frozen at – 20oC to prevent bacterial degradation of AA in the digesta.
Chemical Analyses
At the conclusion of the experiment, ileal digesta samples were thawed, mixed within animal and
diet, and a sub-sample was lyophilized, finely ground, and analyzed. A sample of each diet and
of each batch of DDGS was collected at the time of diet mixing. Diets, ingredients, and ileal
samples were analyzed for AA by ion-exchange chromatography with postcolumn derivatization
with ninhydrin. Amino acids were oxidized with performic acid, which was neutralized with Na
metabisulfite (Llames and Fontaine, 1994; Commission Directive, 1998). Amino acids were
liberated from the protein by hydrolysis with 6 N HCL for 24 h at 110°C and quantified with the
internal standard by measuring the absorption of reaction products with ninhydrin at 570 nm.

42
Tryptophan was determined by HPLC with fluorescence detection (extinction 280 nm, emission
356 nm), after alkaline hydrolysis with barium hydroxide octahydrate for 20 h at 110°C
(Commission Directive, 2000). Diets, ingredients, and ileal samples also were analyzed for DM
(method 935.29; AOAC International, 2007), and for CP following the Dumas procedure
(method 968.06; AOAC International, 2007). Diets and ileal samples were analyzed for
chromium (method 990.08; AOAC International, 2007). Ingredients were analyzed for ADF
(Method 973.18; AOAC International, 2007), NDF (Holst, 1973), for lignin (method 973.18 (A-
D); AOAC International, 2007), ash (method 942.05; AOAC International, 2007), total reducing
sugars (Dubois et al., 1956), and furosine as previously described (Kim et al., 2012). The
concentration of ADIN in ingredients was determined as the concentration of N in the ADF
fraction (method 990.03; AOAC International, 2007). Minolta L* (lightness), a* (redness), and
b* (yellowness) values for each batch of DDGS were determined (8 mm aperture, D65 light
source, and 0° observer, Minolta Camera Company, Osaka, Japan).
Calculations and Statistical Analysis
Values for AID and SID of CP and AA were calculated (Stein et al., 2007). The Lys:CP
ratio in each DDGS sample was calculated by expressing the concentration of Lys in the sample
as a percentage of the CP in the sample. The concentration of reactive Lys (%) was calculated by
the following equation:
Reactive Lys = total Lys (%) – [furosine (%) ÷ 0.32 × 0.40];
Data were analyzed using the MIXED procedure (SAS Institute Inc., Cary, NC).
Normality of the data and the presence of outliers were evaluated using the UNIVARIATE
procedure of SAS. One outlier was identified and removed from the data. The model included
dietary treatment as fixed effect and pig and period as random effects. Linear and quadratic

43
effects of increasing time of heat treatment on the AID and SID of AA were analyzed by
orthogonal polynomial contrasts. Correlations among predictor variables or between predictor
variables and dependent variables were determined using the CORR procedure of SAS. The
coefficients of correlation (rp) were divided into 4 groups: no correlation (P > 0.05), low
correlation (rp < 0.30), moderate correlation (0.60 > rp ≥ 0.30), or high correlation (rp ≥ 0.60).
Regression equations to estimate the relationship between the concentration of SID AA and color
(L*, a*, or b*), or nutrient concentration were developed using the REG procedure in SAS. The
pig was the experimental unit for all analyses and significance among means was assessed with
an α level of 0.05.
RESULTS
Heat treatment did not change the concentrations of DM, ash, or CP in DDGS (Table
3.1). The concentration of total Lys, however, was 0.82% in non-autoclaved DDGS and 0.65,
0.73, and 0.68% in the DDGS that was autoclaved for 10, 20, and 30 min, respectively. The
calculated concentration of reactive Lys was 0.80, 0.64, 0.72, and 0.67% for non-autoclaved
DDGS and DDGS that was autoclaved for 10, 20, and 30 min, respectively. The Lys:CP ratio
was 2.94 in non-autoclaved DDGS, whereas the Lys:CP ratio was 2.37, 2.75, and 2.51 in the
batches that were autoclaved for 10, 20, and 30 min, respectively. The ADF concentration was
7.96% in non-autoclaved DDGS, whereas for autoclaved DDGS, the concentration of ADF was
11.05, 9.85, and 10.89% (10, 20, and 30 min, respectively). The concentration of ADIN in non-
autoclaved DDGS was 0.12%, whereas the concentration of ADIN ranged from 0.42 to 0.55% in
the autoclaved DDGS. Reducing sugar concentration was 0.78 in non-autoclaved DDGS, but
DDGS that was autoclaved for 10, 20, and 30 min contained 0.60, 0.88, and 0.65% reducing

44
sugars, respectively. Lightness (L*) values were 43.90, 46.92, and 45.01 in the DDGS batches
that were autoclaved for 10, 20, or 30 min, whereas L* in the non-autoclaved DDGS was 59.70.
Yellowness (b*) values were 11.25, 14.51, and 12.01 in the batches of DDGS that were
autoclaved for 10, 20, or 30 min, whereas b* in the non-autoclaved DDGS was 30.22.
Digestibility of CP and AA
The AID of CP decreased (linear, P < 0.05) from 64.4% in the non-autoclaved DDGS to
59.0, 52.2, and 55.7% in the DDGS that was autoclaved for 10, 20, or 30 min, respectively
(Table 3.4). The AID of Ile, Lys, Met, Phe, and Asp was reduced (quadratic, P < 0.05) with
increasing time of autoclaving, whereas the AID of all other AA was reduced (linear, P < 0.05)
with increasing time of autoclaving. Lysine was the AA most affected by increasing time of
autoclaving. The AID of Lys was reduced (quadratic, P < 0.05) from 61.2 to 48.0, 48.7, and
44.9% for the non-autoclaved DDGS and the DDGS that was autoclaved for 10, 20, or 30 min,
respectively. The mean AID of indispensable AA was reduced (linear, P < 0.05) as time of
autoclaving increased.
The SID of CP decreased (linear, P < 0.05) from 77.9 % in the non-autoclaved DDGS to
72.1, 66.1, and 68.5% in the DDGS that was autoclaved for 10, 20, or 30 min, respectively
(Table 3.5). The SID of Lys was reduced (quadratic, P < 0.05) from 66.8% in the non-autoclaved
DDGS to 54.9, 55.3, and 51.9% in the DDGS that was autoclaved for 10, 20, or 30 min,
respectively.
The SID of Ile, Met, Phe, and Asp also was reduced (quadratic, P < 0.05) with increasing
time of autoclaving, whereas the SID of all other AA was reduced (linear, P < 0.05) with
increasing time of autoclaving. The mean SID of indispensable AA also was reduced (linear, P <
0.05) as time of autoclaving increased.

45
Coefficients of Linear Correlation and Regression Equations
Color measurements were correlated (rp > 0.70; P < 0.01) with the concentrations of SID
Arg, His, Ile, Leu, Lys, Met, Thr, and Trp (Table 3.6). The correlation between the concentration
of SID Lys in corn DDGS and color L*, b*, or a* was 0.91 (P < 0.01).
The concentrations of SID AA were correlated (rp > 0.70; P < 0.01) with the
concentration of Lys:CP, except for the concentration of SID Thr, that was moderately correlated
with the concentration of Lys:CP (Table 3.7). The concentration of SID AA was poorly
correlated (rp < 0.50) with the concentration of reducing sugars. The concentrations of SID AA
were negatively correlated with the concentrations of ADF, NDF, lignin, and ADIN (P < 0.01).
The concentration of SID of each AA also was well correlated (rp > 0.65; P < 0.01) with its
respective concentration of AA, except for SID Thr, which was moderately correlated (rp < 0.65;
P < 0.01) with the concentration of Thr.
The concentrations of digestible AA may be predicted by regression equations presented
in Table 3.8. Color L* was generally a good predictor (r2 > 0.60) of the concentration of SID
AA, except for the concentration of SID Thr (r2 = 0.52). The concentration of SID Arg or SID
Lys were best predicted by equations that included the concentration of ADIN in the model (r2 =
0.76 and 0.84, respectively). The concentrations of SID AA were predicted (r2 > 0.50) by the
concentrations of their respective AA, but the concentration of SID Thr was poorly (r2 = 0.36)
predicted by the concentration of Thr.

46
DISCUSSION
Composition of Distillers Dried Grains with Solubles
The concentrations of DM, ash, and CP were not affected by autoclaving DDGS and this
observation supports results of González-Vega et al. (2011) who reported that autoclaving
soybean meal did not change concentrations of DM, ash, or CP. Changes in the concentration of
Lys observed for autoclaved DDGS in this experiment also agree with results of previous
experiments in which the concentration of Lys was decreased by heat treatment (Fontaine et al.,
2007; Martinez-Amezcua et al., 2007; Pahm et al., 2008; Boucher et al., 2009). Based on the
concentration of Lys, these results indicate that autoclaving corn DDGS for 10 min was
sufficient to cause heat damage, but increasing time of autoclaving to 20 and 30 min did not
result in further decreases in Lys concentration. In contrast, in a previous experiment, the
concentration of Lys in corn DDGS autoclaved for 0, 10, 20, or 30 min at 135°C was linearly
decreased from 0.82 to 0.59% (Fontaine et al., 2007). These differences may be a result of
differences in sample preparation and autoclaving procedures. Although temperature and time of
autoclaving were similar between the 2 experiments, in this experiment, DDGS was autoclaved
on an as-is basis in quantities of 2.5 kg per tray whereas Fontaine et al. (2007) ground DDGS to
< 3 mm particle size and then autoclaved DDGS in 250 g quantities. The concentrations of
furosine in DDGS used in this experiment were slightly less than the average concentration of
furosine (0.02%; CV = 91.4%) measured in 21 sources of DDGS, and these differences may be a
result of the high degree of variation when determining the concentration of furosine in DDGS
(Kim et al., 2012). The concentration of reactive Lys in 33 sources of DDGS represents
approximately 83% of the concentration of total Lys (Pahm et al., 2008), but as a result of the
relatively low concentrations of furosine determined in DDGS used in this experiment, the

47
calculated concentration of reactive Lys in DDGS used in this experiment represented
approximately 98% of the concentration of total Lys. Determination of reactive Lys using the
furosine procedure was initially developed to be used in milk products under the assumption that
Amadori compounds yield 32% furosine, 40% regenerated Lys, and 28% pyridosine
(Erbersdobler and Somoza, 2007). These same assumptions have been used when determining
the concentration of reactive Lys in DDGS (Pahm et al., 2008; Kim et al., 2012), but the
differences observed among the present data and the data from Pahm et al. (2008) and Kim et al.
(2012) indicate that these assumptions may not be true for DDGS. The reason for the reduced
Lys:CP ratio in the autoclaved DDGS is that only the concentration of Lys, but not the
concentration of CP, is reduced when heat damage occurs (Stein et al., 2009; Kim et al., 2012).
The Lys:CP ratio also was reduced in soybean meal that was heat-damaged compared with
unheated soybean meal (González-Vega et al., 2011). The concentration of Lys in the non-
autoclaved DDGS was slightly greater than the average concentration of Lys (0.76%) in 39
sources of DDGS (Stein and Shurson, 2009). Likewise, the Lys:CP ratio was slightly greater in
the unheated DDGS compared with the average value (2.77) reported by Stein and Shurson
(2009). However, the concentrations of Lys and the Lys:CP ratio in autoclaved DDGS are close
to the average values reported by Stein and Shurson (2009) for corn DDGS, which indicates that
the heat damage caused by autoclaving simulated the varying degrees of heat damage caused by
processing of DDGS in commercial production facilities.
The concentration of ADIN has been used as a predictor of heat damage in plant proteins
and our results agree with these observations (Schroeder et al., 1996). The changes observed
between the concentrations of reducing sugars in the unheated DDGS and the 3 autoclaved
DDGS were expected because, in the initial steps of the Maillard reactions, reducing sugars react

48
with the ε-amino group of Lys to form fructoselysine and maltuloselysine, respectively
(Erbersdobler and Hupe, 1991). Lightness (L*) of soybean meal subjected to heat damage is
reduced (González-Vega et al., 2011). This may be attributed to the formation of advanced
Maillard reaction products such as premelanoidins and melanoidins which, in some cases are
characterized by a noticeable browning of the ingredients (Faist and Erbersdobler, 2001).
Because Maillard reactions are associated with formation of brown color and reduced AA
concentrations, it is expected that darker DDGS contains less AA than lighter DDGS. Among 10
different sources of wheat DDGS produced in European ethanol plants, 3 darker sources with L*
< 50 had a reduced Lys:CP ratio compared with 7 lighter sources with L* > 50 (Cozannet et al.,
2010). In corn DDGS, the concentration of Lys and the Lys:CP ratio is also less in darker DDGS
than in lighter DDGS (Batal and Dale, 2006; Fastinger and Mahan, 2006).
Digestibility of CP and AA
Values for the AID of CP and AA in the unheated DDGS are in agreement with results
from previous experiments (Fastinger and Mahan, 2006; Stein and Shurson, 2009). Results of
previous experiments also indicated that the digestibility of Lys was more reduced by heat
damage than the digestibility of other AA (Martinez-Amezcua et al., 2007; González-Vega et al.,
2011). Values for the SID of CP and AA in the non-autoclaved DDGS were within the range of
values for the SID of CP and AA in corn DDGS observed in previous experiments (Stein and
Shurson, 2009). This observation is supported by the value for the Lys:CP ratio (2.94)
determined for corn DDGS in this experiment, which also was similar to the average value (2.77)
reported by Stein and Shurson (2009). For the autoclaved DDGS, however, values for the SID of
CP and AA were less than those reported by Stein and Shurson (2009). Reductions observed for
the SID of Lys with increasing time of autoclaving and the results from reducing sugars and the

49
Lys concentrations in autoclaved DDGS indicate that the conditions created by autoclaving of
DDGS (i.e., heat, moisture, and pressure) were favorable to initiation of Maillard reactions,
which renders Lys unavailable to the animals and, therefore, reduces Lys digestibility (Nursten,
2005; González-Vega et al., 2011). It appears, however, that the degree of heat damage among
autoclaved DDGS (i.e., 10, 20, or 30 min) was not different and this observation is supported by
the fact that the SID of Lys among these ingredients was not different. Reductions in the
digestibility of AA other than Lys have been attributed to the formation of cross-linkages
between protein chains (Tuohy et al., 2006). When these cross-links are formed, digestive
enzymes such as trypsin have reduced access to the proteins, thus the ability of trypsin to
hydrolyze peptide bonds is reduced. Exposure to excessive heat and pressure may also lead to
AA racemization, thus converting L-AA to D-AA (Zagon et al., 1994). Proteolytic enzymes are
unable to hydrolyze peptide bonds connecting D-AA and L-AA. Consequently, the digestibility
is reduced not only for the D-AA, but also for the L-AA (Finot, 2005).
Coefficients of Linear Correlation and Regression Equations
Results of this experiment concur with results of previous experiments in which the
concentration of SID Lys in different sources of corn DDGS or wheat DDGS was correlated with
color L* (Batal and Dale, 2006; Fastinger and Mahan, 2006; Cozannet et al., 2010; 2011). These
observations indicate that the concentration of SID Lys in DDGS may be predicted from values
for color L* within the same source of DDGS (as for this experiment). The use of color as a
predictor of SID AA in DDGS, however, is debatable (Shurson, 2011), because changes in the
color of DDGS may not only occur as a result of heat damage (Ganesan et al., 2008; Liu, 2009;
Kingsly et al., 2010). Condensed distillers solubles (CDS) are added to wet distillers grains in the
production of DDGS, and because CDS are brown in color, the amount added to wet distillers

50
grain may affect the color of DDGS (Ganesan et al., 2008). Therefore, as CDS level is reduced
the value for L* in DDGS increases (Kingsly et al., 2010). The CDS fraction of DDGS also
contains reducing sugars, which may result in Maillard reactions and, therefore, increase
browning of DDGS (Kingsly et al., 2010). Color of DDGS also is affected by particle size, and
smaller particle size is associated with DDGS that is lighter, less red, and more yellow (Liu,
2009). Therefore, the regression equations using color to predict the concentration of SID AA in
DDGS that were developed in this experiment should be used only for DDGS produced within a
specific ethanol plant where variations in drying temperatures may exist, but the levels of CDS
and particle size are constant. For feed manufacturers who use different sources of DDGS,
however, the use of equations that include color is of limited value because changes in color may
be a result of characteristics of DDGS not related to heat damage.
The relatively good correlations between the concentration of SID AA and the
concentration of each AA in DDGS agree with results from Kim et al. (2012). Consequently,
analyzed concentrations of most AA in DDGS may be used to predict the concentration of SID
AA in DDGS although that is not the case for Thr. It has been observed that heat damage of feed
ingredients is associated with an increase in ADF, lignin, and ADIN, which results in a decrease
in N digestibility in cattle and sheep (Broesder et al., 1992). The concentrations of ADF and
ADIN is increased in dark-colored DDGS, which suggests a greater degree of heat damage in
such ingredients (Cromwell et al., 2003), and likely a lower digestibility of AA. The negative
correlation between the concentration of SID AA and the concentrations of ADF, lignin, or
ADIN observed in this experiment support the latter observations.
The concentration of SID Lys can accurately be predicted from the concentration of Lys.
This observation agrees with Kim et al. (2012) who also concluded that the concentration of SID

51
Lys may be predicted from the concentrations of Lys. Prediction of the concentration of SID Lys
in this study was slightly improved if the concentration of ADIN was used in the model. This
indicates that the concentration of analyzed ADIN may be used to predict the concentration of
SID Lys in DDGS.
In conclusion, results of this experiment confirmed that the concentration and
digestibility of AA in DDGS is reduced as a result of heat damage. The concentrations of Lys
and ADIN are good predictors of the concentration of most AA in heat-damaged DDGS, and the
concentration of SID AA may accurately be predicted from regression equations developed in
this experiment.

52
LITERATURE CITED
AOAC International. 2007. Official methods of analysis. 18th ed. Rev. 2. W. Howitz, and G. W.
Latimer, Jr., ed. AOAC Int., Gaithersburg, MD.
Batal, A. B., and N. M. Dale. 2006. True metabolizable energy and amino acid digestibility of
distillers dried grains with solubles. J. Appl. Poult. Res. 15:89-93.
Boucher, S. E., C. Pedersen, H. H. Stein, and C. G. Schwab. 2009. Evaluation of the furosine and
homoarginine methods for determining reactive Lys in rumen-undegraded protein. J.
Dairy Sci. 92:3951-3958.
Broesder, J. T., S. A. Gunter, L. J. Krysl, and M. B. Judkins. 1992. Digestion of ruminal
masticate dried by three different methods. Anim. Feed Sci. Technol. 37:323-331.
Commission Directive. 1998. Establishing community methods for the determination of amino
acids, crude oils and fats, and olaquindox in feeding stuff and amending Directive
71/393/EEC, annex part A. Determination of Amino Acids. Official J. European
Communities L257, 14-23.
Commission Directive. 2000. Establishing community methods for the determination of vitamin
A, vitamin E and tryptophan, annex part C. Determination of Tryptophan. Official. J.
European Communities L174:45-50.
Cozannet, P., Y. Primot, C. Gady, J. P. Métayer, P. Callu, M. Lessire, F. Skiba, and J. Noblet.
2010. Ileal digestibility of amino acids in wheat distillers dried grains with solubles for
pigs. Anim. Feed. Sci. Technol. 158:177-186.
Cozannet, P., Y. Primot, C. Gady, J. P. Métayer, M. Lessire, F. Skiba, and J. Noblet. 2011.
Standardized amino acid digestibility of wheat distillers’ dried grains with solubles in
force-fed cockerels. Brit. Poult. Sci. 52:72-81.

53
Cromwell, G. L., K. L. Herkelman, and T. S. Stahly. 1993. Physical, chemical, and nutritional
characteristics of distillers dried grains with solubles for chicks and pigs. J. Anim. Sci.
71:679-686.
Dubois, M., K. A. Gilles, J. K. Hamilton, P. A. Rebers, and F. Smith. 1956. Colorimetric method
for determination of sugars and related substances. Anal. Chem. 28:350-356.
Erbersdobler, H. F., and A. Hupe. 1991. Determination of lysine damage and calculation of
lysine bio-availability in several processed foods. Z. Ernährungswiss. 30:46-49.
Erbersdobler, H. F., and V. Somoza. 2007. Forty years of furosine, forty years of using early
Maillard products as indicators of the nutritional quality of foods. Mol. Nutr. Food Res.
51:423-430.
Faist, V., and H. F. Erbersdobler. 2001. Metabolic transit and in vivo effects of melanoidins and
precursor compounds deriving from the Maillard reaction. Ann. Nutr. Metab. 45:1-12.
Fastinger, N. D., and D. C. Mahan. 2006. Determination of the ileal amino acid and energy
digestibilities of corn distillers dried grains with solubles using grower-finisher pigs. J.
Anim. Sci. 84:1722-1728.
Finot, P. A. 2005. The absorption and metabolism of modified amino acids in processed foods. J.
AOAC Int. 88:894-902.
Fontaine, J., U. Zimmer, P. J. Moughan, and S. M. Rutherfurd. 2007. Effect of heat damage in an
autoclave on the reactive lysine contents of soy products and corn distillers dried grains
with solubles. Use of the results to check on lysine damage in common qualities of these
ingredients. J. Agric. Food Chem. 55:10737-10743.

54
Ganesan, V., K. Muthukumarappan, and K. A. Rosentrater. 2008. Effect of moisture content and
soluble level on the physical, chemical, and flow properties of distillers dried grains with
solubles (DDGS). Cereal Chem. 85:464-470.
González-Vega, J. C., B. G. Kim, J. K. Htoo, A. Lemme, and H. H. Stein. 2011. Amino acid
digestibility in heated soybean meal fed to growing pigs. J. Anim. Sci. 89:3617-3625.
Kim, B. G., D. Y. Kil, Y. Zhang, and H. H. Stein. 2012. Concentrations of analyzed or reactive
lysine, but not crude protein, may predict the concentration of digestible lysine in
distillers dried grains with solubles (DDGS) fed to pigs. J. Anim. Sci. 90:3798-3808.
Kingsly, A. R. P., K. E. Ileleji, C. L. Clementson, A. Garcia, D. E. Maier, R. L. Stroshine, and S.
Radcliff. 2010. The effect of process variables during drying on the physical and
chemical characteristics of corn dried distillers grains with solubles (DDGS) – plant scale
experiments. Bioresource Technol. 101:193-199.
Liu, K. 2009. Effects of particle size distribution, compositional and color properties of ground
corn on quality of distillers dried grains with solubles (DDGS). Bioresource Technol.
100:4433-4440.
Llames, C. R., and J. Fontaine. 1994. Determination of amino-acids in feeds – collaborative
study. J. AOAC Int. 77:1362-1402.
Martinez-Amezcua, C., C. M. Parsons, V. Singh, R. Srinivasan, and G. S. Murthy. 2007.
Nutritional characteristics of corn distillers dried grains with solubles as affected by the
amounts of grains versus solubles and different processing techniques. Poult. Sci.
86:2624-2630.
NRC. 1998. Nutrient requirements of swine (10th
Ed.). National Academy Press,
Washington, DC.

55
Nursten, H. 2005. The Maillard Reaction. Chemistry, Biochemistry, and Implications. Royal
Society of Chemistry, Cambridge, UK.
Pahm, A. A., C. Pedersen, and H. H. Stein. 2008. Application of the reactive lysine procedure to
estimate lysine digestibility in distillers dried grains with solubles fed to growing pigs. J.
Agric. Food Chem. 56:9441-9446.
Rosentrater, K. A., K. Ileleji, and D. B. Johnston. 2012. Manufacturing of fuel ethanol and
distillers grains – current and evolving process. Pages 73-102 in Distillers Grains
Production, Properties, and Utilization. K. Liu and K. A. Rosentrater, ed. CRC Press,
Boca Raton, FL.
Rutherfurd, S. M., and P. J. Moughan. 2007. Development of a novel bioassay for determining
the available Lys contents of foods and feedstuffs. Nutr. Res. Rev. 20:3-16.
Schroeder, G. E., L. J. Erasmus, K. J. Leeuw, and H. H. Meissner. 1996. The use of acid
detergent insoluble nitrogen to predict digestibility of rumen undegradable protein of heat
processed plant proteins. S. Afr. J. Anim. Sci. 26:49-52.
Shurson, G. C. 2011. Is color the only best indicator of DDGS quality? The ethanol producer
magazine. Accessed Jun. 12, 2012. http://ethanolproducer.com/articles/7840/is-color-the-
only-or-best-indicator-of-ddgs-quality
Stein, H. H., C. F. Shipley, and R. A. Easter. 1998. Technical note: a technique for inserting a T-
cannula into the distal ileum of pregnant sows. J. Anim. Sci. 76:1433-1436.
Stein, H. H., B. Seve, M. F. Fuller, P. J. Moughan, and C. F. M. de Lange. 2007. Invited review:
Amino acid bioavailability and digestibility in pig feed ingredients: Terminology and
application. J. Anim. Sci. 85:172-180.

56
Stein, H. H., S. P. Connot, and C. Pedersen. 2009. Energy and nutrient digestibility in four
sources of distillers dried grains with solubles produced from corn grown within a narrow
geographical area and fed to growing pigs. Asian-australas. J. Anim. Sci. 22:1016-1025.
Stein, H. H., and G. C. Shurson. 2009. Board-invited review: The use and application of distillers
dried grains with solubles in swine diets. J. Anim. Sci. 87:1292-1303.
Stein, H. H. 2012. Feeding ethanol coproducts to swine. Pages 297-315 in Distillers Grains
Production, Properties, and Utilization. K. Liu and K. A. Rosentrater, ed. CRC Press,
Boca Raton, FL.
Tuohy, K. M., D. J. S. Hinton, S. J. Davies, M. J. C. Crabbe, G. R. Gibson, and J. M. Ames.
2006. Metabolism of Maillard reaction products by the human gut microbiota –
implications for health. Mol. Nutr. Food Res. 50:847-857.
Zagon, J., L. I. Dehne, and K. W. Bögl. 1994. D-amino acids in organisms and food. Nutr. Res.
14:445-463.

57
TABLES
Table 3.1. Chemical composition of distillers dried grains with solubles
Distillers dried grains with solubles
Autoclaved at 130°C
Item Non-autoclaved 10 min 20 min 30 min
DM, % 93.21 92.43 90.91 94.47
Ash, % 5.25 5.08 5.17 5.06
CP, % 27.91 27.44 26.51 27.05
Lys:CP ratio1 2.94 2.37 2.75 2.51
Furosine, % 0.015 0.009 0.006 0.008
Reactive Lys2 0.80 0.64 0.72 0.67
ADF, % 7.96 11.05 9.85 10.89
NDF, % 31.29 33.23 33.32 32.40
ADL, % 0.88 2.06 1.73 2.57
ADIN,3 % 0.12 0.53 0.42 0.55
Reducing sugars, % 0.78 0.60 0.88 0.65
L*4 59.70 43.90 46.92 45.01
a*4 11.79 10.31 10.77 10.27
b*4 30.22 11.25 14.51 12.01
Indispensable AA, %
Arg 1.24 1.10 1.19 1.10
His 0.71 0.67 0.70 0.67

58
Table 3.1. (Cont.)
Ile 0.97 0.91 0.96 0.93
Leu 2.92 2.82 2.89 2.78
Lys 0.82 0.65 0.73 0.68
Met 0.53 0.49 0.52 0.50
Phe 1.24 1.17 1.21 1.17
Thr 1.02 0.98 1.01 0.98
Trp 0.22 0.20 0.20 0.20
Val 1.26 1.19 1.26 1.23
All indispensable 10.93 10.18 10.67 10.24
Dispensable AA, %
Ala 1.90 1.83 1.87 1.82
Asp 1.75 1.66 1.73 1.66
Cys 0.55 0.50 0.52 0.50
Glu 4.43 4.31 4.41 4.26
Gly 1.08 1.04 1.09 1.04
Pro 2.21 2.06 2.13 2.04
Ser 1.31 1.26 1.29 1.23
All dispensable 13.23 12.66 13.04 12.55
1Calculated by expressing the concentration of Lys in each ingredient as a percentage of
the concentration of CP (Stein et al., 2009).
2Reactive Lys (%) = [Lys (%) – (Furosine (%) ÷ 0.32 × 0.40)]; Pahm et al., 2008.
3ADIN = acid detergent insoluble nitrogen.
4L* = lightness; a* = redness; b* = yellowness.
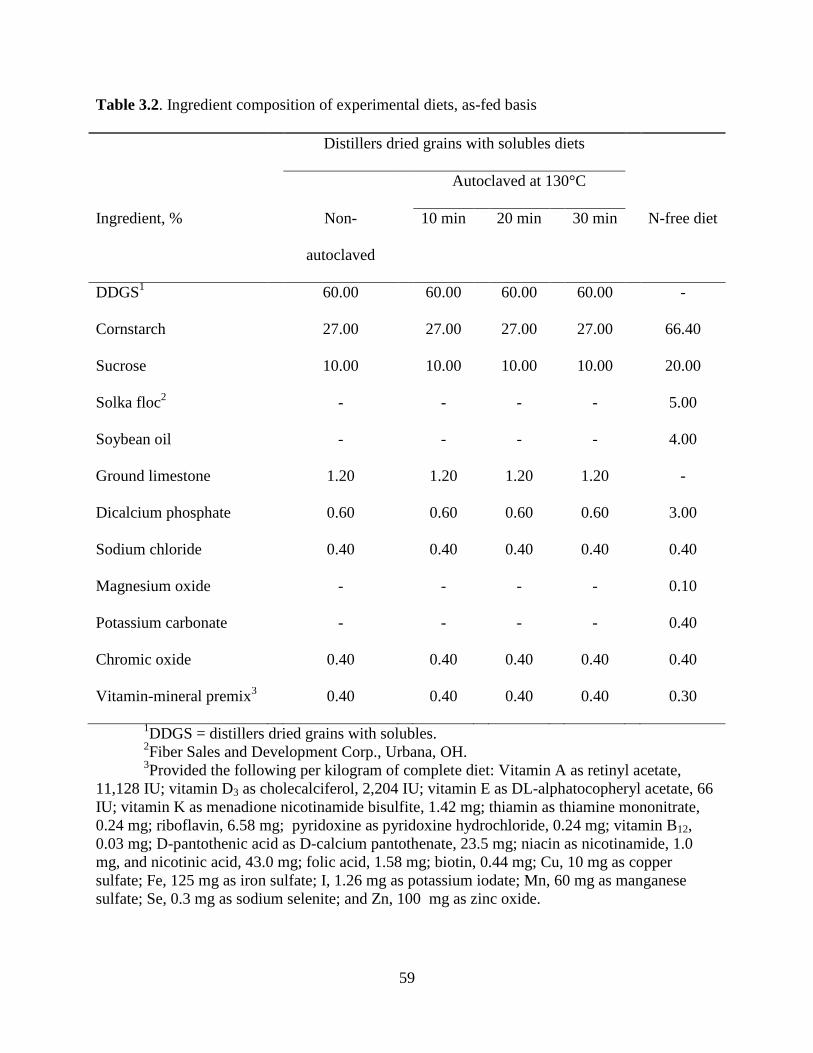
59
Table 3.2. Ingredient composition of experimental diets, as-fed basis
Distillers dried grains with solubles diets
Autoclaved at 130°C
Ingredient, % Non-
autoclaved
10 min 20 min 30 min N-free diet
DDGS1 60.00 60.00 60.00 60.00 -
Cornstarch 27.00 27.00 27.00 27.00 66.40
Sucrose 10.00 10.00 10.00 10.00 20.00
Solka floc2
- - - - 5.00
Soybean oil - - - - 4.00
Ground limestone 1.20 1.20 1.20 1.20 -
Dicalcium phosphate 0.60 0.60 0.60 0.60 3.00
Sodium chloride 0.40 0.40 0.40 0.40 0.40
Magnesium oxide - - - - 0.10
Potassium carbonate - - - - 0.40
Chromic oxide 0.40 0.40 0.40 0.40 0.40
Vitamin-mineral premix3
0.40 0.40 0.40 0.40 0.30
1DDGS = distillers dried grains with solubles.
2Fiber Sales and Development Corp., Urbana, OH.
3Provided the following per kilogram of complete diet: Vitamin A as retinyl acetate,
11,128 IU; vitamin D3 as cholecalciferol, 2,204 IU; vitamin E as DL-alphatocopheryl acetate, 66
IU; vitamin K as menadione nicotinamide bisulfite, 1.42 mg; thiamin as thiamine mononitrate,
0.24 mg; riboflavin, 6.58 mg; pyridoxine as pyridoxine hydrochloride, 0.24 mg; vitamin B12,
0.03 mg; D-pantothenic acid as D-calcium pantothenate, 23.5 mg; niacin as nicotinamide, 1.0
mg, and nicotinic acid, 43.0 mg; folic acid, 1.58 mg; biotin, 0.44 mg; Cu, 10 mg as copper
sulfate; Fe, 125 mg as iron sulfate; I, 1.26 mg as potassium iodate; Mn, 60 mg as manganese
sulfate; Se, 0.3 mg as sodium selenite; and Zn, 100 mg as zinc oxide.

60
Table 3.3. Analyzed composition of experimental diets, as-fed basis
Distillers dried grains with solubles
Autoclaved at 130°C
Item Non-autoclaved 10 min 20 min 30 min N-free diet
DM, % 92.42 93.18 92.59 92.32 92.53
CP, % 14.96 15.59 14.62 15.76 0.28
Indispensable AA, %
Arg 0.73 0.68 0.70 0.67 -
His 0.42 0.41 0.42 0.41 -
Ile 0.56 0.57 0.58 0.55 -
Leu 1.69 1.75 1.76 1.72 -
Lys 0.51 0.42 0.44 0.41 -
Met 0.31 0.29 0.29 0.28 -
Phe 0.71 0.73 0.74 0.72 -
Thr 0.61 0.61 0.62 0.60 -
Trp 0.13 0.12 0.12 0.12 -
Val 0.74 0.75 0.76 0.73 -
All indispensable 6.41 6.33 6.43 6.21 -
Dispensable AA, %
Ala 1.11 1.14 1.15 0.12 -
Asp 1.05 1.04 1.06 1.03 -
Cys 0.33 0.32 0.31 0.31 -
Glu 2.60 2.69 2.70 2.65 -

61
Table 3.3. (Cont.)
Gly 0.64 0.65 0.66 0.64 -
Pro 1.30 1.24 1.27 1.23 -
Ser 0.78 0.79 0.79 0.78 -
All dispensable 7.81 7.87 7.94 6.76 -

62
Table 3.4. Apparent ileal digestibility of CP and AA in distillers dried grains with solubles subjected to increasing levels of heat
treatment by weanling pigs1
Distillers dried grains with solubles
Autoclaved at 130° C SEM P-value2
Item Non-autoclaved 10 min 20 min 30 min Linear Quadratic
CP, % 64.4
59.0
52.2
55.7
2.0 < 0.01 0.12
Indispensable AA, %
Arg 79.3
71.9
72.0
69.1
1.7 < 0.01 0.06
His 73.9
66.8
65.9
66.0
1.3 < 0.01 0.23
Ile 72.3
66.2
66.6
63.1
1.4 < 0.01 0.02
Leu 84.0
80.7
80.4
79.1
0.8 < 0.01 0.12
Lys 61.2
48.0
48.7
44.9
1.9 < 0.01 0.02
Met 83.6
77.7
77.8
75.7
0.9 < 0.01 < 0.01
Phe 79.8 75.1
75.4
73.6
1.0 < 0.01 0.04
Thr 60.2
53.9
53.2
51.2
1.6 < 0.01 0.27
Trp 55.1 43.7 42.8 41.5 2.0 < 0.01 0.15

63
Table 3.4. (Cont.)
Val 71.9
65.7
65.5
62.6
1.4 < 0.01 0.08
Mean 75.6
70.0
69.9
67.8
1.1 < 0.01 0.07
Dispensable AA, %
Ala 77.5
73.3
71.4
71.0
1.3 < 0.01 0.86
Asp 65.5
55.2
55.4
53.3
1.5 < 0.01 0.02
Cys 71.9
64.7
60.5
62.7
1.5 < 0.01 0.54
Glu 81.7
76.7
75.6
75.3
0.9 < 0.01 0.34
Gly 43.4
36.3
29.0
31.7
4.6 < 0.01 0.47
Ser 69.6 65.1
64.1
63.2
1.3 < 0.01 0.47
Mean 68.3
61.8
59.2
59.5
1.5 < 0.01 0.85
1Data are means of 8 observations, except for the distillers dried grains with solubles diet that was autoclaved for 10 min (n =
7).
2Linear and quadratic effects of time of autoclaving.

64
Table 3.5. Standardized ileal digestibility of CP and AA in distillers dried grains with solubles subjected to increasing levels of heat
treatment by weanling pigs1
Distillers dried grains with solubles
Autoclaved at 130° C SEM P-value2
Item Non-autoclaved 10 min 20 min 30 min Linear Quadratic
CP, % 77.9
72.1
66.1
68.5
2.0 < 0.01 0.25
Indispensable AA, %
Arg 87.9
81.3
81.0
78.5
1.7 < 0.01 0.11
His 78.1
71.2
70.1
70.3
1.3 < 0.01 0.27
Ile 77.3
71.1
71.4
68.2
1.4 < 0.01 0.03
Leu 86.7
83.3
83.1
81.8
0.8 < 0.01 0.12
Lys 66.8
54.9
55.3
51.9
1.9 < 0.01 0.04
Met 86.1
80.4
80.5
78.5
0.9 < 0.01 < 0.01
Phe 83.7 79.0
79.2
77.5
1.0 < 0.01 0.05
Thr 70.2
64.0
63.1
61.3
1.6 < 0.01 0.33
Trp 65.9 55.5 54.5 53.2 2.0 < 0.01 0.20

65
Table 3.5. (Cont.)
Val 77.2
71.0
70.7
67.9
1.4 < 0.01 0.09
Mean 80.7
75.2
74.9
73.1
1.1 < 0.01 0.09
Dispensable AA, %
Ala 83.3
79.1
77.1
76.8
1.3 < 0.01 0.89
Asp 72.3
62.1
62.1
60.2
1.5 < 0.01 0.03
Cys 77.7
70.8
66.8
68.9
1.5 < 0.01 0.55
Glu 85.2
80.1
79.0
78.7
0.9 < 0.01 0.33
Gly 73.4
66.0
58.1
61.7
4.6 < 0.01 0.39
Ser 76.9 72.4
71.3
70.5
1.3 < 0.01 0.48
Mean 78.1
71.7
69.0
69.4
1.5 < 0.01 0.91
1Data are means of 8 observations, except for the distillers dried grains with solubles diet that was autoclaved for 10 min (n =
7); Values for standardized ileal digestibility were calculated by correcting apparent ileal digestibility values for basal endogenous
losses (g/kg of DMI), which were determined by feeding pigs a N-free diet: CP, 21.93; Arg, 0.68; His, 0.19; Ile, 0.30; Leu, 0.50; Lys,
0.31; Met, 0.08; Phe, 0.30; Thr, 0.66; Trp, 0.15; Val, 0.43; Ala, 0.71; Asp, 0.77; Cys, 0.21; Glu, 0.98; Gly, 2.08; and Ser, 0.62. 2Linear and quadratic effects of time of autoclaving.

66
Table 3.6. Coefficients of linear correlation between color of distillers dried grains with solubles
and the concentration (%) of standardized ileal digestible (SID) AA
Color1
Item L* b* a*
SID Arg 0.84 0.84 0.87
SID His 0.83 0.83 0.82
SID Ile 0.79 0.79 0.81
SID Leu 0.79 0.79 0.82
SID Lys 0.91 0.91 0.91
SID Met 0.88 0.88 0.87
SID Phe 0.84 0.84 0.86
SID Thr 0.72 0.72 0.72
SID Trp 0.84 0.84 0.83
SID Val 0.77 0.77 0.79
1L* = lightness; a* = redness; b* = yellowness; all correlations are significant (P < 0.01).

67
Table 3.7. Coefficients of linear correlation between nutrient composition of distillers dried grains with solubles and the concentration
(%) of standardized ileal digestible (SID) CP and AA
Nutrient composition
Lys:CP Reducing sugars ADF NDF Lignin ADIN1 Arg His Ile Leu Lys Met Phe Thr Trp Val
Item
SID Arg 0.80* 0.50
* -0.86
* -0.60
* -0.62
* -0.87
* 0.84
* - - - - - - - - -
SID His 0.72* 0.06
ns -0.81
* -0.69
* -0.48
* -0.82
* - 0.69
* - - - - - - - -
SID Ile 0.76* 0.49
* -0.81
* -0.58
* -0.55
* -0.81
* - - 0.70
* - - - - - - -
SID Leu 0.72* 0.45
** -0.81
* -0.54
* -0.65
* -0.82
* - - - 0.78
* - - - - - -
SID Lys 0.83* 0.45
** -0.91
* -0.74
* -0.54
* -0.92
* - - - - 0.89
* - - - - -
SID Met 0.78* 0.40
** -0.86
* -0.73
* -0.48
* -0.87
* - - - - - 0.75
* - - - -
SID Phe 0.78* 0.47
* -0.85
* -0.63
* -0.56
* -0.86
* - - - - - - 0.83
* - - -
SID Thr 0.58* 0.25
ns -0.70
* -0.55
* -0.56
* -0.73
* - - - - - - - 0.60
* - -
SID Trp 0.71* 0.34
ns -0.81
* -0.70
* -0.52
* -0.83
* - - - - - - - - 0.84
* -
SID Val 0.73* 0.45
** -0.78
* -0.59
* -0.50
* -0.78
* - - - - - - - - - 0.55
*
1ADIN = acid detergent insoluble nitrogen.
* = P < 0.01;
** = P < 0.05; ns = not significant.

68
Table 3.8. Linear regression to predict the concentration (%) of standardized ileal digestible (SID) CP and AA from color, and
nutrient concentrations (%) in corn distillers dried grains with solubles (DDGS) fed to pigs1
Intercept Independent variable
Dependent variable Estimate SE P-value Variable Estimate SE P-value r2
SID Arg 0.30 0.08 < 0.01 Color L*2 0.013 0.001 < 0.01 0.71
-0.66 0.20 < 0.01 Arg 1.398 0.171 < 0.01 0.70
1.16 0.02 < 0.01 ADIN2 -0.506 0.053 < 0.01 0.76
SID His 0.23 0.03 < 0.01 Color L* 0.006 0.0006 < 0.01 0.69
-0.62 0.22 < 0.01 His 1.639 0.322 < 0.01 0.47
0.58 0.01 < 0.01 ADIN -0.203 0.025 < 0.01 0.68
SID Ile 0.34 0.05 < 0.01 Color L* 0.007 0.001 < 0.01 0.62
-0.92 0.30 < 0.01 Ile 1.706 0.320 < 0.01 0.50
0.15 0.08 0.08 Lys:CP 0.200 0.031 < 0.01 0.58
SID Leu 1.69 0.10 < 0.01 Color L* 0.014 0.002 < 0.01 0.62
-2.23 0.69 < 0.01 Leu 1.623 0.243 < 0.01 0.61
2.61 0.03 < 0.01 ADIN -0.554 0.071 < 0.01 0.67

69
Table 3.8. (Cont.)
SID Lys -0.20 0.05 < 0.01 Color L* 0.013 0.001 < 0.01 0.83
-0.46 0.08 < 0.01 Lys 1.214 0.115 < 0.01 0.79
0.60 0.02 < 0.01 ADIN -0.463 0.037 < 0.01 0.84
SID Met 0.18 0.02 < 0.01 Color L* 0.004 0.0004 < 0.01 0.77
-0.39 0.13 < 0.01 Met 1.53 0.252 < 0.01 0.56
0.46 0.01 < 0.01 ADIN -0.161 0.017 < 0.01 0.76
SID Phe 0.56 0.05 < 0.01 Color L* 0.008 0.0009 < 0.01 0.70
-1.11 0.26 < 0.01 Phe 1.726 0.217 < 0.01 0.68
1.08 0.01 < 0.01 ADIN -0.304 0.034 < 0.01 0.73
SID Thr 0.32 0.06 < 0.01 Color L* 0.006 0.001 < 0.01 0.52
-1.31 0.50 < 0.05 Thr 1.967 0.499 < 0.01 0.36
0.75 0.02 < 0.01 ADIN -0.247 0.043 < 0.01 0.54
SID Trp 0.002 0.01 0.91 Color L* 0.002 0.0002 < 0.01 0.70
-0.24 0.04 < 0.01 Trp 1.767 0.219 < 0.01 0.70
-0.04 0.03 0.19 Lys:CP 0.061 0.011 < 0.01 0.51

70
Table 3.8. (Cont.)
SID Val 0.46 0.07 < 0.01 Color L* 0.009 0.001 < 0.01 0.59
-0.88 0.50 0.08 Val 1.438 0.400 < 0.01 0.31
0.24 0.11 0.04 Lys:CP 0.246 0.042 < 0.01 0.54
1 n = 31 observations; for all models P < 0.01.
2 Color L* = lightness; ADIN = acid detergent insoluble nitrogen.

71
CHAPTER 4
EFFECTS OF HEAT TREATMENT ON THE APPARENT AND STANDARDIZED
ILEAL DIGESTIBILITY OF AMINO ACIDS IN CANOLA MEAL FED TO GROWING
PIGS
ABSTRACT: An experiment was conducted to determine the effects of heat damage on the
apparent ileal digestibility (AID) and the standardized ileal digestibility (SID) of CP and AA in
canola meal fed to growing pigs. The second objective was to develop regression equations to
predict the concentration of SID AA from the nutrient composition of canola meal. Ten growing
pigs (initial BW: 26.5 ± 0.7 kg) were surgically equipped with a T-cannula in the distal ileum
and allotted to a replicated 5 × 5 Latin square design with 5 diets and 5 periods in each square.
One batch of canola meal was divided into 4 batches that were either not autoclaved or
autoclaved at 130˚C for 20, 30, or 45 min. Four diets were formulated with canola meal being the
only source of AA and CP. Each diet contained 1 of the 4 batches of canola meal. A N-free diet
also was formulated and used to determine the basal endogenous losses of CP and AA in the
pigs. The AID of CP and all AA was reduced (quadratic, P < 0.01) as a result of increasing time
of autoclaving. Autoclaving of canola meal also reduced (quadratic, P < 0.01) the SID of CP and
all AA. The concentration (%) of SID Lys in canola meal may be predicted by regression
equations using the concentration (%) of reducing sugars (r2 = 0.96). Likewise, the
concentrations of SID AA for most AA may be predicted from the nutrient composition of
canola meal. In conclusion, heat damage reduces both the concentration and the digestibility of
AA in canola meal. Regression equations developed in this experiment may be used to predict
the concentration of SID AA in canola meal.

72
Key words: amino acids, canola meal, digestibility, heat damage, pigs
INTRODUCTION
Canola meal, the product remaining after oil has been solvent extracted from canola, is
the second most used protein source for feeding of poultry and livestock (Canola Council of
Canada, 2009). The final step in producing canola meal involves desolventizing and toasting of
the meal, which may last between 35 and 50 min and requires steam (i.e., moisture) and
temperatures that vary from 95 to 115°C (Canola Council of Canada, 2009; Unger, 2011).
Consequently, differences in processing of canola meal may result in variations in the nutritional
composition of canola meal among different processing plants because Maillard reactions may
occur as a result of the combination of heat and moisture in the presence of reducing sugars and
AA (Nursten, 2005). These reactions result in a decrease in the concentration and digestibility of
AA, and Lys is the AA most affected by heat damage (Carvalho et al., 2009; González-Vega et
al., 2011; Newkirk, 2011). Conventional AA analysis may overestimate the concentration of Lys
available for the pig in heat-damaged feed ingredients because some of the Lys that participates
in the Maillard reactions is recovered during the acid hydrolysis step, although this Lys is not
released in vivo (Williams et al., 2006). The use of reactive Lys determined by the furosine
procedure has been suggested as an approach to evaluate the nutritional quality of corn DDGS
(Pahm et al., 2008; Kim et al., 2012), but this hypothesis has not been tested in canola meal.
Apparent ileal digestibility (AID) and standardized ileal digestibility (SID) of CP and AA in
canola meal have been determined (Stein et al., 2005; Woyengo et al., 2010; Trindade Neto et
al., 2012), but effects of heat damage on the AID and SID of CP and AA in canola meal fed to
growing pigs have not been determined. We hypothesized that heat damage decreases the

73
concentration and digestibility of AA in canola meal and that the concentration of SID AA in
heat-damaged canola meal may be predicted from regression equations developed using the
nutrient composition of heat-damaged canola meal. Therefore, the main objective of this
experiment was to determine the effects of heat damage on the AID and SID of CP and AA in
canola meal fed to growing pigs. The second objective was to develop regression equations to
predict the concentration of SID AA in canola meal.
MATERIALS AND METHODS
The protocol for this experiment was reviewed and approved by The Institutional Animal
Care and Use Committee at the University of Illinois. Pigs used in the experiment were the
offspring of G-performer boars and F-25 females (Genetiporc, Alexandria, MN).
Animals, Housing, and Experimental Design
Ten growing pigs (initial BW: 26.5 ± 0.7 kg) were surgically equipped with a T-cannula
in the distal ileum (Stein et al., 1998) and allotted to a replicated 5 × 5 Latin square design with
5 diets and 5 periods in each square. Pigs were individually housed in a controlled environment
in pens (1.2 × 1.5 m) that were equipped with a feeder and a nipple waterer.
Diets and Feeding
Canola meal was obtained from the University of Illinois Feed Mill (Champaign, IL) and
divided into 4 batches that were either not autoclaved or autoclaved at 130˚C for 20, 30, or 45
min (Table 4.1). Four diets were formulated with canola meal being the only source of AA and
CP in each diet (Tables 4.2 and 4.3). Each diet contained 1 of the 4 batches of canola meal. A N-
free diet also was formulated and used to determine the basal endogenous losses of CP and AA
in the pigs. Diets were supplied with vitamins and minerals to meet or exceed the requirement

74
estimates for growing pigs (NRC, 1998). Chromic oxide was included (0.4%) in the diets and
used as an indigestible marker.
The amount of feed provided daily was calculated as 2.5 times the maintenance
requirement of energy (i.e., 106 kcal of ME/kg BW0.75
; NRC, 1998). Pigs were fed once daily at
0800 h. At the beginning of each period, feed allowance was adjusted based on the BW of each
pig. Water was available at all times.
Sample Collection
Each period lasted 7 d. The initial 5 d were considered an adaptation period to the diet.
On d 6 and d 7, ileal digesta were collected for 8 h. A plastic bag was attached to the cannula
barrel and digesta flowing into the bag were collected. Bags were replaced whenever they were
filled with digesta, or at least once every 30 min, and immediately frozen at – 20oC to prevent
bacterial degradation of AA in the digesta.
Chemical Analyses
At the conclusion of the experiment, ileal digesta samples were thawed, mixed within
animal and diet, and a sub-sample was lyophilized, finely ground, and analyzed. A sample of
each diet and of each batch of canola meal was collected at the time of diet mixing. Diets,
ingredients, and ileal samples were analyzed for AA by ion-exchange chromatography with
postcolumn derivatization with ninhydrin. Cysteine and Met were oxidized with performic acid,
which was neutralized with Na metabisulfite (Llames and Fontaine, 1994; Commission
Directive, 1998). Amino acids were liberated from the protein by hydrolysis with 6 N HCL for
24 h at 110°C and quantified with the internal standard by measuring the absorption of reaction
products with ninhydrin at 570 nm. Tryptophan was determined by HPLC with fluorescence
detection (extinction 280 nm, emission 356 nm), after alkaline hydrolysis with barium hydroxide

75
octahydrate for 20 h at 110°C (Commission Directive, 2000). Diets, ingredients, and ileal
samples were also analyzed for DM (Method 935.29; AOAC International, 2007), and for CP
following the Dumas procedure (Method 968.06; AOAC International, 2007). Diets and ileal
samples were also analyzed for chromium (Method 990.08; AOAC International, 2007).
Ingredients were analyzed for ash (Method 942.05; AOAC International, 2007), ADF (Method
973.18; AOAC International, 2007), NDF (Holst, 1973), lignin (method 973.18 (A-D); AOAC
International, 2007), furosine as described by Kim et al. (2012), total reducing sugars (Dubois et
al., 1956), ADIN (method 990.03; AOAC International, 2007), Ca and P by inductively coupled
plasma (ICP) spectroscopy (Method 985.01; AOAC International, 2007), total fat by acid
hydrolysis using 3N HCl (Sanderson, 1986) followed by crude fat extraction using petroleum
ether (Method 2003.06; AOAC International, 2007) on a Soxtec 2050 automated analyzer (FOSS
North America, Eden Prairie, MN), and for total glucosinolates (Method ISO 9167-1:1992,
Eurofins, Des Moines, IA). Minolta L* (lightness), a* (redness), and b* (yellowness) values for
each batch of canola meal were determined (8 mm aperture, D65 light source, and 0° observer,
Minolta Camera Co., Osaka, Japan).
Calculations and Statistical Analysis
The AID and SID values were calculated as previously described (Stein et al., 2007). The
Lys:CP ratio in each canola meal sample was calculated by expressing the concentration of Lys
in the sample as a percentage of the CP in the sample (Stein et al., 2009), and the concentration
of reactive Lys was calculated as previously described using furosine to indicate the
concentration of regenerated Lys (Kim et al., 2012). Data were analyzed using the MIXED
procedure (SAS Institute Inc., Cary, NC). The presence of outliers was evaluated using the
UNIVARIATE procedure of SAS. The model included diet as a fixed effect and pig and period

76
as random effects. Linear and quadratic effects of increasing time of heat treatment on the AID
and SID of AA were analyzed by orthogonal polynomial contrasts. Regression equations to
estimate the concentration of SID AA were developed using the REG procedure in SAS. The pig
was the experimental unit and significance among means was assessed with an α level of 0.05.
RESULTS
Pigs recovered well after the surgery. Feed intake was normalized within a week post-
surgery. Pigs remained healthy during the experiment, and no feed refusals were observed.
The concentrations of ADF were 20.00, 23.63, 22.73, and 31.30% in non-autoclaved
canola meal, and canola meal autoclaved for 20, 30, or 45 min, respectively (Table 4.1). The
non-autoclaved canola meal contained 33.36% NDF, whereas the autoclaved canola meal
contained 42.18, 41.95, and 46.88% NDF (20, 30, and 45 min, respectively). Non-autoclaved
canola meal contained 8.02% lignin, but the concentrations of lignin in canola meals that were
autoclaved for 20, 30, and 45 min were 10.74, 10.96, and 16.45%, respectively. The
concentration of ADIN in the non-autoclaved canola meal was 0.37%, but autoclaving canola
meal for 20, 30, or 45 min resulted in ADIN concentrations of 0.80, 0.88, and 1.75%,
respectively. The concentration of reducing sugars in autoclaved canola meal was 4.20, 4.34, and
3.31% (20, 30, and 45 min, respectively), whereas the concentration of reducing sugars in non-
autoclaved canola meal was 5.05%. The concentration of Lys was 1.36% in the canola meal
autoclaved for 45 min vs. 1.92% in non-autoclaved canola meal. Non-autoclaved canola meal
contained 0.016% furosine, but autoclaved canola meal contained 0.033, 0.033, and 0.025%
furosine (20, 30, and 45 min, respectively). The concentration of reactive Lys was 1.90% in non-
autoclaved canola meal, whereas canola meal that was autoclaved for 20, 30 and 45 min

77
contained 1.53, 1.47, and 1.33% reactive Lys, respectively. Lightness (color L*) was 52.88 in
non-autoclaved canola meal, 47.19 in canola meal autoclaved for 20 min, 47.63 in canola meal
autoclaved for 30 min, and 45.08 in canola meal autoclaved for 45 min.
The AID of CP and all AA was reduced (quadratic, P < 0.01) as a result of increasing
time of autoclaving (Table 4.4). Autoclaving of canola meal also reduced (quadratic, P < 0.01)
the SID of CP and all AA (Table 4.5).
A regression equation that uses the concentration (%) of reactive Lys as an independent
variable may be used to predict the concentration (%) of SID Lys in heat-damaged canola meal
(SID Lys = -1.66 + 1.60 × reactive Lys; r2 = 0.83; Table 4.6). The concentration (%) of SID Lys
in canola meal may be also calculated by regression equation using the concentration (%) of
reducing sugars (SID Lys = -1.65 + 0.59 × reducing sugars; r2 = 0.97). The concentration of
lignin (%) may be used to predict the concentration (%) of SID Met (SID Met = 0.76 - 0.02 ×
lignin; r2 = 0.93), whereas the concentrations of ADF in combination with the concentration of
reducing sugars may be used to predict the concentration of SID Thr [SID Thr = 3.16 – (0.06 ×
ADF) – (0.15 × reducing sugars); r2 = 0.89] and SID Trp [SID Trp = 0.99 – (0.018 × ADF) –
(0.05 × reducing sugars); r2 = 0.88].
DISCUSSION
Canola meal contains glucosinolates, which are antinutritional factors that may reduce
feed intake because of their bitter taste, and which also may decrease growth performance
(Seneviratne et al, 2010). Canola meal should not be included in diets of pigs at inclusion levels
that result in dietary total concentration of glucosinolates that exceed 2 μmol/g (Arntfield and
Hickling, 2011). Total glucosinolates in the non-autoclaved canola meal used in this experiment

78
was 1.58 μmol/g and even at relatively high inclusion levels of canola meal (42%) in the
experimental diets, the calculated concentration of glucosinolates in the mixed diets (0.66
μmol/g) was well below the maximum recommended levels. Therefore, we did not expect any
negative effects of glucosinolates on feed intake of pigs during the experiment.
During the desolventization and toasting processes of canola meal, injection of live steam
and temperatures ranging from 95 to 115°C during an average of 30 min are commonly used
(Canola Council of Canada, 2009). Processing, however, may not be consistent among
processors and this may create some variability in the nutritional composition of canola meal
(Spragg and Mailer, 2007). The concentration of Lys in different sources of canola meal ranges
from 1.64 to 2.40% (Spragg and Mailer, 2007; Newkirk, 2011). Because some of this variation
may be a result of heat damage and because the concentration of Lys in canola meal used in this
experiment ranged from 1.36 to 1.92%, we believe that heat damage caused by autoclaving in
this experiment is equivalent to heat damage that may be caused by processing conditions at
different processing plants.
The concentrations of DM, CP, and AA in the non-autoclaved canola meal used in the
experiment were in agreement with previously published values (Mariscal-Landín et al., 2008,
NRC, 2012). The increase in analyzed ADF and lignin observed as a result of increased time of
autoclaving also has been observed for Italian ryegrass (Miao et al., 1994). The analyzed
concentrations of ADF and lignin may increase because some melanoidins, which are polymers
originating from Maillard reactions, may be analyzed as ADF or lignin (Marlett and Johnson,
1985; Miao et al., 1994). Consequently, heat treatment of feed ingredients is expected to increase
analyzed values of ADF, NDF, and lignin. Our results for the concentration of ADIN in heat-
damaged canola meal are in agreement with previous observations in which the concentration of

79
ADIN increased as a result of heat damage (Cromwell et al., 1993; Schroeder et al., 1996;
Seifdavati and Taghizadeh, 2012). This observation indicates that ADIN may be used as an
indicator of heat damage in canola meal. The concentrations of reducing sugars and Lys were
concomitantly reduced as time of autoclaving increased, and this was expected and clearly
reflects the occurrence of Maillard reactions as a result of heat damage, in which the carbonyl
group of reducing sugars reacts with the epsilon amino group of Lys to form Amadori
compounds and other Maillard reaction products (Nursten, 2005). We observed that the
concentration of furosine increased with autoclaving of canola meal up to 30 min, but the
concentration of furosine was slightly reduced in canola meal that was autoclaved for 45 min.
The reason for these observations is that furosine is a product of Amadori compounds subjected
to acid hydrolysis (Boucher et al., 2009). Amadori compounds are formed during the early
Maillard reaction stage, but if the reaction progresses to more advanced stages, the Amadori
compounds are converted to advanced Maillard reaction products (Nursten, 2005). Therefore,
autoclaving of canola meal for 45 min likely resulted in conversion of Amadori compounds to
advanced Maillard reaction products, thus causing a reduction in the concentration of furosine.
Although we observed a numerical decrease in the Lys concentration of canola meal as time of
autoclaving increased, the concentration of CP remained unaffected regardless of the degree of
heat damage. Thus, the calculated Lys:CP ratio also decreased as time of autoclaving increased.
It has been suggested that the Lys:CP ratio may be used as an indicator of heat damage in feed
ingredients and the current results support this assumption (Cozannet et al., 2010). A change in
color of canola meal (i.e., less yellow and more brown) also has been observed after the
desolventization and toasting processes (Newkirk et al., 2003), which is likely a result of the

80
formation of advanced Maillard reaction products such as pre-melanoidins and melanoidins that
give a brown pigmentation to heat-damaged feeds (Nursten, 2005).
Values for the AID of CP and AA that were determined in this experiment for non-
autoclaved canola meal are in agreement with previously published values (Fan and Sauer, 1995;
Stein et al., 2005; NRC, 2012). The observation that the AID of most AA is reduced due to
autoclaving is in agreement with data for autoclaved SBM (Fontaine et al., 2007; González-Vega
et al., 2011). Values for the SID of AA in the non-autoclaved canola meal determined in this
experiment are also in agreement with previously reported values (Sauvant et al., 2004; Stein et
al., 2005; Woyengo et al., 2010; Rostagno et al., 2011). The reason the SID of Lys is reduced
more than the SID of other AA is that in the presence of heat, moisture, and pressure, reducing
sugars condense with the epsilon amino group of Lys (Nursten, 2005). This reaction initiates a
series of other reactions. After Lys has reacted with reducing sugars, Amadori compounds are
generated, and in more advanced stages, pre-melanoidins and melanoidins are generated, which
reduces the digestibility of Lys. The observed reduction in SID of other AA may be associated
with their direct participation in Maillard reactions (e.g., Cys and Arg) or with the formation of
cross-links that impair digestibility (Finot et al., 1990; Ledl and Schleicher, 1990).
Regression equations developed in the experiment to predict the concentration of SID
Lys in heat-damaged canola meal have a relatively high r2, which indicates that variations are
well explained by the models. The concentration of reactive Lys, calculated by the furosine
procedure, is a good predictor for the concentration of SID Lys in heat-damaged canola meal. To
our knowledge, this is the first time that the usefulness of reactive Lys, determined by the
furosine procedure, to predict the concentration of SID Lys in canola meal fed to pigs is
demonstrated. The concentration of SID Lys in DDGS is also accurately (r2 = 0.90) predicted
81
from the concentration of reactive Lys (Kim et al., 2012). The concentration of analyzed
reducing sugars is also a good predictor of the concentration of SID Lys in canola meal that has
been heat-damaged. Regression equations developed in this experiment are valid if the same
source of canola meal was used, as was the case in this experiment. Further research, however,
needs to be conducted to determine if the use of reducing sugars as a predictor for the
concentration of SID Lys in different sources of canola meal is applicable.
Conclusions
Results of this experiment confirm that the concentration and digestibility of AA in
canola meal are reduced as a consequence of heat damage. This indicates that some of the
variations in AA concentration and digestibility among different sources of canola meal fed to
pigs are likely caused by differences in processing, specifically, the desolventization step, which
likely causes Maillard reactions. Therefore, standardization of desolventization steps among
processing plants may be beneficial to feed manufacturers and to the livestock industry, as it may
create a product that is less variable in AA composition and digestibility. Regression equations
developed in this experiment may be used to predict the concentration of SID AA in canola
meal.

82
LITERATURE CITED
AOAC International. 2007. Official methods of analysis. 18th ed. Rev. 2. W. Howitz, and G. W.
Latimer Jr., ed. AOAC Int., Gaithersburg, MD.
Arntfield, S., and D. Hickling. 2011. Meal nutrition and utilization. Pages 281-312 in Canola:
Chemistry, Production, Processing, and Utilization. Daum, J. K., N. A. M. Eskin, and D.
Hickling, eds. AOCS Press, Urbana, IL.
Canola Council of Canada. 2009. Canola Council of Canada home page.
http://www.canolacouncil.org/uploads/feedguide/Canola_Guide_ENGLISH_2009_small.
pdf Acessed Jun.6, 2012.
Carvalho, D. C. O., L. F. T. Albino, J. G. V. Junior, R. S. Toledo, J. E. de Oliveira, and R. M. de
Souza. 2009. Coeficiente de digestibilidade verdadeira dos aminoácidos e valores de
aminoácidos digestíveis do milho submetido a diferentes temperaturas de secagem e
períodos de armazenamento. R. Bras. Zootec. 38:850-856.
Commission Directive. 1998. Establishing community methods for the determination of amino
acids, crude oils and fats, and olaquindox in feeding stuff and amending Directive
71/393/EEC, annex part A. Determination of Amino Acids. Official J. European
Communities L257, 14-23.
Commission Directive. 2000. Establishing community methods for the determination of vitamin
A, vitamin E and Trp, annex part C. Determination of Tryptophan. Official J. European
Communities L174, 45-50.
Cozannet, P., Y. Primot, C. Gady, J. P. Métayer, P. Callu, M. Lessire, F. Skiba, and J. Noblet.
2010. Ileal digestibility of amino acids in wheat distillers dried grains with solubles for
pigs. Anim. Feed Sci. Technol. 158:177–186.

83
Cromwell, G. L., K. L. Herkelman, and T. S. Stahly. 1993. Physical, chemical, and nutritional
characteristics of distillers dried grains with solubles for chicks and pigs. J. Anim. Sci.
71:679-686.
Dubois, M., K. A. Gilles, J. K. Hamilton, P. A. Rebers, and F. Smith. 1956. Colorimetric method
for determination of sugars and related substances. Anal. Chem. 28:350-356.
Fan, M. Z., and W. C. Sauer. 1995. Determination of apparent ileal amino acid digestibility in
barley and canola meal for pigs with the direct, difference, and regression methods. J.
Anim. Sci. 73:2364-2374.
Finot, P. A., H. U. Aeschbacher, R. F. Hurrel, and R. Liardon. 1990. The Maillard Reaction in
Food Processing, Human Nutrition and Physiology. Birkhaüser Verlag, Berlin, Germany.
Fontaine, J., U. Zimmer, P. J. Moughan, and S. M. Rutherfurd. 2007. Effect of heat damage in an
autoclave on the reactive lysine contents of soy products and corn distillers dried grains
with solubles. Use of the results to check on lysine damage in common qualities of these
ingredients. J. Agric. Food Chem. 55:10737-10743.
González-Vega, J. C., B. G. Kim, J. K. Htoo, A. Lemme, and H. H. Stein. 2011. Amino acid
digestibility in heated soybean meal fed to growing pigs. J. Anim. Sci. 89:3617-3625.
Holst, D. O. 1973. Holst filtration apparatus for Van Soest detergent fiber analysis. J. AOAC
56:1352–1356.
Kim, B. G., D. Y. Kil, Y. Zhang, and H. H. Stein. 2012. Concentrations of analyzed or reactive
lysine, but not crude protein, may predict the concentration of digestible lysine in
distillers dried grains with solubles (DDGS) fed to pigs. J. Anim. Sci. 90:3798-3808.
Ledl, F., and E. Schleicher. 1990. New aspects of the Maillard reaction in foods and in the
human body. Angewandte. Chem. Int. Ed. Engl. 29:565-594.

84
Llames, C. R., and J. Fontaine. 1994. Determination of amino-acids in feeds – collaborative
study. J. AOAC Int. 77:1362-1402.
Mariscal-Landín, G., T. C. Reis de Souza, J. E. Parra S., A. Aguilera B., and B. Mar B. 2008.
Ileal digestibility of protein and amino acids from canola meal in weaned piglets and
growing pigs. Livest. Sci. 116:53-62.
Marlett, J. A., and E. J. Johnson. 1985. Composition of fecal fiber from human subjects. J. Nutr.
115: 650-660.
Miao, Y., M. Amari, and S. Yoshizaki. 1994. Mechanism of spontaneous heating of hay part 2 –
chemical changes in spontaneous heated hay. Trans. Am. Soc. Agric. Eng. 37:1567-1570.
Newkirk, R. W. 2011. Meal nutrient composition. Pages 229-244 in Canola: Chemistry,
Production, Processing, and Utilization. Daum, J. K., N. A. M. Eskin, and D. Hickling,
eds. AOCS Press, Urbana, IL.
Newkirk, R. W., H. L. Classen, T. A. Scott, and M. J. Edney. 2003. The availability and content
of amino acids in toasted and non-toasted canola meals. Can. J. Anim. Sci. 83:131-139.
NRC. 1998. Nutrient requirements of swine (10th
Ed.). National Academy Press, Washington
DC.
NRC. 2012. Nutrient requirements of swine (11th
Ed.). National Academy Press, Washington
DC.
Nursten, H. 2005. The Maillard Reaction. Chemistry, Biochemistry, and Implications. Royal
Society of Chemistry, Cambridge, UK.
Pahm, A. A., C. Pedersen, and H. H. Stein. 2008. Application of the reactive lysine procedure to
estimate lysine digestibility in distillers dried grains with solubles fed to growing pigs. J.
Agric. Food Chem. 56:9441-9446.

85
Rostagno, H. H., L. F. T. Albino, J. L. Donzele, P. C. Gomes, R. T. Oliveira, D. C. Lopes, A. S.
Ferreira, S. L. T. Barreto, and R. F. Euclides. 2011. Brazilian Tables for Poultry and
Swine. Composition of Feedstuffs and Nutritional Requirements. 3rd ed. UFV, Viçosa,
Brazil.
Sanderson, P. 1986. A new method of analysis of feedingstuffs for the determination of crude
oils and fats. Pages 77–81 in Recent Advances in Animal Nutrition. W. Haresign and D.
J. A. Cole, ed. Butterworths, London, UK.
Sauvant, D., J. Perez, and G. Tran. 2004. Tables of composition and nutritional value of feed
materials. 2nd ed. Wageningen Academic Publishers, Wageningen, The Netherlands.
Schroeder, G. E., L. J. Erasmus, and H. H. Meissner. 1996. Chemical and protein quality
parameters of heat processed sunflower oilcake for dairy cattle. Anim. Feed Sci. Technol.
58:249-265.
Seifdavati, J., and A. Taghizadeh. 2012. Effects of moist heat treatment on ruminal nutrient
degradability of and in vitro intestinal digestibility of crude protein from some of legume
seeds. J. Food Agr. Env. 10:390-397.
Seneviratne, R. W., M G. Young, E. Beltranena, L. A. Goonewardene, R. W. Newkirk, and R. T.
Zijlstra. 2010. The nutritional value of expeller-pressed canola meal for grower-finisher
pigs. J. Anim. Sci. 88:2073-2083.
Spragg, J., and R. Mailer. 2007. Canola meal value chain quality improvement. A final report
prepared for AOF and Pork CRC. JCS Solutions Pty Ltd., Berwick Vic., AU.
Stein, H. H., C. F. Shipley, and R. A. Easter. 1998. Technical note: a technique for inserting a T-
cannula into the distal ileum of pregnant sows. J. Anim. Sci. 76:1433-1436.

86
Stein, H. H., C. Pedersen, A. R. Wirt, and R. A. Bohlke. 2005. Additivity of values for apparent
and standardized ileal digestibility of amino acids in mixed diets fed to growing pigs. J.
Anim. Sci. 83:2387-2395.
Stein, H. H., B. Seve, M. F. Fuller, P. J. Moughan, and C. F. M. de Lange. 2007. Invited review:
Amino acid bioavailability and digestibility in pig feed ingredients: Terminology and -
application. J. Anim. Sci. 85:172-180.
Stein, H. H., S. P. Connot, and C. Pedersen. 2009. Energy and nutrient digestibility in four
sources of distillers dried grains with solubles produced from corn grown within a narrow
geographical area and fed to growing pigs. Asian-australas. J. Anim. Sci. 22:1016-1025.
Trindade Neto, M. A., F. O. Opepaju, B. A. Slominski, and C. M. Nyachoti. 2012. Ileal amino
acid digestibility in canola meals from yellow and black seeded Brassica napus and
Brassica juncea fed to growing pigs. J. Anim. Sci. 90:3477-3484.
Unger, E. H. 2011. Processing. Pages 163-188 in Canola: Chemistry, Production, Processing,
and Utilization. Daum, J. K., N. A. M. Eskin, and D. Hickling, eds. AOCS Press, Urbana,
IL.
Williams, P. A., S. M. Hodgkinson, S. M. Rutherfurd, and W. H. Hendriks. 2006. Lysine content
in canine diets can be severely heat damaged. J. Nutr. 136:1998S-2000S.
Woyengo, T. A., E. Kiarie, and C. M. Nyachoti. 2010. Energy and amino acid utilization in
expeller-extracted canola meal fed to growing pigs. J. Anim. Sci. 88:1433-1441.

87
TABLES
Table 4.1. Chemical composition of canola meal
Canola meal
Autoclaved at 130°C
Item1 Non-autoclaved 20 min 30 min 45 min
DM, % 90.87 89.44 89.78 88.42
Ash, % 7.54 7.47 7.66 7.55
CP, % 36.79 36.49 36.88 36.90
ADF, % 20.00 23.63 22.73 31.30
NDF, % 33.36 42.18 41.95 46.88
Lignin, % 8.02 10.74 10.96 16.45
ADIN,1 % 0.37 0.80 0.88 1.75
Reducing sugars, % 5.05 4.20 4.34 3.31
AEE,1
% 3.71 3.34 3.79 1.97
Total glucosinolates, μmol/g 1.58 - - -
Ca, % 0.64 0.61 0.65 0.62
P, % 1.05 1.03 1.02 0.99
Lys:CP ratio2 5.22 4.30 4.09 3.69
Furosine 0.016 0.033 0.033 0.025
Reactive Lys3 1.90 1.53 1.47 1.33
L*4
52.88 47.19 47.63 45.08
a*4
5.76 6.26 5.97 6.35

88
Table 4.1. (Cont.)
b*4
12.56 8.93 8.75 7.44
Indispensable AA, %
Arg 2.22 1.96 1.90 1.74
His 0.97 0.92 0.90 0.91
Ile 1.41 1.40 1.32 1.35
Leu 2.60 2.55 2.50 2.55
Lys 1.92 1.57 1.51 1.36
Met 0.74 0.72 0.71 0.72
Phe 1.48 1.45 1.42 1.44
Thr 1.62 1.60 1.58 1.61
Trp 0.49 0.48 0.49 0.49
Val 1.81 1.79 1.70 1.72
All indispensable 15.26 14.44 14.03 13.89
Dispensable AA, %
Ala 1.65 1.62 1.60 1.63
Asp 2.65 2.58 2.55 2.55
Cys 0.87 0.78 0.76 0.74
Glu 6.29 6.17 6.11 6.20
Gly 1.88 1.84 1.81 1.84
Pro 2.15 2.14 2.09 2.10
Ser 1.61 1.58 1.59 1.60
All dispensable 17.10 16.71 16.51 16.66

89
Table 4.1. (Cont.)
Total AA 32.36 31.15 30.54 30.55
1ADIN = acid detergent insoluble nitrogen; AEE = acid hydrolyzed ether extract.
2Calculated by expressing the concentration of Lys in each ingredient as a percentage of
the concentration of CP (Stein et al., 2009).
3Reactive Lys (%) = [Lys (%) – (Furosine (%) ÷ 0.32 × 0.40)]; Pahm et al., 2008.
4L* = lightness; a* = redness; b* = yellowness.

90
Table 4.2. Ingredient composition of experimental diets, as-fed basis
Canola meal
Autoclaved at 130°C
Ingredient, % Non-autoclaved 20 min 30 min 45 min N-free diet
Canola meal 42.00 42.00 42.00 42.00 -
Cornstarch 42.15 42.15 42.15 42.15 66.40
Sucrose 10.00 10.00 10.00 10.00 20.00
Solka floc1
- - - - 5.00
Soybean oil 3.40 3.40 3.40 3.40 4.00
Ground limestone 0.70 0.70 0.70 0.70 -
Monocalcium phosphate 0.65 0.65 0.65 0.65 3.00
Sodium chloride 0.40 0.40 0.40 0.40 0.40
Magnesium oxide - - - - 0.10
Potassium carbonate - - - - 0.40
Chromic oxide 0.40 0.40 0.40 0.40 0.40
Vitamin-mineral premix2
0.30 0.30 0.30 0.30 0.30
1Fiber Sales and Development Corp., Urbana, OH.
2Provided the following per kilogram of complete diet: Vitamin A as retinyl acetate,
11,128 IU; vitamin D3 as cholecalciferol, 2,204 IU; vitamin E as DL-alphatocopheryl acetate, 66
IU; vitamin K as menadione nicotinamide bisulfite, 1.42 mg; thiamin as thiamine mononitrate,
0.24 mg; riboflavin, 6.58 mg; pyridoxine as pyridoxine hydrochloride, 0.24 mg; vitamin B12,
0.03 mg; D-pantothenic acid as D-calcium pantothenate, 23.5 mg; niacin as nicotinamide, 1.0
mg, and nicotinic acid, 43.0 mg; folic acid, 1.58 mg; biotin, 0.44 mg; Cu, 10 mg as copper
sulfate; Fe, 125 mg as iron sulfate; I, 1.26 mg as potassium iodate; Mn, 60 mg as manganese
sulfate; Se, 0.3 mg as sodium selenite; and Zn, 100 mg as zinc oxide.

91
Table 4.3. Chemical composition of experimental diets, as-fed basis
Canola meal
Autoclaved at 130°C
Item Non-autoclaved 20 min 30 min 45 min N-free diet
DM, % 91.86 91.24 91.01 91.36 92.66
CP, % 17.17 15.24 15.09 15.04 0.19
Indispensable AA, %
Arg 0.96 0.82 0.79 0.71 -
His 0.42 0.39 0.38 0.37 -
Ile 0.59 0.57 0.56 0.55 -
Leu 1.13 1.07 1.05 1.03 -
Lys 0.83 0.66 0.64 0.56 -
Met 0.31 0.28 0.27 0.27 -
Phe 0.64 0.61 0.60 0.58 -
Thr 0.71 0.67 0.65 0.65 -
Trp 0.21 0.20 0.19 0.20 -
Val 0.77 0.73 0.72 0.70 -
All indispensable 6.57 6.00 5.85 5.62 -
Dispensable AA, %
Ala 0.73 0.68 0.67 0.66 -
Asp 1.18 1.10 1.07 1.05 -
Cys 0.38 0.33 0.32 0.29 -
Glu 2.77 2.63 2.57 2.53 -
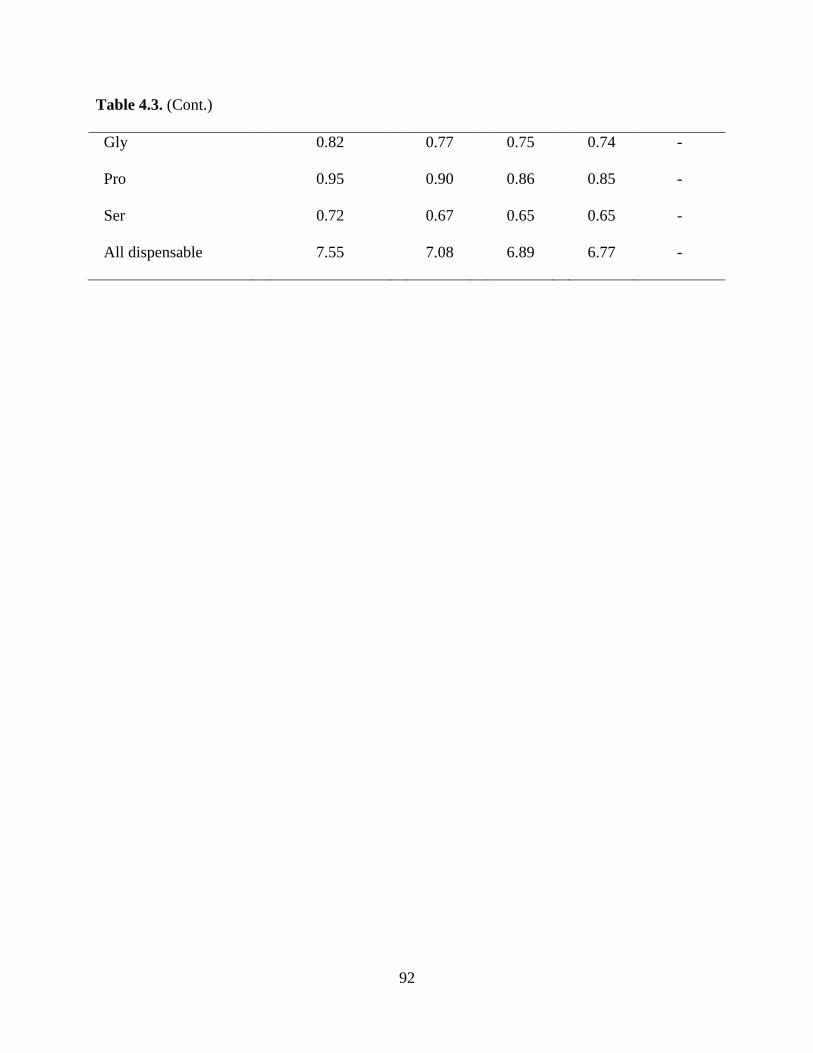
92
Table 4.3. (Cont.)
Gly 0.82 0.77 0.75 0.74 -
Pro 0.95 0.90 0.86 0.85 -
Ser 0.72 0.67 0.65 0.65 -
All dispensable 7.55 7.08 6.89 6.77 -

93
Table 4.4. Apparent ileal digestibility of CP and AA in canola meal subjected to increasing levels of heat treatment by growing pigs1
Canola meal
Autoclaved at 130° C SEM P-value2
Item Non-autoclaved 20 min 30 min 45 min Linear Quadratic
CP, % 59.75 48.55 51.32 22.66 2.5 < 0.01 < 0.01
Indispensable AA, %
Arg 78.72 74.14 76.74 58.61 2.8 < 0.01 < 0.01
His 77.03 73.87 74.83 56.17 1.1 < 0.01 < 0.01
Ile 69.21 65.23 65.94 43.98 1.1 < 0.01 < 0.01
Leu 74.95 71.28 71.41 52.79 0.9 < 0.01 < 0.01
Lys 61.89 48.35 49.36 12.91 1.5 < 0.01 < 0.01
Met 81.14 77.83 78.14 64.05 0.6 < 0.01 < 0.01
Phe 74.28 71.57 72.09 53.01 1.3 < 0.01 < 0.01
Thr 63.17 59.17 59.21 36.21 1.2 < 0.01 < 0.01
Trp 66.28 64.03 63.13 44.06 1.1 < 0.01 < 0.01
Val 67.42 62.50 63.38 39.00 1.1 < 0.01 < 0.01

94
Table 4.4. (Cont.)
Mean 71.98 67.05 67.90 46.15 1.0 < 0.01 < 0.01
Dispensable AA, %
Ala 62.98 54.18 56.26 27.75 2.1 < 0.01 < 0.01
Asp 63.93 55.38 56.60 27.69 1.2 < 0.01 < 0.01
Cys 69.41 65.19 64.57 40.21 1.2 < 0.01 < 0.01
Glu 79.11 76.52 76.56 60.61 1.0 < 0.01 < 0.01
Gly 46.68 34.23 36.01 -2.87 6.0 < 0.01 < 0.01
Ser 66.01 61.62 62.08 40.63 1.2 < 0.01 < 0.01
Mean 64.69 57.91 58.68 32.33 1.9 < 0.01 < 0.01
1Data are means of 10 observations.
2Linear and quadratic effects of time of autoclaving.

95
Table 4.5. Standardized ileal digestibility of CP and AA in canola meal subjected to increasing levels of heat treatment by growing
pigs1
Canola meal
Autoclaved at 130° C SEM P-value2
Item Non-autoclaved 20 min 30 min 45 min Linear Quadratic
CP, % 71.69 61.96 64.78 34.54 2.5 < 0.01 < 0.01
Indispensable AA, %
Arg 84.64 81.02 83.86 66.56 2.8 < 0.01 < 0.01
His 81.34 78.48 79.55 61.04 1.1 < 0.01 < 0.01
Ile 75.42 71.61 72.43 50.61 1.1 < 0.01 < 0.01
Leu 80.25 76.84 77.07 58.58 0.9 < 0.01 < 0.01
Lys 68.17 56.24 57.43 20.81 1.5 < 0.01 < 0.01
Met 85.08 82.15 82.62 68.54 0.6 < 0.01 < 0.01
Phe 80.25 77.79 78.40 59.56 1.3 < 0.01 < 0.01
Thr 71.48 67.92 68.20 45.24 1.2 < 0.01 < 0.01
Trp 73.88 71.95 71.45 51.99 1.1 < 0.01 < 0.01

96
Table 4.5. (Cont.)
Val 74.04 69.44 70.39 46.24 1.1 < 0.01 < 0.01
Mean 77.85 73.44 74.44 53.02 1.0 < 0.01 < 0.01
Dispensable AA, %
Ala 74.20 66.14 68.36 40.08 2.1 < 0.01 < 0.01
Asp 71.37 63.31 64.74 36.02 1.2 < 0.01 < 0.01
Cys 75.59 72.26 71.85 48.27 1.2 < 0.01 < 0.01
Glu 83.33 80.94 81.07 65.21 1.0 < 0.01 < 0.01
Gly 69.21 58.06 60.42 21.96 6.0 < 0.01 < 0.01
Ser 74.34 70.52 71.23 49.81 1.2 < 0.01 < 0.01
Mean 74.68 68.59 69.61 43.56 1.9 < 0.01 < 0.01
1Data are means of 10 observations; Values for standardized ileal digestibility were calculated by correcting apparent ileal
digestibility values for basal endogenous losses (g/kg of DMI), which were determined by feeding pigs a N-free diet: CP, 22.32; Arg,
0.62; His, 0.20; Ile, 0.40; Leu, 0.65; Lys, 0.57; Met, 0.13; Phe, 0.42; Thr, 0.64; Trp, 0.17; Val, 0.55; Ala, 0.89; Asp, 0.96, Cys, 0.26;
Glu, 1.27; Gly, 2.01; and Ser, 0.65.
2Linear and quadratic effects of time of autoclaving.

97
Table 4.6. Linear regressions to predict the concentration (%) of standardized ileal digestible (SID) AA in canola meal fed to pigs1
Intercept Independent variables2
Dependent variable Estimate SE P-value X1 Estimate SE P-value X2 Estimate SE P-value r2
SID Arg -0.20 0.16 0.23 RS 0.41 0.03 < 0.01 - - - - 0.76
SID His 1.02 0.02 < 0.01 Lignin -0.03 0.001 < 0.01 - - - - 0.89
SID Ile 0.81 0.12 < 0.01 NDF 0.01 0.004 < 0.01 ADIN -0.40 0.04 < 0.01 0.92
SID Leu 2.38 0.14 < 0.01 NDF 0.01 0.005 < 0.05 Lignin -0.09 0.009 < 0.01 0.92
SID Lys -1.66 0.19 < 0.01 RL 1.60 0.12 < 0.01 - - - - 0.83
-1.65 0.09 < 0.01 RS 0.59 0.02 < 0.01 - - - - 0.96
SID Met 0.76 0.01 < 0.01 Lignin -0.02 0.0007 < 0.01 - - - - 0.93
SID Phe 1.80 0.05 < 0.01 ADF -0.03 0.002 < 0.01 - - - - 0.84
SID Thr 3.16 0.55 < 0.01 ADF -0.06 0.01 < 0.01 RS -0.15 0.07 < 0.05 0.89
SID Trp 0.99 0.15 < 0.01 ADF -0.018 0.0028 < 0.01 RS -0.05 0.02 < 0.05 0.88
SID Val 1.01 0.16 < 0.01 NDF 0.02 0.004 < 0.01 ADIN -0.55 0.05 < 0.01 0.93
1n = 39 observations; for all models P < 0.01.
2ADIN = acid detergent insoluble nitrogen; RS = reducing sugars; RL = Reactive Lys (%) = [Lys (%) – (Furosine (%) ÷ 0.32 ×
0.40)].

98
CHAPTER 5
AMINO ACID DIGESTIBILITY OF HEAT DAMAGED SUNFLOWER MEAL AND
COTTONSEED MEAL FED TO GROWING PIGS
ABSTRACT: Two experiments were conducted to determine the effects of heat damage,
achieved by autoclaving, on the nutritional composition and on the standardized ileal
digestibility (SID) of AA in sunflower meal (SFM), and cottonseed meal (CSM) fed to growing
pigs. The second objective was to test the hypothesis that the concentration of SID AA in SFM
and CSM may be predicted from the nutrient composition of the ingredients. In Exp. 1, ten
growing pigs (initial BW: 23.1 ± 1.3 kg) were surgically equipped with a T-cannula in the distal
ileum and allotted to a replicated 5 × 5 Latin square design with 5 diets and 5 periods in each
square. A common source of SFM was separated into 4 batches that were either not autoclaved
or autoclaved at 130°C for 20, 40, or 60 min. Four diets that contained each of the 4 batches of
SFM were formulated, and SFM was the only source of CP and AA in the diets. A N-free diet
that was used to determine the endogenous losses of CP and AA from pigs was also formulated.
Each period consisted of 5 d of adaptation to the diets followed by 2 d of ileal digesta collection.
The SID of Lys in SFM was reduced (linear, P < 0.05) from 83.2 to 63.5% in non-autoclaved
SFM or SFM autoclaved for 60 min at 130°C, respectively. The concentrations of Lys and
reducing sugars in SFM may be used as predictors (r2 = 0.85) of the concentration of SID Lys in
SFM. In Exp. 2, ten growing pigs (initial BW: 35.0 ± 1.5 kg) were surgically equipped with a T-
cannula in the distal ileum and allotted to a replicated 5 × 5 Latin square design with 5 diets and
5 periods in each square. A source of CSM was separated into 4 batches that were either not
autoclaved or autoclaved at 130°C for 15, 35, or 60 min. Four diets containing CSM as the only
source of CP and AA were formulated. A N-free diet was also formulated and used as described

99
for Exp. 1. The SID of Lys in non-autoclaved CSM (66.2%) was greater (P < 0.05) than in
autoclaved (60 min at 130°C) CSM (54.1%). The equation (r2 = 0.68) that best predicted the
concentration of SID Lys in CSM includes the concentration of ADIN. In both experiments, the
SID of most AA was reduced (linear or quadratic, P < 0.05) as a result of heat damage. In
conclusion, heat damage reduces the SID of AA in SFM and CSM, and the concentration of SID
Lys in these ingredients may be predicted from the concentration of ADIN, Lys, or reducing
sugars.
Key words: amino acids, cottonseed meal, digestibility, heat damage, pigs, sunflower meal
INTRODUCTION
Sunflower meal and cottonseed meal are alternative protein sources for swine diets.
Solvent extraction of oil from sunflower and cottonseed involves application of heat and
moisture to desolventize the meal. Cottonseed meal contains the antinutritional factor, gossypol,
which may be deactivated by heat treatment of the meal. Processes involving heat and moisture
may cause Maillard reactions (Nursten, 2005), and the application of heat to feed ingredients
may decrease the concentration, digestibility, and utilization of Lys and other AA (Van
Barneveld et al., 1994; Pahm et al., 2008; Boucher et al., 2009; González-Vega et al., 2011).
Maillard reactions start with the condensation between an amino group of AA and the carbonyl
group of a reducing sugar (Nursten, 2005). Amino acids that participate in the Maillard reactions
may become unavailable to pigs and Lys is the AA most susceptible to participate in these
reactions (Pahm et al., 2008). Conventional AA analysis of heat-damaged feed ingredients are
believed to overestimate the concentration of Lys because Lys that has reacted with reducing
sugars is partially recovered during the acid hydrolysis step although they are not available for

100
protein synthesis. This overestimation of the concentration of Lys in heat-damaged feed
ingredients may result in inaccuracies in diet formulation, which ultimately may result in
decreased performance of pigs. Determination of reactive Lys, color, and the Lys:CP ratio have
been suggested as approaches to estimate the availability of Lys in heat processed feed
ingredients (Moughan and Rutherfurd, 1996; Fontaine et al., 2007; Pahm et al., 2008; Kim et al.,
2012). There is, however, limited information about the effects of heat processing on AA
digestibility in sunflower meal and cottonseed meal, and to our knowledge, the use of chemical
composition and physical characteristics either alone or in combination to predict the
concentration of digestible AA in sunflower meal and cottonseed meal that have been heat-
damaged have not been reported. Therefore, the primary objectives of these experiments were to
determine the effects of heat damage on the apparent ileal digestibility (AID) and the
standardized ileal digestibility (SID) of AA in sunflower meal and in cottonseed meal fed to
growing pigs. A second objective was to develop regression equations that may be used to
predict the concentration of SID AA in sunflower meal and cottonseed meal.
MATERIALS AND METHODS
The protocols for these experiments were reviewed and approved by The Institutional
Animal Care and Use Committee at the University of Illinois. Pigs used in the experiments were
the offspring of G-performer boars mated to F-25 females (Genetiporc, Alexandria. MN).
Exp. 1 (AA Digestibility of Sunflower Meal)
Animals, Experimental Design, and Diets. Ten growing pigs (initial BW: 23.1 ± 1.3 kg) were
surgically equipped with a T-cannula in the distal ileum (Stein et al., 1998) and allotted to a
replicated 5 × 5 Latin square design with 5 diets and 5 periods in each square. Pigs were placed

101
in pens (1.2 × 1.5 m) equipped with a nipple drinker and a feeder. Sunflower meal was sourced
from Archer Daniels Midland (Enderlin, ND). The sunflower meal was separated into 4 batches
that were either not autoclaved or autoclaved at 130°C for 20, 40, or 60 min. Four diets that
contained each of the 4 batches of sunflower meal were formulated. Sunflower meal was the
only source of CP and AA in the diets. A N-free diet used to determine the endogenous losses of
CP and AA in the pigs also was formulated.
Feed allowance was calculated as 3 times the maintenance requirement for energy (i. e.,
106 kcal of ME/kg BW0.75
; NRC, 1998). Feed allowance was adjusted according to the BW of
pigs at the beginning of each period. Feed was provided once daily at 800 h and water was
available at all times.
Sample Collection. Each period consisted of 7 d. The initial 5 d were considered an adaptation
period to the diet. Ileal digesta were collected on d 6 and 7 for 8 h by attaching a plastic bag to
the cannula barrel and digesta flowing into the bag were collected. Bags were replaced whenever
they were filled with digesta, or at least once every 30 min, and immediately stored at – 20oC to
prevent bacterial degradation of AA in the digesta.
Chemical Analyses. At the conclusion of the experiment, ileal digesta samples were thawed,
mixed within animal and diet, and a sub-sample was lyophilized, finely ground, and analyzed. A
sample of each diet and of each batch of sunflower meal was collected at the time of diet mixing.
Diets, ingredients, and ileal samples were analyzed for AA by ion-exchange chromatography
with post-column derivatization with ninhydrin. Amino acids were oxidized with performic acid,
which was neutralized with Na metabisulfite (Llames and Fontaine, 1994; Commission
Directive, 1998). Amino acids were liberated from the protein by hydrolysis with 6N HCL for 24
h at 110°C and quantified with the internal standard by measuring the absorption of reaction

102
products with ninhydrin at 570 nm. Tryptophan was determined by HPLC with fluorescence
detection (extinction 280 nm, emission 356 nm) after alkaline hydrolysis with barium hydroxide
octahydrate for 20 h at 110°C (Commission Directive, 2000). Diets, ingredients, and ileal
samples were also analyzed for DM (Method 935.29; AOAC International, 2007), and for CP
following the Dumas procedure (Method 968.06; AOAC International, 2007), and diets and ileal
samples were analyzed for chromium (Method 990.08; AOAC International, 2007). Each batch
of sunflower meal was also analyzed for ash (Method 942.05; AOAC International, 2007), ADF
(Method 973.18; AOAC International, 2007), NDF (Holst, 1973), lignin (method 973.18 (A-D);
AOAC International, 2007), ADIN (method 990.03; AOAC International, 2007), total reducing
sugars (Dubois et al., 1956), furosine as described by Kim et al. (2012), for Ca and P by
inductively coupled plasma (ICP) spectroscopy (Method 985.01; AOAC International, 2007),
and for total fat by acid hydrolysis using 3N HCl (Sanderson, 1986) followed by crude fat
extraction using petroleum ether (Method 2003.06; AOAC International, 2007) on a Soxtec 2050
automated analyzer (FOSS North America, Eden Prairie, MN). The Minolta L* (lightness) value
for each batch of sunflower meal was also determined (8 mm aperture, D65 light source, and 0°
observer, Minolta Camera Company, Osaka, Japan).
Calculations and Statistical Analysis. Values for AID and SID of CP and AA in each batch of
sunflower meal were calculated (Stein et al., 2007), and the Lys:CP ratio in each batch was
calculated by expressing the concentration of Lys in the sample as a percentage of the CP in the
sample (Kim et al., 2012). The concentration of reactive Lys was calculated from the
concentration of furosine as described by Kim et al. (2012). Data were analyzed using the
MIXED procedure (SAS Inst. Inc., Cary, NC). Normality of the data and the presence of outliers
were evaluated using the UNIVARIATE procedure of SAS. The model included diet as a fixed

103
effect and pig and period as random effects. Linear and quadratic effects of increasing time of
heat treatment on the AID and SID of AA were analyzed by orthogonal polynomial contrasts.
Regression equations to estimate the concentration of SID AA were developed using the REG
procedure in SAS. The forward selection method was used to choose the equations that best fit
the data, but in the case of the regression equation to predict the concentration of SID Lys, the
concentration of reactive Lys was forced into the model as an independent variable. The pig was
the experimental unit and significance among means was assessed with an α level of 0.05.
Exp. 2 (AA Digestibility of Cottonseed Meal)
Animals, Experimental Design, and Diets. Ten growing pigs (initial BW: 35.0 ± 1.5 kg) were
surgically equipped with a T-cannula in the distal ileum (Stein et al., 1998) and allotted to a
replicated 5 × 5 Latin square design with 5 diets and 5 periods in each square. Pigs were placed
in pens (1.2 × 1.5 m) equipped with a nipple drinker and a feeder. Cottonseed meal was procured
from Delta Oil Mill (Jonestown, MS). The cottonseed meal was separated into 4 batches that
were either not autoclaved or autoclaved at 130°C for 15, 35, or 60 min. Four diets that contained
each of the 4 batches of cottonseed meal were formulated, and cottonseed meal was the only
source of CP and AA in the diets. A N-free diet that was used to determine the endogenous
losses of CP and AA in the pigs was also formulated.
Feed allowance was calculated as 3 times the maintenance requirement of energy (i. e.,
106 kcal of ME/kg BW0.75
; NRC, 1998). Feed allowance was adjusted according to the BW of
pigs at the beginning of each period. Feed was provided once daily at 0800 h and water was
available at all times.
Ileal samples were collected from pigs as described for Exp. 1 and ileal samples, diets,
and ingredients were processed and chemically analyzed as described for Exp. 1. Each batch of

104
cottonseed meal was also analyzed for free gossypol (Method Ba 8a-99; AOCS, 1998). Data
were analyzed as described for Exp. 1.
RESULTS
Exp. 1 (Sunflower Meal)
The concentration of CP was 35.92% in the non-autoclaved sunflower meal whereas the
sunflower meals that were autoclaved for 20, 40, or 60 min contained 36.55, 36.11, and 35.35%
CP, respectively (Table 5.1). Non-autoclaved sunflower meal contained 21.60% ADF, but the
ADF concentrations were 22.80, 19.87, and 24.12% in sunflower meals that were autoclaved for
20, 40, or 60 min, respectively. The concentration of NDF was 31.90, 34.88, 34.90, and 43.21%
in non-autoclaved sunflower meal, and sunflower meals that were autoclaved for 20, 40, or 60
min, respectively. The concentration of lignin in the sunflower meals that were autoclaved for
20, 40, and 60 min was 5.42, 5.66, and 5.73%, respectively, and the concentration of lignin in
non-autoclaved sunflower meal was 5.59%. Non-autoclaved sunflower meal contained 0.22%
ADIN, and the concentration of ADIN in sunflower meal that was autoclaved for 20, 40, and 60
min was 0.18, 0.25, and 0.28%, respectively. Autoclaving of sunflower meal for 20, 40, or 60
min resulted in concentrations of reducing sugars of 4.43, 4.18, and 3.74%, respectively, but the
concentration of reducing sugars in non-autoclaved sunflower meal was 4.64%. The
concentrations of Lys and reactive Lys were 1.23 and 1.21% in non-autoclaved sunflower meal,
1.09 and 1.08% in sunflower meal autoclaved for 20 min, 1.08 and 1.05% in sunflower meal
autoclaved for 40 min, and 0.98 and 0.94% in sunflower meals that were autoclaved for 60 min.
Non-autoclaved sunflower meal contained 0.013% furosine, whereas the concentration of
furosine was 0.012, 0.021, and 0.030% in sunflower meal autoclaved for 20, 40, and 60 min,

105
respectively. The concentration of Lys expressed as a percentage of the concentration of CP was
3.42 in the non-autoclaved sunflower meal whereas for the sunflower meals that were autoclaved
for 20, 40, or 60 min, the concentration of Lys expressed as a percentage of the concentration of
CP was 2.98, 2.99, and 2.77, respectively.
The AID of CP decreased (linear, P < 0.01) as the time of autoclaving increased (Table
5.4). Likewise, increasing the time of autoclaving decreased (linear, P < 0.01) the AID of all
AA. The SID of CP was also reduced (linear, P < 0.01) by increasing the time of autoclaving
(Table 5.5). For all AA, increasing the time of autoclaving reduced (linear, P < 0.01) the SID of
AA. The concentration of SID Lys in sunflower meal may be predicted (P < 0.01) from the
concentration (%) of analyzed Lys in combination with the concentration (%) of reducing sugars
using the following equation: SID Lys (%) = -1.00 + 0.54 × Lys + 0.30 × reducing sugars (r2 =
0.85; Table 5.6).
Exp. 2 (Cottonseed Meal)
The concentration of CP was relatively unaltered regardless of time of autoclaving (Table
5.1). The lignin concentration in non-autoclaved cottonseed meal was 5.52%, and cottonseed
meals that were autoclaved for 15, 35, and 60 min contained 5.73, 6.49, and 6.68% of lignin,
respectively. Non-autoclaved cottonseed meal contained 0.20% of ADIN, whereas cottonseed
meals that were autoclaved for 15, 35, and 60 min contained 0.25, 0.29, and 0.27% of ADIN,
respectively. Non-autoclaved cottonseed meal contained 3.59% reducing sugars, but cottonseed
meals that were autoclaved for 15, 35, or 60 min contained 3.47, 1.76, or 2.31% reducing sugars,
respectively. The Lys concentration in non-autoclaved cottonseed meal was 1.64%, whereas the
concentration of Lys was 1.59, 1.52, and 1.52% for autoclaved cottonseed meal (15, 35, and 60
min, respectively). Non-autoclaved cottonseed meal contained 0.027% furosine, whereas

106
cottonseed meal autoclaved for 15, 35, and 60 min contained 0.040, 0.040, and 0.030% furosine,
respectively. Non-autoclaved cottonseed meal contained 1.61% reactive Lys, but the
concentration of reactive Lys in cottonseed meal that was autoclaved for 15, 35, and 60 min was
1.54, 1.47, and 1.48%, respectively.
The AID of all indispensable AA in cottonseed meal was quadratically decreased (P <
0.01) as time of autoclaving increased from 0 to 60 min (Table 5.7). Likewise, the SID of all AA
in cottonseed meal was reduced (quadratic, P < 0.01) with increasing time of autoclaving (Table
5.8). The SID of Lys (54.42, 49.75, and 54.10%) in cottonseed meal autoclaved for 15, 35, and
60 min, respectively, was less (P < 0.05) than the SID of Lys in non-autoclaved cottonseed meal
(66.21%).
For most AA, the SID AA (%) in cottonseed meal may be predicted from the
concentration (%) of ADIN and from the concentration of other nutritional components, either
alone or in combination (Table 5.9). The concentration (%) of SID Lys may be predicted using
the following equation: SID Lys = 1.81 - 3.67 × ADIN, r2 = 0.68;
DISCUSSION
Pigs maintained good health status throughout the experiments and pigs used in Exp. 1
consumed their diets well. At the end of period 3 in Exp. 2, some pigs refused to consume all of
their daily allotments. It has been shown that free gossypol, which is an antinutritional factor in
cottonseed meal, is toxic to animals and if present in diets in amounts greater than 100 mg/kg
may cause depressed appetite (Tanksley and Knabe, 1981; Akande et al., 2010). Cottonseed meal
used in this experiment, however, contained concentrations of free gossypol below detection
levels and even at relatively high inclusion levels in the diets, the concentration of free gossypol

107
in the cottonseed meal diets was below 100 mg/kg. Diets used in the cottonseed meal experiment
were also supplemented with ferrous sulfate, which has been reported to mitigate gossypol
toxicity (Moreira et al., 2006). Nevertheless, after period 3, all pigs were fed regular commercial
diets for 10 d and, when given the experimental diets for the subsequent experimental periods, no
issues with feed consumption were observed.
Effects of Autoclaving on Nutrient Composition
The nutrient composition of non-autoclaved sunflower meal and cottonseed meal are in
agreement with the values reported for these ingredients (Rostagno et al., 2011; NRC, 2012).
Some variation in the nutritional composition among different sources of feed ingredients exists,
and these variations may be caused by heat processing used during production of sunflower meal
and cottonseed meal. As an example, heat damage increases the analyzed concentrations of ADF
and lignin in hay because of the formation of Maillard products that are analyzed as lignin (Miao
et al., 1994). The concentration of ADIN in orchardgrass and alfalfa also increases as length of
exposure to heat increases, although the increase in ADIN concentration in orchardgrass was of a
greater proportion than that observed for alfalfa (Goering et al., 1973). Heat processing of
sunflower expellers at 150°C for different lengths of time also resulted in increased
concentrations of ADIN (Schroeder et al., 1996). Our results for the concentrations of ADIN in
sunflower meal support the above observations. In the Maillard reactions, reducing sugars and
Lys are the primary substrates and, therefore, as the reactions progress to form Amadori
compounds and other Maillard reaction products, it is expected that the concentration of
substrates decreases (Nursten, 2005). The present results demonstrate this, as the concentrations
of reducing sugars and Lys were reduced as the length of time sunflower meal and cottonseed
meal were autoclaved increased. It is also expected that the concentration of furosine in heat-

108
damaged feed ingredients increases as the degree of heat damage increases because furosine is
formed from acid hydrolyzed Amadori compounds formed during the early stages of the
Maillard reactions (Nursten, 2005). Our data support this hypothesis in the case of sunflower
meal, but that was not the case for cottonseed meal. The reason for these observations may be
that the Maillard reactions in autoclaved sunflower meals that were used in this experiment did
not progress to advanced stages, in which Amadori products are converted to melanoidins. In
contrast, it appears that autoclaving of cottonseed meal resulted in formation of more advanced
Maillard reactions. Heat damage of SBM does not affect the concentration of CP, although the
concentration of Lys is reduced (González-Vega et al., 2011). As a consequence, the
concentration of Lys expressed as a percentage of the concentration of CP can be used as an
indicator of heat damage in feed ingredients. Thus, it is expected that the greater the degree of
heat damage, is the lower the Lys:CP ratio will be (Cozannet et al., 2010; Skiba et al., 2011).
Results observed in these experiments for both sunflower meal and cottonseed meal support this
hypothesis.
Effects of Autoclaving on AA Digestibility
Values for the SID of CP and for the SID of AA determined for non-autoclaved
sunflower meal are in close agreement with values reported by NRC (2012). Likewise, the SID
of CP and SID of AA determined for non-autoclaved cottonseed meal concur with the SID
values presented in NRC (2012). The SID of Lys in sunflower meal has been reported in a range
from 75.8 to 80.0% , which is narrower than the range observed in this experiment, although it
encompasses some of the values we observed (Jondreville et al., 2000; González-Vega and Stein,
2012). Values for the SID of Lys in cottonseed meal reported by NRC (2012) ranged from 52.15
to 73.85% and the SID of Lys determined for cottonseed meal in this experiment ranged from

109
49.75 to 66.21%. This indicates that some of the variation in the SID of Lys in commercial
sources of sunflower meal and cottonseed meal may be a result of differences in heat processing
of the meals. The observed decrease in the SID of AA in both sunflower and cottonseed meals
resulting from increasing time of autoclaving was expected, and this also has been observed in
DDGS and SBM (Fontaine et al., 2007; González-Vega et al., 2011). Heat processing reduces
the digestibility of AA because AA and protein undergoes Maillard reactions to form insoluble
complexes and cross-linking proteins (Nursten, 2005). These reactions, therefore, may yield AA
and protein containing products that are less accessible to digestive enzymes. Consequently, the
overall digestibility of CP and AA is reduced.
Regression Equations
The automatic search procedures for model selection, when developing regression
equations, play a pivotal role on the selection of a “best” final model for a given data set (Kutner
et al., 2004). In the present experiments, we used the forward selection method, which can be
considered a simplified version of the forward stepwise selection method (Kutner et al., 2004).
From the regression equations developed to predict the concentration of SID AA in sunflower
meal, there was a clear pattern indicating that the concentrations of NDF in combination with the
concentrations of AA were relatively accurate predictors. This observation, however, must be
interpreted with caution as the concentration of NDF in different sources of sunflower meal may
differ because of factors other than heat damage, such as genetic background of the feed
ingredient. Thus, the equations developed from this experiment may be used to predict the
concentration of SID AA within a source of sunflower meal if it is known that the only source of
variation in the nutrient composition of sunflower meal is due to heat processing. Nevertheless,

110
the present results indicate that the concentration of NDF, AA, and the Lys:CP ratio in sunflower
meal may serve as indicators of heat damage.
Regression equations developed to predict the concentration of SID AA in cottonseed
meal indicate that the concentration of ADIN alone or combined with other nutrients may be
used, although, a relatively low r2 was calculated for most equations. Nevertheless, the SID Lys
in cottonseed meal may be predicted from the concentration of ADIN, although a validation of
the equation is required using other data sets.
The concentration of reactive Lys, calculated from the concentration of furosine, has been
reported to be a predictor of the concentration of SID Lys in DDGS (Kim et al., 2012). Our
results are in agreement with these observations, but reactive Lys was not shown to be the best
predictor for the concentration of SID Lys in sunflower meal or cottonseed meal in these
experiments.
Conclusions
Results of these experiments demonstrate that the concentrations of analyzed fiber
components in sunflower meal and cottonseed meal are increased as a result of heat damage. As
previously demonstrated, the concentrations and digestibility of AA is reduced as the degree of
heat damage increases and Lys is the AA most affected by heat damage, but the AID and SID of
all other AA may also be reduced by severe heat damage. Thus, heat processing of sunflower
meal and cottonseed meal should be optimized to prevent reducing the digestibility of AA.
Regression equations that use the concentrations of NDF, ADIN, and AA may be used to
identify the nutritional quality of heat-damaged sunflower meal and cottonseed meal, but the
practical use of the regression equations developed in the current work need to be validated.

111
LITERATURE CITED
Akande, K. E., U. D. Doma, H. O. Agu, and H. M. Adamu. 2010. Major antinutrients found in
plant protein sources: Their effect on nutrition. Pak. J. Nutr. 9:827-832.
AOAC International. 2007. Official methods of analysis. 18th ed. Rev. 2. W. Howitz, and G. W.
Latimer Jr., ed. AOAC Int., Gaithersburg, MD.
AOCS. 1998. AOCS Official Method Ba 8-78 and Ba 8a-99. p. 1–3. In D. Firestone (ed.)
Official Methods and Recommended Practices of the AOCS.5th ed. American Oil
Chemists’ Society, Champaign, IL.
Boucher, S. E., C. Pedersen, H. H. Stein, and C. G. Schwab. 2009. Evaluation of the furosine and
homoarginine methods for determining reactive Lys in rumen-undegraded protein. J.
Dairy Sci. 92:3951-3958.
Commission Directive. 1998. Establishing community methods for the determination of amino
acids, crude oils and fats, and olaquindox in feeding stuff and amending Directive
71/393/EEC, annex part A. Determination of Amino Acids. Official J. European
Communities L257, 14-23.
Commission Directive. 2000. Establishing community methods for the determination of vitamin
A, vitamin E and Trp, annex part C. Determination of Tryptophan. Official J. European
Communities L174, 45-50.
Cozannet, P., Y. Primot, C. Gady, J. P. Metayer, P. Callu, M. Lessire, F. Skiba, and J. Noblet.
2010. Ileal digestibility of amino acids in wheat distillers dried grains with solubles for
pigs. Anim. Feed Sci. Technol. 158:177-186.
Dubois, M., K. A. Gilles, J. K. Hamilton, P. A. Rebers, and F. Smith. 1956. Colorimetric method
for determination of sugars and related substances. Anal. Chem. 28:350-356.

112
Fontaine, J., U. Zimmer, P. J. Moughan, and S. M. Rutherfurd. 2007. Effect of heat damage in an
autoclave on the reactive lysine contents of soy products and corn distillers dried grains
with solubles. Use of the results to check on lysine damage in common qualities of these
ingredients. J. Agr. Food Chem. 55:10737-10743.
Goering, H. K., P. J. van Soest, and R. W. Hemken. 1973. Relative susceptibility of forages to
heat damage as affected by moisture, temperature, and pH. J. Dairy Sci. 56:137-143.
González-Vega, J. C., and H. H. Stein. 2012. Amino acid digestibility in canola, cottonseed, and
sunflower products fed to finishing pigs. J. Anim. Sci. 90:4391-4400.
González-Vega, J. C., B. G. Kim, J. K. Htoo, A. Lemme, and H. H. Stein. 2011. Amino acid
digestibility in heated soybean meal fed to growing pigs. J. Anim. Sci. 89:3617-3625.
Holst, D. O. 1973. Holst filtration apparatus for Van Soest detergent fiber analysis. J. AOAC
56:1352–1356.
Jondreville, C., J. van den Broecke, F. Gâtel, F. Grosjean, S. Van Cauwenberghe, and B. Sève.
2000. Ileal amino acid digestibility and estimates of endogenous amino acid losses in pigs
fed rapeseed meal, sunflower meal and soybean meal. Can. J. Anim. Sci. 80:495-506.
Kim, B. G., D. Y. Kil, Y. Zhang, and H. H. Stein. 2012. Concentrations of analyzed or reactive
lysine, but not crude protein, may predict the concentration of digestible lysine in
distillers dried grains with solubles (DDGS) fed to pigs. J. Anim. Sci. 90:3798-3808.
Kutner, M. H., C. J. Nachtsheim, and J. Neter. 2004. Applied Linear Regression Models.
McGraw-Hill/Irwin, New York, NY.
Llames, C. R., and J. Fontaine. 1994. Determination of amino-acids in feeds – collaborative
study. J. AOAC Int. 77:1362-1402.

113
Miao, Y., M. Amari, and S. Yoshizaki. 1994. Mechanism of spontaneous heating of hay part 2 –
Chemical changes in spontaneously heated hay. Trans. Amer. Soc. Agri. Eng. 37:1567-
1570.
Moreira, I., I. M. Sartori, D. Paiano, R. M. Martins, G. C. de Oliveira. 2006. Effects of feeding
cottonseed meal with or without iron addition for starting piglets (15-30 kg). R. Bras.
Zootec. 35:1077-1084.
Moughan, P. J., and S. M. Rutherfurd. 1996. A new method for determining digestible reactive
lysine in foods. J. Agric. Food Chem. 44:2202-2209.
NRC. 1998. Nutrient requirements of swine (10th
Ed.). National Academy Press, Washington
DC.
NRC. 2012. Nutrient requirements of swine (11th
Ed.). National Academy Press, Washington
DC.
Nursten, H. 2005. The Maillard Reaction. Chemistry, Biochemistry, and Implications. Royal
Society of Chemistry, Cambridge, UK.
Pahm. A. A., C. Pedersen, and H. H. Stein. 2008. Application of the reactive lysine procedure to
estimate lysine digestibility in distillers dried grains with solubles fed to growing pigs. J.
Agric. Food Chem. 56:9441-9446.
Rostagno, H. H., L. F. T. Albino, J. L. Donzele, P. C. Gomes, R. T. Oliveira, D. C. Lopes, A. S.
Ferreira, S. L. T. Barreto, and R. F. Euclides. 2011. Brazilian Tables for Poultry and
Swine. Composition of Feedstuffs and Nutritional Requirements. 3rd ed. UFV, Viçosa,
Brazil.

114
Sanderson, P. 1986.A new method of analysis of feedingstuffs for the determination of crude oils
and fats.Pages 77–81 in Recent Advances in Animal Nutrition. W. Haresign and D. J. A.
Cole, ed. Butterworths, London, UK.
Schroeder, G. E., L. J. Erasmus, and H. H. Meissner. 1996. Chemical and protein quality
parameters of heat processed sunflower oilcake for dairy cattle. Anim. Feed Sci. Technol.
58:249-265.
Skiba, F., D. Coulmier, P. J. Metayer, and M. Vilarino. 2011. Nutritional value of a new wheat
based bioethanol coproduct for poultry. 9èmes Journ. Rech. Avicole, Tours, France. p.
280-284.
Stein, H. H., C. F. Shipley, and R. A. Easter. 1998. Technical note: a technique for inserting a T-
cannula into the distal ileum of pregnant sows. J. Anim. Sci. 76:1433-1436.
Stein, H. H., B. Seve, M. F. Fuller, P. J. Moughan, and C. F. M. de Lange. 2007. Invited review:
Amino acid bioavailability and digestibility in pig feed ingredients: Terminology and -
application. J. Anim. Sci. 85:172-180.
Tanksley, T. D., and D. A. Knabe. 1981. Use of cottonseed meal in swine rations. Feedstuffs
53:24-27.
Van Barneveld, R. J., E. S. Batterham, and B. W. Norton. 1994. The effect of heat on amino
acids for growing pigs. Brit. J. Nutr. 72:221-241.

115
TABLES
Table 5.1. Chemical composition of sunflower meal and cottonseed meal used in Exp. 1 and 2, respectively
Sunflower meal (Exp.1) Cottonseed meal (Exp. 2)
Autoclaved at 130°C Autoclaved at 130°C
Item Non-
autoclaved
20 min 40 min 60 min Non-
autoclaved
15 min 35 min 60 min
DM, % 91.92 89.31 90.05 88.79 90.98 90.12 87.04 87.57
Ash, % 8.10 7.68 8.11 7.65 9.21 8.52 8.14 8.64
CP, % 35.92 36.55 36.11 35.35 41.68 42.20 42.23 42.26
ADF, % 21.60 22.80 19.87 24.12 18.78 16.89 17.92 17.96
NDF, % 31.90 34.88 34.90 43.21 26.19 27.12 27.99 29.83
Lignin, % 5.59 5.42 5.66 6.73 5.52 5.73 6.49 6.68
ADIN, % 0.22 0.18 0.25 0.28 0.20 0.25 0.29 0.27
Reducing sugars, % 4.64 4.43 4.18 3.74 3.59 3.47 1.76 2.31
Free gossypol, % - - - - < 0.02 < 0.02 < 0.02 < 0.02
Total gossypol, % - - - - 0.65 0.60 0.48 0.36
AEE,1
% 1.93 0.88 1.82 1.57 2.60 1.47 1.05 1.31
Ca, % 0.36 0.34 0.35 0.33 0.22 0.26 0.22 0.22
P, % 1.28 1.26 1.28 1.12 1.19 1.23 1.19 1.16
Lys:CP ratio2 3.42 2.98 2.99 2.77 3.93 3.77 3.60 3.60

116
Table 5.1. (Cont.)
Furosine 0.013 0.012 0.021 0.030 0.027 0.040 0.040 0.030
Reactive Lys3 1.21 1.08 1.05 0.94 1.61 1.54 1.47 1.48
L*4
53.83 51.74 49.65 51.84 51.34 48.02 48.03 45.56
Indispensable AA, %
Arg 2.74 2.50 2.61 2.44 4.45 4.43 4.23 4.31
His 0.84 0.78 0.83 0.81 1.16 1.14 1.13 1.16
Ile 1.39 1.31 1.36 1.38 1.28 1.29 1.29 1.33
Leu 2.17 2.03 2.16 2.13 2.35 2.39 2.38 2.46
Lys 1.23 1.09 1.08 0.98 1.64 1.59 1.52 1.52
Met 0.75 0.69 0.74 0.72 0.61 0.63 0.62 0.64
Phe 1.56 1.45 1.55 1.53 2.14 2.17 2.17 2.23
Thr 1.24 1.17 1.25 1.21 1.27 1.31 1.30 1.34
Trp 0.51 0.46 0.44 0.43 0.50 0.51 0.49 0.48
Val 1.71 1.60 1.68 1.68 1.77 1.77 1.78 1.85
All indispensable AA 14.14 13.08 13.70 13.31 17.17 17.21 16.91 17.32
Dispensable AA, %
Ala 1.49 1.39 1.48 1.47 1.56 1.59 1.58 1.63
Asp 3.04 2.84 3.03 2.97 3.54 3.61 3.54 3.54
Cys 0.55 0.51 0.52 0.47 0.66 0.66 0.63 0.64
Glu 6.41 5.97 6.40 6.29 7.75 7.91 7.87 8.05
Gly 1.98 1.84 1.96 1.94 1.70 1.72 1.71 1.76

117
Table 5.1. (Cont.)
Pro 1.48 1.40 1.47 1.46 1.57 1.55 1.55 1.62
Ser 1.41 1.32 1.43 1.37 1.68 1.74 1.71 1.76
All dispensable AA 16.36 15.27 16.29 15.97 18.46 18.78 18.59 19.00
Total AA 30.50 28.35 29.99 29.28 35.63 35.99 35.50 36.32
1AEE = acid hydrolyzed ether extract.
2Calculated by expressing the concentration of Lys in each ingredient as a percentage of the concentration of CP (Stein et al.,
2009).
3Reactive Lys (%) = [Lys (%) – (Furosine (%) ÷ 0.32 × 0.40)]; Pahm et al., 2008.
4L* = lightness.

118
Table 5.2. Ingredient composition of experimental diets (as-fed basis), Exp. 1 and 2
Sunflower meal (Exp.1) Cottonseed meal (Exp.2)
Autoclaved at 130°C Autoclaved at 130°C
Ingredient, % Non-autoclaved 20 min 40 min 60 min Non-autoclaved 15 min 35 min 60 min N-free1
Sunflower meal 42.00 42.00 42.00 42.00 - - - - -
Cottonseed meal - - - - 32.00 32.00 32.00 32.00 -
Cornstarch 42.00 42.00 42.00 42.00 41.97 41.97 41.97 41.97 67.00
Sucrose 10.00 10.00 10.00 10.00 20.00 20.00 20.00 20.00 20.00
Solka floc2
- - - - - - - - 5.00
Soybean oil 3.40 3.40 3.40 3.40 3.50 3.50 3.50 3.50 4.00
Ground limestone 0.85 0.85 0.85 0.85 0.90 0.90 0.90 0.90 0.80
Monocalcium phosphate 0.65 0.65 0.65 0.65 0.50 0.50 0.50 0.50 1.60
Sodium chloride 0.40 0.40 0.40 0.40 0.40 0.40 0.40 0.40 0.40
Ferrous sulfate - - - - 0.03 0.03 0.03 0.03 -
Magnesium oxide - - - - - - - - 0.10
Potassium carbonate - - - - - - - - 0.40
Chromic oxide 0.40 0.40 0.40 0.40 0.40 0.40 0.40 0.40 0.40
Vitamin-mineral premix3
0.30 0.30 0.30 0.30 0.30 0.30 0.30 0.30 0.30
1A N-free diet was produced separately for Exp. 1 and 2.
2Fiber Sales and Development Corp., Urbana, OH.
3Provided the following per kilogram of complete diet: Vitamin A as retinyl acetate, 11,128 IU; vitamin D3 as cholecalciferol,
2,204 IU; vitamin E as DL-alphatocopheryl acetate, 66 IU; vitamin K as menadionenicotinamide bisulfite, 1.42 mg; thiamin as
thiamine mononitrate, 0.24 mg; riboflavin, 6.58 mg; pyridoxine as pyridoxine hydrochloride, 0.24 mg; vitamin B12, 0.03 mg; D-
pantothenic acid as D-calcium pantothenate, 23.5 mg; niacin as nicotinamide, 1.0 mg, and nicotinic acid, 43.0 mg; folic acid, 1.58 mg;
biotin, 0.44 mg; Cu, 10 mg as copper sulfate; Fe, 125 mg as iron sulfate; I, 1.26 mg as potassium iodate; Mn, 60 mg as manganese
sulfate; Se, 0.3 mg as sodium selenite; and Zn, 100 mg as zinc oxide.

119
Table 5.3. Analyzed nutrient composition of experimental diets (as-fed basis), Exp. 1 and 2
Sunflower meal (Exp.1) Cottonseed meal (Exp. 2)
Autoclaved at 130°C Autoclaved at 130°C
Item
Non-
autoclaved
20 min 40 min 60 min
Non-
autoclaved
15 min 35 min 60 min
DM, % 91.39 90.90 90.91 90.70 92.66 91.93 91.98 92.40
CP, % 13.91 14.55 15.00 14.32 14.01 12.45 13.56 13.64
Indispensable AA, %
Arg 1.21 1.12 1.19 1.00 1.49 1.28 1.30 1.37
His 0.38 0.35 0.38 0.33 0.39 0.33 0.34 0.36
Ile 0.61 0.59 0.62 0.56 0.44 0.38 0.39 0.42
Leu 0.98 0.94 1.01 0.90 0.80 0.72 0.74 0.80
Lys 0.54 0.50 0.50 0.41 0.57 0.47 0.47 0.48
Met 0.33 0.30 0.32 0.27 0.21 0.19 0.19 0.20
Phe 0.70 0.66 0.72 0.64 0.73 0.65 0.67 0.72
Thr 0.56 0.53 0.57 0.52 0.43 0.39 0.40 0.43
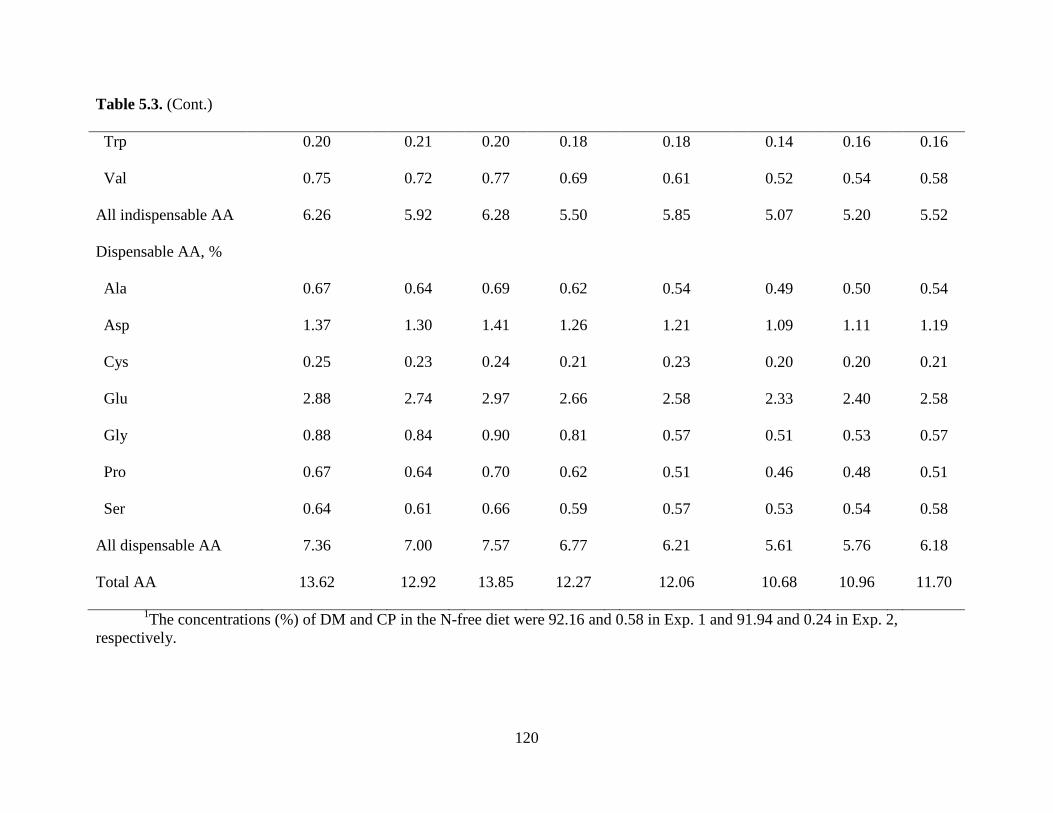
120
Table 5.3. (Cont.)
Trp 0.20 0.21 0.20 0.18 0.18 0.14 0.16 0.16
Val 0.75 0.72 0.77 0.69 0.61 0.52 0.54 0.58
All indispensable AA 6.26 5.92 6.28 5.50 5.85 5.07 5.20 5.52
Dispensable AA, %
Ala 0.67 0.64 0.69 0.62 0.54 0.49 0.50 0.54
Asp 1.37 1.30 1.41 1.26 1.21 1.09 1.11 1.19
Cys 0.25 0.23 0.24 0.21 0.23 0.20 0.20 0.21
Glu 2.88 2.74 2.97 2.66 2.58 2.33 2.40 2.58
Gly 0.88 0.84 0.90 0.81 0.57 0.51 0.53 0.57
Pro 0.67 0.64 0.70 0.62 0.51 0.46 0.48 0.51
Ser 0.64 0.61 0.66 0.59 0.57 0.53 0.54 0.58
All dispensable AA 7.36 7.00 7.57 6.77 6.21 5.61 5.76 6.18
Total AA 13.62 12.92 13.85 12.27 12.06 10.68 10.96 11.70
1The concentrations (%) of DM and CP in the N-free diet were 92.16 and 0.58 in Exp. 1 and 91.94 and 0.24 in Exp. 2,
respectively.

121
Table 5.4. Apparent ileal digestibility of CP and AA in sunflower meal subjected to increasing time of autoclaving by growing pigs
(Exp.1)1
Sunflower meal
Autoclaved at 130° C SEM P-value2
Item Non-autoclaved 20 min 40 min 60 min Linear Quadratic
CP, % 69.48 70.06 64.67 57.91 2.1 < 0.01 0.41
Indispensable AA, %
Arg 87.95 87.15 84.63 81.02 1.0 < 0.01 0.88
His 81.54 80.13 78.53 71.63 1.2 < 0.01 0.23
Ile 81.64 81.44 79.96 75.02 1.1 < 0.01 0.56
Leu 82.05 81.70 80.32 75.30 1.1 < 0.01 0.53
Lys 73.88 71.29 64.87 51.40 2.1 < 0.01 0.66
Met 89.16 88.34 87.85 83.41 0.7 < 0.01 0.08
Phe 84.28 84.07 83.61 79.57 1.0 < 0.01 0.34
Thr 74.27 73.28 70.72 63.31 1.6 < 0.01 0.58
Trp 77.01 78.55 74.41 69.33 1.5 < 0.01 0.37

122
Table 5.4. (Cont.)
Val 80.63 80.29 78.65 73.26 1.2 < 0.01 0.56
Mean 82.01 81.14 79.26 73.34 1.1 < 0.01 0.43
Dispensable AA, %
Ala 73.47 73.19 69.16 60.52 2.1 < 0.01 0.89
Asp 79.08 77.37 74.11 65.13 1.3 < 0.01 0.34
Cys 75.93 74.81 70.39 62.16 2.0 < 0.01 0.95
Glu 87.68 87.17 85.62 81.76 1.0 < 0.01 0.71
Gly 54.57 57.07 44.61 36.02 4.8 < 0.01 0.28
Ser 74.19 72.94 71.48 64.22 1.2 < 0.01 0.26
Mean 74.15 73.84 69.72 62.24 1.7 < 0.01 0.94
1Data are means of 10 observations.
2Linear and quadratic effects of time of autoclaving.

123
Table 5.5. Standardized ileal digestibility of CP and AA in sunflower meal subjected to increasing time of autoclaving by growing
pigs (Exp. 1)1
Sunflower meal
Autoclaved at 130° C SEM P-value2
Item Non-autoclaved 20 min 40 min 60 min Linear Quadratic
CP, % 82.66 82.61 76.84 70.62 2.1 < 0.01 0.35
Indispensable AA, %
Arg 92.53 92.06 89.26 86.52 1.0 < 0.01 0.55
His 86.94 85.96 83.90 77.80 1.2 < 0.01 0.48
Ile 87.58 87.55 85.77 81.44 1.1 < 0.01 0.83
Leu 88.18 88.06 86.23 81.92 1.1 < 0.01 0.85
Lys 83.15 81.24 74.83 63.52 2.1 < 0.01 0.96
Met 92.80 92.32 91.58 87.82 0.7 < 0.01 0.25
Phe 89.80 89.89 88.95 85.56 1.0 < 0.01 0.68
Thr 84.63 84.17 80.84 74.38 1.6 < 0.01 0.96
Trp 85.39 86.49 82.75 78.58 1.5 < 0.01 0.40

124
Table 5.5. (Cont.)
Val 87.17 87.06 84.99 80.32 1.2 < 0.01 0.88
Mean 88.49 87.95 85.68 80.66 1.1 < 0.01 0.79
Dispensable AA, %
Ala 84.88 85.08 80.19 72.76 2.1 < 0.01 0.69
Asp 85.37 83.96 80.18 71.92 1.3 < 0.01 0.62
Cys 84.55 84.14 79.33 72.35 2.0 < 0.01 0.78
Glu 91.61 91.28 89.41 85.99 1.0 < 0.01 0.99
Gly 73.76 77.06 63.36 52.92 3.9 < 0.01 0.17
Ser 83.17 82.31 80.14 73.89 1.2 < 0.01 0.56
Mean 83.89 84.02 79.07 71.94 1.7 < 0.01 0.59
1Data are means of 10 observations; Values for standardized ileal digestibility were calculated by correcting apparent ileal
digestibility values for basal endogenous losses (g/kg of DMI), which were determined by feeding pigs a N-free diet: CP, 20.08; Arg,
0.61; His, 0.22; Ile, 0.40; Leu, 0.66; Lys, 0.55; Met, 0.13; Phe, 0.42; Thr, 0.63; Trp, 0.18; Val, 0.54; Ala, 0.84; Asp, 0.94, Cys, 0.24;
Glu, 1.24; Gly, 1.85; and Ser, 0.63.
2Linear and quadratic effects of time of autoclaving.

125
Table 5.6. Linear regressions to predict the concentration (%) of standardized ileal digestible (SID) AA in sunflower meal fed to pigs1
Intercept Independent variables2
Dependent
variable
Estimate SE P-value Variable 1 Estimate SE P-value
Variable
2
Estimate SE P-value
RMSE3
Adjusted
r2
SID Arg -0.99 0.30 < 0.01 Arg 0.89 0.15 < 0.01 Lys:CP 0.32 0.09 < 0.01 0.08 0.77
SID His 0.45 0.17 < 0.05 His 0.60 0.19 < 0.01 NDF -0.07 0.001 < 0.01 0.03 0.67
SID Ile 0.64 0.29 < 0.05 Ile 0.59 0.29 < 0.01 NDF -0.07 0.001 < 0.01 0.04 0.43
SID Leu 0.99 0.44 < 0.05 Leu 0.61 0.20 < 0.01 NDF -0.01 0.003 < 0.01 0.07 0.49
SID Lys -0.75 0.12 < 0.01 RL 1.49 0.11 < 0.01 - - - - 0.07 0.83
-1.00 0.12 < 0.01 Lys 0.54 0.31 0.08 RS 0.30 0.08 < 0.01 0.06 0.85
SID Met 0.20 0.08 < 0.05 Met 0.81 0.10 < 0.01 NDF -0.003 0.001 < 0.01 0.01 0.81
SID Phe 0.46 0.26 0.08 Phe 0.73 0.16 < 0.01 NDF -0.01 0.002 < 0.01 0.04 0.50
SID Thr 1.45 0.08 < 0.01 NDF -0.01 0.002 < 0.01 - - - - 0.06 0.48
SID Trp -0.23 0.05 < 0.01 Trp 0.53 0.23 < 0.05 Lys:CP 0.12 0.04 < 0.01 0.02 0.81
SID Val 1.59 0.11 < 0.01 NDF -0.03 0.005 < 0.01 Lignin 0.13 0.05 < 0.05 0.06 0.46
1n = 40 observations; for all models P < 0.01.
2RS = reducing sugars; RL = Reactive Lys (%) = [Lys (%) – (Furosine (%) ÷ 0.32 × 0.40)].
3RMSE = root mean square error.

126
Table 5.7. Apparent ileal digestibility of CP and AA in cottonseed meal subjected to increasing time of autoclaving by growing pigs
(Exp.2)1
Cottonseed meal
Autoclaved at 130° C SEM P-value2
Item Non-autoclaved 15 min 35 min 60 min Linear Quadratic
CP, % 61.27 52.63 51.15 53.65 2.4 < 0.01 < 0.01
Indispensable AA, %
Arg 82.20 77.29 74.63 77.84 1.3 < 0.01 < 0.01
His 75.51 67.87 64.44 68.09 1.2 < 0.01 < 0.01
Ile 63.95 54.47 51.94 57.87 1.6 0.04 < 0.01
Leu 66.82 60.22 57.84 63.19 1.5 0.15 < 0.01
Lys 59.06 45.81 41.14 45.63 1.8 < 0.01 < 0.01
Met 67.60 61.48 58.94 63.93 1.4 0.10 < 0.01
Phe 77.41 72.12 69.92 74.10 1.2 0.11 < 0.01
Thr 58.35 50.99 47.35 52.95 1.8 0.06 < 0.01
Trp 67.87 55.31 57.12 59.10 1.6 0.01 < 0.01

127
Table 5.7. (Cont.)
Val 67.43 58.61 56.39 62.01 1.5 0.05 < 0.01
Mean 71.17 63.88 61.13 65.53 1.2 < 0.01 < 0.01
Dispensable AA, %
Ala 52.74 44.20 40.74 48.76 2.6 0.12 < 0.01
Asp 70.98 62.98 55.95 60.01 1.4 < 0.01 < 0.01
Cys 70.57 64.69 60.67 64.42 1.6 0.01 < 0.01
Glu 81.02 76.29 73.26 76.35 1.1 < 0.01 < 0.01
Gly 25.59 16.04 9.31 22.66 6.7 0.42 < 0.01
Ser 66.47 62.40 58.52 63.24 1.3 0.07 < 0.01
Mean 61.23 54.42 49.74 55.84 1.9 < 0.01 < 0.01
1Data are means of 10 observations.
2Linear and quadratic effects of time of autoclaving.

128
Table 5.8. Standardized ileal digestibility of CP and AA in cottonseed meal subjected to increasing levels of heat treatment by
growing pigs (Exp. 2)1
Cottonseed meal
Autoclaved at 130° C SEM P-value2
Item Non-autoclaved 15 min 35 min 60 min Linear Quadratic
CP, % 76.01 69.08 66.27 68.75 2.4 < 0.01 < 0.01
Indispensable AA, %
Arg 88.39 84.44 81.67 84.55 1.3 < 0.01 < 0.01
His 80.92 74.22 70.61 73.94 1.2 < 0.01 < 0.01
Ile 70.71 62.23 59.51 64.93 1.6 0.04 < 0.01
Leu 73.14 67.18 64.63 69.49 1.5 0.13 < 0.01
Lys 66.21 54.42 49.75 54.10 1.8 < 0.01 < 0.01
Met 71.91 66.21 63.67 68.44 1.4 0.12 < 0.01
Phe 81.83 77.05 74.70 78.57 1.2 0.10 < 0.01
Thr 70.53 64.32 60.34 65.09 1.8 0.05 < 0.01
Trp 75.48 65.01 65.62 67.64 1.6 0.02 < 0.01

129
Table 5.8. (Cont.)
Val 74.28 66.59 64.08 69.20 1.5 0.05 < 0.01
Mean 75.34 68.20 65.49 69.56 1.4 0.01 < 0.01
Dispensable AA, %
Ala 66.41 59.15 55.40 62.40 2.6 0.09 < 0.01
Asp 77.44 70.08 62.93 66.55 1.4 < 0.01 < 0.01
Cys 78.38 73.61 69.59 72.96 1.6 0.02 < 0.01
Glu 84.83 80.48 77.32 80.15 1.1 < 0.01 < 0.01
Gly 63.03 57.55 49.27 59.99 6.7 0.27 < 0.01
Ser 76.42 73.02 68.95 72.99 1.3 0.05 < 0.01
Mean 74.42 68.96 63.91 69.10 1.9 < 0.01 < 0.01
1Data are means of 10 observations; Values for standardized ileal digestibility were calculated by correcting apparent ileal
digestibility values for basal endogenous losses (g/kg of DMI), which were determined by feeding pigs a N-free diet: CP, 22.29; Arg,
1.00; His, 0.23; Ile, 0.32; Leu, 0.55; Lys, 0.44; Met, 0.10; Phe, 0.35; Thr, 0.57; Trp, 0.15; Val, 0.45; Ala, 0.80; Asp, 0.84, Cys, 0.19;
Glu, 1.06; Gly, 2.30; and Ser, 0.61.
2Linear and quadratic effects of time of autoclaving.

130
Table 5.9. Linear regressions to predict the concentration (%) of standardized ileal digestible (SID) AA in cottonseed meal fed to
pigs1
Intercept Independent variables2
Dependent
variable
Estimate SE P-value Variable 1 Estimate SE P-value
Variable
2
Estimate SE P-value
RMSE3
Adjusted
r2
SID Arg -4.48 1.27 < 0.01 Arg 1.87 0.29 < 0.01 - - - - 0.16 0.53
SID His 1.06 0.10 < 0.01 Lignin 0.06 0.03 0.04 ADIN -2.18 0.39 < 0.01 0.04 0.62
SID Ile 5.49 1.49 < 0.01 Lys:CP -0.92 0.32 < 0.01 ADIN -4.95 1.30 < 0.01 0.07 0.40
SID Leu 0.78 0.44 0.08 NDF 0.06 0.02 < 0.01 ADIN -3.22 0.77 < 0.01 0.11 0.30
SID Lys -2.42 0.41 < 0.01 RL 2.17 0.27 < 0.01 - - - - 0.09 0.65
1.81 0.11 < 0.01 ADIN -3.67 0.42 < 0.01 - - - - 0.09 0.68
SID Met 0.21 0.11 0.06 NDF 0.01 0.005 < 0.01 ADIN -0.78 0.19 < 0.01 0.03 0.28
SID Phe 1.01 0.33 < 0.01 NDF 0.05 0.02 < 0.01 ADIN -2.38 0.57 < 0.01 0.08 0.30
SID Thr 0.56 0.29 0.06 NDF 0.03 0.01 0.05 ADIN -1.75 0.50 < 0.01 0.07 0.23
SID Trp -0.08 0.11 0.13 ADF 0.02 0.005 < 0.05 RS 0.004 0.005 < 0.05 0.02 0.28
SID Val 8.27 1.87 < 0.01 Lys:CP -1.40 0.39 < 0.01 ADIN -7.19 1.62 < 0.01 0.08 0.43
1n = 40 observations; for all models P < 0.01.
2ADIN = acid detergent insoluble nitrogen; RS = reducing sugars; RL = Reactive Lys (%) = [Lys (%) – (Furosine (%) ÷ 0.32 ×
0.40)]. 3RMSE = root mean square error.

131
CHAPTER 6
EFFECTS OF DIET FORMULATION ON PERFORMANCE OF WEANLING PIGS
FED HEAT DAMAGED SOYBEAN MEAL OR HEAT DAMAGED DISTILLERS
DRIED GRAINS WITH SOLUBLES
ABSTRACT: Two experiments were conducted to investigate if adjustments in diet
formulations based on either total analyzed AA or standardized ileal digestible (SID) AA may be
used to eliminate negative effects of including heat-damaged soybean meal (SBM) or heat-
damaged distillers dried grains with solubles (DDGS) in diets fed to weanling pigs. In Exp. 1, 4
corn-SBM diets were formulated. Diet 1 contained non-autoclaved SBM, and this diet was
formulated on the basis of analyzed AA concentrations and using SID values from the
AminoDat® (2006) database. Three additional diets were formulated using autoclaved SBM,
rather than the non-autoclaved SBM. Diet 2 was formulated similar to Diet 1, except that the
non-autoclaved SBM was replaced by the autoclaved SBM. Diet 3 was formulated by adjusting
AA inclusion in the diet on the basis of analyzed total AA concentrations in the autoclaved SBM
and published SID values (AminoDat®, 2006). Diet 4 also contained autoclaved SBM, but the
formulation of this diet was adjusted on the basis of analyzed AA in the autoclaved SBM and
SID values that were adjusted according to the degree of heat damage in this source of SBM.
Pigs (160; initial BW: 10.4 ± 1.3 kg) were allotted to 4 treatments with 8 replicate pens per
treatment in a randomized complete block design. The final BW on d 21 for pigs fed either Diet
3 or Diet 4 was less (P < 0.05) than the final BW of pigs fed Diet 1, but greater (P < 0.05) than
the final BW of pigs fed Diet 2. The ADG of pigs fed Diet 1 was greater (P < 0.05) than the
ADG of pigs fed the other diets, but pigs fed either Diet 3 or Diet 4 had greater (P < 0.05) ADG
than pigs fed Diet 2. The G:F was greater (P < 0.05) for pigs fed Diet 1 compared with pigs fed

132
the other diets. Pigs fed Diet 4 had greater (P < 0.05) G:F than pigs fed Diet 2. In Exp. 2, 144
pigs (initial BW: 9.9 ± 1.5 kg) were allotted to 4 diets with 8 replicate pens per diet. The 4 diets
contained corn, SBM (8.5%), and DDGS (autoclaved or not autoclaved; 22%), and were
formulated using the concepts described for Exp. 1, except that heat-damaged DDGS but not
heat-damaged SBM, was used in the diets. Pigs fed Diet 2 or Diet 4 had greater (P < 0.05) ADFI
than pigs fed Diet 1, but no differences in ADFI were observed among pigs fed the diets
containing autoclaved DDGS. Pigs fed Diet 1 had greater (P < 0.05) G:F than pigs fed the other
diets, but no differences were observed for G:F among pigs fed diets containing autoclaved
DDGS. Results demonstrate that the negative effects of heat damage may be ameliorated if the
reduced concentration as well as the reduced digestibility of AA in heat-damaged SBM is
corrected.
Diets for weaned pigs containing up to 22% of heat-damaged DDGS reduces performance of
pigs compared with diets containing DDGS that has not been heat-damaged, but correction for
the reduced concentration and the reduced digestibility of AA in heat-damaged DDGS may not
be of practical importance for weaned pigs.
Key words: distillers dried grains with solubles, soybean meal, weaned pigs
INTRODUCTION
Successful feed formulation and nutrition of farm animals requires accurate information
about the nutritional value of the feed ingredients used. Whereas several nutritional criteria are
routinely considered in feed ingredients evaluation, the ability to assess the impact of heat
damage that occurs during processing of particular ingredients has received less attention. The
digestibility of AA by growing pigs in certain ingredients decreases gradually with increasing

133
degree of heat treatment (Fontaine et al., 2007; Pahm et al., 2008; González-Vega et al. 2011). If
this reduction is not considered in feed formulation, use of heat-damaged ingredients may result
in reduced animal performance. Whereas AA analysis of raw materials by rapid methods such as
NIR may identify AA losses in heat-damaged ingredients, which may be considered in diet
formulation, adjustment of diets for changes in AA digestibility is less trivial. Lack of
adjustments in diets containing heat-damaged ingredients, however, may result in reduced
performance of pigs. It is, therefore, necessary that the degree of heat damage in a feed
ingredient is accounted for in diet formulation. Adjustments of values for the standardized ileal
digestibility (SID) of AA in heat-damaged feed ingredients, to ameliorate reduced performance
of chicks fed heat-damaged SBM, have been investigated (Evonik, 2010). In contrast, effects of
formulating diets containing heat-damaged soybean meal (SBM) or heat-damaged distillers dried
grains with solubles (DDGS) to pigs on the basis of adjustments of the SID of AA according to
the degree of heat damage and its effects on performance have not been determined. We
hypothesized that the negative effects of feeding heat-damaged SBM or DDGS to weanling pigs
may be reduced if values for the SID AA used in diet formulation are adjusted according to the
degree of heat damage of the ingredients. Therefore, the objectives of the present experiments
were to investigate if adjustments in diet formulations based on either total analyzed AA or SID
AA may be used to eliminate negative effects of including heat-damaged SBM or DDGS in diets
fed to weanling pigs.

134
MATERIALS AND METHODS
Protocols for the experiments were reviewed and approved by the Institutional Animal
Care and Use Committee at the University of Illinois. Pigs used in both experiments were the
offspring of G-performer boars mated to F-25 females (Genetiporc, Alexandria, MN).
Exp. 1, Use of Heat Damaged Soybean Meal
Diet formulation. Dehulled SBM was procured from Solae (Gibson City, IL) and separated into
2 batches. One batch was not autoclaved, whereas the other batch was autoclaved at 125°C for
60 min (Table 6.1). Four corn-SBM diets were formulated to contain similar concentrations of
CP and GE (Table 6.2). Diet 1 contained the non-autoclaved SBM and this diet was formulated
on the basis of analyzed AA concentrations and using SID values from the AminoDat® (2006)
database. Values for the SID of AA in SBM in the AminoDat® (2006) database are the average
of SID values from 95 digestibility experiments. Three additional diets were formulated using
the autoclaved SBM rather than the non-autoclaved SBM. Diet 2 was formulated exactly like
Diet 1, except that the non-autoclaved SBM was replaced by the autoclaved SBM. Values for the
SID AA used in the formulation of Diet 2 were the same values used in the formulation of Diet
1. Diet 3 was formulated by adjusting AA inclusion in the diet on the basis of analyzed total AA
concentrations in the autoclaved SBM and published SID values (AminoDat®, 2006).
Adjustments for the SID AA in Diet 3 were achieved by adding increased quantities of
crystalline Lys, Met, Thr, and Trp compared with Diets 1 and 2. Diet 4 also contained autoclaved
SBM, but the formulation of this diet was adjusted on the basis of analyzed AA in the autoclaved
SBM and SID values that were adjusted according to the degree of heat damage in this source of
SBM. Crystalline Lys, Met, Thr, and Trp were also added to diet 4, but in greater amounts than

135
in Diet 3. The calculated SID Lys for Diets 1, 2, 3, and 4 were 1.00, 0.88, 0.95, and 1.00%,
respectively.
Animals, Experimental Design, and Housing. A total of 160 pigs (initial BW: 10.4 ± 1.3 kg)
weaned at approximately 21 d of age and fed a common phase 1 diet for 14 d after weaning,
were allotted to 4 dietary treatments with 8 replicate pens per treatment in a randomized
complete block design. Four replicates of each treatment consisted of a pen with 3 barrows and 2
gilts whereas the other 4 replicates of each treatment consisted of a pen with 2 barrows and 3
gilts. Pigs were fed the treatment diets for 21 d. Pigs were housed in an environmental controlled
room in pens (1.2 × 1.2 m) with fully slatted floors. Feed and water were available at all times.
Sample Analyses, Performance Measurements, and Data Processing. Ingredients and diets
were analyzed for DM by drying in an oven at 103°C for 4 h (Method 935.29; AOAC
International), Ca and P (Method 985.01; AOAC International, 2007), ADF (Method 973.18;
AOAC International, 2007), NDF (Holst, 1973), CP according to the Dumas procedure (Method
968.06; AOAC International, 2007), and AA by ion-exchange chromatography with post-column
derivatization with ninhydrin. Cysteine and Met were oxidized with performic acid, which was
neutralized with Na metabisulfite (Llames and Fontaine, 1994; Commission Directive, 1998).
Amino acids were liberated from the protein by hydrolysis with 6 N HCL for 24 h at 110°C and
quantified with the internal standard by measuring the absorption of reaction products with
ninhydrin at 570 nm. Tryptophan was determined by HPLC with fluorescence detection
(extinction 280 nm, emission 356 nm), after alkaline hydrolysis with barium hydroxide
octahydrate for 20 h at 110°C (Commission Directive, 2000).
The individual BW of pigs was recorded at the beginning of the experiment and every 7-
d thereafter. The amount of feed provided to each pen was recorded daily. On the last day of the

136
experiment, feeders were weighed and emptied at 700 h, and at 1300 h blood samples from the
heaviest barrow and the heaviest gilt in each pen were collected via jugular venipuncture in
EDTA tubes. Tubes were stored on ice and centrifuged (2,000 rpm at 5°C for 15 min). Plasma
was then collected from the centrifuged tubes and analyzed for plasma urea nitrogen (PUN) on
an Olympus AU680 Chemistry Analyzer (Olympus Life Science Research Europa GmbH,
Sauerbruchstr., Munich, Germany). At the conclusion of the experiment, values for ADG, ADFI,
and G:F for each 7-d period and for the overall experimental period were calculated. The average
value for PUN for each pen was used in the statistical analysis. The ratio of SID Lys/kg of BW
gain was calculated by the following equation:
SID Lys/BW gain = SID Lys intake (g/d) / ADG (kg).
Data were analyzed using the MIXED procedure of SAS (SAS Institute Inc., Cary, NC).
The UNIVARIATE procedure of SAS was used to verify normality of the data and to test for the
presence of outliers. The model included dietary treatment as the fixed effect, whereas
replication was included as the random effect. The pen was the experimental unit and
significance among means was assessed using an alpha level of 0.05.
Exp. 2, Use of Heat Damaged Distillers Dried Grains with Solubles
Diet formulation. Distillers dried grains with solubles was sourced from Poet LLC (North
Manchester, IN) and separated into 2 batches. One batch was not autoclaved, whereas the other
batch was autoclaved at 125°C for 60 min (Table 6.1). Four diets based on corn, SBM (8.5%),
and DDGS (22%) were formulated following the same concepts as described for Exp. 1 (Table
6.3). Adjustments for the concentration of SID AA in Diet 3 were achieved by adding crystalline
Lys, Met, Thr, Trp, Val, and Ile to a diet that was otherwise similar to Diet 2. Crystalline Lys,

137
Met, Thr, Trp, Val, and Ile were also added to Diet 4, but in greater quantities than in Diet 3. The
calculated SID Lys for Diets 1, 2, 3, and 4 were 1.00, 0.95, 0.97, and 1.00%, respectively.
Animals, Experimental Design, and Housing. A total of 144 pigs (initial BW: 9.9 ± 1.5 kg) that
were weaned at approximately 21 d of age and fed a common phase 1 diet for 14 d were allotted
to 4 dietary treatments with 8 replicate pens per treatment in a randomized complete block
design. Four replicates of each treatment consisted of a pen with 3 gilts and 2 barrows whereas
the other 4 replicates of each treatment consisted of a pen with 2 gilts and 2 barrows. Pigs were
fed the dietary treatments for 21 d. Pigs were housed and fed treatment diets as outlined for Exp.
1.
Sample Analysis, Performance Measurements, and Data Processing. Ingredients and diets
were analyzed as described for Exp. 1. Performance measurements and data processing were also
similar to those described for Exp. 1, except that PUN analysis was not performed.
RESULTS
Exp. 1, Use of Heat Damaged Soybean Meal
The concentration of CP was 47.78 and 46.47% in the non-autoclaved SBM and the
autoclaved SBM, respectively (Table 6.1). The concentration of NDF was 10.28% in the non-
autoclaved SBM vs. 34.94% in the autoclaved SBM. The non-autoclaved SBM contained 2.85%
Lys, whereas the autoclaved SBM contained 2.58% Lys. The concentration of Lys:CP was 6.09
for the non-autoclaved SBM and 5.40 for the autoclaved SBM. The concentration of CP in Diets
1, 2, 3, and 4 were 19.75, 19.85, 19.48, and 20.01%, respectively (Table 6.4). The concentration
of Lys was 1.13% in Diet 1, 0.97% in Diet 2, 1.03% in Diet 3, and 1.10% in Diet 4.
No differences in initial BW of pigs were observed among dietary treatments (Table 6.6).
Pigs that were fed Diet 2, however, had reduced (P < 0.05) BW on d 7 compared with pigs fed

138
the other diets, but the BW on d 7 for pigs fed Diet 4 was not different from the BW of pigs fed
Diet 1. Likewise, the BW on d 7 of pigs fed Diet 3 was not different from that of pigs fed Diet 4.
A similar trend for the BW of pigs on d 14 was observed. The final BW on d 21 for pigs fed
either Diet 3 or Diet 4 was less (P < 0.05) than the final BW of pigs fed Diet 1, but greater (P <
0.05) than the final BW of pigs fed Diet 2.
The ADG (d 0 to 7, and d 7 to 14) of pigs fed Diet 1 was greater (P < 0.05) than the ADG
of pigs fed either Diet 2 or Diet 3, but not different from the ADG of pigs fed Diet 4. The ADG
from d 14 to 21 and the overall ADG of pigs fed Diet 1 was also greater (P < 0.05) than the ADG
of pigs fed the other diets, but pigs fed either Diet 3 or Diet 4 had greater (P < 0.05) ADG than
pigs fed Diet 2.
Pigs fed Diet 3 or Diet 4 had greater (P < 0.05) ADFI (d 0 to 7) than pigs fed Diet 2, but
there was no difference in ADFI between pigs fed Diet 1 or Diet 3. From d 7 to 14, d 14 to 21, or
d 0 to 21, pigs fed Diet 3 or Diet 4 tended (P = 0.08) to consume more feed than pigs fed the
other diets.
The G:F (d 0 to 7) was greater (P < 0.05) for pigs fed Diet 1 than for pigs fed the other
diets. Pigs fed Diet 3 or Diet 4 had greater (P < 0.05) G:F compared with pigs fed Diet 2.
Likewise, the G:F (d 7 to 14, d 14 to 21, and overall) was greater (P < 0.05) for pigs fed Diet 1
compared with pigs fed the other diets. Pigs fed Diet 4 had greater (P < 0.05) G:F during the
entire experiment than pigs fed Diet 2.
Pigs that were fed Diet 1 required less (P < 0.05) SID Lys:BW gain (g/kg) than pigs fed
the other diets. There were no differences on the SID Lys:BW gain among pigs fed Diets 2, 3, or
4.

139
The concentration of PUN was less (P < 0.05) in pigs fed Diet 1 than in pigs fed Diet 2 or
Diet 3, but not different form the PUN in pigs fed Diet 4. Pigs fed Diet 2 had the greatest (P <
0.05) concentration of PUN among all dietary treatments.
Exp. 2, Use of Heat Damaged Distillers Dried Grains with Solubles
The analyzed ADF concentration was 8.53% in non-autoclaved DDGS, whereas
autoclaved DDGS contained 15.47% ADF (Table 6.1). The Lys:CP ratio in non-autoclaved
DDGS was 3.05, but 2.24 in autoclaved DDGS. The Lys concentration in Diet 1 was 1.11%,
whereas the concentration of Lys was 1.06, 1.10, and 1.08% for Diets 2, 3, 4, respectively (Table
6.5).
No differences were observed for initial BW among dietary treatments (Table 6.7), but
pigs fed Diets 1 or 4 tended (P = 0.06) to have a greater BW on d 7 than pigs fed Diets 2 or 3.
The G:F from d 0 to 7 was greater (P < 0.05) for pigs fed Diet 1 or Diet 4 than for pigs fed Diet
2, but the G:F of pigs fed Diet 3 was not different from the G:F of pigs fed Diets 2 or 4.
From d 7 to 14, no differences in growth performance were observed among treatments,
except that pigs fed diets containing autoclaved DDGS had greater (P < 0.05) ADFI than pigs
fed the positive control diet. Likewise, no differences in performance were observed from d 14 to
21 among dietary treatments. For the entire period (d 0 to 21), it was observed that pigs fed Diets
2 or 4 had greater (P < 0.05) ADFI than pigs fed Diet 1, but no differences in ADFI were
observed among pigs fed the diets containing autoclaved DDGS. Pigs fed Diet 1 had greater (P <
0.05) G:F than pigs fed the other diets. No differences were observed for the SID Lys:BW gain
(g/kg) among dietary treatments.

140
DISCUSSION
Ingredients
Soybean meal is the protein source most utilized in diets fed to pigs, but because
inactivation of antinutritional factors in SBM requires heat processing, some variation in the
nutritional value of different sources of SBM may exist (Stein et al., 2008). The concentrations
of DM, CP, and indispensable AA in the non-autoclaved SBM used in this experiment are in
agreement with values reported by Fontaine et al. (2007) and González-Vega et al. (2011). The
concentration of Lys is reduced in heat-damaged ingredients whereas the concentration of CP
remains relatively constant during heat damage (Fontaine et al., 2007; González-Vega et al.,
2011). The reduction in the concentration of Lys in heat-damaged feed ingredients is likely a
result of Maillard reactions (Pahm et al., 2008). Because the concentration of Lys, but not the
concentration of CP, is reduced during heat damage, it has been suggested that the Lys:CP ratio
may be used as an indicator of heat damage in feed ingredients (Stein et al., 2009; Cozannet et
al., 2010; Kim et al., 2012). Reductions in the Lys:CP ratio as a result of heat damage in SBM
that were observed in this experiment have also been observed in previous experiments (Fontaine
et al., 2007; González-Vega et al., 2011). Increased NDF in the autoclaved SBM compared with
the non-autoclaved SBM is in agreement with observations by Hussein et al. (1995). Some of the
products from the Maillard reactions form a “lignin-like matrix”, which is analyzed as fractions
of NDF (Hussein et al., 1995). Thus, it is likely that the observed increase in the analyzed
concentration of ADF in autoclaved DDGS compared with non-autoclaved DDGS was also a
result of this artifact. The protein fraction of SBM is mainly composed of globulins and
albumins, which are susceptible to heat damage and, therefore, Maillard reactions may increase
the concentrations of insoluble N, NDF, and ADF (Hussein et al., 1995). The concentration of

141
NDF was increased from 14.3% in non-autoclaved SBM to 17.1% in SBM autoclaved at 127°C
for 10 min (Sadeghi et al., 2006). These observations indicate that the concentration of NDF
within a source of SBM may also serve as an indicator of heat damage. When SBM is heat
processed, the combination of heat, reducing sugars, and the “free” amino groups of proteins and
AA may initiate Maillard reactions (Fontaine et al., 2007; González-Vega et al., 2011). Lysine
that reacts with reducing sugars through Maillard reactions becomes unavailable to pigs
(Nursten, 2005, Pahm et al., 2008). In heat-damaged feed ingredients, however, Lys that initially
reacted with reducing sugars is partially recovered under traditional AA analysis (Pahm et al.,
2008). The analyzed concentration of total Lys in heat-damaged feed ingredients is, therefore,
believed to overestimate the concentration of reactive Lys, which is the Lys that can potentially
be used for protein synthesis by the pig. The concentration of reactive Lys and the digestibility of
Lys in heat-damaged SBM is reduced (Fontaine et al., 2007; González-Vega et al., 2011)
compared with SBM that is not heat-damaged. Thus, if heat-damaged SBM or DDGS is used in
diet formulation assuming the same concentration and digestibility of Lys and other AA as in
non-heat damaged SBM, diets that are deficient in digestible AA may be formulated.
Diets
The Diets 2 used in the experiments were formulated to simulate a situation where a
batch of heat-damaged SBM or DDGS is treated as regular (not heat-damaged) SBM or DDGS.
Thus, in these diets, the concentrations of analyzed AA from SBM or DDGS that are not heat-
damaged were used. The concentrations of digestible AA in these diets, therefore, were likely
overestimated because the concentration and the digestibility of most AA in autoclaved SBM
and DDGS is reduced compared with SBM or DDGS that has not been autoclaved (Cozannet et
al., 2010; González-Vega et al., 2011). This observation is supported by the reduced

142
concentrations of analyzed AA in Diet 2 in both experiments compared with concentrations in
the diets containing non-autoclaved SBM or DDGS. When formulating Diet 3, the reduced
concentrations of AA, but not the reduced digestibility, was corrected by addition of increased
quantities of crystalline Lys, Met, and Thr (Exp. 1), or increased quantities of crystalline Lys,
Thr, Met, Trp, Val, and Ile (Exp. 2). Thus, Diet 3 in both experiments simulated a situation
where ingredients were analyzed for concentrations of AA prior to diet formulation. However, in
Diet 4, additional crystalline AA were used to compensate for the reduced concentrations and the
reduced digestibility of AA in the heat-damaged SBM or DDGS. Diet 4, therefore, simulated a
situation where it was recognized that SBM or DDGS was heat-damaged, and that expected
reductions in AA digestibility were taken into account in diet formulations. It was expected that
this approach would result in concentrations of SID AA in Diet 4 that were similar to
concentrations in Diet 1. To achieve this, a greater concentration of total Lys in Diet 4 was
necessary. For Exp. 1, the analyzed total concentration of Lys in Diet 4 was slightly less than
expected (1.10 vs. 1.18%). An analysis of free AA in the diets was, therefore, performed and it
was confirmed that crystalline AA were accurately supplemented to the diets. The AA
concentrations in the autoclaved SBM (analyzed by NIR) used in diet formulation were slightly
greater than the corresponding values analyzed via wet chemistry (e.g., Lys, 2.68 vs. 2.51%,
[data not shown]). Thus, it is likely that the difference between calculated and analyzed total AA
in Diet 4 was a result of an overestimation of these AA (by NIR analysis) in heat-damaged SBM,
thereby indicating the necessity for further improvement in the analysis. In diets for Exp. 2, the
concentration of analyzed total Lys was also less than the calculated concentrations. In
particular, the concentration of total Lys in Diet 4 turned out to be close to that in Diet 3 (1.08 vs.

143
1.10%) and approximately 0.08% less than the calculated value. This was unexpected and may
have partly contributed to the observed performance of pigs in Exp. 2.
Performance
The difference in the final BW observed between pigs fed Diet 1 and Diet 2 at the end of
Exp. 1 was expected because of the reduced concentration and digestibility of AA in Diet 2.
Supplementation of practical diets with crystalline AA is a common practice, but because of the
overestimation of the concentration of Lys in feedstuffs that have been heat-damaged, the
quantity of digestible AA added to diets containing such ingredients may not meet the pig`s
requirement, thus, leading to decreased performance. This is likely the reason for the reduced
performance of pigs fed Diet 2. However, the fact that pigs fed Diet 4 had greater final BW,
ADG, and G:F than pigs fed Diet 2 indicates that by taking both the reduced concentration of AA
and the reduced digestibility of AA in heat-damaged SBM into account in diet formulation, the
negative effects of heat damage may be ameliorated. To our knowledge, this is the first time an
experiment has been conducted to evaluate the effects of heat damage and the use of different
diet formulation approaches on performance of weanling pigs fed heat-damaged SBM. A similar
experiment, however, was conducted with broiler chicks (Evonik, 2010). Performance of broilers
fed diets containing autoclaved SBM was less than the performance of broilers fed diets
containing non-autoclaved SBM, but performance of broilers fed diets containing autoclaved
SBM was restored to the same level as that observed for chicks fed diet containing non-
autoclaved SBM when the reduced concentration and digestibility of AA in the negative control
diet was taken into account in diet formulations. Thus, results of the present experiment with
pigs are in agreement with the data observed in broilers. These results confirm the need for
nutrient evaluation of each individual batch of SBM before diet formulation.

144
One of the possible reasons why performance of pigs fed Diet 4 in Exp. 2 was not
improved to the same level as that of pigs fed Diet 1 may be that the SID values used to
formulate this diet were determined from experiments using growing pigs whereas weaned pigs
were used in this experiment. It has been reported that the digestibility of AA is considerably less
for weaned pigs compared with growing pigs (Mariscal-Landin et al., 2008). It is also possible
that the impact of heat damage on the digestibility of AA may be greater in weaned pigs
compared with growing pigs but, to our knowledge, this has not been demonstrated. Another
factor that may have contributed to the lack of a response to adjustments in diet formulation in
Exp. 2 is that the differences in Lys concentration among diets were less than in Exp. 1 because
of the relatively low inclusion level of DDGS in the diets. In the present experiment, DDGS was
included in diets at a level of 22% to be consistent with what is recommended for weaned pigs
(National Swine Nutrition Guide, 2010). The small differences in Lys concentration among diets
is likely the reason we did not observe differences in ADG among treatments. The differences in
G:F among treatments is likely a result of the increased ADFI of pigs fed diets containing
autoclaved SBM or DDGS compared with pigs fed the non-autoclaved ingredients. The reasons
for the greater ADFI in pigs fed diets containing autoclaved DDGS may be that diets were more
palatable because of the formation of Maillard reaction products (Ames, 1998) or because pigs
were trying to compensate for the Lys deficiency in the diets. The latter assumption is supported
by the fact that SID Lys:BW gain was the same among dietary treatments.
As a consequence of the reduced concentration and digestibility of AA in heat-damaged
SBM, an imbalance of AA may be created in pigs fed diets containing SBM that has been heat-
damaged, and some AA may have been absorbed in quantities that are less than the requirement.
Protein synthesis, therefore, may have been limited by the concentrations of the limiting AA.

145
Amino acids that are absorbed in excess of what is used for protein synthesis will be catabolized
and the amino group will be used in the synthesis of urea, which then is excreted via the urine
(Klindt et al., 2006). Thus, the differences observed in PUN between pigs fed Diet 1 and Diet 2
were expected because in the diet containing non-autoclaved SBM, AA were expected to be
more balanced, therefore, leading to increased protein synthesis and less PUN. The PUN
concentrations observed for pigs fed Diet 4 were not different from those of pigs fed Diet 1,
which confirms the need for adjustments in total AA concentrations and SID AA values
according to the degree of heat damage in SBM. This observation also indicates that if such
adjustments are accomplished, not only protein synthesis, but also performance, may be
improved if heat-damaged SBM is included in diets.
Conclusions
Results from this experiment demonstrate the negative effects of excessive heating of
SBM on performance of weaned pigs. Results also demonstrate that the negative effects of heat
damage may be ameliorated if the reduced concentration as well as the reduced digestibility of
AA in heat-damaged SBM is corrected. Diets containing heat-damaged SBM, therefore, need to
contain greater concentrations of Lys, Met, and Thr compared with diets containing non-heat
damaged SBM. Diets for weaned pigs containing up to 22% of heat-damaged DDGS reduce
performance of pigs compared with diets containing DDGS that has not been heat-damaged, but
correction for the reduced concentration and the reduced digestibility of AA in heat-damaged
DDGS may not be of practical importance for weaned pigs.

146
LITERATURE CITED
Almeida, F. N., G. I. Petersen, and H. H. Stein. 2011. Digestibility of amino acids in corn, corn
coproducts, and bakery meal fed to growing pigs. J. Anim. Sci. 89:4109-4115.
Ames, J. M. 1998. Applications of the Maillard reaction in the food industry. Food Chem.
62:431-439.
AOAC International. 2007. Official Methods of Analysis of AOAC International. 18th ed. Rev.
2. W. Hortwitz and G. W. Latimer Jr., ed. AOAC Int., Gaithersburg, MD.
Commission Directive. 1998. Establishing community methods for 434 the determination of
amino acids, crude oils and fats, and olaquindox in feeding stuff and amending Directive
71/393/EEC, annex part A. Determination of Amino Acids. Offic. J. L257:14-23.
Commission Directive. 2000. Establishing community methods for the determination of vitamin
A, vitamin E and tryptophan, annex part C. Determination of Tryptophan. Offic. J.
L174:45-50.
Cozannet, P., Y. Primot, C. Gady, J. P. Métayer, P. Callu, M. Lessire, F. Skiba, and J. Noblet.
2010. Ileal digestibility of amino acids in wheat distillers dried grains with solubles for
pigs. Anim. Feed. Sci. Technol. 158:177-186.
Evonik, 2010. Analytic AMINORED®.
https://www.aminoacidsandmore.com/_LIBRARY/FLEXHIBE/V2/com/evonik/healthnut
rition/documentHandling/file/Download.cfm?fileId=10206. (Accessed 31 January 2013.)
Fontaine, J., U. Zimmer, P. J. Moughan, and S. M. Rutherfurd. 2007. Effect of heat damage in an
autoclave on the reactive lysine contents of soy products and corn distillers dried grains
with solubles. Use of the results to check on lysine damage in common qualities of these
ingredients. J. Agric. Food Chem. 55:10737-10743.

147
González-Vega, J. C., B. G. Kim, J. K. Htoo, A. Lemme, and H. H. Stein. 2011. Amino acid
digestibility in heated soybean meal fed to growing pigs. J. Anim. Sci. 89:3617-3625.
Holst, D. O. 1973. Holst filtration apparatus for Van Soest detergent fiber analysis. J. AOAC
56:1352–1356.
Hussein, H. S., B. Demjanec, N. R. Merchen, and C. G. Aldrich. 1995. Effect of roasting on site
and extent of digestion of soybean meal by sheep: II. Digestion of artifacts of heating. J.
Anim. Sci. 73:835-842.
Kim, B. G., D. Y. Kil, Y. Zhang, and H. H. Stein. 2012. Concentrations of analyzed or reactive
lysine, but not crude protein, may predict the concentration of digestible lysine in
distillers dried grains with solubles (DDGS) fed to pigs. J. Anim. Sci. 90:3798-3808.
Klindt, J., R. M. Thallman, and T. Wise. 2006. Effects of sire line, sire, and sex on plasma urea
nitrogen, body weight, and backfat thickness in offspring of Duroc and Landrace boars. J.
Anim. Sci. 84:1323-1330.
Llames, C. R., and J. Fontaine. 1994. Determination of amino acids in feeds: Collaborative
study. J. Assoc. Off. Anal. Chem. 77:1362–1402.
Mariscal-Landín, G., T. C. Reis de Souza, J. E. Parra, A. Aguilera, and B. Mar. 2008. Ileal
digestibility of protein and amino acids from canola meal in weaned piglets and growing
pigs. Livest. Sci. 116:53-62.
National Swine Nutrition Guide. 2010. National Swine Nutrition Guide Tables on Nutrient
Recommendations, Ingredient Composition, and Use Rates. US Pork Center of
Excellence, Ames, IA.
Nursten, H. 2005. The Maillard Reaction. Chemistry, Biochemistry, and Implications. Royal
Society of Chemistry, Cambridge, UK.

148
Pahm, A. A., C. Pedersen, and H. H. Stein. 2008. Application of the reactive lysine procedure to
estimate lysine digestibility in distillers dried grains with solubles fed to growing pigs. J.
Agric. Food Chem. 56:9441-9446.
Sadeghi, A. A., A. Nikkhah, P. Shawrang, and M. M. Shahrebabak. 2006. Protein degradation
kinetics of untreated and treated soybean meal using SDS-PAGE. Anim. Feed Sci.
Technol. 126:121-133.
Stein, H. H., L. L. Berger, J. K. Drackley, G. C. Fahey, Jr., D. C. Hernot, and C. M. Parsons.
2008. Nutritional properties and feeding values of soybeans and their co-products. Pages
613-660 in Soybeans: Chemistry, Production, Processing, and Utilization. Johnson, L. A.,
P. J. White, and R. Galloway, eds. AOCS Press, Urbana, IL.
Stein, H. H., S. P. Connot, and C. Pedersen. 2009. Energy and nutrient digestibility in four
sources of distillers dried grains with solubles produced from corn grown within a narrow
geographical area and fed to growing pigs. Asian-australas. J. Anim. Sci. 22:1016-1025.
Stein, H. H., and G. C. Shurson. 2009. BOARD-INVITED REVIEW: The use and application of
distillers dried grains with solubles in swine diets. J. Anim. Sci. 87:1292-1303.

149
TABLES
Table 6.1. Analyzed nutrient composition of ingredients (as-fed basis), Exp. 1 and 21
Exp. 1 Exp. 2
Item Corn Non-autoclaved
SBM2
Autoclaved
SBM3
Corn Non-autoclaved
DDGS
Autoclaved
DDGS3
DM, % 89.5 90.7 85.0 88.2 92.4 88.5
CP, % 8.54 47.78 46.47 7.89 27.91 26.82
ADF, % 2.09 4.56 4.49 1.85 8.53 15.47
NDF, % 8.93 10.28 34.94 9.75 31.93 29.65
Ca, % 0.00 0.31 0.29 0.01 0.05 0.05
P, % 0.23 0.61 0.57 0.24 0.89 0.87
Lys:CP4 - 6.09 5.40 - 3.05 2.24
Indispensable AA, %
Arg 0.40 3.44 3.09 0.39 1.27 1.05
His 0.23 1.23 1.15 0.22 0.73 0.64

150
Table 6.1. (Cont.)
Ile 0.28 2.14 2.07 0.26 1.01 0.94
Leu 1.00 3.62 3.44 0.91 3.07 2.86
Lys 0.26 2.91 2.51 0.24 0.85 0.60
Met 0.17 0.67 0.63 0.16 0.56 0.50
Phe 0.41 2.38 2.25 0.37 1.30 1.20
Thr 0.29 1.89 1.78 0.28 1.05 0.97
Trp 0.06 0.65 0.62 - - -
Val 0.37 2.23 2.16 0.36 1.35 1.25
Dispensable AA, %
Ala 0.60 2.05 1.95 0.58 1.99 1.85
Asp 0.56 5.39 5.08 0.52 1.82 1.66
Cys 0.18 0.67 0.58 0.18 0.57 0.49
Glu 1.49 8.43 7.99 1.39 4.69 4.37
Gly 0.32 2.02 1.93 0.31 1.12 1.04
Pro 0.74 2.34 2.25 0.69 2.32 1.99

151
Table 6.1. (Cont.)
Ser 0.40 2.40 2.24 0.38 1.35 1.23
1SBM = soybean meal; DDGS = distillers dried grains with solubles.
2This source of SBM was also included in diets fed to pigs in Exp. 2.
3Autoclaved at 125°C for 60 min.
4Calculated by expressing the concentration of Lys in each ingredient as a percentage of the concentration of CP (Stein et al.,
2009).

152
Table 6.2. Ingredient and nutrient composition of diets used in Exp. 1 (as-fed basis)
Diets1
Non-autoclaved
SBM2
Autoclaved SBM - 125°C, 60 min
Diet 1 Diet 2 Diet 3 Diet 4
Ingredient, %
Non-autoclaved SBM 31.50 - - -
Autoclaved SBM - 31.50 31.50 31.50
Ground corn 61.93 61.93 61.93 61.93
Soybean oil 2.00 2.74 2.00 2.29
Corn starch 2.00 2.00 1.84 1.42
Dicalcium phosphate 0.94 0.94 0.94 0.94
Ground limestone 1.00 1.00 1.00 1.00
Salt 0.20 0.20 0.20 0.20
L-Lys 0.08 0.08 0.18 0.24
L-Thr - - 0.02 0.06
DL-Met 0.05 0.05 0.08 0.10
L-Trp - - 0.01 0.02
Vitamin-mineral
premix3
0.30 0.30 0.30 0.30
Calculated nutrients,4
%
CP 20.42 19.89 20.01 20.12
Total Lys 1.14 1.14 1.13 1.18

153
Table 6.2. (Cont.)
SID Lys 1.00 1.00 (0.88) 1.00 (0.95) 1.00
SID Met 0.33 0.33 (0.31) 0.35 (0.34) 0.36
SID Met + Cys 0.61 0.61 (0.56) 0.61 (0.59) 0.61
SID Thr 0.67 0.67 (0.61) 0.66 (0.63) 0.67
SID Trp 0.21 0.21 (0.19) 0.21 (0.20) 0.21
SID Ile 0.76 0.76 (0.70) 0.74 (0.70) 0.70
SID Val 0.84 0.84 (0.78) 0.82 (0.78) 0.78
SID Leu 1.56 1.56 (1.46) 1.53 (1.46) 1.46
Ca, % 0.71 0.71 0.71 0.71
Available P, % 0.32 0.32 0.32 0.32
1Diet 3 = diet was formulated taking into account the negative effects of heat damage on
the concentration of AA; Diet 4 = diet was formulated taking into account the negative effects of
heat damage on the concentration and on the digestibility of AA. 2SBM = soybean meal.
3The vitamin-micromineral premix provided the following quantities of vitamins and
micro minerals per kilogram of complete diet: Vitamin A as retinyl acetate, 11,128 IU; vitamin
D3 as cholecalciferol, 2,204 IU; vitamin E as DL-alphatocopheryl acetate, 66 IU; vitamin K as
menadione nicotinamide bisulfate, 1.42 mg; thiamin as thiamine mononitrate, 0.24 mg;
riboflavin, 6.58 mg; pyridoxine as pyridoxine hydrochloride, 0.24 mg; vitamin B12, 0.03 mg; D-
pantothenic acid as D-calcium pantothenate, 23.5 mg; niacin as nicotinamide, 1.0 mg, and
nicotinic acid, 43.0 mg; folic acid, 1.58 mg; biotin, 0.44 mg; Cu, 10 mg as copper sulfate; Fe,
125 mg as iron sulfate; I, 1.26 mg as potassium iodate; Mn, 60 mg as manganese sulfate; Se, 0.3
mg as sodium selenite; and Zn, 100 mg as zinc oxide. 4SID = standardized ileal digestible; Values in parentheses were calculated taking into
account the negative effect of heat damage on the SID of AA.

154
Table 6.3. Ingredient and nutrient composition of diets used in Exp. 2 (as-fed basis)
Diets1
Non-autoclaved
DDGS2
Autoclaved DDGS - 125°C, 60 min
Diet 1 Diet 2 Diet 3 Diet 4
Ingredient, %
Non-autoclaved DDGS 22.00 - - -
Autoclaved DDGS - 22.00 22.00 22.00
Ground corn 62.20 62.20 62.20 62.20
Soybean meal 8.50 8.50 8.50 8.50
Soybean oil 1.464 1.464 1.464 1.593
Corn starch 2.00 2.00 1.95 1.67
Dicalcium phosphate 0.98 0.98 0.98 0.98
Ground limestone 1.13 1.13 1.13 1.13
Salt 0.15 0.15 0.15 0.15
Vitamin-mineral
premix3
0.30 0.30 0.30 0.30
L-Lys 0.695 0.695 0.715 0.754
L-Thr 0.181 0.181 0.186 0.210
DL-Met 0.146 0.146 0.160 0.184
L-Trp 0.098 0.098 0.101 0.110
L-Val 0.091 0.091 0.092 0.130
L-Ile 0.060 0.060 0.065 0.091

155
Table 6.3. (Cont.)
Calculated nutrients,4
%
CP 16.02 15.97 16.01 16.13
Total Lys 1.13 1.13 1.13 1.15
SID Lys 1.00 1.00 (0.95) 1.00 (0.97) 1.00
SID Met 1.13 1.13 (1.11) 1.13 (1.12) 1.15
SID Met + Cys 0.38 0.38 (0.36) 0.38 (0.38) 0.40
SID Thr 0.60 0.60 (0.56) 0.60 (0.57) 0.60
SID Trp 0.63 0.63 (0.60) 0.63 (0.61) 0.63
SID Ile 0.21 0.21 (0.20) 0.21 (0.20) 0.21
SID Val 0.54 0.54 (0.51) 0.54 (0.51) 0.54
SID Leu 0.68 0.68 (0.64) 0.68 (0.64) 0.68
Ca, % 1.36 1.36 (1.30) 1.34 (1.30) 1.30
Available P, % 0.70 0.70 0.70 0.70
1Diet 3 = diet was formulated taking into account the negative effects of heat damage on
the concentration of AA; Diet 4 = diet was formulated taking into account the negative effects of
heat damage on the concentration and on the digestibility of AA. 2DDGS = distillers dried grains with solubles.
3The vitamin-micromineral premix provided the following quantities of vitamins and
micro minerals per kilogram of complete diet: Vitamin A as retinyl acetate, 11,128 IU; vitamin
D3 as cholecalciferol, 2,204 IU; vitamin E as DL-alphatocopheryl acetate, 66 IU; vitamin K as
menadione nicotinamide bisulfate, 1.42 mg; thiamin as thiamine mononitrate, 0.24 mg;
riboflavin, 6.58 mg; pyridoxine as pyridoxine hydrochloride, 0.24 mg; vitamin B12, 0.03 mg; D-
pantothenic acid as D-calcium pantothenate, 23.5 mg; niacin as nicotinamide, 1.0 mg, and
nicotinic acid, 43.0 mg; folic acid, 1.58 mg; biotin, 0.44 mg; Cu, 10 mg as copper sulfate; Fe,
125 mg as iron sulfate; I, 1.26 mg as potassium iodate; Mn, 60 mg as manganese sulfate; Se, 0.3
mg as sodium selenite; and Zn, 100 mg as zinc oxide. 4SID = standardized ileal digestible; Values in parentheses were calculated taking into
account the negative effect of heat damage on the SID of AA.

156
Table 6.4. Analyzed nutrient composition of diets used in Exp. 1 (as-fed basis)
Diets1
Non-autoclaved
SBM2
Autoclaved SBM - 125°C, 60 min
Diet 1 Diet 2 Diet 3 Diet 4
Item
GE, kcal/kg 4,106 4,041 4,059 4,058
DM, % 90.27 89.23 89.29 89.36
CP, % 19.75 19.85 19.48 20.01
ADF, % 2.74 2.71 2.79 2.98
NDF, % 8.92 17.75 18.88 17.68
Ca, % 0.74 0.70 0.75 0.75
P, % 0.55 0.50 0.52 0.54
Indispensable AA, %
Arg 1.31 1.20 1.19 1.20
His 0.53 0.51 0.51 0.51
Ile 0.84 0.82 0.82 0.85
Leu 1.73 1.73 1.74 1.73
Lys 1.13 0.97 1.03 1.10
Met 0.36 0.33 0.36 0.38
Phe 0.99 0.99 0.98 0.98
Thr 0.77 0.76 0.79 0.79
Trp 0.24 0.23 0.24 0.25

157
Table 6.4. (Cont.)
Val 0.93 0.91 0.90 0.95
Dispensable AA, %
Ala 1.01 1.00 1.01 1.00
Asp 2.02 1.99 1.96 1.99
Cys 0.32 0.29 0.29 0.29
Glu 3.53 3.50 3.49 3.49
Gly 0.83 0.82 0.81 0.82
Pro 1.19 1.19 1.19 1.18
Ser 0.99 0.99 0.97 0.95
1Diet 3 = diet was formulated taking into account the negative effects of heat damage on
the concentration of AA; Diet 4 = diet was formulated taking into account the negative effects of
heat damage on the concentration and on the digestibility of AA. 2SBM = soybean meal.

158
Table 6.5. Analyzed nutrient composition of diets used in Exp. 2 (as-fed basis)
Diets1
Non-autoclaved
DDGS2
Autoclaved DDGS - 125°C, 60 min
Diet 1 Diet 2 Diet 3 Diet 4
Item
GE, kcal/kg 4,071 4,054 4,077 4,064
DM, % 89.17 88.51 88.34 88.44
CP, % 15.72 15.27 15.44 16.01
ADF, % 3.58 4.47 5.44 5.03
NDF, % 13.52 14.33 14.00 13.62
Ca, % 0.74 0.63 0.68 0.70
P, % 0.60 0.58 0.57 0.57
Indispensable AA, %
Arg 0.80 0.76 0.75 0.78
His 0.40 0.39 0.38 0.40
Ile 0.61 0.58 0.60 0.65
Leu 1.52 1.53 1.50 1.56
Lys 1.11 1.06 1.10 1.08
Met 0.41 0.39 0.41 0.44
Phe 0.71 0.71 0.70 0.73
Thr 0.72 0.69 0.72 0.72

159
Table 6.5. (Cont.)
Trp 0.22 0.22 0.21 0.23
Val 0.77 0.75 0.76 0.82
Dispensable AA, %
Ala 0.94 0.95 0.93 0.96
Asp 1.17 1.15 1.13 1.18
Cys 0.28 0.27 0.27 0.28
Glu 0.61 0.60 0.59 0.61
Gly 1.15 1.10 1.08 1.13
Pro 0.73 0.73 0.70 0.73
Ser 0.94 0.95 0.93 0.96
1Diet 3 = diet was formulated taking into account the negative effects of heat damage on
the concentration of AA; Diet 4 = diet was formulated taking into account the negative effects of
heat damage on the concentration and on the digestibility of AA. 2DDGS = distillers dried grains with solubles.

160
Table 6.6. Performance of weanling pigs fed diets containing non-autoclaved or autoclaved soybean meal (SBM)1
Diets2
Non-autoclaved SBM Autoclaved SBM - 125°C, 60 min SEM P-value
Item Diet 1 Diet 2 Diet 3 Diet 4
d 0 to 7
Initial BW, kg 10.47 10.43 10.44 10.44 0.45 0.52
ADG, kg 0.353a 0.231
c 0.295
b 0.331
ab 0.020 < 0.01
ADFI, kg 0.590b 0.563
b 0.619
ab 0.663
a 0.030 0.04
G:F 0.595a 0.410
c 0.459
b 0.500
b 0.017 < 0.01
Final BW, kg 13.02a 12.06
c 12.52
b 12.75
ab 0.54 < 0.01
d 7 to 14
ADG, kg 0.526a 0.384
c 0.451
b 0.481
ab 0.019 < 0.01
ADFI, kg 0.861b 0.864
b 0.906
ab 1.008
a 0.044 0.08
G:F 0.614a 0.460
b 0.480
b 0.480
b 0.019 < 0.01
Final BW, kg 16.70a 14.87
c 15.68
b 16.13
ab 0.66 < 0.01
d 14 to 21

161
Table 6.6. (Cont.)
ADG, kg 0.571a 0.437
c 0.510
b 0.510
b 0.027 < 0.01
ADFI, kg 0.989 1.085 1.099 1.099 0.051 0.18
G:F 0.579a 0.432
b 0.464
b 0.464
b 0.01 < 0.01
Final BW, kg 20.71a 18.00
c 19.26
b 19.70
b 0.82 < 0.01
Overall (d 0 to 21)
ADG, kg 0.490a 0.351
c 0.418
b 0.440
b 0.018 < 0.01
ADFI, kg 0.813b 0.838
ab 0.873
ab 0.921
a 0.038 0.08
G:F 0.600a 0.442
c 0.471
bc 0.478
b 0.012 < 0.01
SID Lys:BW gain,
g/kg
16.49b 18.30
a 18.46
a 19.59
a 0.43 < 0.01
PUN,3 mg/dL 11.19
c 17.88
a 14.44
b 12.81
bc 0.70 < 0.01
a-c
Means within the same row lacking a common superscript letter are different (P < 0.05). 1Data are means of 8 observations per treatment.
2Diet 3 = diet was formulated taking into account the negative effects of heat damage on the concentration of AA; Diet 4 = diet
was formulated taking into account the negative effects of heat damage on the concentration and on the digestibility of AA. The SID
Lys level in diets was 0.99 (Diet 1), 0.81 (Diet 2), 0.87 (Diet 3), and 0.93% (Diet 4). 3PUN = plasma urea nitrogen.

162
Table 6.7. Performance of weanling pigs fed diets containing non-autoclaved or autoclaved distillers dried grains with solubles
(DDGS)1
Diets2
Non-autoclaved DDGS Autoclaved DDGS - 125°C, 60 min SEM P-value
Item Diet 1 Diet 2 Diet 3 Diet 4
d 0 to 7
Initial BW, kg 9.89 9.94 9.89 9.93 0.52 0.50
ADG, kg 0.214 0.170 0.182 0.215 0.02 0.06
ADFI, kg 0.569 0.612 0.563 0.604 0.05 0.35
G:F 0.383a 0.278
b 0.324
ab 0.363
a 0.03 0.03
Final BW, kg 11.39 11.15 11.15 11.44 0.63 0.06
d 7 to 14
ADG, kg 0.395 0.435 0.433 0.442 0.03 0.32
ADFI, kg 0.807b 0.969
a 0.945
a 1.030
a 0.07 0.02
G:F 0.490 0.454 0.466 0.433 0.02 0.21
Final BW, kg 14.16 14.19 14.18 14.54 0.77 0.23

163
Table 6.7. (Cont.)
d 14 to 21
ADG, kg 0.546 0.528 0.501 0.535 0.03 0.39
ADFI, kg 1.086 1.189 1.155 1.219 0.07 0.17
G:F 0.505 0.451 0.436 0.446 0.02 0.08
Final BW, kg 17.99 17.89 17.69 18.28 0.95 0.36
Overall (d 0 to 21)
ADG, kg 0.385 0.378 0.372 0.397 0.02 0.46
ADFI, kg 0.821b 0.923
a 0.887
ab 0.950
a 0.06 0.03
G:F 0.472a 0.413
b 0.423
b 0.422
b 0.01 0.02
SID Lys:BW gain,
g/kg
20.86 22.19 22.65 22.47 0.75 0.32
a-b Means within the same row lacking a common superscript letter are different (P < 0.05).
1Data are means of 8 observations per treatment.
2Diet 3 = diet was formulated taking into account the negative effects of heat damage on the concentration of AA; Diet 4 = diet was
formulated taking into account the negative effects of heat damage on the concentration and on the digestibility of AA.

164
GENERAL CONCLUSIONS
Heat processing during manufacture of distillers dried grains with solubles (DDGS),
canola meal, sunflower meal, and cottonseed meal is detrimental to their nutritional value
because not only the concentration, but also the digestibility of most AA is reduced.
Fiber components, such as ADF, NDF, and lignin, give some indication that a feed
ingredient has been heat-damaged, but these indications are not consistent among all ingredients
used in this research. As the degree of heat damage increased, the analyzed concentrations of
NDF in canola meal, sunflower meal, and cottonseed meal increased, but that was not the case
for DDGS. Increasing the degree of heat damage also resulted in an increase in the concentration
of ADF in DDGS, canola meal, and sunflower meal, but not in cottonseed meal. The
concentration of analyzed lignin was also affected by heat damage, in which the greater the
degree of heat damage, the greater the concentration of lignin in the feed ingredients evaluated.
The concentration of calculated reactive Lys using the furosine procedure also provides
information about the degree of heat damage. In the current research, the concentration of
reactive Lys corresponded to approximately 98% of the concentration of total Lys. Regression
analyses indicated that there is a good correlation between the concentration of standardized ileal
digestible Lys and the concentration of reactive Lys. Equations developed in these experiments,
however, need further validation using different sources of DDGS, canola meal, sunflower meal,
and cottonseed meal. Alternatively, the Lys:CP ratio gives a good indication that a feed
ingredient has been heat-damaged, and this was consistent among all feed ingredients evaluated
in this research. Thus, it appears that the protein quality of DDGS, canola meal, sunflower meal,
and cottonseed meal can be determined by the Lys:CP ratio.

165
Among all AA, the digestibility of Lys was the most negatively affected by heat damage
in DDGS, canola meal, sunflower meal, and cottonseed meal. Heat damage also decreased the
digestibility of all AA for all feed ingredients evaluated in this research, although this reduction
was in some cases, linear, and in others, quadratic.
Performance of weanling pigs fed heat-damaged soybean meal or DDGS was reduced
compared with pigs that were feed non-heat- damaged soybean meal or DDGS. If the
concentration of standardized ileal digestible AA in diets containing heat-damaged soybean meal
or DDGS is adjusted by supplementation of with crystalline AA, performance of weaned pigs
may be partially ameliorated.
In conclusion, this research indicates that the chemical composition of feed ingredients is
affected by heat damage, but the Lys:CP ratio was the parameter that showed more consistent
changes among the feed ingredients evaluated. Thus, determination of Lys:CP ratio is
recommended to identify heat-damaged feed ingredients. If heat-damaged feed ingredients are
used in diets for weaned pigs, it is necessary to adjust the concentrations of standardized ileal
digestible AA in the formulation, by supplementing crystalline AA, to compensate for the losses
in the concentrations and digestibility of AA.