Embed Size (px)
Citation preview
EFFECTS OF THE AGAT, AGANA, AND NORTHERN DISTRICT
WASTEWATER EFFLUENTS
ON
RECEIVING WATER QUALITY (CHEMISTRY and BACTERIOLOGY)
THE EFFECTS OF THE AGAT EFFLUENT ON
SUCCESS OF SEA URCHIN EGG FERTILIZATION
BY
ERNEST A. MATSON
DEPARTMENT OF NATURAL SCIENCES
AND
MARINE LABORATORY
THE UNIVERSITY OF GUAM
Marine Laboratory Technical Report No. 93
April 1990

DISCLAIMER
The conclusions and opinions expressed here are solely those of the author and do not represent any official position of The Government of Guam, The University of Guam, its Marine Laboratory, or the Public utilities Agency of Guam or the Government of Guam EPA. Methods and procedures described herein were used in accordance with u.s. E. P. A. regulations, or by prior agreement with them and PUAG. Names of products used do not constitute endorsement.
ii

ACKNOWLEDGEMENTS
Research reported here was supported by a contract from the Public Utilities Agency Of Guam to the University of Guam Marine Laboratory. Other support was provided by the University of Guam Department of Natural Sciences, Water and Energy Research Institute, and Marine Laboratory. I thank Serge Quenga for performing the studies of toxicity of the Agat effluent, and of the Nand C contents of selected biological materials. I also thank Sharon Britos, Rick Wood, Butch Irish, and Mark Rogers for assistance in the field and laboratory. Butch Irish and Serge Quenga are to be especially thanked for assistance while diving in sewage. Serge Quenga also helped write the sections on effluent toxicology and Nand C contents of the biota.
iii

ABSTRACT
The three largest wastewater effluents on Guam were analyzed for fecal coliform bacteria (monthly at shoreline stations only) and quarterly at both shoreline and offshore sites for selected water quality parameters (including pH, salinity, temperature, oxygen, turbidity, nitrates and phosphates, and fecal coliforms). Also, the Agat effluent was tested quarterly for its affect on the success of sea urchin egg fertilization. In addition, the nitrogen content of algae and the feces of bottom feeders was analyzed to detect a change due to proximity to the effluents at Agat and the Northern District.
The effluents have little if any detectable affect on water quality except in the immediate vicinity of the boil (where the effluent appears on the water surface, degasses and disperses). Of all water quality parameters measured, only fecal coliform bacteria and reactive phosphate are detectable in the receiving waters once the effluent has been diluted to full-strength seawater. Of these, fecal bacteria persist detectably farther away and for longer periods than phosphate. The actual distance towards shore at which they can be detected is difficult to estimate due to possible additional contribution of these bacteria from runoff.
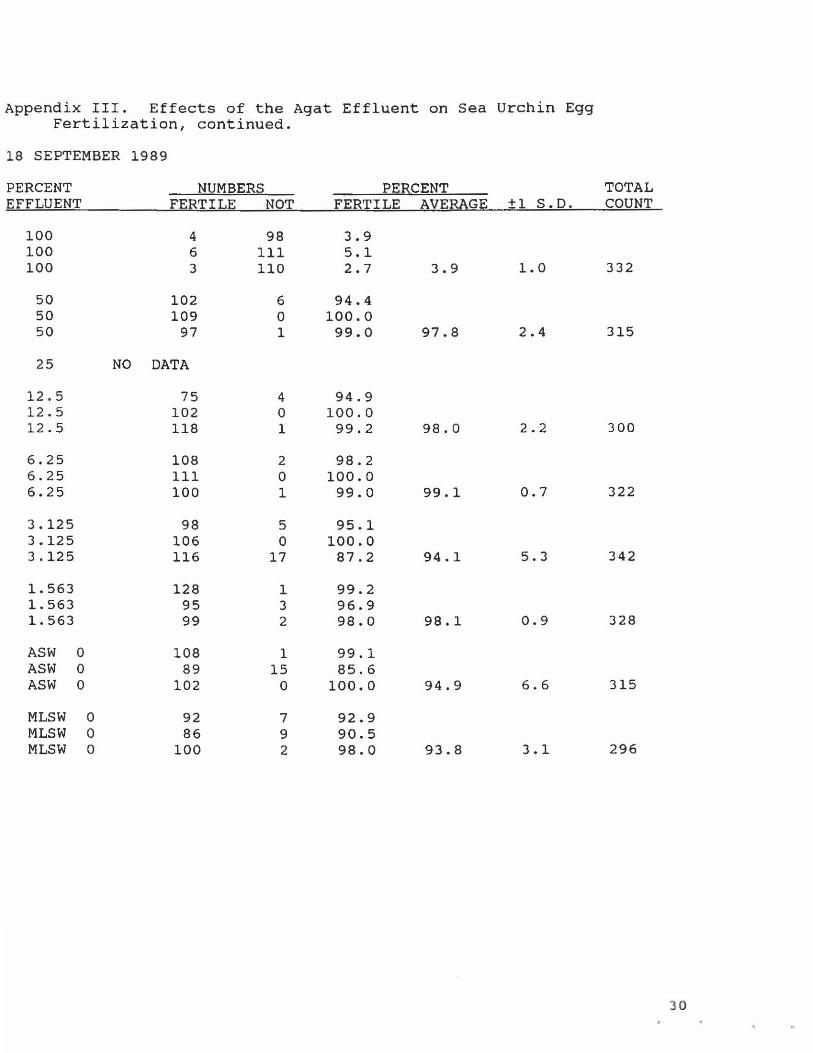
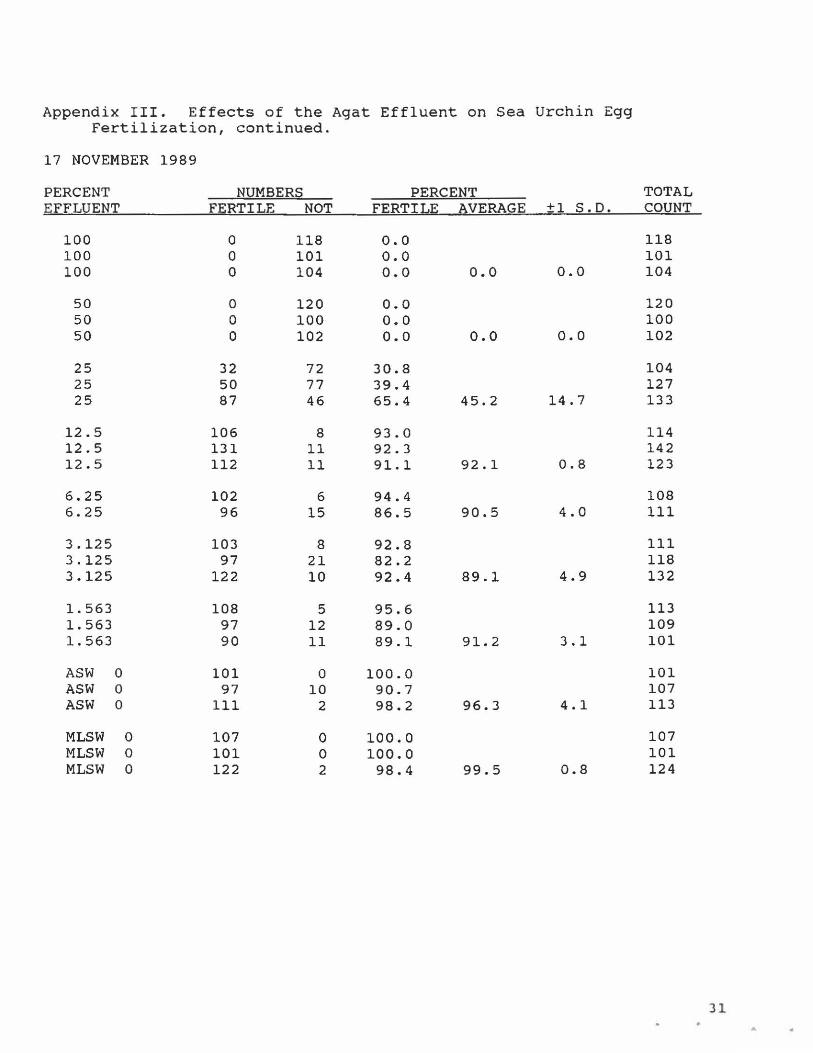
The Agat effluent inhibits sea urchin egg fertilization at a concentration equal to or greater than 12.5 % effluent in artificial seawater. Below this percentage, effects are indistinguishable from normal variation. At concentrations greater than 50 %, the effluent generally inhibits fertilization completely.
The effluents at Agat and Northern District have no detectable affect on the organic N content of two algae or the feces of the holothurian (sea cucumber) Holothuria atra.
The lack of chlorination of the three effluents studied serves to (1) allow fecal coliforms to survive for extended periods away from the point of discharge, (2) provide a good mechanism to track the effluent, and (3) probably contaminate some shoreline waters during the ebb or during uncommon surface wind conditions. It is recommended that PUAG establish and maintain primary sewage treatment only (the treatment level here on Guam does not matter), add effective chlorinators, and discharge the effluents in at least 200 feet of water.
i v

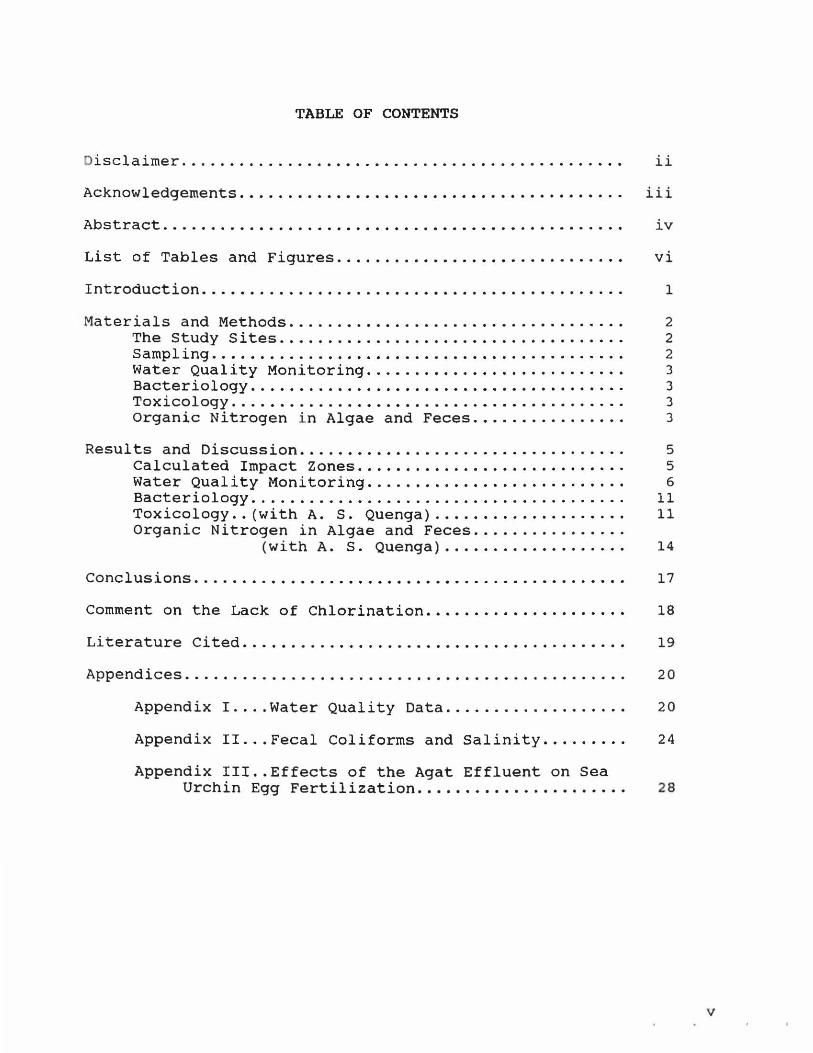
TABLE OF CONTENTS
Disclaimer. . . . . . . . . . . . . . . . . . . . . . . . . . . . . . . . . . . . . . . . . . . . . . ii
Acknowledgements. . . . . . . . . . . • . . . . . . . . . . . . . . . . . . . . . . . . . . . . iii
Abstract.............. . ................................. iv
List of Tables and Figures.............................. vi
Introduction. . . . . . . . . . . . . . . . . . . . . . . • . . . . . . . . . . . . . . . . . . . . 1
Materials and Methods.... . . . . . . . . . . . . . . . . . . . . . . . . . . . . . . . 2 The study sites.................................... 2 Samp1 ing. . . . . . . . . . . . . . . . . . . . . . . . . . . . . . . . . . . . . . . . . . . 2 Water Quality Monitoring........................... 3 Bacteriology. . . . . • . . . . . . . . . . . . . . . . . . . . . . . . . . . . . . . . . 3 Toxicology. . . . . . . . . . . . . . . . . . . . . . . . . . . . . . . . . . . . . . . . . 3 Organic Nitrogen i n Algae and Feces................ 3
Resul ts and Discussion.................................. 5 Calculated Impact Zones............................ 5 Water Quality Monitoring........................... 6 Bacteriology. . . . . . . . . . . . . . . . . . . . . . . . . . . . . . . . . . . . . . . 11 Toxicology .. (with A. S. Quenga).................... 11 Organic Nitrogen in Algae and Feces ............... .
(with A. S. Quenga)................ . .. 14
Conclusions. . . . . . . . . . . . . . . . . . . . . . . . . . . . . . . . . . . . . . . . . . . . . 17
Comment on the Lack of Chlorination..................... 18
Literature Cited...... .. ................................ 19
Appendices. . . . . . . . . . . . . . . . . . . . . . . . . . . . . . . . . . . . . . . . . . . . . . 20
Appendix I .... Water Quality Data................... 20
Appendix II ... Fecal Coliforms and Salinity......... 24
Appendix III .. Effects of the Agat Effluent on Sea Urchin Egg Fertilization...................... 28
v

LIST OF TABLES AND FIGURES
Table 1. Calculated impact zones, dissipation areas, and distances (diameter) for complete dilution of maximum allowable daily flow..... . ................. 6
Table 2. Summary of linear regression results between paired average water quality data.................. 9
Table 3. Cumulative two, five, and ten day rainfall recorded at Naval Air Station, Agana, prior to each sampling of the Agat effluent for toxicity studies. . . . . . . . . . . . . . . . . . . . . . . . . . . . . . . . . . . . . . . . . . . . 14
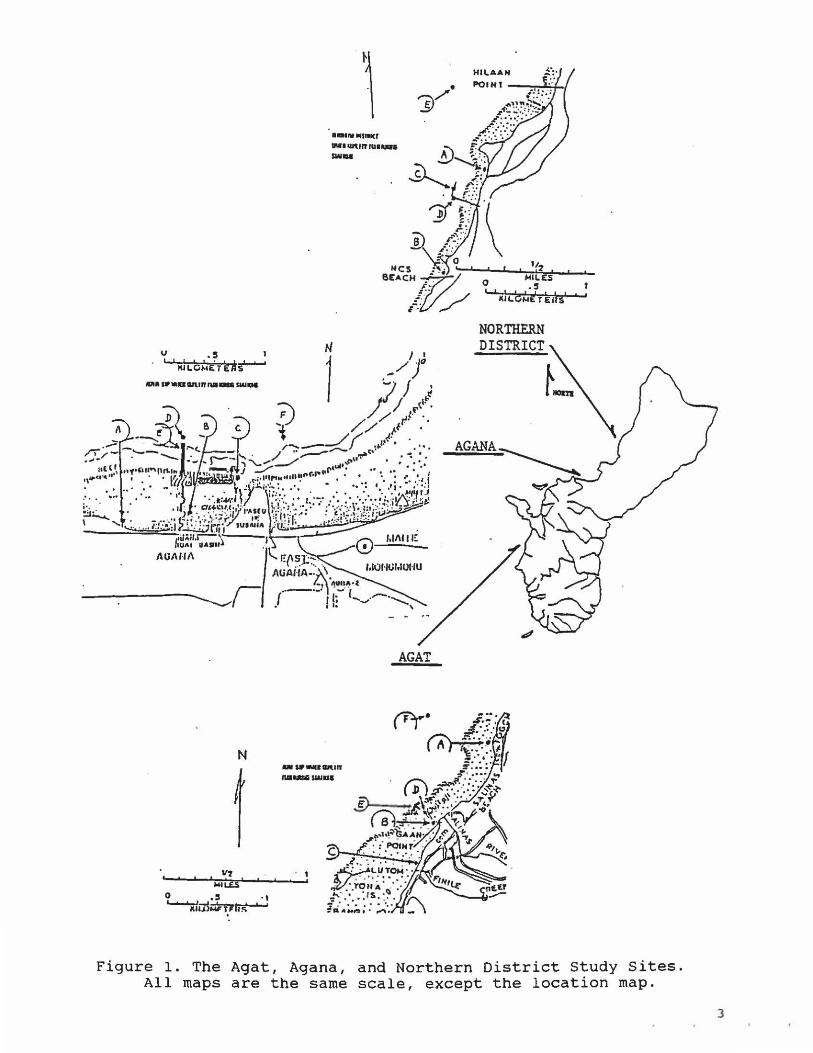
Figure 1. The Agat, Agana, and Northern District Study Sites................ . ...................... 3
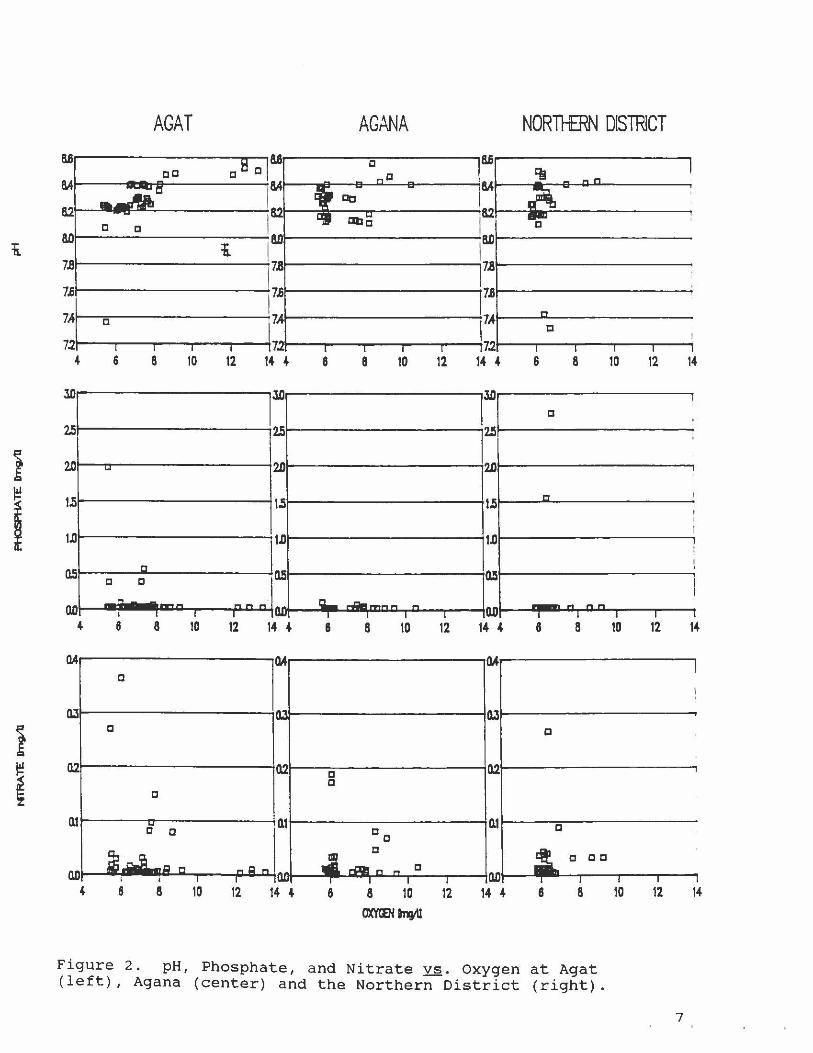
Figure 2 . pH, Phosphate, and Nitrate vs . oxygen at Agat (left), Agana (center) and the Northern District (right). . ...................... . ......... 7
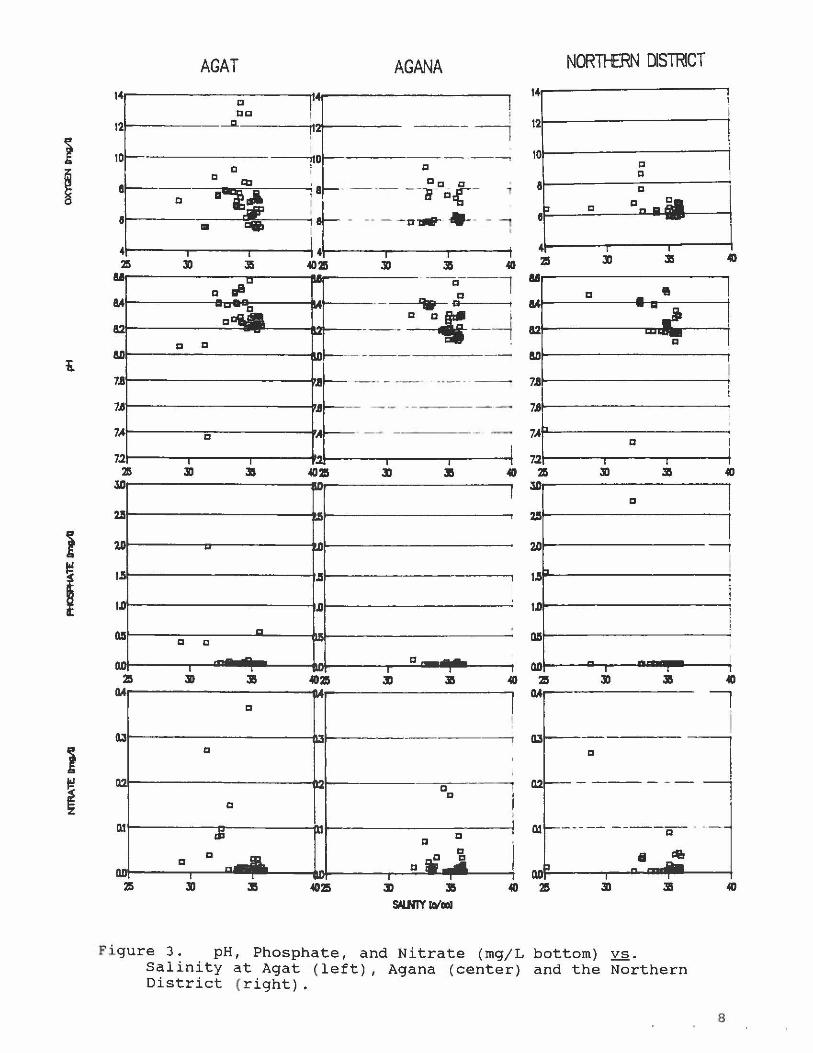
Figure 3. pH, Phosphate, and Nitrate (mgjL bottom) vs. Salinity at Agat (left), Agana (center) and the Northern District (right)..................... 8
Figure 4. Phosphate vs. pH..... . ....................... 10
Figure 5. Phosphate vs. Salinity....................... 10
Figure 6. Fecal coliforms (10g10) vs. Salinity (a), pH (b), and Phosphates (c)........................ 12
Figure 7. I ndividual toxicity assay results (a, left) and averages and standard deviations (b, right)... 1 3
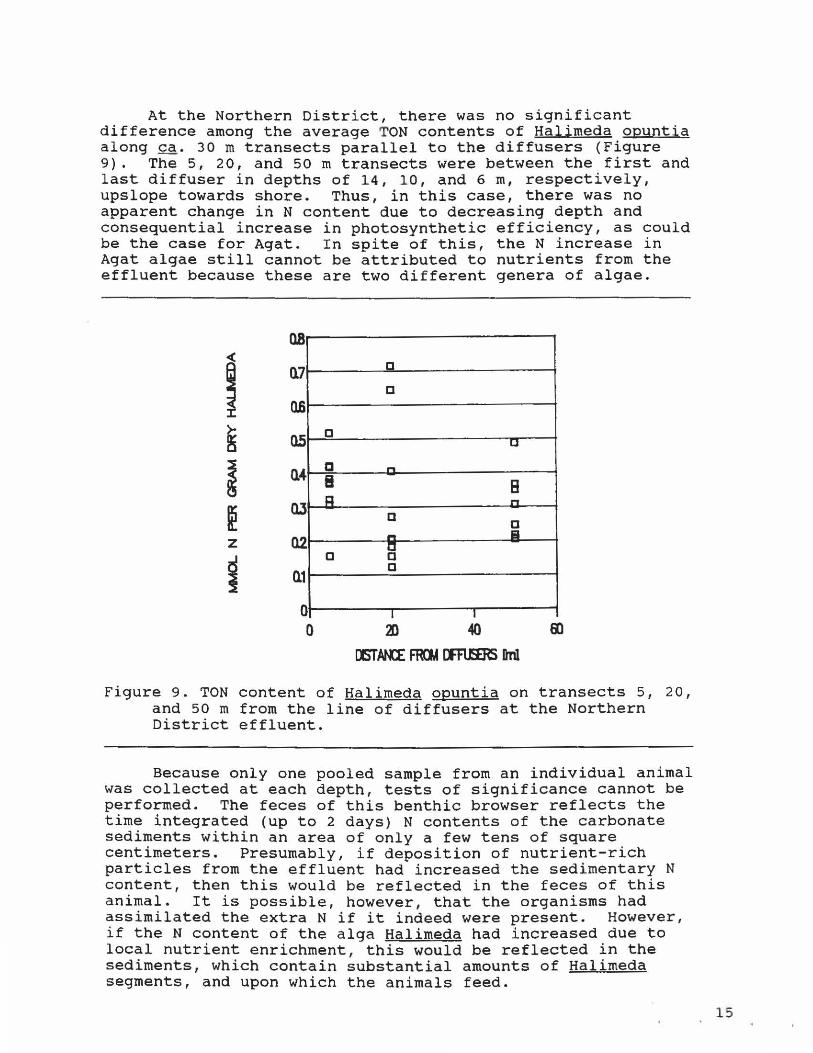
Figure 8. TON (left) and Toe (right) contents of Galaxaura marginata on transects 75 and 100 m from the effluent at Agat......................... 14
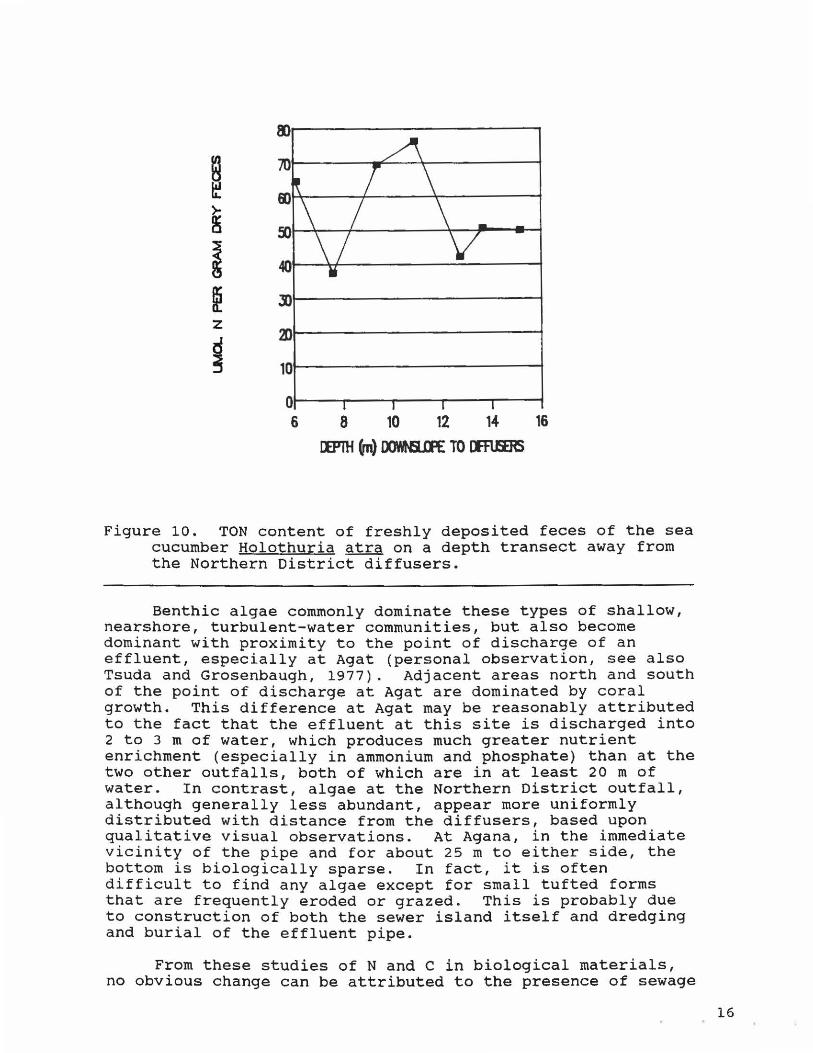
Figure 9. TON content of Halimeda opuntia on transects 5, 20 , and 50 m from the line of diffusers at the Northern District effluent....................... 15
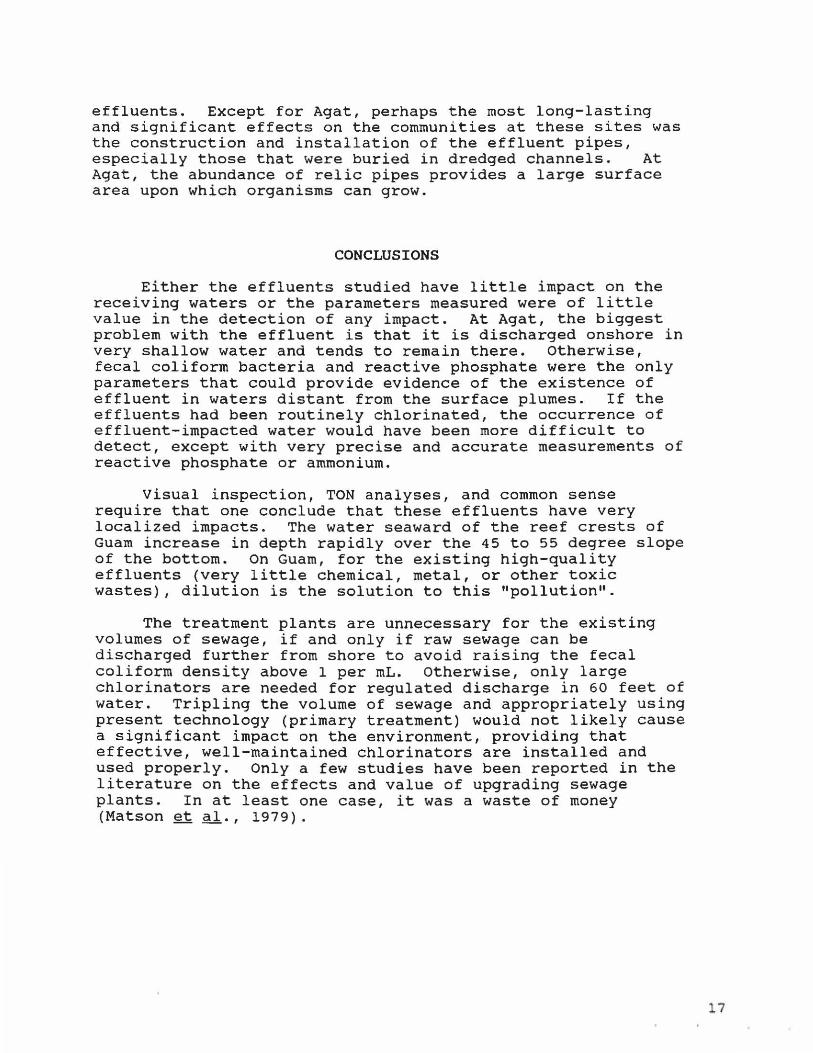
Figure 10. TON content of freshly deposited feces of the sea cucumber Holothuria atra on a depth transect away from the Northern District diffusers......................................... 16
vi

INTRODUCTION
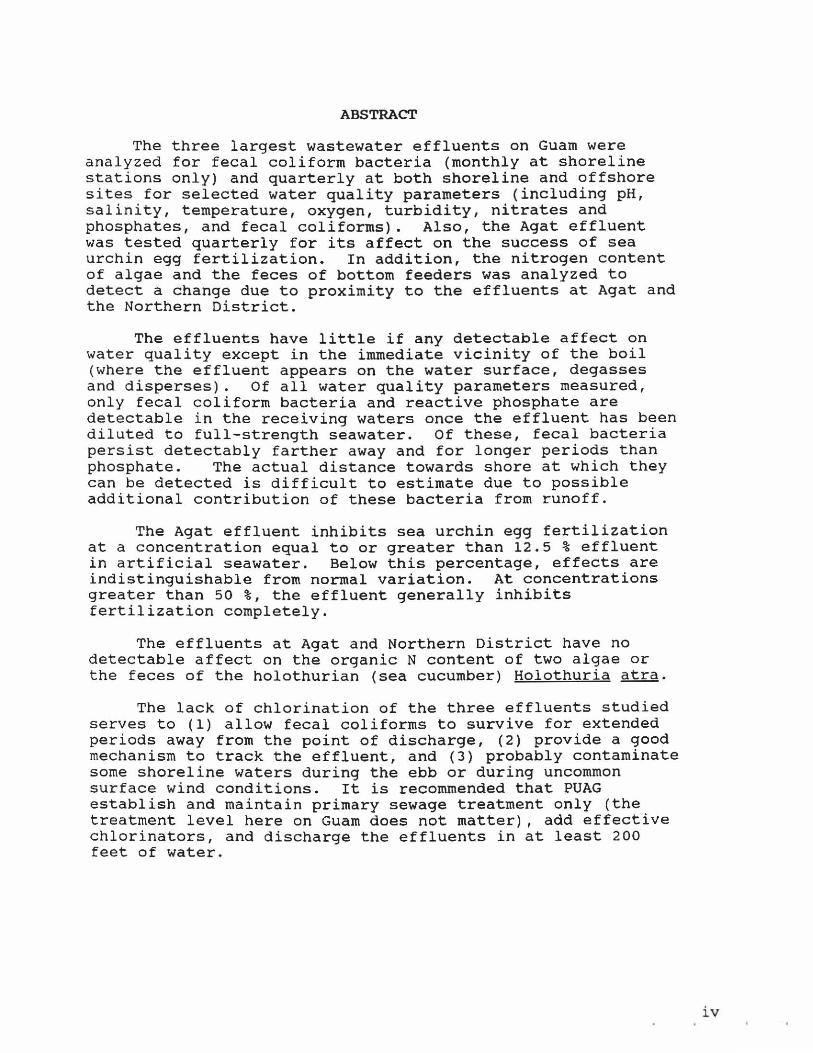
Several wastewater effluents are discharged in the leeward coastal zone of Guam either in or near the borders of the fringing reef (Figure 1). The Agat effluent is discharged ca. 2 to 3 m from shore on Gaan Point, the Agana effluent in ca. 28 m and the Northern District effluent in ca. 20 m.
Regardless of the relative volumes of the discharge and of the receiving waters, an effluent will have some impact on the receiving waters. The impact may be relatively harmless or harmful, but will be measurable at some level of resolution. It was our initial task to determine the detection level at stations that were determined and assigned by the U. S. Environmental Protection Agency (USEPA). Therefore, several initial studies were performed in November and December 1988 and January 1989 to determine the distribution of the effluents within the coastal waters, their content, residence time, and dilution rate. Studies were performed using fluorescein (recorded on videotape with SCUBA) and ammonium analysis (perhaps the most concentrated and persistent of the contents of the effluents). The results of these studies are not reported here, but are available on request in writing at the University of Guam Marine Laboratory. The results were used to determine relative volumes necessary and precision levels required for chemical and microbiological analysis.
The stations and the water quality and bacteriological parameters measured were determined and required by the USEPA and Guam E.P.A. (GEPA). Biological occurrences at these sites, regardless of the presence of an effluent, are directly or indirectly affected by time of day, i.e., the sun's elevation. Fecal coliform bacteria are known to be killed or inactivated by high levels of UV light, although photoreactivation is also common. Nutrient levels, such as nitrate and phosphate are affected by photosynthesis, which simultaneously increases both the pH and 02 content of the waters. Therefore, all samples were taken from all stations between 11 and 13:30 local time, regardless of tide, sea state or cloud cover. Periods of heavy surf often precluded boat trips (especially for about 7 weeks in the Fall of 1989) . Also, trips were postponed if heavy rain occurred within 3 days of scheduled sampling trips. Sampling commenced February 1989 and continued for one year.
Additional work is also reported here, including studies of the organic N content of algae in the vicinity of both the Agat and Northern District effluents and in the feces of sea cucumbers at the Northern District. These studies were performed because evidence of N enrichment would indicate a real and potentially harmful effect of the effluent that would be otherwise undetectable by the required analyses.
1

MATERIALS AND METHODS
The study sites
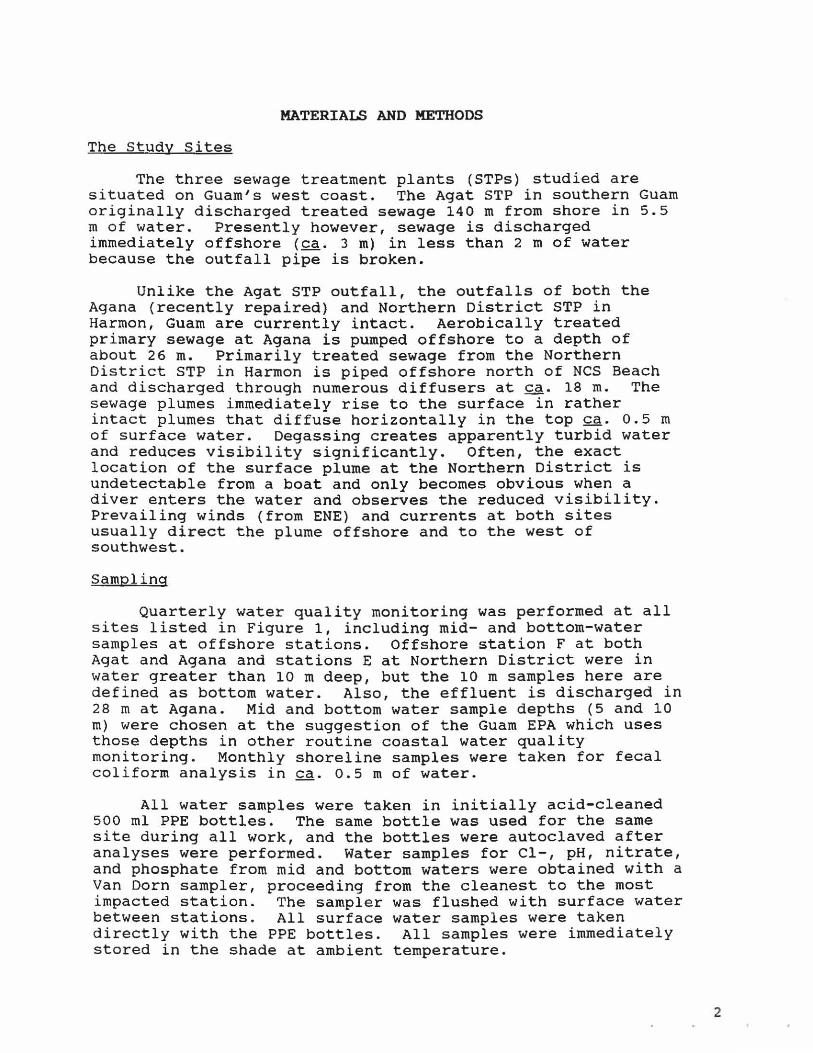
The three sewage treatment plants (STPs) studied are situated on Guam's west coast. The Agat STP in southern Guam originally discharged treated sewage 140 m from shore in 5.5 m of water. Presently however, sewage is discharged immediately offshore (ca. 3 m) in less than 2 m of water because the outfall pipe is broken.
Unlike the Agat STP outfall, the outfalls of both the Agana (recently repaired) and Northern District STP in Harmon, Guam are currently intact. Aerobically treated primary sewage at Agana is pumped offshore to a depth of about 26 m. Primarily treated sewage from the Northern District STP in Harmon is piped offshore north of NCS Beach and discharged through numerous diffusers at~. 18 m. The sewage plumes immediately rise to the surface in rather intact plumes that diffuse horizontally in the top ca. 0.5 m of surface water. Degassing creates apparently turbid water and reduces visibility significantly. Often, the exact location of the surface plume at the Northern District is undetectable from a boat and only becomes obvious when a diver enters the water and observes the reduced visibility. Prevailing winds (from ENE) and currents at both sites usually direct the plume offshore and to the west of southwest.
Sampling
Quarterly water quality monitoring was performed at all sites listed in Figure 1, including mid- and bottom-water samples at offshore stations. Offshore station F at both Agat and Agana and stations E at Northern District were in water greater than 10 m deep, but the 10 m samples here are defined as bottom water. Also, the effluent is discharged in 28 m at Agana. Mid and bottom water sample depths (5 and 10 m) were chosen at the suggestion of the Guam EPA which uses those depths in other routine coastal water quality monitoring. Monthly shoreline samples were taken for fecal col i form analysis in ca. 0.5 m of water.
All water samples were taken in initially acid-cleaned 500 ml PPE bottles. The same bottle was used for the same site during all work, and the bottles were autoclaved after analyses were performed. water samples for Cl-, pH, nitrate, and phosphate from mid and bottom waters were obtained with a Van Dorn sampler, proceeding from the cleanest to the most impacted station. The sampler was flushed with surface water between stations. All surface water samples were taken directly with the PPE bottles. All samples were immediately stored in the shade at ambient temperature.
2

v .5 J
~ILbMit' TkRr--
N
'1 '''''''''IIIK' .. • ... ,"RI .... ....
.UPWUutl" 1Ul1allGu.u_
-:y/
AGAT
•
NORTHERN DISTRICT
Figure 1. The Agat, Agana, All maps are the same
and Northern District study sites. scale, except the location map.
J

Water Ouality Monitoring
Salinity, oxygen, and temperature were measured directly in the field with Yellow Springs Instrument Co. Meters. Salinity was also computed from Cl- measured on a HaakeBuchler Chloridometer (+/- 0.9% relative precision). All salinity data (0/00) reported here were calculated from Salinity = [Cl-/550)*35, where Cl- is measured in mmol kg- 1 . Oxygen meters were calibrated at the lab with oxygen saturated freshwater and checked in the field in air with a wet probe. pH meters were calibrated each time with standard buffers (pH 6.9 and 9.08). Nitrate was analyzed by cadmium reduction (Jones/ 1984) and phosphate by molybdate (Parsons et al., 1984). No samples were filtered for nutrient analysis because of the strong chance of contamination of these nutrient poor waters by the filters. Samples for Cl-, nitrate, and phosphate were refrigerated and performed within 48 hours. Secchi depth was recorded vertically and horizontally underwater with a 0.5 m diameter disc. Later, in the fourth quarter, NTU was measured with a Hach Turbidimeter.
Bacteriology
Fecal coliform bacteria were quantified in duplicate according to APHA et al. (1985) on Difco Bacto mFc broth. Fecal coliforms and pH were always measured immediately upon return to the laboratory and analyses were completed by 18:00 that day.
Toxicology
The potential toxicity of the Agat effluent was measured by incremental serial dilution of raw/ freshly collected effluent made up to full strength seawater using aquarium salts. Sea urchins were collected from the piti reef flat behind the usa and kept at the Marine Laboratory in a flowthrough sea water system. Sperm and eggs were freshly collected using injections of MgC12, kept on icewater, diluted and counted according to the protocol of Horning et al., 1987 (EPA-600/4-87/028). Appropriate dilutions were then suspended in serially halved concentrations of Agat effluent. Two controls were used, both unfiltered Marine Laboratory seawater (MLSW) from the flow-through system and artificial seawater (ASW) made with commercially obtained aquarium salts. The fertilized eggs were counted in a homemade Petrov-Houser cellon a Optiphot phase contrast microscope.
Organic Nitrogen in Algae and Feces
The N content of algae and feces was performed as follows. At Agat, samples of the red alga, Galaxaura marginata, were collected along two transects parallel to
4

shore ca. 75 and 100 m offshore in ca. 3 and 6 m of water, respectively. At the Northern District, samples of the calcareous green alga, Halimeda opuntia, were collected along transects parallel to the diffusers at depths of ca. 14 m, 10 m, and 6 m and at distances of ca. 5, 20, and 50 m respectively from the diffusers. All algal samples were collected from clumps attached to the substratum and placed in Whirl-Pak bags. Additionally, at the Northern District STP outfall, sea cucumber (Holothuria atra) feces were collected along a transect perpendicular to the diffuser pipe at decreasing depth (toward shore). Samples of freshly deposited fecal pellets were gathered from directly behind the animals and placed in Whirl-Pak bags. All samples were collected during June 1989 using SCUBA.
All samples were then dried to constant weight, homogenized in a pestle, and stored for subsequent Nand C analysis. Water content of algal samples was determined by weighing subsamples before and after drying at 50 C. Total organic nitrogen (TON) content was determined with a Carlo Erba Model 1500 NCS elemental analyzer. Total organic carbon (TOC) content of the Agat ~. marginata samples was also measured.
RESULTS AND DISCUSSION
Calculated Impact Zones
Table 1 contains the calculated impact and dilution zones as well as the diameter of a circle required to dilute the effluent to levels undetectable with salinity measurements. This is done for each of the three effluents based on their maximum allowable daily flows, not their actual flows. It should be noted that both the Agat and Agana STPs frequently meet these limits (1.5 and 12 MGD, respectively) especially during heavy rain, while the Northern District STP at present discharges about a third of the 6 MGD allowed.
First, the immediate impact area (ha) is the area of water occupied by only the effluent that is 1 m deep after 1 day of effluent discharge. This depth is approximately that observed in the field when the subsurface effluent boils to the surface and dissipates. The effluent water is both lighter and contains (now) supersaturated gases, especially 02 and C02 (at pH ca. 7.4), in the salt water in which it dissipates. Parcels of effluent float within these surface waters until thorough mixing occurs and the effluent is no longer distinguishable using CI- content. This is the second statistic, and is defined at that area (ha) of water 1 m deep that is required to dilute the effluent to full strength seawater. The calculation is based on an assumed effluent salinity of 0.32 0/00 (5 roM CI-). The diameter of this dilution zone is given as though the zone were a perfect
5

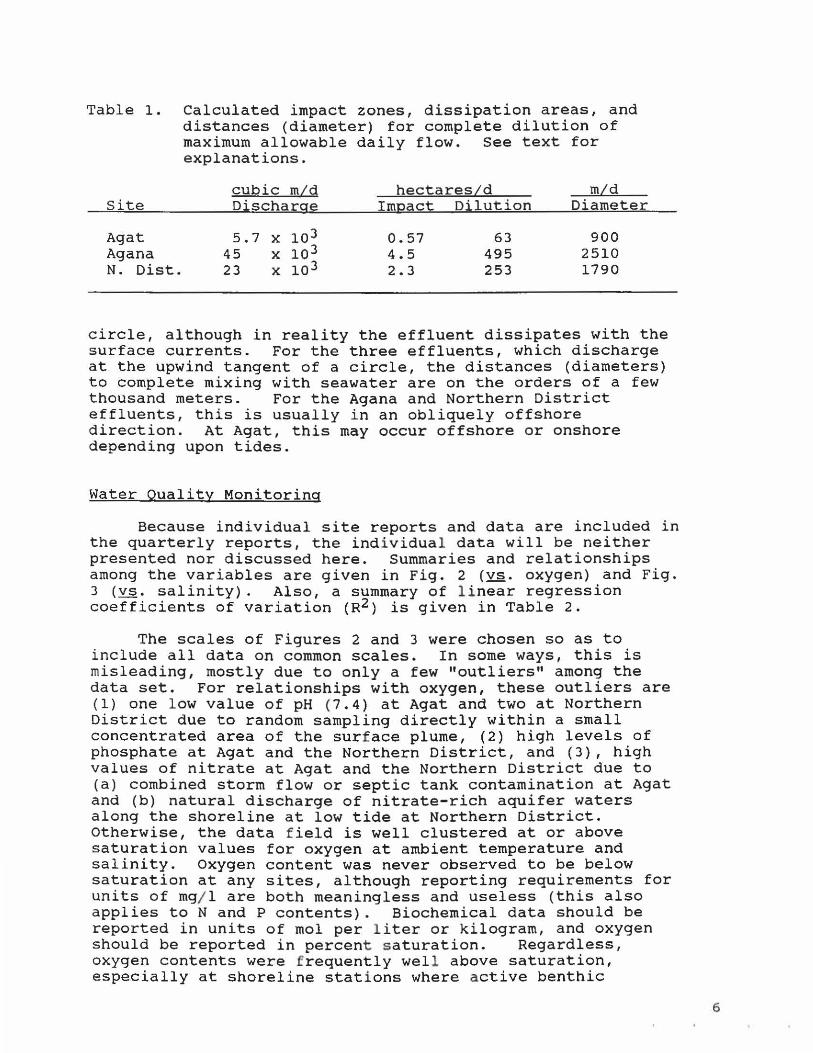
Table 1. Calculated impact zones, dissipation areas, and distances (diameter) for complete dilution of maximum allowable daily flow. See text for explanations.
cubic mLg hectaresLd mLd Site Discharge Impact Dilution Diameter
Agat 5.7 x 10 3 0.57 63 900 Agana 45 x 10 3 4.5 495 2510 N. Dist. 23 x 10 3 2.3 253 1790
circle, although in reality the effluent dissipates with the surface currents. For the three effluents, which discharge at the upwind tangent of a circle, the distances (diameters) to complete mixing with seawater are on the orders of a few thousand meters. For the Agana and Northern District effluents, this is usually in an obliquely offshore direction . At Agat , this may occur offshore or onshore depending upon tides.
Water Quality Monitoring
Because individual site reports and data are included in the quarterly reports, the ind i vidua l data will be neither presented nor discussed here. Summaries and relationships among the variables are given in Fig. 2 (Ye. oxygen) and Fig. 3 (vs. salinity). Also, a summary of linear regression coefficients of variation (R2) is given in Table 2.
The scales of Figures 2 and 3 were chosen so as to include all data on common scales. In some ways, this is misleading, mostly due to only a few "outliers" among the data set . For relationships with oxygen, these outliers are (1) one low value of pH (7.4) at Agat and two at Northern District due to random sampling directly within a small concentrated area of the surf ace plume, (2) high levels of phosphate at Agat and the Northern District, and (3), high values of nitrate at Agat and the Northern District due to (a) combined storm flow or septic tank contamination at Agat and (b) natural discharge of nitrate-rich aquifer waters along the shoreline at low tide at Northern District. otherwise, the data f ield is well clustered at or above saturation values for oxygen at ambient temperature and salinity . Oxygen content was never observed to be below saturation at any sites, although reporting requirements for units of mgj l are both meaningless and useless (this also a pplies to Nand P contents) . Biochemical data should be reported in units of mol per l iter or kilogram, and oxygen should be reported in percent s aturation. Regardless, oxygen contents were f requently wel l above saturation, especially at shoreline stat i ons where a ctive benthic
6

AGAT Mi~--------------~~M
DC C C
M'~-----~------~~IM
8.2 " " 18.2 ~ I~
7.8 ( .8
n In
::1 " t t ttl:: 4 6 8 10 12 14 4
2.D
~
n
00 4
ru
00 4
" " " , I
6 8
"
"
c
C "
~ ~ -" n , , 6 8
I
10
, 10
~
n
---" 00 14 4
r 12
M
~
~
0.1
, " , ... 12 14 4
AGANA
" n" ~ ,ee '!II atlc
, , 6 8 10 12
1;1. .-, , , , 6 8 10 12
" "
"" ..I dQI "" _ " , I I ,
6 8 10 12
0XYlElI~
I I I I
NORThERN DISTRICT
" ~I~-------------------
nl~------------------
n~--------------~
-M~--~-------------D
n~--r-,--r---r-,--r-,~ 14 4 6 8 10 12 14
::~I-----"---------------WI~--------------~
1 ~~--~----------~
1 n~--------------~
M~--------------~
oo~~---~~-~,~-~-r-,--r-r--'I
14 4 6 8 10 12 14
M:~------------~I
~~-----------------D
~,~-----------------
ru~----,,~------------
S. C CD
OOI~~T~L-~I--~'--~~1 14468101214
Figure 2. pH, Phosphate, and Nitrate vs. Oxygen at Agat (left), Agana (center) and the Northern District (right).
7

AGAT
D rJiU
... ~ 0 0
,.
b
:Ill :m :Ii ~:IlI 3D
2.11
2.D
1J5 J5
1.0 .0
IIlI n
0 0
, JI
11.4 0
OJ 0
112
0
II! III
0 0
" ... JI
AG~A NORTI-£RN DISTRICT
--D-~l
.. aO
o O~ i ,. ---1 -
4
2
0
a
6
4
III
M
0
0
l 0 I D
0
o B~
.-JI
@ l '.i I '-: 1
-- _. - .-- - .. _- 0- :II
112
au
l
l
l
l
- ---
:is
,
I --- - -- - - :II
:is
0 , JI
0 0
0 0
0
o ~....i
, -- 14
J --, 0 I
::z , , , ~ :Ill
3D1r-----
o------.
1
:~--------~ i 1J5~-----------j
I I.D~--------___l
I 1IlI,~--------------~
1IlI1~~~~m.~--~ ~ :Ill JI ~
1 ----,
, , I , I : -,
I ,
11.4.---------- I I
OJil----·------ ------; o
112~ - --- - - - --
II!~----- ----g- .. _-
, ~ :Ill 3D JI
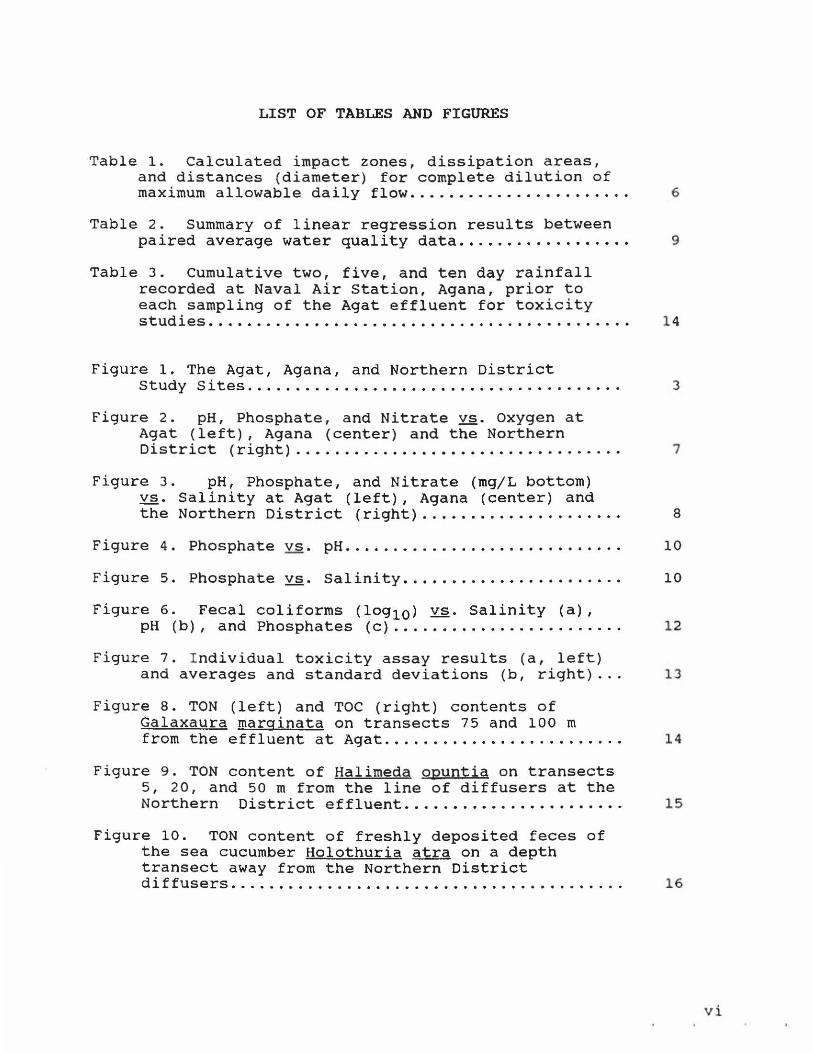
Figure 3. pH, Phosphate, and Nitrate (mg/L bottom) vs. Salinity at Agat ( left), Agana (center) and the Northern District ( right).
8

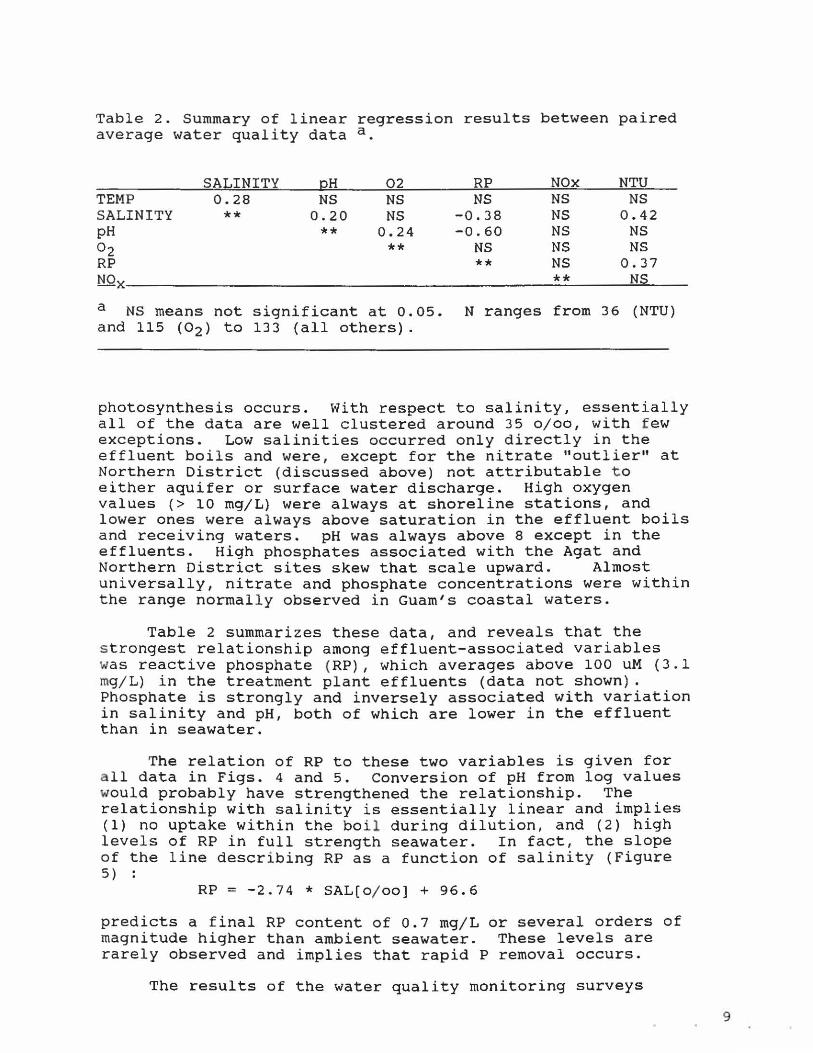
Table 2. Summary of linear regression results between paired average water quality data a
SALINITY gH 02 RP NOx NTU TEMP 0.28 NS NS NS NS NS SALINITY ** 0.20 NS -0.38 NS 0.42 pH ** 0.24 -0.60 NS NS
°2 ** NS NS NS RP ** NS 0.37 NO X ** NS
a NS means not significant at 0.05. N ranges from 36 (NTU) and 115 (°2) to 133 (all others) .
photosynthesis occurs. With respect to salinity, essentially all of the data are well clustered around 35 0/00, with f ew exceptions. Low salinities occurred only directly in the effluent boils and were, except for the nitrate "outlier" at Northern District (discussed above) not attributable t o either aquifer or surface water discharge. High oxygen values (> 10 mg/L) were always at shoreline stations, and lower ones were always above saturation in the effluent boils and receiving waters. pH was always above 8 except in the effluents. High phosphates associated with the Agat and Northern District sites skew that scale upward. Almost universally, nitrate and phosphate concentrations were within the range normally observed in Guam's coastal waters.
Table 2 summarizes these data, and reveals that the s trongest relationship among effluent-associated variables was reactive phosphate (RP), which averages above 100 uM (3 . 1 mg/ L) in the treatment plant effluents (data not shown) . Phosphate is strongly and inversely associated with variation in salinity and pH, both of which are lower in the effluent than in seawater.
The relation of RP to these two variables is given for a ll data in Figs. 4 and 5. Conversion of pH from log values would probably have strengthened the relationship. The relationship with salinity is essentially linear and implies (1) no uptake within the boi l during dilution, and (2) high levels of RP in full strength seawater. In fact, the slope of the line describing RP as a function of salinity (Figure 5)
RP = -2.74 * SAL[O/ oo] + 96.6
predicts a final RP content of 0.7 mg/L or several orders of magnitude higher than ambient seawater. These levels are rarely observed and implies that rapid P removal occurs.
The results of the water quality monitoring surveys
9

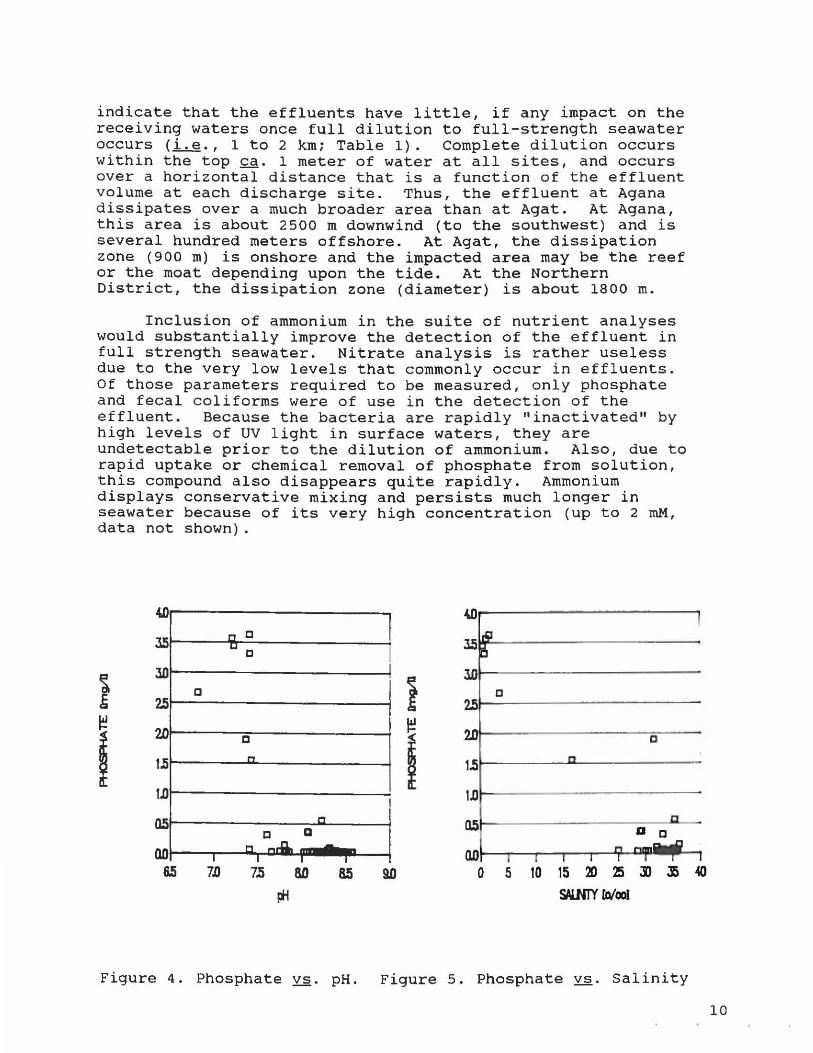
indicate that the effluents have little, if any impact on the receiving waters once full dilution to full-strength seawater occurs (i.e., 1 to 2 km; Table 1). Complete dilution occurs within the top ca. 1 meter of water at all sites, and occurs over a horizontal distance that is a function of the effluent volume at each discharge site. Thus, the effluent at Agana dissipates over a much broader area than at Agat. At Agana, this area is about 2500 m downwind (to the southwest) and is several hundred meters offshore. At Agat, the dissipation zone (900 m) is onshore and the impacted area may be the reef or the moat depending upon the tide. At the Northern District, the dissipation zone (diameter) is about 1800 m.
Inclusion of ammonium in the suite of nutrient analyses would substantially improve the detection of the effluent in full strength seawater. Nitrate analysis is rather useless due to the very low levels that commonly occur in effluents. Of those parameters required to be measured, only phosphate and fecal coliforms were of use in the detection of the effluent. Because the bacteria are rapidly "inactivated" by high levels of UV light in surface waters, they are undetectable prior to the dilution of ammonium. Also, due to rapid uptake or chemical removal of phosphate from solution, this compound also disappears quite rapidly. Ammonium displays conservative mixing and persists much longer in seawater because of its very high concentration (up to 2 roM, data not shown).
4J)
J5
3D
7.5
2D
1.5
ln
as aD
c
" c -U c
c
"
M c_.c. D
I -r
I
"
4J)
J5
3D
7.5
2D
1.5
1.0
as aD
1,IiI
~
0
0
"
" a OJ'!
n I I I . r r I I
I
I
6.5 7n 7.5 aD 85 lUI o 5 10 15 2!l 25 Jl li 40
Iii s.\lNTY lDiool
Figure 4. Phosphate ya. pH. Figure 5. Phosphate vs. Salinity
10

oxygen contents were always at or near (+/- 5 %) of saturation in all control station waters. Nearer to shore, oxygen was almost always supersaturated, regardless of the presence of the effluent. This is due to high rates of photosynthesis in shallow water and to the degassing of oxygen from turbulently mixed effluent waters of low salinity that have higher absolute oxygen levels at saturation: freshwater holds more oxygen. pH rapidly increases to ambient levels upon immediate contact of the effluent with seawater. This is probably due to the combination of rapid dilution and to the carbonate induced shift of carbon dioxide gas (at high levels in a freshwater effluent) to bicarbonate in seawater. The effluents are not known to contain acids or organic matter that would sufficiently and persistently reduce the pH. Although C02 degassing occurs at pH 7.4.
Bacteriology
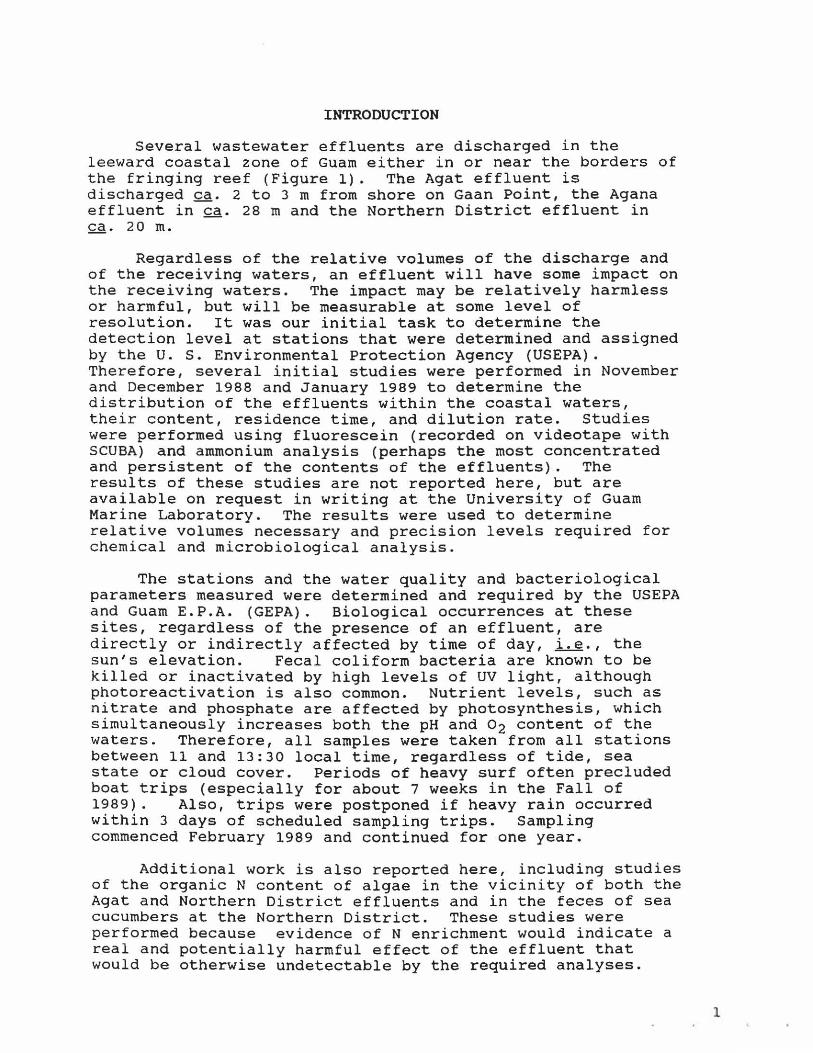
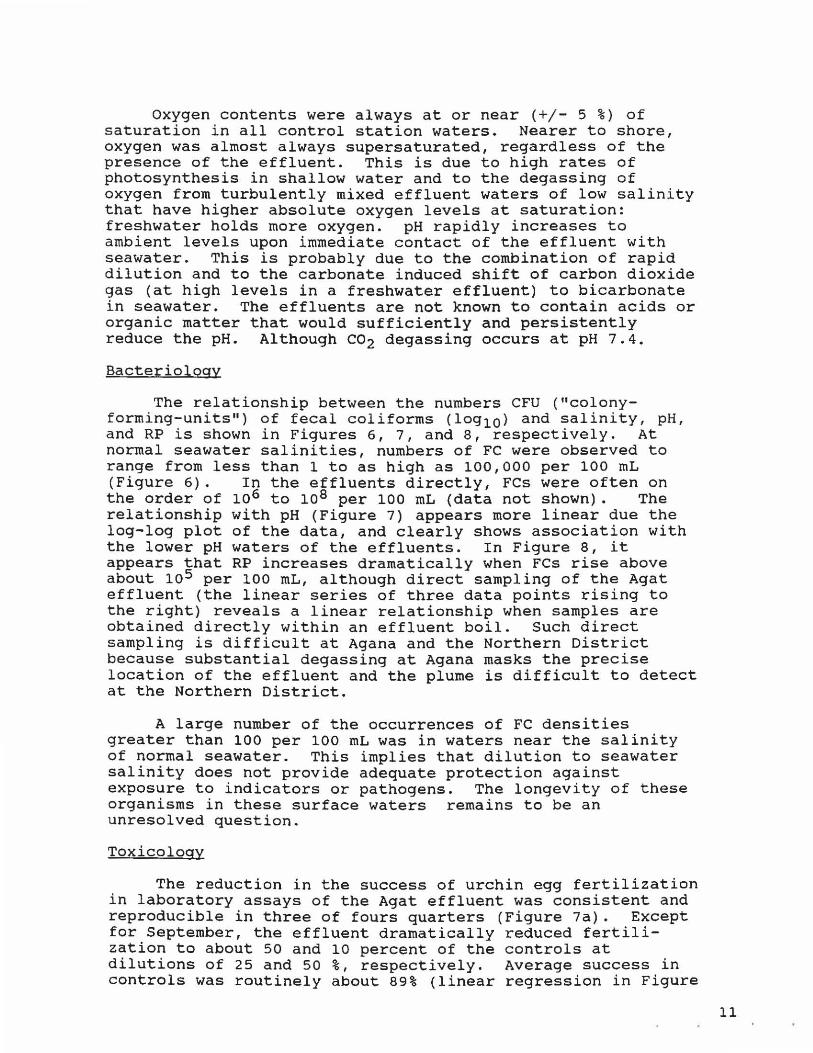
The relationship between the numbers CFU ("colonyforming-units") of fecal coliforms (log10) and salinity, pH, and RP is shown in Figures 6, 7, and 8, respectively. At normal seawater salinities, numbers of FC were observed to range from less than 1 to as high as 100,000 per 100 mL (Figure 6). In the effluents directly, FCs were often on the order of 106 to 108 per 100 mL (data not shown). The relationship with pH (Figure 7) appears more linear due the log-log plot of the data, and clearly shows association with the lower pH waters of the effluents. In Figure 8, it appears that RP increases dramatically when FCs rise above about 105 per 100 mL, although direct sampling of the Agat effluent (the linear series of three data points rising to the right) reveals a linear relationship when samples are obtained directly within an effluent boil. Such direct sampling is difficult at Agana and the Northern District because substantial degassing at Agana masks the precise location of the effluent and the plume is difficult to detect at the Northern District.
A large number of the occurrences of FC densities greater than 100 per 100 mL was in waters near the salinity of normal seawater. This implies that dilution to seawater salinity does not provide adequate protection against exposure to indicators or pathogens. The longevity of these organisms in these surface waters remains to be an unresolved question.
Toxicology
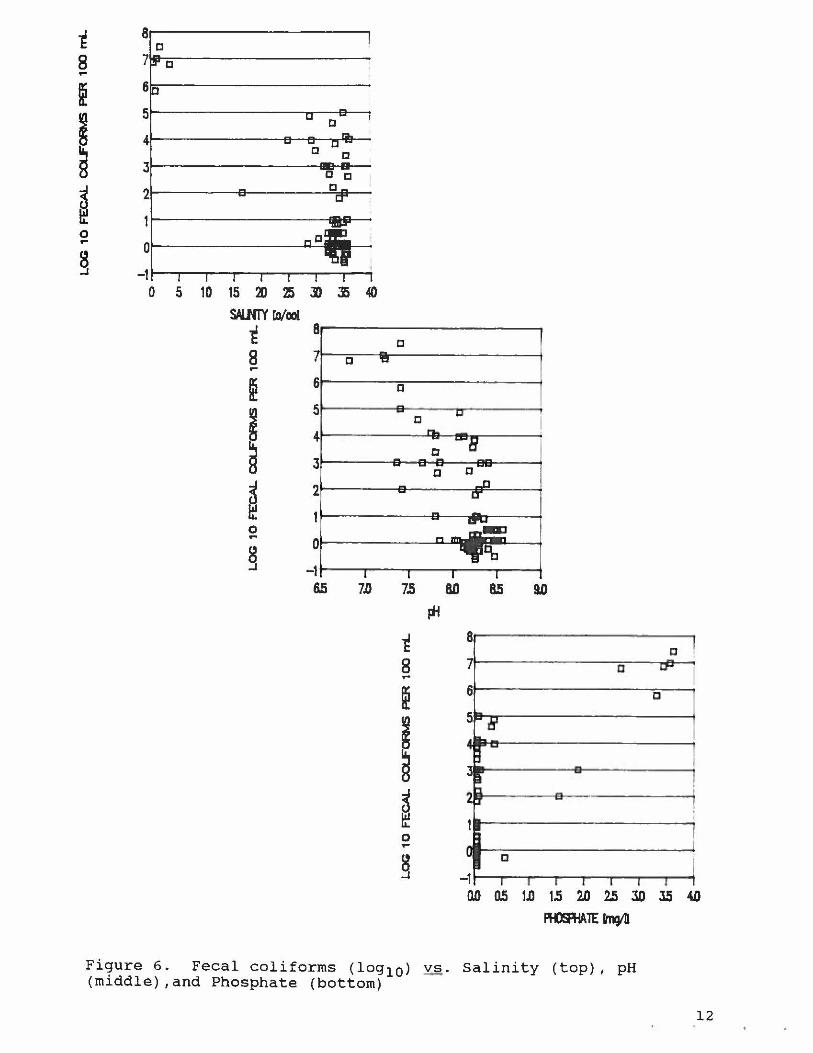
The reduction in the success of urchin egg fertilization in laboratory assays of the Agat effluent was consistent and reproducible in three of fours quarters (Figure 7a). Except for September, the effluent dramatically reduced fertilization to about 50 and 10 percent of the controls at dilutions of 25 and 50 %, respectively. Average success in controls was routinely about 89% (linear regression in Figure
11

~ 8 c
8 7 c ~
~ 6
~ 5 c 4 c c 3 c c
~ 2 c
0 c ~
0 §
-1 0 5 10 15 2D :IS II li 40
SAOOY ro/aol ~ 8 ~
~
I ~ 0 ~
§ 6.5 7!J
c
c
7!)
~ 8 ~
~
I ~ 0 ~
§
c c
aD
Iii 85 9!J
8 c -1 a t1"
6 D 1 5 it I
1 I
3~
I Ei fJ
1 ,
i c
I 1 I I I I I I r -1
no as 1!J I!) 2.D 2.5 3D :IS 40
RimiAlE~
Figure 6. Fecal coliforms (log10) Y§. Salinity (top), pH (middle) ,and Phosphate (bottom)
12

caption), regardless of the use of either Marine Lab flowthrough seawater (pumped from the reef of Pago Bay) or commercially available sea salt (Figure 7b). The High rate of success in September contributed substantially to the variance among the 50 % effluent data, and the reason for that success is possibly due to dilution of the concentration of the effluent by runoff (see below) .
The consistency of this inhibitory effect indicates that some commonly occurring component(s) of the effluent is responsible for fertilization failure. The different result in September could then be due to absence of that component, or dilution of it by increased rainfall runoff in the effluent. Early September 1989 was particularly wet, with measurable rainfall on each day from the first to the eleventh. Specifically, 136, 65, and 33 mm of rain were recorded on the 9th, lOth and 11th at the weather station at Naval Air Station, Agana. Total 11 day rainfall (1 to 11 September) was 332 mm. Thus, due to the relative lack of runoff prior to the previous sampling dates (Table 3 ), it is tempting to conclude that the effluent was relatively dilute in comparison with the other three samples. Nonetheless, treatment plant flow and characteristics should be investigated for that particular day (11 September 1989) in an attempt to identify any peculiar occurrences or lack thereof. Further, the addition of pumped septic tank wastes to the influent of the Agat plant possibly adds materials not usually found in normal sewage. According to the plant manager, several septic trucks per day empty their tanks into the sewers at the Agat facility. However, it is likely that the ordinarily high contents of normally occurring organic matter , ammonium, or detergents may be responsible for the observed reduction in urchin egg fertilization.
r:f.A LRCIi'J FER1lJZA roN
A YffiArI.. PERCENT su:crss ~-: '\
lID g) r \
Jr., \~ V"i \ . \. \ \
"q, \ \..\ \'\
\ \
\
III JO III !O
OJ
II D 0
w ............. '!
0 , , Q
"-\
\ \
\ ......... , ,
r:f.A LROi-l FERTUZA roN
RA 1E = -D.89*\ffillfNTJ+86 R2=O.97
--1m. --JJ.y ~ ___ ----l I;: I
--~.£E
-+-~
,
Figure 7. Individual toxicity assay results (left) and averages and standard deviations (right).
13

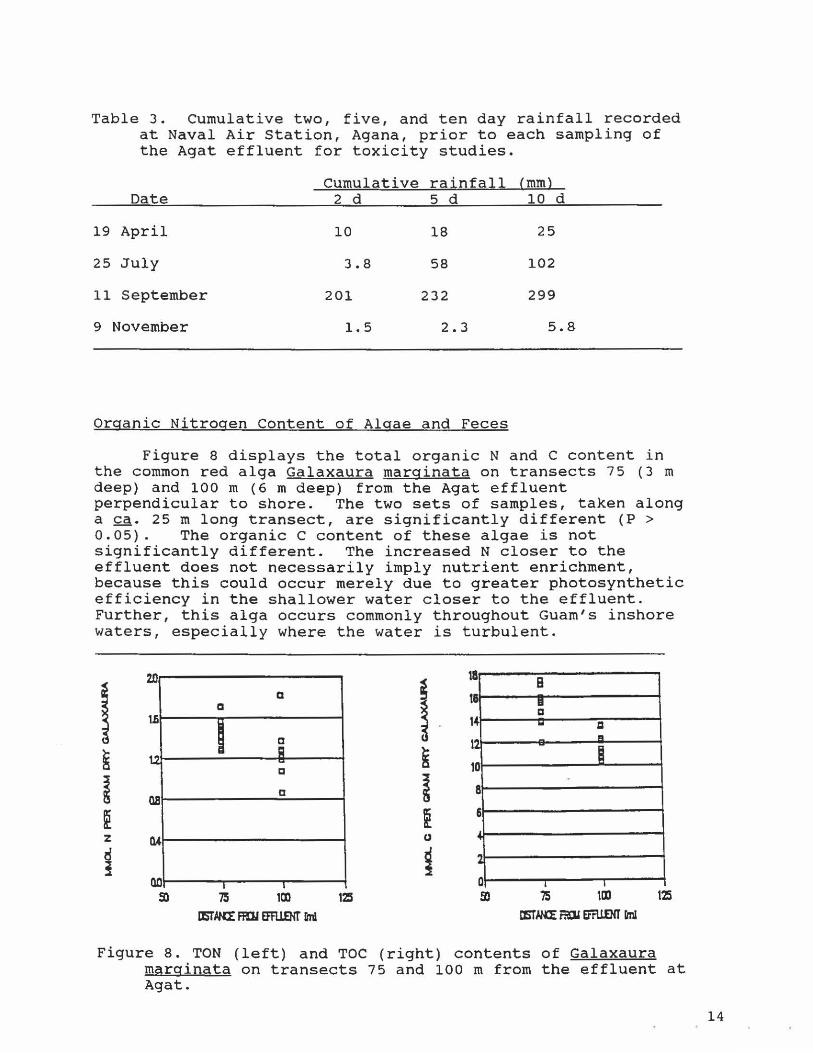
Table 3. Cumulative two, five, and ten day rainfall recorded at Naval Air station, Agana, prior to each sampling of the Agat effluent for toxicity studies.
Cumulative rainfall (mm) Date 2 d 5 d 10 d
19 April 10 18 25
25 July 3.8 58 102
11 September 201 232 299
9 November 1.5 2.3 5.8
Organic Nitrogen Content of Algae and Feces
Figure 8 displays the total organic Nand C content in the common red alga Galaxaura marginata on transects 75 (3 m deep) and 100 m (6 m deep) from the Agat effluent perpendicular to shore. The two sets of samples, taken along a gg. 25 m long transect, are significantly different (P > 0.05). The organic C content of these algae is not significantly different. The increased N closer to the effluent does not necessarily imply nutrient enrichment, because this could occur merely due to greater photosynthetic efficiency in the shallower water closer to the effluent . Further, this alga occurs commonly throughout Guam's inshore waters, especially where the water is turbulent.
2D 8 B a
a Iii
I 1 ' ~
a
~ 4 - II
1 ~
B 10
as a 8
6
114
no . 0 , • 12:5 125
Figure 8. TON (left) and TOe (right) contents of Galaxaura marginata on transects 75 and 100 m from the effluent at Agat.
14

At the Northern District, there was no significant difference among the average TON contents of Halimeda opuntia along ~. 30 m transects parallel to the diffusers (Figure 9). The 5, 20, and 50 m transects were between the first and last diffuser in depths of 14, 10, and 6 m, respectively, upslope towards shore. Thus, in this case, there was no apparent change in N content due to decreasing depth and consequential increase in photosynthetic efficiency, as could be the case for Agat. In spite of this, the N increase in Agat algae still cannot be attributed to nutrients from the effluent because these are two different genera of algae.
Q8
0.7
0Ji
os
0.1
o o
c
a 8 R
c
[]
c
u
-~
8 n
C
~ .. g C
I I
2D
Figure 9. TON content of Halimeda opuntia on transects 5, 20, and 50 m from the line of diffusers at the Northern District effluent.
Because only one pooled sample from an individual animal was collected at each depth, tests of significance cannot be performed. The feces of this benthic browser reflects the time integrated (up to 2 days) N contents of the carbonate sediments within an area of only a few tens of square centimeters. Presumably, if deposition of nutrient-rich particles from the effluent had increased the sedimentary N content, then this would be reflected in the feces of this animal. It is possible, however, that the organisms had assimilated the extra N if it indeed were present. However, if the N content of the alga Halimeda had increased due to local nutrient enrichment, this would be reflected in the sediments, which contain substantial amounts of Halimeda segments, and upon which the animals feed.
15

II)
/'\ ~ L \
70
\ / \ \/ ~
Ii 40
10
o I I I I
6 8 mUM ffi
llP1H ~ 00'I\tB.Dl: TO IJTlfiRS
Figure 10. TON content of freshly deposited feces of the sea cucumber Holothuria atra on a depth transect away from the Northern District diffusers.
Benthic algae commonly dominate these types of shallow, nearshore, turbulent-water communities, but also become dominant with proximity to the point of discharge of an effluent, especially at Agat (personal observation, see also Tsuda and Grosenbaugh, 1977). Adjacent areas north and south of the point of discharge at Agat are dominated by coral growth. This difference at Agat may be reasonably attributed to the fact that the effluent at this site is discharged into 2 to 3 m of water, which produces much greater nutrient enrichment (especially in ammonium and phosphate) than at the two other outfalls, both of which are in at least 20 m of water. In contrast, algae at the Northern District outfall, although generally less abundant, appear more uniformly distributed with distance from the diffusers, based upon qualitative visual observations. At Agana, in the immediate vicinity of the pipe and for about 25 m to either side, the bottom is biologically sparse. In fact, it is often difficult to find any algae except for small tufted forms that are frequently eroded or grazed. This is probably due to construction of both the sewer island itself and dredging and burial of the effluent pipe.
From these studies of Nand C in biological materials, no obvious change can be attributed to the presence of sewage
16

effluents. Except for Agat, perhaps the most long-lasting and significant effects on the communities at these sites was the construction and installation of the effluent pipes, especially those that were buried in dredged channels. At Agat, the abundance of relic pipes provides a large surface area upon which organisms can grow.
CONCLUSIONS
Either the effluents studied have little impact on the receiving waters or the parameters measured were of little value in the detection of any impact. At Agat, the biggest problem with the effluent is that it is discharged onshore in very shallow water and tends to remain there. Otherwise, fecal coliform bacteria and reactive phosphate were the only parameters that could provide evidence of the existence of effluent in waters distant from the surface plumes. If the effluents had been routinely chlorinated, the occurrence of effluent-impacted water would have been more difficult to detect, except with very precise and accurate measurements of reactive phosphate or ammonium.
Visual inspection, TON analyses, and common sense require that one conclude that these effluents have very localized impacts. The water seaward of the reef crests of Guam increase in depth rapidly over the 45 to 55 degree slope of the bottom. On Guam, for the existing high-quality effluents (very little chemical, metal, or other toxic wastes), dilution is the solution to this "pollution".
The treatment plants are unnecessary for the existing volumes of sewage, if and only if raw sewage can be discharged further from shore to avoid raising the fecal coliform density above 1 per mL. Otherwise, only large chlorinators are needed for regulated discharge in 60 feet of water. Tripling the volume of sewage and appropriately using present technology (primary treatment) would not likely cause a significant impact on the environment, providing that effective, well-maintained chlorinators are installed and used properly. Only a few studies have been reported in the literature on the effects and value of upgrading sewage plants. In at least one case, it was a waste of money (Matson et al., 1979).
17

COMMENTS ON THE LACK OF CHLORINATION
None of the effluents studied was chlorinated during the study period. Therefore, no scientifically valid comparison can presently be made between effluents with and without chlorination. However, effective use of well-maintained chlorinators would definitely prevent recreational water users from exposure to chlorine-susceptible organisms within the hundreds of meters (or so) that these organisms persist in the environment. The Agana influent is often chlorinated, (1) when there are funds, and (2) to attempt to eliminate foul odors from the business neighborhood. (The site of the Agana STP makes no sense whatsoever).
Specifically, because the Agat effluent is discharged on shore, chlorination should be a priority at this site. Chlorination should still be used when the effluent pipe is eventually fixed and the effluent is actually discharged offshore in 60 feet of water. Presently however, the effluent frequently moves towards shore and contaminates waters at least at site B.
At Agana, it continues to be difficult to identify the effluent as a contributing factor in the occurrence of FCs at the shoreline stations A, B, and C. Numerous storm culverts, direct street runoff, polluted rivers, and leaky pipes in this densely populated area may contribute FCs to these sites, regardless of the dispersion of the effluent. Further studies of non-point sources of these organisms is planned for June 1990 to June 1991 with funding from the University of Guam Water and Energy Research Institute.
At the Northern District, the effluent rarely appears nearshore and there are no other known sources of FC contamination in that area. However, FCs sometimes do occur at shoreline stations and this is can be considered an unnecessary risk to recreational users. Should the effluent then be chlorinated full-time just to avoid those infrequent exposures ?
18

LITERATURE CITED
Horning, W. B. II, C.I. Weber, O.J. Klemm, T.W. Neiheisel, P.A. Lewis, E.L. Robinson, J. Menkedick, and F. Kessler . 1987. Short-term methods for estimating the chronic toxicity of effluents and receiving waters to marine and estuarine organisms. Preliminary draft of U.S. EPA report EPA-600j4-87j028. Environm. Monit. Supp. Lab. Cincinnati.
Jones, M. N. 1984. Nitrate reduction by shaking with cadmium: Alternative to columns. Wat. Res. 18:643-646.
Matson, E.A., S. G. Horner, and J.~. Buck. 1979. Effects of upgrading a municipal wastewater effluent on pollution indicator and other microorganisms in river water. Environm. Sci. Technol. ~:460-465.
Parsons, T.R., Y. Maita, and C.M. Lalli. 1984. A manual of chemical and biological methods for seawater analysis. Pergamon, New York.173 pp.
Tsuda, R.T., and O.A. Grosenbaugh. 1977. Agat sewage treatment plant: impact of secondary treated effluent on Guam coastal waters. Univ. of Guam Water Resources Research Center Technical Report No.3.
19

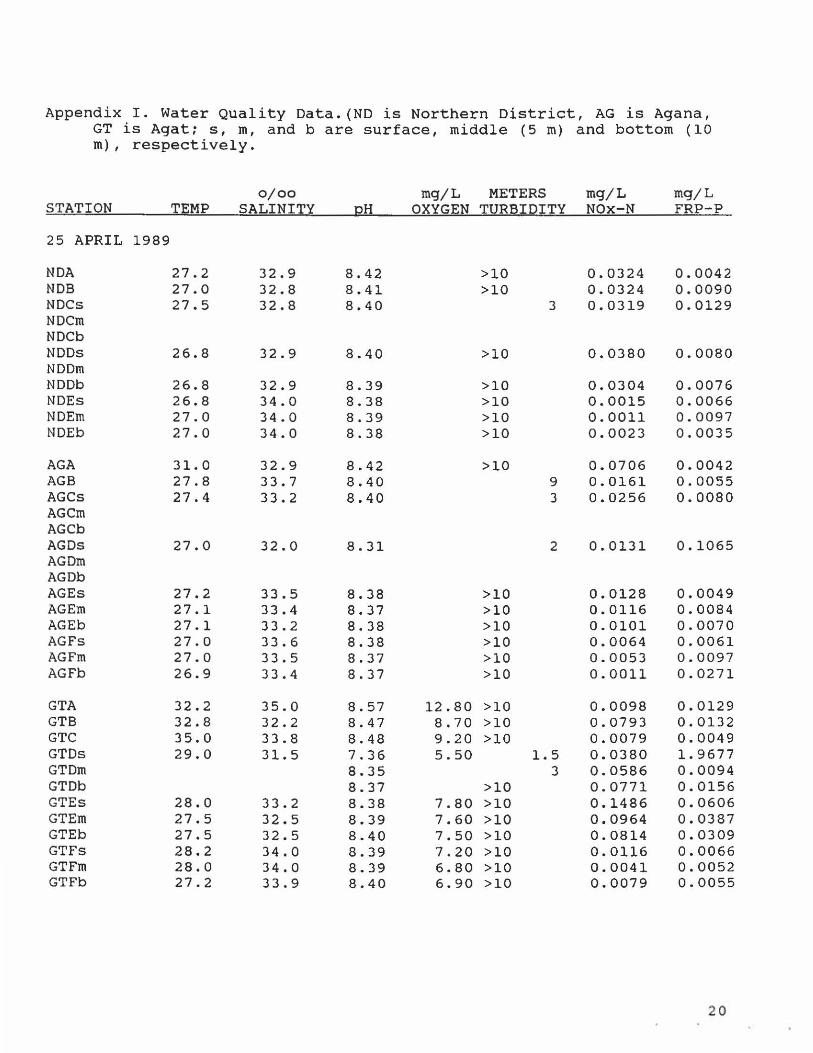
Appendix I. Water Quality Data.(ND is Northern District, AG is Agana, GT is Agat; s, m, and b are surface, middle (5 m) and bottom (10 m), respectively.
STATION
25 APRIL 1989
NDA NDB NDCs NDCm NDCb NDDs NDDm NDDb NDEs NDEm NDEb
AGA AGB AGCs AGCm AGCb AGDs AGDm AGDb AGEs AGEm AGEb AGFs AGFm AGFb
GTA GTB GTC GTDs GTDm GTDb GTEs GTEm GTEb GTFs GTFm GTFb
TEMP
27.2 27.0 27.5
26.8
26.8 26.8 27.0 27.0
31. 0 27.8 27.4
27.0
27.2 27.1 27.1 27.0 27.0 26.9
32.2 32.8 35.0 29.0
28.0 27.5 27.5 28.2 28.0 27.2
0/00
SALINITY
32.9 32.8 32.8
32.9
32.9 34.0 34.0 34.0
32.9 33.7 33.2
32.0
33.5 33.4 33.2 33.6 33.5 33.4
35.0 32.2 33.8 31. 5
33.2 32.5 32.5 34.0 34.0 33.9
pH
8.42 8.41 8.40
8.40
8.39 8.38 8.39 8.38
8.42 8.40 8.40
8.31
8.38 8.37 8.38 8.38 8.37 8 . 37
8.57 8.47 8.48 7.36 8.35 8.37 8.38 8.39 8.40 8.39 8.39 8.40
mg/L METERS mg/L OXYGEN TURBIDITY NOx-N
>10 >10
>10
>10 >10 >10 >10
>10
>10 >10 >10 >10 >10 >10
12.80 >10 8.70 >10 9.20 >10
3
9 3
2
5.50 1.5
>10 7.80 >10 7.60 >10 7.50 >10 7.20 >10 6.80 >10 6.90 >10
3
0.0324 0.0324 0.0319
0.0380
0.0304 0.0015 0.0011 0.0023
0.0706 0.0161 0.0256
0.0131
0.0128 0.0116 0.0101 0.0064 0.0053 0.0011
0.0098 0.0793 0.0079 0.0380 0.0586 0.0771 0.1486 0.0964 0.0814 0.0116 0.0041 0.0079
mg/L FRP-P
0.0042 0.0090 0.0129
0.0080
0.0076 0.0066 0.0097 0.0035
0.0042 0.0055 0.0080
0.1065
0.0049 0.0084 0.0070 0.0061 0.0097 0.0271
0.0129 0.0132 0.0049 1. 9677 0.0094 0.0156 0.0606 0.0387 0.0309 0.0066 0.0052 0.0055
20

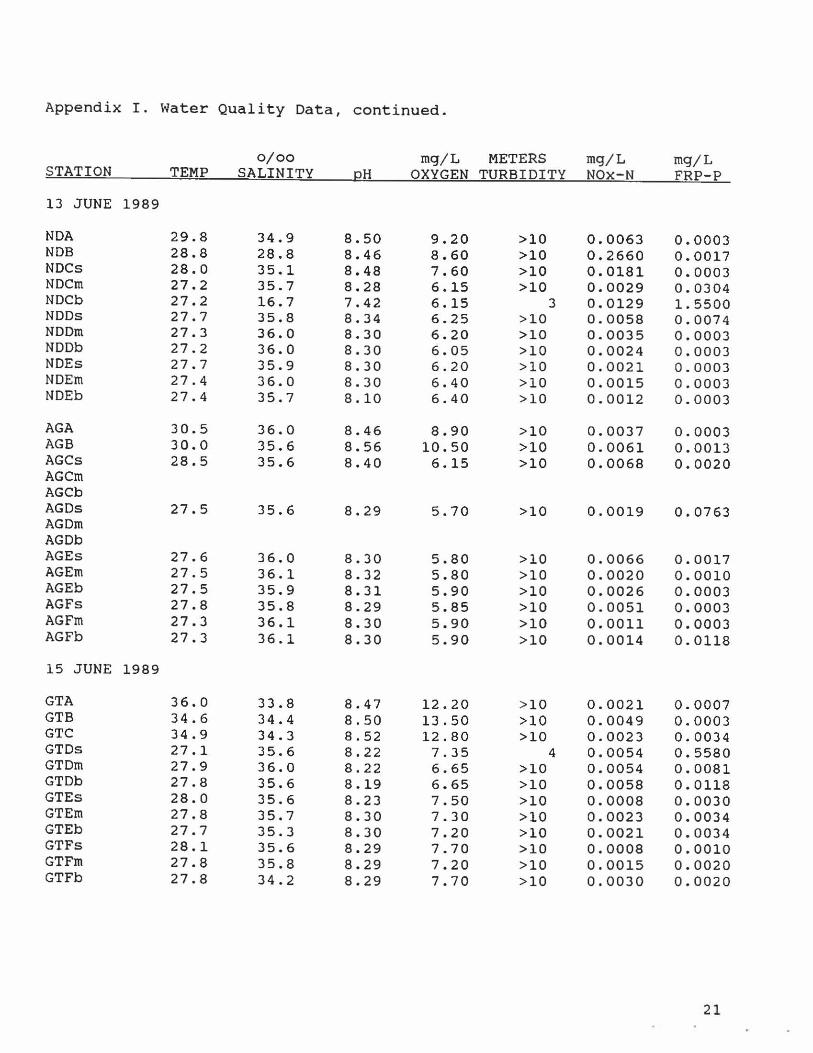
Appendix I. Water Quality Data, continued.
0/00 rng/ L METERS rng/ L rng/ L STATION TEMP SALINITY pH OXYGEN TURBIDITY NOx-N FRP-P
13 JUNE 1989
NDA 29.8 34.9 8.50 9.20 >10 0.0063 0.0003 NDB 28.8 28.8 8.46 8.60 >10 0.2660 0.0017 NDCs 28.0 35.1 8.48 7.60 >10 0.0181 0.0003 NDCrn 27.2 35.7 8.28 6.15 >10 0.0029 0.0304 NDCb 27.2 16.7 7.42 6.15 3 0.0129 1.5500 NDDs 27.7 35.8 8.34 6.25 >10 0.0058 0.0074 NDDrn 27.3 36.0 8.30 6.20 >10 0.0035 0.0003 NDDb 27.2 36.0 8 . 30 6.05 >10 0.0024 0.0003 NDEs 27.7 35.9 8.30 6.20 >10 0.0021 0.0003 NDErn 27.4 36.0 8.30 6.40 >10 0.0015 0.0003 NDEb 27.4 35.7 8.10 6.40 >10 0.0012 0.0003
AGA 30.5 36.0 8.46 8.90 >10 0.0037 0.0003 AGB 30.0 35.6 8.56 10.50 >10 0.0061 0.0013 AGCs 28.5 35.6 8.40 6.15 >10 0.0068 0.0020 AGCrn AGCb AGDs 27.5 35.6 8.29 5.70 >10 0.0019 0.0763 AGDrn AGDb AGEs 27.6 36.0 8.30 5.80 >10 0.0066 0.0017 AGErn 27 . 5 36.1 8.32 5.80 >10 0.0020 0.0010 AGEb 27.5 35.9 8.31 5.90 >10 0 . 0026 0.0003 AGFs 27.8 35.8 8.29 5.85 >10 0.0051 0.0003 AGFrn 27.3 36.1 8.30 5.90 >10 0.001l 0.0003 AGFb 27.3 36.1 8.30 5.90 >10 0.0014 0.01l8
15 JUNE 1989
GTA 36.0 33.8 8.47 12.20 >10 0.0021 0.0007 GTB 34.6 34.4 8.50 13.50 >10 0.0049 0.0003 GTC 34.9 34.3 8.52 12.80 >10 0.0023 0.0034 GTDs 27.1 35.6 8.22 7.35 4 0.0054 0.5580 GTDrn 27.9 36.0 8.22 6.65 >10 0.0054 0.0081 GTDb 27.8 35.6 8.19 6.65 >10 0.0058 0.0118 GTEs 28.0 35.6 8.23 7.50 >10 0.0008 0.0030 GTErn 27.8 35.7 8.30 7.30 >10 0.0023 0.0034 GTEb 27.7 35.3 8.30 7.20 >10 0.0021 0.0034 GTFs 28.1 35.6 8.29 7.70 >10 0 . 0008 0.0010 GTFrn 27.8 35.8 8.29 7.20 >10 0.0015 0.0020 GTFb 27.8 34 . 2 8.29 7.70 >10 0.0030 0.0020
21

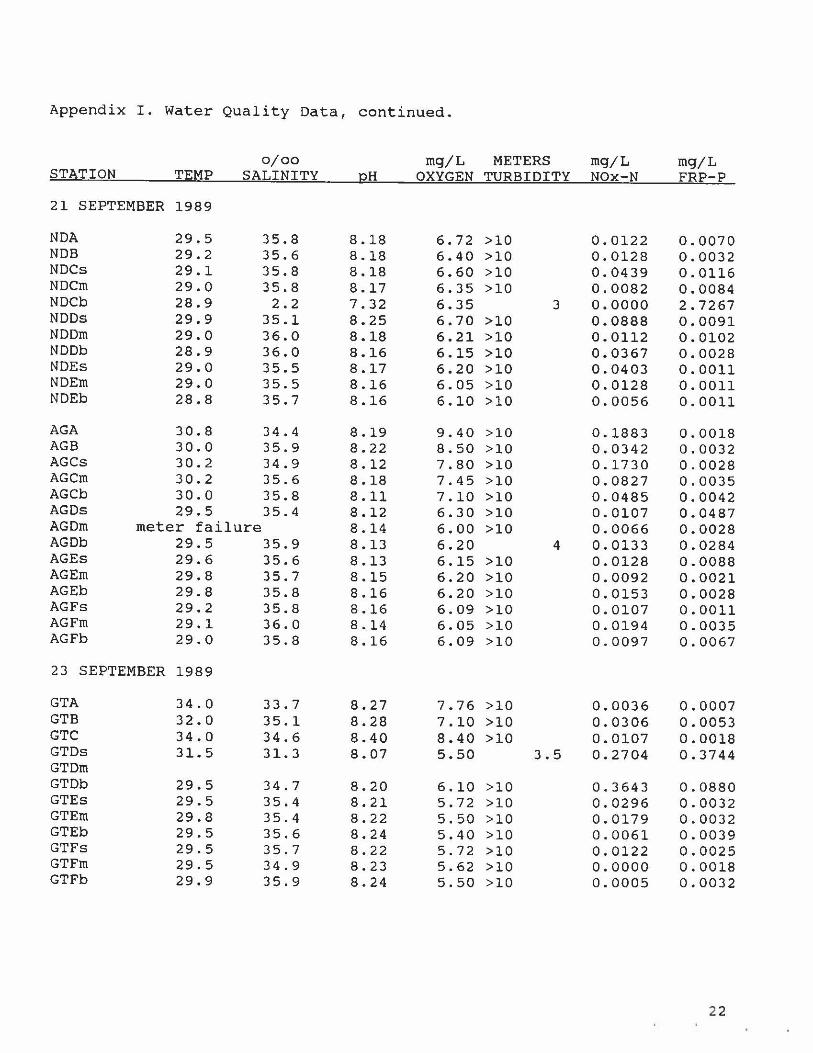
Appendix I. Water Quality Data, continued.
0/00 mg/L METERS mg/L mg/L STATION TEMP SALINITY pH OXYGEN TURBIDITY NOx-N FRP-P
21 SEPTEMBER 1989
NDA 29.5 35.8 8.18 6.72 >10 0.0122 0.0070 NOB 29.2 35.6 8.18 6.40 >10 0.0128 0.0032 NDCs 29.1 35.8 8.18 6.60 >10 0.0439 0.0116 NDCm 29.0 35.8 8.17 6.35 >10 0.0082 0.0084 NDCb 28.9 2.2 7.32 6.35 3 0.0000 2.7267 NODs 29.9 35.1 8.25 6.70 >10 0.0888 0.0091 NDDm 29.0 36.0 8.18 6.21 >10 0.0112 0.0102 NDDb 28.9 36.0 8.16 6.15 >10 0.0367 0.0028 NOEs 29.0 35.5 8.17 6.20 >10 0.0403 0.0011 NDEm 29.0 35.5 8.16 6.05 >10 0.0128 0.0011 NDEb 28.8 35.7 8.16 6.10 >10 0.0056 0.0011
AGA 30.8 34.4 8.19 9.40 >10 0.1883 0.0018 AGB 30.0 35.9 8.22 8.50 >10 0.0342 0.0032 AGCs 30.2 34.9 8.12 7.80 >10 0.1730 0.0028 AGCm 30.2 35.6 8.18 7.45 >10 0.0827 0.0035 AGCb 30.0 35.8 8.11 7.10 >10 0.0485 0.0042 AGDs 29.5 35.4 8.12 6.30 >10 0.0107 0.0487 AGDm meter failure 8.14 6.00 >10 0.0066 0.0028 AGDb 29.5 35.9 8.13 6.20 4 0.0133 0.0284 AGEs 29.6 35.6 8.13 6.15 >10 0.0128 0.0088 AGEm 29.8 35.7 8.15 6.20 >10 0.0092 0.0021 AGEb 29.8 35.8 8.16 6.20 >10 0.0153 0.0028 AGFs 29.2 35.8 8.16 6.09 >10 0.0107 0.0011 AGFm 29.1 36.0 8.14 6.05 >10 0.0194 0.0035 AGFb 29.0 35.8 8.16 6.09 >10 0.0097 0.0067
23 SEPTEMBER 1989
GTA 34.0 33.7 8.27 7.76 >10 0.0036 0.0007 GTB 32.0 35.1 8.28 7.10 >10 0.0306 0.0053 GTC 34.0 34.6 8.40 8.40 >10 0.0107 0.0018 GTDs 31. 5 31. 3 8.07 5.50 3.5 0.2704 0.3744 GTDm GTDb 29.5 34.7 8.20 6.10 >10 0.3643 0.0880 GTEs 29.5 35.4 8.21 5.72 >10 0.0296 0.0032 GTEm 29.8 35.4 8.22 5.50 >10 0.0179 0.0032 GTEb 29.5 35.6 8.24 5.40 >10 0.0061 0.0039 GTFs 29.5 35.7 8.22 5.72 >10 0.0122 0.0025 GTFm 29.5 34.9 8.23 5.62 >10 0.0000 0.0018 GTFb 29.9 35.9 8.24 5.50 >10 0.0005 0.0032
22

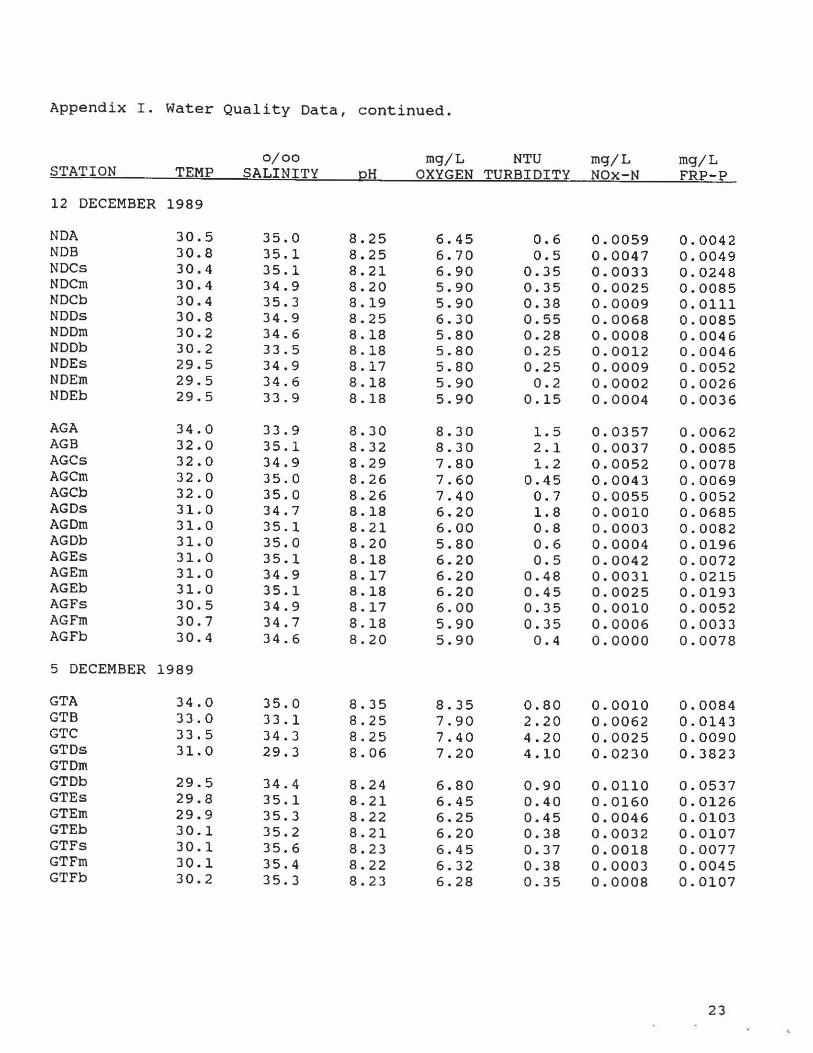
Appendix I. Water Quality Data, continued.
0/00 mg/L NTU mg/L mg/L STATION TEMP SALINITY pH OXYGEN TURBIDITY NOx-N FRP-P
12 DECEMBER 1989
NDA 30.5 35.0 8.25 6.45 0.6 0.0059 0.0042 NDB 30.8 35.1 8.25 6.70 0.5 0.0047 0.0049 NDCs 30.4 35.1 8.21 6.90 0.35 0.0033 0.0248 NDCm 30.4 34.9 8.20 5.90 0.35 0.0025 0.0085 NDCb 30.4 35.3 8.19 5.90 0.38 0.0009 0.0111 NDDs 30.8 34.9 8.25 6.30 0.55 0.0068 0.0085 NDDm 30.2 34.6 B.IB 5.BO 0.2B O.OOOB 0.0046 NDDb 30.2 33 . 5 B.IB 5.BO 0.25 0.0012 0.0046 NDEs 29.5 34.9 B.17 5.BO 0.25 0.0009 0.0052 NDEm 29.5 34.6 8.18 5.90 0.2 0.0002 0.0026 NDEb 29 . 5 33.9 8.1B 5.90 0.15 0.0004 0.0036
AGA 34.0 33.9 8.30 B.30 1.5 0.0357 0.0062 AGB 32.0 35.1 B.32 B.30 2.1 0.0037 0.0085 AGCs 32.0 34.9 8.29 7.BO 1.2 0.0052 0.007B AGCm 32.0 35.0 B.26 7.60 0.45 0.0043 0.0069 AGCb 32.0 35.0 B.26 7.40 0.7 0.0055 0.0052 AGDs 31. 0 34.7 B.IB 6.20 1.8 0.0010 0.0685 AGDm 31. 0 35.1 B.21 6.00 O.B 0.0003 0.00B2 AGDb 31. 0 35.0 B.20 5.80 0.6 0.0004 0.0196 AGEs 31. 0 35.1 B.18 6.20 0.5 0.0042 0.0072 AGEm 31. 0 34.9 B.17 6.20 0.48 0.0031 0.0215 AGEb 31. 0 35.1 B.1B 6.20 0.45 0.0025 0.0193 AGFs 30.5 34.9 8.17 6.00 0.35 0.0010 0.0052 AGFm 30.7 34.7 8.18 5.90 0.35 0.0006 0.0033 AGFb 30.4 34.6 B.20 5.90 0.4 0.0000 0.007B
5 DECEMBER 19B9
GTA 34.0 35.0 8.35 8.35 O.BO 0.0010 0.00B4 GTB 33.0 33. 1 8.25 7.90 2.20 0.0062 0.0143 GTC 33.5 34.3 8.25 7.40 4.20 0.0025 0.0090 GTDs 31.0 29.3 8.06 7.20 4.10 0.0230 0.3823 GTDm GTDb 29.5 34.4 8.24 6.80 0.90 0.0110 0.0537 GTEs 29.B 35.1 8.21 6.45 0.40 0.0160 0.0126 GTEm 29.9 35.3 B.22 6.25 0.45 0.0046 0.0103 GTEb 30.1 35.2 8.21 6.20 0.38 0.0032 0.0107 GTFs 30.1 35.6 8.23 6.45 0.37 0.0018 0.0077 GTFm 30.1 35.4 8.22 6.32 0.38 0.0003 0.0045 GTFb 30.2 35.3 8.23 6.28 0.35 0.0008 0.0107
23

•
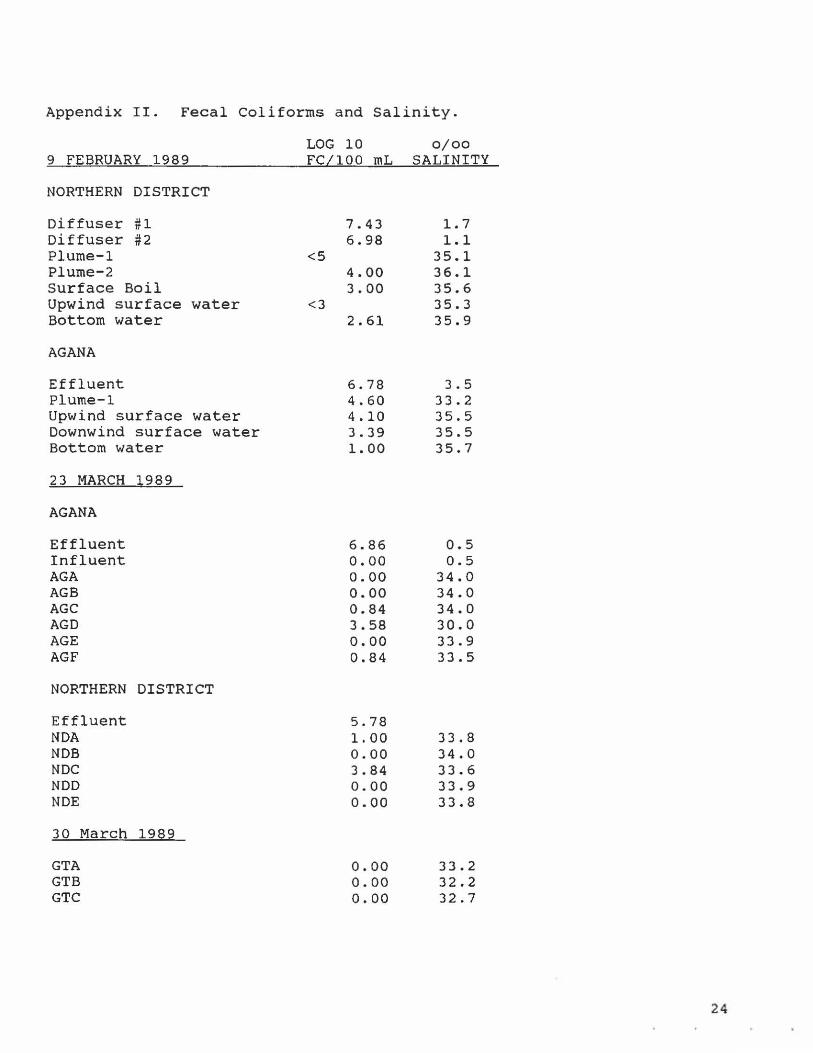
Appendix II. Fecal Coliforms and Salinity.
9 FEBRUARY 1989
NORTHERN DISTRICT
Diffuser #1 Diffuser #2 Plume-1 Plume-2 Surface Boil Upwind surface water Bottom water
AGANA
Effluent Plume-1 Upwind surface water Downwind surface water Bottom water
23 MARCH 1989
AGANA
Effluent Influent AGA AGB AGC AGD AGE AGF
NORTHERN DISTRICT
Effluent NDA NDB NDC NDD NDE
30 March 1989
GTA GTB GTC
LOG 10 0/00 FC/100 mL SALINITY
<5
<3
7.43 6.98
4.00 3.00
2.61
6 . 78 4.60 4.10 3.39 1. 00
6.86 0.00 0.00 0.00 0.84 3.58 0.00 0.84
5.78 1. 00 0.00 3.84 0 . 00 0.00
0.00 0.00 0.00
1.7 1.1
35.1 36.1 35.6 35.3 35.9
3.5 33.2 35.5 35.5 35.7
0.5 0.5
34.0 34.0 34.0 30.0 33.9 33.5
33.8 34.0 33.6 33.9 33.8
33.2 32.2 32.7
24

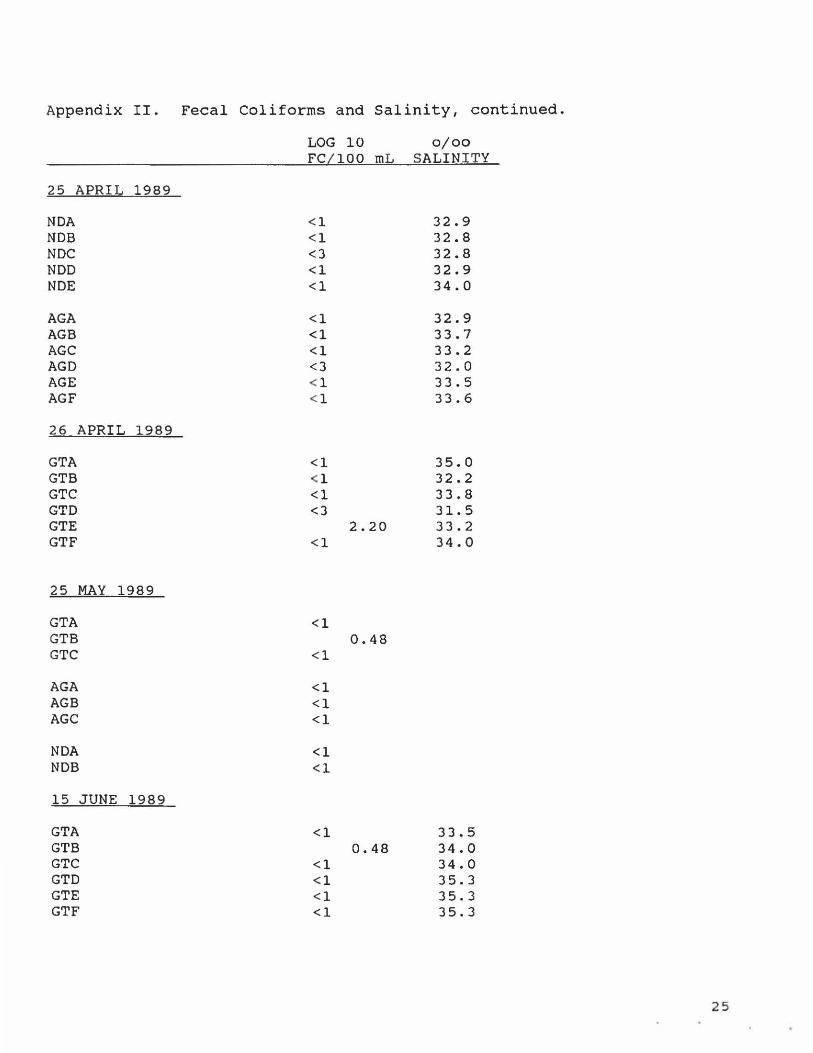
Appendix II. Fecal Coliforms and Salinity, continued.
LOG 10 0/00 FCIlOO mL SALINITY
25 APRIL 1989
NOA <1 32.9 NOB <1 32.8 NOC <3 32.8 NOD <1 32.9 NOE <1 34.0
AGA <1 32.9 AGB <1 33.7 AGC <1 33.2 AGO <3 32.0 AGE <1 33.5 AGF <1 33.6
26 APRIL 1989
GTA <1 35.0 GTB <1 32.2 GTC <1 33.8 GTO <3 31.5 GTE 2.20 33.2 GTF <1 34.0
25 MAY 1989
GTA <1 GTB 0.48 GTC <1
AGA <1 AGB <1 AGC <1
NOA <1 NOB <1
15 JUNE 1989
GTA <1 33.5 GTB 0.48 34.0 GTC <1 34.0 GTO <1 35.3 GTE <1 35.3 GTF <1 35.3
25

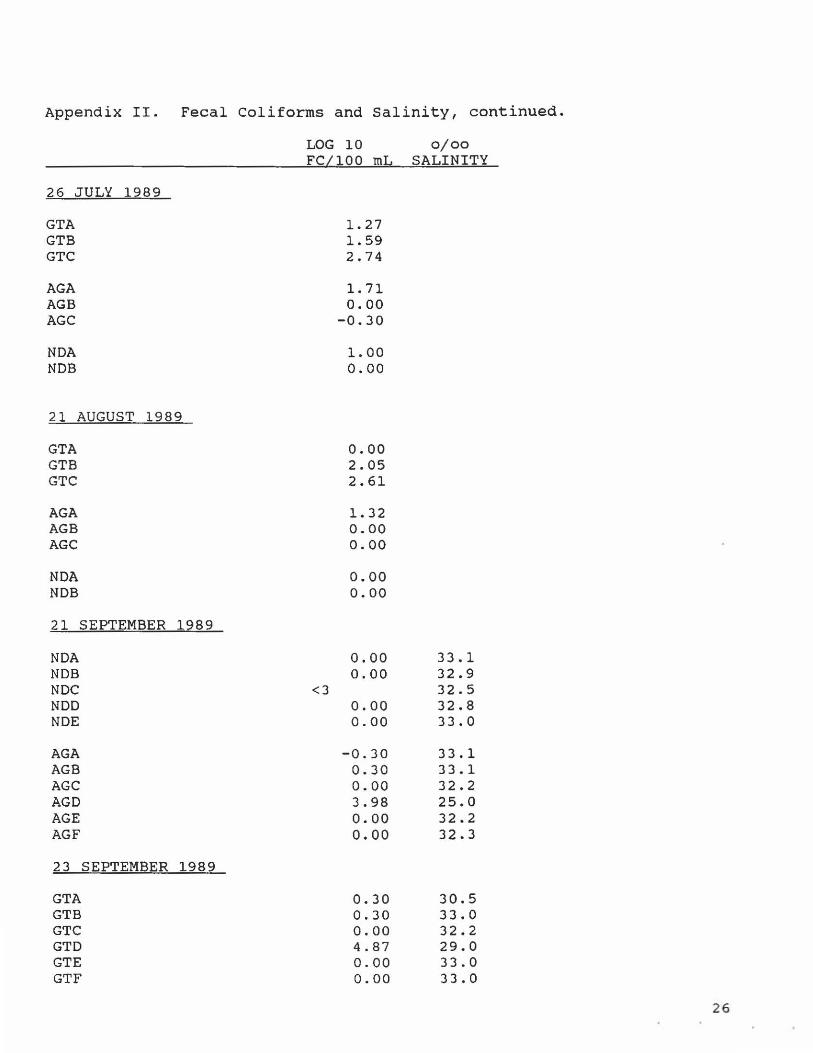
Appendix II. Fecal Coliforms and Salinity, continued.
26 JULY 1989
GTA GTB GTC
AGA AGB AGC
NDA NDB
21 AUGUST 1989
GTA GTB GTC
AGA AGB AGC
NDA NDB
21 SEPTEMBER 1989
NDA NDB NDC NDD NDE
AGA AGB AGC AGD AGE AGF
23 SEPTEMBER 1989
GTA GTB GTC GTD GTE GTF
LOG 10 0/00 FC/IOO mL SALINITY
<3
1. 27 1. 59 2.74
1.71 0.00
-0.30
1. 00 0.00
0.00 2.05 2.61
1. 32 0.00 0.00
0.00 0.00
0.00 0.00
0.00 0.00
-0.30 0.30 0.00 3.98 0.00 0.00
0.30 0.30 0.00 4.87 0.00 0.00
33.1 32.9 32.5 32.8 33.0
33.1 33.1 32.2 25.0 32.2 32.3
30.5 33.0 32.2 29.0 33 . 0 33.0
26

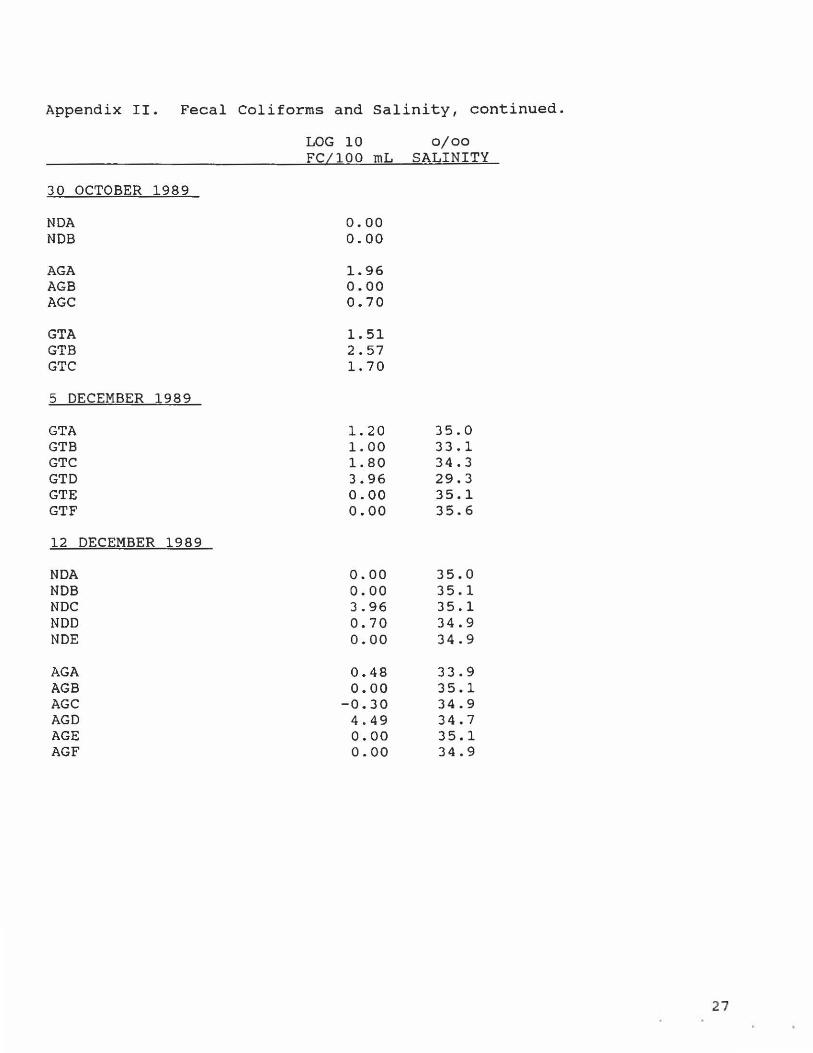
Appendix II. Fecal Coliforms and Salinity, continued.
30 OCTOBER 1989
NDA NDB
AGA AGB AGC
GTA GTB GTC
5 DECEMBER 1989
GTA GTB GTC GTD GTE GTF
12 DECEMBER 1989
NDA NDB NDC NDD NDE
AGA AGB AGC AGD AGE AGF
LOG 10 0/00 FC/ I00 mL SALINITY
0.00 0.00
1.96 0.00 0.70
1. 51 2.57 1. 70
1. 20 1. 00 1. 80 3.96 0.00 0.00
0.00 0.00 3.96 0.70 0.00
0.48 0.00
-0.30 4.49 0.00 0.00
35.0 33.1 34.3 29.3 35.1 35.6
35.0 35.1 35.1 34.9 34.9
33.9 35.1 34.9 34.7 35.1 34.9
27

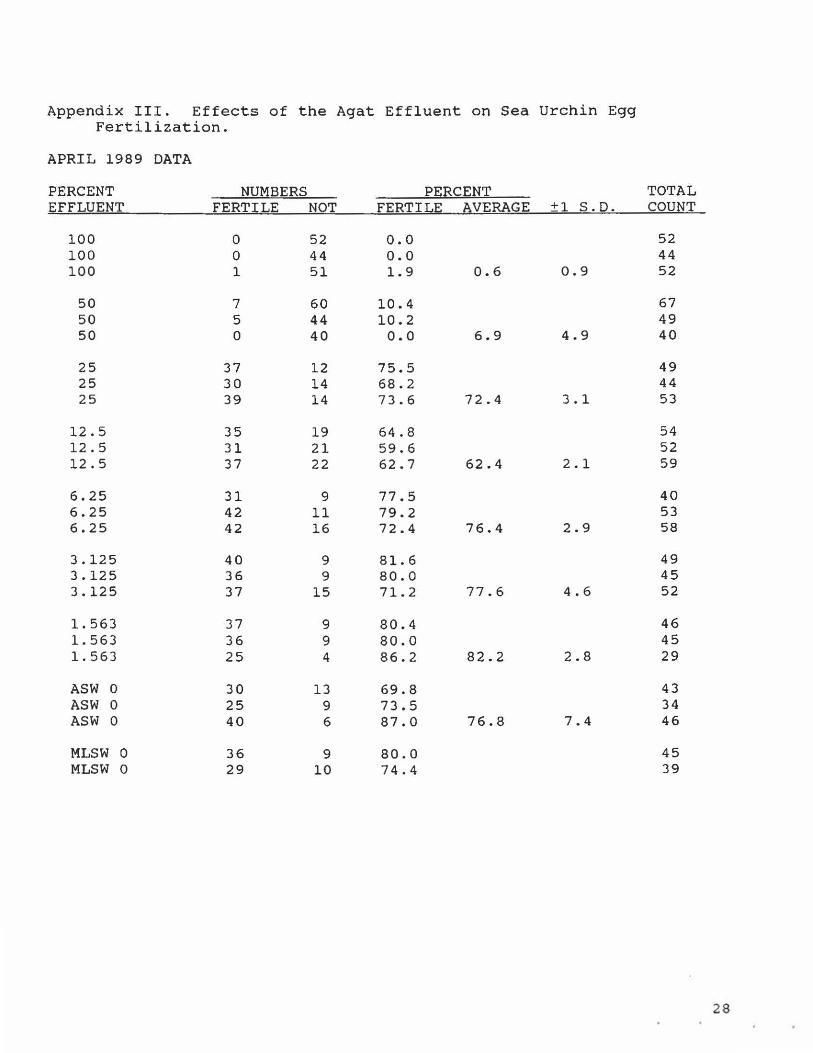
Appendix III. Effects of the Agat Effluent on Sea Urchin Egg Fertilization.
APRIL 1989 DATA
PERCENT NUMBERS PEBCf:l::!T TOTAL EFFLUENT FERTILE NOT FERTILE AVERAGE +1 S.D. COUNT
100 0 52 0.0 52 100 0 44 0.0 44 100 1 51 1.9 0.6 0.9 52
50 7 60 10.4 67 50 5 44 10.2 49 50 0 40 0.0 6.9 4.9 40
25 37 12 75.5 49 25 30 14 68.2 44 25 39 14 73.6 72.4 3.1 53
12.5 35 19 64.8 54 12.5 31 21 59.6 52 12.5 37 22 62.7 62.4 2.1 59
6.25 31 9 77.5 40 6.25 42 11 79.2 53 6.25 42 16 72.4 76.4 2.9 58
3 . 125 40 9 81.6 49 3.125 36 9 80 . 0 45 3.125 37 15 71.2 77.6 4.6 52
1. 563 37 9 80.4 46 1. 563 36 9 80.0 45 1. 563 25 4 86.2 82.2 2.8 29
ASW 0 30 13 69.8 43 ASW 0 25 9 73.5 34 ASW 0 40 6 87.0 76.8 7.4 46
MLSW 0 36 9 80.0 45 MLSW 0 29 10 74.4 39
28

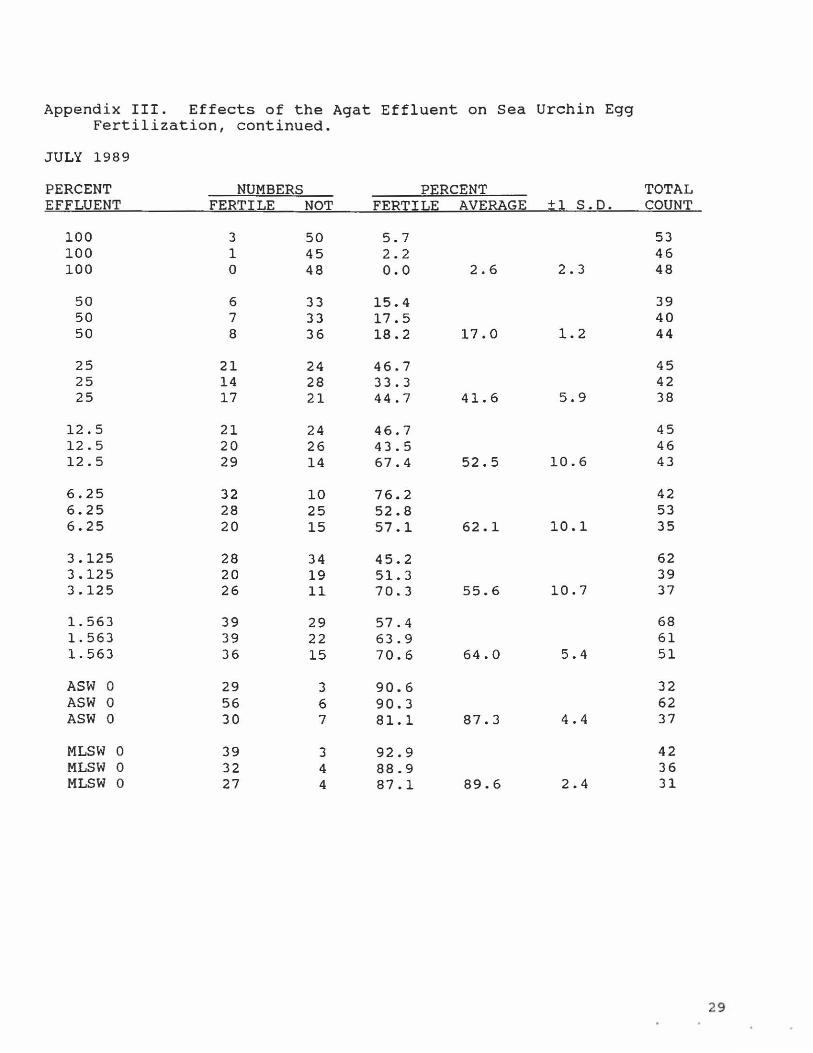
Appendix III. Effects of the Agat Effluent on Sea Urchin Egg Fertilization, continued.
JULY 1989
PERCENT NUMBERS PERCENT TOTAL EFFLUENT FERTILE NOT FERTILE AVERAGE ±1 S.D. COUNT
100 3 50 5.7 53 100 1 45 2.2 46 100 0 48 0.0 2.6 2.3 48
50 6 33 15.4 39 50 7 33 17.5 40 50 8 36 18.2 17.0 1.2 44
25 21 24 46.7 45 25 14 28 33.3 42 25 17 21 44.7 41. 6 5.9 38
12.5 21 24 46.7 45 12.5 20 26 43.5 46 12 . 5 29 14 67.4 52.5 10.6 43
6.25 32 10 76.2 42 6.25 28 25 52.8 53 6.25 20 15 57.1 62.1 10.1 35
3.125 28 34 45.2 62 3.125 20 19 51.3 39 3.125 26 11 70.3 55.6 10.7 37
1. 563 39 29 57.4 68 1. 563 39 22 63.9 61 1.563 36 15 70.6 64.0 5.4 51
ASW 0 29 3 90.6 32 ASW 0 56 6 90.3 62 ASW 0 30 7 81.1 87.3 4.4 37
MLSW 0 39 3 92.9 42 MLSW 0 32 4 88.9 36 MLSW 0 27 4 87.1 89.6 2.4 31
29

Appendix III. Effects of the Agat Effluent on Sea Urchin Egg Fertilization, continued.
lB SEPTEMBER 19B9
PERCENT NUMBERS P£:BCENT TOTAL EFFLUENT FERTILE NOT FERTILE AVERAGE +1 S.D. COUNT
100 4 98 3.9 100 6 111 5.1 100 3 110 2.7 3.9 1.0 332
50 102 6 94.4 50 109 0 100.0 50 97 1 99.0 97.8 2.4 315
25 NO DATA
12.5 75 4 94 . 9 12.5 102 0 100.0 12.5 118 1 99.2 98.0 2.2 300
6.25 108 2 98.2 6.25 111 0 100.0 6.25 100 1 99.0 99.1 0.7 322
3.125 98 5 95.1 3.125 106 0 100.0 3.125 116 17 87.2 94.1 5.3 342
1.563 128 1 99.2 1. 563 95 3 96.9 1.563 99 2 98.0 98.1 0.9 328
ASW 0 108 1 99.1 ASW 0 89 15 85.6 ASW 0 102 0 100.0 94.9 6.6 315
MLSW 0 92 7 92.9 MLSW 0 86 9 90.5 MLSW 0 100 2 98.0 93.8 3.1 296
30

Appendix III. Effects of the Agat Effluent on Sea Urchin Egg Fertilization, continued.
17 NOVEMBER 1989
PERCENT NUMBER§ PERCENT TOTAL EFFLUENT FERTILE NOT FERTILE AVERAGE ±1 S.D. COUNT
100 0 118 0.0 ll8 100 0 101 0.0 101 100 0 104 0.0 0.0 0.0 104
50 0 120 0.0 120 50 0 100 0.0 100 50 0 102 0.0 0.0 0.0 102
25 32 72 30.8 104 25 50 77 39.4 127 25 87 46 65.4 45.2 14.7 133
12.5 106 8 93.0 ll4 12.5 131 II 92.3 142 12.5 ll2 11 91.1 92.1 0.8 123
6.25 102 6 94.4 108 6.25 96 15 86.5 90.5 4.0 III
3.125 103 8 92.8 III 3.125 97 21 82.2 ll8 3.125 122 10 92.4 89.1 4.9 132
1.563 108 5 95.6 113 1.563 97 12 89.0 109 1. 563 90 II 89.1 91.2 3.1 101
ASW 0 101 0 100.0 101 ASW 0 97 10 90.7 107 ASW 0 111 2 98.2 96.3 4.1 113
MLSW 0 107 0 100.0 107 MLSW 0 101 0 100.0 101 MLSW 0 122 2 98.4 99.5 0.8 124
31