Embed Size (px)
Citation preview

Effects of the Affordable Care Act on Part-Time Employment:
Early Evidence
Marcus Dillender
W.E. Upjohn Institute for
Employment Research
Carolyn Heinrich
Vanderbilt University
Susan Houseman
W.E. Upjohn Institute for
Employment Research
August 2016
ABSTRACT
The Affordable Care Act (ACA) requires employers with at least 50 full-time-equivalent
employees to offer “affordable” health insurance to employees working 30 or more hours per
week. If employers do not comply with the mandate, they may face substantial financial
penalties. Employers can circumvent the mandate by reducing employees’ weekly hours below
the 30-hour threshold, but only certain industries are likely to make widespread use of this tactic:
those where short-hours part-time work is a feasible staffing strategy and where many employees
work more than 30 hours but had not previously been offered health insurance—in particular, in
the retail, accommodations and food services industries. Using monthly CPS data, we examine
the effects of the ACA on short-hours, part-time and involuntary part-time employment. Our
empirical strategy uses Hawaii, which has had a more stringent employer health insurance
mandate than that of the ACA for several decades, as a control group. In our preferred
specification, we estimate a triple difference model and conservatively infer statistical
significance based on the results of 50 placebo tests for the 49 other states and the District of
Columbia. Our causal estimates indicate that the ACA increased low-hours, involuntary part-
time employment by a half-million to a million workers in retail, accommodations, and food
services, the industries in which employers are most likely to reduce hours if they choose to
circumvent the mandate.
JEL Classification Codes: I13, J23, J3
Key Words: Affordable Care Act, employer-sponsored health insurance, employer mandate,
part-time employment, involuntary part-time employment
Acknowledgments
We thank participants at the conference on Building Human Capital and Economic
Potential, held at the University of Wisconsin–Madison and seminar participants from the MIT
Sloan School of Management, Institute for Work and Employment Research; Vanderbilt
University, Department of Health Policy; Summer Research Workshop, Institute for Research on
Poverty at the University of Wisconsin-Madison; and the Upjohn Institute for valuable input.
Lillian Vesic-Petrovic provided excellent research assistance. The Smith Richardson Foundation
helped support this research.

1
Despite considerable improvement since the Great Recession, the labor market continues
to show signs of weakness, with historically low labor force participation rates and flat or
minimal growth in real wages and benefits. In this context, the implementation of the Patient
Protection and Affordable Care Act (ACA) presents an opportunity to significantly improve
compensation, particularly for low-wage workers. Employer-sponsored health insurance is an
important component of compensation, though its incidence was declining sharply prior to the
ACA, both because fewer employers were offering this benefit and because employers have
passed along higher premium costs to employees, leading fewer of them to take health insurance
when offered (Vistnes et al. 2010). Under the ACA’s provisions, employers with at least 50 full-
time-equivalent workers (FTEs) are required to offer “affordable” health insurance meeting
minimum standards of coverage to their full-time employees, defined as those who work at least
30 hours per week. Large employers who do not offer any health insurance to full-time
employees, whose policies do not cover minimum benefits, or who do not cover a sufficient
share of the policy’s premium may face substantial financial penalties.
While the employer mandate in the ACA is intended to increase employer-sponsored
health insurance and thereby improve workers’ compensation and the quality of jobs, some are
concerned it could backfire. In theory, to the degree that employees value the health insurance
benefit offered, employers may pass along the premium costs to workers in the form of lower
real wages or other reduced benefits. Particularly for low-wage workers, however, employers’
ability to lower wages may be constrained by the minimum wage. Moreover, employers may
avoid cutting nominal wages because of adverse effects on morale and productivity, and inflation
may not be a viable mechanism to reduce real wages if the relatively low rates of price growth of
the recent past persist.
Alternatively, large employers may increase their use of workers in staffing arrangements
that are not covered by the employer mandate: workers averaging less than 30 hours per week or
working in organizations with fewer than 50 full-time employees. Federal rules stipulate that to
determine work hours for a particular employee, an employer may use up to a 12-month “look
back” period to establish whether an employee works an annual average of 30 hours per week.
As a result, employers will not be required to offer insurance to many, if not most, on-call and
temporary workers. To circumvent the mandate, therefore, employers may choose to reduce

2
standard weekly hours below 30 or shift their mix of staffing toward greater use of on-call,
direct-hire temporaries, or agency temporaries. Additionally, employers may choose to outsource
certain tasks to firms with fewer than 50 full-time employees. Ironically, the employer mandate
could reduce the quality of jobs for low- and middle-skilled workers by increasing the share of
low-hours part-time, temporary, and contract employment—categories that often are associated
with relatively low compensation and high job instability.
Reflecting such concerns, a July 2013 letter from three of the largest labor unions to
congressional leaders argued that the law would “shatter not only our hard-earned health
benefits, but destroy the foundation of the 40-hour work week that is the backbone of the
American middle class.”1 The union leaders argued, and some public accounts confirm, that
employers would be incentivized to keep or cut workers’ hours to below 30 hours per week to
avoid the obligation to provide insurance. For example, as of September 2014, several months
before the mandate took effect for employers with at least 100 FTEs, Investor’s Business Daily
had compiled a list of 450 public and private employers for which it claims there was “strong
proof” (i.e., official documents or accounts) that these employers had cut work hours from full-
to part-time or reduced hours of new hires to be less than 30 in order to circumvent the health
insurance benefit requirement.2 Many of these actions came well before the employer mandate
was implemented; the earliest reported increase in the use of part-time work explicitly to avoid
the repercussions of the ACA’s employer mandate came in March 2011. This suggests that
employers were considering altering employee work hours long before the mandate’s official
implementation date. Similarly, industry analysts have predicted a boost to temporary-help firms
from the ACA (Hancock 2013).
In this paper, we seek to shed light on the early effects the ACA employer mandate has
had on short-hours, part-time employment. In our analysis, we distinguish between part-time
employment for personal reasons and part-time employment for economic reasons. The latter
should best capture any changes owing to an increase in employer demand for short-hours part-
time employment. We previously estimated that around the time of the ACA’s passage, about 5
1 http://www.forbes.com/sites/theapothecary/2013/07/15/labor-leaders-obamacare-will-shatter-their-health-
benefits-cause-nightmare-scenarios/ 2 http://news.investors.com/politics-obamacare/020314-669013-obamacare-employer-mandate-a-list-of-
cuts-to-work-hours-jobs.htm.

3
percent of the wage and salary workers were vulnerable to changes in their employment
arrangement and argued that, if employers chose to circumvent the mandate, the mechanisms
would likely vary across industries according to the organization of production and established
staffing practices (Dillender, Heinrich, and Houseman 2015). The relatively small share of the
workforce potentially affected by the mandate implies that any impacts on hours may be difficult
to detect empirically outside of industries with a high share of such workers and in which use of
low-hours part-time workers is an attractive alternative.
Our empirical strategy uses Hawaii as a control group in comparison with the rest of the
nation. Hawaii has had, for several decades, a more stringent employer health insurance mandate
than that contained in the ACA. Consequently, the introduction of the mandate in the ACA
should have no effect on employer behavior in that state. Although Hawaii is in many ways a
unique state, we find that part-time employment in Hawaii closely tracks part-time employment
in the rest of the nation prior to the passage of the ACA, using monthly data from the Current
Population Survey (CPS). Using the same data, we estimate that the ACA increased low-hours,
involuntary part-time employment by two to three percentage points, or a half-million to a
million workers, in retail, accommodations, and food services—the sectors where employers are
most likely reduce hours if they choose to circumvent the mandate. Our findings are robust to
placebo tests and alternative specifications.
The remainder of the paper is organized as follows. We provide background on the
employer mandate in the ACA, on Hawaii’s employer mandate, and on Massachusetts’s health
insurance reforms in Section 1. We provide an overview of the theory of employer-mandated
benefits and prior research findings on the effects of mandated benefits in Section 2. In Section
3, we examine the factors affecting firms’ decisions to comply with the mandate or circumvent it
by shortening workers’ hours or outsourcing work, and we provide descriptive evidence
suggesting the mandate may have increased involuntary part-time employment in certain sectors.
We detail our methodology and data in Section 4, and we present findings from difference-in-
differences and triple-difference specifications in Section 5. In the concluding section, Section
6, we review our findings, place them in context to those of related studies, and discuss
implications for future research.
4
1. The Employer Mandates in the Affordable Care Act and in Hawaii and
Massachusetts Health Insurance Reforms
In the decades before the passage of the ACA, health care spending had been growing as
a percentage of GDP and of household expenditures. From 2000 to 2010, health care costs rose
from 13.4 percent of GDP to 17.4 percent (Centers for Medicare and Medicaid Services 2014),
and the growth in health care spending eroded much of people’s real wage gains (Auerbach and
Kellermann 2011). Paralleling the growth in insurance costs, the percentage of people without
health insurance rose (Kaiser Family Foundation 2013), leading many people to push for health
care reform.3 During the 2008 presidential election, health care reform was a major part of
Barack Obama’s platform. In March 2010, Congress narrowly passed the ACA, with the vote
occurring generally along party lines, and President Obama immediately signed the bill into law.
The ACA features a mandate that large employers provide full-time workers with
affordable coverage, along with a health insurance mandate for individuals, an expansion of
Medicaid, and subsidies for those purchasing coverage in the individual market. The ACA
employer mandate requires that companies with 50 or more FTEs offer affordable coverage to
their full-time employees or face a penalty. The act defines full-time employment as employment
that averages 30 hours or more per week and affordable coverage as an insurance plan that pays
for at least 60 percent of covered health care expenses and for which employees pay no more
than 9.66 percent of family income for the coverage.
Although originally scheduled to take effect January 1, 2014, the employer mandate was
delayed in various ways. In July 2013, the effective date of the employer mandate was delayed
until January 1, 2015, and in February 2014, the mandate for employers with 50–99 full-time
employees was further delayed until 2016 (Kennedy 2014). As of January 1, 2015, employers
with 100 or more FTEs were required to offer at least 70 percent of their full-time employees and
their dependents health insurance; that share rose to 95 percent on January 1, 2016. If an
employer subject to the mandate fails to offer health insurance and if at least one employee
purchases insurance through an exchange and receives a subsidy or tax credit, the employer is
3 In fact, people had been pushing for health care reform for many years, and previous attempts were made
to reform the health care system, perhaps most notably under the Clinton administration in 1993.

5
subject to a penalty equal to $2,160 multiplied by the number of full-time employees less 30
(less 80 in 2015). If an employer offers employees health insurance but that insurance fails to
pay for 60 percent of covered expenses or the premium exceeds 9.66 percent of family income,
the employer may also be subject to a penalty. Specifically, if, under these circumstances,
employees receive subsidized insurance in the exchanges, then the employer is subject to a
penalty of $3,240 for each employee receiving a tax credit or subsidy after the first 30 (80 in
2015). 4 As of January 1, 2016, the employer mandate became effective for all employers with
50 or more FTEs.
The nation has been divided on health care reform. The constitutionality of the ACA has
been challenged in federal courts. The U.S. Supreme Court upheld the constitutionality of the
individual mandate in National Federation of Independent Business v. Sebelius but ruled that
states did not have to expand Medicaid coverage. In King v. Burwell, the court ruled that people
who purchased insurance on the federal exchanges could be eligible for subsidies. The ACA was
a major factor in the 2012 presidential election, and Republicans in Congress have made many
attempts to repeal the legislation (Liptak 2012). Meanwhile, employers have voiced complaints
about the employer mandate, both because of the added reporting requirements and because of
the costs of expanded insurance coverage for employees. The Healthcare Trends Institute (2015)
reported that employers were finding it difficult to assemble disparate data sources from the
human resources, finance, insurance, and payroll departments and to reformat them for filing the
tax forms required for compliance with the employer mandate. It also found that those lacking
the ability to expand information technology infrastructure were increasingly outsourcing these
tasks to payroll companies. According to a 2013 survey, 88 percent of the employers polled
thought the ACA would increase their costs, and 4.7 percent reported that they already had
adjusted hours so that fewer employees qualify for insurance. Another 11.1 percent reported that
they would adjust hours in the future (Mrkvicka et al. 2013).
State Health Insurance Mandates: Hawaii and Massachusetts
4 These are the penalty amounts and the maximum percent that employees can pay each year as of 2016.
Because the penalties are indexed to inflation and the Internal Revenue Service sets the maximum percent that
employees can pay each year, all amounts are subject to change.

6
Prior to the passage of the ACA, two states—Hawaii and Massachusetts—required
employers to provide health insurance to employees. Hawaii’s Prepaid Health Care Act (PHCA),
passed in 1974, requires that all private-sector employers provide health insurance to employees
working more than 20 hours per week. Employers must pay at least 50 percent of the premium
cost, and the employee contribution is limited to 1.5 percent of an employee’s earnings. The
Hawaiian mandate exempts coverage of those with very low monthly earnings—less than 87
times the minimum hourly wage, which amounts to earning the minimum wage and working 20
hours per week. Like the ACA, employer-sponsored health insurance must cover minimum
benefits, which include inpatient and emergency-room hospital care, maternity care, and medical
and surgical services.
Although Hawaii’s health insurance mandate was passed in 1974, its legality was
successfully challenged on the grounds that the federal government regulates employer-
sponsored benefit programs under the Employee Retirement and Income Security Act (ERISA)
of 1974. In 1983, Congress granted a permanent exception to the PHCA. Hawaiian employers
who do not comply with the employer mandate face penalties and may be shut down
(Buchmueller, DiNardo, and Valletta 2011).
Hawaii’s employer mandate is notable in that it has been in effect for more than 30 years.
By requiring coverage of employees working as few as 20 hours per week (versus 30 in the
ACA) and by capping employee premium contributions at 1.5 percent of earnings (compared to
9.66 percent of family income), Hawaii’s mandate is considerably stronger than the mandate
contained in the ACA. Thus, the ACA employer mandate should not have been binding on
Hawaiian employers and should have had little if any effect on their behavior.5
The goal of Massachusetts health insurance reform, which was signed into law in 2006,
was to attain nearly universal coverage by expanding Medicaid, subsidizing insurance purchased
through the individual market, and mandating that individuals purchase coverage and employers
provide it. This three-pronged approach used in the Massachusetts health insurance reform was
5 Although we do not intend to draw broad conclusions from anecdotal evidence, we find it reassuring that
no Hawaiian employer is on Investor’s Business Daily list of employers that have reported shifting workers to part-
time work because of the ACA’s employer mandate. This is consistent with the ACA’s employer mandate having
minimal effects on Hawaiian employers, while, alternatively, most of the rest of the nation (44 states and the District
of Columbia) is represented on the list.

7
subsequently the model for the ACA, although the details of the Massachusetts health reform and
the ACA differ in key respects.
Massachusetts employers with at least 10 FTEs were subject to the Massachusetts
employer mandate, but, in a number of ways, the requirements of the Massachusetts mandate
were weaker than those in the ACA for large employers. First, the hours threshold defining part-
time employment was higher in the Massachusetts reform than in the ACA. Massachusetts
employers with more than 10 FTEs were required to provide coverage to all employees who
worked at least 35 hours per week, as compared to 30 hours per week in the ACA. Second, the
penalty structure for employers who failed to comply with the mandate was quite different.
Massachusetts employers who did not offer affordable coverage had to pay a penalty of $295 per
employee. Although for some employers the financial penalty for noncompliance could be
greater under the Massachusetts rules, the potential penalties for large employers—particularly
those with many low-wage workers—is considerably greater under the ACA (as described
above). Third, the definition of “affordable” differed between the Massachusetts reform and the
ACA. Under the Massachusetts reform, insurance was considered affordable if the employer
offered to pay at least 33 percent of the premium cost or if at least 25 percent of full-time
employees were enrolled in the plan.6 Under the ACA, the employee’s premium is capped at
9.66 percent of family income. Therefore, for low-wage workers whose employers are least
likely to voluntarily provide health insurance, the premium employers would be required to pay
would likely be higher under the ACA mandate.7 In anticipation of the federal law, the
Massachusetts employer mandate was repealed in 2013, and owing to delays in implementing the
ACA, large Massachusetts employers were not subject to any health insurance mandate for a
period of one to two years.
6 The vast majority of employers complied with the law. In 2010, 4.6 percent of employers who were
required to provide coverage were penalized for noncompliance (Goodnough 2012). 7 This section applies to states with and without Medicaid expansions. Because the ACA initially required
states to expand Medicaid eligibility to people earning less than 133 percent of the federal poverty level, it specified
that only people earning at least 133 percent of the federal poverty level are eligible for subsidies to purchase
insurance on the exchanges. In states with Medicaid expansions, working adults with incomes of less than 133
percent of the federal poverty level are eligible for Medicaid. In states that opted not to expand Medicaid after
National Federation of Independent Business v. Sebelius, people earning less than 133 percent of the federal poverty
level are not eligible for Medicaid or for subsidies on the exchanges. As penalties are triggered when a worker
receives a subsidy (and not from firms having uninsured workers or workers who receive Medicaid), neither case
would trigger a penalty for an employer.

8
In sum, while we expect that some Massachusetts employers would be affected by the
ACA mandate, the ACA mandate should have little or no effect on employer behavior in Hawaii,
because a more stringent mandate had been in operation in that state for decades prior to the
passage of the ACA. Reflecting that more stringent mandate, the incidence of employer-
sponsored health insurance is substantially higher in Hawaii than in any other state. To illustrate,
we pooled annual data on employees from the March CPS Supplement for the years 2005 to
2010—a period that represents the six years prior to the passage of the ACA—and estimated a
linear probability model on whether an individual received health insurance from his or her own
employer.8 The model controls for job and demographic characteristics (occupation, industry,
firm size, part-time status, gender) and year fixed effects. Figure 1, which plots the mean
residuals by state from this model, shows that Hawaii is an outlier. Controlling for job and
demographic characteristics, we find that Hawaiian employees were 21 percentage points more
likely to receive employer-sponsored coverage from their employer than the national average,
and the incidence in Hawaii was 15 percentage points higher than in Nevada, the state with the
next highest incidence of own employer-sponsored health insurance.
2. Theory and Prior Evidence on the Effects of Employer-Mandated Health Benefits
Although under the ACA large employers are required to provide health insurance
benefits to employees working 30 or more hours per week, employers will not necessarily pay
the cost of this benefit and may instead be able to shift some or all of the health insurance costs
onto workers. Summers (1989) argues that any mandated benefit will function like a tax at a rate
equal to the difference between the employer’s cost of providing the benefit and the employee’s
valuation of it. That is, a mandated benefit only functions like a tax on employers to the extent
that the employer’s costs of providing the benefit are not equal to the employee’s willingness to
pay for it. If employees fully value the new benefit, theory predicts that employees will bear its
costs through lower wages or other forms of compensation.
8 March CPS Supplements ask respondents about their health insurance coverage during the prior calendar
year, and therefore the responses pertain to the period 2004—2009.

9
In practice, even if employees fully value the benefit, however, employers’ ability to shift
their costs onto workers in the form of lower wages may be constrained by minimum wages or
union contracts. In addition, in a period of low inflation, as currently exists, employers may need
to cut nominal wages in order to reduce real wages to cover the benefit cost; nominal wage cuts
can have significant adverse consequences on worker morale and productivity. Moreover,
empirical evidence suggests that at the premium rates that employers have recently been
charging for health insurance benefits, take-up of those benefits has been declining in both small
and larger firms. In other words, there appears to be a growing gap between employer costs and
employees’ willingness to pay for these benefits.
Schultz and Doorn (2009) reviewed the existing literature on how employers respond to
increases in health insurance costs or health insurance mandates and found some shifting of the
costs of health benefit coverage to workers through lower wages. Gruber (1994), for example,
found evidence that mandated maternity benefits lowered the wages of demographic groups
likely to use the benefit. Kolstad and Kowalski (2012) studied the effects of the Massachusetts
mandate for employer-sponsored health insurance and found that employers complying with the
law lowered wages by an average of $6,058 annually; this compensating differential was only
slightly smaller in magnitude than the average cost to employers of providing the insurance,
suggesting that employees valued the benefits and thus were willing to accept lower wages.
Other research has found evidence that increases in health insurance costs or mandated health
insurance benefits leads to increases in hours worked (and overtime labor) among those with
health insurance coverage and increases in the percentage of workers that do not qualify for
benefits.9 If employers are unable to fully shift the cost of the mandated benefit onto workers,
they may pass along the costs to consumers in the form of higher prices, potentially reducing
demand for their products and resulting in lower employment levels.
Alternatively, employers may increase their use of workers in staffing arrangements that
are not covered by the employer mandate. In the case of the ACA, this involves workers
averaging less than 30 hours per week or working in organizations with fewer than 50 full-time
employees. Large employers may choose to reduce standard weekly hours below 30 hours per
9 See Schultz and Doorn (2009) for a review of the literature.
10
week for a larger share of the workforce. Because organizations with fewer than 50 FTEs are
exempt from the mandate, large employers also may outsource tasks to small contract
companies. In addition, although temporary workers with sufficiently long hours and prolonged
assignments may be subject to the mandate, typically they will be exempted. Federal rules
stipulate that to determine work hours for a particular employee, an employer may use up to a
12-month “look-back” period to establish whether an employee works an annual average of 30
hours per week. As a result, employers will not be required to offer insurance to many, if not
most, on-call and temporary workers.
To the extent that employers seek to circumvent the mandate, the types of staffing
arrangements used are likely to vary systematically across industries. Whether firms wishing to
avoid the mandate choose to cut workers’ hours or outsource tasks to independent contractors or
small firms will depend on the organization of production and the relative costs of using these
alternative arrangements. We expand on this point further below, but first we review existing
research evidence on firms’ use of alternative staffing arrangements to lower benefit costs.
Evidence on Use of Alternative Arrangements to Lower Benefit Costs
A large research literature has examined the many and diverse reasons organizations use
part-time, temporary, and contract employment arrangements. Staffing needs in many
organizations lend themselves to part-time schedules. For example, in retail, a store may wish to
bring in additional staff during peak hours, or, depending on its hours of operation, it may be
unable to staff exclusively with employees on 40-hour-per-week schedules. In the same way,
organizations typically use direct-hire or agency temporary workers to meet increased staffing
needs during temporary periods of higher demand or to fill in for absent employees. Contractors
are often used for their specialized expertise.10
Savings on health insurance and retirement benefits represent another factor widely
believed to affect certain organizations’ decisions to use or to expand their use of part-time,
temporary, and contract workers. Using Medical Expenditure Panel Survey–Insurance
Component (MEPS-IC) data from 1996 to 2004, Schultz and Doorn (2009) examined an
10 See Cappelli and Keller (2013) for a recent review of the literature.

11
organization’s change in staffing in response to an increase in health insurance costs and found
that a 1 percent increase in spending on health insurance benefits was associated with a 3.7
percent increase in part-time workers (when health insurance coverage was not offered to part-
time employees).
Several studies have examined the effects of employer mandates in state health insurance
reforms on staffing arrangements. Buchmueller, DiNardo, and Valletta (2011) argue that as
health insurance costs increased following the passage of Hawaii’s Prepaid Health Care Act,
employer incentives to pass along the costs of health insurance to workers or to circumvent the
mandate by using exempt part-time workers would grow. Using CPS data for the years 1979 to
2005, they find evidence that employers increasingly relied on low-hours part-time employees,
particularly among workers most affected by the mandate. Similarly, in a study of the
Massachusetts health insurance reform, we use CPS data and a difference-in-differences strategy
to study the mandate’s effect on part-time employment (Dillender, Heinrich, and Houseman,
forthcoming). We find a significant shift toward exempt part-time hours among low-educated
workers—who are the ones most likely to be affected by the employer mandate. Silber and
Condra (2013) show that from 2005 to 2007 temporary-help employment increased by 13.9
percent in Massachusetts compared to just 2.2 percent for the country overall, in spite of the fact
that overall growth in Massachusetts was weaker than in the aggregate economy. Any effect of
the Massachusetts health reform on employers’ use of temporary staffing is particularly hard to
disentangle, because the industry is highly cyclical and the Massachusetts reform was
implemented on the eve of the Great Recession. Even so, the authors point out that this pattern
suggests that a secular factor contributed to the growth of temporary-help employment in the
state during the period, which coincided with the implementation of health care reform.
To date, evidence of the effects of the employer mandate in the ACA on staffing
arrangements has been mixed. Even and Macpherson (2015) argue that although employers have
an incentive to shift new health insurance coverage costs to workers by requiring employee
contributions or reducing wages, because these strategies are less likely to work for low-wage
workers, employers will look for other ways to avoid complying with the coverage mandate for
low-wage workers. They use data from the CPS (1994–2014) to assess whether the ACA
employer mandate increased involuntary part-time employment. They apply a difference-in-

12
differences strategy to estimate the average percentage of workers (aged 19–64) by year that are
in involuntary (and voluntary) part-time employment and test whether the ACA effects show up
in more new part-time jobs that are held involuntarily.11 They find that involuntary part-time
employment was higher in 2014 than one would have expected, given economic conditions and
the composition of the labor market. Furthermore, their estimated increase in the probability of
involuntary part-time employment was highest for workers without a college degree and for
those earning lower wages in industries and occupations most likely to be affected by the ACA
mandate.
Alternatively, Mathur, Slavov, and Strain (2016) use CPS data from 2008 to 2014 to
examine the effects of the ACA mandate on part-time work. Using a difference-in-differences
strategy, they test whether there was an increase in those working 25–29 hours compared to 31–
35 hours in industries and occupations they deemed most likely to be affected by the mandate.
They conclude that the ACA mandate had no effect on part-time work, although the coefficients
in their models were imprecisely estimated. Pinkovskiy (2015) examines changes in
employment at the county level during the last U.S. recession and recovery period using data
from the Quarterly Census of Employment and Wages, the CPS, and the MEPS-IC. He finds that
counties more exposed to changes from the ACA had a statistically insignificant decline in their
part-time to full-time employment ratio. However, as he acknowledged, the ACA employer
mandate had not yet taken effect in the time period of his analysis, and thus his analysis does not
preclude the possibility of adverse labor market effects accompanying its full implementation.
3. Potential Effects of the ACA on Part-Time Employment and Descriptive Evidence
The potential effects of the ACA mandate on employer demand for short-hours part-time
workers will depend on the following factors: 1) the number of workers who are vulnerable to a
change in employment arrangement because of the mandate—workers who average 30 or more
hours a week and who are employed at firms with at least 50 FTEs, but whose employers did not
previously offer them health insurance coverage; 2) the cost of complying with the mandate—
i.e., offering health insurance that complies with the mandate; 3) the penalty for not complying
with the mandate; and 4) the cost of using more short-hours part-time workers, and how this cost
11 In contrast to our approach, they exclude Hawaii and Massachusetts from their estimations, citing the
earlier mandates in those states.

13
compares to the costs of using other employment arrangements (independent contractors, small
contractors, temporary workers) to circumvent the mandate.
With respect to the first factor, the ACA employer mandate may have little effect on
employer demand for short-hours part-time workers—or other alternative staffing
arrangements—if it largely codifies existing practices. In other words, the ACA mandate may
generally apply to employees who are already offered health insurance by their employers.
Indeed, in earlier work, we estimated that the large majority of wage and salary workers who are
not offered employer-sponsored insurance are not subject to the mandate because they work in
small firms or work fewer than 30 hours per week. Using 2008–2010 data from the March CPS,
which contains information on coverage by an own-employer plan, as well as statistics on
insurance take-up rates by industry, we estimate that only about 5 percent of the wage and salary
workforce is covered by the mandate but not already offered health insurance by their employers
(Dillender, Heinrich, and Houseman 2015). While these estimates are rough, they nevertheless
indicate that the share of the workforce that is vulnerable to a reduction in hours or other change
in staffing arrangement is relatively small.
For those covered by the mandate, an employer will also weigh the costs of complying
with it relative to the penalties associated with noncompliance. Prior to the mandate taking
effect, low-wage workers comprised the majority of those who were not offered health insurance
but were covered by the mandate, and the costs to employers of providing health insurance for
them are high both in an absolute sense and as a percentage of their wages. To illustrate,
consider a single, 40-year-old nonsmoker, who works 30 hours per week and earns $11 per hour,
or $16,500 per year. That individual earns slightly above the threshold that would make her
eligible for Medicaid in most states, but she would be eligible for assistance on the exchanges.
The average premium cost in 2016 of a bronze plan (which provides the minimum coverage
under the ACA) is $3,480 for this individual.12 Because the premium contribution from the
employee cannot exceed 9.66 percent of her income, the employer must cover at least $1,886 of
the premium, which amounts to 11.4 percent of the worker’s wage income. Particularly if take-
12 Information on average premium costs comes from the technology company HealthPocket, which
compiles and ranks information on health insurance plans, and can be found at
https://www.healthpocket.com/healthcare-research/infostat/2016-obamacare-premiums-
deductibles#.VxkL63osBOU.

14
up rates are expected to be high, then for employers with a large pool of low-wage workers, the
costs of offering health insurance to all full-time employees could constitute a substantial
percentage increase in labor costs. At the same time, as discussed above, the penalties firms face
for not complying with the mandate are potentially high.
Given the relatively high costs of complying with the mandate and the financial penalties
for noncompliance, some employers will have an incentive to circumvent the mandate by
altering the way they staff. Reflecting differences in the organization of production, however,
the types of staffing arrangements used are likely to systematically vary across industries.13
Certain service industries utilize staffing models that heavily rely on part-time employment and
algorithms to vary workers’ hours from week to week according to demand.14 In such industries,
the costs of reducing average weekly hours below the 30-hour threshold for certain employees to
circumvent the mandate may be relatively low. In other sectors, such as manufacturing,
production is organized around full-time shifts. The incidence of part-time employment is low,
and consequently reduction of weekly hours to avoid the mandate may be a costly strategy. Use
of temporary-help employment in manufacturing, however, is high. Although it is beyond the
scope of this paper, the rise of temporary-help employment since the Great Recession could
partly reflect a response to the ACA (Dillender, Heinrich, and Houseman (2015).
Even though the focus of our inquiry is on the effect of the ACA employer mandate on
employer demand for short-hours part-time work, it should be noted that the ACA may also
increase the supply of workers desiring part-time jobs. In the past, because of adverse selection
in insurance markets, individuals purchasing health insurance often faced very high premiums,
and many sought full-time jobs in order to have access to affordable health insurance through
their employers, who had group rates. By prohibiting price discrimination based on preexisting
health conditions and by providing affordable care to individual buyers on the exchanges, the
ACA is expected to reduce the hours that individuals choose to work; it thereby may increase
voluntary part-time employment. In addition, low-earnings workers receive subsidies for health
insurance, and those subsidies are phased out as earnings increase. The resulting high effective
13 We developed this argument originally in Dillender, Heinrich, and Houseman (2015). 14For evidence on such practices, see University of Chicago Work Scheduling Study reports and papers,
available at http://ssascholars.uchicago.edu/work-scheduling-study/work-scheduling-study-papers.
15
marginal tax on earned income for these workers may, for some, reduce the number of work
hours they desire (CBO 2014). For that reason, we distinguish between involuntary and
voluntary part-time employment. Although an increase in voluntary part-time employment could
be the consequence of a supply-side or demand-side response, an increase in involuntary part-
time employment would only be consistent with increased employer demand for part-time
scheduling.15
The CPS, the Bureau of Labor Statistics monthly household survey that covers around
60,000 households, is the primary source for data on employment and hours in the United States.
For individuals working part-time, the CPS collects information on whether part-time
employment is voluntary (i.e., the individual works part-time for personal reasons) or
involuntary (i.e., the individual works part-time for economic reasons—specifically, she cannot
find full-time work or her employer has reduced her work hours).16 A number of observers have
noted that, although it has fallen during the recovery period, the rate of involuntary part-time
employment has remained higher than would be expected given the state of the macroeconomy,
suggesting that structural factors help to explain why it has a higher incidence today than before
the recession (e.g., Valletta and van der List 2015). In addition, higher-than-normal involuntary
part-time employment has been concentrated in sectors with high baseline rates of part-time
employment (Dillender, Heinrich, and Houseman 2015; Robertson and Terry 2014).
Figures 2 and 3 depict the percentage of employees working fewer than 30 hours per
week voluntarily and the percentage working fewer than 30 hours per week for economic
reasons, respectively, for selected sectors for the years 2003 to 2015.17 Although the rate of
voluntary part-time employment displays seasonal fluctuations, no cyclical or secular trends are
evident. The fluctuation in the rate of part-time employment over the business cycle is due
entirely to changes in the incidence of part-time employment for economic reasons. The rate of
15 Studying Hawaii also helps us focus more narrowly on the effects of the employer mandate, since
Hawaii, along with the rest of the nation, has experienced the other features of the ACA, in particular the individual
mandate and expanded Medicaid coverage. 16 Although the American Community Survey has a much larger sample than the CPS, it does not ask about
hours worked at a specific job, nor does it probe respondents as to the reasons they work part-time, thus making it
insufficient for our study. 17 The figures come from authors’ tabulations of the monthly CPS public use files. Omitted sectors have
very low rates of part-time and involuntary part-time employment and were dropped from the figures to improve
their readability.

16
involuntary part-time employment jumped during the recession in 2008 and 2009 and has
remained stubbornly high in accommodations and food services and in retail. Other sectors also
registered increases in involuntary part-time employment during the recession, but they are less
pronounced, and the drop in involuntary part-time employment during the recovery has been
proportionately greater than in accommodations and food services and retail.
These patterns of persistently high low-hours involuntary part-time employment in the
accommodations and food services sector and the retail sector are plausibly consistent with an
employer response to the ACA mandate in two ways. First, prior to the mandate taking effect,
these sectors accounted for a large and disproportionate share of workers who would be covered
by the mandate but who were not offered health insurance. Although they accounted for only 20
percent of wage and salary employment, they accounted for an estimated 42 percent of workers
vulnerable to a change in staffing arrangements (Dillender, Heinrich, and Houseman 2015).
Given the large numbers and exceptionally high concentration of vulnerable workers in these
sectors, it is plausible that any response to the mandate would be detected there. Second, for
employers who wish to sidestep the mandate by changing the way they staff some positions,
shortening hours is likely to be a particularly attractive alternative. Almost 70 percent of the
workers in jobs identified as vulnerable to a staffing change in these sectors worked between 30
and 39 hours per week, and so were relatively close to the 30-hour threshold (Dillender,
Heinrich, and Houseman). Moreover, the organization of work in these sectors has long made
heavy use of variable-hours scheduling and low-hours part-time employment. Case studies have
documented the extensive use of variable-hours scheduling in these sectors, and survey evidence
from the National Longitudinal Survey of Youth (NLSY) shows that three out of the four
occupations with the greatest variability in hours were core occupations in these sectors: retail
workers, food service workers, and janitors and cleaners (Henly and Lambert 2015; Lambert,
Fugiel, and Henly 2014). These institutional factors suggest that it would be relatively
straightforward for many employers in these sectors to cut hours, particularly the hours of those
close to the 30-hour threshold, should they wish to sidestep the mandate.
Although workers in retail, accommodations, and food services are likely most
susceptible to having their hours reduced because of the employer mandate, adjusting workers’
hours may not be costless even for employers in these industries. Once workers’ schedules are
17
established, cutting their weekly hours below 30 may lower morale, and even in the retail,
accommodations, and food service sectors, reconfiguring established staffing patterns may
disrupt business operations in the short run. That said, in view of the fact that short-hours part-
time work was elevated at the time that ACA was passed (during the Great Recession), one
possible response of the affected employers would be to slow or halt the increase in workers’
weekly hours to pre-ACA levels while the economy gradually emerged from the Great Recession
(rather than raising workers’ hours and then reducing them again once the employer mandate
was implemented).
The possibility that employers responded to the ACA by not raising hours after the Great
Recession has implications for our analysis. In particular, we may see effects of the ACA on
part-time work immediately after the ACA was passed if workers in the control group (Hawaii)
experience an increase in hours as the economy emerges from the Great Recession, while other
workers do not because employers affected by the mandate want fewer full-time workers than
before the Great Recession. In addition, it is important to note that this paper is considering the
effects of the ACA employer mandate as the economy recovers from the Great Recession; the
ACA may have had a different effect on part-time work had it been enacted during better
economic conditions. Thus, we may see employers alter their responses to the employer mandate
as the economy becomes stronger. Determining if the longer-term effects of the ACA differ from
the short-term effects is a question we leave for future research, once more years of data are
available. We turn now to formally testing the effects of the ACA on part-time employment.
4. Methodology and Data
Our methodology for estimating the effects of the ACA employer mandate on short-hours
part-time employment exploits the fact that this mandate should have virtually no effect on
employer, or household, behavior in Hawaii. To determine the effect of the ACA on the
probability of holding a short-hours part-time job in the other states, where the mandate would be
binding, we estimate the following difference-in-differences equation:
(1) 𝑦𝑖𝑗𝑠𝑡 = 𝛼𝑋𝑖𝑠𝑡 + 𝑢𝑛𝑒𝑚𝑝𝑠𝑡𝜆 + 𝑝𝑜𝑠𝑡𝐴𝐶𝐴𝑡 × 𝐻𝐼𝑠𝛽 + 𝛾𝑡 + 𝜙𝑠 + 𝜃𝑗 + 𝜖𝑖𝑠𝑡.
Outcome y is an indicator variable measuring whether individual i working in sector j in state s
and time t is in a short-hours part-time job. We estimate models in which the outcome measure

18
includes all short-hours part-time employment, and we also estimate models in which the
outcome measure is restricted to part-time employment for economic reasons (i.e., involuntary).
The regression model controls for demographic and job characteristics (age, age2, gender,
education, race and ethnicity, occupation); the state monthly unemployment rate; and month-
year, state, and major sector fixed effects. The period following the passage of the ACA is
interacted with Hawaii, and the coefficient 𝛽 captures differences between Hawaii and the other
states in the probability of being part-time that did not exist prior to the act’s passage.
As discussed earlier, there are reasons to think that many employers began to adjust their
behavior shortly after the act’s passage in response to the prospect of the mandate. Although the
employer mandate was postponed in July 2013 and did not take effect until January 2015 for
employers with 100 or more FTEs, it is plausible that many employers would have begun their
adjustment to the mandate years before the mandate took effect. If employers wished to cut the
hours of existing employees to avoid the mandate, legally they would need to establish that those
employees’ hours fell below the 30-hour-per-week threshold in the year before the start of the
mandate—which according to the original schedule would have been 2013. In addition, it bears
noting that in the initial years following the ACA’s passage regulations had not been fully
promulgated, there was much confusion about the law’s requirements, and opposition to the
mandate was intense among many businesses. In light of the confusion and hype surrounding
the ACA, some businesses that had cut hours during the recession may have decided not to
increase workers’ hours in anticipation of the mandate, even as demand recovered. For these
reasons, we do not make any strong assumptions about the year that we would expect employers
to start responding to the employer mandate, and we estimate a different year coefficient for the
ACA for 2009 to 2015.
We also expect that the incentives employers have to shorten hours of work to
circumvent the mandate will vary substantially across industries. In particular, as detailed above,
we expect that the financial benefits would be potentially relatively high and costs relatively low
for shortening hours to circumvent the mandate in the retail and the accommodations and food
services sectors, and we expect that any impacts of the ACA employer mandate on short-hours
part-time work will be concentrated in these sectors, except in Hawaii. In view of this, we also
estimate the following triple-difference specification:

19
(2) 𝑦𝑖𝑗𝑠𝑡 = 𝛼𝑋𝑖𝑠𝑡 + 𝑝𝑜𝑠𝑡𝐴𝐶𝐴𝑡 × 𝑅𝐴𝐹𝑗 × 𝐻𝐼𝑠𝛽 + 𝛾𝑠𝑡 + 𝜙𝑗=𝑅𝐴𝐹,𝑠 + 𝜃𝑗=𝑅𝐴𝐹,𝑡 + 𝜖𝑖𝑗𝑠𝑡
Along with controls for demographic and job characteristics, the triple-difference specification
includes a more extensive set of fixed effects—state-month-year; state interacted with
employment in retail, accommodations, and food services (RAF); and month-year interacted with
RAF—that control for other factors potentially affecting the probability of short-hours part-time
employment.18 In Equation (2), 𝛽 captures the change, following the passage of the ACA, in the
in the probability of short-hours part-time work in the RAF sector in Hawaii compared to the
probability of short-hours part-time work in the RAF sector in other states that is not explained
by differences in general economic conditions between the pre- and post-ACA period in Hawaii
relative to the rest of the country.19
We estimate Equations (1) and (2) using CPS data. In addition to collecting information
on workers’ demographic and job characteristics, the survey collects information on usual
weekly hours worked in up to two jobs, and, if total usual hours are less than 35 (the BLS
definition of part-time employment), on whether the individual worked part-time for personal
(voluntary) or economic (involuntary) reasons. The latter consists of workers whose employers
have reduced their work hours or who indicate that they cannot find full-time work. We classify
individuals as part-time based on their usual hours worked in their main job. Although data on
weekly hours include the full range of possible integer values, responses tend to bunch at five-
hour increments (e.g., 20, 25, 30, 35, 40), suggesting that many respondents round their reported
hours. In constructing measures of short-hours part-time employment, we therefore use two
alternative cutoffs: work involving less than 30 hours per week in the main job (corresponding to
the threshold that applies in the ACA mandate) and work involving 30 hours or less per week in
the main job. The latter measure likely includes many who, in practice, work somewhat below
18 The inclusion of state-month-year fixed effects in Equation (2) obviates the need for including state
unemployment rate as a control. 19 In experimental terminology, Hawaii is the one “untreated” state, the state that is unaffected by the ACA
employer mandate. Point estimates for β would be equal and opposite in sign if we were instead to interact an
indicator for belonging to the set of treated states with the post-ACA time period.

20
(or above) 30 hours. In addition, we estimate equations with the outcome variable indicating any
short-hours part-time work and indicating only involuntary short-hours part-time work.20
Our sample includes wage and salary workers aged 18 to 64; self-employed are excluded
from the sample because the employer mandate does not apply to their situation. We present
estimates of models over two time periods: 2003–2015 and 1994–2015. Although the longer
time period, which incorporates two recessions, would generally be preferable, Buchmueller,
DiNardo, and Valletta (2011) argue that Hawaiian employers continued to adjust behavior to the
mandate as health insurance premium costs kept rising through the 1990s. We show that our
findings are not sensitive to time period.
5. Results
Table 1 presents results for the difference-in-differences specification in Equation (1).
Selected coefficient estimates for four outcomes are displayed: 1) working fewer than 30 hours
per week, 2) working 30 or fewer hours per week, 3) working fewer than 30 hours per week for
economic reasons, and 4) working 30 or fewer hours per week for economic reasons. As
described earlier, to show the time patterns of any response, we interact residence in Hawaii with
the year before and the year of the ACA’s passage (2009, 2010) and each year following the
act’s passage. We also present Wald tests for the joint significance of the coefficients on the
post-ACA period. All observations are weighted using the CPS weights. In addition, because
individuals in the CPS may appear in the data up to eight times, we cluster standard errors on
individuals.21
Panel A of Table 1 reports coefficient estimates of the interaction of Hawaii with year
from models based on the sample of workers employed in all sectors. If the passage of the ACA
20 The question concerning the reason for part-time work is only asked of those who were at work during
the survey week and who usually work fewer than 35 hours per week in up to two jobs. It is possible that an
individual has her hours reduced below 30 hours per week on a main job and picks up a second job that boosts her
hours to 35 or above. That individual would not be counted as involuntarily part-time on the main job. The share of
individuals with second jobs is very small—about 5 percent. In addition, some workers report that their weekly
hours are variable, and they are subsequently asked if their usual hours are part-time or full-time. We classify
variable-hours workers who indicate they usually work part-time as short-hours part-time, although deleting them
from our sample has no substantive effect on our results. 21 The CPS has a limited longitudinal structure. Participating households are in the sample for four months,
out of the sample for eight months, and then included in the sample for four months.

21
led to greater low-hours part-time employment except in Hawaii, one would expect that the
coefficients on the Hawaii interaction terms would be negative after 2010. These coefficient
estimates, however, are near zero and never statistically significant.
Panels B and C of Table 1 display coefficient estimates for models restricted to workers
employed in retail, accommodations, and food services and workers employed in all other
sectors, respectively. For the sample of workers in retail, accommodations, and food services,
the coefficient estimates on the Hawaii-year interaction terms become large and negative
beginning in 2011, and, except for 2015, are statistically significant at conventional levels. In all
specifications, tests of joint significance suggest that, following the ACA’s passage, the
probability of being in a short-hours part-time job and of being involuntarily in a short-hours
part-time job was significantly lower in Hawaii than in the rest of the United States relative to
the differential during the period prior to the passage of the ACA. A comparison of estimates
from models in which the dependent variable measures all short-hours part-time work with those
in which the dependent variable is short-hours part-time work for economic reasons reveals that
the coefficient estimates for the Hawaiian interaction term are generally only slightly more
negative in the former than in the latter. This indicates that most of the effect is coming from
involuntary part-time employment and so is demand driven. Estimates from a model in which
the dependent variable is specified as voluntary short-hours part-time employment (not reported
in Table 1) confirm that coefficient estimates on the Hawaiian interaction term during the post-
ACA period are not jointly statistically significant.22 Panel C coefficient estimates on the
Hawaii-year interaction terms are uniformly near zero and insignificant for the period following
the ACA’s passage, indicating the mandate has to date had little discernible effect on short-hours
part-time employment in other sectors.
In view of these results, we estimate the triple difference specification of Equation (2),
providing a more rigorous test of the hypothesis that in affected states the ACA increased short-
hours part-time employment—in particular, involuntary short-hours part-time employment—in
retail, accommodations, and food services. As the results in Table 1 suggest that employers in the
rest of the nation began changing their use of part-time work relative to employers in Hawaii in
22 P-values are 0.73 and 0.48 for voluntary part-time employment less than 30 hours and voluntary part-
time employment of 30 hours or less, respectively.

22
2011, we define the post-ACA period in Equation (2) as 2011 and later in computing the average
effect of the ACA. This model includes an extensive set of fixed effects in order to control for
other factors that might affect changes in short-hours part-time employment in the Hawaiian
retail, accommodations, and food services sectors relative to the rest of the country and to other
Hawaiian sectors following the passage of the ACA. In addition, because of concerns that
standard errors may be understated in difference-in-differences specifications when the number
of treated and untreated states is unbalanced, we estimate a series of placebo tests to assess the
statistical significance of our estimates.23 Specifically, for Equation (2), we rerun each
specification 50 times, substituting one of the other 49 states or the District of Columbia for
Hawaii in the interaction with employment in retail, accommodations, or food services following
the passage of the ACA. The fraction of placebo runs for which the coefficient on this state
interaction term is less than the coefficient for the Hawaiian interaction term provides a
conservative test of statistical significance.
The top panel of Table 2 reports the results of this specification using data for the period
2003–2015. The first two columns display the coefficient on the Hawaiian interaction term for
models in which the dependent variable captures all short-hours part-time employment, defined
either as less than 30 hours or as 30 hours or less per week, respectively. These estimates
indicate that the ACA increased short-hours part-time employment on the order of two to three
percentage points. In only four of the placebo tests (8 percent) were the interaction terms less
than that of Hawaii’s, suggesting the estimates are moderately significant (one-tailed test). The
third and fourth columns report results from models in which the dependent variable is defined
as short-hours part-time employment for economic reasons. The point estimates on the Hawaiian
interaction terms are only 0.04 to 0.08 points less than the corresponding estimates in the first
two columns, indicating that most of the estimated effect of the mandate arises from an increase
in involuntary short-hours part-time work. Moreover, in none of the placebo models was the
coefficient on the state interaction term smaller than that for Hawaii, indicating strong statistical
significance.
23 See Conley and Taber (2013) and Buchmueller, DiNardo, and Valletta (2011) for discussions of potential
biases to standard errors when there are few treated (or in our case untreated) states. Our approach, which generates
p-values based on a set of placebo estimates, follows that in Buchmueller, DiNardo, and Valletta.

23
Panel B displays models estimated over the years 1994–2015. In the first two columns,
where the dependent variable is defined as any short-hours part-time employment, coefficient
estimates for the Hawaiian interaction term are quite similar to those displayed in panel A for the
shorter time period, and just two placebo estimates (4 percent) are smaller. In the third and fourth
columns, where the dependent variable is involuntary short-hours part-time employment, the
coefficient estimates on the Hawaiian interaction terms are only slightly smaller (0.001 to 0.003
points) than their counterparts for any short-hours part-time employment and are highly
significant; no placebo estimate is smaller. Our estimates imply that the ACA increased
involuntary short-hours part-time employment by 2.4 to 3.1 percentage points—or about 600,500
to 800,500 workers—in retail, accommodations, and food services.
The models reported in Table 2 include a single interaction of employment in the
Hawaiian retail, accommodations, and food sectors with the period following the passage of the
ACA. We also estimated equations that interact Hawaiian employment in these sectors with an
indicator variable for each year. For models with involuntary short-hours part-time employment
as the dependent variable, we display coefficient estimates on these interaction terms, along with
the 95 percent confidence intervals, in Figures 4 and 5. Figure 4 results are from models
estimated on the 2003–2015 period, and Figure 5 results are from models estimated on the 1994–
2015 period. Although individual-year interaction terms are imprecisely estimated, in each set
there is a noticeable drop in the point estimates in 2011 to 2015 relative to the earlier period.
Interestingly, there is a narrowing of the differential in 2015. This narrowing arises primarily
from a jump in involuntary part-time employment in the Hawaiian retail, accommodations, and
food sectors. More years of data will be needed to determine if the significant differential
apparent following the passage of the ACA persists as employers come to better understand and
adjust to the mandate and as macroeconomic conditions change.
6. Conclusion
Since the passage of the ACA in 2010, there has been considerable speculation that there
would be a widespread reduction in weekly scheduled hours below the 30-hour threshold by
employers seeking to avoid its mandate. Those predictions, however, ignore the fact that the
majority of workers who, prior to the ACA, were not receiving offers of health insurance

24
coverage from their employer were not covered by the mandate. In an earlier work, we estimate
that at the time of the act’s passage only about 5 percent of wage and salary workers would be
covered by the mandate but were not already receiving an offer of employer-sponsored health
insurance and so would be potentially vulnerable to a reduction in hours (Dillender, Heinrich,
and Houseman 2015). Moreover, we emphasize that although compliance with the mandate
could result in a substantial percentage increase in compensation for some—particularly low-
wage workers—employers will have to weigh any increase in costs associated with offering
health insurance against the costs of reorganizing work around short-hours schedules. Such
reorganization may often be costly and infeasible, and in these circumstances firms will likely
comply with the mandate or use other mechanisms, such as outsourcing, to circumvent it.
We find strong evidence that the ACA increased short-hours part-time employment, but
only in sectors where a large concentration of workers was affected by the mandate and where
use of variable weekly scheduling and low-hours part-time employment was already prevalent.
Specifically, exploiting the fact that the employer mandate was not binding in Hawaii in
difference-in-differences and triple-difference models, we estimate that the short-hours part-time
employment increased by two to three percentage points in retail, accommodations, and food
services; almost all of the increase was the result of an increase in involuntary part-time
employment, indicating that employer demand, not worker supply, was the cause of the growth
in short-hours part-time employment. Our results contrast with those of most existing studies of
the effects of the ACA on part-time employment.24 This, we suspect, is because in aggregate the
effects will be small as a percentage of the workforce and because most prior studies are
insufficiently powered or targeted to detect effects in sectors where they are likely concentrated.
Our study identifies causal effects resulting from employers’ initial reactions to the
mandate. Those effects could change over time. Our time analysis measures responses during
the period following the passage of the ACA through the first year of implementation for
employers with 100 or more FTEs. During much of the period, the regulations governing the
mandate were being developed, and there was much confusion among employers over their
costs. The period was also marked by strong opposition to the mandate among many employers,
24 The notable exception is Even and MacPherson (2015), which, although using a quite different
methodology from our study, examines effects by industry and occupation.

25
which may have been associated with some exaggeration of potential costs. As employers learn
about the actual cost implications of the mandate in their circumstances, behavior may change.
In addition, it is important to recognize that the effects of the mandate on staffing arrangements
are not independent of economic conditions. If the economy continues to substantially improve
and labor markets tighten, more employers may find it in their interests to offer longer work
hours and health insurance benefits. In a different way, an increase in inflation could increase
the probability that employers offer workers health insurance, by making it easier for them to
pass along premium costs in the form of lower real wages without cutting nominal wages. There
is a need, therefore, for future studies of the effects of the ACA mandate on part-time
employment, as well as on other staffing arrangements, which have not been addressed in this or
other research.

26
References
Auerbach, David I., and Arthur L. Kellermann. 2011. “A Decade of Health Care Cost Growth
Has Wiped Out Real Income Gains for an Average U.S. Family.” Health Affairs 30(9):
1630–1636. http://content.healthaffairs.org/content/30/9/1630.full.pdf+html (accessed
June 6, 2016).
Buchmueller, Thomas C., John DiNardo, and Robert G. Valletta. 2011. “The Effect of an
Employer Health Insurance Mandate on Health Insurance Coverage and the Demand for
Labor: Evidence from Hawaii.” American Economic Journal: Economic Policy 3(4): 25–
51.
Cappelli, Peter, and J. R. Keller. 2013. “Classifying Work in the New Economy.” Academy of
Management Review 38(4): 575–596.
Centers for Medicare and Medicaid Services. 2014. “NHE Summary Including Share of GDP,
1960–2012.” Baltimore, MD: Centers for Medicare and Medicaid Services.
http://www.cms.gov/Research-Statistics-Data-and-Systems/Statistics-Trends-and-
Reports/NationalHealthExpendData/NationalHealthAccountsHistorical.html (accessed
June 6, 2016).
Congressional Budget Office (CBO). 2014. Labor Market Effects of the Affordable Care Act:
Updated Estimates. Appendix C. Washington, DC: Congressional Budget Office.
http://www.cbo.gov/sites/default/files/cbofiles/attachments/45010-breakout-
AppendixC.pdf (accessed June 6, 2016).
Conley, Timothy G., and Christopher R. Taber. 2013. “Inference with ‘Difference in
Differences’ with a Small Number of Policy Changes.” Review of Economics and
Statistics 93(1): 113–125.
Dillender, Marcus, Carolyn J. Heinrich, and Susan N. Houseman. 2015. “The Potential Effects of
Federal Health Insurance Reforms on Employment Arrangements and Compensation.”
Upjohn Institute Working Paper No. 15-228. Kalamazoo, MI: W. E. Upjohn Institute for
Employment Research. http://research.upjohn.org/up_workingpapers/228/ (accessed June
6, 2016).
———. Forthcoming. “Health Insurance Reform and Part-Time Work: Evidence from
Massachusetts.” Labour Economics.
Even, William E., and David A. Macpherson. 2015. “The Affordable Care Act and the Growth
of Involuntary Part-Time Employment.” Working paper, University of Miami.
Goodnough, Abby. 2012. “In Massachusetts, Insurance Mandate Stirs Some Dissent.” New York
Times, March 27.
Gruber, Jonathan. 1994. “The Incidence of Mandated Maternity Benefits.” American Economic
Review 84(3): 622–641.

27
Hancock, Jay. 2013. “Health Law Could Boost Use of Temp Workers.” Washington Post,
March 25.
Healthcare Trends Institute. 2015. “Many Employers Need Third-Party Payroll Support to
Handle ACA Compliance.” News release, April 22. Minneapolis, MN: Healthcare
Trends Institute.
Henly, Julia R., and Susan J. Lambert. 2015. Work Scheduling Study: A Profile of Retail Sales
Associates in a Women’s Apparel Firm. Chicago: University of Chicago School of Social
Service Administration. https://ssascholars.uchicago.edu/sites/default/files/work-
scheduling-study/files/wss_profile_of_retail_sales_associates.pdf (accessed June 6,
2016).
Kaiser Family Foundation. 2013. Key Facts about the Uninsured Population. Menlo Park, CA:
Kaiser Family Foundation. http://kff.org/uninsured/fact-sheet/key-facts-about-the-
uninsured-population/ (accessed June 6, 2016).
Kennedy, Kelly. 2014. “Another Part of the Affordable Care Act Delayed for a Year.” USA
Today, February 10.
Kolstad, Jonathan T., and Amanda E. Kowalski. 2012. “Mandate-Based Health Reform and the
Labor Market: Evidence from the Massachusetts Reform.” NBER Working Paper No.
17933. Cambridge, MA: National Bureau of Economic Research.
Lambert, Susan J., Peter J. Fugiel, and Julia R. Henly. 2014. Precarious Work Schedules among
Early-Career Employees in the U.S.: A National Snapshot. Chicago: University of
Chicago.
Liptak, Adam. 2012. “Supreme Court Upholds Health Care Law, 5-4, in Victory for Obama.”
New York Times, June 28.
Mathur, Aparna, Sita Nataraj Slavov, and Michael R. Strain. 2016. “Has the Affordable Care Act
Increased Part-Time Employment?” Applied Economic Letters 23(3): 222–225.
http://www.tandfonline.com/doi/pdf/10.1080/13504851.2015.1066483 (accessed June 6,
2016).
Mrkvicka, Neil, Justin Held, Julie Stich and Kelli Kolsrud. 2013. Employer-Sponsored Health
Care: ACA’s Impact. Brookfield, WI: International Foundation of Employee Benefit
Plans.
Pinkovskiy, Maxim. 2015. The Affordable Care Act and the Labor Market: A First Look.
Federal Reserve Bank of New York Staff Report No. 746. New York: Federal Reserve
Bank of New York.
Robertson, John, and Ellyn Terry. 2014. Part-Time for Economic Reasons: A Cross-Industry
Comparison. Atlanta: Federal Reserve Bank of Atlanta.

28
http://macroblog.typepad.com/macroblog/2014/07/part-time-for-economic-reasons-a-
cross-industry-comparison.html (accessed May 2, 2016).
Silber, Jeffrey M., and Paul Condra. 2013. “Thoughts from 2013 Staffing Industry Executive
Forum.” Toronto, ON: BMO Capital Markets.
Schultz, Jennifer Feenstra, and David Doorn. 2009. “Employer Health Benefit Costs and
Demand for Part Time Labor.” CES Working Paper 09-08: Washington, DC: Center for
Economic Studies, U.S. Census Bureau.
Summers, Lawrence H. 1989. “Some Simple Economics of Mandated Benefits.” American
Economic Review 79(2): 177–183.
Valletta, Rob, and Catherine van der List. 2015. “Involuntary Part-Time Work: Here to Stay?”
FRBSF Economic Letter. San Francisco: Federal Reserve Bank of San Francisco.
http://www.frbsf.org/economic-research/publications/economic-
letter/2015/june/involuntary-part-time-work-labor-market-slack-post-recession-
unemployment/ (accessed May 2, 2016).
Vistnes, Jessica, Alice Zawacki, Kosali Simon, and Amy Taylor. 2010. “Declines in Employer
Sponsored Coverage Between 2000 and 2008: Offers, Take-Up, Premium Contributions,
and Dependent Options.” CES Working Paper 10-23. Washington, DC: Center for
Economic Studies, U.S. Census Bureau.

Table 1 Effects of the ACA on Part-Time Employment: Hawaii Relative to the Rest of the United States, Difference-in-Differences SpecificationPanel A: All industries Panel B: Retail, accommodations and food services Panel C: All other industries
Interaction Hawaii with:
Working < 30 hrs/wk
Working ≤ 30 hrs/wk
PT economic reasons,
< 30 hrs/wk
PT economic reasons,
≤ 30 hrs/wkWorking
< 30 hrs/wkWorking
≤ 30 hrs/wk
PT economic reasons,
< 30 hrs/wk
PT economic reasons,
≤ 30 hrs/wkWorking
< 30 hrs/wkWorking
≤ 30 hrs/wk
PT economic reasons,
< 30 hrs/wk
PT economic reasons,
≤ 30 hrs/wk2009 0.0035 0.0017 0.0049~ 0.0036 −0.0054 −0.0119 0.0015 −0.0023 0.0037 0.0033 0.0034 0.0021
(0.006) (0.006) (0.003) (0.003) (0.012) (0.013) (0.007) (0.008) (0.006) (0.007) (0.003) (0.003)
2010 0.0039 0.0056 0.0113** 0.0154** −0.0177 −0.0227 0.0052 0.0088 0.0075 0.0111 0.0099** 0.0132**(0.006) (0.006) (0.003) (0.004) (0.013) (0.014) (0.008) (0.009) (0.006) (0.007) (0.004) (0.004)
2011 0.0004 −0.0015 −0.0006 −0.0008 −0.0301* −0.0414** −0.0194** −0.0270** 0.0077 0.0085 0.0032 0.0047(0.006) (0.006) (0.003) (0.003) (0.013) (0.014) (0.007) (0.008) (0.006) (0.007) (0.003) (0.004)
2012 −0.0034 −0.0030 −0.0019 −0.0032 −0.0263* −0.0289* −0.0168* −0.0213** 0.0012 0.0023 0.0009 −0.0000(0.006) (0.006) (0.003) (0.003) (0.013) (0.014) (0.007) (0.008) (0.007) (0.007) (0.003) (0.003)
2013 −0.0037 −0.0047 −0.0022 −0.0049 −0.0262* −0.0322* −0.0230** −0.0328** 0.0011 0.0009 0.0024 0.0016(0.006) (0.006) (0.003) (0.003) (0.012) (0.014) (0.006) (0.007) (0.006) (0.007) (0.003) (0.003)
2014 −0.0035 −0.0059 −0.0001 −0.0024 −0.0359** −0.0532** −0.0200** −0.0313** 0.0033 0.0053 0.0039 0.0040(0.006) (0.007) (0.003) (0.003) (0.014) (0.015) (0.007) (0.008) (0.006) (0.007) (0.003) (0.004)
2015 0.0070 0.0077 0.0036 0.0020 −0.0091 −0.0183 −0.0062 −0.0114 0.0094 0.0126~ 0.0051 0.0041(0.006) (0.007) (0.003) (0.003) (0.014) (0.015) (0.007) (0.008) (0.007) (0.007) (0.003) (0.003)
R-sq. 0.13 0.15 0.03 0.04 0.16 0.19 0.03 0.03 0.10 0.11 0.02 0.02Joint significance of estimates for post-ACA period (2011–15), p-values
0.67 0.54 0.77 0.59 0.02 0.00 0.00 0.00 0.67 0.52 0.50 0.57
N All industries = 8,094,919 All retail, accommodations, and food services = 1,475,840
All other industries = 6,619,079
NOTE: Each column represents a separate regression with the indicated dependent variable. Reported coefficient estimates are for variables measuring the interaction of Hawaii with the indicated year. All models also include month-year, state, and industry fixed effects; interactions of industry dummy variables with Hawaii; controls for demographic and job characteristics (age, age2, gender, race-ethnicity, education, occupation); and state-month-year unemployment rate. Data come from the monthly CPS covering the period January 2003 through December 2015. Observations include wage and salary workers aged 18–64. Observations are weighted by the CPS weights, and standard errors are clustered on individuals. ~ denotes significance at the 0.10 level, * at the 0.05 level, and ** at the 0.01 level.
SOURCE: Authors’ calculations using CPS data.

Table 2 Effects of ACA on Part-Time Employment: Hawaii Relative to Rest of U.S., Triple Difference SpecificationDependent variable:
(1) (2) (3) (4)Working
< 30 hrs/wkWorking
≤ 30 hrs/wkPT economic reasons,
< 30 hrs/wkPT economic reasons,
≤ 30 hrs/wkPanel A: 2003–2015
Hawaii × retail-hotel-food × post-ACA
−0.0237** −0.0322** −0.0179** −0.0247**
(0.008) (0.008) (0.004) (0.004)Fraction of placebo
estimates smaller than Hawaii's
0.08 0.08 0.00 0.00
R-sq. 0.12 0.14 0.03 0.04N 8,094,919 8,094,919 8,094,919 8,094,919
Panel B: 1994–2015Hawaii × retail-hotel-
food × post-ACA−0.0251** −0.0344** −0.0240** −0.0313**
(0.007) (0.007) (0.003) (0.004)Fraction of placebo
estimates smaller than Hawaii’s
0.04 0.04 0.00 0.00
R-sq. 0.12 0.14 0.03 0.03N 13,478,440 13,478,440 13,478,440 13,478,440NOTE: Each column represents a separate regression with the indicated dependent variable. Reported coefficient estimates are for variables
measuring the interaction of employment in the Hawaiian retail, accommodations, and food (RAF) sectors with the period 2011–2015. All models also include demographic and job characteristics variables (age, age2, gender, race-ethnicity, education, occupation), state-month-quarter, RAF sector-month-quarter, and RAF sector-state fixed effects. Data come from the monthly CPS. Observations include wage and salary workers aged 18–64; observations are weighted by the CPS weights. ~ denotes significance at the 0.10 level, * at the 0.05 level, and ** at the 0.01 level.
SOURCE: Authors’ calculations using CPS data.

−0.10
−0.05
0
0.05
0.10
0.15
0.20
0.25N
ew M
exic
oTe
xas
Ariz
ona
Flor
ida
Okl
ahom
aA
rkan
sas
Uta
hLo
uisia
naC
alifo
rnia
Geo
rgia
Col
orad
oN
ew Je
rsey
Ala
ska
Wes
t Virg
inia
Wyo
min
gW
iscon
sinTe
nnes
see
New
Yor
kM
aryl
and
Neb
rask
aV
irgin
iaR
hode
Isla
ndK
ansa
sM
assa
chus
etts
Sout
h D
akot
aA
laba
ma
Del
awar
eVe
rmon
tM
ichi
gan
Nor
th D
akot
aIo
wa
Mai
neSo
uth
Car
olin
aN
orth
Car
olin
aO
hio
New
Ham
pshi
reIll
inoi
sM
ississ
ippi
Indi
ana
Miss
ouri
Con
nect
icut
Min
neso
taK
entu
cky
Mon
tana
Idah
oPe
nnsy
lvan
iaO
rego
nD
istric
t of C
olum
bia
Was
hing
ton
Nev
ada
Haw
aii
Figure 1 Relative Probability of Having Health Insurance Coverage from Own Employer, by State
NOTE: Figure plots mean state-level residuals from a regression of a variable indicating worker receives employer-sponsored health insurance on demographic and job character-istics for six years prior to ACA passage (2004–2009).
SOURCE: March 2005–2010 CPS Supplements.

Figure 2 Share of Involuntary Short-Hours (< 30 hours/week) Part-Time Employment, Selected Sectors, 2003–2015
0
0.02
0.04
0.06
0.08
0.10
0.12
Manufacturing Retail tradeProfessional and business services Education servicesHealth care and social assistance Accommodation and food services
SOURCE: Authors’ tabulations of monthly CPS public use files.
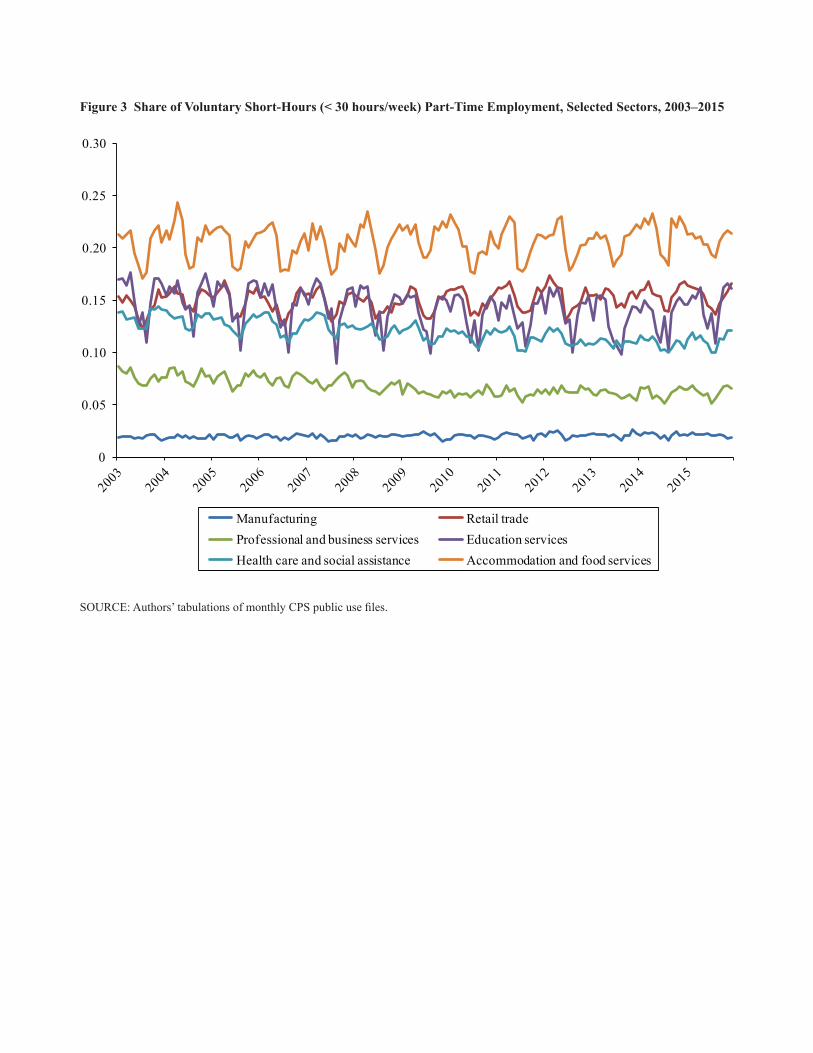
Figure 3 Share of Voluntary Short-Hours (< 30 hours/week) Part-Time Employment, Selected Sectors, 2003–2015
SOURCE: Authors’ tabulations of monthly CPS public use files.
0
0.05
0.10
0.15
0.20
0.25
0.30
Manufacturing Retail tradeProfessional and business services Education servicesHealth care and social assistance Accommodation and food services
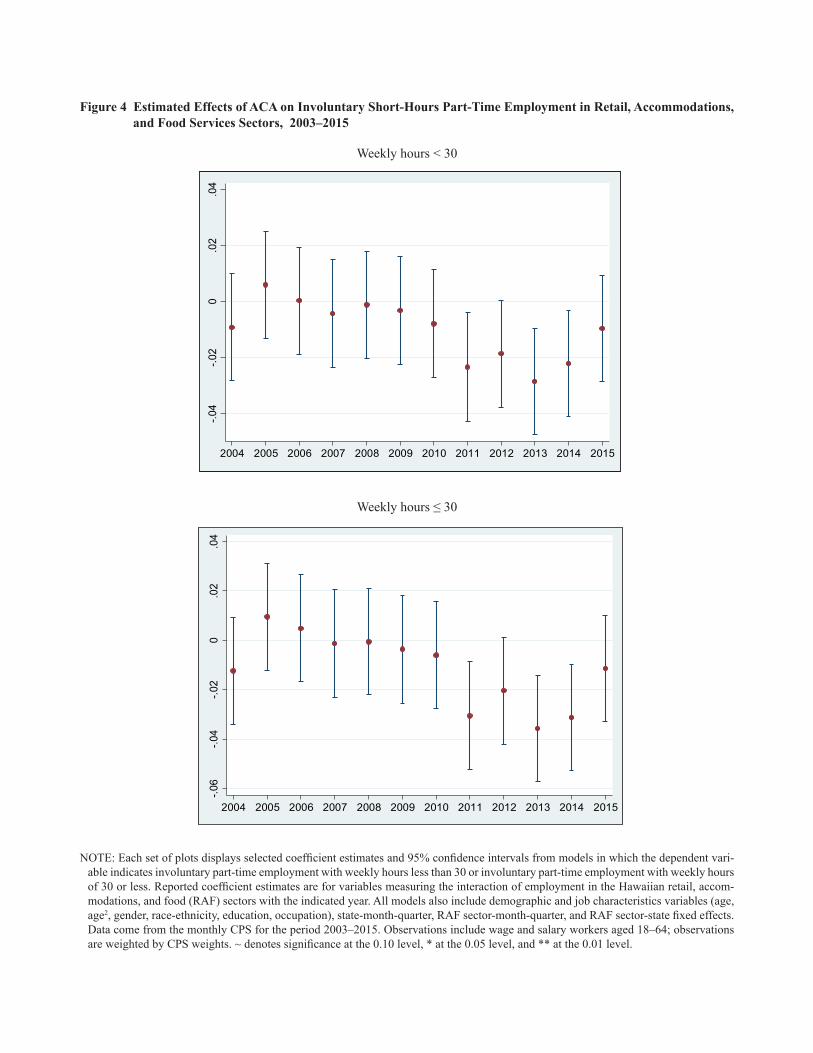
Figure 4 Estimated Effects of ACA on Involuntary Short-Hours Part-Time Employment in Retail, Accommodations, and Food Services Sectors, 2003–2015
Weekly hours < 30
-.04
-.02
0.0
2.0
4
2004 2005 2006 2007 2008 2009 2010 2011 2012 2013 2014 2015
Weekly hours ≤ 30
-.06
-.04
-.02
0.0
2.0
4
2004 2005 2006 2007 2008 2009 2010 2011 2012 2013 2014 2015
NOTE: Each set of plots displays selected coefficient estimates and 95% confidence intervals from models in which the dependent vari-able indicates involuntary part-time employment with weekly hours less than 30 or involuntary part-time employment with weekly hours of 30 or less. Reported coefficient estimates are for variables measuring the interaction of employment in the Hawaiian retail, accom-modations, and food (RAF) sectors with the indicated year. All models also include demographic and job characteristics variables (age, age2, gender, race-ethnicity, education, occupation), state-month-quarter, RAF sector-month-quarter, and RAF sector-state fixed effects. Data come from the monthly CPS for the period 2003–2015. Observations include wage and salary workers aged 18–64; observations are weighted by CPS weights. ~ denotes significance at the 0.10 level, * at the 0.05 level, and ** at the 0.01 level.

Figure 5 Estimated Effects of ACA on Involuntary Short-Hours Part-Time Employment in Retail, Accommodations, and Food Services Sectors, 1994–2015
-.1-.0
50
.05
1995 1997 1999 2001 2003 2005 2007 2009 2011 2013 2015
-.06
-.04
-.02
0.0
2.0
4
1995 1997 1999 2001 2003 2005 2007 2009 2011 2013 2015
-.1-.0
50
.05
1995 1997 1999 2001 2003 2005 2007 2009 2011 2013 2015
-.06
-.04
-.02
0.0
2.0
4
1995 1997 1999 2001 2003 2005 2007 2009 2011 2013 2015
Weekly hours < 30
Weekly hours ≤ 30
NOTE: Each set of plots displays selected coefficient estimates and 95% confidence intervals from models in which the dependent vari-able indicates involuntary part-time employment with weekly hours less than 30 or involuntary part-time employment with weekly hours of 30 or less. Reported coefficient estimates are for variables measuring the interaction of employment in the Hawaiian retail, accom-modations, and food (RAF) sectors with the indicated year. All models also include demographic and job characteristics variables (age, age2, gender, race-ethnicity, education, occupation), state-month-quarter, RAF sector-month-quarter, and RAF sector-state fixed effects. Data come from the monthly CPS for the period 1994–2015. Observations include wage and salary workers aged 18–64; observations are weighted by CPS weights. ~ denotes significance at the 0.10 level, * at the 0.05 level, and ** at the 0.01 level.