Embed Size (px)
Citation preview
ISSN: 2289-4519 Page 16
International Journal of Accounting & Business Management
www.ftms.edu.my/journals/index.php/journals/ijabm
Vol. 3 (No.1), April, 2015 ISSN: 2289-4519 DOI: 10.24924/ijabm/2015.04/v3.iss1/16.38
This work is licensed under a Creative Commons Attribution 4.0 International License.
Research Paper
Effects of Technology On Customer Retention: A study on Tesco Malaysia
Tolulope Olaide Folarin
School of Accounting and Business Management FTMS College, Malaysia
Zubair Hassan
School of Accounting and Business Management FTMS College, Malaysia
Abstract
The main purpose of this study is to explore the effects of information technology on business, focusing on how information technology had enabled TESCO Malaysia to improve customers’ satisfaction and customers’ retention. The conceptual framework for this research was deduced from past researches (Lindh, 2005; Daneshvar and Ramesh 2010), it comprises of five independent variables which are, cost reduction, speedy process, communication and relationship, accessibility and convenience and two dependent variables which include, customers satisfaction and retention. The study adopted descriptive and explanatory research designs. Also this study used a case-study survey methods using a survey questionnaires containing 35 items with Likert Scale (Disagree -1 and 5 for Agree). The sample of 253 respondents (customers) from various TESCO retail outlets were recruited using self-selection sampling. The collected data was analysed using descriptive means and regression via SPSS.20. To ensure reliability and validity of the data set, the sample size only includes TESCO Malaysia’s Customers’ who had made use of TESCO Grocery Home Shopping Service. The Bivariate multiple regression result shows that all the IT enabled elements has a significant and positive impact on customers’ satisfaction except accessibility, which we found no significant influence on customer satisfaction. Also this research found a positive and significant influence of IT enabled elements on customer retention except cost and accessibility. Also this research shows that improved customer satisfaction has a significant and positive impact on customer retention. This study concluded that adoption of advanced information technology will maintain TESCO Malaysia’s competitive edge through customer satisfaction and retention. Therefore managers working in retail sector should take initiatives to promote the use of IT in order to enhance customers’ satisfaction and retention. Future research should involve several organizations from different sectors and make use of a larger sample that will improve the generalization of the effects of information technology on business.
Key Terms: Information Technology, Customer Satisfaction, Customer Retention, operation efficiency, online business, TESCO Malaysia
ISSN: 2289-4519 Page 17
1. Introduction Over the years, IT had radically changed our personal lives with the invention of mobile phones to make calls and the use of credit/debit cards for payment through internet (Bae, 2004; Tsai, 2003). Damanpour and Damanpour (2001) states that, not only did IT changed lifestyles, these changes had hugely impacted the business environment, the ways in which organizations approach business, relate and distribute information with customers and the process of selling and procurement of products and services. IT had also made movement of goods and services from one place to another easier, to the extent that many transactions that previously required physical movement can now be made electronically via internet (Dhar and Sundararajan, 2007). In Porter and Miller’s (2001) view, IT enables competitive advantage through operational efficiency
This research is carried out on Tesco Malaysia’s customers’, though there are currently 47 Tesco’s outlets in Malaysia, Tesco’s grocery home shopping service is presently available to few cities within Kuala Lumpur, Klang Valley, Penang and Johore Bahru (Tesco, 2012). Hence, this research will focus on Tesco’s customers that had been opportune to use Tesco’s grocery home shopping service. And for this research to be unbiased it is essential to target the right population (Pigott, 2001; Graham, et al., 2008) that is, those customers that had shop on Tesco’s e-shop and had their orders delivered to their door steps. Therefore, these samples are selected because they live in the areas where Tesco is currently offering delivery service.
Currently, there are three multinational retailers in Malaysia grocery industry, GCH retailer who owns Giant, Cold Storage and Guardian is the leader, followed by Tesco and AEON Co (Krafft and Mantrala, 2010). Tesco is a British multinational grocery and general merchandise retailer which entered Malaysia in May 2002 and partnered with Sime Darby Berhad (Tesco, 2012). Tesco currently operates 47 Tesco and Tesco Extra stores in Malaysia; it offers varieties of food, household utensils, electronics and appliances (Tesco, 2012). Tesco makes use of several IT features like spread sheets, intranet and extranet, scanner, smart cards, surveillance camera, radio frequency identification (RFID), point of sales (POS) (Tesco, 2012; Wong, 2013b). And on top of that, Tesco recently took a step ahead of its competitors by launching its e-shop called Tesco Grocery Home Shopping Service, that allows customers in their comfort zones to order all the groceries needed via internet and have it delivered at their door steps within a chosen two hours slot between 10am to 10pm daily at the rate of RM10 for service charge with no minimum purchase imposed (Wong, 2013a; Sara, 2013). Tesco Malaysia has more than 15,000 products online, payments are made via credit/debit card and in some cases, where product like fish, vegetables, have to be weighed, cash on delivery model (COD) is used and the goods are always delivered in good shapes with temperature-control trucks (Sara, 2013). Tesco’s Grocery Home Shopping service is currently serving 38 cities nationwide (Tesco, 2012). Tesco had also been keeping in touch and updating its customers through its Facebook and twitter pages (Wong, 2013b; Sara 2013).
Further, it is prerequisite to explore customers view on this topic, because according to Steinmacher (2010), there will be lost of 24 customers out of 26 unhappy and unsatisfied customers because customers are always right. However, this research will not be able to get response(s) from all Tesco’s customers’ that had shopped on Tesco’s e-shop since the population is large, nevertheless, couple of Tesco’s customers will be worked with.
Research Rational From time unmemorable, the effect of IT has enthralled the interest of several academics and numerous researches had been conducted (Alkadi, Alkadi, and Totaro, 2003; Karmarkar and Mangal, 2007). These studies conceptualized different variables, however, five major variables have the market trend in which researchers focused on and these are: cost reduction, speedy process, communication and relationship, accessibility and convenience
ISSN: 2289-4519 Page 18
(Intellitrend, 2013; Ahearne, and Schillewaert, 2001; Karmarkar and Mangal, 2007; Lindh, 2005). Previous researches report that, the effects of IT on business cannot be over-emphasized and that IT has permeated every aspect of business world and it also contributed hugely to economic performance (Alkadi, Alkadi, and Totaro, 2003; Georganta, and Vogiatzi, 2010). This is a threat on Malaysia economy, since many retailers have not embraced IT (Zaini et al, 2011). IT was reveals that online retail market in Malaysia is just 0.8percent in 2011 and this is anticipated to increase to 1.4 percent in 2016 ( Zaini,et al., 2011). This is the level of IT adoption that had been reported, this issue is escalating, since without the adoption of IT, retailers cannot be competitive and they cannot make grocery shopping convenience for full-time workers (Porter and Miller 2001). This issue propelled Malaysian government to allocate 12.9 billion to boost usage of IT for retail purposes in the year 2010. Despite this huge investment by the government and the increase in internet usage in Malaysia, which elevated from 15% of the population in 2000 to 64.6% in 2010, the adoption of IT is still quite low (Stats, 2010). Further, a survey by PricewaterhouseCoopers shows that 75% feel Malaysians are not doing enough to embrace social media as a business tool, 30% have not developed key performance indicators (KPIs) to measure the success of their internet activities, 35% do not seek any feedback from their customers on how they expect to be engaged in social media and 60% do not have a budget for online business (TheSun, 2013, p14). This is an issue because, PricewaterhouseCoopers Malaysia managing partner, Sridharan Nair said: Thus, compared to other developing countries, IT adoption rate in Malaysia is relatively low, because apart from Tesco which recently launched its online services in April 2013, no other multinational grocery retailer in Malaysia provides online shopping, though some SME’s sell their products online (Wong, 2013a; Sara 2013). This issue of declining retail is increasing because till date Malaysia retailers have not been able to make grocery shopping convenience for customers who see traditional-shopping as stressful as a chore (Zaini, et al, 2011). Hence, it is significance to make this research as it seems little empirical research had endeavored to examine the effects of IT on Malaysia retail outlets, thus, it is essential to fill this gap, which will contribute to the existing knowledge by affirming the effects of IT on TESCO Malaysia. Also, the proposed framework will contribute to the body of knowledge and assist future researches. Therefore the aims of the study is to examine the effects of IT on Tesco Malaysia by exploring several ways that Tesco’s newly adopted IT, that is, Tesco’s online shopping services and ‘Grocery Home Shopping Service’ had helped Tesco Malaysia to satisfy and retain its customers. Therefore the following objectives were formulated to examine the impact of Information Technology on
1) Cost reduction resulting to improve customers’ satisfaction and retention.
2) Improving speedy process leads to improve customers’ satisfaction and retention.
3) Enhancing communication and relationship leads to improve customers’ satisfaction and retention.
4) Improving accessibility leads to improve customers’ satisfaction and retention.
5) Convenience causing to improve customers’ satisfaction and retention.
“Numerous Malaysian organizations do not have a vigorous strategy to conduct
their social media activities and measure their benefits; this is a lost opportunity,
considering the dynamic nature of social media which enables businesses to
respond to customers need” (TheSun, 2013, p14).
ISSN: 2289-4519 Page 19
This paper is organised as follows: first part is discussed above. Second part is the theoretical framework and research hypothesis development. Third part discusses the research design and methodology, data collection procedures and process. Fourth part presents the results and discussion. Final part is conclusion and recommendation, and implication for further research
2. Literature Review Information technology has diverse definition with no standard definition (Rajaraman, 2013), therefore, IT will be defined in the view of several scholars. According to Subramaniam (2007), IT is all technologies used for creating, communicating, presenting and managing the flow of information. IT was also defined by Trauth (2006) as an advancement that makes life better and easier by enabling people to perform tasks faster and efficiently, communicate easily and transacts business conveniently. According to Manzoor (2012) IT refers to the tool that combines computing with high-speed connections links transporting data, video and sound. Further, IT is a strategic source that enables main alterations in competitive behavior, marketing and customer service (Aremu and Saka, 2014). Customer satisfaction was defined according to Oliver (1999) as the extent of accomplishment of some desire, needs, goal or other delightful end state that results from a precise exchange between the customer and a firm. It was also defined by Zeithml and Bitmer (1996; 2003; 2006) as the customers’ fulfillment reaction, which is a judgment that a product or service feature results to satisfying level of consumption related fulfillment, including level of under or over fulfillment. Customer retention was defined by Shajahan (2004) as the capability of the firm’s offer to its customers to purchase its products or services over a specified period. Kotzab and Bjerre (2005) defined customer retention as a state which reveals the consumer’s loyalty to a brand and the subsequent declined tendency to switch brand Current theories and models Lindh (2005) in his research, how does IT Impact on Business Relationships? Collected and analyzed data from 354 business relationships on the Swedish business-to-business market, to answer the question if and how IT impacts on social exchange relationships. Lindh (2005) focused on communication and relationship, the result shows that business relationships in which IT increases or decreases the need for personal meetings to higher extent have a relatively higher level of use of IT in the exchanges. However, the relation between the level of use of IT and its effect on the need for personal meetings is not linear, which means that although the need for personal meetings changes with higher levels of IT use in exchanges, it is unknown when or why the need for meetings increases or decreases (Lindh, 2005). This shows that, to some businesses, IT reduces personal interaction while others take the view that IT increases personal interaction (Lindh, 2005). It can be concluded that, though this study is related to this research objectives, it is inconclusive as it failed to state whether the rate of those that support the fact that IT reduces personal interaction is higher than those that opposed it. In 2007, a research conducted in United States and Canada by Karmarkar and Mangal (2007) shows IT impact on business to ascertain changes in business that are driven by IT in an extensive field of business industries, observed four variables, communication and relationship, convenience, business process and globalization. Karmarkar and Mangal (2007) ascertained that businesses are experiencing radical internal alteration, as such, the ways businesses interact with business partners and customers had changed. Though, the pace of change is possibly not as rapid as suggested by the high-water-mark instances that are illustrated in the popular business press. Nevertheless, the changes are without question both prevalent and on-
ISSN: 2289-4519 Page 20
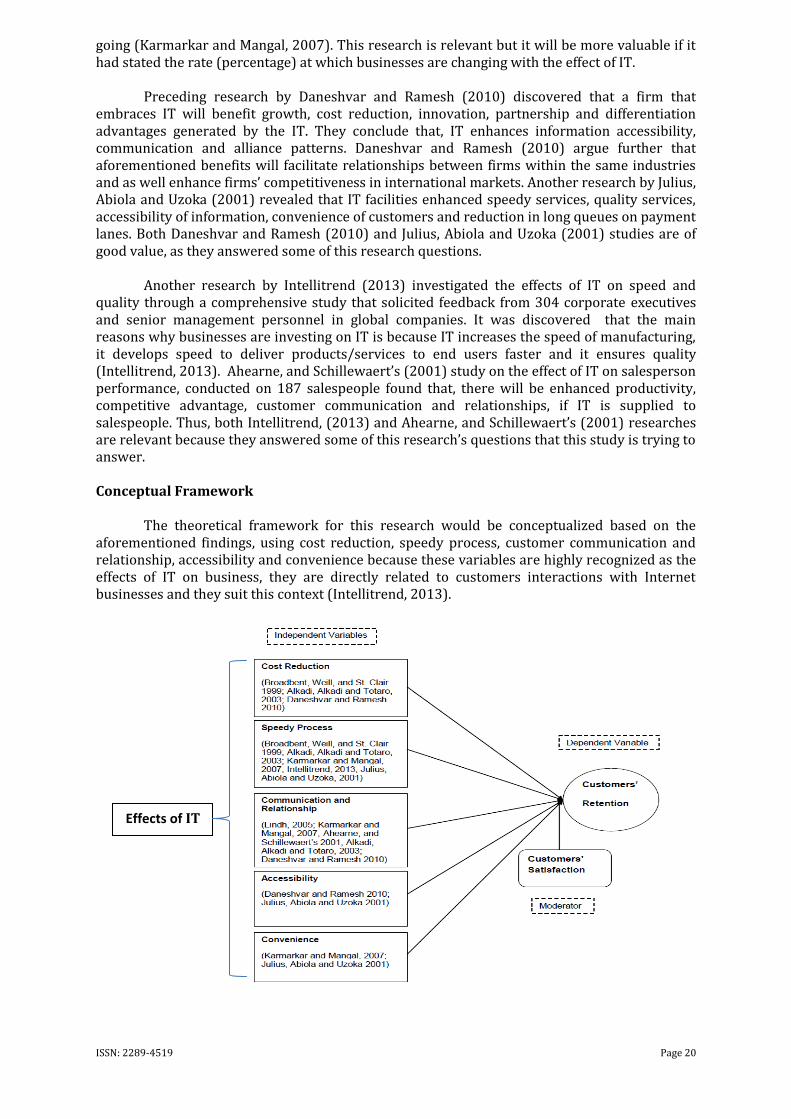
going (Karmarkar and Mangal, 2007). This research is relevant but it will be more valuable if it had stated the rate (percentage) at which businesses are changing with the effect of IT. Preceding research by Daneshvar and Ramesh (2010) discovered that a firm that embraces IT will benefit growth, cost reduction, innovation, partnership and differentiation advantages generated by the IT. They conclude that, IT enhances information accessibility, communication and alliance patterns. Daneshvar and Ramesh (2010) argue further that aforementioned benefits will facilitate relationships between firms within the same industries and as well enhance firms’ competitiveness in international markets. Another research by Julius, Abiola and Uzoka (2001) revealed that IT facilities enhanced speedy services, quality services, accessibility of information, convenience of customers and reduction in long queues on payment lanes. Both Daneshvar and Ramesh (2010) and Julius, Abiola and Uzoka (2001) studies are of good value, as they answered some of this research questions. Another research by Intellitrend (2013) investigated the effects of IT on speed and quality through a comprehensive study that solicited feedback from 304 corporate executives and senior management personnel in global companies. It was discovered that the main reasons why businesses are investing on IT is because IT increases the speed of manufacturing, it develops speed to deliver products/services to end users faster and it ensures quality (Intellitrend, 2013). Ahearne, and Schillewaert’s (2001) study on the effect of IT on salesperson performance, conducted on 187 salespeople found that, there will be enhanced productivity, competitive advantage, customer communication and relationships, if IT is supplied to salespeople. Thus, both Intellitrend, (2013) and Ahearne, and Schillewaert’s (2001) researches are relevant because they answered some of this research’s questions that this study is trying to answer. Conceptual Framework The theoretical framework for this research would be conceptualized based on the aforementioned findings, using cost reduction, speedy process, customer communication and relationship, accessibility and convenience because these variables are highly recognized as the effects of IT on business, they are directly related to customers interactions with Internet businesses and they suit this context (Intellitrend, 2013).
Effects of IT
ISSN: 2289-4519 Page 21
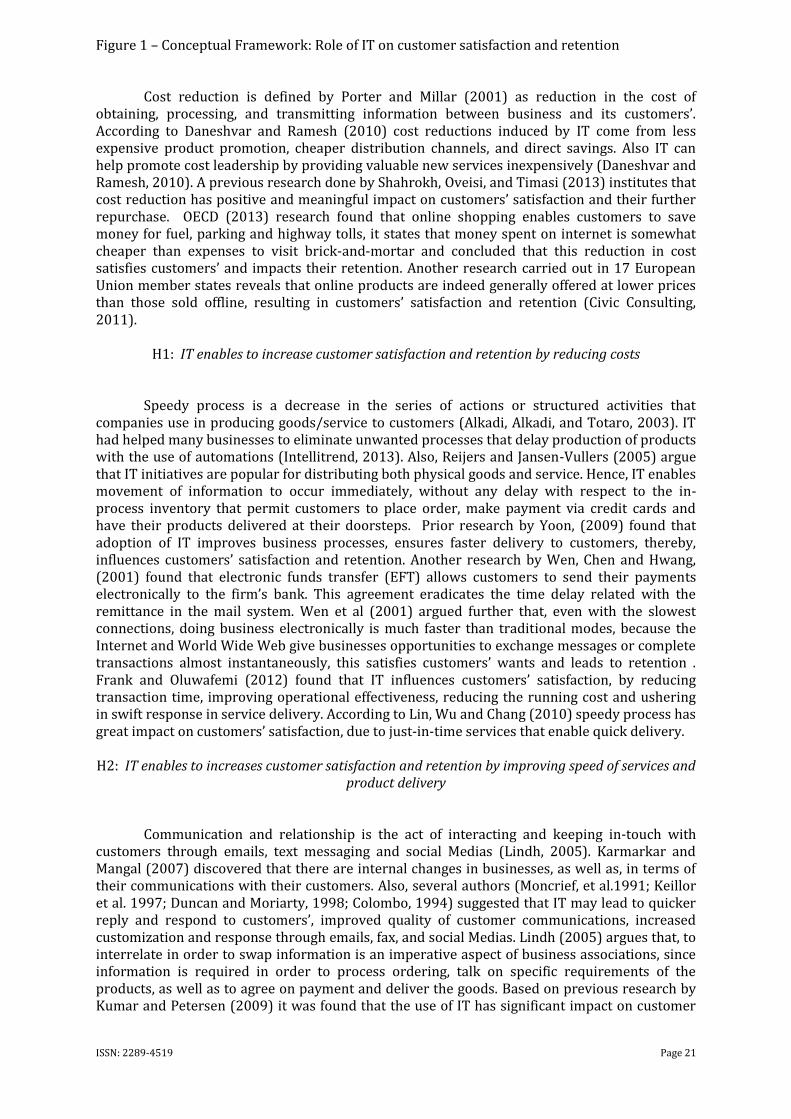
Figure 1 – Conceptual Framework: Role of IT on customer satisfaction and retention Cost reduction is defined by Porter and Millar (2001) as reduction in the cost of obtaining, processing, and transmitting information between business and its customers’. According to Daneshvar and Ramesh (2010) cost reductions induced by IT come from less expensive product promotion, cheaper distribution channels, and direct savings. Also IT can help promote cost leadership by providing valuable new services inexpensively (Daneshvar and Ramesh, 2010). A previous research done by Shahrokh, Oveisi, and Timasi (2013) institutes that cost reduction has positive and meaningful impact on customers’ satisfaction and their further repurchase. OECD (2013) research found that online shopping enables customers to save money for fuel, parking and highway tolls, it states that money spent on internet is somewhat cheaper than expenses to visit brick-and-mortar and concluded that this reduction in cost satisfies customers’ and impacts their retention. Another research carried out in 17 European Union member states reveals that online products are indeed generally offered at lower prices than those sold offline, resulting in customers’ satisfaction and retention (Civic Consulting, 2011).
H1: IT enables to increase customer satisfaction and retention by reducing costs Speedy process is a decrease in the series of actions or structured activities that companies use in producing goods/service to customers (Alkadi, Alkadi, and Totaro, 2003). IT had helped many businesses to eliminate unwanted processes that delay production of products with the use of automations (Intellitrend, 2013). Also, Reijers and Jansen-Vullers (2005) argue that IT initiatives are popular for distributing both physical goods and service. Hence, IT enables movement of information to occur immediately, without any delay with respect to the in-process inventory that permit customers to place order, make payment via credit cards and have their products delivered at their doorsteps. Prior research by Yoon, (2009) found that adoption of IT improves business processes, ensures faster delivery to customers, thereby, influences customers’ satisfaction and retention. Another research by Wen, Chen and Hwang, (2001) found that electronic funds transfer (EFT) allows customers to send their payments electronically to the firm’s bank. This agreement eradicates the time delay related with the remittance in the mail system. Wen et al (2001) argued further that, even with the slowest connections, doing business electronically is much faster than traditional modes, because the Internet and World Wide Web give businesses opportunities to exchange messages or complete transactions almost instantaneously, this satisfies customers’ wants and leads to retention . Frank and Oluwafemi (2012) found that IT influences customers’ satisfaction, by reducing transaction time, improving operational effectiveness, reducing the running cost and ushering in swift response in service delivery. According to Lin, Wu and Chang (2010) speedy process has great impact on customers’ satisfaction, due to just-in-time services that enable quick delivery. H2: IT enables to increases customer satisfaction and retention by improving speed of services and
product delivery
Communication and relationship is the act of interacting and keeping in-touch with customers through emails, text messaging and social Medias (Lindh, 2005). Karmarkar and Mangal (2007) discovered that there are internal changes in businesses, as well as, in terms of their communications with their customers. Also, several authors (Moncrief, et al.1991; Keillor et al. 1997; Duncan and Moriarty, 1998; Colombo, 1994) suggested that IT may lead to quicker reply and respond to customers’, improved quality of customer communications, increased customization and response through emails, fax, and social Medias. Lindh (2005) argues that, to interrelate in order to swap information is an imperative aspect of business associations, since information is required in order to process ordering, talk on specific requirements of the products, as well as to agree on payment and deliver the goods. Based on previous research by Kumar and Petersen (2009) it was found that the use of IT has significant impact on customer
ISSN: 2289-4519 Page 22
satisfaction because customers’ relationships are improved with the use of social media resulting in enhanced communications with customers, and improved response times. OECD (2013) found that IT offers relatively inexpensive solutions for making information available to a large number of customers via the web, including social networking platforms, that today complement (or sometimes even substitute for) traditional communication channels, such as newspapers, radio or television advertising campaigns. Also OECD (2013) stated that the inexpensive solutions intensify Business-to-Customers communication and relationship, which in-turn satisfies customers and impact their intension to repurchase. According to Wen et al (2001), the ability to provide online answers to problems through resolution guides, archives of commonly encountered problems and electronic mail interaction 24hours a day, 365 days a year, impacts customer confidence, satisfaction and retention.
H3: IT enables to increases customer satisfaction and retention by improving communication an
relationship with customers
Accessibility is the ability to ingress the product/services needed (IBM, 2006). Moncrief, et al., (1991) suggested that IT may lead to quicker access to better information. Grant (2001) proposed that adopting advanced IT leads to increased information accessibility, which increase the speed and effectiveness with which customers can change information into decision. Preceding research by Beldona, et al., (2005) discovered that accessibility has impacts on customers’ satisfaction because IT enables buyers’ easy access to product information, provides transaction assurance, and solves timely problems for business applications. Beldona, et al., (2005) argue further that, lesser time is required to access products on e-shop than brick-and-mortar. Gelard and Negahdari (2011) found that IT enables the chance to have permanent access to information like wide product assortments from an e-shop, which will likely lead to consumer satisfaction and retention. Another research by Cheung and Lee (2005) established that the advent of online shopping had empowered consumers, they can access a virtually unlimited selection of products, brands, and sellers, however, consumers have limited time and unlimited choice. Therefore, customers would naturally stick to the Internet merchants whose website is easier to surf and who gives them the detailed information. Thus Cheung and Lee (2005) concluded that accessibility impacts customers’ satisfaction and retention.
H4: IT enables to increases customer satisfaction and retention by enhancing customer accessibility to products and services
Convenience according to Zeithaml and Bitner(1996) is a feature that makes business process easier for employees and customers by reducing the amount of effort or time required to carry out an operation. Convenience consists of the whole effort involved in searching for a product, time used in shopping, pre-purchase service and complete contact information (Schaupp and Bélanger, 2005). Karmarkar and Mangal (2007) argue that IT had made shopping convenience for customers, as the time and efforts required to visit the brick-and-mortar had been reduced by the introduction of e-shops. According to Beldona, et al. (2005) in online context, the most compelling motivation became the convenience to shop 24/7 from the luxury of one's home. OECD (2013) research discovered that online shopping leads to significant savings of time and effort for customers’, customers’ save time by avoiding traffics, queue on payment lines, they save efforts of driving, pushing trolley around the mall in search of products and loading/offloading products from vehicles. OECD (2013) argues further that, the extra value that consumers derive from online transactions stems from loosening the day-of-week and time-of-day constraints of traditional markets by offering a nearly continuous shopping convenience. OECD (2013) concludes that its findings are consistent with previous findings showing that, convenience impacts customers’ satisfaction as well as retention. Schaupp and Bélanger (2005) found that convenience impacts customers’ satisfaction as IT gives individual the opportunity to economize on time and effort by making it easy to locate merchants, find items, procure offerings and have it delivered.
ISSN: 2289-4519 Page 23
H5: IT enables to increases customer satisfaction and retention by facilitating convenience to do online shopping
3. Research Design and Methodology Explanatory study approach is employed for this study, because it is deemed appropriate for studies that establish causal relationships between variables (Saunders, Lewis and Thornhill, 2009). Further, this research is designed as a cross-sectional study which is the study of a particular phenomenon (phenomena) at a particular time (Saunders et al 2009; Bell, 2010). This is chosen because this research is undertaken for academic purpose and it is time constrained (Saunders et al, 2009). Easterby-Smith et al. (2008) argue that cross-sectional studies often employ the survey strategy. Thus, as this study deduced variables from past researches on effect of IT on business. Saunders et al (2009) argue further that survey strategy allows data to be obtained by using a questionnaire administered to a sample and it allows quantitative data to be collected and analyzed quantitatively using descriptive and inferential statistics. Hence, this study administers questionnaires to its sample and analyzes the data quantitatively. For the purpose of this research, the selected data collection method is quantitative method, because it has been argued by Mujis (2010) that “quantitative method is important in business research as data from samples can be used to estimate parameters relating to the population as a whole, it is the best to explain phenomena and it is specifically suitable for testing hypothesis”. Thus, quantitative method will enable this research to produce reliable data as the research result can be generalized base on selected samples (Mujis, 2010). Research Questionnaire A new questionnaire was developed to identify the effects of IT on Tesco Malaysia and the questionnaire was pilot-tested to ensure its validity and reliability. According to Chhokar et al. (2013) when responding to questionnaires, various people have different response patterns which can potentially compromise generalization. Thus, to avoid this, this research questionnaire makes use of closed questions where respondents are compelled to pick within the given options (Saunders et al 2009). The questionnaire has three compartments and it is designed for the purpose of gathering data from the respondents. To facilitate the gathering of quality data, attention to the readability, length, language used, layout, arrangement of questions and content of questionnaires is advocated (Robson, 1993). The questionnaire has the following parts
Part one: includes the demographic profile (attribute variables) of respondent which contains data about respondents’ characteristics like age, gender, marital status, race, to mention but a few. It also includes few behavioral variables of whether respondents had shop on Tesco’s e-shop before. Part two: includes opinion variables which consist of how respondents feel about Tesco’s e-shop services. This includes 25 questions which measures cost reduction, speedy-process, communication and relationship, accessibility and convenience. Part three: consist of 10 questions measuring customers’ satisfaction and customers’ retention.
According to Bryman (2001) several researches that employed a five-point Likert-scale had accomplished excellent results. Consequently, Five-point Likert-scale which range from strongly disagree (1) to strongly agree (5) is used for part two and three, because Likert-scale does not force respondents to strongly agree or strongly disagree, but allows respondents to respond in a degree of agreement which makes answering questions easier for the respondents (Opdeakker, 2006, p.65).
ISSN: 2289-4519 Page 24
Sample size and Sampling method For this study, self-selection sampling which allows each case (individual) to identify its desire to take part in the research is used (Saunders et al, 2009). Because it is difficult for this research to identify Tesco’s customers who had made use of Online Tesco Grocery Home Shopping Service, it is also time consuming for researcher to ask every customer at Tesco outlets if they had ever used Tesco’s e-shop, this might also sound awkward to the respondents and it might discourage them from participating. To avoid this, this research was conducted on social network where most of the users that had shopped on Tesco’s e-shop share their experiences; this made it easier for the respondents to participate willingly. Thus, the questionnaire for this research was self-administered through internet-mediated questionnaire (Saunders et al 2009). The questionnaire was designed on Google Forms, the hyperlink was posted on Tesco Malaysia’s Facebook page for respondents’ easy access and it was addressed to Tesco’s customers who had shop on Tesco’s e-shop. The participant information letter and the consent form that explained the purpose of the research and seeks respondent’ consent is on the first and second pages of the questionnaire, this acquaint respondents with the research aim and the confidentiality of their data. With this, the questionnaire was able to convince and receive response from 253 respondents. Due to the large population “self-selection sampling” has been selected as most appropriate method to get responses from a large size of population (Bell, 2010). This is to ensure that the questionnaires were filled willingly by Tesco’s customers who had shop on Tesco’s e-shop and had their orders delivered to them. The data collection started 20th of March till 15th of April 2014 and 253 samples where gathered
Ethical Considerations The aim of this research was made known to the respondent without any deceit. They were made to understand that their data will be used as the main data set for this research (Wilson, 2010) The respondents were asked for their names while filling the questionnaire, however, the respondents were assured that their responses and names will be kept with utmost confidentiality and they will not be identified based on their responses. This helped in gathering honest response (Wilson, 2010; Bell, 2010). This research seeks the consent of its entire respondents, as no participant was forced or given incentives to fill the questionnaire. Also been an internet-mediated questionnaire, it gives no room for physical contacts that might influence the respondents.
4. Results and Discussion In this research, total of 253 questionnaires were distributed to the respected companies to conduct the study. Analysis of the results is being demonstrated below as to create further understanding of the study. In this section, few important analysis were carried out: Descriptive Analysis, Normality Test, Reliability Test, Validity test, Descriptive Mean, Correlation, and Regression.
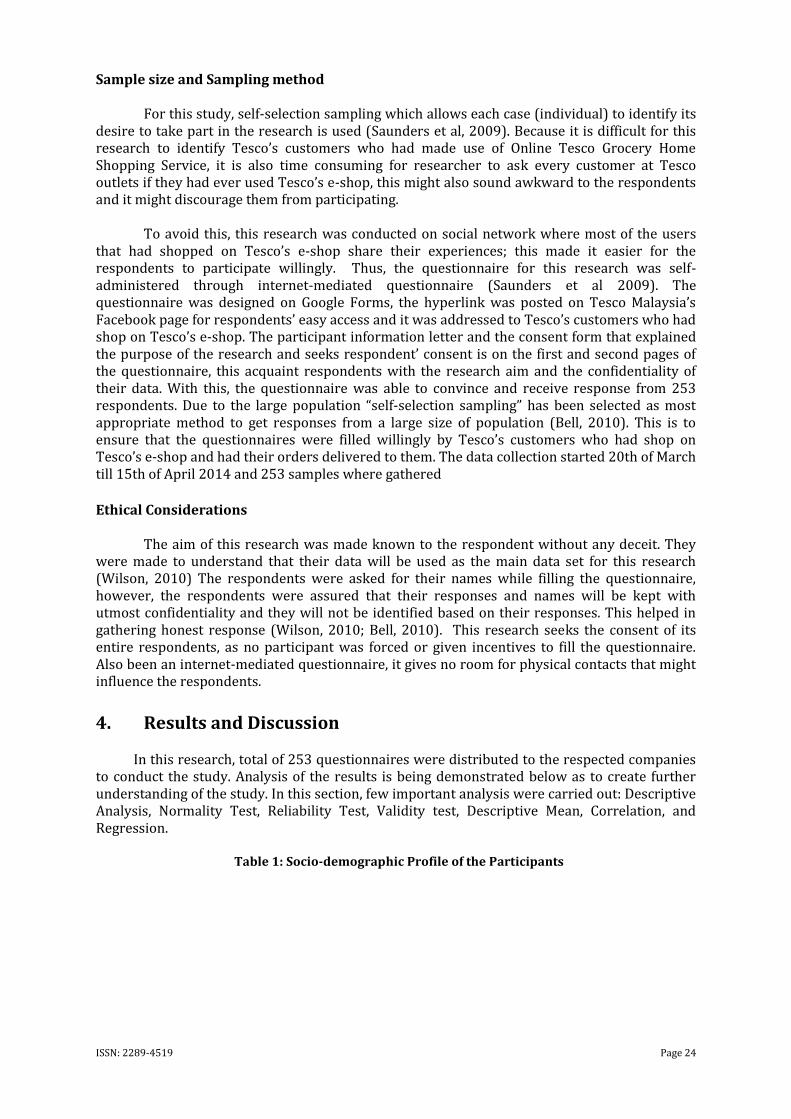
Table 1: Socio-demographic Profile of the Participants
ISSN: 2289-4519 Page 25
Table 1 above shows the demographic profile of all the 253 respondents’, which includes 19% male and 81% female; this indicates that females are keener to shop on TESCO’s e-shop than males. 9% of the respondents are between ages 18 to 22 years, 33% are between 23 to 27 years, 30% are between ages 28 to 32 years and 28% are 33 years and above. This indicates that respondents between ages 23 to 27 are the highest users of Tesco’s e-shop. It is obvious that Tesco’s e-shop had relieved the shopping stress of most full time workers and students because 72% of the respondents are workers while 24% are students and 4% are neither workers nor students, also 94% of the respondents are both full time workers and students while 6% are part time. Additionally, the ease of shopping online had attracted a lot of married people, perhaps, due to work and family hectic, they found shopping on Tesco’s e-shop preferably, as such, 56% of respondents are married, 1% is divorced, 29% are single and 14% are engaged. Also, 83% of the respondents are Asians, 13% are African and 4% are other races. 60% of the respondents shop on Tesco’s e-shop weekly, 25% shop monthly and 15% shop once in a while. Respondents also use various payment methods, 61% use credit card, 16% use debit cards and 23% use other means like cash on delivery. Further, due to the advancement in technology, Tesco’s e-shop can now be accessed on the go, 61% of the respondents always shop on Tesco’s e-shop using smart phones, 33% uses smart phones once in a while and 6% had never shopped on Tesco’s e-shop using smart phone. Conversely, only 36% always access the e-shop using computer while 64% use computer once in a while. Scale Reliability and Validity Cronbach's alpha is a widely used measure of reliability, its coefficient ranges from 0 to 1 and it is the best for describing reliability of factors extorted from scales and the higher the score, the more reliable the generated scale is (Hatcher, 1994). Nunnaly (1978) argues 0.7 to be an acceptable reliability coefficient. George and Mallery (2003) argue that when Cronbach’s alpha is > 0.9 it is Excellent, > 0.8, Good, > 0.7, Acceptable, > 0.6, Questionable, > 0.5, Poor, and < 0.5 is Unacceptable. The construct for this research which includes 35 items has a Cronbach’s Alpha of 0.951 which is above 0.7 and Cronbach's Alpha Based on Standardized Items 0.955, as shown in Table
ISSN: 2289-4519 Page 26
2 below. This suggests that there is a high internal consistency. Therefore scales used for this research is highly reliable for data analysis. Thus the construct used are suitable and acceptable for this research.
Table 2 – Reliability Statistics for the whole scale
Number of Items
Cronbahc’s Alpha 0.951 35
Cronbach's Alpha Based on Standardized Items 0.955 35
Source: SPSS generated
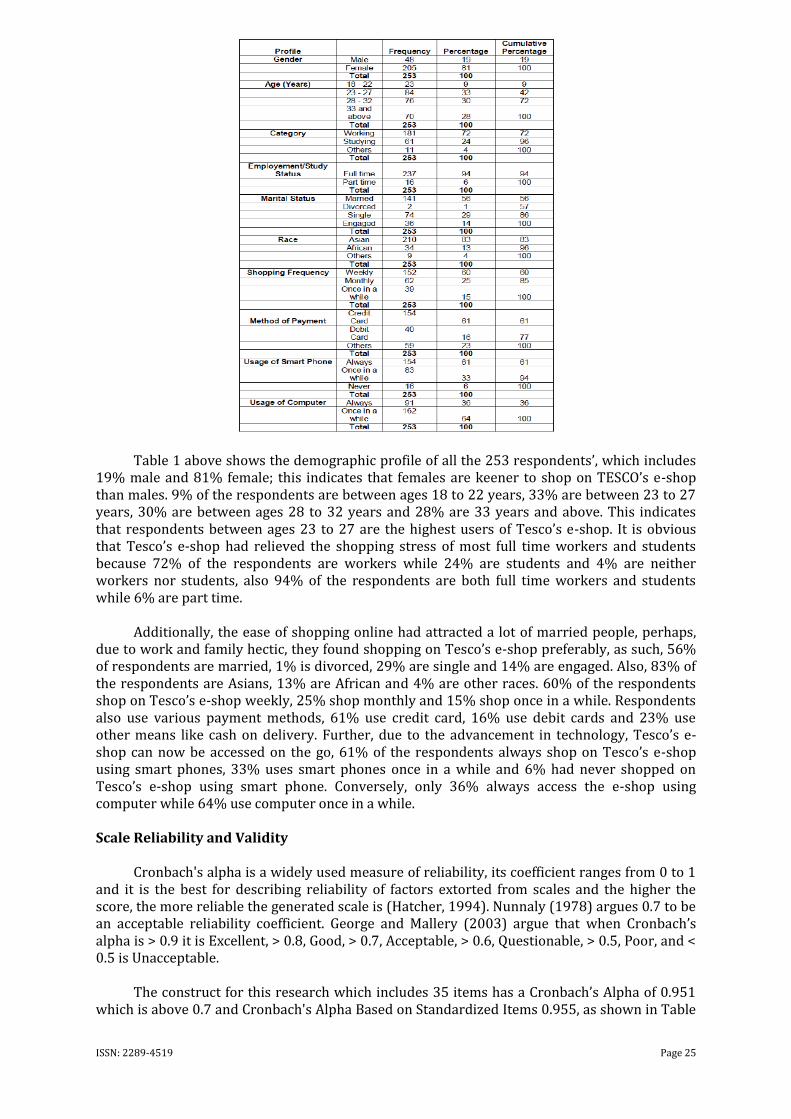
Further, Table 3 below shows that the Cronbach's Alpha of cost reduction (0.683), speedy process (0.822), communication and relationship (0.735), accessibility (0.738), convenience (0.848), customer satisfaction (0.853) and retention (0.838) are acceptable and reliable because some of the variables Cronbach's Alpha are greater than 0.7 which signifies acceptable reliability and some are greater than 0.8 which indicates a good reliability. However, cost reduction has a Cronbach's Alpha of 0.683 which can eventually be rounded up to 0.70 this also implies the reliability is acceptable. Also it is note worthy that the differences in standardised Cronbach’s Alpha for each variable is not signifcant compared to unstandardised Cronbach’s Alpha. This shows that almost every varibale is highly reliable for its internal consistency and acceptable for regressiona analysis.
Table 3: Reliability Test Variables Standardised
Cronbach's
Alpha
Cronbach’s
Alpha
Number of
Items
Cost Reduction 0.691 0.683 5
Speedy Process 0.824 0.822 5
Communication and Relationship 0.737 0.735 5
Accessibility 0.742 0.738 5
Convenience 0.851 0.748 5
Customer Satisfaction 0.859 0.853 5
Customer Retention 0.850 0.838 5
Source: SPSS generated
The feasibility and evaluation of a validity coefficient depends on the adequacy of the research sample (Rogelberg, 2004). Hence, the size of a sample determines its sample adequacy, because to produce realistic chance of finding statistical significance and to yield reasonable stable result, the sample has to be big enough. In contrast MacCallum, Windaman, Zhang and Hong (1999) state that the lower communalities becomes, the higher the importance of sample size, they concluded that, somewhat small samples (less than 300) could be absolutely sufficient, if all communalities are above 0.5. Thus the sample size of 253 employed for this study is adequate for a suitable factor solution since all commonalities are 0.5 and above.
Table 4: Sample Adequacy Test
ISSN: 2289-4519 Page 27
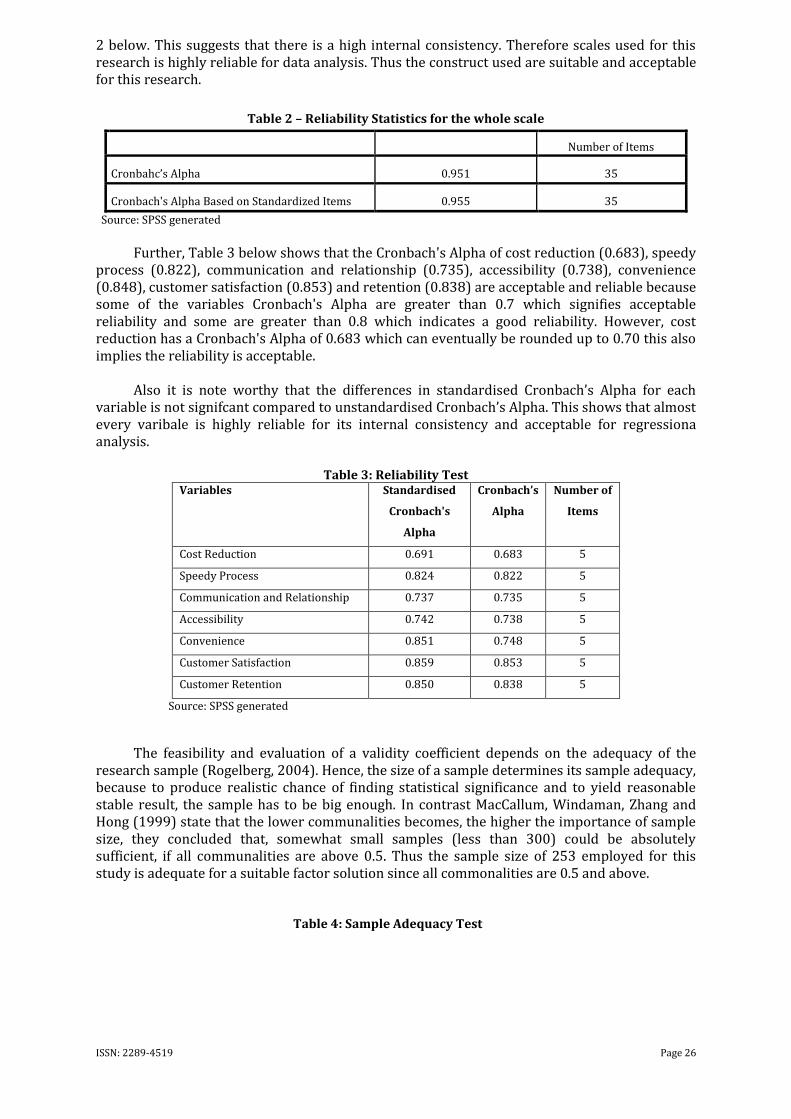
Source: SPPSS generated Kaiser-Meyer-Olkin (KMO) Measure of Sampling Adequacy is a widely used techniques. The KMO is a statistic that indicates the proportion of variance variables that might be caused by underlying factors and KMO statistics varies between 0 and 1 (Kline, 1994). Field, (2000) proposed that values greater than 0.5 are acceptable, between 0.5 and 0.7 are mediocre, between 0.7 and 0.8 are good, between 0.8 and 0.9 are superb. Therefore, as shown above in Table 4, the value of KMO for the whole construct of this research is 0.942; this suggests that the factor analysis is superb and statistically significant. Descriptive Statistics The mean and standard deviation from descriptive statistics are used to analyse the data. The average or mean is the most popular measure of central tendency (Thompson, 2005). The usage of means to explain a dataset must be bounded to ratio and interval level data (Thompson, 2005). The mean is more affected by the allocation of the values than is the median and it is more responsive to outliers (Thompson, 2005).
Table 5: Descriptive Statistics
N Minimum Maximum Sum Mean Std. Deviation
COST 253 2.80 5.00 1072.20 4.2379 .43514
SPEED 253 2.80 5.00 1120.60 4.4292 .52245
COMMUNICATION 253 1.60 5.00 1034.20 4.0877 .55725
ACCESSIBILITY 253 2.40 5.00 1101.20 4.3526 .45735
CONVINIENCE 253 3.00 5.00 1172.60 4.6348 .44264
SATISFACTION 253 2.60 5.00 1154.80 4.5644 .49713
RETENTION 253 2.80 5.00 1135.00 4.4862 .54132
Valid N (listwise) 253
Source: SPSS generated
Table 5 above shows that the statistical mean and standard deviation for effects of IT on cost, speed, communication, accessibility, and convenience in the measurement construct is 4.348 advocating that majority of the respondents concurred that IT had enabled Tesco to satisfy and willing to continue doing business with TESCO. The means ranged from 4.0877 to 4.6348. This indicates that most of the customers or respondents perceived that IT enabled them to shop conveniently (M=4.6348) through online shopping, followed by speedy process (M= 4.4292), accessibility (M= 4.3526), cost reduction (M= 4.2379) and relationship and communication (M = 4.0877).
4.6. Correlation Analysis Correlation coefficient is a measurement of the degree of linear relationship between two variables, that is, independent and dependent variables. Thus, Pearson correlation is explored to examine if there is a significant correlation between the independent variables, (which are cost reduction, speedy process, relationship and communication, accessibility and convenience) and dependent variables (customers’ satisfaction and retention). Correlation coefficients range from -1.00 to +1.00, with the weaker the relationship the closer the coefficient is to zero (Hair et al.
ISSN: 2289-4519 Page 28
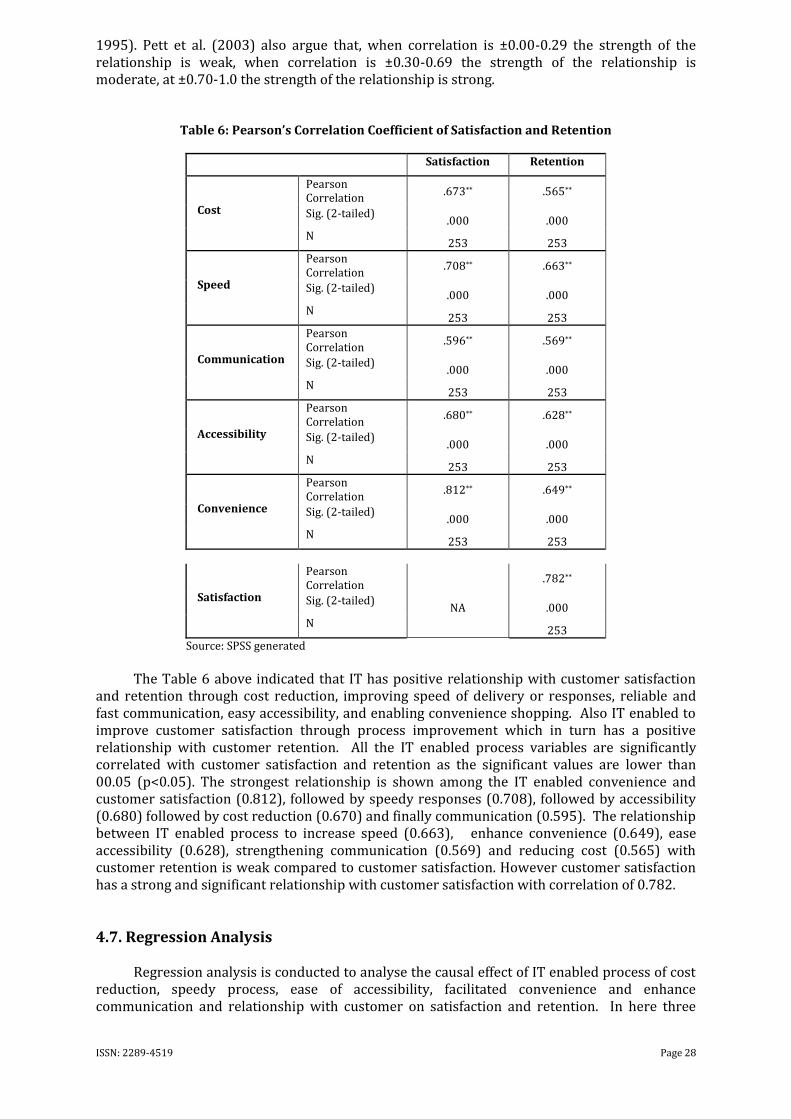
1995). Pett et al. (2003) also argue that, when correlation is ±0.00-0.29 the strength of the relationship is weak, when correlation is ±0.30-0.69 the strength of the relationship is moderate, at ±0.70-1.0 the strength of the relationship is strong.
Table 6: Pearson’s Correlation Coefficient of Satisfaction and Retention
Satisfaction Retention
Cost
Pearson Correlation
.673** .565**
Sig. (2-tailed) .000 .000
N 253 253
Speed
Pearson Correlation
.708** .663**
Sig. (2-tailed) .000 .000
N 253 253
Communication
Pearson Correlation
.596** .569**
Sig. (2-tailed) .000 .000
N 253 253
Accessibility
Pearson Correlation
.680** .628**
Sig. (2-tailed) .000 .000
N 253 253
Convenience
Pearson Correlation
.812** .649**
Sig. (2-tailed) .000 .000
N 253 253
Satisfaction
Pearson Correlation
.782**
Sig. (2-tailed) NA .000
N 253
Source: SPSS generated
The Table 6 above indicated that IT has positive relationship with customer satisfaction and retention through cost reduction, improving speed of delivery or responses, reliable and fast communication, easy accessibility, and enabling convenience shopping. Also IT enabled to improve customer satisfaction through process improvement which in turn has a positive relationship with customer retention. All the IT enabled process variables are significantly correlated with customer satisfaction and retention as the significant values are lower than 00.05 (p<0.05). The strongest relationship is shown among the IT enabled convenience and customer satisfaction (0.812), followed by speedy responses (0.708), followed by accessibility (0.680) followed by cost reduction (0.670) and finally communication (0.595). The relationship between IT enabled process to increase speed (0.663), enhance convenience (0.649), ease accessibility (0.628), strengthening communication (0.569) and reducing cost (0.565) with customer retention is weak compared to customer satisfaction. However customer satisfaction has a strong and significant relationship with customer satisfaction with correlation of 0.782.
4.7. Regression Analysis Regression analysis is conducted to analyse the causal effect of IT enabled process of cost reduction, speedy process, ease of accessibility, facilitated convenience and enhance communication and relationship with customer on satisfaction and retention. In here three
ISSN: 2289-4519 Page 29
empirical models are generated to show the causal effect of IT on customer retention. The first model is IT enabled process and its impact on customer satisfaction. Second model is IT enabled process and its impact on customer retention. Third model is about the causal impact of customer satisfaction on customer retention. The Beta Coefficient will be used to determine the strength of the causal effect on dependent variables. Also the significant level will be determined by using p values. If the p values are less than 0.05, it will be considered as significant. Therefore the following empirical models will be used
Y1= B1X1+B2X2+B3X3+B4X4+B5X5+ C ------------------------------ (1)
Y2= B1X1+B2X2+B3X3+B4X4+B5X5+C-------------------------------- (2)
Y2=B1Y1+C------------------------------------------------------------------- (3)
Where Y1= Customer satisfaction Y2= Customer Retention X1=Cost X2=Speed X3=Communication X4=Accessibility X5=Convenience C=Constant Model 1: Impact of IT enhanced process on customer satisfaction
Table 7 – Model 1 Summary of IT enabled Process and Customer Satisfaction
Model R R Square
Adjusted R Square
Std. Error of the Estimate
Change Statistics Durbin-Watson
F Change
df1 df2 Sig. F Change
1 .860a .739 .734 .25656 139.841 5 247 .000b 1.402
a. Predictors: (Constant), CONVINIENCE, COMMUNICATION, SPEED, COST, ACCESSIBILITY
b. Dependent Variable: SATISFACTION
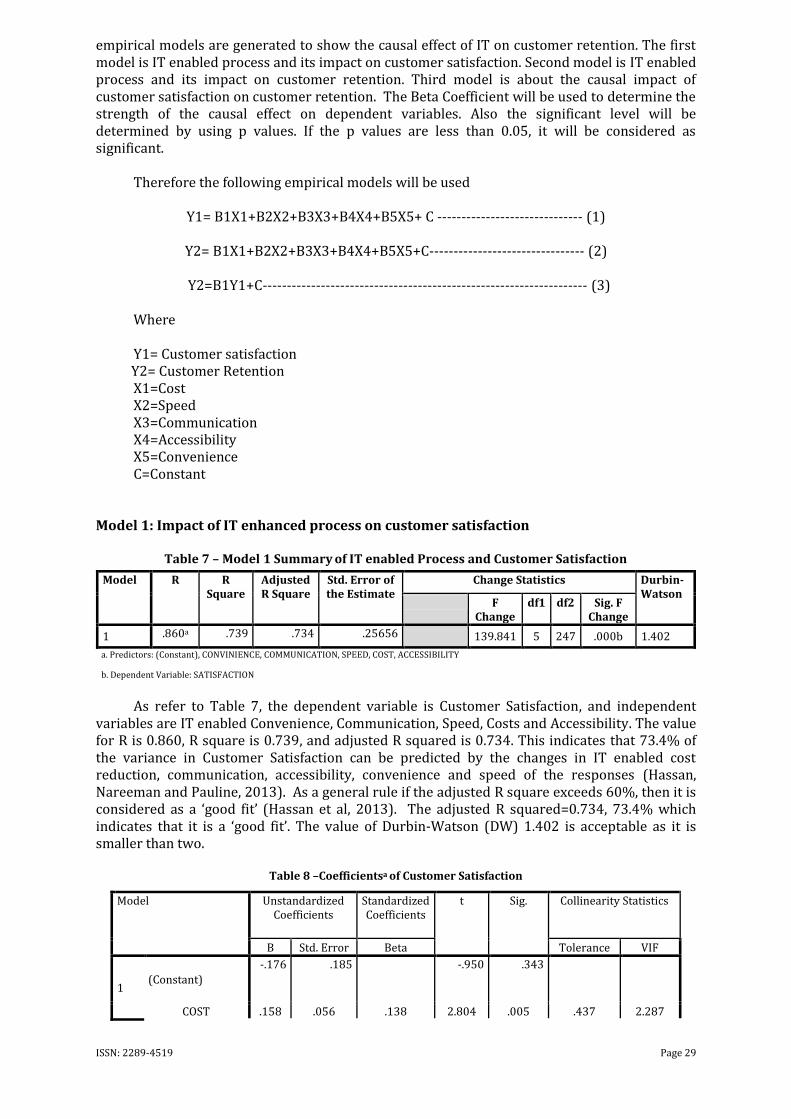
As refer to Table 7, the dependent variable is Customer Satisfaction, and independent variables are IT enabled Convenience, Communication, Speed, Costs and Accessibility. The value for R is 0.860, R square is 0.739, and adjusted R squared is 0.734. This indicates that 73.4% of the variance in Customer Satisfaction can be predicted by the changes in IT enabled cost reduction, communication, accessibility, convenience and speed of the responses (Hassan, Nareeman and Pauline, 2013). As a general rule if the adjusted R square exceeds 60%, then it is considered as a ‘good fit’ (Hassan et al, 2013). The adjusted R squared=0.734, 73.4% which indicates that it is a ‘good fit’. The value of Durbin-Watson (DW) 1.402 is acceptable as it is smaller than two.
Table 8 –Coefficientsa of Customer Satisfaction
Model Unstandardized Coefficients
Standardized Coefficients
t Sig. Collinearity Statistics
B Std. Error Beta Tolerance VIF
1 (Constant)
-.176 .185 -.950 .343
COST .158 .056 .138 2.804 .005 .437 2.287
ISSN: 2289-4519 Page 30
SPEED .194 .047 .204 4.126 .000 .433 2.307
COMMUNICATION .086 .040 .097 2.157 .032 .527 1.898
ACCESSIBILITY .039 .057 .035 .679 .498 .387 2.585
CONVINIENCE .581 .056 .518 10.413 .000 .428 2.337
a. Dependent Variable: Customer Satisfaction
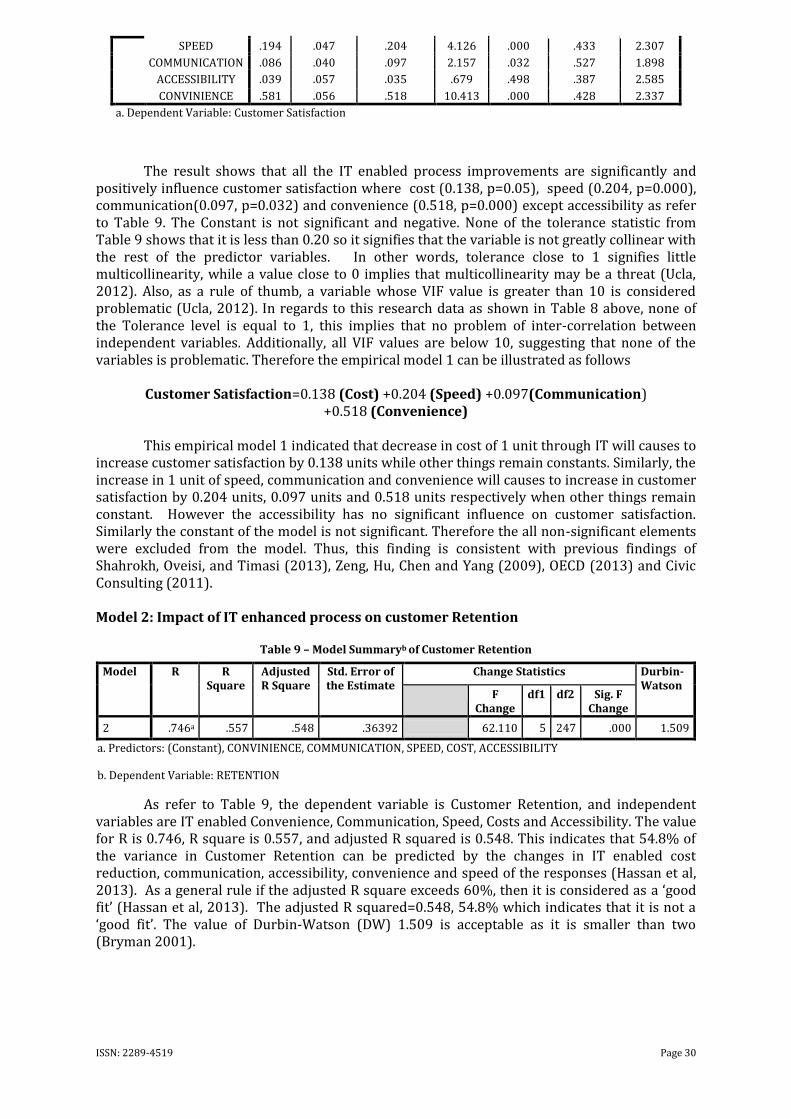
The result shows that all the IT enabled process improvements are significantly and positively influence customer satisfaction where cost (0.138, p=0.05), speed (0.204, p=0.000), communication(0.097, p=0.032) and convenience (0.518, p=0.000) except accessibility as refer to Table 9. The Constant is not significant and negative. None of the tolerance statistic from Table 9 shows that it is less than 0.20 so it signifies that the variable is not greatly collinear with the rest of the predictor variables. In other words, tolerance close to 1 signifies little multicollinearity, while a value close to 0 implies that multicollinearity may be a threat (Ucla, 2012). Also, as a rule of thumb, a variable whose VIF value is greater than 10 is considered problematic (Ucla, 2012). In regards to this research data as shown in Table 8 above, none of the Tolerance level is equal to 1, this implies that no problem of inter-correlation between independent variables. Additionally, all VIF values are below 10, suggesting that none of the variables is problematic. Therefore the empirical model 1 can be illustrated as follows
Customer Satisfaction=0.138 (Cost) +0.204 (Speed) +0.097(Communication) +0.518 (Convenience)
This empirical model 1 indicated that decrease in cost of 1 unit through IT will causes to increase customer satisfaction by 0.138 units while other things remain constants. Similarly, the increase in 1 unit of speed, communication and convenience will causes to increase in customer satisfaction by 0.204 units, 0.097 units and 0.518 units respectively when other things remain constant. However the accessibility has no significant influence on customer satisfaction. Similarly the constant of the model is not significant. Therefore the all non-significant elements were excluded from the model. Thus, this finding is consistent with previous findings of Shahrokh, Oveisi, and Timasi (2013), Zeng, Hu, Chen and Yang (2009), OECD (2013) and Civic Consulting (2011). Model 2: Impact of IT enhanced process on customer Retention
Table 9 – Model Summaryb of Customer Retention
Model R R Square
Adjusted R Square
Std. Error of the Estimate
Change Statistics Durbin-Watson
F Change
df1 df2 Sig. F Change
2 .746a .557 .548 .36392 62.110 5 247 .000 1.509
a. Predictors: (Constant), CONVINIENCE, COMMUNICATION, SPEED, COST, ACCESSIBILITY
b. Dependent Variable: RETENTION
As refer to Table 9, the dependent variable is Customer Retention, and independent variables are IT enabled Convenience, Communication, Speed, Costs and Accessibility. The value for R is 0.746, R square is 0.557, and adjusted R squared is 0.548. This indicates that 54.8% of the variance in Customer Retention can be predicted by the changes in IT enabled cost reduction, communication, accessibility, convenience and speed of the responses (Hassan et al, 2013). As a general rule if the adjusted R square exceeds 60%, then it is considered as a ‘good fit’ (Hassan et al, 2013). The adjusted R squared=0.548, 54.8% which indicates that it is not a ‘good fit’. The value of Durbin-Watson (DW) 1.509 is acceptable as it is smaller than two (Bryman 2001).
ISSN: 2289-4519 Page 31
Table 10 –Coefficientsa of Customer Retention
Model Unstandardized Coefficients
Standardized Coefficients
t Sig. Collinearity Statistics
B Std. Error
Beta Tolerance VIF
2
(Constant)
.188 .262 .718 .473
COST .026 .080 .021 .331 .741 .437 2.287
SPEED .311 .067 .300 4.663 .000 .433 2.307
COMMUNICATION .166 .057 .171 2.923 .004 .527 1.898
ACCESSIBILITY .155 .081 .131 1.928 .055 .387 2.585
CONVINIENCE .314 .079 .257 3.968 .000 .428 2.337
a. Dependent Variable: Customer Retention
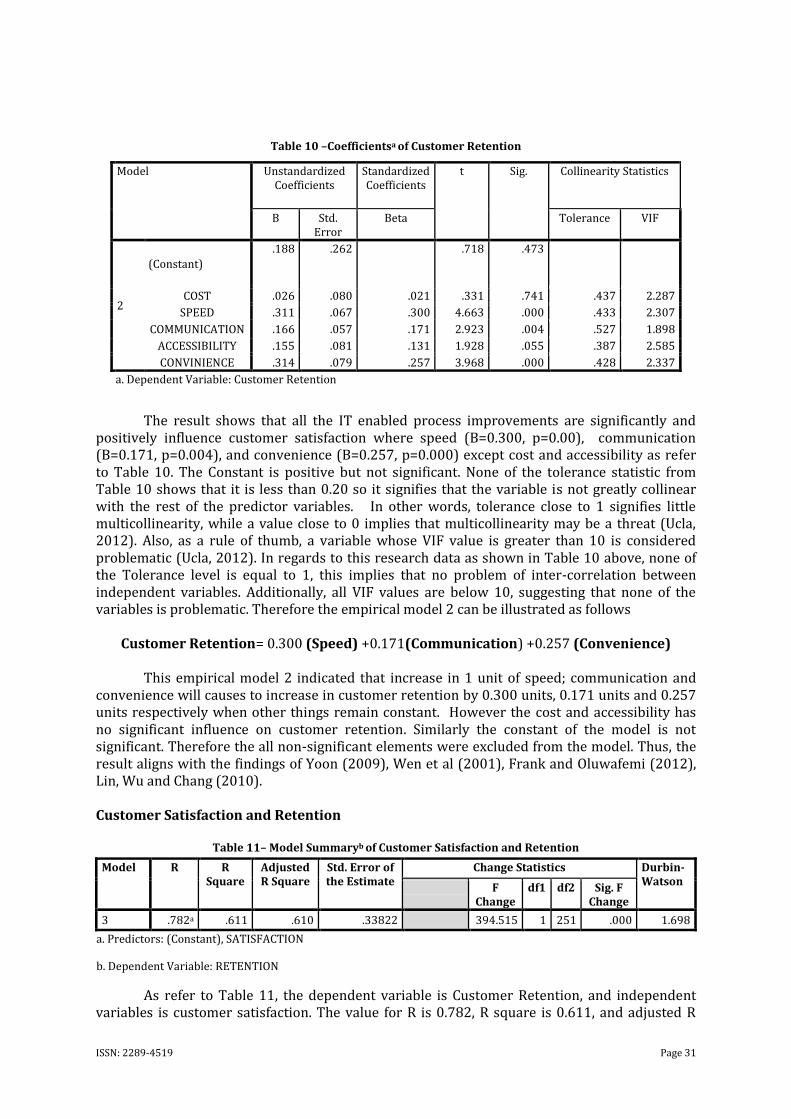
The result shows that all the IT enabled process improvements are significantly and
positively influence customer satisfaction where speed (B=0.300, p=0.00), communication (B=0.171, p=0.004), and convenience (B=0.257, p=0.000) except cost and accessibility as refer to Table 10. The Constant is positive but not significant. None of the tolerance statistic from Table 10 shows that it is less than 0.20 so it signifies that the variable is not greatly collinear with the rest of the predictor variables. In other words, tolerance close to 1 signifies little multicollinearity, while a value close to 0 implies that multicollinearity may be a threat (Ucla, 2012). Also, as a rule of thumb, a variable whose VIF value is greater than 10 is considered problematic (Ucla, 2012). In regards to this research data as shown in Table 10 above, none of the Tolerance level is equal to 1, this implies that no problem of inter-correlation between independent variables. Additionally, all VIF values are below 10, suggesting that none of the variables is problematic. Therefore the empirical model 2 can be illustrated as follows
Customer Retention= 0.300 (Speed) +0.171(Communication) +0.257 (Convenience) This empirical model 2 indicated that increase in 1 unit of speed; communication and convenience will causes to increase in customer retention by 0.300 units, 0.171 units and 0.257 units respectively when other things remain constant. However the cost and accessibility has no significant influence on customer retention. Similarly the constant of the model is not significant. Therefore the all non-significant elements were excluded from the model. Thus, the result aligns with the findings of Yoon (2009), Wen et al (2001), Frank and Oluwafemi (2012), Lin, Wu and Chang (2010). Customer Satisfaction and Retention
Table 11– Model Summaryb of Customer Satisfaction and Retention
Model R R Square
Adjusted R Square
Std. Error of the Estimate
Change Statistics Durbin-Watson
F Change
df1 df2 Sig. F Change
3 .782a .611 .610 .33822 394.515 1 251 .000 1.698
a. Predictors: (Constant), SATISFACTION
b. Dependent Variable: RETENTION
As refer to Table 11, the dependent variable is Customer Retention, and independent variables is customer satisfaction. The value for R is 0.782, R square is 0.611, and adjusted R
ISSN: 2289-4519 Page 32
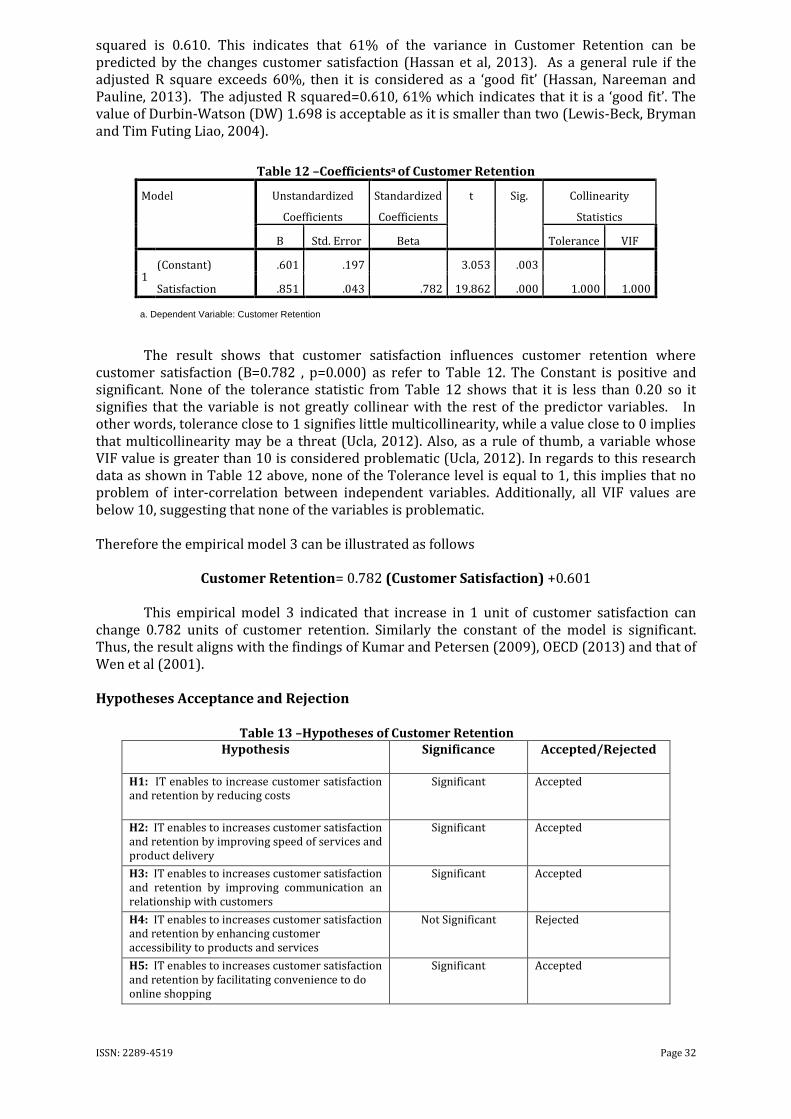
squared is 0.610. This indicates that 61% of the variance in Customer Retention can be predicted by the changes customer satisfaction (Hassan et al, 2013). As a general rule if the adjusted R square exceeds 60%, then it is considered as a ‘good fit’ (Hassan, Nareeman and Pauline, 2013). The adjusted R squared=0.610, 61% which indicates that it is a ‘good fit’. The value of Durbin-Watson (DW) 1.698 is acceptable as it is smaller than two (Lewis-Beck, Bryman and Tim Futing Liao, 2004).
Table 12 –Coefficientsa of Customer Retention
Model Unstandardized
Coefficients
Standardized
Coefficients
t Sig. Collinearity
Statistics
B Std. Error Beta Tolerance VIF
1 (Constant) .601 .197
3.053 .003
Satisfaction .851 .043 .782 19.862 .000 1.000 1.000
a. Dependent Variable: Customer Retention
The result shows that customer satisfaction influences customer retention where
customer satisfaction (B=0.782 , p=0.000) as refer to Table 12. The Constant is positive and significant. None of the tolerance statistic from Table 12 shows that it is less than 0.20 so it signifies that the variable is not greatly collinear with the rest of the predictor variables. In other words, tolerance close to 1 signifies little multicollinearity, while a value close to 0 implies that multicollinearity may be a threat (Ucla, 2012). Also, as a rule of thumb, a variable whose VIF value is greater than 10 is considered problematic (Ucla, 2012). In regards to this research data as shown in Table 12 above, none of the Tolerance level is equal to 1, this implies that no problem of inter-correlation between independent variables. Additionally, all VIF values are below 10, suggesting that none of the variables is problematic. Therefore the empirical model 3 can be illustrated as follows
Customer Retention= 0.782 (Customer Satisfaction) +0.601 This empirical model 3 indicated that increase in 1 unit of customer satisfaction can change 0.782 units of customer retention. Similarly the constant of the model is significant. Thus, the result aligns with the findings of Kumar and Petersen (2009), OECD (2013) and that of Wen et al (2001). Hypotheses Acceptance and Rejection
Table 13 –Hypotheses of Customer Retention Hypothesis Significance Accepted/Rejected
H1: IT enables to increase customer satisfaction and retention by reducing costs
Significant Accepted
H2: IT enables to increases customer satisfaction and retention by improving speed of services and product delivery
Significant Accepted
H3: IT enables to increases customer satisfaction and retention by improving communication an relationship with customers
Significant Accepted
H4: IT enables to increases customer satisfaction and retention by enhancing customer accessibility to products and services
Not Significant Rejected
H5: IT enables to increases customer satisfaction and retention by facilitating convenience to do online shopping
Significant Accepted
ISSN: 2289-4519 Page 33
5. Conclusion and Recommendation The aim of this research is to examine the impact of IT enabled factors or process on customer satisfaction and retention. After the analysis of the result, this research concluded the following
This research found that cost reduction has a significant and positive impact on customers’ satisfaction. This means that information technology had enabled Tesco Malaysia to reduce its product prices and helped customers to reduce their cost, as such, reduction in customers cost satisfies Tesco Malaysia’s customers. However, this research found that, cost reduction does not have impact on customers’ retention. Therefore IT enabled cost reduction has a significant and positive impact on customer satisfaction but not on customer retention. It was found in this study that speedy process has a significant and positive impact on customers’ satisfaction. This implies that information technology improves Tesco Malaysia’s delivery service and enables Tesco customers’ to receive their ordered product within the chosen time slot, hence, the speedy process of Tesco’s delivery service satisfies Tesco Malaysia’s customers’. Similarly, this research also found that speedy process has significant and positive impact on customers’ retention. This shows that, due to the speedy process of Tesco Malaysia’s delivery service, Tesco’s customers’ prefer to shop on Tesco’s e-shop. According to the findings of this research, communication and relationship has a significant and positive impact on customers’ satisfaction. This shows that information technology enhanced the communication and relationship between Tesco Malaysia and its customers’ through the use of facebook and twitter that enables Tesco to update its customers’ on recent activities and promotions and the e-customers service center that helps customers’ with shopping issues. As such, Tesco Malaysia had been able to satisfy its customers through communication and relationship. Likewise, communication and relationship has significant and positive impact on customers’ retention. Base on this research finding, accessibility does not have impact on customers’ satisfaction nor retention. This suggests that been able to access Tesco’s e-shop 24/7 does not influence Tesco Malaysia’s customers’ satisfaction or neither retention. It was found in this study that convenience has significant and positive impact on customers’ satisfaction and retention. This proves that information technology had enabled Tesco Malaysia to provide convenient means of shopping to its customers’. Tesco Malaysia had reduced customers’ stress of pushing trolley around the mall and queuing on payment lines, as such customers’ found this satisfying and encouraged repeat purchases. Also this study concludes that improved customer satisfaction has a positive and significant influence on customer satisfaction. This means if by any means if customer satisfaction is improved, then customer retention will improve.
Implications and future research direction
Overall, this study concluded IT enables organisations to reduce cost, improve convenience, ease accessibility and enhance communication , and enables to respond customer enquiries more quickly. This enables to improve customer satisfaction and retention. Therefore this study recommends the following:
ISSN: 2289-4519 Page 34
Focus on implementing IT based solution on all the functions of the organisation.
Secondly, future studies should refined the variables that are more relevant to other
aspects of business rather than focusing only on customers.
This study will be a useful study for those managers who are trying to implement IT
based systems to enhance customer satisfaction and retention. This study will be a guide to
those who wants to link IT systems and customer satisfaction and retention.
References Ahearne, M. and Schillewaert, N.2000. The Effect of Information Technology on Salesperson Performance.
Working paper of e-Business Research Center 2000, pp.1-47. Pennsylvania State University (Online).
Available at: http://citeseerx.ist.psu.edu/viewdoc/download?doi=10.1.1.387.6352&rep=rep1&type=pdf
[Accessed 7 October 2013].
Alkadi, I., Alkadi, G. ve Totaro, M. 2003. Effects of Information Technology On The Business. World Human
Systems Management, 22(3) pp. 99-103
Aremu, M.A. and Saka, H.T., 2014. The impact of information technology on library management: a marketing
perspective. Arabian Journal of Business and Management Review (Oman Chapter), 4(4), pp.1-10
ISSN: 2289-4519 Page 35
Bae, B.B. and Ashcroft, P., 2004. Implementation of ERP systems: accounting and auditing implications.
Information systems control journal, 5, pp.43-48.
Beldona, S., Morrison, A.M. and O’Leary, J. 2005. Online shopping motivations and pleasure travel products: A
correspondence analysis. Tourism Management, 26 (5), pp 561–570.
Bell, J. 2010. Doing Your Research Project: a Guide for First-time Researchers in Education, Health and Social
Science. Maidenhead: McGraw Hill.
Bryman, A. (2001). Social Research Methods. New York: Oxford University Press.
Cheung, M.K. and Lee, M.K., 2005. Research framework for consumer satisfaction with internet shopping. City
University of Hong Kong, China. Sprouts: Working Papers on Information Systems, 5(26), pp.5-26.
Chhokar, J.S., Brodbeck, F.C. and House, R.J.2013. Culture and Leadership Across the World: The GLOBE
Book of In-Depth Studies of 25 Societies. Harlow: Cencage learning Inc.
Civic Consulting. 2011. Consumer Market Study On The Functioning Of E-Commerce And Internet Marketing
And Selling Techniques In The Retail Of Goods, Final Report Part 1: Synthesis Report, prepared for the
Executive Agency for Health and Consumers on behalf of the European Commission. [pdf] Available at:
<http://ec.europa.eu/consumers/consumer_research/market_studies/docs/study_ecommerce_goods_en.pdf>
[Accessed, 25 January 2014].
Colombo, G.1994. Sales Force Automation. New York: McGraw-Hill.
Damanpour, F. and Damanpour, J.A. 2001. E-business e-commerce evolution: perspective and strategy.
Managerial Finance, 27(7) pp.16-33.
Daneshvar, P. and Ramesh H.N. 2010. Review of Information Technology Effect on Competitive Advantage
Strategic Perspective. International Journal of Engineering Science and Technology, 2(11), pp.6248-625.
Dhar, V. and Sundararajan, A. 2007. Information Technologies in Business: A Blueprint for Education and
Research. Information Systems Research, 18(2) pp.125–141.
Duncan, T. and Moriarty, S.E., 1998. A communication-based marketing model for managing relationships. The
Journal of marketing, 62(2), pp.1-13.
Easterby-Smith, M., Thorpe, R. Jackson, P. and Lowe, A. 2008. Management Research. 3rd ed. Sage: London.
Field, A.2000. Discovering Statistics Using SPSS for Windows. London: Sage Publications.
Frank, I. and Oluwafemi, J. 2012. Impact of Information Technology on Nigeria Banking Industry: a case Study
of Skye Bank. International Journal of Computing Academic Research (IJCAR) 1(1), pp.25-35.
Gelard, P., and Negahdari, A. 2011. A New Framework For Customer Satisfaction In Electronic Commerce.
Australian Journal of Basic and Applied Sciences, 5(11),pp.1952-1961
Georganta, Z. and Vogiatzi, M., 2010. The Effects of Information and Communication Technologies on E-
Business Performance: Designing a Path Analysis Framework. Journal of Information Technology Impact,
10(3), pp.137-160.
George, D., & Mallery, P. 2003. SPSS for Windows step by step: A simple guide and reference. 11.0 update. 4th
ed. Boston: Allyn & Bacon.
Graham, C.H., Elith, J., Hijmans, R.J., Guisan, A., Townsend Peterson, A. and Loiselle, B.A., 2008. The
influence of spatial errors in species occurrence data used in distribution models. Journal of Applied
Ecology, 45(1), pp.239-247.
Grant, G. 2001. Managing Telecommunications and Networking Technologies in the 21st Century: Issues and
Trend. [e-book] Hershey: Idea Group Publishing. Available at: Google Books [Accessed 11 February
2014].
Hair, J., Anderson R.E., Tatham R.L., Black W.C.1995. Multivariate data analysis. 4th ed. New Jersey:
Prentice-Hall Inc.
Hassan, Z., Nareeman, A., & Pauline, N. 2013. Impact of CSR Practices on Customer Satisfaction and
Retention: An Empirical Study on Foreign MNCs in Malaysia. International Journal of Accounting and
Business Management, 1(1), pp.63-81. Available at SSRN 2327243.
Hatcher, L. 1994. A step-by-step approach to using the SAS(R) system for factor analysis and structural
equation modeling. Cary, NC: SAS Institute.
IBM. 2006. Reaping the business advantages of accessibility for banking, pp.1-8 [online] Available at:
http://www-03.ibm.com/able/dwnlds/BusinessAdvantBanking-ExecBrief-accessible.pdf. [Accessed 11
February 2014].
Intellitrend. 2013. Measuring the Business Impact of Technology Performance. [pdf] Available at:
http://www.compuware.com/content/dam/compuware/about/techfail/Study-The-True-Cost-of-Poor-
Technology-Performance.pdf [Accessed 7 October 2013].
Julius, A.O., Abiola, R.O., Uzoka, F.M., 2001. The Impact Of Information Technology On Banking Services In
Nigeria. [pdf] Available at: http://dspace.futa.edu.ng:8080/jspui/handle/123456789/1177 [Accessed, 25
January 2014].
Karmarkar, S. U. and Mangal, V. 2007. Information Technology Impact on Business Practices: The Ucla Bit
Project. Annals of Information Systems, 1(2), pp.385-411.
Keillor, B., Bashaw, E., Pettijohn, C., (1997), Sales Force Automation Issues Prior to Implementation: The
relationship between attitudes toward technology, experience and productivity. Journal of Business and
Industrial Marketing, 13(5), pp.209-219.
Kline, P. 1994. An Easy Guide to Factor Analysis. London: Routledge.
ISSN: 2289-4519 Page 36
Kotzab, H. and Bjerre, M. 2005. Retailing in a SCM-perspective. [e-book] Denmark: Copenhagen Business
School. Available at: Google Books [Accessed 24 December 2013].
Krafft, M., and Mantrala, M.K. 2010. Retailing in the 21st Century: Current and Future Trends. 2nd ed.
Columbia: Springer.
Kumar S. and Petersen, P. (2009). Impact of e-commerce in lowering operational costs and raising customer
satisfaction. Journal of Manufacturing Technology Management, 17(3), pp.283-302.
Lin, C.C., Wu, H.Y. and Chang, Y.F., 2011. The critical factors impact on online customer satisfaction.
Procedia Computer Science, 3, pp.276-281.
Lindh, C., Dahlin, P. and Hadjikhani, A., 2008. How Does Information Technology Impact on Business
Relationships? In The Need for Personal Meetings. Published at the 24th IMP-conference in Uppsala,
Sweden. [pdf] Available at: http://impgroup.org/uploads/papers/6163.pdf [Accessed 8 October, 2013].
MacCallum, R.C., Widaman, K.F., Zhang, S. and Hong, S., 1999. Sample size in factor analysis. Psychological
methods, 4(1), pp.84-99.
Manzoor, A. 2012. Information Technology in Business. New York: Cengage Learning.
Moncrief, W.C., Lamb, C.W. and Mackay, J.M., 1991. Laptop computers in industrial sales. Industrial
Marketing Management, 20(4), pp.279-285.
Mujis, R. 2010. Introduction to quantitative research. [pdf] Available at: http://www.sagepub.com/upm-
data/36869_muijs.pdf [Accessed, 5 February2014].
Nunnaly, J.1978. Psychometric theory. New York: McGraw-Hill.
OECD. 2013. Electronic And Mobile Commerce. [pdf] Available at:
<http://search.oecd.org/officialdocuments/publicdisplaydocumentpdf/?cote=DSTI/ICCP/IE/IIS(2012)1/FIN
AL&docLanguage=En> [Accessed, 25 January 2014].
Oliver, R. L., 1999. Consumer Behaviour: A Framework for Analysis and Research. New York: Routledge.
Opdeakker, R. 2006. Advantages and Disadvantage of Four Interview Techniques in Quantitative Research.
Qualitative Social Research Journal, 7 (4), pp.63-75.
Pett M.A., Lackey N.R., Sullivan J.J. 2003. Making Sense of Factor Analysis: The use of factor analysis for
instrument development in health care research. California: Sage Publications Inc.
Pigott, T.H. 2001. A Review of Methods for Missing Data. Educational Research and Evaluation, 7(4), pp.353-
383.
Porter M.E. and Millar V.E. 2001. The Information Revolution is Transforming the Nature of Competition.
[pdf] Available at: http://www.ida.liu.se/~TDEI65/documents/8500002422.pdf [Accessed 22 January,
2014].
Rajaraman, V. 2013. Introduction To Information Technology. 2nd ed. New Delhi: PHI Learning Private
Limited.
Reijers, H.A., and Jansen-Vullers, M. H. 2005. Better Processes Better E-Commerce. [pdf] Available at
http://spaa.newark.rutgers.edu/casesimportal/storage/documents/technology/public/case/Better_Processes__
Better_E-Commerce.pdf [Accessed, 25 January 2014].
Robson, C.1993. Real World Research. Oxford: Blackwell.
Rogelberg, S. O. 2004. Handbook of Research Methods in Industrial and Organizational Psychology. Oxford:
Blackwell Publishing Ltd.
Sara, D. 2013. How we bought groceries online from TESCO? 6 Steps. [online] Available at:
http://jewelpie.com/how-we-bought-groceries-online-from-tesco/ [Accessed 19 December 2013].
Saunders, M., Lewis, P. and Thornhill, A. 2009. Research Methods for Business Students. 5th ed. Harlow:
Pearson Education Limited.
Schaupp, L.C. and Bélanger, F. 2005. A conjoint analysis of online consumer satisfaction. Journal of Electronic
Commerce Research, 6 (2), pp.95-111
Shahrokh, Z.D, Oveisi, N. Timasi, S.M. 2013. E-commerce A Customer Loyalty Perspective. Journal of Basic
and Applied Scientific Research. 3(6), pp.636-644.
Shajahan S. 2004. Relationship Marketing: Text and Cases. [e-book] New Delhi: McGraw Hill. Available at:
Google Books [Accessed 24 December 2013].
Stats, I.W. 2010. Malaysia Internet Usage Stats and Marketing Report. Available at:
<http://www.internetworldstats.com/asia/my.htm> [Accessed 19 December 2013].
Steinmacher, M. 2010. The Customer is always right. [pdf] Available at:
<http://michaelsteinmacher.com/CUSTOMER%20web.pdf> [Accessed 19 December, 2013].
Subramaniam M.M. 2007. The Development of Information Technology Curricula Guidelines and Skill
Standard. [e-book] New York: Cencage learning. Available at: Google Books [Accessed 24 December
2013].
Tesco. 2012. About Tesco Store. [online] Available at: <http://www.tesco.com.my/html/tesco_store-
details.aspx?ID=115&PID=122> [Accessed 19 December, 2013].
TheSun. 2013. Survey: Most local firms not social media savvy. The sun, 10 Dec. p14 [online] Available at:
http://www.pwc.com/my/en/assets/press/131210-thesun-most-local-firms-not-socialmedia-savvy.pdf
[Accessed 12 December, 2013].
ISSN: 2289-4519 Page 37
Thompson, B. 2005. The Loyalty Connection: Secrets To Customer Retention And Increased Profits. [pdf]
Available at: http://ugyfelorientalt.hu/wp-content/uploads/2013/02/A-lojalit%C3%A1s-
kapcsolat_RN_LoyaltyCRMGuru.pdf [Accessed 15 April, 2014]
Trauth E.M. 2006. Encyclopedia of Gender and Information Technology. [e-book] London: Idea Group
Reference. Available at: Google Books [Accessed 24 December 2013].
Tsai, H. 2003. Information Technology and Business Process Reengineering: New Perspectives. [e-book]
Westport: Praeger Publisher. Google Book. [Accessed 23 October 2013].
Ucla. 2012. SPSS Web Books Regression with SPSS. [online] Available at:
http://www.ats.ucla.edu/stat/spss/webbooks/reg/chapter2/spssreg2.htm [Accessed 15 April, 2014]
Wen, H.J., Chen, H.G. and Hwang, H.G., 2001. E-commerce Web site design: strategies and models.
Information management & computer security, 9(1), pp.5-12.
Wilson, J. 2010. Essential of Business Research: a Guide to Doing Your Research Project. London: Sage
Publication.
Wong C.K. 2013a. The Ultimate Guide to E-Commerce Statistics of Southeast Asia & Malaysia [online]
Available at: <http://www.ecommercemilo.com/2013/08/ecommerce-statistic-southeast-asia-
malaysia.html#.UrVNMNIW12o> [Accessed 19 December 2013].
Wong, C.K. 2013b. A closer look at Tesco Online Shopping setup & fulfillment service. [online] Available at:
<http://www.ecommercemilo.com/2013/08/tesco-online-shopping-setup-fulfillment-
service.html#.UrPREdIW12p> [Accessed 19 December 2013].
Yoon, S.H. 2009. Determinants of Online Service Satisfaction and Their Impacts on Behavioral Intentions.
[pdf]. Google Book. [Accessed, 25 January 2014]. Abu Bakar, A.R(2014). Customer store loyalty in the
context of customer perceived value in Saudi Arabia. Journal of contemporary research in business, 5(12),
442-460 [e-journal] available from: http://journal-archieves36.webs.com/442-460apr14.pdf [accessed 16th
March 2016].