Embed Size (px)
Citation preview
TREE TRANSPIRATION IN FOREST PLANTATIONS : EFFECTS OF SPECIES, SEASONALITY AND
DIVERSITY (PANAMA )
Dissertation zur Erlangung des akademischen Grades des Doktors der Forstwissenschaften (Dr. forest.) der Fakultät für Forstwissenschaften und Waldökologie
vorgelegt von Norbert Kunert geboren in Nürnberg, Deutschland
Göttingen, 2010

TREE TRANSPIRATION IN FOREST PLANTATIONS : EFFECTS OF SPECIES, SEASONALITY AND DIVERSITY
(PANAMA )
Dissertation zur Erlangung des akademischen Grades des Doktors der Forstwissenschaften (Dr. forest.) der Fakultät für Forstwissenschaften und Waldökologie der Georg-August-Universität Göttingen
vorgelegt von Norbert Kunert geboren in Nürnberg, Deutschland Göttingen, 2010

1. Gutachter: Prof. Dr. Dirk Hölscher
2. Gutachter: Prof. Dr. Christian Ammer
Tag der mündlichen Prüfung: 9. Juni 2010

TABLE OF CONTENT
Summary _________________________________________________________________ I
Resumen _________________________________________________________________ V
Zusammenfassung________________________________________________________ IX
1 Introduction _________________________________________________________1
1.1 Plantation forestry in the tropics 1 1.2 Water use by tropical trees 2 1.3 Plant diversity and ecosystem processes 4 1.4 Objectives of this study 5
2 Study sites __________________________________________________________7
2.1 Overview 7 2.2 Location of study sites in Panama 7 2.4 Plantation administrated by the Smithsonian Tropical Research Institute 9 2.5 Plantation of the Autoridad Nacional del Ambiente 12 2. Study sites in the Philippines and in Indonesia 13
3 Methodology _______________________________________________________15
3.1 Overview 15 3.5 Micrometeorological variables and soil moisture 16 3.6 Measuring sap flux density, water use and transpiration 18 3.7 Assessing changes in tree phenology 20 3.8 Additive partitioning of biodiversity effects 21 3.9 Sap flux density model 23
4 Seasonal dynamics of tree sap flux and water use _________________________25 in nine species in Panamanian forest plantations
5 Tree diversity enhances tree transpiration _______________________________41 in a Panamanian forest plantation
6 Comparison of tree water use characteristics in reforestation _______________59 and agroforestry stands across the tropics
7 Conclusions ________________________________________________________71
References _______________________________________________________________75
Acknowledgements ________________________________________________________86
Supporting documents _____________________________________________________87


SUMMARY
I
TREE TRANSPIRATION IN FOREST PLANTATIONS: EFFECTS OF SPECIES, SEASONALITY AND
DIVERSITY (PANAMA )
Forests serve many benefits worldwide such as providing renewable raw materials and
energy, maintaining biodiversity and protecting land and water resources. However, they are
threatened by fire, agricultural and urban expansion and various other disturbances.
Especially in tropical areas the loss of forest cover is on an alarming high rate. Therefore the
establishment of tree plantations in the tropics is of increasing importance to mitigate climate
change by carbon sequestration and as a contribution to the growing demand for wood.
Current research suggests that well designed forest plantations can reduce the volume of
sediment, nutrients and salt transported into river systems. Nevertheless, there is a growing
concern that tree plantations could potentially use high quantities of water. So far, most of
afforestation and reforestation with tree plantations has been conducted with monocultures
involving a limited number of species. Such traditional plantations have supplied some
benefits but have made only minor contributions to the restoration of ecological functions and
biodiversity. According to that, recent approaches to reforestation in the tropics emphasize
the establishment of multispecies plantations consisting of native tree species. Information on
species-specific water use characteristics of tropical trees is at present very limited. The few
existing multispecies reforestation experiments are pointing out that tropical plantations
containing higher tree diversity are likely to be more productive in biomass than
monospecific stands, but possible changes in the hydrological cycle have rarely been studied.
Furthermore, the effectiveness of tree species selection in stands aiming at biomass
production can be questioned, as recent studies in old growth forest showed that species-
independent relationships between water use and tree size exist.
The main objectives of this study were
(1) to determine the influence of species and tree structural traits on seasonal water use
characteristics in trees planted monocultures,
(2) to assess the effect of tree diversity (1-, 3-, and 6-species mixtures) on the water use
of tree plantations, and
(3) to compare water use characteristics of trees growing in different land use systems
across the tropics.

SUMMARY
II
The main part of this dissertation was conducted on an experimentally designed tree
plantation in Panama. Chapters 4 and 5 of this thesis are dealing with the results gained from
the field study in Panama. Chapter 6 presents data on how generalizations could be made for
trees growing in different land-use systems at different locations in the tropics.
Chapter 4 is addressing water use characteristics in tree species growing in monocultures
under seasonal climate. Thermal dissipation sensors were applied to measure sap flux over
one entire year in nine tree species, six of which were native to the region and three were
exotics widely planted throughout the tropics, growing in two plantations near the village
Sardinilla, Panama. Each species was represented by four individuals with a sun-exposed
crown. Simultaneously, environmental variables such as photosynthetic photon flux density,
vapour pressure deficit and soil moisture were registered and aspects of tree leaf phenology
were quantified. These species range in leaf phenology from evergreen to semi-deciduous
and to deciduous.
Chapter 5 is presenting results from comparison of monoculture and multispecies plots
consisting of native tree species. The hypothesis of this chapter was that tree diversity
enhances tree transpiration of mixed tree species plots. To test this hypothesis we measured
tree sap flux and estimates water useplot transpiration. Measurements were conducted in 60
trees in a seven-year-old tree plantation in Panama for one year. Trees were planted in
monoculture, 3-species mixtures and 6-species mixtures. Biodiversity effects were
statistically partitioned on plot level transpiration, and the importance of complementarity of
species on tree water use was evaluated.
Chapter 6 is based in part on data provided by members of the research group. The dataset
from the monoculture plots in Panama was combined with the datasets from mixed
reforestation stands in the Philippines and an agroforestry stand in Indonesia. A simple sap
flux model was applied to describe sap flux as a function of the most important
environmental variables. This resulted in a synthesis covering more than 100 trees belonging
to 17 species that were studied using almost identical methods. The aim of this study was to
see if generalisations could be made for trees growing in different land-use systems at
different locations in the tropics.

SUMMARY
III
The main findings were following:
• Results from the monocultures in Panama showed that under full foliage, maximum sap
flux densities varied more than two-fold among species. Time of leaf shedding and
duration of leafless periods also varied strongly among the semi-deciduous and among the
deciduous species. However, the relationship between percentage of foliage and
normalized maximum sap flux densities can be described by a universal non species-
specific function. Species means of maximum transpiration rates on a basis of projected
crown area varied more than two-fold (1.2 - 2.8 mm d-1). Transpiration rates between the
dry and wet season differed for six of the nine species. Three species (Acacia mangium,
Anacardium excelsum, and Gmelina arborea) showed enhanced transpiration in the dry
season with dry to wet season ratios between 1.4 and 2.1. In contrast, the dry to wet
season ratio of Cedrela odorata, Hura crepitans, and Tectona grandis ranged from 0.4 to
0.8. The results suggest that tree species choice can substantially influence water resource
use in plantation forestry under such seasonal climatic conditions.
• The results of the comparison of the monoculture and multispecies plots showed that
species-specific annual course of sap flux density varied little among mixture types.
Annual tree water use differed significantly among species. Maximum tree water use was
related to tree diameter (r2 = 0.54, p < 0.001). Trees in most of the 3-species mixtures and
in all 6-species mixtures had attained bigger diameters than those growing in
monocultures, which was associated with increased tree water use rates. Accordingly, the
estimated annual transpiration correlated with the basal area of the study plots. However,
the 6-species mixtures had significantly higher transpiration rates per unit basal area than
monocultures and 3-species mixtures (51% and 56%, respectively). An additive
partitioning method suggests a positive net biodiversity effect induced by
complementarity of species. We assume that enhanced transpiration rates in mixed plots
might arise from complementary use of radiation and from higher canopy roughness of
the mixed species plots. Our results suggest that complementarity of species influences
tree water use rates in tree species mixture and can thus be used for an optimization of
water resource management.

SUMMARY
IV
• The synthesis of data collected from more than 100 trees belonging to 17 species revealed
a threefold range of maximal sap flux densities and significant differences in sap flux
densities within species growing at each of the given study sites. A declining, species
independent relationship between sap flux density and tree diameter, suggested in
literature, could not be substantiated by this large dataset. Despite the very different study
locations and large number of species included, pooled data revealed a strong linear
relationship between water use rates and tree diameter (R2adj = 0.65). Even so, trees of
different species with comparable diameter and contrasting water use (twofold
differences) were found at all sites, indicating that species-identity may affect water use
in a variety of land-use systems throughout the tropics.
In conclusion, it can be said that all results suggest an effect of species on tree water use
characteristics and that species selection, under seasonal climate especially through the
choice of tree phenolgy and species combination are helpful tools to balance water use and
productivity of manmade forest.

RESUMEN
V
TRANSPIRACIÓN DE ÁRBOLES EN PLANTACIONES
FORESTALES: EFECTOS DE LAS ESPECIES, ESTACIONALIDAD Y DIVERSIDAD (PANAMA )
A nivel mundial, los bosques proveen muchos beneficios como materiales renovables y
energía, manteniendo la biodiversidad y protegiendo recursos del suelo y agua. Sin embargo,
se encuentran bajo la amenaza de expansiones urbanas y agrícolas, incendios y otro tipo de
perturbaciones. La tasa de pérdida de cobertura de los bosques en areas tropicales se
encuentra a niveles extremadamente altos. Por lo tanto, establecer plantaciones en zonas
tropicales es de gran importancia para mitigar los cambios climáticos secuestrando carbon y
para contribuir a la creciente demanda de productos madereros. Investigaciones han
demostrado que el buen diseño de plantaciones forestales puede reducir el volumen
sedimentos, nutrientes y volumen de sal que llegará a sistemas acuíferos. No obstante, aun se
cuestiona el hecho de que plantaciones forestales pueden requerir grandes cantidades de agua.
Hasta el momento la mayoría de los proyectos de aforestación y reforestación se han
realizado con monocultivos, incluyendo un número limitado de especies. Este tipo de
plantaciones proveen algunos beneficios materiales pero contribuyen de manera muy limitada
a restorar funciones ecológicas y biodiversidad. Es por eso que recientes enfoques en
investigaciones de reforestación en los trópicos hacen énfasis en establecer plantaciones con
múltiples especies nativas. La información y conocimiento acerca de las carácteristicas de
uso del agua específico por especie es actualmente muy limitado. Los pocos estudios de
reforestación realizados utilizando múltiples especies señalan que plantaciones con una
mayor diverisdad tienden a ser más productivas en cuanto a la biomasa que plantaciones de
una sola especie, sin embargo no se ha tomado en cuenta el efecto de posibles cambios en el
ciclo hidrológico. La efectividad en la selección de especies en base a la produción de
biomasa es cuestionable, ya que estudios recientes demuestran la relación que hay entre el
uso del agua y el tamaño de los árboles en bosques maduros.

RESUMEN
VI
Los principales objetivos de este estudio fueron:
(1) Determinar la influencia de especies y rasgos estructurales de los árboles en las
características de uso del agua en plantaciones de monocultivos,
(2) Cuantificar el efecto de la diversidad de especies (mezclas de 1-, 3-, 6- especies) en el
uso del agua en plantaciones forestales, y
(3) Comparar características en el uso del agua en árboles creciendo en distintos tipos de
uso del suelo en zonas tropicales
El componente principal de esta tesis se llevó a cabo en una plantación experimental en
Panamá. Los capítulos 4 y 5 de la tesis presentan los resultados obtenidos del trabajo de
campo en Panamá. En el capítulo 6 se muestran resultados generales comparando
información de árboles de diferentes sistemas ambientales en varias regiones tropicales.
En el capítulo 4 se presenta la información de monocultivos y características del uso del agua
en las especies en un clima estacional. Sensores de disipación térmica se usaron para medir
el flujo de savia a lo largo de un año en 9 especies de árboles, seis especies nativas a la region
y 3 introducidas y comunmente utilizadas en plantaciones en zonas tropicales. Este trabajo se
realizó en dos plantaciones en la localidad de Sardinilla, República de Panamá. Cada especie
estaba representada por 4 individuos cuya copa estaba expuesta al sol. Igualmente se
midieron variables ambientales como densidad del flujo de fotones fotosintéticos, el deficit
en presión del vapor y la humedad en el suelo. También se cuantificaron aspectos de la
fenológia de hojas en los árboles. Las especies estudiadas varían en fenología de hojas de
siempreverdes, semicaducos a caducos.
El capítulo 5 se enfoca en la comparación de monocultivos y plantaciones con multiples
especies nativas a la region, y se espera que la diversidad de árboles aumenta la perdida de
agua en plantaciones con múltiples especies. Para este estudio se midió el flujo de savia y
uso del agua, y estadísticamente se dividieron los efectos de biodiversidad en los niveles de
transpiración por parcela. Esto permitió caracterizar la importancia de complementaridad de
especies en el uso de agua por los árboles. Las medidas se hicieron durante un año en 60
árboles en una plantación establecida hace 7 años en Panamá. Los árboles se plantaron en
parcelas de 1, 3, y 6 especies.

RESUMEN
VII
El capítulo 6 concierne datos provenientes de varios miembros del grupo de investigación.
Los datos obtenidos de los monocultivos en la plantación en Panamá se utilizaron en conjunto
con datos de parcelas mixtas de reforestación en las Filipinas y un sitio agroforestal en
Indonesia. Un modelo simple de flujo de savia se aplica para discribir el flujo de la savia en
función de las más relevantes variables ambientales. Este trabajo resulto en una sintesis de
datos con más de 100 árboles representando 17 especies que se han estudiado bajo una misma
metodología. El propósito de este estudio es investigar posibles generalizaciones en los
árboles creciendo en diferentes sistemas en distintas localidades tropicales.
Los resultados principales son los siguientes:
• El estudio de los monocultivos en Panama muestran que la densidad de flujo máximo
de la savia varía más del doble entre especies cuando el follaje es completo. El
tiempo en que las hojas empiezan a caer y la duración de los periodos sin hojas tienen
una fuerte variación entre las especies. Sin embargo, la relación entre el porcentaje de
follaje y las densidades máximas de flojo de savia normalizadas pueden describirse
con una función universal no específica por especie. La media de las tasas máximas
de transpiración proyectadas en base al área de la copa varía más del doble (1.2 – 2.8
mm d-1). Las tasas de transpiración entre la estación seca y la estación humeda varía
para seis de las nueve especies. Tres especies (Acacia mangium, Anacardium
excelsum, and Gmelina arborea) muestran aumentos en la transpiración durante la
estación seca. La proporción de transpiración entre la estación seca y la estación
humeda es de 1.4 a 2.1. A diferencia de las otras especies Cedrela odorata, Hura
crepitans, y Tectona grandis, en donde la proporción de la estación seca a la humeda
va de 0.4 a 0.8. Los resultados indican que la selección de especies para plantaciones
forestales puede influenciar significativamente el uso del agua bajo estaciones
climáticas similares.
• Los resultados de la comparación de monocultivos y plantaciones con múltiples
especies muestran que el curso anual de la densidad de flujo de savia especifico para
cada especie varía poco entre las distintas mezclas de especies. El uso anual del agua
por los árboles difiere significativamente entre especies. El máximo uso del agua se
relaciona al diametró del árbol (r2 = 0.54, p < 0.001). Los árboles en la mayoría de las
parcelas de mezclas de tres especies y todas las de seis especies tienen mayores

RESUMEN
IIX
diametros que aquellos en los monocultivos, lo cual se puede relacionar con una
mayor tasa de uso de agua por los árboles. Igualmente la transpiración anual estimada
se correlaciona con el área basal en los sitios de estudio. Sin embargo, las parcelas
con seis especies tienen tasas de transpiración significativamente más altas por unidad
de área basal que los monocultivos y mezclas de tres especies (51 y 56%
respectivamente). Un método de división aditiva sugiere un efecto neto positivo de la
biodiversidad inducido por el efecto complementario de las especies. Suponemos que
los aumentos en la tasa de transpiración en parcelas con mezcla de especies se dan por
el uso complementario de la radiación y una mayor heterogeneidad en el dosel en las
parcelas con mezcla de especies. Nuestros resultados sugieren un efecto
domplementario de las especies que influye en las tasas de uso del agua en parcelas
con múltiples especies, lo cual puede utilizarse para optimizar el manejo del agua.
• La sintesis de los datos colectados de más de 100 árboles representando 17 especies
dejan ver una variación tres veces mayor en la densidad máxima del flujo de savia así
como diferencias significativas en la densidad del flujo de savia dentro del grupo de
especies en cada sitio de estudio. Una relación decreciente entre la densidad del flujo
de savia y el diámetro del árbol, independiente de la especie, propuesto en la
literatura, no puede confirmarse con el extenso conjunto de datos presentados en
estudio. A pesar de la gran diferencia en sitios de estudio y en alto número de especies
incluidas, el agrupamiento de los datos reveló una fuerte relación linear entre las tasas
de uso de agua y diámetro de los árboles (R2adj = 0.65). Igualmente, los árboles de
distintas especies con un diámetro similar y distinto uso del agua (differencias de
doble del valor) se encontraron en todos los sitios. Esto indica que la identidad de las
especies puede afectar el uso del agua en una variedad de sitios con distintos usos del
suelo alrededor de las zonas tropicales.
En conclusión, puedo decir que todos los resultados indican un efecto de las especies en el
uso del agua por los árboles, y que la selección de especies en sitios con un clima estacional,
tomando en cuenta las distintas fenologías y combinación de especies, es una herramienta
importante para equilibrar el uso del agua y la productividad en plantaciones forestales.

ZUSAMMENFASSUNG
IX
BAUMTRANSPIRATION IN FORSTLICHEN
PLANTAGEN: EFFEKTE VON ARTEN, SAISONALITÄT
UND DIVERSITÄT (PANAMA )
Die weltweit vorhandenen Wälder bieten eine Bandbreite an Nutzungsmöglichkeiten. Sie
stellen erneuerbare Rohstoffe sowie Energieressourcen zur Verfügung, erhalten die
Biodiversität und schützen sowohl Land- und Wasserressourcen. Jedoch sind diese durch
Waldbrand, Ausbreitung landwirtschaftlicher und urbane Fläche sowie verschiedener anderer
Eingriffe bedroht. Besonders in tropischen Gegenden hat der Verlust an Waldfläche
alarmierende Ausmaße erreicht. Die Begründung von tropischen Holzplantagen hat daher
gewisse Bedeutung erhalten, um die Auswirkungen des globalen Klimawandels durch
Kohlenstofffixierung abzuschwächen und der wachsenden Nachfrage nach Holz
nachzukommen. Aktuelle Forschungsergebnisse nehmen des Weiteren an, dass durch gut
angelegte Holzplantagen der Eintrag von Sedimenten, Nährstoffen und Mineralien in
Gewässer reduziert werden kann. Trotzdem gibt es zunehmend Bedenken ob diese
Holzplantagen nicht potentiell große Wassermengen verbrauchen könnten. Bis jetzt wurden
diese Aufforstungen in Form von Plantagen und zumeist mit einer sehr beschränkten Anzahl
an Baumarten durchgeführt. Solche traditionellen Holzplantagen erfüllen durchaus ihren
Zweck, jedoch haben sie nur einen geringen Beitrag zur Erhaltung der ökologischer
Schutzfunktion und der Biodiversität geleistet. Daher empfehlen neuere Studien
Wiederaufforstungen in Form von Mischbeständen mit einheimischen Arten zu gestalten,
jedoch ist über die Wassernutzung der einzelnen tropischen Baumarten bis jetzt wenig
bekannt. Die wenigen bereits bestehenden Experimente von Wiederaufforstungen mit
Mischbeständen zeigen, dass tropische Holzplantagen mit einer höheren Artenzahl eine
schnellere Biomasseproduktion als Reinbestände aufweisen. Der Einfluss von Misch-
beständen auf den Wasserkreislauf wurde jedoch noch nicht untersucht. Des Weiteren ist die
Artenwahl als Mechanismus zur Beeinflussung der Bestandestranspiration fragwürdig, da
Forschungsergebnisse aus Naturwäldern einen artenunabhängigen Zusammenhand zwischen
Wassernutzung und Baumgröße zeigen.

ZUSAMMENFASSUNG
X
Die Hauptziele dieser Studie waren daher
(1) den Einfluss von Arten und Baumstrukturparameter auf die saisonale Wassernutzung
von Bäumen in Reinbeständen zu bestimmen,
(2) die Auswirkung von Baumartendiversität (Reinbestand, 3- und 6-Artenmischbestand)
auf die Wassernutzung von Holzplantagen zu bestimmen.
(3) einen Vergleich der Wassernutzung von Bäumen in verschiedenen Landnutzungs-
systemen in verschiedenen tropischen Regionen aufzustellen.
Der Hauptteil dieser Dissertation wurde auf einer experimentell angelegten Holzplantage in
Panama durchgeführt. Die Kapitel 4 und 5 dieser Dissertation stellen die Ergebnisse der
Feldstudie aus Panama dar. Kapitel 6 zielt darauf ab, in wie weit die Wassernutzung von
Bäumen welche in verschieden Landnutzungssystemen kultiviert werden, verallgemeinert
werden kann.
Kapitel 4 behandelt die Wassernutzung von verschiedenen Baumarten in Reinbeständen unter
saisonalem Klima. Hierfür wurden über ein Jahr mit Xylemsaftflusssensoren (thermal
dissipation sensors) die Saftflussdichte in neun Baumarten, davon sechs in der Region
heimische und drei fremdländische Baumarten, auf zwei Holzplantage in der Nähe des
Dorfes Sardinilla in Panama gemessen. Von jeder Baumart wurde die Saftflussdichte von vier
Individuen mit sonnenexponierter Krone gemessen. Analog zu den Xylemsaftflussmessungen
wurden die photosyntheseaktive Strahlung, das Wasserdampfdruckdefizit der Luft und die
Bodenfeuchte gemessen sowie Änderungen in der Blattphänologie aufgenommen. Die
untersuchten Bäume wurden in phänologisch immergrüne, halbimmergrüne und
laubabwerfende Arten eingeteilt.
Kapitel 5 behandelt das Ergebnis aus dem Vergleich von Plantagen bestehend aus
einheimischen Baumarten, begründet in Reinbeständen und Mischbeständen. Die Hypothese
dieses Kapitels bestand darin, das Baumdiversität den Wasserverlust von Plantagen mit
Mischbeständen erhöht. Um diese Hypothese zu beweisen wurden der Xylemsaftfluss und die
Wassernutzung der Bäumen gemessen und die Biodiversitätseffekte auf die
Bestandestranspiration statistisch aufgegliedert, sowie der Einfluss der Komplementarität der
Arten auf die Wassernutzung der Bestände charakterisiert. Die Messungen wurden für ein
Jahr an 60 Probebäumen in einer sieben Jahre alten Plantage in Panama durchgeführt. Die

ZUSAMMENFASSUNG
XI
Bäume stammten aus Reinbeständen bzw. aus Mischbeständen von drei und sechs
Baumarten.
Kapitel 6 basierten auf Daten, die zum Teil von Kollegen der Arbeitsgruppe erhoben wurden.
Die erhobenen Daten der Reinbestände der Plantage in Panama wurden mit den Daten von
Aufforstungsmaßnahmen durch Mischbestände von den Philippinen und Daten aus einem
„agroforestry“ Bestand in Indonesien verglichen. Ein einfaches Saftflussmodell wurde
angewandt, das die wichtigsten Umweltvariablen, wie Strahlung und Wasserdampf-
druckdefizit, berücksichtigt. Die Modellparameter sowie Wassernutzungsraten wurden
analysiert, um die Einflüsse der Artzugehörigkeit und der Baumstrukturen inkl. Durchmesser
und oberirdischer Biomasse zu identifizieren. Dies resultierte in einer Synthese basierend auf
mehr als 100 Bäumen aus 17 Arten, die mit einheitlichen Methoden untersucht worden sind.
In dieser Studie wurde geprüft, ob es generelle Zusammenhänge über Baumarten, Kontinente
und Nutzungssysteme hinweg zwischen Baumstruktur und Wassernutzung gibt.
Die Hauptergebnisse waren folgende:
• Die Ergebnisse aus der Untersuchung der Reinbestände in Panama zeigen, dass unter
voller Belaubung die sich maximale Saftflussdicht unter den Arten um das zweifache
unterschied. Der Zeitpunkt und die Dauer der Entlaubung waren ebenfalls zwischen den
Arten sehr unterschiedlich. Der Zusammenhang zwischen Belaubungsprozent und
standardisierter maximaler Saftflussdichte kann jedoch als allgemein gültige Funktion
beschrieben werden. Im Durchschnitt unterschied sich auch die maximale Transpiration
auf der Basis der Kronenprojektionsfläche zwischen den Arten um das zweifache (1,2 -
2,8 mm pro Tag). Die Transpirationsraten waren von sechs der neun Arten zwischen der
Trocken und Regenzeit unterschiedlich. Drei Baumarten (Acacia mangium, Anacardium
excelsum und Gmelina arborea) zeigten eine um das 1,4- bis 2,1-fache erhöhte
Transpiration in der Trockenzeit im Vergleich zur Regenzeit. Im Gegensatz dazu
transpirierten Cedrela odorata, Hura crepitans und Tectona grandis nur das 0,4 bis 0,8 -
fache in der Trockenzeit gegebüber der Regenzeit. Die Ergebnisse legen nahe, dass die
Artenauswahl die Wassernutzung von Holzplantage unter wechselnden Jahreszeiten
wesentlichen beeinflussen kann.

ZUSAMMENFASSUNG
XII
Die Ergebnisse aus dem Vergleich der Reinbestände und Mischbestände zeigen, dass sich
der Jahresverlauf der Saftflussdichte sehr wenig zwischen den verschieden
Mischungsverhältnissen unterscheiden. Der jährliche Wasserverbrauch unterschied sich
signifikant zwischen den Arten. Die Maximale Wassernutzungsrate korrelierte mit dem
Stammdurchmesser der Bäume (r2 = 0,54, p < 0,001). Die meisten Bäume aus den
Mischbeständen mit drei Baumarten sowie fast alle Bäume in den Mischbeständen mit
sechs Baumarten hatten gegenüber den Reinbeständen dickere Durchmesser, was mit
einer höheren Wassernutzung einherging. Dementsprechend korrelierte die jährliche
Bestandestranspirationsrate mit der Bestandesgrundfläche. Die Mischbestände bestehend
aus sechs Baumarten hatten jedoch bezüglich auf die Bestandesgrundfläche eine
signifikant höhere Wassernutzung als die Reinbestände bzw. Mischbestände mit 3
Baumarten (51% und 56%). Die statistische Partitionierung der Biodiversitätseffekte
ergab einen positiven netto-Biodiversitätseffekt, hervorgerufen durch Komplementarität
der Arten. Es ist anzunehmen, dass die erhöhte Transpirationsrate der Mischkulturen von
der komplimentärern Nutzung des Lichts und erhöhter Kronenrauhigkeit der
Mischkulturen herrührt. Die Komplementarität der Arten kann daher zur Optimierung der
Wasserressourcen herangezogen werden.
• Die Synthese der Daten von mehr als 100 Baumen und 17 Arten zeigte eine Variation der
maximalen Saftflussdichte zwischen den Arten um den Faktor drei sowie signifikante
Unterschiede zwischen den Arten an den jeweiligen Standorten. Eine Abnahme der
Saftflussdichte mit zunehmendem Baumdurchmesser, wie sie in der Literatur postuliert
wird, konnte aus diesen Daten nicht bekräftigt werden. Trotz aller Unterschiede war auch
in diesem Datensatz die Zunahme der Wassernutzung mit ansteigendem Durchmesser
deutlich ersichtlich (R2adj = 0.65). Jedoch wurden bei gleichem Durchmesser erhebliche
Unterschiede in der Wassernutzung zwischen den Arten (um ein Faktor zwei) festgestellt,
unabhängig von den Standorten und Landnutzungssystemen.
Aus den Ergebnissen kann gefolgert werden, dass ein Zusammenhang zwischen Art und
arstspezifischer Wassernutzung besteht. Somit sind die richtige Baumartenwahl, unter
saisonalen Klimaten durch Nutzung der Baumphänology, sowie Baumartenkombination,
probate Mittel zur Regulierung von Wassernutzung und Zuwachsleistung in Waldsystemen
antropogenen Ursprungs.

CHAPTER 1 INTRODUCTION
1
CHAPTER 1 INTRODUCTION
1.1 Plantation forestry in the tropics
Forests serve many benefits worldwide such as providing renewable raw materials and
energy, maintaining biodiversity and protecting land and water resources. However, they are
threatened by fire, agricultural and urban expansion and various other disturbances.
Especially in the tropics, deforestation is continuing at an alarmingly high rate. Therefore, the
establishment of tree plantations on deforested tropical land and the afforestation of grassland
is of increasing importance to mitigate climate change by carbon sequestration and as a
contribution to the worldwide growing demand for wood. Current research suggest that well
design forest plantations can reduce the volume of sediment, nutrients and salt transported
into river systems (van Dijk and Keenan 2007). Nevertheless, there is a special concern about
a reduction in stream flow with plantation establishments (Jackson et al. 2005, Malmer et al.
2010). From a worldwide synthesis, it can be assumed that annual runoff can be reduced by
44% when grassland is afforested (Farley et al. 2005). However, when reviewing the existing
literature on the effects of forest plantation on the hydrological cycle, information on water
use rates under plantation conditions are only available for a very limited set of species and
conditions (Scott et al. 2004). So far, most of reforestation has been conducted with industrial
monocultures involving a small number of species. These species usually are from the genera
Fig. 1: In the last decade most of reforestation has been conducted with monocultures involving a limited number of species. In Panama, 65% of the new estab-lished plantations consist of teak (Tectona grandis) (ANAM 2008). (photo: www.fincaleola.com)
„Serit arbores, quae alteri saeclo prosint.“ Caecilius Statius (219-166 B.C.)
CHAPTER 1 INTRODUCTION
2
Pinus, Eucalyptus and Acacia. In Panama, where this study was mainly conducted 65% of the
new established plantations are consisting of teak (Tectona grandis) (ANAM 2008) (Figure
1). These traditional single species plantations have supplied some benefits but have made
only minor contributions to the restoration of ecological functions and biodiversity (Lamb et
al. 2005). According to that, recent approaches to reforestation in the tropics emphasize the
establishment of multispecies plantations consisting of native tree species (Montagnini and
Jordan 2005, Lamb et al. 2005, Wishnie et al. 2007). These few existing multispecies
reforestation experiments are pointing out that tropical plantations containing higher tree
diversity are likely to be more productive than monospecific stands (Forrester et al. 2004,
Bristow et al. 2006, Potvin et al. 2007, Piotto 2008), but possible changes in the hydrological
cycle have rarely been studied so far.
1.2 Water use by tropical trees
In the last two decades numerous studies on the dynamics of sap flux and transpiration in old-
growth tropical forests have been conducted (Granier et al. 1996, Goldstein et al. 1998,
Meinzer et al. 2001, Meinzer et al. 2004, O’Brien et al. 2004, Motzer et al. 2005).
Unfortunately, information of species growing under plantation conditions is still rare
(Dünisch and Morais 2002, Lüttge et al. 2003, Fetene and Beck 2004, Dierick and Hölscher
2009). Differences in tree species and tree physiology have been recognized as one of the
stand characteristics influencing the hydrological impacts of forest stands (van Dijk and
Keenan 2007, Bigelow 2001, Bruijnzeel 1997). Hence, the transpirational water use of
plantations may depend largely on the tree species planted (van Dijk and Keenan 2007). This
contrasts with studies showing that water use at tree or stand level is predominantly
influenced by tree size and stand structure in diverse old-growth forest (Meinzer et al. 2001,
2005, McJannet et al. 2007) and a single-species tree plantation (Cienciala et al. 2000). Trees
and other wooden plants such as lianas are expected to show similar patterns of maximum
sap flux densities and water use in relation to individual tree size, independent of species
when operating within fixed biophysical limitation (Meinzer et al. 2005, Andrade et al 2005)
(Figure 2). A comparative study on sap wood area and sap flux density in more than 20 tree
species in a Panamanian old-growth forest suggests that variation in diameter at breast height
accounted for 98% of the variation in sapwood area, and for 91% of the variation in total
daily sap flux density in the outermost two cm of sapwood if all species are pooled (Meinzer
et al. 2001).
CHAPTER 1 INTRODUCTION
3
Recent analyses including more angiosperm
species basically confirmed earlier results on
tree size dependence of water transport
(Meinzer et al. 2005). This suggests that
species-specific differences among
angiosperms can mainly be reduced to
differences in tree size and probably depth of
the sap conducting xylem, and further
differences are much less important. If these
rules commonly apply, the possibilities to
influence tree water use of plantations by
species selection would be limited.
However, maximum rates of sap flux and
water use are only achieved when trees are
fully foliated and under optimal
environmental conditions. Under seasonal
rainfall conditions with extended drought
periods, trees have to cope with water
shortage and they have developed strategies
to adjust at structural, physiological and
chemical levels (Baldocchi and Xu 2007).
Structural adjustment to dry periods includes
reduction of leaf area or a deep root system,
stomatal conductance may be under
physiological control, and roots may respond
by the chemical mechanism of osmotic
adjustment.
In the natural forest of Barro Colorado Island
(BCI), Panama, where seasonal rainfall
conditions prevail, tree species with a large
variation in timing and duration of leafless
Fig. 2: Does water use universally scale? a), b), Maximum sap flux density and c) maximum daily sap flow for lianas (open symbols) and branches and trees (closed symbols) as a function to diameter at breast height. Values for tree branches from 4 to 6 cm diameter (adapted from Andrade 2005).
CHAPTER 1 INTRODUCTION
4
periods co-occur (Meinzer et al. 1999), ranging from evergreen to semi-deciduous and to
deciduous. Even when fully foliated, species may differ in their response to decreasing soil
water availability during the dry season. In a temperate deciduous forest, among five studied
co-occurring species, one showed little response to decreasing soil moisture; three were
classified as being intermediate, and the species with the highest water use rate under moist
soil conditions showed the most pronounced reduction in sap flow when soil moisture
decreased (Hölscher et al. 2005). In an Australian Eucalyptus open-forest the evergreen tree
species also exerted higher transpiration rates during the dry season than during the wet
season, which was related to an increased evaporative demand and due to the use of
groundwater (O’Grady et al. 1999). On BCI, trees with the ability to take up soil water from
deeper layers during the dry season maintained or even increased rates of water use (Meinzer
et al. 1999). Conclusions drawn from natural forests with locally adapted tree species can
however not necessarily been transferred to man-made forests, and particularly monospecific
plantations are usually much simple structured. Given the varied responses of tree species
under seasonal rainfall distribution, a range of possibilities to influence water use by forest
plantations through species selection may exist.
1.3 Plant diversity and ecosystem processes
There is evidence that biodiversity has positive effects on most ecosystem functions and
biogeochemical cycles (Balvanera et al. 2006). In general the observed responses to higher
diversity can be separated into two main biodiversity effects (Loreau and Hector 2001). First,
in a complementarity effect that is collectively covering mechanisms like niche
differentiation and facilitation process between species. Theoretically, complementarity of
species occurs when resource supply allows species coexistence (Gross and Cardinale 2007).
Complementarity effects often result in increasing performance of mixed communities above
the expected performance of individuals (Loreau and Hector 2001). And secondly in a
selection effect if the performance of mixed communities is influenced by selective
processes, such as interspecific competition, which causes dominance of species with
particular traits (Loreau and Hector 2001). Selective process would be the driving forces in
communities where resource supply did not allow coexistence (Gross and Cardinale 2007).
Selection effects can vary from positive to negative depending on whether species with
lower- or higher-than-average performance dominate communities. For management

CHAPTER 1 INTRODUCTION
5
purposes complementarity of species is more desirable, thus a basic understanding of patterns
on species resource requirements that determine competitive ability will help to find
compatible species that have an improved performance in combination.
However, most research on biodiversity effect has been carried out in grasslands and only
recent studies are dealing with tree diversity (Scherer-Lorenzen et al. 2005). Similar
experiments with trees have almost been absent and only a few publications deal with tree
diversity effects on ecosystem processes (Orians et al. 1996, Schulze et al. 1996, Caspersen
and Pacala 2001, Scherer-Lorenzen et al. 2005a). Mixing tree species may result in higher
production than monocultures (Kelty 1992) and in enhanced nutrient uptake (Rothe and
Binkley 2001). Positive mixture effects have also been reported from reforestation
experiments in the tropics. There is some evidence that more species-rich communities are
better at conserving soil nutrients than monocultures (Fölster and Khanna 1997, Montagnini
2000). From studies done in native tree plantations in the dry and wet regions of Costa Rica it
was concluded that a mixed species plantation can be almost as productive if not equally
productive as a monoculture, and that in some cases they will be even more productive
(Menalled et al. 1998, Petit and Montagnini 2004, Piotto et al. 2004).
In general, tree diversity is affecting aboveground tree structural characteristics such as
crown structure, leaf morphology and phenology and the development of a stratified canopy
with increasing species diversity (Menalled et al. 1998, Bauhus et al. 2003, da Silva et al.
2009). Studies on grassland suggest that complementarity in soil water use was related to
improved three-dimensional root differentiation (Verheyen et al. 2008). Although the root
differentiation had a positive effect on the productivity of mixed communities, water
resources were depleted earlier in the in case of water limitation (van Peer et al. 2004,
Verheyen et al. 2008). On the other hand, selection effects are occurring if under severe
drought stress high evapotranpiration rates are found caused by drought-tolerant species
included in diverse communities (Verheyen et al. 2008).
1.4. Objectives of this study
The main part of this thesis was conducted in Central Panama, where the annual dry period
lasts three months. The study site is located in the watershed of the Panama Canal, a major
water way for global trade. With each ship crossing the canal, large quantities of freshwater

CHAPTER 1 INTRODUCTION
6
are released into the sea, and water availability for the canal but also for the capital Panama
City situated in the Canal Zone can seasonally be a problem. Degraded land is available for
reforestation and research to determine appropriate tree species and species mixtures is
currently underway (Wishnie et al. 2007, Potvin and Dutilleul 2009).
In view of the limited information on the relative importance of tree species and tree
structural aspects on tree water use in manmade forests (including agroforestry) the following
two objectives were set for this dissertation:
(1) to determine the influence of species and tree structural traits on seasonal water use
characteristics in trees planted monoculture, and
(2) to assess the effect of tree diversity (1-, 3-, and 6-species mixtures) on the water use
of every tree species, and
(3) to compare water use characteristics of trees growing in different land use systems
across the tropics.
Working towards the first objective, it will become clear if, aside from tree structure, also
species identity has a noticeable effect on water use characteristics in trees growing in
different land use systems. At the same time, data on water use characteristics of a number of
lesser known plantation species become available.

CHAPTER 2 STUDY SITES
7
CHAPTER 2 STUDY SITES
2.1 Overview
The main part of this dissertation was conducted on an experimentally designed tree
plantation in Panama, but it is also presenting data on tree water use gathered in different land
use systems situated across the tropics. Thus a variety of results are presented from
monoculture and mixed species plantations in Panama, mixed reforestation stands in the
Philippines and a cacao-Gliricidia agroforest stand in Indonesia (Figure 3). This chapter will
give a brief description of the different study sites and the species studied on the different
sites. Description about methods used will follow in chapter 3. More detailed information on
the study sites in Panama and on the other study sites are given in chapters 4 to 6.
Fig. 3: Data on water use characteristics was gathered in different land-use systems across the tropics. Trees growing in monocultures and of trees growing in mixed species plantations are coming from Panama. Mixed species reforestation stands were studied in the Philippines and a cacao-Gliricidia agroforest stand was studied in Central-Sulawesi (map source: www.eurosino-groep.com).

CHAPTER 2
2.2 Location of the study sites in Panama
The study site is located near the village of Sardinilla, Central Panama (9°19’ N,
which is approximately 50 km north of Panama City
sea level. The topography is slightly undulating. Mean
Colorado Island (BCI) is 2350
(January-March), 120-130 mm per month during the transition period in April and December,
and 250 mm per month during the rainy season (May to November). The mean annual
temperature of the region is 26.2
temperatures are typical for tropical regions and
33.2°C with an annual mean daily minima of 21.8
bedrock in Sardinilla is belonging to
and clay formed during the middle to upper Eocene
are classified as Typic and Aquic Tropudalfs
2004). The original vegetation around Sardinilla was probably a tropical moist forest similar
to that on BCI (Holdridge and Budowski
79°51’W). The forest at the site was clear
After two years in crops (probably corn, plantain and yucca) the site was changed into pasture
by seeding it with a C4 African grass,
Fig. 4: Map of the natural vegetation types in Panama
location of the study site in Panama is highlighted
8
in Panama
The study site is located near the village of Sardinilla, Central Panama (9°19’ N,
which is approximately 50 km north of Panama City (Figure 4). The elevation is 70 m
. The topography is slightly undulating. Mean annual precipitation at nearby
mm, with 25-50 mm per month during peak
130 mm per month during the transition period in April and December,
and 250 mm per month during the rainy season (May to November). The mean annual
°C (STRI 2009). The relatively constant daily and seasonal
are typical for tropical regions and annual mean daily maximum temperatures
annual mean daily minima of 21.8°C (Scherer Lorenzen et al. 2007)
belonging to the Gantuncillo formation and is characterized
and clay formed during the middle to upper Eocene (Potvin et al. 2004). The clay rich soils
are classified as Typic and Aquic Tropudalfs with a clay content of about 65%
nal vegetation around Sardinilla was probably a tropical moist forest similar
on BCI (Holdridge and Budowski 1956) (Figure 4), 40 km west of Sardinilla (9°09’N,
79°51’W). The forest at the site was clear-cut in 1952 and 1953 and then used for agriculture.
After two years in crops (probably corn, plantain and yucca) the site was changed into pasture
n grass, Hyparrhenia rufa (Abraham 2004).
: Map of the natural vegetation types in Panama (adapted from Holdridge and Budowski 1956
in Panama is highlighted.
STUDY SITES
The study site is located near the village of Sardinilla, Central Panama (9°19’ N, 79°38’ W),
. The elevation is 70 m above
annual precipitation at nearby Barro
g peak dry season
130 mm per month during the transition period in April and December,
and 250 mm per month during the rainy season (May to November). The mean annual
aily and seasonal
annual mean daily maximum temperatures is
et al. 2007). The
characterized by silt
he clay rich soils
content of about 65% (Potvin et al.
nal vegetation around Sardinilla was probably a tropical moist forest similar
, 40 km west of Sardinilla (9°09’N,
cut in 1952 and 1953 and then used for agriculture.
After two years in crops (probably corn, plantain and yucca) the site was changed into pasture
Holdridge and Budowski 1956). The

CHAPTER 2 STUDY SITES
9
The main study was carried out in two tree plantations approximately 500 m apart from each
other. One of the plantations is administrated by the Smithsonian Tropical Research Institute
(STRI, STRI-plantation) and the other by Autoridad Nacional del Ambiente (ANAM,
ANAM-plantation).
Fig. 5: Entrance to the STRI-plantation in Sardinilla, Panama.
2.3. Plantation administered by the Smithsonian Tropical Research Institute
The “Sardinilla experiment” was established as a permanent large-scale facility to study the
links between biodiversity and ecosystem functioning. In July 2001, the pasture site was
converted into an experimental tree plantation by Catherine Potvin. On an area of 9 ha, 24
plots were established using six native tree species. The plantation was set up with plots of 1,
3 and 6 species from different ecological groups (Figure 6): two light demanding, early
successional species Luehea seemannii (Triana & Planch, Tiliaceae) and Cordia alliodora
(Ruiz & Pavon, Boraginaceae), two lightintermediate species Anacardium excelsum (Bert. &
Balb. ex Kunth, Anacardiaceae) and Hura crepitans (Liné, Euphorbiaceae) and two shade
tolerant, late successional species Cedrela odorata (Liné, Meliaceae) and Tabebuia rosea
(Bertol., DC., Bignoniaceae) (Figure 8). The tree species were selected based on relative
growth rates (RGR), measured on Barro Colorado Island (respectively, 5.56% and 6.47%;

CHAPTER 2 STUDY SITES
10
0.73% and 1.65%; 1.75% and 2.03%). Anacardium excelsum, Hura crepitans, Luehea
seemannii and Tabebuia rosea can be classified as semi deciduous and Cedrela odorata,
Cordia alliodora as deciduous.
The following types of diversity plots were established:
(a) Twelve plots with monocultures planted with one of the six different tree species; each
species is replicated twice.
(b) Six plots of different three-species mixtures, each triplet containing one species, chosen
randomly, from each successional group.
(c) Six plots of six-species mixtures, obtained by adding three species, each from a different
successional group, to the existing triplets.
Fig. 6: Schematic diagram of the different mixture types of the biodiversity project in Sardinilla, Panama. From left to right (a) monoculture, (b) 3-species and (c) 6-species mixture plots.
Diversity treatments were randomly distributed across the site (Figure 7). Each of the plots
(n=24) has a size of 45 m by 45 m and is further divided into to four subplots of 22.5 by 22.5
m. Saplings were planted with 3 m spacing what is the commercially prevalent density in
Central America (225 trees per plot or 1111 trees per ha). Planting density was chosen to
allow comparisons with other plantations. In total 5400 trees were planted on this plantation.
Seeds were collected from forests within the Barro Colorado National Monument and
germinated on-site at Sardinilla. Saplings of approximately 50 cm height were planted. The
plantation is tended following standard forestry practices in Panama and Central America. In
the first couple of years the understory was cut three times a year, after canopy closure only
once a year. Survival of saplings was very high (> 90%), however, Cordia alliodora did not

CHAPTER 2 STUDY SITES
11
establish in monoculture. In the mixed plots, only some of the Cordia trees survived, but the
number of surviving trees were too small to find enough sample trees. Therefore, this species
was omitted from this study. The study was conducted between March 2007 and August
2008. Trees were about seven years old at the beginning of this study in March 2007.
Fig. 7: Map of the design of the field experiment in Sardinilla. Basis of map data is a courtesy of Sebastian Wolf, ETH Zurich.

CHAPTER 2 STUDY SITES
12
Fig. 8: Four of the five studied species growing on the STRI-plantation. From left to right Anacardium excelsum (Anacardiacea), Cedrela odorata (Meliacea), Luehea seemannii (Tiliaceae) and Tabebuia rosea (Bignoniaceae) (Vosso, 2003).
2.4 Plantation of the Autoridad Nacional del Ambiente
In the second plantation, three introduced species, namely Acacia mangium (Willd.,
Fabaceae), Gmelina arborea (Roxb., Lamiaceae), and Tectona grandis (Liné F., Lamiaceae)
and one native species, Terminalia amazonia (J. F. Gmel., Exell., Combretaceae) grown in
four monoculture plots were studied (Figure 9). Each of the plots was covering at least half a
hectare and trees were planted with 3 m spacing. Understory was cut or burned once a year
usually during the dry season. The plantation was reforested by the Autoridad Nacional del
Ambiente (ANAM, ANAM-plantation) and trees were between 10 and 15 years old at the
time of this study. The plantation was mainly used to collect seeds for other reforestation
projects.
Fig. 9: Three of the four trees species studied growing on the ANAM-plantation. From left to right Acacia mangium (Fabaceae), Gmelina arborea (Lamiaceae) both introduced to Panama and Terminalia amazonia (Combretaceae) native to Panama (Vosso, 2003).

CHAPTER 2 STUDY SITES
13
2.4 Study sites in the Philippines and in Indonesia
The study in the Philippines was conducted on Leyte Island located in the Eastern Visayas
from November 2005 to September 2006 and from November 2006 to September 2007
(fieldwork was performed by Diego Dierick). The climate in the region can be described as
humid tropical and annual temperature averages 27.5 °C and annual rainfall 2753 mm y-1
(PAGASA, 2007). Between March and May rainfall is lower than the monthly average over
the year, but rainfall is never beneath 100 mm per month. The original natural vegetation of
the site would be a species rich lowland dipterocarp forest (Langenberger, 2006). The study
was conducted in two mixed reforestations which were 12 years old at the time of study.
Water use was studied in ten tree species, eight of which were native to the region (Table 1).
The study in Indonesia, Central Sulawesi was conducted in a cacao-Gliricidia agroforest
between February 2007 and February 2008 (fieldwork was performed by Michael Köhler).
Measurements made at Gimpu (5 km away from the study site) indicated an average
temperature of 25.5 °C and annual rainfall of 2092 mm y-1 (H. Kreilein, unpublished data).
Rainfall shows a weak bimodal pattern with a rainy season (> 100 mm per month) from June
to July and again from October to December. The agroforest stand was 6 years old at the time
of the study and containing cacao trees growing under shade trees of the species Gliricidia
sepium. Sap flux density was measured in 18 cacao and 18 Gliricidia trees distributed over
the site.
Table 1: Studied tree species on the Philippines and in Indonesia
Scientific name Family Study Location
Native or Exotic
Shorea contorta S.Vidal Dipterocarpaceae Philippines N Parashorea malaanonan Merr. Dipterocarpaceae Philippines N Hopea malibato Foxw. Dipterocarpaceae Philippines N Hopea plagata S.Vidal Dipterocarpaceae Philippines N Swetenia macrophylla King Meliaceae Philippines E Vitex parviflora A.L. Juss Verbenaceae Philippines N Myrica javanica Blume. Myricaceae Philippines N Sandoricum koetjape (Burmf.) Merr. Meliaceae Philippines N Durio zibethinus Murray Bombacaceae Philippines N Gmelina arborea Roxb Verbenaceae Philippines E Theombroma cacao L. Malvaceae Indonesia E Gliricidia sepium (Jacq.) Kunth ex Steud. Fabaceae Indonesia E


CHAPTER 3 METHODOLOGY
15
CHAPTER 3 METHODOLOGY
3.1 Overview
This methodology chapter provides a description about the methods used to assess water use
characteristics of trees. Furthermore, methods to measure environmental, tree structural and
phonological parameters are described. The description will mainly refer to the setup and the
measurements on the main study site in Panama. In the Philippines and in Indonesia almost
identical set ups and standardised methods were used to measure tree water use
characteristics and environmental parameters. Similar methods were applied to analyse the
datasets. Detailed information on the methods used in Panama and on the other study sites is
given in chapters 4 to 6. Data collection in Panama was conducted by the author itself. The
data collection in the Philippines and in Indonesia was conducted by the ‘Tropical
Silviculture and Forest Ecology’ working group, namely Diego Dierick (Philippines) and
Michael Köhler (Indonesia). The last part of this chapter is dedicated to the description of a
method for additive portioning of biodiversity effects and a sap flux model which is used as a
diagnostic tool for species comparison.
Fig. 10: Eddy flux towers in the center of the plantation and on an adjacent pasture. Micrometeorological measurements were conducted by Sebastian Wolf (photos: Sebastian Wolf).
CHAPTER 3 METHODOLOGY
16
3.2 Micrometeorological variables and soil moisture
On all sites micrometeorological data were monitored to assess their effect on tree water use.
In Panama photosynthetic photon flux density, air temperature and relative humidity were
measured on top of a 15 m high Eddy Covariance flux tower (Figure 10 and 11) (6-8 m above
the canopy) located in the center of the STRI-plantation. Photosynthetic photon flux density
(PPFD, mol m-2 s-1) was measured with a PAR-LITE quantum sensor (Kipp & Zonen, Delft,
The Netherlands), air temperature (°C) and relative humidity (%) with a thermo-hygrometer
(Type MP100A, Rotronic AG, Ettlingen, Germany). Precipitation (mm) was measured with a
rain gauge (Type 10116, TOSS GmbH, Potsdam, Germany) at 1.5 m above ground in an
adjacent open pasture (Figure 10 and 11). Micrometeorological data were recorded every 10
seconds and average values were stored every 30 minutes. All micrometeorological data were
provided by the ETH Zurich (Wolf et al. 2008). Water vapour pressure deficit (VPD, kPa)
was calculated from air temperature and relative humidity.
Volumetric soil moisture content (m3 m-3) was measured using time domain reflectometry
sensors (TDR; CS616, Campbell Scientific Inc., Logan, UT, USA). To cover spatial
heterogeneity, sensors were installed at four locations within the STRI-plantation and at one
location within the ANAM-plantation, evenly spaced throughout the site (Figure 11). The
sensors were installed at 10 cm, 35 cm and 60 cm depth and hourly averages were stored
(CR800 and CR1000, Campbell Scientific Inc, Logan, UT, USA). The probes were calibrated
for the local soil following the procedure described in Veldkamp and O'Brien (2000).

CHAPTER 3 METHODOLOGY
17
Fig.11: Surrounding of the STRI-plantation. Eddy flux towers in the center of the plantation and on an adjacent pasture. Soil moisture measurements evenly placed throughout the plantation. Basis of map data is a courtesy of Sebastian Wolf, ETH Zurich.

CHAPTER 3 METHODOLOGY
18
3.3 Measuring sap flux, tree water use and transpiration
At all three locations, the same method was used to determine the water use characteristics.
On the STRI-plantation in Panama sample trees were chosen in five monoculture plots (one
plot for each of the five investigated species and four sample trees per plot); six different
3-species mixture plots (one sample tree of each species in every plot and once replicated
twice); and four replicates of the six-species mixture (one sample tree of each species in
every plot) (Figure 7). On the ANAM-plantation, for each of the four investigated species
four sample trees were chosen. Altogether 76 trees were investigated. On the Philippines, five
sample trees per species were selected and in Indonesia the studied species were represented
by 18 sample trees.
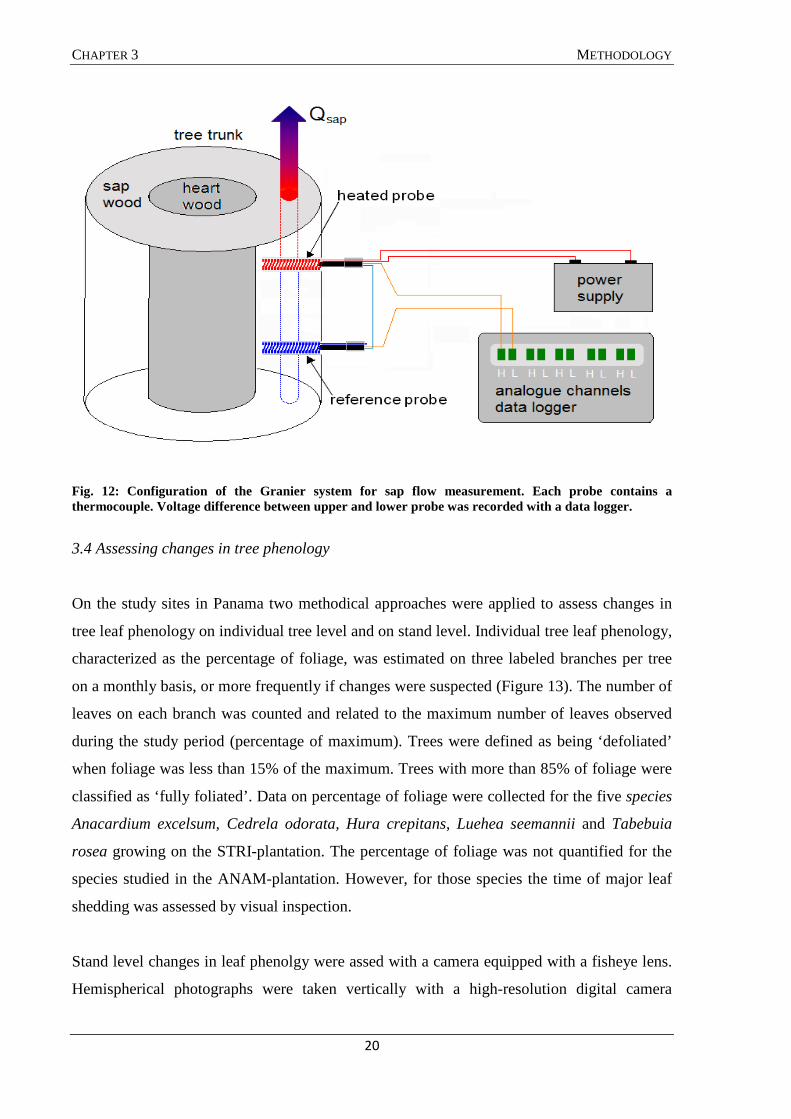
Sap flux density was measured with thermal dissipation sensors constructed after Granier
(1985) (Figure 12). The sensors consisting of two cylindrical probes were inserted radially (0-
20 mm below cambium) into the stem, with one probe placed approximately 10-15 cm
vertically above the other. Every tree was equipped with two Granier sensors, one on the
southern and one on the northern side of the trunk at 130 cm above the ground. The sensors
were protected from thermal influences and water intrusion by a styrofoam box, reflective
foil and a plastic cover. Probe output voltage was recorded every 30 seconds, and the average
value stored every 15 minutes (CR800 and CR1000 datalogger; AM16/32 and AM416
multiplexer, Campbell Scientific Inc., Logan, UT, USA). This voltage difference can be
related to the flux density in the sapwood around the sensor using the empirical formula
(Granier 1987):
where Js is the sap flux density in the sapwood (g cm-2 h-1); ∆V the measured voltage
difference (°C); and ∆Vref the reference voltage difference measured at time of zero flow
(°C).
Sapwood thickness was determined for two to three individuals of all species by dye injection
(Indigocarmin) into the trunk followed by taking wood cores approximately 3 cm above the
1.231
ref
s V
VV0.01193600J
∆∆−∆
××=

CHAPTER 3 METHODOLOGY
19
injection height after two hours. The length of the coloured core section was assumed to be
the conductive sapwood. For all species the sapwood thickness exceeded the lengths of the
Granier sensor.
In the last two weeks of the experiment radial profile measurements of Js were conducted. In
all sample trees Js was measured at 20 to 40 mm depth below the cambium. Sap flux density
was also determined at a third depth (40-60 mm) in trees with a diameter > 8 cm. Sensors for
measuring the radial profile were installed randomly on the east or west side of the trunk. Js
measured in the deeper sections was related to the concurrent measurements at reference
depth (0 to 20 mm below cambium) and expressed in percentages. At least one week of good
quality data were collected per depth. For each tree species an average normalised Js profile
(%) was constructed out of the four sample trees. Sap flux density data was extrapolated to
tree level water use by summing up the water flow in a given number of ring-shaped stem
cross sections corresponding with the respective installation depth, Js as measured at
reference depth and the normalised profile of Js for the species considered (Edwards et al.
1996):
10001
iisci
ni
ii
AJQwithQQ ==∑
=
=
Where Q (kg d-1) is the water use per tree; Qi is the water flow through ring i; Jsc i (g cm-2 d-1)
is the cumulative sap flux density; and Ai (cm2) is the ring-shaped area of sapwood that
extends between the tip and the end of each probe for a given depth interval i. Tree level
transpiration rates (mm d-1) were calculated by dividing daily water use rates (kg d-1) by the
unit crown projection area (m2). The plot level transpiration rate (Tplot mm d-1) expressed per
unit ground area was calculated using the relationship of tree water use and tree diameter
(Garcia Santos 2007). We derived daily relationships between measured tree water use rates
and tree diameters for each species separated into mixtures, inserted the known diameters of
all other individuals of the plot into the respective equations, summed the calculated water
use rates of all trees and divided the result by the area of the plot.
CHAPTER 3 METHODOLOGY
20
Fig. 12: Configuration of the Granier system for sap flow measurement. Each probe contains a thermocouple. Voltage difference between upper and lower probe was recorded with a data logger.
3.4 Assessing changes in tree phenology
On the study sites in Panama two methodical approaches were applied to assess changes in
tree leaf phenology on individual tree level and on stand level. Individual tree leaf phenology,
characterized as the percentage of foliage, was estimated on three labeled branches per tree
on a monthly basis, or more frequently if changes were suspected (Figure 13). The number of
leaves on each branch was counted and related to the maximum number of leaves observed
during the study period (percentage of maximum). Trees were defined as being ‘defoliated’
when foliage was less than 15% of the maximum. Trees with more than 85% of foliage were
classified as ‘fully foliated’. Data on percentage of foliage were collected for the five species
Anacardium excelsum, Cedrela odorata, Hura crepitans, Luehea seemannii and Tabebuia
rosea growing on the STRI-plantation. The percentage of foliage was not quantified for the
species studied in the ANAM-plantation. However, for those species the time of major leaf
shedding was assessed by visual inspection.
Stand level changes in leaf phenolgy were assed with a camera equipped with a fisheye lens.
Hemispherical photographs were taken vertically with a high-resolution digital camera

CHAPTER 3 METHODOLOGY
21
(Minolta Dimage Xt, Japan) (Figure 13). The camera was equipped a 185° fish-eye lens and
was placed in a leveling device (Regent Instruments, Canada), images were analyzed for the
forest cover and leaf area index with Gap Light Analyzer (GLA) Version 2.0 (Simon Fraser
University, Burnaby, British Columbia, Canada).
Fig. 13: On the left, labeling branches in the tree canopy in a Tabebuia rosea monoculture plot (photo: Rut Sanchez). On the right, hemispherical photograph of a Luehea seemannii monoculture plot.
3.5 Additive partitioning of biodiversity effects
Various studies have shown that that the observed responses of ecosystem processes to
changes in species or functional group diversity are due to a combination of different effects
(Tilman et al. 1997, Loreau 1998, 2000). These biodiversity effects can be classified into two
groups. The first group of effects is induced through niche differentiation or facilitation
between different species. These effects are usually resulting in a better performance of a
community of species compared to the performance of a single species without competition
by other species. The effects of niche differentiation and facilitation are hard to distinguish so
that these two effects are commonly grouped as “complementarity” (Loreau and Hector
2001).

CHAPTER 3 METHODOLOGY
22
The second group of biodiversity effects arises from selective processes in a community of
species. The selective processes can influence the performance of a species community
positively or negatively. Selective processes are driven through interspecific competition,
which cause dominance of species with particular traits (Loreau and Hector 2001).
In analogy with the work of Loreau and Hector (2001), we used a methodological approach
based on the Price equation of evolutionary genetics (Price 1995), to measure the net
biodiversity effect (∆Y) by additive partitioning a selection effect and a complementarity
effect. The net biodiversity effect has the dimension of yield, where yield stands for any
measurable variable in an ecosystem and is expected to be zero under the null hypothesis of
no biodiversity effects. These various effects can be related by additive partitioning as
follows:
∆� � �� � �� � � ��,��� � � ��,�����
� � ∆���� � ∆� � � ����∆�, ���
where N = number of species in the mixture,
M i = yield of species i in monoculture,
YO,i = observed yield of species i in mixture,
�� � ∑ ��,�� = total observed yield of the mixture,
�� � ∑ ��,�� = total expected yield of the mixture.
Accordingly, the complementary and selection effect are expressed as a function of the
deviation from the expected relative yield in the mixture (∆RY). The yield in mixture is
influenced by a complementarity effect ( ∆� �������� ), if it is on average higher than the
expected yield calculated out of the weighted average of the monoculture yield. The
covariance between the monoculture yield of species and their change in relative yield in the
mixture is explaining a selection effect ( ����∆�, ��). The additive partitioning method
was applied on the data set of the STRI-plantation in Panama. Biodiversity effects for the
three estimated variables stand transpiration, basal area and stand water use per basal area
were partitioned.

CHAPTER 3 METHODOLOGY
23
3.6 Sap flux density model
A modified and advanced Jarvis model (Jarvis 1976, modified by O'Brien et al. 2004,
advanced by Dierick and Hölscher 2009) was used to compare the large data sets of sap flux
data densities from the study sites in Panama, Indonesia and the Philippines. The advantage
of the sap flux model was to link measured sap flux density to key environmental variables
and to condense the large data sets into a limited number of interpretable model parameters,
which then could be used for further statistical analysis. The model is using global radiation
(Rg) and vapour pressure deficit VPD (kPa) as explanatory variables as they exert a strong
influence on sap flux density. Therefore, the model form used was:
Where Js model is the modelled sap flux density (g cm-2 h-1); a the maximum modelled sap flux
density (g cm-2 h-1); b a parameter describing the Rg response; c and d parameters describing
the VPD response (kPa). Parameter b (J m-2 s-1, or W m-2, note: 1 W = 1 J s-1) can be
interpreted as a measure of the light saturation level. At high Rg the function is
asymptotically approaching 1 when reaching the light saturation (Cienciala el. 2000, Granier
et al. 2000, Herbst et al. 1999). Under the assumption that VPD is non-limiting, sap flux
density reaches 90% of the maximum value a if Rg reaches a value equal to ten times b. The
response function to VPD is sigmoid shaped (O'Brien et al. 2004). The parameter c equals the
VPD at which sap flux rises to half the maximum value a (Rg non-limiting), whereas d is
related to the slope of the sigmoid. Parameters a, b, c and d were estimated using a Gauss
Newton algorithm.
d
VPDcg
g
Rb
RaJ −
+×
+×=
exp1
1models


CHAPTER 4 SEASONAL DYNAMICS OF TREE SAP FLUX AND WATER
USE IN NINE SPECIES IN PANAMANIAN FOREST PLANTA-
TIONS
KUNERT, N., SCHWENDENMANN , L. & HÖLSCHER, D., 2010. SEASONAL DYNAMICS OF TREE
SAP FLUX AND WATER USE IN NINE SPECIES IN PANAMANIAN FOREST PLANTATIONS. AGRICUL-
TURAL AND FOREST METEOROLOGY 150, 411-419.

CHAPTER 4 Agricultural and Forest Meteorology 150, 411-419.
27
Seasonal dynamics of tree sap flux and water use in nine species in Panamanian forest plantations
Norbert Kunert*, Luitgard Schwendenmann & Dirk Hölscher
Tropical Silviculture and Forest Ecology, Burckhardt Institute, Georg-August-Universität Göttingen, Büsgenweg 1, 37077 Göttingen, Germany
Abstract. We studied nine tree species with different leaf phenologies growing in monospecific plantations in the watershed of
the Panama Canal. The annual rainfall in the region averages 2,350 mm with a pronounced dry season from January to March.
The atmospheric evaporative demand is usually higher in the dry season compared to the wet season. Our objectives were to 1)
compare water use characteristics among the tree species, 2) analyze the response of sap flux density to changes in environmental
conditions, and 3) estimate seasonal and annual tree water use and transpiration rates. Tree sap flux was monitored using the heat
dissipation technique according to Granier. Under full foliage, maximum sap flux densities varied more than two-fold among
species. Time of leaf shedding and duration of leafless periods also varied strongly among species. However, the relationship
between percentage of foliage and normalized maximum sap flux densities can be described by a universal non species-specific
function. Species means of maximum transpiration rates on a basis of projected crown area varied more than two-fold (1.2 - 2.8
mm d-1). Transpiration rates between the dry and wet season differed for six of the nine species. Three species (Acacia mangium,
Anacardium excelsum, and Gmelina arborea) showed enhanced transpiration in the dry season with dry to wet season ratios between
1.4 and 2.1. In contrast, the dry to wet season ratio of Cedrela odorata, Hura crepitans, and Tectona grandis ranged from 0.4 to 0.8. The
results suggest that tree species choice can substantially influence water resource use in plantation forestry under such seasonal
climatic conditions.
Keywords: deciduous, evergreen, leaf phenology, semi-deciduous, soil water content, tree transpiration
1 Introduction
Reforestation of degraded land in the trop-ics is considered as a measure to mitigate climate change by carbon sequestration and to enhance wood supply. Tree plantations are often profit-able and under certain circumstances they may protect biological diversity (Lamb et al., 2005). One major concern, however, is a high water use rate of forest plantations (Jackson et al., 2005); especially where water resources are at
least seasonally scarce and demand for water for other purposes is high.
Appropriate tree species selection might re-
duce water use rates to acceptable levels (van Dijk and Keenan, 2007) but knowledge on spe-cies-specific water use characteristics of tropical trees is rather limited. Furthermore, the effec-tiveness of species selection is questionable as studies in diverse old-growth forests (Meinzer et al., 2004; McJannet et al., 2007) and a single-species tree plantation (Cienciala et al., 2000)
Kunert, N., Schwendenmann, L. & Hölscher, D., 2010. Seasonal dynamics of tree sap flux and water use in nine species
in Panamanian forest plantations. Agricultural and Forest Meteorology 150, 411-419.
* Corresponding author. Tel.: +49 551 399556; Fax: +49 551 394019; E-mail address: [email protected] (N. Kunert)

CHAPTER 4 Agricultural and Forest Meteorology 150, 411-419.
28
showed that tree size is the main factor influenc-ing tree water use. Hence, trees are expected to show similar patterns of maximum sap flux densities and water use in relation to individual tree size independent of species when operating within fixed biophysical limitation (Meinzer et al., 2005). If these rules commonly apply, the possibilities to influence tree water use of plan-tations by species selection would be limited.
However, maximum rates of sap flux and
water use are only achieved when trees are fully foliated and under optimal environmental condi-tions. Under seasonal rainfall conditions with extended drought periods trees have to cope with water shortage and they have developed strategies to adjust at structural, physiological and chemical levels (Baldocchi and Xu, 2007). Structural adjustment to dry periods includes reduction of leaf area or a deep root system, and stomatal conductance may be under physiologi-cal control. Chemical signal mechanisms involv-ing the synthesis of biochemical compounds, e.g. accumulation of absisic acid, are well known as an adaptation by the plants to soil drying (Davies et al., 2000).
In the natural forest of Barro Colorado Is-
land (BCI), Panama, where seasonal rainfall conditions prevail, tree species with a large variation in timing and duration of leafless peri-ods co-occur (Meinzer et al., 1999), ranging from evergreen to semi-deciduous and to de-ciduous. Even when fully foliated, species may differ in their response to decreasing soil water availability during the dry season. In a temperate deciduous forest, among five studied co-occurring species, one showed little response to decreasing soil moisture, three were classified as being intermediate, and the species with the highest water use rate under moist soil condi-tions showed the most pronounced reduction in sap flow when soil moisture decreased (Höl-scher et al., 2005). In Australian Eucalyptus open-forest the evergreen tree species also ex-erted higher transpiration rates during the dry season than during the wet season, which was related to an increased evaporative demand and due to the use of groundwater (O’Grady et al., 1999). On BCI, trees with the ability to take up soil water from deeper layers during the dry season maintained or even increased rates of water use (Meinzer et al., 1999).
Conclusions drawn from natural forests
with locally adapted tree species can however
not necessarily been transferred to man-made forests, and particularly monospecific planta-tions are usually much simple structured. Given the varied responses of tree species under sea-sonal rainfall distribution, a range of possibilities to influence water use by forest plantations through species selection may exist.
The present study was conducted in Central
Panama, where the annual dry period lasts three months. The study site is located in the water-shed of the Panama Canal, a major water way for global trade. With each ship crossing the canal, large quantities of freshwater are released into the sea, and water availability for the canal but also for the capital Panama City situated in the Canal Zone can seasonally be a problem. Degraded land is available for reforestation and research to determine appropriate tree species and species mixtures is currently underway (Wishnie et al., 2007; Potvin and Dutilleul, 2009). We studied the water use characteristics of nine tree species, six of which are native to the region and three are exotics widely planted throughout the tropics. These species range in leaf phenology from evergreen to semi-deciduous and to deciduous. Our objectives were to 1) compare water use characteristics among nine different tree species throughout a typical season, 2) analyze the response of sap flux density and leaf phenology to changes in environmental conditions, and 3) estimate sea-sonal and annual tree water use and transpira-tion rates. The results may contribute to better understanding of tree sap flux and water use rates also in relation to tree size under seasonally changing environmental conditions. It may also help stakeholders to make informed decisions on species selection especially in environments were the available water is limited.
2 Methods 2.1 Study sites
The study site was located near the village of Sardinilla, Central Panama (9°19’ N, 79°38’ W), approximately 50 km north of Panama City. The elevation of the site is on average 70 m, with a slightly undulating topography. Mean annual precipitation on nearby BCI is 2,350 mm, with 25-50 mm per month during the dry season (January-March), 120-130 mm per month during the transition period (April and December), and 250 mm per month during the wet season (May

CHAPTER 4 Agricultural and Forest Meteorology 150, 411-419.
29
to November) (STRI, 2009) (Figure 1). The mean annual temperature on BCI is 26.2 ºC (STRI, 2009). The bedrock in Sardinilla consists of limestone, and the clay rich soils are classified as Typic and Aquic Tropudalfs (Potvin et al., 2004). The original vegetation around Sardinilla was probably a tropical moist forest similar to that on BCI (Holdridge and Budowski, 1956). Most of the area was logged in 1952/1953, tem-porarily used for crop production (probably corn, plantain and yucca) and then converted into pasture with C4 grasses dominating (Potvin et al., 2004).
The study was carried out in two tree plan-
tations approximately 500 m apart. The first plantation was converted from a pasture into an experimental tree plantation consisting of vari-ous indigenous species between June and July 2001 and is administrated by the Smithsonian Tropical Research Institute (STRI, STRI-plantation). Five native tree species, Anacardium excelsum (Bertero & Balb. ex Kunth) Skeels, Cedrela odorata Linné, Hura crepitans Linné, Luehea seemannii Triana & Planch and Tabebuia rosea (Bertol.) A. DC. grown in five monoculture plots were investigated in this plantation. At the beginning of this study, the trees were approxi-mately six years old. In the second plantation, three introduced species, namely Acacia mangium Willd., Gmelina arborea Roxb., and Tectona grandis Linné F. and one native species, Terminalia ama-zonia (J.F. Gmel.) Exell. grown in four monocul-ture plots were studied. The second plantation was reforested by the Autoridad Nacional del Ambiente (ANAM, ANAM-plantation) and trees were between 10 and 15 years old at the time of this study. 2.2 Micrometeorological and soil moisture measurements
Photosynthetic photon flux density, air temperature and relative humidity were meas-ured on top of a 15 m high flux tower (6–8 m above the canopy) located in the center of the STRI-plantation. Photosynthetic photon flux density (PPFD, mol m-2 s-1) was measured with a PAR-LITE quantum sensor (Kipp & Zonen, Delft, The Netherlands), air temperature (°C) and relative humidity (%) with a thermo-hygrometer (Type MP100A, Rotronic AG, Et-tlingen, Germany). Precipitation (mm) was measured with a rain gauge (Type 10116, TOSS GmbH, Potsdam, Germany) at 1.5 m above
ground in an adjacent open pasture. Micromete-orological data were recorded every 10 seconds and average values were stored every 30 min-utes. All micrometeorological data were pro-vided by the ETH Zürich (Wolf et al., 2008). Water vapour pressure deficit (VPD, kPa) was calculated from air temperature and relative humidity.
Soil moisture was measured at four loca-
tions within the STRI-plantation and at one location within the ANAM-plantation using time domain reflectometry sensors (TDR; CS616, Campbell Scientific Inc., Logan, UT, USA). The sensors were installed at 10 cm, 35 cm and 60 cm depth and hourly averages were stored (CR800 and CR1000, Campbell Scientific Inc, Logan, UT, USA). The probes were cali-brated for the local soil following the procedure described in Veldkamp and O'Brien (2000). 2.3 Tree selection, tree structural parameters, and leaf phenology
In each monoculture plot four trees were
selected, resulting in a total of 36 trees. All se-lected trees reached the upper canopy level of a given monoculture stand. Tree diameter at breast height (DBH) was measured using a girth tape. Tree height was determined with a hyp-someter (Vertex III, Haglöf, Lensele, Sweden). The crown extension was measured in each of the eight cardinal directions and the crown pro-jection area was calculated as the sum of eight pitch circles as described by Röhle (1986). The main characteristics of the studied species are given in Table 1.
Fig. 1: Climate diagram for Barro Colorado Island (BCI) based on data obtained between 1977 and 2007 (STRI, 2009). BCI is located at a distance of approximately 30 km from Sardinilla.

CHAPTER 4 Agricultural and Forest Meteorology 150, 411-419.
30
Table 1: Leaf phenology of the studied species and structural characteristics of the studied trees (mean values ± SD, n = 4 trees per species)
1)Rocas (2003), 2)Fournier (2003a), 3)Meinzer et al. (1999), 4)Fournier (2003b), 5)Flores & Marín (2003),6)Kijkar (2003), 7) Francis (2003a), 8)Francis (2003b), 9)Flores (2003)
Leaf phenology, characterized as the per-
centage of foliage, was estimated on three la-belled branches per tree on a monthly basis, or more frequently if changes were suspected. The number of leaves on each branch was counted and related to the maximum number of leaves observed during the study period (percentage of maximum). Trees were defined as being ‘defoli-ated’ when foliage was less than 15% of the maximum. Trees with more than 85% of foliage were classified as ‘fully foliated’. Data on per-centage of foliage were collected for the five species Anacardium excelsum, Cedrela odorata, Hura crepitans, Luehea seemannii and Tabebuia rosea grow-ing on the STRI-plantation. The percentage of foliage was not quantified for the species studied in the ANAM-plantation. However, for those species the time of major leaf shedding was assessed by visual inspection.
2.4 Sap flux density, water use and tree transpiration
The thermal dissipation method according to Granier (1985) was used to measure sap flux density. The sensors consisting of two cylindri-cal probes were inserted radially (0-20 mm be-low cambium) into the stem, with one probe placed approximately 10-15 cm vertically above the other. Every tree was equipped with two Granier sensors, one on the southern and one on the northern side of the trunk at 130 cm (DBH) above the ground. Sensors were pro-tected from thermal influences and water intru-sion by a styrofoam box, reflective foil and a plastic cover. Probe output voltage was recorded every 30 seconds, and the average value stored every 15 minutes (CR800 and CR1000 datalog-ger; AM16/32 and AM416 multiplexer, Camp-
bell Scientific Inc., Logan, UT, USA). Sap flux density (Js in g cm-2 h-1) was calculated from differences in voltage using the calibration equa-tion determined by Granier (1987). Sap flux density in the STRI-plantation was measured from July 2007 to June 2008 (365 days) and in the ANAM-plantation from November 2007 to June 2008 (240 days). Sensors were changed when broken or latest after approximately six month to ensure that sap flux was measured in the outermost sap wood. The new sensors were installed at the same height but moved sideways from the first installation.
Sapwood thickness was determined for two
to three individuals of all species by dye (Indigo-carmin) injection into the trunk followed by taking wood cores approximately 3 cm above the injection height after two hours. The length of the coloured core section was assumed to be the conductive sapwood. For all species the sapwood thickness exceeded the lengths of the Granier sensor.
In the last two weeks of the experiment ra-
dial profile measurements of Js were conducted. In all sample trees Js was measured at 20 to 40 mm depth below the cambium. Sap flux density was also determined at a third depth (40-60 mm) in trees with a diameter > 8 cm. Sensors for measuring the radial profile were installed ran-domly on the east or west side of the trunk. Js measured in the deeper sections was related to the concurrent measurements at reference depth (0 to 20 mm below cambium) and expressed in percentages. At least one week of good quality

CHAPTER 4 Agricultural and Forest Meteorology 150, 411-419.
31
data were collected per depth. For each tree species an average normalised Js profile (%) was constructed out of the four sample trees. Sap flux density data was extrapolated to tree level water use by summing up the water flow in a given number of ring-shaped stem cross sec-tions corresponding with the respective installa-tion depth, Js as measured at reference depth and the normalised profile of Js for the species considered (Edwards et al., 1996):
10001
iisci
ni
ii
AJQwithQQ ==∑
=
=
Where Q (kg d-1) is the water use per tree; Qi
is the water flow through ring i; Jsc i (g cm-2 d-1) is the cumulative sap flux density; and Ai (cm2) is the ring-shaped area of sapwood that extends between the tip and the end of each probe for a given depth interval i. Tree level transpiration rates (mm d-1) were calculated by dividing daily water use rates (kg d-1) by the unit crown projec-tion area (m2).
2.5 Data analysis
Maximum sap flux density was determined as the maximum value that lasted for more than 45 min with less than 5% variation during clear days. Normalized maximum sap flux density was calculated by dividing daily maximum sap flux densities by the highest maximum daily sap flux density measured during the study period (per-centage of maximum) of a given species. Nor-malized daily Js was estimated by dividing daily integrated Js by the highest observed daily inte-grated Js during the study period (percentage of maximum).
Gap filling was performed for those species
and trees where only 240 days of measured data were available (ANAM plantation). Sap flux densities for missing days (Js estimated) were calculated based on the species-specific relation-ships between measured sap flux densities and PPFD for the wet season (r2 = 0.767 – 0.830, p < 0.05).
The dry season period was defined as the time when less than 100 mm rainfall was meas-ured for the duration of three months (Dietrich et al., 1996). The starting date was set three weeks after the last major rain event. According to this definition, the dry season lasted from January 15, 2008 to April 15, 2008 (90 days). The periods from July 1, 2007 to December 14,
2007 and June 1, 2008 to June 30, 2008 were defined as wet season (195 days). Annual means are based on 365 days including the transition periods between December 15, 2007 to January 14, 2008 and April 16, 2008 to May 30, 2008.
Linear regressions were used to establish the
relationship between the normalized maximum sap flux density and the proportion of foliage and between tree water use rates and environ-mental parameters. Differences in tree water use and tree transpiration rates between seasons were determined with a paired Student’s t-test. Tree water rates among species were compared using the analysis of covariance with DBH as a covariate (ANCOVA, followed by a post-hoc Tukey HSD test). Differences in tree transpira-tion rates among species were assessed applying the analysis of variance (ANOVA, followed by a post-hoc Tukey HSD test). All statistical analy-ses were performed using SPSS 13.0 software (SPSS Inc., Chicago, USA).
3 Results 3.1 Micrometeorological and soil moisture measurements
Precipitation during the 12-month study pe-riod totalled 2,260 mm. During the dry season (January 15, 2008 to April 15, 2008), only 33.4 mm rainfall was measured (Figure 2). Mean PPFD (47.1 ± 9.7 mol m-2 d-1) and VPD (0.81 ± 0.18 kPa) were substantially higher during the dry season compared to the wet season (29.9 ± 9.2 mol m-2 d-1 and 0.48 ± 0.27 kPa, respec-tively) (Figure 2). During the wet season, the average soil moisture at all depths was around 0.48 m3 m-3. A rapid decrease in soil moisture in 10 cm depth was observed during the transition period between wet and dry season, and lowest values of soil moisture (0.26 m3 m-3) were re-corded at the end of the dry season. Soil mois-ture at 35 cm and 60 cm depths showed a dif-ferent pattern with a gradual decline starting in mid January and reaching a low of 0.37 m3 m-3 (35 cm) and 0.40 m3 m-3 (60 cm), respectively, at the end of the dry season (Figure 2).

CHAPTER 4 Agricultural and Forest Meteorology 150, 411-419.
32
3.2 Leaf phenology
The two evergreen tree species, Acacia man-gium and Terminalia amazonia, were fully foliated throughout the study period. The deciduous tree species Cedrela odorata was defoliated for ap-proximately 4 months between the end of one wet season and the beginning of the next wet season (Figure 3). The semi-deciduous species were shedding their leaves at different times of the year (Figure 3) and the number of days of defoliation (over the whole observation period) ranged from 16 (Anacardium excelsum) to 86 days (Tabebuia rosea). Hura crepitans was defoliated during the dry season (February-March) but also
shed a high number of leaves towards the end of the wet season (November). At that time, Hura crepitans was infested by phytopathogens (various fungi e.g. Colletotrichum sp.; U. Braun, personal communication) which might have led to the observed leaf loss. Anacardium excelsum shed most of its leaves in December/January but green flushes appeared within a couple of days. Tectona grandis lost a high proportion of its leaves at the beginning of the dry season, whereas Lue-hea seemannii trees gradually lost their leaves throughout the dry season. Tabebuia rosea trees shed most of their leaves at the end of the dry season/onset of the wet season (Figure 3). In May, Luehea seemannii and Tectona grandis were
Fig. 2: a) Photosynthetic photon flux density (PPFD) and vapour pressure deficit (VPD), b) weekly rainfall, and c) soil mois-ture (mean of n = 4 sensors per soil depth ± SD) over the course of the study period, STRI-plantation. No VPD data were available for June 2008 due to sensor failure.

CHAPTER 4 Agricultural and Forest Meteorology 150, 411-419.
33
shedding the rest of their leaves within a couple of days and green flushes appeared simultane-ously. Gmelina arborea trees lost the majority of their leaves at the beginning of the wet season (May). At end of the wet season (November), Gmelina arborea trees were infested by leaf cutting ants (Atta sp., H. Herz, personal communica-tion), which may explain the additional peak in leaf loss.
3.3 Sap flux density, water use and tree transpiration
Mean maximum sap flux densities ranged from 20 g cm-2 h-1 (Cedrela odorata and Gmelina
arborea) to 46 g cm-2 h-1 (Anacardium excelsum) and significant differences among species were found (Table 2). For the five species for which the percentage of foliage was monitored (STRI-plantation), a species-specific linear relationship between maximum sap flux densities and per-centage of foliage was found (data not shown). After transforming maximum sap flux densities into normalized maximum sap flux densities and plotting these values against the percentage of foliage, the relationship between these variables remained significant and was independent of species (Figure 4). When trees had a leaf area of less than 15% the average normalized sap flux density was 20%.
Fig. 3: Mean maximum sap flux density (Jsmax) of the nine tree species (n = 4 trees per species) over the course of the study period.

CHAPTER 4 Agricultural and Forest Meteorology 150, 411-419.
34
Fig. 4: Relationship between normalized maximum sap flux density (normalized Jsmax) and percentage of foliage for five tree species (with 4 trees per species) combined (Anacardium excelsum, Cedrela odorata, Hura crepitans, Luehea seemannii and Tabebuia rosea).
The seasonal patterns of maximum sap flux density varied strongly among species (Figure 3). However, for all deciduous and semi-deciduous species, the lowest sap flux densities coincided with major leaf shedding events or periods when trees were defoliated (Figure 3).
Normalized daily Js, analyzed separately for
dry and wet season, revealed differences in slopes and intercepts when related to PPFD (Figure 5). Except for Gmelina arborea, all species seemed to reduce Js under high PPFD. In de-ciduous and semi-deciduous species, this pattern may be explained by the reduced number of leaves present during the dry season whereas in evergreen species lower soil water content dur-ing the drier season may play a role.
Mean annual water use rates ranged be-tween 5.1 kg d-1 (Gmelina arborea) and 21.9 kg d-1 (Terminalia amazonia) (Table 2). The water use rates of Anacardium excelsum, Gmelina arborea and Acacia mangium were significantly higher during the dry season compared to the wet season. In contrast, Cedrela odorata, Hura crepitans and Tectona grandis used significantly less water during the dry season than during the wet season (Table 2). Overall, maximum daily water use rates were positively correlated with tree diameter (Figure 6a). During the dry season the relationship be-tween maximum daily water use rates and tree diameter was remaining strong over all tree spe-cies, but water use rates in the lower tree diame-ter class (10 - 15 cm) was wider scattered (Figure 6b). Extracting the semi deciduous tree species in the dry season, the relation between maxi-mum daily water use rates and tree diameter was very weak (Figure 6c).
The highest and lowest maximum tree tran-
spiration rate was measured for Tectona grandis (2.8 mm d-1) and Tabebuia rosea (1.2 mm d-1), respectively (Table 2). Tree transpiration of Cedrela odorata, Anacardium excelsum, Gmelina arbo-rea, Hura crepitans, Tectona grandis and Acacia man-gium differed significantly between wet and dry season (Table 2). Similarly, Cedrela odorata, Hura crepitans and Tectona grandis had significantly lower tree transpiration rates during the dry season than during the wet season, whereas Anacardium excelsum, Gmelina arborea and Acacia mangium transpired more water during the dry season as compared to the wet season (Table 2).
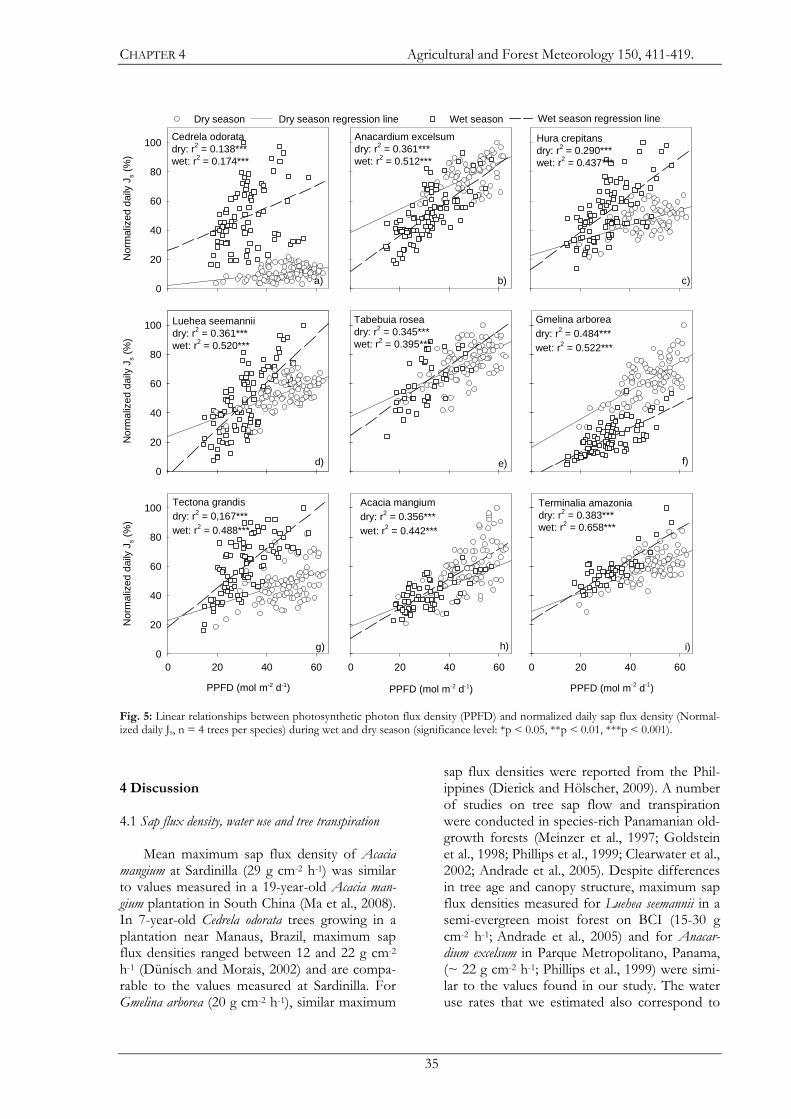
CHAPTER 4 Agricultural and Forest Meteorology 150, 411-419.
35
Nor
mal
ized
dai
ly J
s (%
)
Tabebuia roseadry: r2 = 0.345***wet: r2 = 0.395***
Cedrela odoratadry: r2 = 0.138***wet: r2 = 0.174***
PPFD (mol m-2 d-1)
Nor
mal
ized
dai
ly J
s (%
)
0
20
40
60
80
100
Terminalia amazoniadry: r2 = 0.383***wet: r2 = 0.658***
PPFD (mol m-2 d-1)
0 20 40 60
Tectona grandisdry: r2 = 0,167***wet: r2 = 0.488***
PPFD (mol m-2 d-1)
0 20 40 60
Nor
mal
ized
dai
ly J
s (%
)
0
20
40
60
80
100 Acacia mangiumdry: r2 = 0.356***wet: r2 = 0.442***
0 20 40 60
Luehea seemanniidry: r2 = 0.361***wet: r2 = 0.520***
Nor
mal
ized
dai
ly J
s (%
)
0
20
40
60
80
100
Anacardium excelsumdry: r2 = 0.361***wet: r2 = 0.512***
Gmelina arboreadry: r2 = 0.484***wet: r2 = 0.522***
Hura crepitansdry: r2 = 0.290***wet: r2 = 0.437***
a) b) c)
d) e) f)
g) h) i)
Dry season Dry season regression line Wet season Wet season regression line
Fig. 5: Linear relationships between photosynthetic photon flux density (PPFD) and normalized daily sap flux density (Normal-ized daily Js, n = 4 trees per species) during wet and dry season (significance level: *p < 0.05, **p < 0.01, ***p < 0.001).
4 Discussion 4.1 Sap flux density, water use and tree transpiration
Mean maximum sap flux density of Acacia mangium at Sardinilla (29 g cm-2 h-1) was similar to values measured in a 19-year-old Acacia man-gium plantation in South China (Ma et al., 2008). In 7-year-old Cedrela odorata trees growing in a plantation near Manaus, Brazil, maximum sap flux densities ranged between 12 and 22 g cm-2 h-1 (Dünisch and Morais, 2002) and are compa-rable to the values measured at Sardinilla. For Gmelina arborea (20 g cm-2 h-1), similar maximum
sap flux densities were reported from the Phil-ippines (Dierick and Hölscher, 2009). A number of studies on tree sap flow and transpiration were conducted in species-rich Panamanian old-growth forests (Meinzer et al., 1997; Goldstein et al., 1998; Phillips et al., 1999; Clearwater et al., 2002; Andrade et al., 2005). Despite differences in tree age and canopy structure, maximum sap flux densities measured for Luehea seemannii in a semi-evergreen moist forest on BCI (15-30 g cm-2 h-1; Andrade et al., 2005) and for Anacar-dium excelsum in Parque Metropolitano, Panama, (~ 22 g cm-2 h-1; Phillips et al., 1999) were simi-lar to the values found in our study. The water use rates that we estimated also correspond to

CHAPTER 4 Agricultural and Forest Meteorology 150, 411-419.
36
values recorded from other stands across the tropics. For example, water use rates of 7-year-old Cedrela odorata trees (mean DBH 7.6 cm) in a plantation near Manaus, Brazil, ranged between 1.6 kg d-1 and 11.6 kg d-1 depending on the sea-son (Dünisch and Morais, 2002). In contrast, the mean daily water use rates we found for Acacia mangium were lower than the values reported for a Acacia mangium plantation (80-90 kg d-1) of similar DBH in Sabah, Borneo (Cienciala et al., 2000).
Our data showed a strong positive correla-tion between maximum daily tree water use and tree diameter (Figure 6a-c). This relationship was also observed in different species-rich old-growth tropical forests (Meinzer et al., 2004; McJannet et al., 2007) and a single-species Acacia mangium plantation (Cienciala et al., 2000). De-spite the strong correlation between maximum water use and tree diameter in the individuals studied, considerable scatter was present around the fitted curve especially in the lower diameter range between 10 and 15 cm (Figure 6a-c). For example, annual maximum daily water use of Luehea seemannii (29.4 kg d-1) was twice the amount of water used by Cedrela odorata (14.2 kg d-1) trees of equal size and increased up to three times during the dry season. The variation in time of leaf shedding and duration of reduced leaf area among the semi deciduous tree species led to a weak diameter depending correlation particularly in this group in the dry season. Hence, differences in maximum water use rates among species might offer an opportunity to influence water use by species selection at the tree level. However, on the stand level, addi-tional parameters such as stem density and the contribution of understory transpiration have to be taken into account. 4.2 Leaf phenology in relation to water use characteristics
The present study reveals that the annual course of sap flux density, tree water use, and transpiration rates differs among species (Table 2). Overall, maximum sap flux densities were only measured during periods when trees were fully foliated (Figure 3). Substantial sap flux densities (on average 20% of the maximum sap flux density) were measured when on the three study branches foliage was less than 15% of the maximum (Figure 4). Normalized daily sap flux density for the deciduous species Cedrela odorata was less than 6% when trees shed all their leaves (Figure 5a). In a 7-year-old plantation near
Manaus, daily sap flux densities of leafless Cedrela odorata trees during the dry season were 14% of the maximum sap flux density measured during the wet season (Dünisch and Morais, 2002). It is thus suggested, that this species still transpires some water even without leaves. However, Cedrela odorata had significantly lower water use and transpiration rates during the dry season compared to the wet season. Shedding the leaves at the end of the wet season and re-maining almost leafless during the dry season could be an adjustment of Cedrela odorata to re-duced water availability. In a general assessment, Cedrela odrorata is characterized by a superficial root system (Cintron, 1990).
Fig. 6: a) Relationship between annual maximum daily tree water use and diameter at breast height (DBH). b) Rela-tionship between maximum daily tree water use during the dry season and DBH. c) Relationship between maximum daily tree water use during the dry season and DBH of the semi deciduous trees species.

CHAPTER 4 Agricultural and Forest Meteorology 150, 411-419.
37
Table 2:
Max
imum
sap
flu
x d
ensi
ties
(J s
max
), t
ree
wat
er u
se r
ates
an
d t
ree
tran
spir
atio
n r
ates
per
un
it c
row
n a
rea
for
dif
fere
nt
per
iod
s. D
ry s
easo
n, w
et s
easo
n a
nd
an
nual
val
ues
are
bas
ed
on
90,
195
an
d 3
65 d
ays,
res
pec
tivel
y (m
ean
± S
D, n
= 4
tre
es p
er s
pec
ies)
. No
te t
hat
sap
flu
x d
ensi
ties
fo
r tr
ees
in t
he
AN
AM
pla
nta
tio
n (
ind
icat
ed b
y $)
wer
e o
nly
mea
sure
d f
or
240
day
s.
Fo
r th
e m
issi
ng
day
s sa
p f
lux
den
siti
es (J s
est
imat
ed)
wer
e ca
lcula
ted b
ased
on
th
e sp
ecie
s-sp
ecif
ic r
elat
ion
ship
s b
etw
een
mea
sure
d s
ap f
lux
den
siti
es a
nd
PP
FD
fo
r th
e w
et s
easo
n. L
ow
er-
case
let
ters
in
dic
ate
sign
ific
ant
dif
fere
nce
s (p
< 0
.05)
fo
r a
give
n s
pec
ies
bet
wee
n d
ry a
nd
wet
sea
son
(p
aire
d S
tud
ent
t-te
st).
Cap
ital
let
ters
ind
icat
e si
gnif
ican
t d
iffe
ren
ces
amo
ng
spec
ies
in a
gi
ven
sea
son
(J s
max
an
d t
ree
tran
spir
atio
n: A
NO
VA
fo
llow
ed b
y a
po
st-h
oc
Tuke
y H
SD
tes
t; w
ater
use
rat
e: A
NC
OV
A w
ith
DB
H a
s co
vari
ate
follo
wed
by
a p
ost
-ho
c T
uke
y H
SD
tes
t, p
<
0.05
).

CHAPTER 4 Agricultural and Forest Meteorology 150, 411-419.
38
It may therefore react very sensitive to changes in precipitation and soil water content. The use of stable isotope techniques (δ2H) on the STRI plantation indicated that during the dry season, Cedrela odorata obtained most of its water from the upper soil layers (0-30 cm) (L. Schwenden-mann and R. Sánchez Bragado, unpublished data).
The semi-deciduous species Hura crepitans
and Tectona grandis also used less water during the dry season than during the wet season, which can be explained by the reduced number of leaves during the dry season. On the STRI plantation three-years-old Hura crepitans trees allocated a lower amount of biomass into ta-proots compared to Tabebuia rosea (Coll et al., 2008). In Venezuela it was observed older Hura crepitans tend to develop a superficial root system (Esteva, 1969 as cited in Francis, 1990). Tectona grandis also has a superficial root system (Schorcht, 2000).
In contrast, the semi-deciduous species Anacardium excelsum, which was almost fully foli-ated during the dry season, had significantly higher water use rates during the dry season (Table 2), possibly caused by a higher evapora-tive demand. Such an observation was also made in eucalypt open-forests of northern Aus-tralia, where during the dry season transpiration rates were higher than in the rainy season (O’Grady et al., 1999). This was explained with a higher atmospheric evaporative demand and due to the use of groundwater. Comparing the natural abundance of δ2H values during the dry season suggested that Anacardium excelsum used water from deeper soil layers than Cedrela odorata and Hura crepitans on the STRI plantation (L. Schwendenmann and R. Sánchez Bragado, un-published data). Access to deeper soil water may enable Anacardium excelsum to maintain its leaves during the dry season. On BCI, trees with the ability to take up soil water from deeper layers during the dry season maintained or even in-creased rates of water use (Jackson et al. 1995, Meinzer et al., 1999).
Gmelina arborea was attacked by leaf cutting
ants during November 2007 and all sample trees had a reduced leaf area during this time. The leaf herbivory was leading to considerable reduced sap flux densities through this reduction in leaf area, and the extrapolation from 240 days to the full year was performed with the wet season data of November 2007. Hence, it is likely that we
underestimated the wet season and annual water use and tree transpiration rates of Gmelina arbo-rea. Similar situation has also been reported from an Australian Eucalyptus woodland where sap flux density of trees without insect protection was half that of protected trees (Cunningham et al., 2009).
The evergreen species Acacia mangium had
higher water use and tree transpiration rates during the dry season, most likely due to an increased evaporative demand. In contrast, no seasonal difference in water use was found for Terminalia amazonia. We assume that soil water availability during the dry season may have be-come limiting for Terminalia amazonia. In Termi-nalia amazonia trees, the reduced water use under high PPFD in the dry season (Figure 5i) cannot be attributed to leaf loss but may indicate water shortage. A similar tendency is also present in Acacia mangium. Both species were growing in the ANAM-plantation where soil water content at all depths declined rapidly around two weeks earlier (end of December 2007) than in the STRI-plantation. A study of water use character-istics of co-existing species in a natural forest on BCI during the dry season found that trees able to develop a deep and extensive root system maintained or even increased rates of water use (Meinzer et al. 1999).
5 Conclusions
Overall, under optimal environmental con-ditions there was a strong correlation between tree size and tree water use. Still some tree spe-cies show the tendency to differ in daily tree water uses in the same diameter class, which was even more pronounced when dry season values were considered. Our study shows that species-specific differences in leaf phenology had a large influence on the annual course of tree water use and tree transpiration. Leaf phenological and water use differences may go along with differ-ent rooting patterns and soil water uptake depths. Our results imply that tree species selec-tion can be used to influence tree water use in forest plantations under seasonal rainfall condi-tions. The respective decision may depend on specific goals and constraints.

CHAPTER 4 Agricultural and Forest Meteorology 150, 411-419.
39
6. Acknowledgements
We thank Catherine Potvin for the oppor-tunity to conduct our study at the experimental tree plantation in Sardinilla and for her encour-agement. Special thanks to Sebastian Wolf for providing the micrometeorological data. We thank Klaus Winter for advice, Milton Garcia for technical support, Diego Dierick and two anonymous reviewers for valuable comments on earlier versions of the manuscript and Sol Heber for critical proof reading. We are grateful to ANAM for granting access to their plantations. This study benefited from the logistical support provided by STRI and ANAM and was funded by the German Research Foundation (Ho-2119/3-1).
7. References Andrade, J.L., Meinzer, F.C., Goldstein, G., Schnitzer, S.A., 2005.
Water uptake and transport in lianas and co-occurring trees of a seasonally dry tropical forest. Trees 19, 282-289.
Baldocchi, D.D., Xu, L., 2007. What limits evaporation from Mediterranean oak woodlands – The supply of moisture in the soil, physiological control by plants or the demand by atmosphere? Adv. Water Res. 30, 2113-2122.
Cienciala, E., Kucera, J., Malmer, A., 2000. Tree sap flow and stand transpiration of two Acacia mangium plantations in Sabah, Borneo. J. Hydrol. 236, 109-120.
Cintron, B. B., 1990. Cedrela odorata L. Cedro hembra, Spanish cedar. In: Burns, R. M., Honkala, B. H. (Eds.), Silvics of North America: 2. Hardwoods. Agricultural. Handbook. 654. U.S. Department of Agriculture, Forest Service, Washington, DC, pp. 250-257.
Clearwater, J.S.A., M., Meinzer, F.C., Goldstein, G., 2002. Heat dissipation sensors of variable length for measurement of sap flow in trees with deep sapwood. Tree Physiol. 22, 277-283.
Coll, L., Potvin, C., Messier, C., Delagrange, S., 2008. Root archi-tecture and allocation patterns of eight native tropical species with different successional status used in open-grown mixed plantations in Panama. Trees 22, 585-596.
Cunningham, S.A., Kimberi, R.P., Colloff, M.J., 2009. Whole-tree sap flow is substantially diminished by leaf herbi-vory. Oecologia 158, 633–640.
Davies, W.J., Bacon, M.A., Thomson, D.S., Sobeih, W., Gonzalez, R.L., 2000. Regulation of leaf and fruit growth in plants growing in drying soil: exploitation of the plant's own chemical signaling system and hydraulic architecture to increase the efficiency of water use in agriculture. Journal of Experimental Botany 51, 1617-1626.
Dierick, D., Hölscher, D., 2009. Species-specific tree water use characteristics in reforestation stands in the Philippines. Agric. For. Meteorol. 149, 1317-1326.
Dietrich, W.E., Windsor, M.D., Dunne, T., 1996. Geology, Cli-mate and Hydrology of Barro Colorado Island. In: Leigh, E.G. Jr., Rand, A.S., Windsor, D.M. (Eds.), The Ecology of a Tropical Forest. Seasonal Rhythms and Annual Changes. Second edition. Smithsonian Institution Press, Washington DC, pp. 21-46.
Dünisch, O., Morais, R.R., 2002. Regulation of xylem sap flow in an evergreen, a semi-deciduous, and a deciduous Meli-aceae species from the Amazon. Trees 16, 404-416.
Edwards, W.R.N., Becker, P., Cermák, J., 1996. A unified nomen-clature for sap flow measurements. Tree Physiol. 17, 65–67.
Flores, E.M., 2003. Terminalia amazonia (J.F. Gmel. ) Exell. In: Vozzo, J.A. (Ed.), Tropical Tree Seed Manual. Part II-
Species Descriptions. United States Department of Agriculture. Forest Service. Agriculture Handbook 721. Washington DC, pp. 748-751.
Flores, E.M., Marín, W.A., 2003. Tabebuia rosea (Bertol.) DC. In: Vozzo, J.A. (Ed.), Tropical Tree Seed Manual. Part II-Species Descriptions. United States Department of Agriculture. Forest Service. Agriculture Handbook 721. Washington DC, pp. 737-739.
Fournier, L.A., 2003a. Anacardium excelsum (Bertero & Balb. ex Kunth) Skeels. In: Vozzo, J.A. (Ed.), Tropical Tree Seed Manual. Part II-Species Descriptions. United States Department of Agriculture. Forest Service. Agriculture Handbook 721. Washington DC, pp. 294-296.
Fournier, L.A., 2003b. Luehea seemannii Triana & Planch. In: Vozzo, J.A. (Ed.), Tropical Tree Seed Manual. Part II-Species Descriptions. United States Department of Agriculture. Forest Service. Agriculture Handbook 721. Washington DC, pp. 553-554.
Francis, J.K., 1990. Hura crepitans L. Sandbox, molinillo, jabillo. Euphorbiaceae. Spurge family. USDA Forest Service, Southern Forest Experiment Station, Institute of Tropical Forestry. SO-ITF-SM; 38, New Orleans, LA, USA.
Francis, J.K., 2003a. Acacia mangium Willd. In: Vozzo, J.A. (Ed.), Tropical Tree Seed Manual. Part II-Species Descriptions. United States Department of Agriculture. Forest Service. Agriculture Handbook 721. Washington DC, pp. 256-258.
Francis, J.K., 2003b. Tectona grandis L.f. In: Vozzo, J.A. (Ed.), Tropical Tree Seed Manual. Part II-Species Descriptions. United States Department of Agriculture. Forest Service. Agriculture Handbook 721. Washington DC, pp. 745-747.
Goldstein, G., Andrade, J.L., Meinzer, F.C., Holbrook, N.M., Cavalier, J., Jackson, P., Celis, A., 1998. Stem water storage and diurnal patterns of water use in tropical forest canopy trees. Plant Cell Environ. 21, 397-406.
Granier, A., 1985. A new method of sap flow measurement in tree stems. Ann. For. Sci. 42, 193-200.
Granier, A., 1987. Evaluation of transpiration in a Douglas-fir stand by means of sap flow measurements. Tree Physiol. 3, 309-320.
Hölscher, D., Koch, O., Korn, S., Leuschner, Ch., 2005. Sap flux of five co-occurring tree species in a temperate broad-leaved forest during seasonal soil drought. Trees 19, 628-637.
Holdridge, L.R., Budowski, G., 1956. Report on an ecological survey of the Republic of Panama. The Caribbean Forester 17, 92-109.
Jackson, P.C., Cavelier, J., Goldstein, G., Meinzer, F.C., Holbrook, N.M., 1995. Partitioning of water resources among plants of a lowland tropical forest. Oecologia 101, 197-203.
Jackson, B.J., Jobbagy, E.G., Avissar, R., Roy, S.B., Barrett, D.J., Cook, C.W., Farley, K.A., le Maitre, D.C., McCarl, B.A., Murray, B.C., 2005. Trading water for carbon with bio-logical carbon sequestration. Science 310, 1944-1947.
Kijkar, S., 2003. Gmelina arborea Roxb. In: Vozzo, J.A. (Ed.), Tropical Tree Seed Manual. Part II-Species Descriptions. United States Department of Agriculture. Forest Service. Agriculture Handbook 721. Washington DC, pp. 476-478.
Lamb, D., Erskine, P.D., Parrotta, J.A., 2005. Restoration of degraded tropical forest landscapes. Science 310, 1628-1632.
Ma, L., Lu, P., Zhao, P., Roa, X.-Q., Cai, X.A., Zeng, X.P., 2008. Diurnal, daily seasonal and annual patterns of sap-flux-scaled transpiration from an Acacia mangium plantation in South China. Ann. For. Sci. 65, 402p1-402p9.
McJannet, D., Fitch, P., Disher, M., Wallace, J., 2007. Measure-ments of transpiration in four tropical rainforest types of north Queensland, Australia. Hydrol. Process. 21, 3549-3564.
Meinzer, F.C., James, S.A, Goldstein, G., 2004. Dynamics of transpiration, sap flow and use of stored water in tropical forest canopy trees. Tree Physiol. 24, 901-909.

CHAPTER 4 Agricultural and Forest Meteorology 150, 411-419.
40
Meinzer, F.C., Bond, B.J., Warren, J.M., Woodruff, D.R., 2005.
Does water transport scale universally with tree size? Funct. Ecol. 19, 558-565.
Meinzer, F.C., Andrade, J.L, Goldstein, G., Holbrook, N.M., Cavelier, J., Jackson, P., 1997. Control of transpiration from the upper canopy of a tropical forest, the role of stomatal, boundary layer and hydraulic architecture com-ponents. Plant, Cell and Environ. 20, 1242-1252.
Meinzer, F.C., Andrade, J.L., Goldstein, G., Holbrook, N.M., Cavelier, J., Wright, S.J., 1999. Partitioning of soil water among canopy trees in a seasonally dry tropical forest. Oecologia 21, 293-301.
O’Grady, A.P., Eamus, D., Hutley, L.B., 1999. Transpiration increases during dry season, patterns of tree water use in eucalypt open-forests of northern Australia. Tree Physiol. 19, 591-597.
Phillips, N., Oren, R., Zimmermann, R., Wright, S.J., 1999. Temporal patterns of water flux in trees and lianas in Panamanian moist forest. Trees 14, 116-123.
Potvin, C., Dutilleul, P., 2009. Neighborhood effects and size-symmetric competition in a tree plantation varying in di-versity. Ecology 90, 321–327.
Potvin, C., Whidden, E., Moore, T., 2004. A case study of carbon pools under three different land-uses in Panama. Clim. Change 67, 291-307.
Rocas, A.N., 2003. Cedrela odorata L. In: Vozzo, J.A. (Ed.), Tropical Tree Seed Manual. Part II-Species Descriptions. United States Department of Agriculture. Forest Service.
Agriculture Handbook 721. Washington DC, pp. 386-389.
Röhle, H., 1986. Vergleichende Untersuchungen zur Ermittlung der Genauigkeit bei der Ablotung von Kronenradien mit dem Dachlot und durch senkrechtes Anvisieren des Kronenrandes. Forstarchiv 57, 67–71.
Schorcht, M., 2000. Tectona grandis. In: Schütt, P., Schuck, H.J., Lang, U., Rollof,A. (Eds.), Enzykloppädie der Holzgewächse. Handbuch und Atlas der Dendrologie. Ecomed Verlagsgesellschaft, Landsberg..
STRI, 2009. Temperature and rainfall data Barro Colorado Island, Panama 1987-2007. Online. http://striweb.si.edu/esp/meta_data/details_bci_temp1.html
van Dijk, A.I.J.M., Keenan, R.J., 2007. Planted forests and water in perspective. For. Ecol. Manage. 251, 1-9.
Veldkamp, E., O'Brien, J.J., 2000. Calibration of a FDR sensor for humid tropical soils of volcanic origin. Soil Sci. Soc. Am. J. 64, 1549-1553.
Wishnie, M.H., Dent, D.H., Mariscal, E., Deago, J., Cedeño, N., Ibarra, D., Condit, R., Ashton, P.M.S., 2007. Initial performance and restoration potential of 24 tropical tree species planted across a precipitation gradient in the Re-public of Panama. For. Ecol. Manage. 243, 39-49.
Wolf, S., Eugster, W., Buchmann, N., 2008. Micrometeorological measurements of a plantation and adjacent pasture in Sardinilla, Panama. Field Measurements. ETH Zürich, Institute of Plant Sciences. Digital media.

CHAPTER 5
TREE DIVERSITY ENHANCES TREE TRANSPIRATION IN A
PANAMANIAN FOREST PLANTATION
KUNERT, N., SCHWENDENMANN, L., POTVIN, C. & HÖLSCHER, D.,
(ARTICLE IN PREPARATION).


CHAPTER 5
43
Tree diversity enhances tree transpiration a Panamanian forest plantation
Norbert Kunert1*, Luitgard Schwendenmann1,2, Cathrine Potvin3, Dirk Hölscher1
1Tropical Silviculture and Forest Ecology, Burckhardt Institute, Georg-August-Universität Göttingen, Büsgenweg 1, 37077 Göttingen, Germany 2Present address: School of Environment, The University of Auckland, Private Bag 92019, Auckland 1142, New Zea-land 3Department of Biology, McGill University, 1205 Dr Penfield, Montreal, Quebec, H3A 1B1, Canada
Abstract: 1. Tree plantations may play an important role in carbon sequestration and wood supply but there is concern about
high water use rates. Recent approaches to reforestation in the tropics emphasize the establishment of multispecies plantations. The effects of tree species mixture on water use have not yet been studied.
2. We hypothesized that tree species diversity enhances plot level transpiration rates. Tree sap flux and water use rates were assessed in monocultures (n = 5), 3-species mixtures (n = 6) and 6-species mixtures (n = 4). Therefore, sap flux densities were monitored with thermal dissipation probes in 60 trees for one year in a seven-year-old tree plantation in Panama.
3. The species-specific sap flux characteristics varied little among mixture types. The individual trees in the 3- and 6-species mixtures had attained bigger diameters than those growing in monocultures, which was associated with high-er tree water use rates. Accordingly, on the plot level the estimated annual transpiration by trees increased with in-creasing tree basal area, and was thus highest in mixed plots.
4. A statistical additive partitioning method suggests a positive net biodiversity effect on the water use characteristics of mixed species plots, which was induced by complementarity of species.
5. Furthermore, for the 6-species mixtures a disproportional increase in tree transpiration was observed. 6-species mix-tures had significantly higher transpiration rates per unit basal area than an average monocultures and 3-species mix-tures (51 and 56 %, respectively). We speculate that the over-proportional high transpiration rates in the 6-species plots might arise from enhanced vegetation-atmosphere energy exchange e.g. through higher canopy roughness and/or complementary use of soil water uptake.
6. Synthesis and applications: The study suggests that tree species diversity enhances transpiration by trees, and the increase is almost linear to tree basal area regarding monocultures and 3-species mixtures and disproportional for 6-species mixtures. For the design of tree plantations this may be taken into account in order to balance goals with respect to biodiversity, production and the use of water resources.
Keywords: monoculture, mixtures, native species, plot transpiration, complementarity of species, selection effect
Kunert, N., Schwendenmann, L., Potvin, C. & Hölscher, D. (in prep.)
*Corresponding author. Tel.: +49 551 399556; Fax: +49 551 394019; E-mail address: [email protected] (N. Kunert)

CHAPTER 5
44
1 Introduction
The establishment of tree plantations in the tropics is of increasing importance to mitigate climate change by carbon sequestration and as a contribution to the growing demand for wood. Current research suggest that well designed forest plantations can reduce the volume of sediment, nutrients and salt transported into river systems (van Dijk and Keenan 2007). Nev-ertheless, there is concern about reduction in stream flow with plantation establishment (Jack-son et al. 2005, Malmer et al. 2010), because trees may exhibit high water use rates. So far, most reforestations have been conducted with monocultures involving a limited number of species. Such traditional plantations have sup-plied some goods but have made only minor contributions to the restoration of ecological functions and biodiversity (Lamb et al. 2005). According to that, recent approaches to refores-tation in the tropics emphasize the establish-ment of multispecies plantations consisting of native tree species (Montagnini and Jordan 2005, Lamb et al. 2005, Wishnie et al. 2007). The few existing multispecies reforestation experiments indicate that tropical plantations containing higher tree diversity are likely to be more pro-ductive than monospecific stands (Forrester et al. 2004, Bristow et al. 2006, Potvin et al. 2007, Piotto 2008), but possible changes in the hydro-logical cycle have to our knowledge not been studied.
There is evidence that biodiversity has posi-
tive effects on most ecosystem functions (Bal-vanera et al. 2006). In general the observed res-ponses to higher diversity can be separated into two main biodiversity effects (Loreau and Hec-tor 2001). First, in a complementarity effect that is collectively covering mechanisms like niche differentiation and facilitation processes among species. Complementarity effects often result in increasing performance of mixed communities above the expected performance of individuals (Loreau and Hector 2001). And secondly in a selection effect if the performance of mixed communities is influenced by selective processes, such as interspecifc competition, which causes dominance of species with particu-lar traits (Loreau and Hector 2001). Selection effects can be positive or negative depending on whether species with lower- or higher-than-average performance dominate communities. Biodiversity effects are directly affecting intra-
specific tree morphology and physiology at the individual tree level (Richards et al. 2010). How-ever, changes in aboveground tree structural characteristics, such as canopy architecture, leaf traits (Menalled et al. 1998, Bauhus et al. 2004), and spatial, temporal or chemical stratification of roots (da Silva et al 2009) have been observed when tree species were planted in mixtures.
Tree water use and transpiration are directly
linked to tree structural characteristics such as tree size, canopy structure and diameter (Meinzer et al. 1999). We hypothesized that tree species diversity enhances tree water use and plot level transpiration rates. Tree sap flux and water use rates were assessed in monocultures, 3-species mixtures and 6-species mixtures and combined with a methodological approach to identify and separate biodiversity effects. We measured sap flux densities with thermal dissipa-tion probes in 60 trees for one year in a seven-year-old tree plantation in Panama. The results may contribute to a better understanding of biodiversity effects on the water use of tree plantations and may help to select appropriate tree species mixtures with respect to water re-source management. 2 Methods 2.1 Study area
The study was conducted in an experimental plantation close to the village of Sardinilla, Cen-tral Panama (9°19’ N, 79°38’ W), which is lo-cated 50 km north of Panama City. The eleva-tion of the site is approximately 70 m a.s.l. In the area, mean annual precipitation is about 2,350 mm (Figure 1), with a pronounced dry season from January to March. In the wet sea-son precipitation reaches on average 250 mm per month (May - November), 120-130 mm during the transit period (April and December) and 25-50 mm during the dry season. The mean annual temperature in the region is 26.2 ºC (Fig-ure 1). The clay rich soils in Sardinilla are classi-fied as Typic and Aquic Tropudalfs and are derived from limestone (Potvin et al. 2004). The original vegetation in the area around Sardinilla was probably a tropical moist forest similar to that on Barro Colorado Island (Holdridge and Budowski 1956). Most of the area was clear cut in the 1950th and then used for agriculture (probably corn, plantain and yucca). In the fol-lowing years the site was converted into pasture (Abraham 2004).

CHAPTER 5
45
2.2 Experimental design of the plantation The experimental tree plantation was set-up
with plots of varying tree species richness (mo-noculture, 3-species and 6-species mixtures) and species combinations (Figure 2). In total 24 plots were established between June and July 2001 (Figure 2). The following six native tree species were planted: Anacardium excelsum ((Bertero & Balb. ex Kunth) Skeels; Anacardi-aceae), Hura crepitans (Linné; Euphorbiaceae), Luehea seemannii (Triana & Planch, Tiliaceae) Tabebuia rosea ((Bertol.) DC, Bignoniaceae), Cor-dia alliodora ((Ruiz & Pavon) Oken, Boragina-ceae) and Cedrela odorata (Liné, Meliaceae). The first five species can be classified as semi de-ciduous tree species and the last as a deciduous tree species. Each plot is 45x45 m and further divided into four subplots of 22.5x22.5 m. Seedlings were planted with 3 m spacing which is the commercially prevalent planting density in Central America with 1,111 stems per ha. The plantation includes 12 monoculture plots with each of the species replicated two times, six different 3-species mixture plots with different species combination and six 6-species mixture plots containing all six species (Figure 2). Unfor-tunately, all Cordia allidora trees grown in mono-cultures and the majority of Cordia allidora in the 3-species and 6-species mixtures died within the first year. Consequently, we did not include Cordia alliodora in the study.
Fig. 1: Climate diagram for Barro Colorado Island (BCI) based on data obtained between 1977 and 2007 (STRI, 2009). BCI is located at a distance of approximately 30 km from Sardinilla.
2.3 Micrometeorological and soil moisture measurements
The micrometeorological data such as pho-tosynthetic photon flux density (PPFD, mol m-2
s-1), air temperature (C°), relative humidity (%) and precipitation (mm) were provided by the ETH Zürich (Wolf et al. 2007-2008). The pho-tosynthetic photon flux density was measured with a PAR-LITE quantum sensor (Kipp & Zonen, Delft, The Netherlands), air temperature and relative humidity with a thermo-hygrometer (Type MP100A, Rotronic AG, Ettlingen, Ger-many) installed 6–8 m above the canopy on top of a 15 m high flux tower in the center of the plantation. Precipitation (mm) was measured with a rain gauge (Type 10116, TOSS GmbH, Potsdam, Germany) at 1.5 m above ground in an adjacent open pasture (Wolf et al. 2007-2008). Data were recorded every 10 seconds and half hourly averages were stored. Soil moisture content was measured with time domain reflec-tometry sensors (TDR, CS610, Campbell Scien-tific, Inc., Logan, UT, USA) at four locations within the plantation and at three depths (10 cm, 35 cm and 60 cm). Soil moisture content was recorded hourly and stored on data loggers (CR800 and CR1000 datalogger, Campbell Sci-entific Inc., Logan, UT, USA). Soil moisture sensors were calibrated following the procedure of Veldkamp and O’Brien (2000).
2.4 Tree selection
Sap flux measurements were conducted in
the five remaining tree species (Anacardium excel-sum, Cedrela odorata, Hura crepitans, Luehea seeman-nii and Tabebuia rosea). Sample trees were chosen in five monoculture plots (one plot for each of the five investigated species and four sample trees per plot); six different 3-species mixture plots (one sample tree of each species in every plot and once replicated twice); and four repli-cates of the six-species mixture (one sample tree of each species in every plot) (Figure 2). Alto-gether 60 trees were investigated. All sample trees had all four direct neighboring trees and were situated within those subplots that had the lowest mortality rates.
2.5 Sap flux density, tree water use and plot level tran-spiration
Sap flux density was measured with thermal dissipation sensors constructed after Granier (1985). The sensors consisting of two cylindrical probes were inserted radially (0-20 mm below cambium) into the stem, with one probe placed approximately 10-15 cm vertically above the

CHAPTER 5
46
Fig. 2: Map of the design of the field experiment in Sardinilla. The basis of the map is a courtesy of Sebastian Wolf, ETH Zu-rich

CHAPTER 5
47
other. Every tree was equipped with two Granier sensors, one on the southern and one on the northern side of the trunk at 130 cm above the ground. The sensors were protected from thermal influences and water intrusion by a styrofoam box, reflective foil and a plastic cover. Probe output voltage was recorded every 30 seconds, and the average value stored every 15 minutes (CR800 and CR1000 datalogger; AM16/32 and AM416 multiplexer, Campbell Scientific Inc., Logan, UT, USA). Sap flux den-sity (Js in g cm-2 h-1) was calculated from differ-ences in voltage using the calibration equation determined by Granier (1987). Sap flux density was measured from July 2007 to June 2008 (365 days). Sap flux sensors were changed when ne-cessary to ensure that sap flux was measured in the outermost sap wood. The estimation of the water use (Q) for in-dividual trees was based upon the sapwood area of the tree and the radial changes in Js present in the sapwood. Species specific xylem depth was estimated by dye injection for three trees per species. Thereby, sap wood depth of all species was found to be greater than sensor length. Changes of sap flux density with increasing xylem depth were assessed in each tree in the last two week of the experiment. For each tree spe-cies an average normalised Js profile (%) was constructed out of the four sample trees. Sap flux density data was extrapolated to tree level water use Q [kg d-1] by summing up the water flow in a given number of ring-shaped stem cross sections corresponding with the respective installation depth, Js as measured at reference depth and the nor-malised profile of Js for the species consid-ered (Edwards et al. 1996). The plot level transpiration rate (Tplot mm d-1) expressed per unit ground area was calculated using the relationship of tree water use and tree di-ameter (Garcia Santos 2007). We derived daily relationships between measured tree water use rates and tree diameters for each species separated into mixtures, inserted the known diameters of all other individuals of a given plot into the respective equations, summed the calculated water use rates of all trees and divided the result by the area of the plot.
2.6 Tree and stand structure
Diameter at breast height (DBH) was meas-ured with a girth tape of all sample trees. Tree height and crown base height of each sample tree was determined with a hypsometer (Vertex III, Haglöf, Lensele, Sweden). The crown exten-sion in each of eight cardinal directions was measured by vertically looking up and crown area was calculated as sum of eight pitch circles as described by Röhle (1986). A complete inven-tory of all plots was conducted every year at the onset of the dry season and individual tree height and diameter at breast height were meas-ured as explained above. Hemispherical photo-graphs were taken vertically with a high-resolution digital camera (Minolta Dimage Xt, Japan). The camera was equipped a 185° fish-eye lens and was placed in a leveling device (Re-gent Instruments, Canada), Images were ana-lyzed for the forest cover and leaf area index with Gap Light Analyzer Version 2.0 (GLA, Simon Fraser University, Burnaby, British Co-lumbia, Canada).
2.7 Additive partitioning of biodiversity effects
Following the work of Loreau and Hector
(2001), we used a methodological approach based on the Price equation of evolutionary genetics (Price 1995), to measure the net biodi-versity effect (∆Y) by additive partitioning a selection effect and a complementarity effect. The net biodiversity effect has the dimension of yield, where yield stands for any measurable variable in an ecosystem and is expected to be zero under the null hypothesis of no biodiversity effects. These various effects can be related by additive partitioning as follows:
∆� � �� � �� � � ��,��� � � ��,�����
� � ∆���� � ∆� � � ����∆�, ���
where N = number of species in the mixture,
Mi = yield of species i in monoculture, YO,i = observed yield of species i in mix-ture, �� � ∑ ��,�� = total observed yield of the mixture,
�� � ∑ ��,�� = total expected yield of the mixture.

CHAPTER 5
48
Accordingly the complementary and selec-tion effect are expressed as a function of the deviation from the expected relative yield in the mixture (∆RY). The yield in mixture is influ-
enced by a complementarity effect ( ∆��������� ), if it is on average higher than the expected yield calculated out of the weighted average of the monoculture yield. The covariance between the monoculture yield of species and their change in relative yield in the mixture is explaining a selec-tion effect (N cov(∆RY,M)). The additive parti-tioning method was applied to the variables plot level transpiration, basal area and plot level wa-ter use per unit basal area.
2.8 Data analyses
Normalized daily Js was calculated by divid-ing daily integrated Js by the highest observed daily integrated Js during the study period (per-centage of maximum). Gap filling for missing days was done based on the species-specific relationships between measured sap flux densi-ties and PPFD (r2 = 0.671 – 0.830, p < 0.05). The dry season was defined following Dietrich et al. (1996) when less than 100 mm rainfall was measured for the duration of three months. We set the starting date of the dry season three weeks after the last major rain event, so that the dry season lasted from January 15, 2008 to April 15, 2008 (90 days). The time from July 1, 2007 to December 14, 2007 and June 1, 2008 to June 30, 2008 was characterized as wet season (195 days). All annual values and means are based on 365 days including the transition periods be-tween December 15, 2007 to January 14, 2008 and April 16, 2008 to May 30, 2008. Linear re-gressions were used to establish the relationship between the maximum tree water use and DBH. Tree water use rates among species and mixtures were compared using the analysis of covariance with DBH as a covariate (ANCOVA, followed by a post-hoc Tukey HSD test). Differences in plot level transpiration rates between seasons were determined with a paired Student’s t-test.
Statistical tests of the additive partitioning
were performed following Loreau and Hector (2001). Accordingly, we used the initial planted species richness (monoculture, 3-species and 6-species mixtures) in the analysis defining the treatments in the experimental design. Values of the selection, complementarity and net biodiver-sity effects were square root transformed pre-serving the original positive or negative sign. Grand mean values across all 3-species and 6-
species mixtures were tested versus zero with a one-sample t-test. Analysis of variance was used to test the relationship between over yield and species richness, partitioning the relationship into a linear regression, testing for positive or negative relationships. All statistical analyses were performed using SPSS 13.0 software (SPSS Inc., Chicago, USA). 3 Results 3.1 Micrometeorological and soil moisture measurements
Rainfall during the 12 months of the study
period equaled 2,260 mm. Monthly average rainfall was 254.8 ± 88.1 mm during the wet season (July 1, 2007 to December 14, 2007 and June 1, 2008 to June 30, 2008). Total rainfall during the dry season (January 15, 2008 to April 15, 2008) was only 33.4 mm in a three month period. Higher mean PPFD (47.1 ± 9.7 mol m-2
d-1) and VPD (0.81 ± 0.18 kPa) were recorded during the dry season than during the wet sea-son (29.9 ± 9.2 mol m-2 d-1 and 0.48 ± 0.27 kPa, respectively). Soil moisture in 10 cm depth de-creased rapidly during the wet to dry season transition period and reached its minimum (0.26 m3 m-3) at the end of the dry season. Soil mois-ture at 35 cm and 60 cm depths showed a dif-ferent pattern with a gradual decline starting in mid January and reaching a low of 0.37 m3 m-3 (35 cm) and 0.40 m3 m-3 (60 cm), respectively, at the end of the dry season. 3.2 Daily sap flux density and annual courses
Maximum sap flux densities (Jsmax) were be-
tween 20 g cm-2 h-1 (Cedrela odorata, monoculture) and 55 g cm-2 h-1 (Anacardium excelsum, 3-species mixture). Mean daily integrated sap flux densi-ties (Jsdaily) ranged from 68 g cm-2 d-1 (Cedrela odorata, 6-species mixture) to 202 g cm-2 d-1
(Anacardium excelsum, monoculture). For both measures significant differences among species were found (ANOVA; F4,15 < 9.372; p < 0.001). In contrast, we did not find statistically signifi-cant differences among diversity level of a given species (ANOVA; F2,9 > 2.402; p > 0.146), ex-cept for the daily sap flux densities of Hura crepi-tans (ANOVA; F2,9 = 7.088; p = 0.014) (Table 2). The seasonal patterns of normalized daily sap flux density varied strongly among species, but revealed similar patterns among the different mixtures for a given species (Figure 3). Mini-mum sap flux densities in the annual course coincided with major leaf shedding periods of a

CHAPTER 5
49
Tab
le 1
: Str
uct
ura
l ch
arac
teri
stic
s o
f th
e st
ud
y tr
ees
(mea
n v
alues
± S
D, n
= 4
tre
es p
er s
pec
ies)
an
d m
ean
tre
e dia
met
er a
nd
tre
e h
eigh
t o
f th
e sp
ecie
s o
n t
he
stud
y p
lots
.

CHAPTER 5
50
Table 2: Water use characteristics of the study trees (mean values ± SD, n = 4 trees per species). Mean daily intergrated sap flux densities (Jsdaily ), maximum sap flux densities (Jsmax) and tree water use rates (Q) for different periods. Dry season, wet season and annual values are based on 90, 195 and 365 days, re-spectively (mean ± SD, n = 4 trees per species). Capital letters indicate significant differences among species tested for each mixture and lower-case letters indicate significant differences within species (Jsdaily and Jsmax: ANOVA followed by a post-hoc Tukey HSD test; water use rate: ANCOVA with DBH as covariate followed by a post-hoc Tukey HSD test, p < 0.05).
given species and were independent from the type of mixture (Figure 3).
3.3 Tree water use rates in relation to tree characteristics
Maximum water use rates for individual
trees were highly variable ranging from 18.9 kg d-1 for Tabebeuia rosea of 8.3 cm DBH to 101.1 kg d-1 for a Hura crepitans with a DBH of 28.2 cm (Figure 4). The observed tree water use rates were strongly correlated with tree diameter. A linear regression of maximum water use of all 60 sample trees against DBH explained 54% of the observed variation (Figure 4). In trees with a diameter between 10 and 15 cm diameter for example, we see a fourfold difference in water use rates with a pronounced effect of species and independent from diversity level. Significant differences in mean tree water use among spe-cies were found in the monoculture, 3-species and 6-species mixtures (ANCOVA; F4,14 > 3.807; p < 0.027) (Table 2). 3.4 Plot level transpiration rates and stand characteris-tics Plot level transpiration averaged 1.3 ± 0.7 mm d-1 over the 12 month study period across all
plots and did not differ between dry and wet season. Absolute minimum and maximum val-ues were 0.3 and 2.6 mm d-1 (Cedrela odorata in monoculture and Luhea seemannii in monocul-ture, respectively). On average the daily plot level transpiration rate was 7% higher in the 3-species mixtures and 48% higher in the 6-species mixtures compared to monocultures. Plot level transpiration during wet season and during the wet to dry season transition period were significantly different in the 3 species and 6-species mixtures (paired Student’s t-test; p < 0.05), but not different among the monocultures (paired Student’s t-test; p > 0.05). The 3-species mixtures were showing an increased plot level transpiration during the transition period from wet to dry season, the 6-species mixtures a slightly reduced transpiration compared to the wet season. Annual transpiration ranged from 175 (Cedrela odorata) to 806 mm yr-1 (Luehea seemannii) in the monocultures, from 125 to 748 mm yr-1 in the 3-species mixture and from 693 to 761 mm yr-1 in the 6-species mixture (Table 3). There was a positive relation between plot level water use and basal area across all study plots (Figure 5).

CHAPTER 5
51
Nevertheless, the 6-species mixtures had signifi-cantly higher water use rates per unit basal area than the average monocultures and 3-species mixtures (annual 51 and 56 %, respectively). The relation between water use per basal area and PPFD was curvilinear and indicating an earlier light saturation of the monocultures and 3-species mixtures (Figure 6). 3.5 Partitioning of biodiversity effects
Overall, tree diversity enhanced plot level
transpiration, basal area and water use per basal area (Figure 7). The additive partitioning re-vealed that the effect of species number on the net effect was positive for all measured variables (p < 0.05). The grand means of the net effect were significantly different from zero across all
variables. The selection effect was generally small and only significant for the basal area. However, the selection effect was influenced by species richness for the plot level transpiration and water use per unit basal area, but the selec-tion effect was unaffected by species richness for the basal area. Plot level transpiration and basal area were affected by complementarity. Remarkably was the strong compelementarity effect on the water use per unit basal area and the huge increase of the water use rates in the 6-species mixtures compared to zero (Figure 8c). The complementarity effect was significantly influenced by species richness and exceeded the selection effect in all cases. The grand means of all variables were significant different from zero for the complementarity effect (Figure 8).
Fig. 3: Annual course of normalized daily sap flux density (species mean, n = 4) in the different species mixtures.

CHAPTER 5
52
Tab
le 3
: C
har
acte
rist
ics
of
stud
y p
lot
(mea
n v
alues
± S
D,
n =
225
tre
es p
er p
lot,
n =
5 m
easu
rem
ents
per
plo
t fo
r L
AI)
, b
asal
are
a an
d p
lot
level
tra
nsp
irat
ion
(T
plo
t)
rate
s fo
r d
iffe
ren
t p
erio
ds.
Wet
sea
son
, tr
ansi
t p
erio
d,
and
dry
sea
son
tra
nsp
irat
ion
rat
es a
re m
ean
val
ues
an
d b
ased
on
90,
30,
195
day
s, r
esp
ecti
vely
. V
alues
fo
r b
asal
area
an
d a
nn
ual
plo
t le
vel tr
ansp
irat
ion
(su
m o
f 36
5 d
ays)
are
ab
solu
te v
alues
.

CHAPTER 5
53
Fig. 4: Maximum daily water use for trees as a function to diameter at breast height (DBH).
4 Discussion 4.1 Sap flux density and tree water use
Measured daily and maximum sap flux den-sities are comparable with observations made for different tropical tree species, belonging to a large number of genera growing in natural forest and under plantation conditions (Phillip et al. 1999, Meinzer et al. 2004). As sap flux densities of the monocultures and mixture were compa-rable and no significant differences of the sap flux density among of the mixtures was meas-ured, we conclude that there are no measurable effects of species mixture on the sap flux densi-ties of trees. The water use rates that we esti-mated also correspond to values recorded from other stands across the tropics (Cienciala et al. 2000, Meinzer et al. 2004, McJannet et al. 2007). The variation in water use among species planted in monoculture and the opportunity to influence water use of plantations by species selection was discussed in Kunert et al. (2010). The commonly found water use and diameter relation (Meinzer et al. 2001, 2005, Andrade et al. 2005, McJannet et al. 2007) was present, but is not as strong as the reported relation in natu-ral forests. The considerable scatter of our data in the lower diameter range between 10 and 15 cm (Figure 4) might reflect the different envi-ronmental conditions in natural forests and young plantations (Dierick and Hölscher 2009). In contrast to stratified natural forest, trees in young plantations are well exposed to sunlight. Under such conditions species specific traits to cope with light intensity, temperature, humidity, and wind speed may play a more important role.
Results from monospecific and mixed Eucalyptus grandis and Acacia mangium stands in Brazil indi-cate that mixed species stands develop a more stratified canopy than even aged monocultures (Laclau et al. 2008). 4.2 Basal area and transpiration in relation to tree diversity
We found a positive net effect of tree diver-
sity on the basal area, plot transpiration and water use per unit basal area. On average 30-58% higher tree basal area was found in the mixture plots after five years of growth (Potvin and Gotelli 2008). This difference was even more pronounced in the seven-year-old stands. In the five-year-old stands the higher basal area was explained by a significant positive comple-mentary effect and a significant negative selec-tion effect (Healy et al. 2008). These opposing biodiversity effects resulted in a non-significant net biodiversity effect (Healy et al. 2008). We found a significant positive complementarity effect and a negative selection effect on the basal area, but our results suggest a significant positive net biodiversity effect. The negative selection effect might be a result from the high mortality of Cordia alliodora as a poor performing species. Nevertheless in the 3-species mixtures (T1, T5, T6) where only two species were re-maining, basal area of the remaining trees was equal to an average monoculture (Figure 7 b). Long term experiments demonstrate that com-plementarity of species and net biodiversity effects are increasing over time and selection effects are decreasing (Fargione et al. 2007).
Fig. 5: Linear relationship between mean daily a annual plot level transpiration (mm d-1) and basal area (m² ha-1) of the investigated plots.

CHAPTER 5
54
Our results support this observation as the complementarity effect in the seven-year-old plantation was higher compared to the five-year-old plantation (Healy et al. 2008).
Fig. 6: Daily average water use per basal area during the wet season (monoculture: n = 5 plots, 3-Species: n = 6 plots, 6-species: n = 4 plots) as functions of daily PPFD.
Furthermore, our results show an on aver-age higher plot level transpiration rate in the mixed species plots. Results obtained from grasslands suggest that possible explanation for higher transpiration are higher biomass of the mixed species plots, a greater representation of species that intrinsically use more water, and/or a positive influence of species diversity on transpiration (van Peer et al. 2004). In our study higher plot level transpiration was usually ac-companied by higher basal area (Figure 5). Stu-dies conducted in species rich grassland com-munities indicate that complementarity and/or facilitation of species accounted for enhanced transpiration (Caldeira et al. 2001, van Peer et al 2004, de Boeck et al. 2006). Remarkable is the on average over 50% higher water use rate per unit basal area of the 6-species mixtures com-pared to the monocultures and 3-species mix-tures. This enhanced water use cannot be ex-plained by either a higher basal area in these plots or the dominance of a single tree species with high water use rates.
4.3 The importance of complementarity of species
Our results suggest that the positive rela-tionship between tree diversity and plot level transpiration and water use per unit basal area was explained largely by a significant positive complementarity effect (Figure 8). The higher transpiration of the mixtures in comparison to
the monocultures might indicate a better use of limited resources and a better tree growth. Dif-ferent resources might be limited during the wet season and during the dry season. However, the site is situated in an environment where tree growth is not water limited during the wet sea-son, so that we assume that radiation and water vapor pressure deficit may limit tree transpira-tion. Potvin and Gotelli (2008) related the en-hanced growth of the mixed species plots to stronger competition for light in monocultures. Recent studies show that the canopy structure of tree mixtures has a better three-dimensional canopy space filling and a more complete access to the radiation (da Silva et al. 2009). Comple-mentary use of radiation was also made respon-sible for enhanced growth in mixed species grassland (Yachi and Loreau 2007). Further-more, Baldocchi (2005) mentions higher stand transpiration rates of mixed stands due to a higher canopy roughness. The higher heteroge-neity in tree heights and also mean tree height (Kelliher et al. 1993) of the mixed stands may be an indicator of canopy roughness (Table 1). Therefore the aerodynamic roughness length of the tree canopy of the mixed stands can be ex-pected to be larger which enhances the degree of turbulent energy exchange with the atmos-phere, enabling higher transpiration rates. This might even explain the oversized water use rates per unit basal area of the 6-species plots as they are representing the plots with the highest in canopy height.
In the transition periods and in the dry sea-
son trees are receiving a higher amount of radia-tion than in the wet season due to cloudless sky (Kunert et al. 2010). Radiation in the dry season is exceeding wet season radiation on average about 36%. Hence, trees should be able to use the increased amount of radiation for photosyn-thesis and should show higher transpiration rates if they are not limited by other resources such as water. Such higher tree transpiration rates during dry season were reported for a eu-calypt open-forest in Northern Australia (O’Grady et al. 1999) and dry season non-deciduous monocultures in Panama (Kunert et al. 2010). Accordingly some trees have the abili-ty to use the increased availability of radiation, but significant increased transpiration rates dur-ing the transition period from wet to dry season and during the dry season were present only in the 3-species mixtures. Significant lower transpi-ration rates could be observed in the 6-species mixtures during the transition period from the

CHAPTER 5
55
Fig
. 7: O
bse
rved
a)
ann
ual
plo
t le
vel tr
ansp
irat
ion
, b)
bas
al a
rea
per
ha
and
c)
ann
ual
plo
t tr
ee w
ater
use
rat
e p
er u
nit
bas
al a
rea
in t
he
dif
fere
nt
stud
y p
lots
.
wet to the dry season (data not shown). Never-theless, the 6-species mixtures could maintain transpiration on a relatively constant high level compared to the other mixture types throughout the entire dry season. The wide range of species and species phenology in the 6-species mixtures might have balanced the reduction of transpira-tion through shedding leaves of deciduous spe-cies and the enhancement of transpiration of non deciduous species through the higher amount of radiation. Hence, an improved com-plementary soil water use can be assumed in the 3- and 6-species mixtures during the dry season, despite the slightly lower transpiration rates of the 6-species mixtures. 4.4 Management considerations
Various reasons exist for enforcing refores-tation in the tropics, but a major concern is that tree planting results in a strongly reduced streamflow after reforesting deforested land (Calder et al. 2004, Farley et al. 2005, Jackson et al. 2005, Kaimowitz 2005). Hence reforestation can be critical in regions where water resources are at least seasonally scarce and demand for water for other purposes is high. Well-designed forest plantations are commonly said to posi-tively influence the hydrological cycle by high infiltration and groundwater recharge during the wet season with a gradual release of water dur-ing the dry season (Malmer et al. 2010). The functioning of these artificial forests will largely depend on the tree species planted and species selection offers the opportunity to control tree water use in forest stands (Dierick and Hölscher 2009). The specific regional management goals will define silvicultural practices to promote best possible tree growth, land cover protection or water resource restoration. Mixed species plan-tations are known to attain a higher basal area in a shorter time period. Accordingly, mixed spe-cies plantations have a higher water use than monocultures, because of higher tree sizes of the individual trees. Our study suggest that with increasing species richness mixed species planta-tions have an enhanced water use rates per unit basal area compared to monocultures mostly due to increasing heterogeneity of the stand structure. This enhanced water use might not be problematic in non seasonal climates or during the wet season when the amount of rainfall is higher than the evaporative demand (Dietrich et al. 1996). Under seasonal climates, we suggest the establishment of suitable species mixtures

CHAPTER 5
56
containing a low number of species, to achieve high growth rates through complementarity of species and to keep water use rates on an ac-ceptable level compared to an average monocul-ture through creating more homogenous stand structures. 5. Acknowledgements
We thank Sebastian Wolf for providing the micrometeorological data and Jose Monteza for
taking good care of the plantation and for col-lecting data on tree growth. We thank Klaus Winter for advice and Milton Garcia for techni-cal support. This study benefited from the logis-tical support provided by STRI and ANAM and was funded by the German Research Founda-tion (Ho-2119/3) and an NSERC operating grant to CP.
Fig
. 8:
Ad
did
ativ
e p
arti
tio
nin
g o
f b
iod
iver
sity
eff
ects
(af
ter
Lo
reau
an
d H
ecto
r, 2
001)
a,b
,c)
Net
bio
div
ersi
ty e
ffec
t; d
,e,f
) se
lect
ion
eff
ect;
an
d g
,h,i)
co
mp
lem
enta
rity
eff
ect
on
an
nual
plo
t le
vel tr
ansp
irat
ion
, bas
al a
rea
and
wat
er u
se r
ate
per
un
it b
asal
are
a, r
esp
ecti
vely
. Val
ues
of
the
bio
div
ersi
ty e
ffec
t, s
elec
tio
n a
nd
co
mp
lem
enta
rity
eff
ect
are
squar
e-ro
ot
tran
sfo
rmed
to
mee
t th
e as
sum
pti
on
s o
f an
alys
es b
ut
pre
serv
e th
e o
rigi
nal
po
siti
ve
and
neg
ativ
e si
gns
(Sin
gle
aste
risk
, p <
0.0
5; d
oub
le a
ster
isk,
p <
0.0
1; t
rip
le a
ster
isk,
p <
0.0
01; n
s: n
on
-sig
nif
ican
t).

CHAPTER 5
57
7. References Andrade, J.L., Meinzer, F.C., Goldstein, G., Schnitzer, S.A., 2005.
Water uptake and transport in lianas and co-occurring trees of a seasonally dry tropical forest. Trees 19, 282-289.
Baldocchi, D.D., Xu, L., 2007. What limits evaporation from Mediterranean oak woodlands – The supply of moisture in the soil, physiological control by plants or the demand by atmosphere? Adv. Water Res. 30, 2113-2122.
Cienciala, E., Kucera, J., Malmer, A., 2000. Tree sap flow and stand transpiration of two Acacia mangium plantations in Sabah, Borneo. J. Hydrol. 236, 109-120.
Cintron, B. B., 1990. Cedrela odorata L. Cedro hembra, Spanish cedar. In: Burns, R. M., Honkala, B. H. (Eds.), Silvics of North America: 2. Hardwoods. Agricultural. Handbook. 654. U.S. Department of Agriculture, Forest Service, Washington, DC, pp. 250-257.
Clearwater, J.S.A., M., Meinzer, F.C., Goldstein, G., 2002. Heat dissipation sensors of variable length for measurement of sap flow in trees with deep sapwood. Tree Physiol. 22, 277-283.
Coll, L., Potvin, C., Messier, C., Delagrange, S., 2008. Root archi-tecture and allocation patterns of eight native tropical species with different successional status used in open-grown mixed plantations in Panama. Trees 22, 585-596.
Cunningham, S.A., Kimberi, R.P., Colloff, M.J., 2009. Whole-tree sap flow is substantially diminished by leaf herbi-vory. Oecologia 158, 633–640.
Davies, W.J., Bacon, M.A., Thomson, D.S., Sobeih, W., Gonzalez, R.L., 2000. Regulation of leaf and fruit growth in plants growing in drying soil: exploitation of the plant's own chemical signaling system and hydraulic architecture to increase the efficiency of water use in agriculture. Journal of Experimental Botany 51, 1617-1626.
Dierick, D., Hölscher, D., 2009. Species-specific tree water use characteristics in reforestation stands in the Philippines. Agric. For. Meteorol. 149, 1317-1326.
Dietrich, W.E., Windsor, M.D., Dunne, T., 1996. Geology, Cli-mate and Hydrology of Barro Colorado Island. In: Leigh, E.G. Jr., Rand, A.S., Windsor, D.M. (Eds.), The Ecology of a Tropical Forest. Seasonal Rhythms and Annual Changes. Second edition. Smithsonian Institution Press, Washington DC, pp. 21-46.
Dünisch, O., Morais, R.R., 2002. Regulation of xylem sap flow in an evergreen, a semi-deciduous, and a deciduous Meli-aceae species from the Amazon. Trees 16, 404-416.
Edwards, W.R.N., Becker, P., Cermák, J., 1996. A unified nomen-clature for sap flow measurements. Tree Physiol. 17, 65–67.
Flores, E.M., 2003. Terminalia amazonia (J.F. Gmel. ) Exell. In: Vozzo, J.A. (Ed.), Tropical Tree Seed Manual. Part II-Species Descriptions. United States Department of Agriculture. Forest Service. Agriculture Handbook 721. Washington DC, pp. 748-751.
Flores, E.M., Marín, W.A., 2003. Tabebuia rosea (Bertol.) DC. In: Vozzo, J.A. (Ed.), Tropical Tree Seed Manual. Part II-Species Descriptions. United States Department of Agriculture. Forest Service. Agriculture Handbook 721. Washington DC, pp. 737-739.
Fournier, L.A., 2003a. Anacardium excelsum (Bertero & Balb. ex Kunth) Skeels. In: Vozzo, J.A. (Ed.), Tropical Tree Seed Manual. Part II-Species Descriptions. United States Department of Agriculture. Forest Service. Agriculture Handbook 721. Washington DC, pp. 294-296.
Fournier, L.A., 2003b. Luehea seemannii Triana & Planch. In: Vozzo, J.A. (Ed.), Tropical Tree Seed Manual. Part II-Species Descriptions. United States Department of Agriculture. Forest Service. Agriculture Handbook 721. Washington DC, pp. 553-554.
Francis, J.K., 1990. Hura crepitans L. Sandbox, molinillo, jabillo. Euphorbiaceae. Spurge family. USDA Forest Service, Southern Forest Experiment Station, Institute of Tropical Forestry. SO-ITF-SM; 38, New Orleans, LA, USA.
Francis, J.K., 2003a. Acacia mangium Willd. In: Vozzo, J.A. (Ed.), Tropical Tree Seed Manual. Part II-Species Descriptions. United States Department of Agriculture. Forest Service. Agriculture Handbook 721. Washington DC, pp. 256-258.
Francis, J.K., 2003b. Tectona grandis L.f. In: Vozzo, J.A. (Ed.), Tropical Tree Seed Manual. Part II-Species Descriptions. United States Department of Agriculture. Forest Service. Agriculture Handbook 721. Washington DC, pp. 745-747.
Goldstein, G., Andrade, J.L., Meinzer, F.C., Holbrook, N.M., Cavalier, J., Jackson, P., Celis, A., 1998. Stem water storage and diurnal patterns of water use in tropical forest canopy trees. Plant Cell Environ. 21, 397-406.
Granier, A., 1985. A new method of sap flow measurement in tree stems. Ann. For. Sci. 42, 193-200.
Granier, A., 1987. Evaluation of transpiration in a Douglas-fir stand by means of sap flow measurements. Tree Physiol. 3, 309-320.
Hölscher, D., Koch, O., Korn, S., Leuschner, Ch., 2005. Sap flux of five co-occurring tree species in a temperate broad-leaved forest during seasonal soil drought. Trees 19, 628-637.
Holdridge, L.R., Budowski, G., 1956. Report on an ecological survey of the Republic of Panama. The Caribbean Forester 17, 92-109.
Jackson, P.C., Cavelier, J., Goldstein, G., Meinzer, F.C., Holbrook, N.M., 1995. Partitioning of water resources among plants of a lowland tropical forest. Oecologia 101, 197-203.
Jackson, B.J., Jobbagy, E.G., Avissar, R., Roy, S.B., Barrett, D.J., Cook, C.W., Farley, K.A., le Maitre, D.C., McCarl, B.A., Murray, B.C., 2005. Trading water for carbon with bio-logical carbon sequestration. Science 310, 1944-1947.
Kijkar, S., 2003. Gmelina arborea Roxb. In: Vozzo, J.A. (Ed.), Tropical Tree Seed Manual. Part II-Species Descriptions. United States Department of Agriculture. Forest Service. Agriculture Handbook 721. Washington DC, pp. 476-478.
Lamb, D., Erskine, P.D., Parrotta, J.A., 2005. Restoration of degraded tropical forest landscapes. Science 310, 1628-1632.
Ma, L., Lu, P., Zhao, P., Roa, X.-Q., Cai, X.A., Zeng, X.P., 2008. Diurnal, daily seasonal and annual patterns of sap-flux-scaled transpiration from an Acacia mangium plantation in South China. Ann. For. Sci. 65, 402p1-402p9.
McJannet, D., Fitch, P., Disher, M., Wallace, J., 2007. Measure-ments of transpiration in four tropical rainforest types of north Queensland, Australia. Hydrol. Process. 21, 3549-3564.
Meinzer, F.C., James, S.A, Goldstein, G., 2004. Dynamics of transpiration, sap flow and use of stored water in tropical forest canopy trees. Tree Physiol. 24, 901-909.
Meinzer, F.C., Bond, B.J., Warren, J.M., Woodruff, D.R., 2005. Does water transport scale universally with tree size? Funct. Ecol. 19, 558-565.
Meinzer, F.C., Andrade, J.L, Goldstein, G., Holbrook, N.M., Cavelier, J., Jackson, P., 1997. Control of transpiration from the upper canopy of a tropical forest, the role of stomatal, boundary layer and hydraulic architecture com-ponents. Plant, Cell and Environ. 20, 1242-1252.
Meinzer, F.C., Andrade, J.L., Goldstein, G., Holbrook, N.M., Cavelier, J., Wright, S.J., 1999. Partitioning of soil water among canopy trees in a seasonally dry tropical forest. Oecologia 21, 293-301. O’Grady, A.P., Eamus, D., Hut-ley, L.B., 1999. Transpiration increases during dry sea-son, patterns of tree water use in eucalypt open-forests of northern Australia. Tree Physiol. 19, 591-597.
Phillips, N., Oren, R., Zimmermann, R., Wright, S.J., 1999. Temporal patterns of water flux in trees and lianas in Panamanian moist forest. Trees 14, 116-123.
Potvin, C., Dutilleul, P., 2009. Neighborhood effects and size-symmetric competition in a tree plantation varying in di-versity. Ecology 90, 321–327.

CHAPTER 5
58
Potvin, C., Whidden, E., Moore, T., 2004. A case study of carbon pools under three different land-uses in Panama. Clim. Change 67, 291-307.
Rocas, A.N., 2003. Cedrela odorata L. In: Vozzo, J.A. (Ed.), Tropical Tree Seed Manual. Part II-Species Descriptions. United States Department of Agriculture. Forest Service. Agriculture Handbook 721. Washington DC, pp. 386-389.
Röhle, H., 1986. Vergleichende Untersuchungen zur Ermittlung der Genauigkeit bei der Ablotung von Kronenradien mit dem Dachlot und durch senkrechtes Anvisieren des Kronenrandes. Forstarchiv 57, 67–71.
Schorcht, M., 2000. Tectona grandis. In: Schütt, P., Schuck, H.J., Lang, U., Rollof,A. (Eds.), Enzykloppädie der Holzgewächse. Handbuch und Atlas der Dendrologie. Ecomed Verlagsgesellschaft, Landsberg..
STRI, 2009. Temperature and rainfall data Barro Colorado Island,
Panama 1987-2007. Online. http://striweb.si.edu/esp/meta_data/details_bci_temp1.html van Dijk, A.I.J.M., Keenan, R.J., 2007. Planted forests and water in
perspective. For. Ecol. Manage. 251, 1-9. Veldkamp, E., O'Brien, J.J., 2000. Calibration of a FDR sensor for
humid tropical soils of volcanic origin. Soil Sci. Soc. Am. J. 64, 1549-1553.
Wishnie, M.H., Dent, D.H., Mariscal, E., Deago, J., Cedeño, N., Ibarra, D., Condit, R., Ashton, P.M.S., 2007. Initial performance and restoration potential of 24 tropical tree species planted across a precipitation gradient in the Re-public of Panama. For. Ecol. Manage. 243, 39-49.
Wolf, S., Eugster, W., Buchmann, N., 2008. Micrometeorological measurements of a plantation and adjacent pasture in Sardinilla, Panama. Field Measurements. ETH Zürich, Institute of Plant Sciences. Digital media.
CHAPTER 6 COMPARISON OF TREE WATER USE CHARACTERISTICS IN
REFORESTATION AND AGROFORESTRY STANDS ACROSS
THE TROPICS
CONTRIBUTION IN: T. TSCHARNTKE, C. LEUSCHNER, E. VELDKAMP, H. FAUST, E. GUHARDJA, A. BIDIN (EDS.), TROPICAL RAINFORESTS AND AGROFORESTS UNDER GLOBAL CHANGE, SPRINGER, BERLIN, PP. 293-308.

CHAPTER 6 Tropical Rainforests and Agroforests under Global Change, Springer, Berlin, pp. 293-308.
61
Comparison of tree water use characteristics in reforestation and agroforestry stands across the tropics
Diego Dierick*, Norbert Kunert, Michael Köhler, Luitgard Schwendenmann & Dirk Hölscher
Tropical Silviculture and Forest Ecology, Burckhardt Institute, Georg-August-Universität Göttingen, Büsgenweg 1, 37077 Göttingen, Germany
Abstract. In the tropics, reforestations and agroforestry become increasingly important and may help mitigate climate change.
However, high water use by trees may deplete water resources for associated crops or other purposes. Choice of tree species
might reduce water use rates to acceptable levels, but available information on species-specific water use characteristics is scarce.
We addressed the following questions: (1) do species differ in xylem sap flux response to fluctuating environmental conditions,
(2) are there species-specific differences in quantities of water used, and specifically (3) do universal rules relating tree size to
water use apply? This chapter combines data on tree sap flux and water use gathered in Indonesia, Panama and the Philippines.
These studies applied the same methods and were conducted in recently established stands (5-12 years old when studied) charac-
terised by small diameter trees and relatively simple stand structure. We analyse data from more than 100 trees belonging to 17
species using a simple sap flux model. Model application suggests species-specific differences in parameters such as maximal sap
flux velocity and responses to radiation and vapour pressure deficit. With respect to the quantity of water used per tree, we ob-
served a strong correlation between tree diameter and tree water use, which confirms earlier publications. However, e.g. in the
stands in the Philippines where tree diameter explained 65% of observed variation, some species clearly followed distinct trajec-
tories. For a given diameter, up to twofold differences in tree water use among species were observed. Our findings thus support
the idea that species selection can be used to control tree water use of future reforestations and within agroforestry systems. This
will be especially relevant in areas where water resources are limited already or where climate scenarios predict decreasing precipi-
tation.
Keywords: Indonesia, Panama, Philippines, sap flux, tree size, tree species
1 Introduction
Natural forests in the tropics are still being converted at a high rate. Many of the former forest areas have been degraded, fail to produce goods and do not contribute to the protection of climate and biodiversity. For the management of buffer zones around remaining protected forests as well as for the restoration of degraded land, reforestation and agroforestry can be suit-
able measures. The re-introduction of trees into the landscape and especially reforestations have however been criticised because trees are poten-tially heavy water users and might deplete water resources (Jackson et al. 2005). From a global synthesis it was concluded that annual runoff was on average reduced by 44% and by 31% when reforesting grass- and shrubland, respec-tively (Farley et al. 2005). Also trees in agrofor-estry may be problematic as they may reduce
In: Teja Tscharntke, Christoph Leuschner, Edzo Veldkamp, Heiko Faust, Edi Guhardja, Arifuddin Bidin (editors), tropical
rainforests and agroforests under global change, Springer Berlin 2009, pp 293-308.
* Corresponding author. Tel.: +49 551 399556; Fax: +49 551 394019; E-mail address: [email protected] (D. Dierick)

CHAPTER 6 Tropical Rainforests and Agroforests under Global Change, Springer, Berlin, pp. 293-308.
62
water availability for the main crops and addi-tionally increase stand level transpiration. In Costa Rica, the estimated stand level transpira-tion by coffee with shade trees was on average twice as high as that of coffee grown without shade trees (van Kanten and Vaast 2006).
It has been suggested that a suitable tree species choice might reduce water use rates to acceptable levels (van Dijk and Keenan 2007). This contention is somewhat theoretical as available information on species-specific water use characteristics is scarce. Furthermore, the effectiveness of species selection is questionable as studies in diverse old-growth forests and a single-species tree plantation showed repeatedly that tree size is the main factor influencing tree water use (Cienciala et al. 2000; Meinzer et al. 2004; McJannet et al. 2007). Meinzer et al. (2005) suggested that, as a result of functional convergence, plants operating within given bio-physical limitations, develop common patterns of sap flux and water use in relation to size characteristics across taxa. This would leave little room for species selection to serve as a tool to influence stand water use, at least if wood pro-duction or carbon fixation is a major goal.
A thorough analysis of the problem is diffi-cult as single studies of sap flux and tree water use often lack sufficient replicates within a spe-cies and/or analyse a limited number of species. Comparison among studies is additionally ham-pered by differences in applied methods. Here we bring together data from three case studies namely from the Philippines (Dierick and Höl-scher 2009), Indonesia (Köhler et al. in press) and Panama (Kunert, unpublished data), which were conducted in relatively young reforestation and agroforestry stands. Our compilation com-prises 106 individual trees belonging to 17 spe-cies, which were studied and analysed using the same protocol. In this data compilation, we concentrate on time periods with ample soil water supply and on trees fully in leaves. As a diagnostic tool, we apply a model that predicts sap flux density based on meteorological pa-rameters. The following questions were ad-dressed: (1) do species differ in xylem sap flux response to fluctuating environmental condi-tions, (2) are there species-specific differences in quantities of water used, and specifically (3) do universal rules relating tree size to water use apply?
2 Methods 2.1 Study sites
In the Philippines, we worked on the island Leyte in the Eastern Visayas. Two study sites were located near the villages Marcos (10.765°N, 124.790°E) and Patag (10.736°N, 124.804°E) at an elevation of 30 and 40 m asl, respectively. Average rainfall in the region amounts to 2753 mm y-1 and rain is relatively evenly distributed throughout the year (PA-GASA 2007). Average annual air temperature is 27.5 °C. The natural vegetation in the region is species-rich lowland dipterocarp forest (Lan-genberger 2006). After deforestation and inter-mittent cultivation, the degraded sites were re-forested following the so called ‘rainforestation’ approach (Margraf and Milan 1996). This means reforesting with a mixture of native species, promoting the incorporation of fruit trees and combining fast growing trees with shade tolerant species. At the time of the field study, from June to August 2006 at Marcos and July to September 2007 at Patag, both stands were 12 years old. Stem density was 796 and 1367 stems ha-1 in Marcos and Patag, respectively. We selected ten tree species, eight of which were native to the region (Table 1). Each species was represented by five individuals selected to have well exposed crowns. Only for Hopea plagata S. Vidal, a species with an in general smaller stature, some indi-viduals had little exposed crowns.
In Indonesia, our study site was located in Central Sulawesi in the vicinity of the village of Marena (1.552°S, 120.020°E) at 560 m asl. Measurements made between 2002 and 2006 at Gimpu (5 km south of Marena, 471 m asl) show that the mean air temperature is 25.5 °C and annual rainfall in the region is around 2092 mm y-1. Rainfall shows a weak bimodal pattern with rainy seasons (>100 mm per month) from March to June and October to December. The structure and species composition of surround-ing natural forest, which is usually only remain-ing at higher elevations, was described by Grad-stein et al. (2007). The studied agroforest was located on former agricultural land used for cultivating annual crops such as maize and was 6 years old at the time of study. Cacao (Theobroma cacao L.) was growing as crop under Gliricidia sepium (Jacq.) Kunth ex Steud. shade trees. The stem density was 1030 stems ha-1 for cacao and 325 stems ha-1 for Gliricidia. Both tree species were represented by 18 individuals and studied for a one-month period in February 2007.

CHAPTER 6 Tropical Rainforests and Agroforests under Global Change, Springer, Berlin, pp. 293-308.
63
Table 1: Char
acteristics of th
e study tree
s. S
cien
tific nam
es are
listed w
ith the re
spec
tive
abbre
viatio
ns use
d.

CHAPTER 6 Tropical Rainforests and Agroforests under Global Change, Springer, Berlin, pp. 293-308.
64
Our site in Panama was located near the village of Sardinilla, Central Panama (9.317°N, 79.633°W), which is approximately 50 km north of Panama City. The elevation of the site is 70 m asl. Mean annual precipitation measured at Barro Colorado Island (at 30 km distance) is 2627 mm, with 25-50 mm per month during peak dry season (January-March) and 250 mm per month during the rainy season (May to No-vember). The mean annual temperature of the region is 25.9 °C (STRI 2009). The original for-est vegetation at the Sardinilla site was probably a tropical moist forest, similar to that of the Barro Colorado National Monument (Leigh et al. 1996). The study site was clear-cut in the 1950’s and later used for cattle ranging. At the time of our study, the stands were 6 years old and stem density was about 1100 stems ha-1. Five tree species growing in monocultures were studied with four replicates each during the rainy season between June and September 2007.
2.2 Sap flux measurements
Sap flux density Js (g cm-2 h-1) was measured using 25 mm long thermal dissipation probes (Granier 1985). Per study tree, two sensor pairs were installed on opposite sides of the tree trunk in the outermost xylem. Sensors were shielded and protected by styrofoam boxes, reflective foil, and plastic foil. The thermocouple output from the thermal dissipation probes was meas-ured every 30 seconds and 5 or 30 minute aver-ages were stored using dataloggers and attached multiplexers (CR1000 and AM16/32, Campbell Scientific Inc., Logan, UT, USA). Sap flux den-sity was calculated from raw temperature data using the calibration equation determined by Granier (1987).
2.3 Radial sap-flux profiles and water use rates
Radial profiles of sap flux density Js were used to determine tree water use. Therefore Js was measured at one or two additional depths below the cambium and expressed relatively (%) to concurrent measurements at the outer refer-ence depth. Sap flow of ring-shaped stem cross-sections was then calculated, taking into account the cross-sectional area of the ring correspond-ing with the respective installation depth, Js as measured at reference depth at the outer xylem, and the normalised profile of Js for the species considered (Hatton et al. 1990; Meinzer et al. 2005). Contributions of the different cross sec-tions were added to determine total tree sap
flow (g h-1) and summed over a day to give daily tree water use rates WU (kg d-1). Water use rates were also expressed as transpiration rates (T, mm d-1) by dividing WU by the crown projec-tion area of the respective tree (m2).
2.4 Sap flux density model
We used a model to capture species charac-teristics of sap flux density and its responses to environmental conditions in analogy with work of O'Brien et al. (2004). The sap flux model used is a modification of the Jarvis-type model (Jarvis 1976) which was originally developed to describe stomatal responses to environmental drivers. The model takes the form of a multipli-cation of non-linear response functions, each depending on a single environmental factor. Each individual response function takes a value between zero and one, thus limiting the overall response if one or more environmental factors become suboptimal. The fact that environ-mental variables appear isolated in the model enhances the interpretation of model parame-ters. This multiplicative type of model has been widely used in a number of variations to de-scribe canopy conductance (Herbst et al. 1999; Granier et al. 2000; Harris et al. 2004), stand transpiration (Oren and Pataki 2001; Whitley et al. 2008) and to describe sap flow patterns in individual trees (Cienciala et al. 2000).
We opted for a sap flux density model with radiation Rg (W m-2) and vapour pressure deficit VPD (kPa) as explanatory variables. Additional factors such as soil moisture conditions were not included because a preliminary exploration of the data indicated that this would not im-prove model fit much. The model form used was:
with Js model the modeled sap flux density (g cm-2 h-1), a the maximum modeled sap flux density (g cm-2 h-1), b a parameter describing Rg
response(W m-2) and c, d parameters describing the VPD response (kPa).
Modeled sap flux density Js model reaches a maximum value a when all environmental condi-tions are optimal. To account for the influence of radiation we introduced a commonly used hyperbolic response function which asymptoti-cally approaches a value of 1 at high Rg. Parame-ter b can be interpreted as a measure of the light saturation level. Assuming VPD is non-limiting,
d
VPDcg
g
Rb
RaJ −
++
=exp1
1models
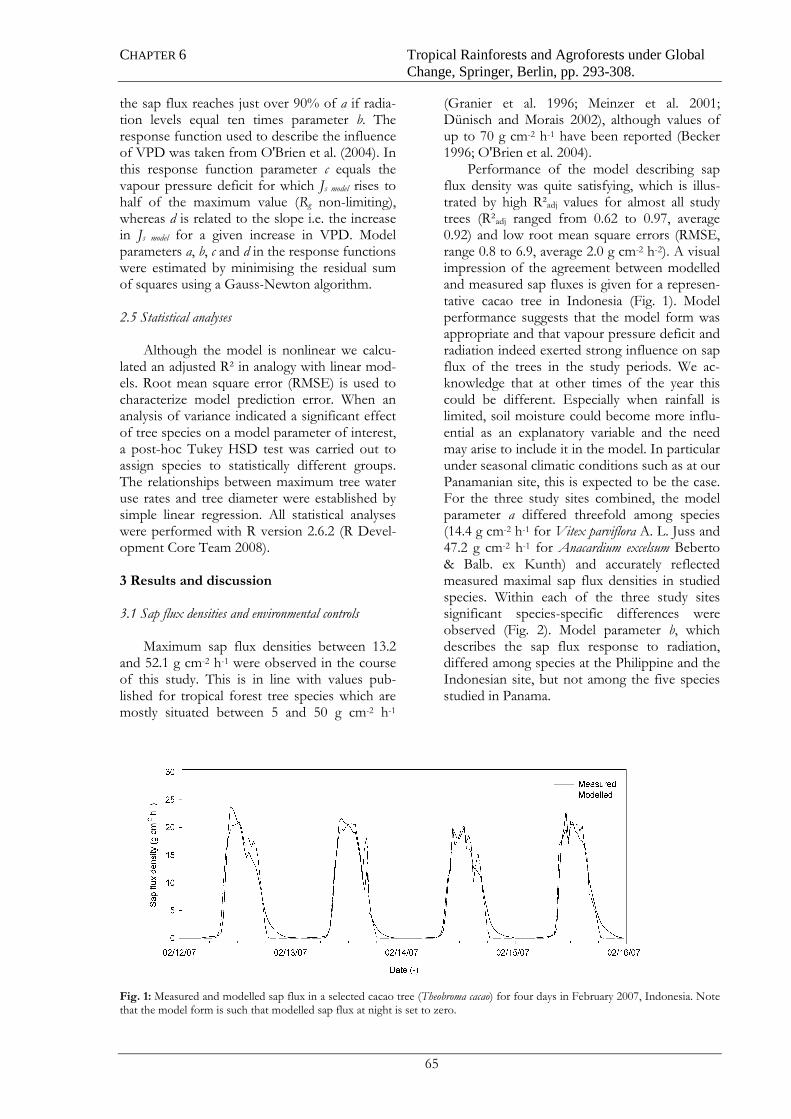
CHAPTER 6 Tropical Rainforests and Agroforests under Global Change, Springer, Berlin, pp. 293-308.
65
the sap flux reaches just over 90% of a if radia-tion levels equal ten times parameter b. The response function used to describe the influence of VPD was taken from O'Brien et al. (2004). In this response function parameter c equals the vapour pressure deficit for which Js model rises to half of the maximum value (Rg non-limiting), whereas d is related to the slope i.e. the increase in Js model for a given increase in VPD. Model parameters a, b, c and d in the response functions were estimated by minimising the residual sum of squares using a Gauss-Newton algorithm.
2.5 Statistical analyses
Although the model is nonlinear we calcu-lated an adjusted R² in analogy with linear mod-els. Root mean square error (RMSE) is used to characterize model prediction error. When an analysis of variance indicated a significant effect of tree species on a model parameter of interest, a post-hoc Tukey HSD test was carried out to assign species to statistically different groups. The relationships between maximum tree water use rates and tree diameter were established by simple linear regression. All statistical analyses were performed with R version 2.6.2 (R Devel-opment Core Team 2008).
3 Results and discussion 3.1 Sap flux densities and environmental controls
Maximum sap flux densities between 13.2 and 52.1 g cm-2 h-1 were observed in the course of this study. This is in line with values pub-lished for tropical forest tree species which are mostly situated between 5 and 50 g cm-2 h-1
(Granier et al. 1996; Meinzer et al. 2001; Dünisch and Morais 2002), although values of up to 70 g cm-2 h-1 have been reported (Becker 1996; O'Brien et al. 2004).
Performance of the model describing sap flux density was quite satisfying, which is illus-trated by high R²adj values for almost all study trees (R²adj ranged from 0.62 to 0.97, average 0.92) and low root mean square errors (RMSE, range 0.8 to 6.9, average 2.0 g cm-2 h-2). A visual impression of the agreement between modelled and measured sap fluxes is given for a represen-tative cacao tree in Indonesia (Fig. 1). Model performance suggests that the model form was appropriate and that vapour pressure deficit and radiation indeed exerted strong influence on sap flux of the trees in the study periods. We ac-knowledge that at other times of the year this could be different. Especially when rainfall is limited, soil moisture could become more influ-ential as an explanatory variable and the need may arise to include it in the model. In particular under seasonal climatic conditions such as at our Panamanian site, this is expected to be the case. For the three study sites combined, the model parameter a differed threefold among species (14.4 g cm-2 h-1 for Vitex parviflora A. L. Juss and 47.2 g cm-2 h-1 for Anacardium excelsum Beberto & Balb. ex Kunth) and accurately reflected measured maximal sap flux densities in studied species. Within each of the three study sites significant species-specific differences were observed (Fig. 2). Model parameter b, which describes the sap flux response to radiation, differed among species at the Philippine and the Indonesian site, but not among the five species studied in Panama.
Fig. 1: Measured and modelled sap flux in a selected cacao tree (Theobroma cacao) for four days in February 2007, Indonesia. Note that the model form is such that modelled sap flux at night is set to zero.

CHAPTER 6 Tropical Rainforests and Agroforests under Global Change, Springer, Berlin, pp. 293-308.
66
High values for parameter b were found in
species which did not have full sun exposed crowns such as Hopea plagata in the Philippines and Theobroma cacao in Indonesia. A possible explanation is that in trees growing under shade or having a layered crown structure sap flux continues to rise with additional light even at high radiation. 3.2 Sap flux density in relation to tree size
At first view our data suggests, despite a very low R2
adj, a negative relation between maximum sap flux density Jsmax and tree diame-ter (Fig. 3). This finding is explained by the sig-nificant decline in sap flux density with increas-ing diameter we observed in the dataset from Indonesia (Fig. 3 inset). Rather than by a real effect of diameter on Jsmax, the latter is caused by the different diameter range of sampled cacao and Gliricidia trees in combination with the dif-ferent sap flux densities observed for these spe-cies. The complete lack of a diameter-related decline of sap flux density with diameter at the
two other study sites supports this interpreta-tion. The absence of a decline of sap flux den-sity with diameter apparently contradicts the hypothesis of functional convergence (Meinzer et al. 2001; Meinzer et al. 2005). Their work in Panama revealed a strong inverse relationship (R² = 0.85) between maximum sap flux density and tree diameter in 24 co-occurring species in a Panamanian old-growth forest. Similarly, in a patch of advanced secondary forest in Vietnam, a weak but significant (R² = 0.23) decline of mean Js with tree diameter existed (Giambelluca et al. 2003). At the same time however, that study acknowledged the presence of large differ-ences in Js across and within species and the decisive role of factors such as tree exposure and environmental conditions. That our data did not reveal a similar pattern of declining Jsmax with tree diameter could be due to the limited diame-ter range encompassed in comparison with the original work (Meinzer et al. 2001). The data presented by Meinzer et al. (2001) revealed con-siderable scatter, in particular in the lower di-ameter range where the steepest decline in Jsmax
Fig. 2: Estimated model parameters a (upper panel) and b (lower panel) for the species studied (means and standard deviations, n depends on study site (see Table 1)). Significant differences (p < 0.05) between species within a study site are indicated by different small letters. The complete species names and abbreviations are listed in Table 1.

CHAPTER 6 Tropical Rainforests and Agroforests under Global Change, Springer, Berlin, pp. 293-308.
67
is predicted. A possible implication is that gen-eral patterns resulting from functional conver-gence may remain unnoticed if the range of tree diameters covered is too narrow. In our opinion the species differences we observed in Js max and responses of Js to environmental variables do not necessarily contradict the hypothesis of functional convergence (Meinzer 2003). We hypothesise that this finding merely reflects that considerable variation remains within general patterns observed across species. This can in part be due to species-specific adaptation to a given set of growth conditions and possibly also due to stand structural differences (see also Cienciala et al. 2000).
In stands where functional convergence can be demonstrated, it would be an essential tool in assessing stand transpiration. This is particularly true in species-rich and highly structured natural forest stands (McJannet et al. 2007). However, we argue functional convergence to be less rele-vant in relatively young mixed reforestation or agroforest stands characterised by limited di-ameter ranges and stand structure. In our opin-ion the species-specific differences in sap flux density we observed in co-occurring trees would become relatively more important under such conditions and become a determining factor for stand water use.
3.3 Tree water use, tree diameter, and transpiration
Our data revealed a strong positive correla-tion between maximum daily tree water use and tree diameter (Fig. 4a). This is true for the pooled data, as well as for data from the indi-vidual study sites (Fig. 4b-d). Also Meinzer et al. (2004) found for different co-occurring species in Panama, that tree size rather than tree species was a determining factor for tree water use. Follow-up studies encompassing more species and replicates revealed similar allometric rela-tionships between tree water use rates and tree diameter (and biomass) that were shared by species belonging to distinct species groups (Meinzer et al. 2005). The relation between tree water use and tree diameter was best described by a sigmoid relationship in 18 mainly tropical angiosperm tree species. That a simple linear regression between tree diameter and tree water use explains most of the variance in our data set, should be seen in relation to the small diameter range covered. Some theoretical relationships describing water use versus tree size characteris-tics might be inappropriate from a biological point of view, even though they provide an adequate fit in certain datasets (Meinzer et al. 2005). The same appears to be the case in our study.
Fig. 3: Maximum sap flux density Js max for individual trees in the three studies in relation to tree diameter. The inset shows the data from the Indonesian study site

CHAPTER 6 Tropical Rainforests and Agroforests under Global Change, Springer, Berlin, pp. 293-308.
68
Despite the strong dependence of maxi-mum water use on diameter for the individuals studied, considerable scatter was present around the fitted curve with species located on distinct trajectories (Fig. 4b-d). For a given tree diame-ter, tree water use differed up to twofold be-tween some of the species studied. This resulted from a combination of both species-specific Js and species differences in hydroactive xylem depth. Apart from these factors, the relationship would be determined strongly by cross correla-tion between estimated water use rates and tree diameter. This can be expected to be most pro-nounced in the lower diameter ranges (Meinzer et al. 2001), making the deviations from a com-mon relationship even more significant. Maxi-mum transpiration rates observed in individual trees varied from 0.4 to 4.9 mm d-1, except for a single individual of Swietenia macrophylla King
which had a maximum transpiration rate of 7.5 mm d-1. A small crown projection area and asso-ciated larger relative error in this individual could explain the high value. Excluding this single tree, results are comparable with findings from Giambelluca et al. (2003) who measured daily transpiration rates in individual trees from 0.5 to 4.6 mm d-1 in a patch of advanced secon-dary forest in Vietnam during the wet season. In our study, mean transpiration rates over the study periods differed fourfold across species from 0.6 to 2.4 mm d-1 (Table 2). For the men-tioned study in a forest patch in Vietnam, tran-spiration rates were also found to be different among species and were, in addition, influenced by crown exposure, seasonality and enhanced transpiration at the forest edge (Giambelluca et al. 2003). It is unlikely that differences in tran-spiration rates observed between species can be
Fig. 4: Maximum daily water use rates WUmax for each individual in relation to tree diameter for all studied trees (a). Ana-logue plots show the data for species in the Philippines (b), Indonesia (c) and Panama (d). In each of the latter graphs two contrasting species are shown with a different symbol.

CHAPTER 6 Tropical Rainforests and Agroforests under Global Change, Springer, Berlin, pp. 293-308.
69
translated directly to transpiration at the stand level as different stand development and stand structure of contrasting species (or species mix-tures) are likely to partly reduce species-specific transpiration rates. Nevertheless, we assume that the remarkable differences across tree species in both tree water use and tree transpiration rates could be exploited to manage stand water use. 4 Conclusions
We conclude that water use- and transpira-tion rates found in trees of tropical reforestation and agroforestry stands showed considerable variation across species. Despite the strong de-pendence of maximal tree water use on tree diameter for the individuals studied, consider-able scatter was present around the fitted curve with species located on distinct trajectories. At a given diameter, up to twofold differences be-tween trees of different species were observed. Species selection might thus indeed be an effec-tive tool to control water use in reforestation and agroforestry. It can be used to optimise the balance between wood production or carbon sequestration and the use of water resources.
Acknowledgements
This study was funded by the German Re-search Foundation in the framework of the SFB 552 (sub-project B4) and a further grant for the study in Panama (Ho-2119/3-1).
References Becker P (1996) Sap flow in Bornean heath and dipterocarp forest
trees during wet and dry periods. Tree Physiology 16: 295-299 Cienciala E, Kucera J, Malmer A (2000) Tree sap flow and stand
transpiration of two Acacia mangium plantations in Sabah, Borneo. Journal of Hydrology 236: 109-120
Dierick D, Hölscher D (2009) Species-specific tree water use characteristics in reforestation stands in the Philippines. Agri-cultural and Forest Meteorology 149: 1317-1326
Dünisch O, Morais RR (2002) Regulation of xylem sap flow in an evergreen, a semi-deciduous, and a deciduous Meliaceae species from the Amazon. Trees-Structure and Function 16: 404-416
Farley KA, Jobbagy EG, Jackson RB (2005) Effects of afforesta-tion on water yield: a global synthesis with implications for pol-icy. Global Change Biology 11: 1565-1576
Giambelluca TW, Ziegler AD, Nullet MA, Truong DM, Tran LT (2003) Transpiration in a small tropical forest patch. Agricul-tural and Forest Meteorology 117: 1-22
Gradstein SR, Kessler M, Pitopang R (2007) Tree species diversity relative to human land uses in tropical rain forest margins in Central Sulawesi. In: Tscharntke T, Leuschner C, Guhardja E, Zeller M (Eds.), The Stability of Tropical Rainforest Margins: Linking Ecological, Economic and Social Constraints of Land Use and Conservation. Springer, Berlin, p. 321-334
Granier A (1985) A new method of sap flow measurement in tree stems. Annals of Forest Science 42: 193-200
Table 2: Maximum (WUmax) and mean water use (WUmean) and maximum (Tmax) and mean (Tmean) transpiration rates (means and standard deviations, n depends on study site (see Table 1)). Significant differences (p < 0.05) are indicated by different small letters.

CHAPTER 6 Tropical Rainforests and Agroforests under Global Change, Springer, Berlin, pp. 293-308.
70
Granier A (1987) Evaluation of transpiration in a Douglas-fir stand by means of sap flow measurements. Tree Physiology 3: 309-319
Granier A, Huc R, Barigah ST (1996) Transpiration of natural rain forest and its dependence on climatic factors. Agricultural and Forest Meteorology 78: 19-29
Granier A, Loustau D, Breda N (2000) A generic model of forest canopy conductance dependent on climate, soil water availabil-ity and leaf area index. Annals of Forest Science 57: 755-765
Harris PP, Huntingford C, Cox PM, Gash JHC, Malhi Y (2004) Effects of soil moisture on canopy conductance of Amazonian rainforest. Agricultural and Forest Meteorology 122: 215-227
Hatton TJ, Catchpole EA, Vertessy RA (1990) Integration of sapflow velocity to estimate plant water-use. Tree Physiology 6: 201-209
Herbst M, Eschenbach C, Kappen L (1999) Water use in neighbouring stands of beech (Fagus sylvatica L.) and black al-der (Alnus glutinosa (L.) Gaertn.). Annals of Forest Science 56: 107-120
Jackson BJ, Jobbagy EG, Avissar R, Roy SB, Barrett DJ, Cook CW, Farley KA, le Maitre DC, McCarl BA, Murray BC (2005) Trading water for carbon with biological carbon sequestration. Science 310: 1944-1947
Jarvis PG (1976) The interpretation of the variations in leaf water potential and stomatal conductance found in canopies in the field. Philosophical Transactions of the Royal Society of Lon-don B- Biological Sciences 273: 593-610
Köhler M, Dierick D, Schwendennman L, Hölscher D (in press, DOI: 10.1002/eco.67) Water use characteristics of cacao and Gliricidia trees in an agroforest in Central Sulawesi, Indonesia. Ecohydrology
Langenberger G (2006) Habitat distribution of dipterocarp species in the Leyte Cordillera: an indicator for species-site suitability in local reforestation programs. Annals of Forest Science 63: 149-156
Leigh EG, Rand AS, Windsor DW (1996) The ecology of a tropi-cal forest, 2nd edn, Smithsonian Press, Washington, DC
Margraf J, Milan PP (1996) Ecology of dipterocarp forests and its relevance for island rehabilitation in Leyte, Philippines. In: Schulte A, Schöne D (Eds.), Dipterocarp Forest Ecosystems:
Towards Sustainable Management. World Scientific, Singapore, p. 124-154
McJannet D, Fitch P, Disher M, Wallace J (2007) Measurements of transpiration in four tropical rainforest types of north Queen-sland, Australia. Hydrological Processes 21: 3549-3564
Meinzer FC (2003) Functional convergence in plant responses to the environment. Oecologia 134: 1-11
Meinzer FC, Goldstein G, Andrade JL (2001) Regulation of water flux through tropical forest canopy trees: Do universal rules apply? Tree Physiology 21: 19-26
Meinzer FC, James SA, Goldstein G (2004) Dynamics of transpi-ration, sap flow and use of stored water in tropical forest can-opy trees. Tree Physiology 24: 901-909
Meinzer FC, Bond BJ, Warren JM, Woodruff DR (2005) Does water transport scale universally with tree size? Functional Ecology 19: 558-565
O'Brien JJ, Oberbauer SF, Clark DB (2004) Whole tree xylem sap flow responses to multiple environmental variables in a wet tropical forest. Plant, Cell and Environment 27: 551-567
Oren R, Pataki DE (2001) Transpiration in response to variation in microclimate and soil moisture in southeastern deciduous forests. Oecologia 127: 549-559
PAGASA (2007) Philippine Atmospheric, Geophysical and Astro-nomical Services Administration, Philippines.
R Development Core Team (2008) R: A language and environ-ment for statistical computing. R Foundation for Statistical Computing, Vienna, Austria, ISBN 3-900051-07-0,http://www.R-project.org (last visited 28/05/2009)
STRI (2009) Temperature and rainfall data Barro Colorado Island, Panama 1987-2006. http://striweb.si.edu/esp/ physical_monitoring/download_bci.htm (last visited 28/05/2009)
Van Dijk AIJM, Keenan RJ (2007) Planted forests and water in perspective. Forest Ecology and Management 251: 1-9
Van Kanten R, Vaast P (2006) Transpiration of arabica coffee and associated shade tree species in sub-optimal, low-altitude condi-tions of Costa Rica. Agroforestry Systems 67: 187-202
Whitley R, Zeppel M, Armstrong N, Macinnis-Ng C, Yunusa I, Eamus D (2008) A modified Jarvis-Stewart model for predicting stand-scale transpiration of an Australian native forest. Plant and Soil 305: 35-47

CHAPTER 7 CONCLUSIONS
CHAPTER 7 CONCLUSIONS


CHAPTER 7 CONCLUSIONS
73
CONCLUSIONS
Various reasons exist for enforcing reforestation in the tropics. In the past, land has been
reforested mainly for wood production, to reduce erosion, sustain soil fertility, improve
quality and quantity of water supply, and for socioeconomic and conservation benefits.
Recently reforestation has gained value through carbon sequestration as a potential measure to
mitigate climate change. One major concern is that tree planting results in a strongly reduced
streamflow after reforesting deforested land. Hence reforestation can be critical in regions
where water resources are at least seasonally scarce and demand for water for other purposes
is high. Well-designed forest plantations are frequently said to positively influence the
hydrological cycle by high infiltration and groundwater recharge during the wet season with a
gradual release of water during the dry season.
This dissertation presented three studies on water use characteristics of trees growing in
different forest management systems and at different locations in the tropics. Being separate
studies each of them had their specific research objectives and placed different emphases
when looking into species specific tree water use or water use on plot level. Despite this,
some overall conclusions can be drawn which are of importance when discussing the options
to control water use from tree plantations or other man made forest stands by means of
species selection and species combination. The specific regional management goals will
define silvicultural practices to promote best possible tree growth, land cover protection,
conservation of biodiversity or water resource restoration. The functioning of these artificial
forests will largely depend on the tree species planted.
The commonly found water use and diameter relation was present in all study sites and land
use systems, but was not as strong as the reported relation in natural forests. The observed tree
species show the tendency to differ in daily tree water uses in the same diameter class and
considerable scatter was present around the fitted curve with species located on distinct
trajectories. At a given diameter, up to twofold differences between trees of different species
were observed. Species selection might thus indeed be an effective tool to control water use in
reforestation and agroforestry. Under seasonal climate the difference was even more
pronounced when dry season values were considered. The strong differences of species under
seasonal climate were mostly due to specific differences in leaf phenology and had a large

CHAPTER 7 CONCLUSIONS
74
influence on the annual course of tree water use and tree transpiration. Leaf phenological and
water use differences may go along with different rooting patterns and soil water uptake
depths.
The results from this study are confirming the findings of other multispecies reforestation
experiments, which are pointing out that tropical plantations containing higher tree diversity
are likely to be more productive than the average monospecific stand. The mixed species plots
attained higher basal area and hence had a higher yield than monocultures. Accordingly,
mixed species plantations were using a higher amount of water than monocultures.
Nevertheless mixed species plots have enhanced water use rates per unit basal area compared
to monocultures. However, significant higher water use rates were only observed during the
wet season when the amount of rainfall was higher than the evaporative demand and high
rates of surface run off may occur. In the dry season when soil water resources were limited,
mean daily transpiration rates of the mixed species plots did not significantly increase
compared to monocultures. The enhanced wet season water use in mixed plantations may not
be evaluated negative because water is highly available anyways. The strong effects of tree
diversity on plot level transpiration, basal area and water use per unit basal area were due to
complementary use of resources. Differences in stand structural characteristics such as
improved three-dimensional crown and root differentiation and canopy roughness must be
responsible for the enhanced transpiration rates in the mixtures.
As overall conclusion it can be said that water use- and transpiration rates found in trees of
tropical reforestation and agroforestry stands showed considerable variation across species.
Under seasonal climate tree phenology can be an important tool to slow down transpiration
rates during periods of water limitation. The establishment of mixed species plantations
enhances the performance of tree growth and transpiration. Tree species selection and
combination can be used to optimize the balance between wood production or carbon
sequestration and the use of water resources. It is beyond question that mixed species
plantations are more productive in biomass accumulation and can help to conserve
biodiversity.

REFERENCES
75
REFERENCES
Abraham, M., 2004. Spatial variation in soil organic carbon and stable isotope signature in a
pasture and a primary forest in Central Panama. Masters Thesis, University of McGill,
Montréal.
ANAM, 2008. Plan Nacional de Desarrollo Forestal: Modelo forestal sostenible. Dirección de
Gestión Integrada de Cuencas Hidrográficas, Departamento de Desarrollo y Manejo
Forestal. Autoridad Nacional del Ambiente. República de Panamá. p 24.
Andrade, J.L., Meinzer, F.C., Goldstein, G., Schnitzer, S.A., 2005. Water uptake and transport
in lianas and co-occurring trees of a seasonally dry tropical forest. Trees 19, 282-289.
Baldocchi, D.D., 2005. The role of bidodiversity on the evaporation of forests. In Scherer-
Lorenzen, M., Körner, C., Schulze, E.D. (Eds), Forest diversity and function.
Temperate and boreal systems. Ecological Studies 176. Springer Verlag, Berlin
Heidelberg, pp.131-148.
Baldocchi, D.D., Xu, L., 2007. What limits evaporation from Mediterranean oak woodlands –
The supply of moisture in the soil, physiological control by plants or the demand by
atmosphere? Adv. Water Res. 30, 2113-2122.
Balvanera, P., Pfisterer, A.B., Buchmann, N., He, J.S., Nakashizuka, T., Raffaelli, D.,
Schmid, B., 2006. Quantifying the evidence for biodiversity effects on ecosystem
functioning and services. Ecol. Lett. 9, 1146–1156.
Bauhus, J., van Winden, A.P., Nicotra, A.B., 2004. Aboveground interactions and
productivity in mixed-species plantations of Acacia mearnsii and Eucalyptus globulus
Can. J. For. Res. 34, 686–694.
Becker, P. 1996. Sap flow in Bornean heath and dipterocarp forest trees during wet and dry
periods. Tree Physiology 16: 295-299.
Bristow, M., Vanclay, J.K, Brooks, L., Hunt, M., 2006. Growth and species interactions of
Eucalyptus pellita in a mixed and monoculture plantation in the humid tropics of north
Queensland Forest Ecology and Management 233, 285–294.
Bruijnzeel, L.A., 1997. Hydrology of forest plantations in the tropics. In: Nambiar, E.K.S. and
Brown, A.G. (Eds). Management of Soils, Nutrients and Water in Tropical Plantation
Forests. ACIAR Canberra, Australia, pp. 125-167.
Calder, I., Amezaga, J., Aylward, B., Bosch, J., Fuller, L., 2004. Forest and water policies: the
need to reconcile public and science conceptions. Geologica Acta, 2, 157–166.

REFERENCES
76
Caldeira, M.C., Ryel, R.J., Lawton, J.H., Pereira, J.S., 2001. Mechanisms of positive
biodiversity-production relationships: insights provided by delta C-13 analysis in
experimental mediterranean grassland plots. Ecol. Lett. 4 , 439–443.
Caspersen, J.P., Pacala, S.W., 2001. Successional diversity and forest ecosystem function.
Ecological Research 16, 895-903.
Cienciala, E., Kucera, J., Malmer, A., 2000. Tree sap flow and stand transpiration of two
Acacia mangium plantations in Sabah, Borneo. J. Hydrol. 236, 109-120.
Cintron, B. B., 1990. Cedrela odorata L. Cedro hembra, Spanish cedar. In: Burns, R. M.,
Honkala, B. H. (Eds.), Silvics of North America: 2. Hardwoods. Agricultural.
Handbook. 654. U.S. Department of Agriculture, Forest Service, Washington, DC, pp.
250-257.
Clearwater, J.S.A., M., Meinzer, F.C., Goldstein, G., 2002. Heat dissipation sensors of
variable length for measurement of sap flow in trees with deep sapwood. Tree Physiol.
22, 277-283.
Coll, L., Potvin, C., Messier, C., Delagrange, S., 2008. Root architecture and allocation
patterns of eight native tropical species with different successional status used in open-
grown mixed plantations in Panama. Trees 22, 585-596.
Cunningham, S.A., Kimberi, R.P., Colloff, M.J., 2009. Whole-tree sap flow is substantially
diminished by leaf herbivory. Oecologia 158, 633–640.
De Boeck, H.J., Lemmens, C.M.H.M., Bossuyt, H., Malchair, S., Carnol, M., Merckx, R.,
Nijs, I., Ceulemans, R., 2006. How do climate warming and plant species richness
affect water use in experimental grasslands? Plant Soil 288, 246–261.
da Silva, E.V., de Moraes Gonçalves, J.L., de Freitas Coelho, S.R., Moreira e Moreira, R., de
Miranda Mello, S.L., Bouillet, J.P., Jourdan, C., Laclau, J.P., 2009. Dynamics of fine
root distribution after establishment of monospecific and mixed-species plantations of
Eucalyptus grandis and Acacia mangium. Plant Soil 325, 305–318.
Dierick, D., Hölscher, D., 2009. Species-specific tree water use characteristics in reforestation
stands in the Philippines. Agricultural and Forest Meteorology 149, 1317-1326.
Dietrich, W.E., Windsor, M.D., Dunne, T., 1996. Geology, Climate and Hydrology of Barro
Colorado Island. In: Leigh, E.G. Jr., Rand, A.S., Windsor, D.M. (Eds.), The Ecology of
a Tropical Forest. Seasonal Rhythms and Annual Changes. Second edition.
Smithsonian Institution Press, Washington DC, pp. 21-46.
.

REFERENCES
77
Dünisch, O., Morais, R.R., 2002. Regulation of xylem sap flow in an evergreen, a semi-
deciduous, and a deciduous Meliaceae species from the Amazon. Trees-Structure and
Function 16, 404-416.
Edwards, W.R.N., Becker, P., Cermák, J., 1996. A unified nomenclature for sap flow
measurements. Tree Physiol. 17, 65–67.
Fargione, J., Tilman, D., Dybzinski, R., Lambers, J.H.R., Clark, C., Harpole, W.S., Knops,
J.M.H., Reich, P.B., Loreau, M., 2007. From selection to complementarity: shifts in the
causes of biodiversity–productivity relationships in a long-term biodiversity
experiment. Proceedings Royal Society Biology 274, 871–876.
Farley, K.A., E.G. Jobbagy, Jackson, R.B., 2005. Effects of afforestation on water yield: a
global synthesis with implications for policy. Global Change Biology 11, 1565-1576.
Fetene, M., Beck, E.H., 2004. Water relations of indigenous versus exotic tree species,
growing at the same site in a tropical montane forest in southern Ethiopia. Trees 18,
428-435.
Fölster, H., Khanna, P.K., 1997. Dynamics of nutrient supply in plantation soils. In Nambiar,
E.K.S., Brown, A.G., (eds.). Management of soil, nutrients and water in tropical
plantation forests. ACIAR/CSIRO/CIFOR, Canberra, 338-378.
Flores, E.M., 2003. Terminalia amazonia (J.F. Gmel. ) Exell. In: Vozzo, J.A. (Ed.), Tropical
Tree Seed Manual. Part II-Species Descriptions. United States Department of
Agriculture. Forest Service. Agriculture Handbook 721. Washington DC, pp. 748-751.
Flores, E.M., Marín, W.A., 2003. Tabebuia rosea (Bertol.) DC. In: Vozzo, J.A. (Ed.),
Tropical Tree Seed Manual. Part II-Species Descriptions. United States Department of
Agriculture. Forest Service. Agriculture Handbook 721. Washington DC, pp. 737-739.
Forrester, D.I., Bauhus, J., Khanna, P.K., 2004. Growth dynamics in a mixedspecies
plantation of Eucalyptus globulus and Acacia mearnsii. For. Ecol. Manage. 193, 81–95.
Fournier, L.A., 2003a. Anacardium excelsum (Bertero & Balb. ex Kunth) Skeels. In: Vozzo,
J.A. (Ed.), Tropical Tree Seed Manual. Part II-Species Descriptions. United States
Department of Agriculture. Forest Service. Agriculture Handbook 721. Washington
DC, pp. 294-296.
Fournier, L.A., 2003b. Luehea seemannii Triana & Planch. In: Vozzo, J.A. (Ed.), Tropical
Tree Seed Manual. Part II-Species Descriptions. United States Department of
Agriculture. Forest Service. Agriculture Handbook 721. Washington DC, pp. 553-554.

REFERENCES
78
Francis, J.K., 1990. Hura crepitans L. Sandbox, molinillo, jabillo. Euphorbiaceae. Spurge
family. USDA Forest Service, Southern Forest Experiment Station, Institute of Tropical
Forestry. SO-ITF-SM; 38, New Orleans, LA, USA.
Francis, J.K., 2003a. Acacia mangium Willd. In: Vozzo, J.A. (Ed.), Tropical Tree Seed
Manual. Part II-Species Descriptions. United States Department of Agriculture. Forest
Service. Agriculture Handbook 721. Washington DC, pp. 256-258.
Francis, J.K., 2003b. Tectona grandis L.f. In: Vozzo, J.A. (Ed.), Tropical Tree Seed Manual.
Part II-Species Descriptions. United States Department of Agriculture. Forest Service.
Agriculture Handbook 721. Washington DC, pp. 745-747.
Giambelluca, T.W., Ziegler, A.D., Nullet, M.A., Truong, D.M., Tran, L.T., 2003.
Transpiration in a small tropical forest patch. Agricultural and Forest Meteorology 117:
1-22.
Garcia Santos, G., 2007. An ecohydrological and soils study in a montane cloud forest in the
National Park of Garajonay, La Gomera (Canary Islands, Spain). Dissertation, Vrije
Universiteit Amsterdam, The Netherlands.
Goldstein, G., Andrade, J.L., Meinzer, F.C., Holbrook, N.M., Cavalier, J., Jackson, P., Celis,
A., 1998. Stem water storage and diurnal patterns of water use in tropical forest canopy
trees. Plant Cell Environ. 21, 397-406.
Gradstein, S.R., Kessler, M., Pitopang, R., 2007. Tree species diversity relative to human land
use in tropical rain forest margins in Central Sulawesi. In: Tscharnke, T., Leuschner, C.,
Guhardja, E., Zeller, M. (Eds). The Stability of Tropical Rainforest Margins: Linking
Ecological, Economic and Social Constraints of Land Use and Conservation. Springer,
Berlin, p. 321-334.
Granier, A., 1985. A new method of sap flow measurement in tree stems. Ann. For. Sci. 42,
193-200.
Granier, A., 1987. Evaluation of transpiration in a Douglas-fir stand by means of sap flow
measurements. Tree Physiol. 3, 309-320.
Granier, A., Huc, R., Barigah, S.T., 1996. Transpiration of natural rain forest and its
dependence on climatic factors. Agricultural and Forest Meteorology 78, 19-29.
Granier, A., Loustau, D., Bréda, N., 2000. A generic model of forest canopy conductance
dependent on climate, soil water availability and leaf area index. Annals of Forest
Science, 57, 755-765.

REFERENCES
79
Gross, K., Cardinale, B.J., 2007. Does species richness drive community production or vice
versa? Reconciling historical and contemporary paradigms in competitive communities.
The American Naturalist, 170, 207–220.
Harris, P.P., Huntingford, C., Cox, P.M., Gash, J.H.C., Malhi, Y., 2004. Effects of soil
moisture on canopy conductance of Amazonian rainforest. Agricultural and Forest
Meteorology 122: 215-227.
Hatton. T.J., Catchpole, E.A., Vertessy, R.A., 1990. Integration of sapflow velocity to
estimate plant water-use. Tree Physiology 6: 201-209.
Healy, C., Gotelli, N.J., Potvin, C., 2008. Partitioning the effects of biodiversity and
environmental heterogeneity for productivity and mortality in a tropical tree plantation.
Journal of Ecology 96, 903–913.
Herbst, M., Eschenbah, C., Kappen, L., 1999. Water use in neighbouring stands of beech
(Fagus sylvatica L.) and black alder (Alnus glutinosa (L.) Gaertn.). Annals of Forest
Science, 56, 107-120.
Hölscher, D., Koch, O., Korn, S., Leuschner, Ch., 2005. Sap flux of five co-occurring tree
species in a temperate broad-leaved forest during seasonal soil drought. Trees 19, 628-
637.
Holdridge, L.R., Budowski, G., 1956. Report on an ecological survey of the Republic of
Panama. The Caribbean Forester 17, 92-109.
Jackson, P.C., Cavelier, J., Goldstein, G., Meinzer, F.C., Holbrook, N.M., 1995. Partitioning
of water resources among plants of a lowland tropical forest. Oecologia 101, 197-203.
Jackson, B.J., Jobbagy, E.G., Avissar, R., Roy, S.B., Barrett, D.J., Cook, C.W., Farley, K.A.,
le Maitre, D.C., McCarl, B.A., Murray, B.C., 2005. Trading water for carbon with
biological carbon sequestration. Science 310, 1944-1947.
Jarvis, P.G., 1976. The interpretation of the variations in leaf water potential and stomatal
conductance found in canopies in the field. Philosophical Transactions of the Royal
Society of London: Series B Biological Sciences, 273, 593-610.
Kaimowitz, D., 2005. Useful myths and intractable truths: the politics of the link between
forests and water in Central America. In eds: Bonell, M., Bruijnzeel, L.A., Forest–
Water–People in the Humid Tropics. Cambridge University Press, Cambridge, UK. pp.
86–98.

REFERENCES
80
Kelliher, F.M., Leuning, R., Schulze, E.D., 1993. Evaporation and canopy characteristics of
coniferous forests and grasslands. Oecologia 95, 153–163.
Kelty, M.J., 1992. Comparative productivity of monocultures and mixed-species stands. In
M.J. Kelty, B.C. Larson & C.D. Oliver (eds.). The ecology and silviculture of mixed-
species forests. Kluwer Academic Publishers, Dordrecht, Boston, London, 125-141.
Kijkar, S., 2003. Gmelina arborea Roxb. In: Vozzo, J.A. (Ed.), Tropical Tree Seed Manual.
Part II-Species Descriptions. United States Department of Agriculture. Forest Service.
Agriculture Handbook 721. Washington DC, pp. 476-478.
Köhler, M., Dierick, D., Schwendennman, L., Hölscher, D., 2009. Water use characteristics of
cacao and Gliricidia trees in an agroforest in Central Sulawesi, Indonesia.
Ecohydrology 2, 520- 529.
Kunert, N., Schwendenmann, L., Hölscher, D., 2010. Seasonal dynamics of tree sap flux and
water use in nine species in Panamanian forest plantations. Agricultural and Forest
Meteorology 150, 411-419.
Laclau, J.-P., Bouillet, J.-P., Goncçalves, J.L.M., Silva, E.V., Jourdan, C., Cunha, M.C.S,
Moreira, M.R., Saint-André, L. , Maquère, V., Nouvellon, Y., Ranger, J., 2008. Mixed-
species plantations of Acacia mangium and Eucalyptus grandis in Brazil 1. Growth
dynamics and aboveground net primary production. Forest Ecology and Management
255, 3905–3917.
Lamb, D., Erskine, P.D., Parrotta, J.A., 2005. Restoration of degraded tropical forest
landscapes. Science 310, 1628-1632.
Langenberger, G., 2006. Habitat distribution of dipterocarp species in the Leyte Cordillera: an
indicator for species-site suitability in local reforestation programs. Annals of Forest
Science, 63, 149-156.
Leigh, E.G., Rand, A.S., Windsor, D.W., 1996. The ecology of a tropical forest, 2nd edn,
Smithsonian Press, Washington, DC.
Loreau, M., Hector, A., 2001. Partitioning selection and complementarity in biodiversity
experiments. Nature, 412, 72–76.
Lüttge, U., Berg, A., Fetene, M., Nauke, P., Peter, D., Beck, E., 2003. Comparative
characterization of photosynthetic performance and water relations of native trees and
exotic plantation trees in an Ethiopian forest. Trees 17, 40-50.

REFERENCES
81
Ma, L., Lu, P., Zhao, P., Roa, X.-Q., Cai, X.A., Zeng, X.P., 2008. Diurnal, daily seasonal and
annual patterns of sap-flux-scaled transpiration from an Acacia mangium plantation in
South China. Ann. For. Sci. 65, 402p1-402p9.
Malmer, A., Murdiyarso, D., Bruijnzeel, L.A., Ilstedt, U., 2010. Carbon sequestration in
tropical forests and water: a critical look at the basis for commonly used
generalizations. Global Change Biology 16, 599–604.
Margraf, J., Milan, P.P., 1996. Ecology of dipterocarp forests and its relevance for island
rehabilitation in Leyte, Philippines. In: Schulte, A., Schöne, D. (Eds.), Dipterocarp
Forest Ecosystems: Towards Sustainable Management. World Scientific, Singapore, p.
124-154.
McJannet, D., Fitch, P., Disher, M., Wallace, J., 2007. Measurements of transpiration in four
tropical rainforest types of north Queensland, Australia. Hydrol. Process. 21, 3549-
3564.
Meinzer, F.C., Andrade, J.L, Goldstein, G., Holbrook, N.M., Cavelier, J., Jackson, P., 1997.
Control of transpiration from the upper canopy of a tropical forest, the role of stomatal,
boundary layer and hydraulic architecture components. Plant, Cell and Environ. 20,
1242-1252.
Meinzer, F.C., Andrade, J.L., Goldstein, G., Holbrook, N.M. Cavelier, J. Wright, S.J., 1999.
Partitioning of soil water among canopy trees in a seasonally dry tropical forest.
Oecologia 121, 293–301.
Meinzer, F.C., G. Goldstein & J.L. Andrade, 2001. Regulation of water flux through tropical
forest canopy trees: Do universal rules apply? Tree Physiology 21, 19-26.
Meinzer, F.C., 2003. Functional convergence in plant responses to the environment.
Oecologia 134, 1-11.
Meinzer, F.C., James, S.A., Goldstein, G., 2004. Dynamics of transpiration, sap flow and use
of stored water in tropical forest canopy trees. Tree Physiology 24, 901-909.
Meinzer, F.C., Bond, B.J., Warren, J.M., Woodruff, D.R., 2005. Does water transport scale
universally with tree size? Functional Ecology 19, 558-565.
Meinzer, F.C., Andrade, J.L., Goldstein, G., Holbrook, N.M., Cavelier, J., Wright, S.J., 1999.
Partitioning of soil water among canopy trees in a seasonally dry tropical forest.
Oecologia 21, 293-301.

REFERENCES
82
Menalled, F.D., Kelty, M.J., Ewel, J.J., 1998. Canopy development in tropical tree
plantations: a comparison of species mixtures and monocultures. Forest Ecology and
Management 104, 249-263.
Montagnini 2000 Montagnini, F., 2000. Accumulation in aboveground biomass and soil
storage of mineral nutrients in pure and mixed plantations in a humid tropical lowland.
Forest Ecology and Management 134, 257-270.
Montagnini, F., Jordan, C.F., 2005. Tropical Forest Ecology. Springer Verlag, Heidelberg.
Motzer, T., Munz, N., Küppers, M., Schmitt, D., Anhuf, D., 2005. Stomatal conductance,
transpiration and sap flow of tropical montane rain forest trees in the southern
Ecuadorian Andes. Tree Physiology 25, 1283-1293.
O`Brien, J.J., Oberbauer, S.F., Clark, D.B., 2004. Whole tree xylem sap flow responses to
multiple environmental variables in a wet tropical forest. Plant, Cell and Environment
27, 551-567.
O’Grady, A.P., Eamus, D., Hutley, L.B., 1999. Transpiration increases during dry season,
patterns of tree water use in eucalypt open-forests of northern Australia. Tree Physiol.
19, 591-597.
Oren, R., Pataki, D.E., 2001. Transpiration in response to variation in microclimate and soil
moisture in southeastern deciduous forests. Oecologia 127, 549-559.
Orians, G.H., R. Dirzo & J.H. Cushman, 1996. Biodiversity and Ecosystem Processes in
Tropical Forests. Ecological Studies 122. Springer Berlin.
PAGASA, 2007. Philippine Atmospheric, Geophysical and Astronomical Services
Administration, Philippines, available from http://www.pagasa.dost.gov.ph (last visited:
20/08/2009).
Petit, B., Montagnini, F., 2004. Growth equations and rotation ages of ten native tree species
in mixed and pure plantations in the humid neotropics. Forest Ecology and
Management 199, 243-257.
Piotto, D., 2008. A meta-analysis comparing tree growth in monocultures and mixed
plantations. Forest Ecology and Management, 255, 781-786.
Phillips, N., Oren, R., Zimmermann, R., Wright, S.J., 1999.Temporal patterns of water flux in
trees and lianas in Panamanian moist forest. Trees 14, 116-123.
Potvin, C., Whidden, E., Moore, T., 2004. A case study of carbon pools under three different
land-uses in Panama. Climate Change 67, 291-307.

REFERENCES
83
Potvin, C., Tschakert, P., Lebel, F., Kirby, K., Barrios, H., Bocariza, J., Caisamo, J., Caisama, L.,
Cansari, C., Casamá, J., Casamá, M., Chamorra, L., Dumasa, N., Goldenberg, S., Guainora,
V., Hayes, P., Moore, T., Ruíz, J., 2007. A participatory approach to the establishment of
a baseline scenario for a reforestation CDM project. Mitigation and Adaptation Strategies
for Global Change 12(8): 1341-1362.
Potvin, C., Gotelli, N.J., 2008. Biodiversity enhances individual performance but does not
affect survivorship in tropical trees. Ecolo. Lett. 11, 217–223.
Potvin, C., Dutilleul, P., 2009. Neighborhood effects and size-symmetric competition in a tree
plantation varying in diversity. Ecology 90, 321–327.
Price, G. R., 1996. The nature of selection. J. Theor. Biol. 175, 389-396.
Scherer-Lorenzen M, Körner C, Schulze E-D. 2005. The functional significance of forest
diversity: a synthesis. In: Forest diversity and function. Temperate and boreal Systems.
Ecological Studies, Vol. 176, Scherer-Lorenzen M, Körner C, Schulze E-D (eds);
Springer: Berlin; 377–389.
R Development Core Team (2008) R: A language and environment for statistical computing.
R Foundation for Statistical Computing, Vienna, Austria, ISBN 3-900051-07-
0,http://www.R-project.org (last visited 28/05/2009)
Rocas, A.N., 2003. Cedrela odorata L. In: Vozzo, J.A. (Ed.), Tropical Tree Seed Manual.
Part II-Species Descriptions. United States Department of Agriculture. Forest Service.
Agriculture Handbook 721. Washington DC, pp. 386-389.
Röhle, H., 1986. Vergleichende Untersuchungen zur Ermittlung der Genauigkeit bei der
Ablotung von Kronenradien mit dem Dachlot und durch senkrechtes Anvisieren des
Kronenrandes, Forstarchiv 57, 67–71.
Rothe, A., Binkley, D., 2001. Nutritional interactions in mixed species forests: a synthesis.
Canadian Journal of Forest Research 31, 1855-1870.
Scherer-Lorenzen, M., Bonilla, L.B., Potvin, C., 2007.Tree species richness affects litter
production and decomposition rates in a tropical biodiversity experiment. Oikos 116,
2108-2124.
Schorcht, M., 2000. Tectona grandis. In: Schütt, P., Schuck, H.J., Lang, U., Rollof,A. (Eds.),
Enzykloppädie der Holzgewächse. Handbuch und Atlas der Dendrologie. Ecomed
Verlagsgesellschaft, Landsberg.

REFERENCES
84
Schulze, E.-D., Bazzaz, F.A., Nadelhoffer, K.J., Koike, T., Takatsuki, S., 1996. Biodiversity
and ecosystem function of temperate deciduous broad-leaved forests. In H.A. Mooney,
J.H. Cushman, E. Medina, O.E. Sala & E.-D. Schulze (eds.). Functional roles of
biodiversity: a global perspective. John Wiley & Sons, Chichester, New York,
Brisbane, 71-98.
Scott, D.F., Bruijnzeel, L.A., Mackensen, J., 2004. The hydrological and soil impacts of
forestation in the tropics. In M. Bonnell, & L.A. Bruijnzeel (eds). Forests, Water &
People in the Humid Tropics. Cambridge University Press, Cambridge, 622-651.
Stocker, R., Körner, C., Schmid, B., Niklaus, P.A., Leadley, P.W., 1999. A field study of the
effects of elevated Co2 and plant species diversity on ecosystem-level gas exchange in
a planted calcareous grassland. Glob. Chang. Biol. 5, 95–105.
STRI, 2009. Temperature and rainfall data Barro Colorado Island, Panama 1987-2007.Online.
http,//striweb.si.edu/esp/meta_data/details_bci_temp1.html
van Dijk. A.I.J.M., Keenan, R.J., 2007. Planted forests and water in perspective. Forest
Ecology and Management 251, 1–9.
Van Peer, L., Nijs, I., Reheul, D., De Cauwer, B., 2004. Species richness and susceptibility to
heat and drought extremes in synthesized grassland ecosystems: compositional vs
physiological effects. Funct. Ecol. 18, 769–778.
Veldkamp, E., O'Brien, J. J., 2000. Calibration of a FDR sensor for humid tropical soils of
volcanic origin. Soil Science Society of America Journal 64(5), 1549-1553.
Van Kanten, R., Vaast, P., 2006. Transpiration of arabica coffee and associated shade tree
species in sub-optimal, low-altitude conditions of Costa Rica. Agroforestry Systems
67: 187-202.
Verheyen K, Bulteel H, Palmborg C, Olivié B, Nijs I, Raes D, Muys B. 2008. Can
complementarity in water use help to explain diversity–productivity relationships in
experimental grassland plots? Oecologia 156: 351-361.
Vosso, J.A., 2003 (Ed.) Tropical Tree Seed Manual: Part II – Species Descriptions. United
States Department of Agriculture. Forest Service. Agriculture Handbook 721.
Washington DC, pp 899.
Whitley, R., Zeppel, M., Armstrong, N., Macinnis-Ng, C., Yunusa, I., Eamus, D., 2008. A
modified Jarvis-Stewart model for predicting stand-scale transpiration of an Australian
native forest. Plant and Soil 305: 35-47.

REFERENCES
85
Wishnie, M.H., Dent, D.H., Mariscal, E., Deago, J., Cedeño, N., Ibarra, D., Condit, R.,
Ashton, P.M.S., 2007.Initial performance and restoration potential of 24 tropical tree
species planted across a precipitation gradient in the Republic of Panama. Forest
Ecology and Management 243, 39-49.
Wolf, S., Eugster, W., Buchmann, N., 2008. Micrometeorological measurements of a
Plantation and adjacent Pasture in Sardinilla, Panama. Field Measurements. ETH
Zurich, Institute of Plant Sciences. Digital media.
Yachi, S., Loreau, M., 2007. Does complementary resource use enhance ecosystem
functioning? A model of light competition in plant communities. Ecol. Lett. 10, 54–
62.

ACKNOWLEDGMENTS
86
ACKNOWLEDGMENTS
This thesis would not have been possible without the help, support, hard work and endless
efforts of many.
First and foremost, I would like to thank my supervisor, Dirk Hölscher, whose
encouragement, guidance and support from the initial to the final level enabled me to develop
an understanding of the subject.
I am heartily thankful to Luitgard Schwendenmann. The research in this thesis would have
taken far longer to complete without her. Luitgard was always there to listen and to give
advice.
My particular gratitude goes to Catherine Potvin for helpful advice during my fieldwork in
Panama and for sharing her insights in the Panamanian way of life.
And I want to thank Eva Siegelkow who helped me to overcome many administrative
challenges and was always prepared to check the references, points and commas in my drafts.
The days would have passed far more slowly without the other PhD students of the
department Mareike Roeder, Diego Dierick, Renz Come, Michael Köhler and Meik Meißner.
Furthermore, I want to thank my colleagues at the field site Fabiene Zeugin, Mirco Plath and
especially Sebastian Wolf (for the meteorological data).
Besides, I would like to thank the Smithsonian Tropical Research Institute for providing us with
a good environment and facilities to complete this project. Especially I want to thank Klaus
Winter for advice, Milton Garcia for technical support and José Monteza for his invaluable
assistance during my field work.
I wish to thank my parents for their love, encouragement and support throughout the years, without
whom I would never have enjoyed so many opportunities
Finally, I want to thank Alida for her love, care and patience.

SUPPORTING DOCUMENTS
87
DECLARATION OF HONOR
I hereby declare that I am the sole author of this dissertation entitled “Tree transpiration in
forest plantations: effects of species, seasonality and diversity (Panama)” and that all
references and data sources used have been acknowledged as such. I further declare that this
work has never been submitted in any form as part of other dissertation procedures.
Göttingen, April 2010
(Norbert Kunert)

SUPPORTING DOCUMENTS
88
CURRICULUM VITAE
Name
Date of birth
Place of birth
Citizenship
Norbert Kunert
29 August 1980
Nürnberg, Germany
German
Education
03/2007 - present Ph.D. in Forest Science and Wood Ecology, Georg-August
Universität, Germany
04/2006 - 02/2007 M.Sc. in Biology, TU-Munich, Germany
10/2005 - 05/2006 M.Sc. in Wood and Forestry Science, TU-Munich, Germany
10/2001 - 04/2006 Diploma in Forestry Science and Resource Management,
TU-Munich, Germany
10/2001 - 02/2005 B.Sc. in Forestry Science, TU-Munich, Germany
09/1991 - 06/2000 Dietrich-Bonhoeffer-Gymnasium, Oberasbach, Germany
09/1987 - 06/1991
07/2000 - 04/2001
Grundschule Altenberg, Oberasbach, Germany
Military Service
Deutsche Bundeswehr (4. GebArtBat 225), Füssen, Germany