Embed Size (px)
Citation preview
SED7, 2011–2035, 2015
Effects of soil depthon the dynamics ofsoil properties in
Northeast Wollega
A. Adugna andA. Abegaz
Title Page
Abstract Introduction
Conclusions References
Tables Figures
J I
J I
Back Close
Full Screen / Esc
Printer-friendly Version
Interactive Discussion
Discussion
Paper
|D
iscussionP
aper|
Discussion
Paper
|D
iscussionP
aper|
Solid Earth Discuss., 7, 2011–2035, 2015www.solid-earth-discuss.net/7/2011/2015/doi:10.5194/sed-7-2011-2015© Author(s) 2015. CC Attribution 3.0 License.
This discussion paper is/has been under review for the journal Solid Earth (SE).Please refer to the corresponding final paper in SE if available.
Effects of soil depth on the dynamics ofselected soil properties among thehighlands resources of NortheastWollega, Ethiopia: are these sign ofdegradation?
A. Adugna1,2 and A. Abegaz1
1Department of Geography and Environmental Studies, Addis Ababa University,Addis Ababa, Ethiopia2Department of Geography and Environmental Studies, Wolaita Sodo University,Addis Ababa, Ethiopia
Received: 27 April 2015 – Accepted: 28 April 2015 – Published: 30 July 2015
Correspondence to: A. Adugna ([email protected])
Published by Copernicus Publications on behalf of the European Geosciences Union.
2011
SED7, 2011–2035, 2015
Effects of soil depthon the dynamics ofsoil properties in
Northeast Wollega
A. Adugna andA. Abegaz
Title Page
Abstract Introduction
Conclusions References
Tables Figures
J I
J I
Back Close
Full Screen / Esc
Printer-friendly Version
Interactive Discussion
Discussion
Paper
|D
iscussionP
aper|
Discussion
Paper
|D
iscussionP
aper|
Abstract
This study was conducted with an aim to analyze the spatial variability of soil proper-ties with depth under four prominent land use patterns viz., forestland, grazing land,cultivated land and bush land of Northeast Wollega. Soil samples were collected fromthe land uses at two depths (0–15 and 15–30 cm) in replicates and totally 40 compos-5
ite soil samples were collected. Statistical analysis revealed significant variation in soilproperties with along the selected land uses. Topsoil layer had significantly greater OM,TN, AP, sand, silt, Mg2+, K+ and Mg2+ concentrations than the subsoil layers. However,clay under all land uses and CEC under bush land and grazing land revealed reversetrends. Organic matter and CEC have stronger correlations with most of soil properties10
in the topsoil than in the subsoil while clay has no significant correlation with selectedsoil properties except with sand fraction in the sampled depths. Hence, the correlationamong the selected soil properties also varies with soil depth. In general, the spatialvariability of soil properties indicates that they were strongly affected by external factors(agricultural treatments and soil management practices) and internal factors (soil type15
and depth).
1 Introduction
In tropical and subtropical highlands, soils are highly weathered, well-drained and lowin the availability of major soil nutrients, especially N and P (USDA, 1999). As theinteraction between natural and anthropogenic management system persists (Assefa20
and van Keulen, 2009), soil undergoes vertical exchange of materials which in turnresulting in physical and chemical changes from surface soil to sub-soils (Brady andWeil, 1999). The reasons for these are addition of organic matter from plant growth tothe top soil, weathering of rocks and minerals, decomposition of organic matter, andtranslocation of soluble components by leaching, which in turn responsible for the dif-25
ferentiation of soil layers (Foth, 1990). Human management system such as frequent
2012
SED7, 2011–2035, 2015
Effects of soil depthon the dynamics ofsoil properties in
Northeast Wollega
A. Adugna andA. Abegaz
Title Page
Abstract Introduction
Conclusions References
Tables Figures
J I
J I
Back Close
Full Screen / Esc
Printer-friendly Version
Interactive Discussion
Discussion
Paper
|D
iscussionP
aper|
Discussion
Paper
|D
iscussionP
aper|
plowing and tillage for the purpose of cultivation, grazing or similar uses also changesthe proportions of many soil properties with changing depths (Ali et al., 1997; McCarthyet al., 2013). Ali et al. (1997) have reported that soil weathering differentials betweenthe soil profiles have caused changes in clay, CEC, organic matter and K. Islam andWeil (2000) stated that tillage mechanically disintegrates soil particles and modifies soil5
conditions for plant growth and intensive leaching, and hastens organic matter decom-position. Sheet erosion and intensive leaching process leads to higher concentration ofclay content and lesser concentration of calcium, magnesium, potassium and sodiumin the subsoil than the topsoil (Adeboye et al., 2011). In Kobamo basin of Nigeria,Abubakar (1997) has studied vertical distribution of soil nutrients along different land10
use types and reported that sand content of both topsoil and subsoil is higher in culti-vated land than the contents in forestland. However, silt and clay fractions are higher inforest land than the contents in cultivated land in both depths. It has also been reportedthat various nutrient elements such as N, P, Ca2+, Mg2+ and K+ showed 3 to 43 % de-clining trend as soil depth increases. Lalisa et al. (2010) also reported that OC, TN15
and TP declined with depth for cereal farm; but these nutrients increased by 48.1, 63.4and 20.4 %, respectively across the depth in the pasture land. Exchangeable cationsdecreased with depth except Ca2+ in wood lots, K+ in homesteads and Na+ in cerealfarms. CEC, however, decreased in all the land uses with depth by about 19 % (Lalisaet al., 2010).20
The associations among the soil properties also vary with the variation of depth. Insurface soil layer, CEC is strongly associated with organic matter than clay (McAlisteret al., 1998). In the subsoil, since there is higher clay and relatively lower OM, CEC wasstrongly correlated with clay than organic matter (Jin et al., 2011). These observationshave supported the thought that soil properties react to depths across the various land25
use types.In the Northeast Wollega, Ethiopia, each year approximately 1.5 % of forestland was
converted to other land covers. In comparison, 85 % of the loss goes to agricultural landthat has been cultivated for years. This change has been linked to tree mortality and
2013
SED7, 2011–2035, 2015
Effects of soil depthon the dynamics ofsoil properties in
Northeast Wollega
A. Adugna andA. Abegaz
Title Page
Abstract Introduction
Conclusions References
Tables Figures
J I
J I
Back Close
Full Screen / Esc
Printer-friendly Version
Interactive Discussion
Discussion
Paper
|D
iscussionP
aper|
Discussion
Paper
|D
iscussionP
aper|
mineral mining. The size of agricultural land expands further, because of uncontrolledfarming and settlement distributions. Also, there is no available study that examinesdynamics of soil properties with depth among resources of highlands at the site. On theother hand, understanding the effects of soil depth on the dynamics of soil propertiesunder different land covers is essential to establishing appropriate management options5
aimed at sustaining soil health and restoring degraded soils in the highlands. Therefore,the objective of this study was to examine the effects of soil depth on some selectedsoil properties and compare them under different land covers.
2 Materials and methods
2.1 Study area10
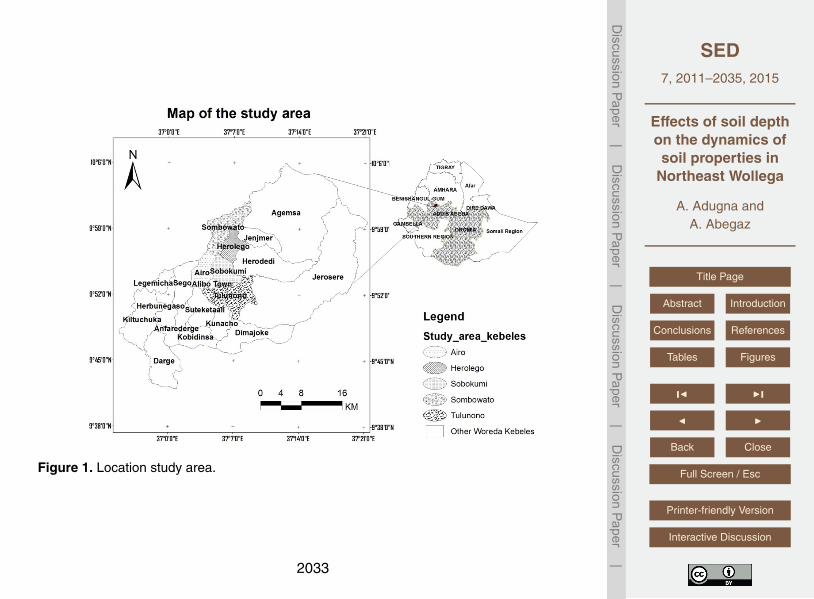
The study area, covering 14 979 ha, is located between 9◦45′ and 10◦00′N and 37◦00′
and 37◦15′ E (Fig. 1). Administratively, the Jarte area belongs to Horo-GuduruWolegazone, Oromia Regional State of Ethiopia. Geologically, the area belongs to the trapseries of tertiary volcanic eruptions (ORLEPB, 2013). Its topography is typical of vol-canic landscapes, which were later deeply incised by streams, resulting in the current15
diversity of landforms. The soils have developed from volcanic ashes and reworkedmaterials resulting from tertiary volcanic eruptions and sedimentation processes (OR-LEPB, 2013). Nitosols are the dominant soil type, mainly on undulating to steep slopes.Relatively flat areas and especially those closer to river valleys, are largely covered bywell-developed Vertisols. As a result of degradation, the soils on steep slopes appear to20
have been downgraded to Regosols and Cambisols. Its altitude ranges between 1800and 2657 m. Mean annual temperatures range between 22 and 28 ◦C. Annual rainfall,which is heavy during the summer months (June–August) ranges between 1750 and2000 mm (EMS, 2013). For 2013, the population of the study area was projected to58 339 of which only 10.09 % was urban population (CSA, 2013). The same document25
reported that the population of the district has increased by 39 % from 1980 to 2013.
2014
SED7, 2011–2035, 2015
Effects of soil depthon the dynamics ofsoil properties in
Northeast Wollega
A. Adugna andA. Abegaz
Title Page
Abstract Introduction
Conclusions References
Tables Figures
J I
J I
Back Close
Full Screen / Esc
Printer-friendly Version
Interactive Discussion
Discussion
Paper
|D
iscussionP
aper|
Discussion
Paper
|D
iscussionP
aper|
Except for a small percentage of the population living in the urban area, the inhabitantsare farmers engaged in mixed crop-livestock farming system.
2.2 Soil sampling
Four adjacent sites were selected in this study from Jarte area, each located withinthe four different land use types, representing forestland, cultivated land, grazing land5
and bush land. Each land use has been divided into five tiles (100m×100m in size).Within each tile four sub-plots were established, each with an area of 100 m2, one inthe center and three on a radial arm with 120◦ angles between them (Vågen et al.,2013). This form of sampling allows the assessment of variability of soil properties atdifferent spatial scales (in our case depth variation among land uses at site level).10
Soil sampling was carried out in February 2014 from each of the four land use types.At every sampling plot, soil samples were collected from five spots (north, south, east,west and center of the plot) within the land use and composite samples were preparedby hand mixing depending on depth strata. Totally, we had 40 composite soil samples.For every land use plots, soil samples were taken at two depths: 0–15 cm (topsoil15
layer) and 15–30 cm (subsoil layer) using soil auger. The two depths are deliberatelychosen for two main reasons. Firstly, the 0–15 cm represents the average plough layerin the area while the 15–30 cm depth is the layer where the clay particles leached fromthe topsoil accumulate. Secondly, samplings at these predetermined depths enhancecomparability of soil properties with depth among the studied land uses.20
2.3 Soil analysis
Soil sample were analyzed following standard procedures as applied to tropical soils(Abubakar, 1997) for particle size distribution, cation exchange capacity (CEC), ex-changeable Na, K, Ca and Mg, total nitrogen (TN), soil organic carbon (OC) and avail-able P at the National Soil Laboratory Centre of the Ministry of Agriculture (MoA), Addis25
Ababa, Ethiopia. Disturbed soil sample were air-dried and grounded to pass through
2015
SED7, 2011–2035, 2015
Effects of soil depthon the dynamics ofsoil properties in
Northeast Wollega
A. Adugna andA. Abegaz
Title Page
Abstract Introduction
Conclusions References
Tables Figures
J I
J I
Back Close
Full Screen / Esc
Printer-friendly Version
Interactive Discussion
Discussion
Paper
|D
iscussionP
aper|
Discussion
Paper
|D
iscussionP
aper|
a 2 mm sieve prior to any laboratory analysis (Boyer, 1972). Black et al. (1965) pro-cedures have been used for particle size analysis (Bouyoucos Hydrometer Method);total nitrogen (following Kjeldhal procedure); and CEC and exchangeable Ca, Mg, Kand Na (by the ammonium acetate at pH 7). Percentage organic carbon was estimatedbased on the Walkey–Black Method (Walkey and Black, 1934) and equivalent % con-5
tent of SOM was determined by multiplying the % OC by the Van Bermmelen factor of1.724 (Thompson and Troeh, 1978). Phosphorous was determined by means of Olsenmethod (Olsen et al., 1954).
2.4 Statistical analysis
The data was organized and entered into Statistical Package for Social Sciences10
(SPSS) software version 20.0 for windows. Independent samples t test was undertaken to test the significance of the effects of soil depth, along with the impact of landuse differences, on the variation of soil textural class, soil PH, available P, soil organicmatter content (%), total Nitrogen (%), CEC Cmolkg−1, and Exchangeable bases (K+,Ca2+, and Mg2+) Cmolkg−1 at the 0.05 level. The independent variable (i.e. soil depth)15
has two groups: topsoil (0–15 cm) and subsoil (15–30 cm). Independent samples t testwas used in this study because the data meet the six different assumptions of inde-pendent t test such as measurement at interval level, two category of independentvariables, independence of observations, absence of outliers, normal distributions ofindependent variable and homogeneity of variance. Bivariate correlation analysis was20
conducted to assess the relationships between the studied soil properties. Variationin soil properties with depth across the land uses were computed by taking the sur-face layer (0–15 cm depth) as reference groups. Hence, for a given soil property, thevariation expresses how much it increased or decreased in percent in relation to thereference group (Eq. 1).25
Rsub % =Q2−Q1
Q1×100 (1)
2016
SED7, 2011–2035, 2015
Effects of soil depthon the dynamics ofsoil properties in
Northeast Wollega
A. Adugna andA. Abegaz
Title Page
Abstract Introduction
Conclusions References
Tables Figures
J I
J I
Back Close
Full Screen / Esc
Printer-friendly Version
Interactive Discussion
Discussion
Paper
|D
iscussionP
aper|
Discussion
Paper
|D
iscussionP
aper|
where, Rsub =Variation in % of soil properties in subsoil layer compared to topsoil prop-ertiesQ1= value of soil property in the surface soil layerQ2= value of soil property in the subsurface soil layer.
3 Results and discussion5
3.1 Variations in soil properties with depth
3.1.1 Particle size distributions
The mean particle size distribution of the top and sub soils corresponds respectively tosandy loam and clay loam on forest lands. It corresponds to clay loam in both top andsub soils of grazing land, while it corresponds to sand and sand loam respectively in top10
and sub soils of bush land, and in both layers of cultivated soils it clearly correspondsto clay (Table 2). The proportion of sand fraction was the highest (73.6 % in the topsoiland 62.8 % in subsoil) under bush land and the lowest (29.6 % in topsoil and 26.8 % insubsoil) under cultivated land (Table 2). Silt and clay fractions, however, showed oppo-site trends. Silt was the highest (32.8 % in topsoil and 28 % in subsoil) under forestland15
and lowest (12.8 % in topsoil and 14.4 % in subsoil) under bush land (Table 2). Claywas the highest (42 %) under cultivated land in topsoil and under grazing land (47.6 %)in the subsoil (Table 2). It was the lowest in both topsoil (13.6 %) and subsoil (22.8 %)under bush land. The highest and the lowest values of respectively sand and clay frac-tions in topsoil of bush land might have been attributed to relatively higher rate of down20
ward erosion or destruction of clay in the top soil (Siddique et al., 2014) and slow rateof weathering process. This land use also described by unstable soil fractions becauseof steeper slope and impact of human and livestock interventions (Table 1). This findingcontradicts with the result of Abubakar’s (1997) study that reported sand content wasthe highest in the cultivated land and the lowest in forestland for both top and sub soils.25
2017
SED7, 2011–2035, 2015
Effects of soil depthon the dynamics ofsoil properties in
Northeast Wollega
A. Adugna andA. Abegaz
Title Page
Abstract Introduction
Conclusions References
Tables Figures
J I
J I
Back Close
Full Screen / Esc
Printer-friendly Version
Interactive Discussion
Discussion
Paper
|D
iscussionP
aper|
Discussion
Paper
|D
iscussionP
aper|
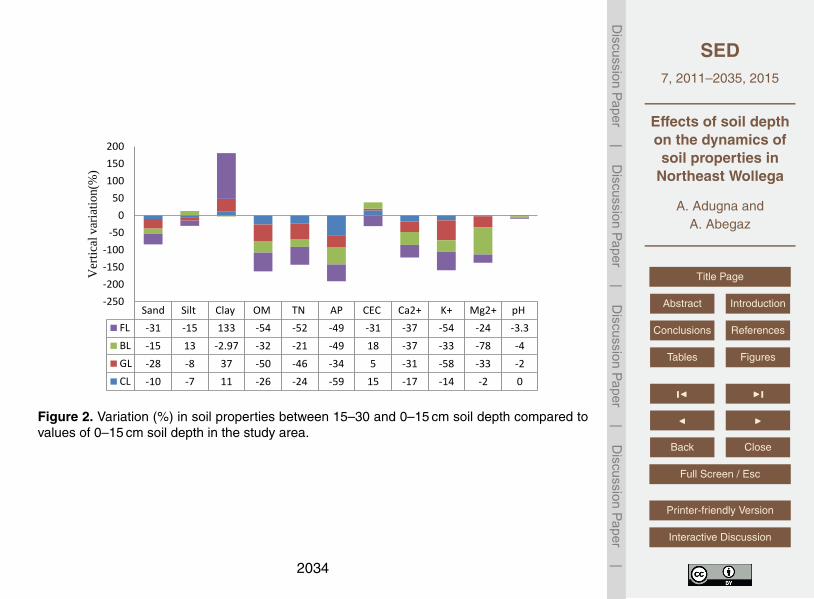
The percentage changes in sand particle size distribution of subsoil from topsoil weredecreasing in all land uses. The change was the highest in forestland (−31 %; P < 0.01)and the lowest in cultivated land (−10 %) (Fig. 2). On the other hand, the percentagechanges in clay particle size distribution of subsoil from topsoil were increasing in allthe four land uses. The change was the highest in forestland (133 %; P < 0.01) and5
the lowest in cultivated land (11 %) (Fig. 2).This finding revealed that soil particle sizedistributions significantly changes between sampling depths in the three land-uses. Thechange is, however, at varying rates. These variations might be caused by variation ofland-covers overlying the surfaces. Studies in Ethiopia (e.g. Belay, 2002; Woldeamlakand Stroonijer, 2003; Eyayu et al., 2009; Asmamaw and Mohammed, 2013) and in10
Nigeria (Abubakar, 1997) on spatial variability of soil properties have shown similarchanges.
3.1.2 Organic matter
OM was the highest (9.0 % in topsoil and 4.2 % in subsoil) under forestland and was thelowest (3.0 % in topsoil and 2.0 % in subsoil) under bush land (Table 2). The percentage15
changes in OM content of subsoil from topsoil were decreasing in all land uses. Thisimplies that the surface soil layer is the most biologically active of the soil profile. Thelitter on the soil surface beneath different canopy layers and high biomass productioncaused high biological activity in the topsoil layer. The change was the highest in forest-land (−54 %; P < 0.01), followed by grazing land (−50 %; P < 0.01), bush land (−32 %;20
P < 0.01) and the lowest in cultivated land (−26 %; P < 0.05) (Fig. 2). The highestchange of OM with depth under forest land might be attributed to continuous accu-mulation of un-decayed and partially decomposed plant and animal residues mainly inthe surface soils of forestland, high rate of interception and infiltration and/or absenceof erosion (Morgan, 2005). However, the decrease of organic matter was gradual in25
cultivate land as compared to other land uses. The possible explanation for this maybe the prevalence of active erosion, decomposition process and disturbances by tillageimplements. Tillage combines different soil layers. It, therefore, results into rapid de-
2018
SED7, 2011–2035, 2015
Effects of soil depthon the dynamics ofsoil properties in
Northeast Wollega
A. Adugna andA. Abegaz
Title Page
Abstract Introduction
Conclusions References
Tables Figures
J I
J I
Back Close
Full Screen / Esc
Printer-friendly Version
Interactive Discussion
Discussion
Paper
|D
iscussionP
aper|
Discussion
Paper
|D
iscussionP
aper|
composition of soil organic matter and reduce the contribution of organic and microbialprocess to nutrient cycling (Yifru and Taye, 2011; Bhuyan et al., 2013).
3.1.3 Total nitrogen (TN)
TN was the highest (0.44 % in topsoil and 0.21 % in subsoil) under forestland and wasthe lowest (0.14 % in topsoil and 0.11 % in subsoil) under bush land (Table 2). Similar5
to organic matter, the percentage changes in TN content of subsoil from topsoil weredecreasing in all land uses. Thus, TN is higher in topsoil than in the subsoil probablybe as a result of losses in organic matter by mineralization in the subsoil. The changewas the highest in forestland (−52 %), followed by grazing land (−46 %), cultivated land(−24 %) and the lowest in bush land (−21 %) (Fig. 2). The change in TN was highest10
under forestland may be because of abundance of legume plants and Azotobacteralgae (able to fix atmospheric nitrogen), decaying plant and animal matter, and nitrogencompounds produced by thunderstorms (Hall, 2008).
The lowest change of TN under cultivated land compared to forestland and grazingland implies that fertilizer applications may not have replaced the total N lost due to15
harvest removal, leaching, and humus losses associated with cultivation (Eyayu et al.,2009). Farmyard manures and organic matter from which TN for crop production syn-thesized and mineralized in cultivated land is also low. In the study area, dung andurine from animals concentrated in stock camps, under trees and near gateways. Asinformed by elders, this system had been used as a method to restock N in the soil20
lost due to crop harvest. Thus, cultivated land often supplied with soluble form of ni-trogen, namely nitrate (NO3), or ammonium (NH4). This could be attained directly byadding fertilizers such as urea, various ammoniums or nitrate salts such as ammoniumnitrate, potassium nitrate, calcium ammonium nitrate or as anhydrous ammonia to beagriculturally productive.25
2019
SED7, 2011–2035, 2015
Effects of soil depthon the dynamics ofsoil properties in
Northeast Wollega
A. Adugna andA. Abegaz
Title Page
Abstract Introduction
Conclusions References
Tables Figures
J I
J I
Back Close
Full Screen / Esc
Printer-friendly Version
Interactive Discussion
Discussion
Paper
|D
iscussionP
aper|
Discussion
Paper
|D
iscussionP
aper|
3.1.4 Available phosphorous (AP)
AP was the highest (3.7 ppm) under cultivated land in the topsoil and under the forest-land (1.84 %) in the subsoil. It was the lowest (1.49 ppm in topsoil and 0.76 ppm insubsoil) under bush land (Table 2). Thus, AP was one of the major nutrients whichexist in low proportions in the study area. It is below the requirements even for the5
low demanding crops. According to Tisdale et al. (1993) plants’ demands to AP varywhere low demanding crops require concentration of P > 8 ppm, moderate-demandingcrops > 14 ppm and crops with high demanding crops > 21 ppm. This was found prob-ably due to the deficiency of the soil to absorb or retain phosphorous since soils of thestudy area are acidic and clayey; its deficiency also attributed to human management10
systems such as deforestation, overgrazing, over cultivation and erosion which in turn,reveals the prevalence of land degradation (McAlister et al., 1998; Brady and Weil,1999).
The percentage changes in AP content of subsoil from topsoil were decreasing in allland uses. The change was the highest in both cultivated and forestland constituting15
−59 % each, followed by bush land (−49 %) and the lowest in grazing land (−34 %)(Fig. 2). Highest decline of AP in cultivated land is most likely to appear due to the sur-face of the cultivated land is continuously supplied with inorganic fertilizer and removedby annual crops. Hence, cultivated land should be supplied with inorganic fertilizer toincrease the concentration of P in the soil solution that required by crops. This finding20
also corroborates the reports of similar and recent studies (Woldeamlak and Stroosni-jder, 2003; Yifru and Taye, 2011).
3.1.5 Cation Exchange Capacity (CEC)
CEC was the highest (32.85 Cmolkg−1) under forestland in topsoil and under grazingland (26.93 Cmolkg−1) in the subsoil and was the lowest (7.37 Cmolkg−1 in topsoil and25
8.68 Cmolkg−1 in subsoil) under bush land (Table 2). The percentage changes in CECcontent of subsoil from topsoil were increasing under forestland (31 %; P < 0.05) and
2020
SED7, 2011–2035, 2015
Effects of soil depthon the dynamics ofsoil properties in
Northeast Wollega
A. Adugna andA. Abegaz
Title Page
Abstract Introduction
Conclusions References
Tables Figures
J I
J I
Back Close
Full Screen / Esc
Printer-friendly Version
Interactive Discussion
Discussion
Paper
|D
iscussionP
aper|
Discussion
Paper
|D
iscussionP
aper|
cultivated land (15 %); however, decreasing under bush land (−18 %) and grazing land(−5 %) (Fig. 2).The changes were the highest under forestland (31 %) and the lowestunder grazing land (−5 %). The topsoil of forestland and cultivated land has higherCEC than subsoil probably because of the presence of higher organic matter on thesurfaces of forestland and AP in the cultivated land use. Thus, CEC of the subsoil5
layer are influenced by OM of the soil (Adeboye et al., 2011). Under grazing land andbush land, however, CEC showed the opposite trend where its content increases andorganic matter declines with depth. The CEC of these land uses in the subsoil maybe influenced by clay content. Thus, the variability of CEC with depth among differentland uses imply the difference in the ability of the soil to hold positively charged ions10
affecting the stability of soil structure, nutrient availability, soil pH and soil’s response tofertilizers (Crewett et al., 2008). This study, therefore, suggests that clay and OM couldbe the main factors that influence CEC in the soil. This finding is also supported byMcAlister et al. (1998) who justified that CEC of soils varies with the changes of claypercentage, the type of clay, soil pH and amount of organic matter.15
3.1.6 Exchangeable basic cations (K+, Ca2+ and Mg2+)
Exchangeable potassium (K+) was the highest (0.14 Cmolkg−1 in topsoil and0.12 Cmolkg−1 in the subsoil) under cultivated land and the lowest (0.03 Cmolkg−1
in topsoil and 0.02 Cmolkg−1 in the subsoil) under bush land (Table 2). The percent-age changes in K+ content of subsoil from topsoil were decreasing in all land uses.20
The change was the highest in grazing land (−58 %) and the lowest in cultivated land(−14 %), while it was intermediate in the forestland (−54 %) and bush land (−33 %)(Fig. 2). The highest content of K+ under cultivated land in both sampled depths maybe related to frequent supply of fertilizers i.e. urea and DAP (up to 100 kgha−1 each)applied to cultivated land. Whereas, the lowest value of K+ in both sampled depths25
under bush land was attributed to high browsing, erosive nature of the soil (sandy soil)and high level erosion (Table 1). In addition, the highest variability of K+ with depthunder grassland may be attributed to cattle manure supplied to the topsoil.
2021
SED7, 2011–2035, 2015
Effects of soil depthon the dynamics ofsoil properties in
Northeast Wollega
A. Adugna andA. Abegaz
Title Page
Abstract Introduction
Conclusions References
Tables Figures
J I
J I
Back Close
Full Screen / Esc
Printer-friendly Version
Interactive Discussion
Discussion
Paper
|D
iscussionP
aper|
Discussion
Paper
|D
iscussionP
aper|
Exchangeable calcium (Ca2+) was the highest (12.81 Cmolkg−1 in topsoil and8.13 Cmolkg−1 in subsoil) under forestland and the lowest (0.54 Cmolkg−1 in topsoiland 0.34 Cmolkg−1 in subsoil) under bush land (Table 2). The percentage changesin Ca2+ content of subsoil from topsoil were decreasing in all land uses. The changewas the highest in forestland and bush land (−37 %) and the lowest in cultivated land5
(−17 %), while it was intermediate in the grazing land (−37 %) (Fig. 2). The highestcontent of Ca2+ in forestland was may be attributed to leaves from plant falls, macrofauna and soil micro flora and microbial activities common in this land use (Table 1).However, under bush and cultivated lands, the opposite trend could be observed.
Exchangeable magnesium (Mg2+) was the highest (4.80 Cmolkg−1 in topsoil and10
3.24 Cmolkg−1 in subsoil) under grazing land and the lowest (0.55 Cmolkg−1 in topsoiland 0.12 Cmolkg−1 in subsoil) under bush land (Table 2). The percentage changes inMg2+ content of subsoil from the topsoil were decreasing in all land uses. The changewas highest (−78 %) in bush land and the lowest (−2 %) in the cultivated land, while itwas intermediate in grazing land (−33 %) and forestland (−24 %) (Fig. 2). In general,15
exchangeable cations show a similar declining pattern in the subsoil from the topsoil.Reasons for such change could be as a result of localized enrichments of cation con-taining minerals of the parent rock (Korkanc et al., 2008). Exchangeable cations couldalso be added by outside sources attributed to human management such as throughfall, plant and animal residues, chemical fertilizers (on cultivated land), animal manures20
and wood ashes (Korkanc et al., 2008). But in the subsoil, their values were declinedprobably due to leaching, decomposition, plant root uptake, runoff and erosion. Thus,the concentrations of basic cations in the soil provide a very good assessment of soilfertility because individual cations are an indication of nutrient status and balance (Sid-dique et al., 2014).25
Unlike Ca2+, Mg2+ and K+, Na+ was not detected from the soil of the study area.Na+ is toxic to many plant species and has a lethal effect on soil structure advancingthe dispersal of aggregates. Hence, soil of the area is not sodium-affected (sodic) soil.
2022
SED7, 2011–2035, 2015
Effects of soil depthon the dynamics ofsoil properties in
Northeast Wollega
A. Adugna andA. Abegaz
Title Page
Abstract Introduction
Conclusions References
Tables Figures
J I
J I
Back Close
Full Screen / Esc
Printer-friendly Version
Interactive Discussion
Discussion
Paper
|D
iscussionP
aper|
Discussion
Paper
|D
iscussionP
aper|
3.2 Relationship between soil properties
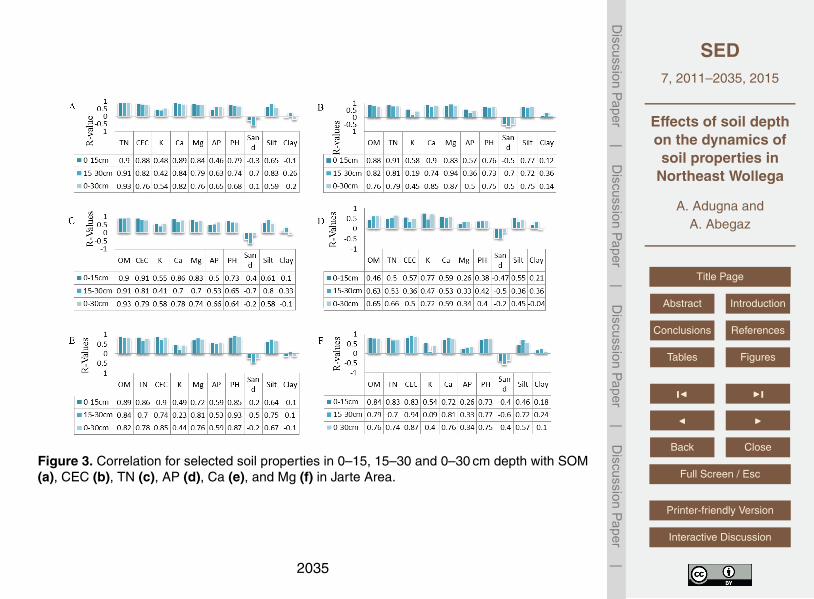
This section offers information on the relationship among the soil properties withdepth. Organic matter was correlated positively significantly with most of soil properties(Fig. 3a) except sand and clay in both sampled depths. It, however, negatively corre-lated with sand and clay. Expectedly, OM was highly positively correlated with TN in the5
sampled depths. It was very highly positively correlated at 0–30 cm (r = 0.93, P < 0.01)followed by subsoil (r = 0.91, P < 0.01) and topsoil (r = 0.90, P < 0.01) (Fig. 3a). It wasvery weakly negatively correlated with clay in topsoil (r = −0.1), but positively in sub-soil (r = 0.26), while at 0–30 cm, it was very weakly negatively correlated with sand(r = −0.01).10
CEC was correlated positively significantly with most of the soil properties at bothsampling depths except sand. It, however, correlated negatively with sand at both sam-pling depths. CEC was very highly positively correlated with Mg2+ (r = 0.94, P < 0.01)in subsoil and with TN (r = 0.91, P < 0.01) in topsoil and 0–30 cm (r = 0.87, P < 0.01)(Fig. 3b). It was very weakly correlated with clay in top soil (r = 0.12), subsoil (r = 0.36)15
and 0–30 cm (r = 0.14) (Fig. 3b). TN was correlated positively significantly with se-lected soil properties except sand in topsoil and subsoil, sand and clay at 0–30 cm.It, however, correlated negatively with sand at both sampling depths. TN was veryhighly positively correlated with OM at 0–30 cm (r = 0.93), subsoil (r = 0.91) and topsoil(r = 0.90) (Fig. 3c). It was correlated very weakly positively with clay in topsoil (r = 0.1)20
and subsoil (r = 0.33), while they were negatively correlated at 0–30 cm (r = −0.1)(Fig. 3c). AP was correlated positively significantly with most of the soil propertiesat both sampling depths. It, however, correlated negatively with sand at both samplingdepths. AP was highly positively correlated with K+ in topsoil (r = 0.77) and 0–30 cm(r = 0.72), and with OM (r = 0.63) in subsoil (Fig. 3d). It was very weakly positively cor-25
related with clay in topsoil (r = 0.21) and subsoil (r = 0.36), while they were negativelycorrelated at 0–30 cm (r = −0.04) (Fig. 3d).
2023
SED7, 2011–2035, 2015
Effects of soil depthon the dynamics ofsoil properties in
Northeast Wollega
A. Adugna andA. Abegaz
Title Page
Abstract Introduction
Conclusions References
Tables Figures
J I
J I
Back Close
Full Screen / Esc
Printer-friendly Version
Interactive Discussion
Discussion
Paper
|D
iscussionP
aper|
Discussion
Paper
|D
iscussionP
aper|
Ca2+ was correlated positively significantly with most of the soil properties at bothsampling depths. It, however, correlated negatively with sand and clay at both sam-pling depths. Ca2+ was very highly positively correlated with CEC (r = 0.90) in topsoil(Fig. 3e). It was very weakly positively correlated with clay in the subsoil (r = 0.01),while they were negatively correlated in topsoil (r = −0.1) and at 0–30 cm depth5
(r = −0.1) (Fig. 3e). Mg2+ was correlated significantly with most of the selected soilproperties at both sampling depths except sand. It, however, correlated negatively withsand and clay at both sampling depths. Mg2+ was highly positively correlated with OM(r = 0.84) in topsoil and very highly with CEC (r = 0.94) in subsoil, while it was highlycorrelated with CEC (r = 0.87) at 0–30 cm (Fig. 3f). Mg2+ was, however, very weakly10
positively correlated with clay at both sampled depths (Fig. 3f).The correlation matrix shows that OM, CEC and Ca2+ are fundamental elements
since they are significantly correlated with most of soil properties (Assefa and vanKeulen, 2009). The negative correlation of most of selected soil properties with clayand sand fraction at both sampling depths may be attributed to the parent materials15
from which sand and clay fractions are formed (Thapa and Yila, 2012). Sandy soilsare loose and course textured; they don’t retain moisture as are formed by the disinte-gration and weathering of rocks such as limestone, granite, quartz and shale (Crewettet al., 2008; Ozcan et al., 2013). The weak correlation between organic matter andclay in the subsoil may be attributed to the opposite pattern in percentage change of20
organic matter (decreasing) and clay (increasing) in subsoil from the topsoil. In the sub-soil, the soil was characterized by poor drainage, high water logging, poor aeration andworkability where crop cultivation could be supported by supplying compost and gyp-sum (FiBL, 2012; Thapa and Yila, 2012).This finding corroborates that of McCarthy’set al. (2013) and McAlister et al. (1998) studies that stated sand and clay are negatively25
correlated with most of soil properties. The finding of our study, however, contradictsthe fact that SOM positively correlated with clay content. FAO (2005, 2006) found thatdecomposition process in the subsoil is slow as a result of bonds between the surfaceof clay particles and organic matter. But, in the study area SOM may be influenced by
2024
SED7, 2011–2035, 2015
Effects of soil depthon the dynamics ofsoil properties in
Northeast Wollega
A. Adugna andA. Abegaz
Title Page
Abstract Introduction
Conclusions References
Tables Figures
J I
J I
Back Close
Full Screen / Esc
Printer-friendly Version
Interactive Discussion
Discussion
Paper
|D
iscussionP
aper|
Discussion
Paper
|D
iscussionP
aper|
repetitive tillage, burning of vegetation and biomass production for agricultural produc-tion than soil texture.
However, it is difficult to generalize and explain on which sampled depths that corre-lation coefficient of selected soil properties would be stronger. Either, it could be safe togeneralize that correlation among selected soil properties vary with depth (Fig. 3a–f).5
For instance, organic matter has stronger correlation with most of soil properties, suchas CEC, Ca2+, Mg2+ and pH in the topsoil than in the subsoil whereas it is strongly cor-related with N, K+ and AP at 0–30 cm. This implies that organic matter is mainly presentin the topsoil layer and subjected to a continuous transformation process. These cir-cumstances could also be revealed in other empirical studies (McAlister et al., 1998;10
McCarthy’s et al., 2013) that revealed the influence of SOM on other physico-chemicalproperties. Similarly, CEC strongly correlated with OM, TN, K, Ca, AP, pH and silt inthe topsoil that subsoil whereas it has stronger correlation with Mg, sand and clay inthe subsoil than topsoil layer (Fig. 4).
3.3 Is spatial variability of soil properties sign of degradation?15
This study suggests that soil is a complex medium which react to environmental pro-cess and conditions being at the interface of the earth and its environment. The pedo-genic processes operating within the natural environments, both top and sub-surfacescan be addition, transformation, transfer and loss of materials within the soil (Ellis andMellor, 1995). Materials added to top-and sub-soil can be locally derived or trans-20
ported from elsewhere. On topsoil it usually takes the form of plant litter and animaldroppings. Local derivations of subsoil, however, comprise plant roots, soil fauna andmicro-organisms. The nature of transported materials also varies with depth. Wind-blown leaves, stem carried by running water, a dead tree falling down a steep slopeor manure added to the soil to assist cultivation are active in topsoil, while transported25
materials appears in solution, or as small particles in water draining laterally throughthe subsoil (Miller and Donahue, 1997). It appears, therefore, there are more additionsof soil materials in the topsoil than subsoil.
2025
SED7, 2011–2035, 2015
Effects of soil depthon the dynamics ofsoil properties in
Northeast Wollega
A. Adugna andA. Abegaz
Title Page
Abstract Introduction
Conclusions References
Tables Figures
J I
J I
Back Close
Full Screen / Esc
Printer-friendly Version
Interactive Discussion
Discussion
Paper
|D
iscussionP
aper|
Discussion
Paper
|D
iscussionP
aper|
Transformation, also known as mineralization, are an important sources of plant nu-trients such as nitrogen and phosphorous, cations such as Ca2+, Mg2+ and K+. It willundergo once materials has been added to a soil by weathering or by the formationof clay minerals. The weatherability of soil minerals are influenced by their chemicalcharacteristics, pH conditions and environmental factors. This process is active un-5
der forestland and responsible for the increment of clay minerals with depth. Materialswithin a soil are transported within soil layers either in solution or suspension. Thisprocess is known as leaching and occurs in a downward, lateral or upward direction.Essential nutrients and cations will gradually be lost via leaching (ground drainage wa-ters), increasing acidity and plant root uptakes. They will be stored in the plants or10
returned to the surface soil via plant litters. Mechanical transfers of soil properties arefaster under cropland and hence lower variability with depth. This may be happeneddue to bioturbation, soil mixing by burrowing animals and human activity. Ploughing(cultivation practices) can typically mix soil to depth of 20–50 cm. On the contrary, bio-turbation effect is lower under forestland where additions are via the surface and ma-15
terials remain for longer time without bioturbation. Transformation, transfer and lossesare highest under cropland than other land-use types. This suggests the prevalence ofsoil degradation as more lands are claimed for crop production.
4 Conclusion
This study shows that selected soil properties vary with depth among different land-use20
types. The variation was highest under forestland and lowest under cropland. OM, TN,AP, K+, Ca2+, Mg2+, sand and silt decrease with depth. Clay increased with depth inall land-uses. CEC increased under forestland and cultivated land, while the oppositetrends were revealed under shrubland and grazing land. Na+ is not available in thesoils of sampled depth among the land-use types. The correlation matrix suggests25
OM, CEC and Ca2+ are fundamental soil properties in both sampled depths. Eventhough clay and sands are formed from different soil-forming parent materials, they
2026

SED7, 2011–2035, 2015
Effects of soil depthon the dynamics ofsoil properties in
Northeast Wollega
A. Adugna andA. Abegaz
Title Page
Abstract Introduction
Conclusions References
Tables Figures
J I
J I
Back Close
Full Screen / Esc
Printer-friendly Version
Interactive Discussion
Discussion
Paper
|D
iscussionP
aper|
Discussion
Paper
|D
iscussionP
aper|
have negative relationship between with most of selected soil properties. This impliesthat the relationship between soils properties are determined by soil-forming processshaped by addition, transformation, transfers and losses processes. These processesproduce soil horizons giving rise to different soil types.
The impact of human activities on soil-forming processes can be direct or indirect, or5
deliberate or unintentional. Vegetation clearance derived by population growth impliesthe greatest indirect human impact on soils. These caused soil degradation via veg-etation removal by felling, burning or grazing of animals. This, in turn, decreased thethickness of litter layers and then speed up leaching processes. Improving soil qualityfor agricultural production, therefore, can be the direct and deliberate influence. Tillage10
is practiced to prepare seed bed, control weeds, increase water infiltration, make fur-rows for drainage and bury crop residues. These are responsible for the transforma-tion, transfer and losses of soil properties under cropland. However, weed control bytillage and hand are still common in the highlands of tropical area. This study, therefore,recommends tillage and crop rotations as improvement of land management. Tillage15
rotation implies deep-plow every few years; less tillage other years. The reasons forrecommending tillage rotation are due to the fact it reduces soil erosion, compactionand stores water in the root zone. Crop rotation should adopt certain crops that couldcontrol weeds than herbicides.
Acknowledgements. The authors wish to thank farmers of the study area who allowed collect-20
ing extensive data from their farms. We are also grateful to National Soil Laboratory Centre ofthe Ministry of Agriculture (MoA), Addis Ababa, Ethiopia.
References
Abubakar, M.: Monitoring land degradation in the semi-arid tropics using an inferential ap-proach: the Kabomo basin case study, Nigeria, Land Degrad. Dev., 8, 311–323, 1997.25
2027
SED7, 2011–2035, 2015
Effects of soil depthon the dynamics ofsoil properties in
Northeast Wollega
A. Adugna andA. Abegaz
Title Page
Abstract Introduction
Conclusions References
Tables Figures
J I
J I
Back Close
Full Screen / Esc
Printer-friendly Version
Interactive Discussion
Discussion
Paper
|D
iscussionP
aper|
Discussion
Paper
|D
iscussionP
aper|
Adeboye, M., Bala, A., Osunde, A., Uzoma, A., Odofin, A., and Lawal, B.: Assessment of soilquality using soil organic carbon and total nitrogen and microbial properties in tropical agro-ecosystems, Journal of Agricultural Science (JAS), 2, 34–40, 2011.
Ali, M. M., Shaheed, S. M., and Kubota, D.: Soil degradation during the period 1967–1995 inBangladesh. II. Selected chemical characteristics, Soil Sci. Plant Nutr., 43, 879–890, 1997.5
Asmamaw, L. and Mohammed, A.: Effects of slope gradient and changes in land use/cover onselected soil physic-biochemical properties of the Gerado catchment, Northeastern Ethiopia,Int. J. Environ. Stud., 70, 111–125, 2013.
Assefa, A. and Van Keulen, H.: Modeling soil nutrient dynamics under alternative farm manage-ment practices in the Northern Highlands of Ethiopia, Soil Till. Res., 103, 203–215, 2009.10
Belay, T.: Land Cover/Land Use Changes in the Derakolli Catchment of the South Wollo Zoneof Amhara Region, Ethiopia, East African social science research review, Organization forSocial Science Research in Eastern and Southern Africa, Addis Ababa, 2002.
Bhuyan, S. I., Tripathi, O. P., and Khan, M. L.: Soil nutrients status in prominent agro-ecosystems of East Siang district, Arunachal Pradesh, Int. J. Environ. Sci. Te., 3, 1957–1968,15
2013.Black, C. A., Evans, D. D., White, J. L., Ensminger, L. E., and Clarkem, F. E.: Methods of Soil
Analysis, Part 2, American Society of Agronomy Inc., New York, WI, 1965.Boyer, J.: Soil potassium, in: Soils of the Humid Tropics, edited by: Drosdoff, M., US National
Academy of Science, Washington, DC, 102–135, 1972.20
Brady, N. C. and Weil, R. R.: The Nature and Properties of Soils, 12th edn., Prentice Hall, NewJersey, 1999.
Crewett, W., Bogale, A., and Korf, B.: Land tenure in Ethiopia: continuity and change, shiftingrulers, and the quest for state control, CAPRI Working Paper 91, International Food PolicyResearch Institute, Washington, DC, 2008.25
CSA: The 2007 Population and Housing Census of Ethiopia, Statistical Summary Report atNational Level, Central Statistical Agency, Addis Ababa, Ethiopia, 2008.
Ellis, E. and Mellor, A.: Soils and Environment, Routledge, London, 1995.Eyayu, M., Heluf, G., Tekalign, M., and Mohammed, A.: Effects of land use change on se-
lected soil properties in the Tara Gedam catchment and adjacent agro-ecosystem, Northwest30
Ethiopia, Ethiopian Journal of Natural Resources (EJNR), 11, 35–65, 2009.
2028
SED7, 2011–2035, 2015
Effects of soil depthon the dynamics ofsoil properties in
Northeast Wollega
A. Adugna andA. Abegaz
Title Page
Abstract Introduction
Conclusions References
Tables Figures
J I
J I
Back Close
Full Screen / Esc
Printer-friendly Version
Interactive Discussion
Discussion
Paper
|D
iscussionP
aper|
Discussion
Paper
|D
iscussionP
aper|
Fantaw, Y. and Abdu, A.: Soil property changes following conversion of acacia woodland intograzing and farmlands in the rift valley area of Ethiopia, Land Degrad. Dev., 22, 425–431,2011.
FAO: The Importance of Soil Organic Matter: Key to Drought-Resistant Soil and SustainedProduction, Food and Agricultural Organization Publication, Rome, 2005.5
FAO: Guidelines for Soil Descriptions, 4th edn., Food and Agricultural Organization Publication,Rome, 2006.
FiBL: African Organic Agriculture Training Manual, version 1.1, edited by: Gilles, W. andKilcher, L., Research Institute of Organic Agriculture FiBL, Frick, 2012.
Foth, D. H.: Fundamentals of Soil Sciences, 8th edn., John Wiley and Sons, New York, 1990.10
Gol, C.: The effects of land use change on soil properties and organic carbon at Dagdami rivercatchment in Turkey, J. Environ. Biol., 30, 825–830, 2009.
Hall, R.: Soil Essentials: Managing your Farm’s Primary Asset, Landlinks Press, Collingwood,2008.
Islam, K. R. and Weil, R. R.: Land use effects on soil quality in a tropical forest ecosystem of15
Bangladesh, Agriculture, Ecosystem and Environment (ELSEVIER), 79, 9–16, 2000.Jin, J. W., Ye, H. C., Xu, Y. F., Shen, C. Y., and Huang, Y. F.: Spatial and temporal patterns of
soil fertility quality and analysis of related factors in urban-rural transition zone of Beijing, Afr.J. Biotechnol., 10, 10948–10956, 2011.
Korkanc, S. Y., Ozyuvaci, N., and Hizal, A.: Impacts of land use conversion on soil properties20
and soil erodiblity, J. Environ. Biol., 29, 363–370, 2008.Lelissa, A., Hager, H., and Sieghardt, M.: Effects of land use types on soil chemical properties
in smallholder farmers of central highland Ethiopia, Ekologia, 29, 1–14, 2010.McAlister, J. J., Smith, B. J., and Sanchez, B.: Forest clearance: impact of land use change on
fertility status of soils from the Sao Francisco Area of Niteroi, Brazil, Land Degrad. Dev., 9,25
425–440, 1998.MacCarthy, D. S., Agyare, W. A., Vlek, L. G., and Adiku, G. K.: Spatial variability of some
soil chemical and physical properties of an agricultural land scape, West African Journal ofapplied Ecology (AJOL), 21, 47–61, 2013.
Miller, R. W. and Donahue, R. L.: Soils in our Environment, 7th edn., Prentice Hall of India, New30
Delhi, 1997.Morgan, P. C.: Soil Erosion and Conservation, 3rd edn., Blackwell Publishing, Malden, 2005.
2029
SED7, 2011–2035, 2015
Effects of soil depthon the dynamics ofsoil properties in
Northeast Wollega
A. Adugna andA. Abegaz
Title Page
Abstract Introduction
Conclusions References
Tables Figures
J I
J I
Back Close
Full Screen / Esc
Printer-friendly Version
Interactive Discussion
Discussion
Paper
|D
iscussionP
aper|
Discussion
Paper
|D
iscussionP
aper|
Olsen, S. R., Cole, C. V., Watanabe, F. S., and Dean, L. A.: Estimation of Available Phos-phorous in Soils by Extraction with Sodium Bicarbonate, USDA, Department of Agriculture,Washington, DC, 1954.
Oromia Rural Land and Environmental Protection (ORLEPB): Dhidhessa Sub Basin ErosionHazard and Land Degradation Assessment, vol. IV, Oromia Water Works Design and Super-5
vision Enterprise (OWWDSE), Addis Ababa, Ethiopia, 2013.Özcan, M., Gökbulak, F., and Hizal, A.: Exclosure effects on recovery of selected soil properties
in a mixed broadleaf forest recreation site, Land Degrad. Dev., 24, 266–276, 2013.Siddique, M. D., Noor-E-Alam, M. M., Islam, M. D., Halim, A., Kamaruzzaman, M. D., Sul-
tana, J., and Karim, D.: Mapping of Site-Specific Soil Spatial Variability by Geostatistical10
Technique for Textural Fractions in a Terrace Soil of Bangladesh, Journal of Bioscience andAgriculture Research (JBAR), 1, 8–16, 2014.
Thapa, G. B. and Yila, O. M.: Farmers’ land management practices and status of agriculturalland in the Jos Plateau, Nigeria, Land Degrad. Dev., 23, 263–277, 2012.
Thompson, L. M. and Troeh, F. R.: Soils and Soil Fertility, MacGraw-Hill, New York, 1978.15
Tisdale, S. L., Nelson, W. L., Beaton, J. D., and Havlin, J. D.: Soil Fertility and Fertilization, 5thedn., Prentice-Hall of India, New Delhi, 1997.
Tsui, C. C., Chen. Z. S., and Hsieh, C. F. Relationships between soil properties and slopeposition in a lowland rain forest of southern Taiwan, Geoderma, 123, 131–142, 2004.
USDA: Soil Taxonomy: a Basic System of Soil Classification for Making and Interpreting Soil20
Surveys, 2nd edn., Agriculture Handbook Number 436, United States Department of Agri-culture, Natural Resources Conservation Section, Washington, DC, 1999.
Vågen, T. G., Winowiecki, L. A., Assefa, A., and Kiros, M.: Landsat-based approaches for map-ping of land degradation prevalence and soil functional properties in Ethiopia, Rem. Sens.Env., 134, 266–275, 2013.25
Walkely, A. and Black, C. A.: An examination of the Degtjareff method for determining soilorganic matter and a proposed modification of the chromic acid titration method, Soil Sci.,37, 29–38, 1934.
Woldeamlak, B. and Stroosnijder, L.: Effects of agro-ecological land succession on soil proper-ties in the Chemoga watershed, Blue Nile Basin, Ethiopia, Geoderma, 111, 85–89, 2003.30
Yifru, A. and Yaye, B.: Effects of land use on soil organic carbon and nitrogen in soils ofBale, Southwestern Ethiopia, Tropical and Subtropical Agroecosystems (TSA), 14, 229–235,2011.
2030
SED7, 2011–2035, 2015
Effects of soil depthon the dynamics ofsoil properties in
Northeast Wollega
A. Adugna andA. Abegaz
Title Page
Abstract Introduction
Conclusions References
Tables Figures
J I
J I
Back Close
Full Screen / Esc
Printer-friendly Version
Interactive Discussion
Discussion
Paper
|D
iscussionP
aper|
Discussion
Paper
|D
iscussionP
aper|
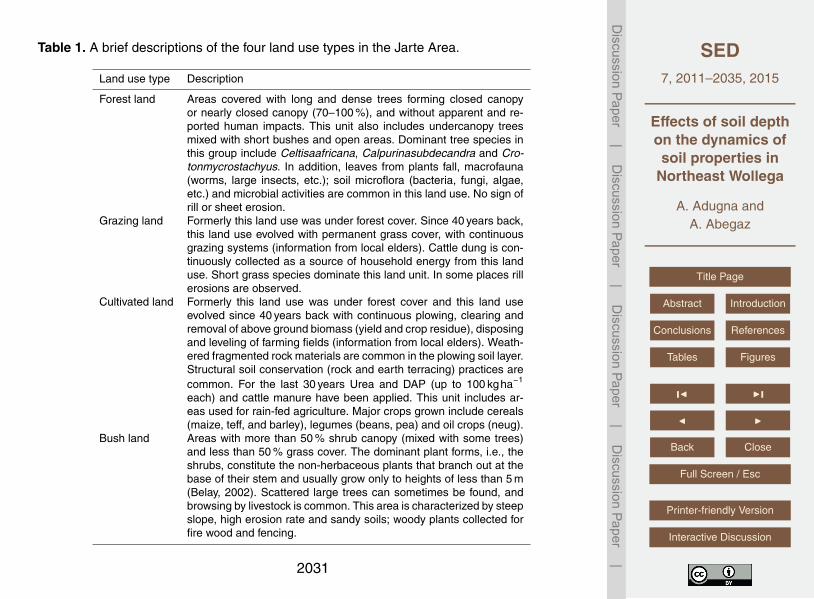
Table 1. A brief descriptions of the four land use types in the Jarte Area.
Land use type Description
Forest land Areas covered with long and dense trees forming closed canopyor nearly closed canopy (70–100 %), and without apparent and re-ported human impacts. This unit also includes undercanopy treesmixed with short bushes and open areas. Dominant tree species inthis group include Celtisaafricana, Calpurinasubdecandra and Cro-tonmycrostachyus. In addition, leaves from plants fall, macrofauna(worms, large insects, etc.); soil microflora (bacteria, fungi, algae,etc.) and microbial activities are common in this land use. No sign ofrill or sheet erosion.
Grazing land Formerly this land use was under forest cover. Since 40 years back,this land use evolved with permanent grass cover, with continuousgrazing systems (information from local elders). Cattle dung is con-tinuously collected as a source of household energy from this landuse. Short grass species dominate this land unit. In some places rillerosions are observed.
Cultivated land Formerly this land use was under forest cover and this land useevolved since 40 years back with continuous plowing, clearing andremoval of above ground biomass (yield and crop residue), disposingand leveling of farming fields (information from local elders). Weath-ered fragmented rock materials are common in the plowing soil layer.Structural soil conservation (rock and earth terracing) practices arecommon. For the last 30 years Urea and DAP (up to 100 kgha−1
each) and cattle manure have been applied. This unit includes ar-eas used for rain-fed agriculture. Major crops grown include cereals(maize, teff, and barley), legumes (beans, pea) and oil crops (neug).
Bush land Areas with more than 50 % shrub canopy (mixed with some trees)and less than 50 % grass cover. The dominant plant forms, i.e., theshrubs, constitute the non-herbaceous plants that branch out at thebase of their stem and usually grow only to heights of less than 5 m(Belay, 2002). Scattered large trees can sometimes be found, andbrowsing by livestock is common. This area is characterized by steepslope, high erosion rate and sandy soils; woody plants collected forfire wood and fencing.
2031
SED7, 2011–2035, 2015
Effects of soil depthon the dynamics ofsoil properties in
Northeast Wollega
A. Adugna andA. Abegaz
Title Page
Abstract Introduction
Conclusions References
Tables Figures
J I
J I
Back Close
Full Screen / Esc
Printer-friendly Version
Interactive Discussion
Discussion
Paper
|D
iscussionP
aper|
Discussion
Paper
|D
iscussionP
aper|
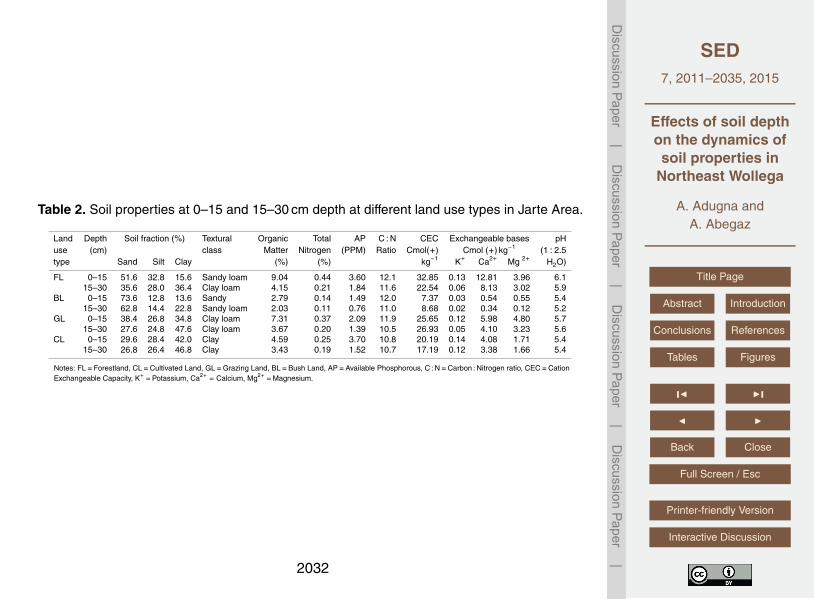
Table 2. Soil properties at 0–15 and 15–30 cm depth at different land use types in Jarte Area.
Land Depth Soil fraction (%) Textural Organic Total AP C : N CEC Exchangeable bases pHuse (cm) class Matter Nitrogen (PPM) Ratio Cmol(+) Cmol (+) kg−1 (1 : 2.5type Sand Silt Clay (%) (%) kg−1 K+ Ca2+ Mg 2+ H2O)
FL 0–15 51.6 32.8 15.6 Sandy loam 9.04 0.44 3.60 12.1 32.85 0.13 12.81 3.96 6.115–30 35.6 28.0 36.4 Clay loam 4.15 0.21 1.84 11.6 22.54 0.06 8.13 3.02 5.9
BL 0–15 73.6 12.8 13.6 Sandy 2.79 0.14 1.49 12.0 7.37 0.03 0.54 0.55 5.415–30 62.8 14.4 22.8 Sandy loam 2.03 0.11 0.76 11.0 8.68 0.02 0.34 0.12 5.2
GL 0–15 38.4 26.8 34.8 Clay loam 7.31 0.37 2.09 11.9 25.65 0.12 5.98 4.80 5.715–30 27.6 24.8 47.6 Clay loam 3.67 0.20 1.39 10.5 26.93 0.05 4.10 3.23 5.6
CL 0–15 29.6 28.4 42.0 Clay 4.59 0.25 3.70 10.8 20.19 0.14 4.08 1.71 5.415–30 26.8 26.4 46.8 Clay 3.43 0.19 1.52 10.7 17.19 0.12 3.38 1.66 5.4
Notes: FL=Forestland, CL=Cultivated Land, GL=Grazing Land, BL=Bush Land, AP=Available Phosphorous, C : N=Carbon : Nitrogen ratio, CEC=CationExchangeable Capacity, K+ =Potassium, Ca2+ = Calcium, Mg2+ =Magnesium.
2032
SED7, 2011–2035, 2015
Effects of soil depthon the dynamics ofsoil properties in
Northeast Wollega
A. Adugna andA. Abegaz
Title Page
Abstract Introduction
Conclusions References
Tables Figures
J I
J I
Back Close
Full Screen / Esc
Printer-friendly Version
Interactive Discussion
Discussion
Paper
|D
iscussionP
aper|
Discussion
Paper
|D
iscussionP
aper|
Figure 1. Location study area.
2033
SED7, 2011–2035, 2015
Effects of soil depthon the dynamics ofsoil properties in
Northeast Wollega
A. Adugna andA. Abegaz
Title Page
Abstract Introduction
Conclusions References
Tables Figures
J I
J I
Back Close
Full Screen / Esc
Printer-friendly Version
Interactive Discussion
Discussion
Paper
|D
iscussionP
aper|
Discussion
Paper
|D
iscussionP
aper|
Sand Silt Clay OM TN AP CEC Ca2+ K+ Mg2+ pH
FL -31 -15 133 -54 -52 -49 -31 -37 -54 -24 -3.3
BL -15 13 -2.97 -32 -21 -49 18 -37 -33 -78 -4
GL -28 -8 37 -50 -46 -34 5 -31 -58 -33 -2
CL -10 -7 11 -26 -24 -59 15 -17 -14 -2 0
-250
-200
-150
-100
-50
0
50
100
150
200
Ver
tica
l var
iati
on
(%)
Figure 2. Variation (%) in soil properties between 15–30 and 0–15 cm soil depth compared tovalues of 0–15 cm soil depth in the study area.
2034
SED7, 2011–2035, 2015
Effects of soil depthon the dynamics ofsoil properties in
Northeast Wollega
A. Adugna andA. Abegaz
Title Page
Abstract Introduction
Conclusions References
Tables Figures
J I
J I
Back Close
Full Screen / Esc
Printer-friendly Version
Interactive Discussion
Discussion
Paper
|D
iscussionP
aper|
Discussion
Paper
|D
iscussionP
aper|
Figure 3. Correlation for selected soil properties in 0–15, 15–30 and 0–30 cm depth with SOM(a), CEC (b), TN (c), AP (d), Ca (e), and Mg (f) in Jarte Area.
2035