Embed Size (px)
Citation preview

Prepared in cooperation with the University of Arizona, School of Natural Resources and the Environment
Effects of Reintroduced Beaver (Castor canadensis) on Riparian Bird Community Structure along the Upper San Pedro River, Southeastern Arizona and Northern Sonora, Mexico
U.S. Department of the InteriorU.S. Geological Survey
Open-File Report 2014-1121

Cover: Photograph of beaver dam (0.8 meter height), 3.7 kilometers north of U.S. Highway 90, July 2006.Photograph taken by Glenn E. Johnson, University of Arizona, School of Natural Resources and the Environment.

Effects of Reintroduced Beaver (Castor canadensis) on Riparian Bird Community Structure along the Upper San Pedro River, Southeastern Arizona and Northern Sonora, Mexico
By Glenn E. Johnson and Charles van Riper III
Prepared in cooperation with the University of Arizona, School of Natural Resources and the Environment
Open-File Report 2014-1121
U.S. Department of the Interior U.S. Geological Survey

U.S. Department of the Interior SALLY JEWELL, Secretary
U.S. Geological Survey Suzette M. Kimball, Acting Director
U.S. Geological Survey, Reston, Virginia: 2014
For more information on the USGS—the Federal source for science about the Earth, its natural and living resources, natural hazards, and the environment—visit http://www.usgs.gov or call 1–888–ASK–USGS
For an overview of USGS information products, including maps, imagery, and publications, visit http://www.usgs.gov/pubprod
To order this and other USGS information products, visit http://store.usgs.gov
Suggested citation: Johnson, Glenn E., and van Riper III, Charles, 2014, Effects of reintroduced beaver (Castor canadensis) on riparian bird community structure along the upper San Pedro River, southeastern Arizona and northern Sonora, Mexico: U.S. Geological Survey Open-File Report 2014-1121, 98 p., http://dx.doi.org/10.3133/ofr20141121. ISSN 2331-1258 (online)
Any use of trade, product, or firm names is for descriptive purposes only and does not imply endorsement by the U.S. Government.
Although this report is in the public domain, permission must be secured from the individual copyright owners to reproduce any copyrighted material contained within this report.

iii
Contents Chapter 1. Bird Abundance and Richness in a Southwestern Desert Riparian Area Following Beaver Reintroduction ............................................................................................................................................................. 1
Abstract ...................................................................................................................................................................... 1 Introduction ................................................................................................................................................................ 1 Description of Study Area .......................................................................................................................................... 5 Methods ..................................................................................................................................................................... 6
Sampling Design .................................................................................................................................................... 6 Bird Surveys ........................................................................................................................................................... 7 Avian Species Groups ............................................................................................................................................ 8 Environmental Measurements ................................................................................................................................ 8 Beaver and Water Measurements .......................................................................................................................... 9 Statistical Analyses ...............................................................................................................................................10
Results ......................................................................................................................................................................11 Avian Survey Effort and Detections .......................................................................................................................11 Beaver Activity .......................................................................................................................................................12 Non-Random Spatial Association between Beaver and Birds ...............................................................................13 Bird-Habitat Associations ......................................................................................................................................13 Effects of Beaver on Vegetation/Habitat ................................................................................................................14
Discussion.................................................................................................................................................................15 Conclusion ................................................................................................................................................................18 Acknowledgments .....................................................................................................................................................19 References Cited ......................................................................................................................................................20 Figures ......................................................................................................................................................................25 Tables .......................................................................................................................................................................28
Chapter 2. An Investigation of Important Factors Associated with Riparian Bird Community Structure Along the Upper San Pedro River in Southeastern Arizona and Northern Sonora, Mexico: Effects of Reintroduced Beaver ..................................................................................................................................................57
Abstract .....................................................................................................................................................................57 Background ...............................................................................................................................................................57 Methods ....................................................................................................................................................................58
Seven-Minute Point Count Sampling .....................................................................................................................58 Resampling of Historical Surveys ..........................................................................................................................58 Conservation Priority Index Ranking .....................................................................................................................59
Results ......................................................................................................................................................................59 Breeding Birds of the Upper San Pedro River Riparian Areas ..............................................................................59 Species of Conservation Concern .........................................................................................................................60 Incidental and Noteworthy Species, Excluded Observations .................................................................................60 Notes on Beaver Activity and Distribution .............................................................................................................61 Modeling Bird and Beaver Associations Relative to Vegetation and Surface Water .............................................62 Additional Funding Received and Updated List of Project Partners (In Bold) ........................................................62 Changes to Original Proposal - Interactions with People ......................................................................................63
Conclusion ................................................................................................................................................................63 References Cited ......................................................................................................................................................64 Figures ......................................................................................................................................................................66 Tables .......................................................................................................................................................................69

iv
Appendix 2-A. Table of 59 species of conservation interest detected throughout study area along the San Pedro River and associated riparian areas in southeastern Arizona and northern Sonora, and designation under each of 17 lists intended to aid in the prioritization of species for conservation action. .........................................................75
Chapter 3. Southwestern Willow Flycatcher Nest Records and Potential for Future Breeding along the Upper San Pedro River, Arizona ...............................................................................................................83
Abstract .....................................................................................................................................................................83 Introduction ...............................................................................................................................................................83 Methods ....................................................................................................................................................................84
Historical and Contemporary Breeding Records ...................................................................................................84 Upper San Pedro River 2005 Nest–Site Characteristics Compared to Regional Measurements ..........................84 Environmental Conditions Along the Upper San Pedro River ................................................................................85
Results ......................................................................................................................................................................85 Historical and Contemporary Breeding Records ...................................................................................................85 Upper San Pedro 2005 Nest-Site Characteristics Compared to Regional Measurements ....................................86 Environmental Conditions Along Upper San Pedro ...............................................................................................87
Discussion.................................................................................................................................................................87 Conclusions and Management Implications ..............................................................................................................89 Acknowledgments .....................................................................................................................................................91 References Cited ......................................................................................................................................................92 Tables .......................................................................................................................................................................95 Appendix 3-A. Discovery, Location, Subsequent Monitoring, and Fate of the 2005 Hereford Nest ...........................98
Figures Figure 1-1. Number of birds counted (Y axis) within 1 meter distance bins (X axis) along the upper San Pedro River, May–July 2005 and 2006. A total of 22,166 bird detections are represented .................................................... 25 Figure 1-2. Percentage of total basal area of all beaver-gnawed (but standing) cottonwood (Populus fremontii) and willow trees (Salix spp.), and combined basal area of cottonwood-willow stumps and live trees (unaffected by beaver [Castor canadensis]) across all sites within each of the low-, moderate-, and high-use beaver intensity classes, and sites with no beaver use .............................................................................................................................................. 25 Figure 1-3. Breeding bird species richness (mean number of 76 species detected within 50 meters of stations) at sites where beavers (Castor canadensis) absent (n=154) and present (n=86); includes 95-percent confidence intervals from t test (table 1-5) ..................................................................................................................................... 26 Figure 1-4. Relative abundance of all breeding birds (average number of individuals detected per survey visit within 50 m) at sites where beavers (Castor canadensis) absent (n=154) and present (n=86); includes 95-percent confidence intervals from t test (table 1-5) ................................................................................................................... 27 Figure 2-1. Scanning riparian vegetation for a bird heard during a training session lead by the investigator at Los Fresnos Land Trust, TNC~Mexico, in the Sonoran portion of the upper San Pedro River watershed, May 16, 2007. . 66 Figure 2-2. Beaver (Castor canadensis) sign along upper San Pedro River 7.2 kilometers south of the U.S.-Mexico International border ................................................................................................................................. 66 Figure 2-3. Dam in riparian area north of Hereford Bridge with recent fire history. ..................................................... 67 Figure 2-4. Beaver (Castor canadensis) dam over 1 meter high, 1 kilometer south of Hunter Wash, north of Hereford, Arizona (8.5 x 11 inch clipboard for scale) ................................................................................................... 67 Figure 2-5. Beaver (Castor canadensis) dam (same 0.8 meter height dam from figure 1, p. 1), 3.7 kilometers north of U.S. Highway 90, July 2006 (8.5 x 11 inch clipboard for scale) ...................................................................... 68 Figure 2-6. Yellow-crowned Night-Heron (Nyctanassa violacea) observed 7 kilometers south of international border ...................................................................................................................................................... 68

v
Tables Table 1-1. Environmental variables used in stepwise variable selection and final habitat/covariate models. .............. 28 Table 1-2. Number of survey stations where beaver (Castor canadensis) dams were documented and total number of dams documented each year from 2000 to 2006 within the San Pedro National Riparian Conservation Area, Arizona ......................................................................................................................................... 30 Table 1-3. Beaver (Castor canadensis) activity from 2000 to 2006 at 240 stations in the San Pedro Riparian National Conservation Area, Arizona, used to quantify beaver presence/absence and beaver intensity ..................... 30 Table 1-4. Common and scientific names of 76 breeding bird species detected within 50 meters of 240 survey stations on the San Pedro Riparian National Conservation Area, Arizona, 2005–2006 ............................................... 31 Table 1-5. Species richness and relative abundance of species groups at sites with and without beavers (Castor canadensis) ................................................................................................................................................................. 34 Table 1-6. Mean relative abundance for most commonly detected bird species (n=31) at sites with and without beaver (Castor canadensis) . ....................................................................................................................................... 35 Table 1-7. Habitat and Environmental Covariate models for species and species groups from multiple linear regression (n=240) using stepwise variable-selection (minimum BIC to enter) selected model terms ......................... 36 Table 1-8. Comparison of models incorporating beaver-related variables to habitat- and environmental covariate-only models for species and species groups, respectively ........................................................................... 39 Table 1-9. Result of multiple linear regression (n=240) models after adding beaver-related factors to habitat/covariate models (table 1-7), for species and species groups ......................................................................... 43 Table 1-10. Name and location of the 240 point count stations used to survey breeding birds in 2005–2006 on the San Pedro Riparian National Conservation Area, listed from northern-most to southernmost station. ............. 51 Table 2-1. Four components of the investigation of bird community dynamics in riparian areas in the upper San Pedro River watershed and details of survey technique, effort, total detections, and study design ...................... 69 Table 2-2. Bird species encountered during summer surveys of riparian areas in upper San Pedro River watershed within the United States and Mexico .......................................................................................................... 70 Table 3-1. Records of breeding Southwestern Willow Flycatchers (E.t. extimus) within the upper San Pedro River watershed in Arizona, including: locality, number of nests documented, date(s) of record, sources used to find or investigate record (specimen information given in parentheses: institution abbreviation*, catalog number, and collector), and further information and comments on the record .................................................................................. 95 Table 3-2. Comparison of mean and range of values from 240 sites, value at nest site, and rank and percentile (= percent sites with lesser values) of nest site in relation to range of values for all stations, for each of seven environmental variables: percent Goodding’s willow (Salix gooddingii) cover in 3–5 m and 5–7 m canopy layers, total number of Goodding’s willow, seep willow and all woody plant stems, mean diameter-at-breast-height of all woody species’ main stems, and total width of riparian vegetation .............................................................................. 97

vi
Conversion Factors and Datums Conversion Factors SI to Inch/Pound
Multiply By To obtain
Length
centimeter (cm) 0.3937 inch (in.)
millimeter (mm) 0.03937 inch (in.)
meter (m) 3.281 foot (ft)
kilometer (km) 0.6214 mile (mi)
kilometer (km) 0.5400 mile, nautical (nmi)
meter (m) 1.094 yard (yd)
Area
square meter (m2) 0.0002471 acre
hectare (ha) 2.471 acre
square hectometer (hm2) 2.471 acre
square kilometer (km2) 247.1 acre
square centimeter (cm2) 0.001076 square foot (ft2)
square meter (m2) 10.76 square foot (ft2)
hectare (ha) 0.003861 square mile (mi2)
Datums Vertical coordinate information is referenced to the North American Vertical Datum of 1988 (NAVD 88). Horizontal coordinate information is referenced to the North American Datum of 1983 (NAD 83). Elevation, as used in this report, refers to distance above the vertical datum.
1
Effects of Reintroduced Beaver (Castor canadensis) on Riparian Bird Community Structure along the Upper San Pedro River, Southeastern Arizona and Northern Sonora, Mexico
By Glenn E. Johnson and Charles van Riper III
Chapter 1. Bird Abundance and Richness in a Southwestern Desert Riparian Area Following Beaver Reintroduction Abstract
We measured bird abundance and richness along the upper San Pedro River in 2005 and 2006 to investigate how beavers (Castor canadensis) may act as ecosystem engineers after reintroduction to a desert riparian area in the Southwestern United States. In areas where beavers colonized, we found higher bird abundance and richness of bird groups, such as all breeding birds, insectivorous birds, and riparian specialists, and higher relative abundance of many individual species—including several avian species of conservation concern. After accounting for environmental factors, such as presence or persistence of surface water, and extent of Frémont cottonwood (Populus fremontii) and Goodding’s willow (Salix gooddingii), the relative influence of beaver activity was not as strong as these other environmental factors. However, there was still evidence of an association between beaver activity and bird abundance and richness, as models that included beaver-related variables better explained variation in bird abundance and richness for 71 percent of species groups and 46 percent of individual species for which we built models. Although the effect sizes associated with the beaver influence on the bird community were smaller than similar studies conducted in other regions of North America, the biological significance of beaver activity in the upper San Pedro River riparian area will likely become even stronger with increasing time.
Introduction Interactions among organisms are often examined by ecologists to help understand dynamic
processes affecting the distribution and persistence of species. For example, interactions can be trophic or chemical, competitive or mutualistic, or intra- or inter-specific. The concept of ecosystem engineering is used to investigate interactions that arise when an organism physically creates or modifies its environment and thereby changes the availability of abiotic resources required by other organisms, which may result in direct, indirect, or cascading biotic effects (Jones and others, 1994, 1997, 2010; Berke, 2010; Thomsen and others, 2010). The strength of ecosystem engineering and the effects it can exert on community dynamics can be explicitly parameterized to help generate testable hypotheses and predictions, as demonstrated in observational, experimental, and modeling studies investigating hundreds of species and ecological contexts (Wright and others, 2003; Badano and Cavieres, 2006; Wright and Jones, 2006; Cuddington and others, 2007, 2009; Wright, 2009; Jones and others, 2010). The ecosystem engineering

2
concept focuses attention on (1) the process by which organisms may change the physical structure or other abiotic dimensions of their environment, and then (2) the consequence(s) physical changes may have on biotic elements in the community (Jones and Gutiérrez, 2007; Jones and others, 2010). Although there is some overlap with other terms (for example, foundation species, dominants, habitat cascades, niche construction, facilitation, and keystone species), ecosystem engineering is not synonymous with these concepts, for example because it is not dependent on disproportionate effects of a species or organism’s biomass, trophic interactions, evolutionary consequences of habitat formation, or purely beneficial interactions (Jones and others, 1994; Wright and Jones, 2006; Berke, 2010). When focusing on a specific organism, one could classify both “autogenic” ecosystem engineers that modulate abiotic resources through their physical structure alone (for example, coral reefs, kelp beds, large trees) as well as “allogenic” engineers that can modify their environment through behavior (for example, mammals burrowing in the earth or woodpeckers excavating cavities). However, because all organisms modify their environment to some degree, the question “is this species an engineer?” is not particularly informative. Rather, by focusing on the process when it is relevant, for example, “how and when do ecosystem engineering activities of an organism exert influence on other organisms?” new insights can be gained regarding the direct or indirect interactions that influence community dynamics and structure (Jones and others, 2010).
The concept of ecosystem engineering is relevant and has proved useful in applied contexts where the goal is to conserve or restore populations or ecosystem function (Wright and others, 2002; Boogert, 2006; Byers and others, 2006; Crain and Bertness, 2006; Moore, 2006; Griffiths and others, 2010; Laland and Boogert, 2010). Beavers (Castor canadensis) are often cited as the quintessential ecosystem engineers, and have consistently been promoted by resource managers in North America and Europe as an inexpensive tool for restoring ecological function in riparian areas (Apple, 1985; Olson and Hubert, 1994; Fredlake, 1997; Albert and Trimble, 2000; Baker and Hill, 2003; Rosell and others, 2005; Boyle and Owens, 2007; Prettyman, 2009). Throughout North America, beavers historically had a profound impact on stream ecology and watershed function, and after extensive extirpation by trapping in the 18th and 19th centuries, the species returned to portions of its former range during the 20th century—both through natural recolonization and human reintroduction (Naiman and others, 1988; Baker and Hill, 2003; Rosell and others, 2005). Despite beavers’ consumption of riparian vegetation and use of plant material to build dams, many land managers and restoration ecologists believe the benefits to the ecosystem as a whole outweigh any consequences of herbivory or felling of trees (Apple, 1985; Olson and Hubert, 1994; Fredlake, 1997; Albert and Trimble, 2000; Fouty, 2002). Ostensibly, the potential benefits of beaver on ecosystems that are sought by managers are the same as the ecosystem engineering effects, although this is not always explicitly stated as such.
A beaver’s ecosystem engineering process begins with several abiotic effects on the environment. Beavers create dams that impound water, reduce water velocity, promote deposition and retention of sediments, organic matter, and dissolved nutrients, while reducing turbidity downstream. At larger scales, beaver dams can modulate high-flow events and capture precipitation that is then released slowly into the groundwater and stream channel, which ultimately can alter erosion patterns, stream channel morphology, and stream gradients (Naiman and others, 1988; Gurnell, 1998; Baker and Hill, 2003). In addition to maintaining hydrologic stability, or even de-entrenching some down-cut stream channels (Albert and Trimble, 2000), the totality of beaver influences typically make some resources more available, such as water, organic matter, and nutrients such as dissolved nitrogen and phosphorus (Naiman and others, 1988; Baker and Hill, 2003;Wright and others, 2003). Additionally, through creation of canopy gaps resulting from tree felling, beaver activity can alter the temperature and moisture gradients in their terrestrial environment, and create a mosaic of disturbed and undisturbed patches with different levels of abiotic conditions or resources required by other species (Wright and others, 2002, 2003).

3
Given such dramatic effects on the abiotic components of the environment, many studies have found biotic consequences associated with beaver activity; for example, raised water tables and increased soil-water interface can facilitate germination, recruitment, and primary production of trees and shrubs, thus having a positive feedback on beavers and other species dependent on riparian vegetation (Naiman and others, 1988). Beaver activity has been associated with higher species richness and abundance of a broad range of taxa including plants, odontanate insects, aquatic invertebrates, fish, amphibians, reptiles, and small mammals (Wright and others, 1996, 2003; Baker and Hill, 2003; Rosell and Parker, 1996; Rosell and others, 2005). Many anecdotal natural history accounts have noted that bird communities appear to thrive where beavers are found (Carr, 1940; Muller-Schwarze, 1992; Wilkinson, 2003; Nijhuis, 2011). The majority of rigorous (for example, experimental) studies regarding the effects of beaver activity on birds have focused on waterfowl (Anatidiae), oftentimes demonstrating positive effects of beaver ponds on habitat use and vital rates (Speake, 1956; Arner, 1963; Renouf, 1972; Nummi, 1989, 1992; Merendino and others 1995; Nummi and Poyosa, 1997; McKinstry and others, 2001; Hartke and Hepp, 2004; Nummi and Hahtola, 2008). Observational studies on other groups of birds (for example, songbirds), although fewer in number, also have consistently found that beaver activity is correlated with higher species richness and abundance in mesic environments of Eastern North America (Reese and Hair, 1976; Grover and Baldassarre, 1995; Edwards and Otis, 1999; Bulluck and Rowe, 2006; Aznar and Desrochers, 2008) and in more arid regions in Western North America (Medin and Clary, 1990; Brown and Parsons, 1979; Cooke and Zack, 2008). Yet in these studies, explanations for these effects typically are correlative, invoking increases in riparian vegetation, open water, prey (for example, insects) availability, and structural complexity at small and/or large scales.
Despite the presumed effects of beaver activity on birds, specific mechanisms by which beaver activity affects avian communities have only been studied for waterfowl. Past studies on the association between beaver activity and bird communities have usually assumed that observed differences between areas with beaver activity and surrounding environments could be attributed to the beaver activity. Beaver habitat selection also may explain some of these observed patterns, yet few studies have attempted to account for co-varying factors that could simultaneously influence the habitat selection of both birds and beavers (Cooke and Zach, 2008; Chandler and others, 2009).
Beaver were once widespread in riparian areas in the Southwestern United States, although they were largely extirpated in the 19th century (Baker and Hill, 2003; Webb and others, 2007). The gallery forests of cottonwood (Populus fremontii) and Goodding’s willow (Salix gooddingii) in the Southwest support breeding bird communities known for being among the highest density and diversity in North America (Carothers, 1974; Hunter and others, 1987). In southeastern Arizona, beavers were so common along the San Pedro River in the 1800s that James Ohio Pattie named it the “Beaver River” in 1825 (Webb and others, 2007), yet the mammal was extirpated there by the early 20th century .
In 1984, when the Bureau of Land Management (BLM) assumed stewardship of approximately 75 km of the upper San Pedro River watershed and created the San Pedro Riparian National Conservation Area (SPRNCA), conservation of birds and other wildlife became a central management objective. In cooperation with Arizona Game and Fish Department and others, BLM personnel reintroduced beaver in the SPRNCA from 1999 to 2002, resulting in at least 40 individuals in 13 different sites by 2005 (M. Fredlake, Bureau of Land Management, oral commun.). Along with returning a potentially important native species to the ecosystem, goals of this program were to increase water retention, restore the structural heterogeneity of vegetation, and enhance conditions for wildlife (Fredlake, 1997).
Similar to other locations where beaver activity exists in conjunction with a management priority on birds (for example, Longcore and others, 2007), some have voiced concerns that beaver activity may jeopardize the riparian forests and the bird community of the SPRNCA (M. Fredlake, Bureau of Land Management, oral commun..). Tree-felling by beaver could reduce canopy cover needed by some birds,

4
such as the Yellow-billed Cuckoo (Coccyzus americanus), a candidate for listing under the Endangered Species Act that is relatively common along the San Pedro River compared to other river systems in the region (Krueper and Rich 2003). Conversely, reduced over-story canopy of cottonwood, an increase in early successional (that is, shrub-form) growth of willows, and other components of beaver activity are associated with habitat for Southwestern Willow Flycatcher (Empidonax traillii extimus; Finch and others, 2000; Sogge and Marshall, 2000), which is listed as threatened in Arizona at both the State and Federal level. Increases in habitat for the flycatcher in this area may contribute to recovery, given the species’ historical and contemporary nest records in the local area combined with the presence of large populations to the north along the lower reach of the San Pedro River. However, if beaver heavily utilized willow or cottonwood and caused net losses to either of these woody species, it could affect both of these bird species of conservation concern, as well as many others that depend on riparian vegetation.
Within a few years after the reintroduction of beaver, the reduction in over-story canopy and/or construction of dams and retention of water were expected to be the potential pathways for abiotic influences of beaver activity and, thus, initial components of the ecosystem engineering process. The primary abiotic driver for the majority of bird species on the upper San Pedro River is the depth or availability of water, because this directly affects the extent and vigor of riparian vegetation, which in turn can affect vegetative and insect food availability, nesting substrate, cowbird parasitism, and nest predation (Brand and others, 2010a, 2010b, 2011). Previous studies along the San Pedro have empirically demonstrated that groundwater depth is the key driver of vegetation dynamics, especially determining the extent of cottonwood and willow in reaches with relatively shallow (more available) groundwater versus reaches more dominated by tamarisk (Tamarix spp.) and/or mesquite (Prospis velutina) in areas with deeper (less available) water (Stromberg,1998; Leenhouts and others, 2005; Stromberg and Tellman, 2010). The extent and persistence of surface water also is affected by groundwater depth, and although surface water does not directly drive vegetation dynamics (Stromberg, 1998), it is crucial to water-dependent birds, such as Mallards (Anas platyrhynchos) (Brand and others, 2010a).
We investigated the potential for beaver activities to affect the riparian ecosystem and influence breeding bird communities along the upper San Pedro River. We hypothesized that if beavers were affecting the environment through the ecosystem engineering process, we would find that differences in the breeding bird communities along the river would be non-randomly associated with places where beavers had settled. However, we recognized the possibility that any non-random association could result either from an ecosystem engineering process and its effects on water and riparian vegetation structure (that is, increased shrub cover resulting from greater water availability and/or direct reduction in canopy over-story resulting from tree-felling) or simply the result of both beaver and certain bird species being drawn to the same environments. Depending on the length of time beaver had been in the system (3–6 years, depending on the site and settlement date), bird community structure could be influenced more by water and vegetation dynamics than by beaver activity.
To consider the full complement of environmental conditions present on the upper San Pedro River, we sampled throughout this portion of the watershed along a gradient of vegetative and hydrologic conditions, which included areas with and without beaver, but that were otherwise similar. We specifically assessed three questions:
1. Were there differences in the number of breeding bird species and the abundance of individual species where beavers were present in the SPRNCA?
2. Were there differences in the parameters in question 1 attributable to environmental factors that were merely correlated with beaver habitat selection? Or, alternatively,
3. Was there evidence that observed differences could be attributed to beaver activity—either from tree felling, dam creation, or both?

5
Because the area is specifically managed for birds, we wanted to assess if the distribution of birds—especially species of concern—and beaver were spatially related in any way, and thus whether beaver activity might lead to management concerns or opportunities in relation to the beaver reintroduction program. We extensively sampled birds and environmental attributes, and then modeled the potential relationships between the avian community and factors in their environment including vegetation, water, and beaver activity.
Description of Study Area We studied interactions between bird communities and beaver in the lower riparian floodplain
terrace and channel (and “channel shelf” and “floodplain bank,” especially when vegetated; Hupp and Osterkamp, 1996) along 68.5 km of the upper San Pedro River, within the boundaries of the SPRNCA. The SPRNCA extends northward from the U.S. border with Mexico approximately 60 km to St. David, Arizona, and is managed by BLM. Elevation ranged from 1,125 m at the northern-most portion of our study to 1,285 m at the southern-most point, 2.5 km north of the international border. Prior research conducted on the upper San Pedro River has described the interaction between groundwater, surface water, and vegetation community dynamics within and adjacent to the riparian areas (see Stromberg and Tellman, 2010; and Webb and others, 2007, for reviews), providing the basis for the following summary. The upper San Pedro River contains reaches with perennial, intermittent, and ephemeral surface water. Riparian vegetation consists primarily of Frémont cottonwood (Populus fremontii) and Goodding’s willow (Salix gooddingii) as the dominant over-story canopy, with seepwillow (Baccharis salicifolia) often present in the understory along wetter reaches. Mesquite occurs on high floodplain terraces adjacent to the primary riparian vegetation. Mesquite and non-native tamarisk (that is, saltcedar Tamarix chinensis and closely related species) are regular yet minor components of the vegetation throughout the length of the study area, and dominate along some of the drier, ephemeral reaches in the north of the study area where groundwater is deep and less accessible. Tamarisk, especially, forms fairly homogeneous stands in some areas in the northern section of the study area near the community of St. David, although there are scattered remnant or senescing cottonwood trees. Additional woody species present in the study area include velvet ash (Fraxinus velutina), Arizona walnut (Juglans microcarpa v. major), netleaf hackberry (Celtis reticulata), western soapberry (Sapindus saponaria), and desert willow (Chilopsis linearis). Emergent vegetation at sites with perennial, slow-moving water include bulrush (Scirpus ssp.), cattail (Typha domingensis), and various species of sedge (Carex ssp.).
In the early the 19th century, the San Pedro River Basin was swampy, with beaver dams, isolated patches of gallery cottonwood forest, and a high water table and extensive sacaton grasslands (Sporobolus wrightii) within the primary floodplain (Stromberg and Tellman, 2010). Similar to much of the Southwest in the second half of the 19th century, channel incision and arroyo formation started to occur on the upper San Pedro River, draining wetlands and resulting in a lower water table. Like previous arroyo formation, channel widening, and fill-in cycles over the last 8,000 years, the entrenchment on the San Pedro River and throughout the Southwest is correlated with a climate-flood cycle (Webb and others, 2007). However in the 19th century, anthropogenic factors (for example, livestock grazing, removal of beaver dams, wood cutting, agriculture, and groundwater use) may have contributed to the speed and severity of entrenchment. River down-cutting and channel widening continued through the 1930s, after which cottonwood and willow established itself more widely as the channel stabilized and secondary, lower floodplains formed adjacent to the main channel. Throughout the later 20th century, riparian vegetation

6
continued to expand in extent and height along the new, lowered floodplain of upper San Pedro River, especially during the 1980s and early 1990s (Webb and others, 2007; Stromberg and Tellman, 2010). The removal of cattle grazing in the 1990s probably contributed to increased riparian vegetation production and the substantial increases in bird abundance in the SPRNCA documented by Krueper and others (2003).
Due largely to the current extent of cottonwood-willow cover along the upper San Pedro River, the area is recognized as a regionally important area for breeding and migrating birds, and has been the site of multiple avian studies (Skagen and others, 1998; Krueper, 1999; Krueper and others, 2003; Brand and others, 2008, 2010a, 2011; McFarland and others, 2012. In a review, Brand and others (2010b) found that breeding bird species richness estimates from the upper San Pedro River were approximately twice as high as reported from other Southwest rivers. The river is perhaps best known for its recreational bird-watching opportunities and for the near-certainty that local groundwater pumping is depleting the aquifer that supplies the river’s surface water and supports the adjacent cottonwood-willow riparian forests (Stromberg and Tiller, 1996; Stromberg, 2001; Rojo and others, 1999; Steiner and others, 2000; Davis, 2004; Steinitz and others, 2005; Mac Nish and others, 2010).
Methods To estimate abundance of breeding birds, we used variable-radius point count surveys combined
with distance sampling (Reynolds and others, 1980; Ralph and others, 1993; Buckland and others, 2001; Thomas and others, 2010) from May 24 to July 24, 2005 and 2006. To quantify environmental conditions at point count stations, we documented the presence of surface water and its persistence through the dry season, canopy cover and basal area of all woody plants, and width of riparian vegetation areas along the river channel. To quantify the presence and intensity of use by beaver, we also used data on beaver activity and location collected by BLM staff from the time of initial release in late 1999 through spring 2005, and then documented all beaver activity at and near the survey stations in 2005 and 2006. We then used model selection techniques to evaluate the strength of associations between bird population and community parameters and beaver activity environmental factors.
Sampling Design To achieve extensive spatial coverage across riparian vegetation areas targeted for sampling, we
randomly chose a start point and placed survey points systematically throughout the SPRNCA. Survey stations (n=240) were located every 250–285 m along the upper San Pedro River in riparian vegetation adjacent to the river on the lowest available floodplain terrace, which was typically just above (0.5–2 m) the river level. The initial stations were located randomly at 100, 200, or 300 m from bridges or other access points along the river, and then additional stations were systematically placed within available riparian vegetation, utilizing GarminTM 12XL and 12X GPS units to estimate distances between stations. The distance of a given station from the river’s edge varied slightly depending on the perpendicular width of the riparian vegetation corridor, but was typically placed under canopy cover within 10 m of the river-side edge of riparian vegetation. At some locations (<10 percent) with very wide riparian corridors and/or where floods had scoured vegetation, stations were placed 16–46 m from the edge of the river. Previous observations by BLM personnel indicated beaver were building dams in the San Pedro River on or near larger (>5 m) wash inlets, so when beaver dams or wash inlets were encountered more than 100 m from a previously established survey station, the station was replaced with a new station located 5–15 m up-river of the dam or wash inlet.

7
Bird Surveys We used modified point-count survey methods (Reynolds and others, 1980; Ralph and others,
1993) incorporating field procedures for distance sampling (Buckland and others, 2001; Thomas and others, 2010) to estimate bird abundance and breeding bird species richness. Seven-minute point-count surveys were conducted from mid-May to early August, which represents the most active period of breeding bird activity in this riparian area. Although surveys were conducted from May 15 to August 5, we only utilized surveys from May 24 to July 24; lingering winter birds and/or late-spring migrants complicated detection of territorial singing birds earlier in May, and rain and flood events during late July and early August precluded consistent and/or safe sampling in the lower floodplain thereafter. After excluding these surveys (before May 24 and after July 24) for which detectability of breeding birds was compromised, total effort at each station over the 2 years ranged from five to eight visits. Field personnel surveyed 8–15 stations per morning between 0500 and 0900 hours. Throughout the survey period each year, stations were visited at a variety of times during the day by randomizing start points of successive visits. For each bird detected, the observer estimated the distance (to nearest meter) visually or with Bushnell Yardage-Pro® laser rangefinders, and also recorded the detection type (song, call, visual, moving/flying within riparian vegetation, or flyover) and whether birds were detected within the first 5 minutes or the last 2 minutes. Indications of breeding activity were documented at every opportunity during or between surveys, along with incidental sightings of rare species and those of conservation concern.
To account for variation in detection probabilities (for example, because of bird behavior, observer skill, environmental factors, and because the adjacent upland environment generally had much fewer birds that were not as likely to be affected by beaver activity), we included only birds detected within 50 m of stations for analyses. We arrived at this distance cut-off point through several lines of evidence. A line fitted to a plot of the number of birds detected within 100 m of the stations approached a horizontal asymptote at approximately 50 m (fig. 1-1), because of the decreased detectability with increasing distance coupled with the proximity of the edge of the riparian corridor. Histograms of detection distances from point count stations typically demonstrate an increasing number of detections within distance categories farther away from the center point, because of the effect of increasing area of each successive distance-bin, and the point at which detectability decreases significantly can be inferred by noting where the “shoulder” to the right of the peak is located (Emlen, 1971; Buckland and others, 2001). We checked this assumption by evaluating the relationship between detectability-adjusted estimates of density and relative abundance.
We used the multiple covariate distance sampling approach within program DISTANCE (Marques and others, 2007; Thomas and others, 2010) to construct detection probabilities and density estimates per hectare for two of the more common species in the study, Yellow Warbler (Setophaga petechia) and Song Sparrow (Melospiza melodia). These density estimates for each station were then compared to the maximum number of singing males detected per visit, median number of singing males detected across all visits, and relative abundance (total number of birds detected at each station divided by effort at the station, that is, the average number of birds per visit) calculated from our raw data but truncated at 30, 50, 60, 80, and 100 m. We used the 50-m truncation distance for all bird species as it was most closely correlated to the program DISTANCE-derived density estimates (see section, “Results”). Although this obviously left out many detections (that is, singing birds beyond 50 m), we felt this truncation distance was an appropriate balance of considerations related to detection probability, the extent of vegetation measurements (the majority of which were within 30 m), and inclusion of a representative sample of birds using the station-area.

8
We recorded all birds detected, including migrants and vagrants, yet for our analyses considered only species known to breed in the upper San Pedro River Basin (Krueper, 1999; Krueper and others, 2003; Brand and others, 2008, 2010a). Birds were excluded if detected flying over the canopy at the station and not utilizing the surrounding riparian environment.
Avian Species Groups In addition to considering only breeding bird species (using our own observations as well as those
of Krueper, 1999; and Brand and others, 2010a), we grouped some species that use similar environments or have similar foraging strategies. We used prior research (Hunter and others, 1987,; Krueper, 1999; Brand and others; 2010a) to determine: (1) which bird species are, or are not, associated with riparian environments in the Southwestern United States, and then (2) which of the riparian-associated species are considered riparian generalists or riparian obligates. We grouped species as a “riparian generalist” if they were known to utilize multiple riparian vegetation types (for example, mesquite and tamarisk, either more often or in equal proportion to cottonwood/willow use), and we grouped species as a “riparian specialist” if either obligated or strongly associated with cottonwood-willow forests and/or surface water on the upper San Pedro River according to Brand and others (2010a), Krueper (1999), or Hunter and others (1987). For all species detected, we also determined whether each was of conservation concern status if the species was indicated by Hunter and others (1987) as “declining” in Southwestern broadleaf riparian forests, or if it was included in the “Birds of Conservation Concern” list of the U.S. Fish and Wildlife Service (2008).
Environmental Measurements We quantified a range of environmental conditions at each survey station. To estimate canopy
cover for each species of tree and shrub, we added all percent cover estimates from nine different height strata measured (0–1, 1–3, 3–5, 5–7, 7–10, 10–15, 15–20, 20–25, 25–30 m) for each of five dominant woody species, that is, cottonwood, willow, tamarisk, mesquite, and seepwillow. To estimate upper levels of canopy cover for cottonwood, we also included “canopy cover from 20 to 30 m” to ensure we accounted for this potentially important variable. To measure standing tree density, we recorded diameter-at-breast-height (DBH) for all trees within 30 m. To estimate relative abundances of different-size classes of trees and shrubs, we considered all woody stems within a 30-m radius of the station center and used Biltmore sticks and/or DBH tapes to check sizes and recorded measurements to the nearest centimeter. We also recorded when trees had signs of beaver gnawing (these are reported with other living trees when reporting canopy cover and for most basal area measurements) and measured the diameter of all beaver stumps, beaver-created snags, or felled trees, measuring as close to 1.3 m from the ground to stem as possible, or as high as possible for stumps. To analyze tree mortality and canopy openings related to beaver within the 30-m vegetation plots, we combined beaver-created stumps, snags, and recently downed trees of willow and cottonwood into one grouping, because it was often difficult or impossible to distinguish between stumps of willow or cottonwood (especially after a year or two of weathering), and because there were few beaver-created snags or beaver-felled trees. For analyses, DBH measurements were transformed to individual tree basal areas (DBH2* 0.00007854; Dunster and Dunster, 1996), then all basal area measurements for each plot were summed for each species within each of six DBH size classes (size 1 = 1–4 cm DBH, 2 = 5–11 DBH, 3 = 12–18 DBH, 4 = 19–25 DBH, 5 = 26–52 DBH, 6 = >53 cm DBH) for five dominant species (cottonwood, willow, mesquite, tamarisk, and Baccharis) and for stumps. Because of colinearity between these classes, for analyses, we condensed the live woody stems into three classes (<12 cm DBH, 12–25 cm DBH, and >25 cm DBH), and beaver-created stumps, snags, and recently felled trees were condensed into one basal area class, which was the sum of their values at each site. Because other woody species are relatively minor components of the canopy, we did not test for effects for all species. For example, cottonwood, willow, mesquite, and tamarisk made up 95.3 percent

9
(16,907) of all stem and stump diameters recorded (17,724), with seepwillow comprising another 2.3 percent (418 stems). Basal area calculations are presented directly as measured, then summarized (in square meters) for each 30-m radius plot surrounding the station, or 2,826 m² (0.2826 ha) rather than extrapolated to a single, larger unit (hectare, square kilometer, etc.). An index of vegetation structure was created by allocating a “1” to each height strata level above 1 m (all sites had some vegetation below 1 m) with vegetation cover, which were then summed to get a "Vegetation Height Diversity" at each site (scored from 1 to 7).
To categorize riparian vegetation and geomorphological influences at the stations outside 30 m, we measured the over-all width of riparian vegetation perpendicular to orientation of river, distance from the survey center point to edges of riparian vegetation, riverbank, and other habitats farther away (for example, grassland, mesquite savannah, or mesquite bosque), width and depth of river, and other vegetative and geomorphic factors, such as vegetation community type(s) in each area and depth of entrenchment/terracing. During the analysis phase, we reduced these variables considerably (from >100 to <20 columns), for example, reducing the canopy coverage classes to either the “average percent cover” (all percent cover measurements within each height strata, divided by the number of strata with measurements), and by not including more than one of any two highly correlated variables in the final analysis. Table 1-1 summarizes environmental measurements used for analyses.
Beaver and Water Measurements Immediately after each avian survey, and while transiting along the river between survey stations,
we recorded beaver sign (dams, gnawed trees, stumps, downed trees) and river condition (dry, recently dried, or water present, and if present whether shallow or deep, <0.2 and >0.2 m, respectively) at the stations. Water data were summarized to provide a measure of the persistence of surface water throughout the dry season before the late-summer monsoons. We considered three classes of surface-water conditions as potentially important to birds—if a station was dry from May through June (unless a rain or flood event occurred, that is, “ephemeral”); if a station had flowing water that persisted until at least late May (but later dried up at some sites) when many birds are setting up territories or have already settled into their breeding activities; and if a site contained perennial water that flowed throughout the summer (table 1-1). We used indicator variables for the latter two classes (that is, =1 if condition is true at the site) and sites without either of these water conditions were used as the reference levels (that is, =0; table 1-1).
Data were provided for beaver activity locations from late 1999 through early 2005 by BLM personnel, and we collected these data from 2005 to 2006, which we categorized by year according to an annual cycle that started after the majority of rains and flooding from the summer monsoon season had subsided (October 1) and extending for the following year. To determine beaver influence at each avian survey station, we projected two circles of 50- and 100-m radius around each station in ArcMap 9 (Environmental Systems Research Institute) displaying map at a 1:3,200 scale). For each year period, we projected all spatial beaver information around each station location and determined proximity of dams and sign within each 50- or 100-m distance bin, or within 150 m downriver because downriver dam locations regularly had backwater up to 150 m upriver, and beavers use this water to travel and forage. If a dam or location coordinates appeared to span both sides of a distance-boundary (for example, from 45 to 55 m), we included it within the closer category.
To model beaver activity as an explanatory (independent) variable at each avian survey station, we included three variables in our analyses—presence/absence, number of years where a dam was present within 50 m, and an intensity scale that ranked sites according to beaver presence and both the distance to dams and the number of years dams were located in the vicinity of stations (tables 1-1–1-3). Presence was inferred by beaver sign documented within 100 m of the station (in any year), and included dams, gnawed trees, stumps, bank dens, and other signs of occupation. We counted the number of years in which a dam

10
was present within 50 or 100 m of a given station, or 150 m if the dam was downriver, but used just the number of years stations had a dam within 50 m as the only continuous variable related to beaver activity. In order to rank the intensity of beaver use at sites, we considered the results that the BLM and we documented (tables 1-2 and 1-3) and created the following levels of indicator variables, with the reference level set to “beaver absence”—low-use sites that did not include sites with any dams but did include any other “beaver presence” sign, such as bank dens and/or at least 10 gnawed/felled trees documented within 100 m of the avian survey station (“beaver level 1”); moderate-use sites where no more than one dam was located within 50 m of a station, and/or where stations had less than three dams documented within 100 m of a station, in any year (“beaver level 2”); and high-use sites where dams were located within 50 m of stations for 2 or more years, and/or where dams were located within 100 m for 3 or more years (“beaver level 3”) (table 1-1).
Statistical Analyses To assess non-random associations between relative bird abundance or richness when comparing
areas with and without beavers, we first categorized all 240 survey stations into two groups based on the documented presence of beaver (that is, dams or any other sign within 100 m). We then conducted a two-tailed t test for the difference in mean relative abundance at stations with beaver activity versus those with no activity, both for species most commonly detected (n=31) and species groups. Because bird abundance is affected by a complex of environmental conditions (not just beaver activity) at each station, non-random associations between bird abundance and beaver presence do not suggest mechanistic or causal relationships. Therefore, to further address the question of how beaver may conduct ecosystem engineering, we first explained variation in bird abundance because of environmental factors other than beaver. We used multiple linear regression to describe “habitat relationships” for species with a greater than or equal to 50 percent difference in abundance when comparing stations with and without beaver (for all species where the difference was significant at the P ≤ 0.05 level and that had greater than 50 detections), and similarly constructed “environmental correlate models” for the total number of breeding birds and riparian birds detected within 50 m of stations (“habitat” is species-specific so we do not use this term for groups of species).
We first screened for highly correlated variables by computing pairwise correlations (Pearson’s correlation coefficients) and then eliminated one variable of any pair where r ≥ 0.65 (retaining the most biologically significant variable), yielding a set of 18 environmental covariates for potential inclusion in habitat/covariate models (table 1-1). To choose a candidate model of environmental covariates for each species or species group, we fit all possible models because we had no a priori expectations. The stepwise variable selection platform in JMP 9.0.2 (SAS Institute, Inc.) was used to select an environmental habitat model (using “all possible models” option with “minimum BIC” as a stopping rule, fitting up to eight parameters). Due to the possibility of potentially correlated variables (biologically if not statistically), and to guard against over-fitting models, we used Bayesian Information Criterion (BIC; Schwarz, 1978) to rank support for each model:
-2loglikelihood + k × ln(n),
where
k is the number of parameters, and n is the sample size (that is, the number of data points in the study; n=240).
11
We chose BIC over AIC (Akaike Information Criteria) for initial model selection because it applies a larger penalty for each additional model parameter that is dependent on the sample sizes (Ramsey and Schafer, 2002); therefore, models were much more parsimonious and less likely to include insignificant or redundant variables. Each model explained relative abundance, or richness, at all stations sampled.
After building models that attempted to account for variation attributable to habitat of each species or for environmental correlates of the different species groups, we examined whether or not beaver-related variables explained additional variation over the habitat/covariate models alone, and the strength of the additional model parameters. The models were ranked and compared using AICc values, ΔAIC, and Akaike weights (wi). AICc were used for initial ranking of models. Models with beaver-related variables in which ΔAIC ≤ 2 of the top ranked variable are reported (that is, regression coefficients), although we give summary model statistics (R2, AICc, delta AIC, Akaike weights) for all models ranked used Burnham and Anderson’s (2004) “simple rules of thumb” to assess the relative merits of models in the set, where models having ΔAIC ≤ 2 have substantial support (evidence), those in which 4 ≤ ΔAIC ≤ 7 have considerably less support, and models having ΔAIC > 10 have essentially no support. Finally, we considered evidence that the top-ranked models (highest-ranked habitat/environment and beaver models) contained the most accurate model using wi, which reflects the likelihood that a particular model was best among those considered (Burnham and Anderson, 2004; Chandler and others, 2009).
We used JMP 9.0.2 (SAS Institute, Inc.) for all statistical analyses. To better meet assumptions, most continuous variables were log transformed ([X + 1] log 10) before regression analyses. Although this transformation did not always result in normal univariate distributions, residuals were checked after fitting final models to confirm approximate normality. For example, the distribution of variables with percent values were compared after arcsine and log transformations, and the log-transformed variables were retained after determining that the distribution of the residuals was approximately normal (Ramsey and Schafer, 2002. We used P ≤ 0.05 as our accepted level of significance for all t-tests and inferences regarding individual regression estimates, and based the latter on the variables included within the ranked models (that is, rather than using model averaging) because each beaver variable was entered in only one model.
Results
Avian Survey Effort and Detections A total of 1,480 survey visits (759 in 2005; 721 in 2006) were conducted at the 240 stations;
greater than 90 percent of stations were surveyed three times per year. Relative abundance at stations after truncating detection data at 50 m was most strongly correlated with the density calculated by program DISTANCE, for both Yellow Warbler (r=0.93, P < 0.0001) and Song Sparrow (r=0.892, P < 0.0001). After excluding birds detected at distances greater than 50 m from stations, flyovers, wintering birds and obvious migrants, juveniles, or other birds for which detectability may have been compromised (for example, vagrants), we analyzed 13,590 detections of 76 species known to breed in the upper San Pedro River Basin (table 1-4). This included 42 species that primarily are associated with riparian vegetation and surface water in the region, and 34 species that more typically use upland vegetation and yet also visit adjacent riparian areas (Hunter and others, 1987; Krueper, 1999; Brand and others, 2010a). Of the 42 riparian-associated species, 28 were riparian specialists, and 14 were riparian generalists. Additionally, 68 percent of species (52 of 76) were primarily insectivorous, and 25 percent were species of regional conservation concern (Hunter and others, 1987; U.S. Fish and Wildlife Service, 2008). Of the 19 species of regional conservation concern, 14 also were riparian-associated species (table 1-4), and 11 of these had sufficient detections to test for differences in relative abundance between sites with and without beaver.
12
Beaver Activity Beaver census data yielded 2,943 observations of sign (bank dens, gnawed, or felled trees) and at
least 122 instances where dams were found on the upper San Pedro River from 2000 to -2006, allowing us to determine the number of years in which beaver may have influenced the environment at avian survey station locations. At 64 percent of stations (n=154) beavers were apparently absent as no sign was documented, with the remaining 36 percent of stations (n=86) divided between low-, moderate-, and high-use sites (14, 14, and 8 percent of stations, respectively). Beaver dams were located within the following distance categories from stations—within 50 m at 14 percent of stations (n=33), within 51–100 m at 5 percent of stations (n=13), and 100–150 m downstream of 3 percent of stations (n=6) (see table 1-2 for totals by year). Including all signs documented over the 6-year period at the 36 percent of stations that had some level of beaver activity within 100 m, 14 percent were stations (n=34) where only presence was documented, whereas dams were documented at the 22 percent (n=52) of stations (that is, those categorized as moderate- and high-use (table 1-3).
Virtually all woody vegetation that beaver felled, gnawed, or consumed living materials from was either willow or cottonwood. No tamarisk, mesquite, or other woody species was observed gnawed more than a few times, although limbs of these species were occasionally seen in dam construction. The stem density (DBH) counts within 30 m of each station revealed that extant beaver stumps represented a maximum of 15, 19, and 20 percent of total basal area of cottonwood/willow stems within beaver low-, moderate-, and high-use sites, respectively. However, the sites with the highest percentage of stump basal area within each level of beaver intensity all hosted a relatively low number of stems (for example, total of 10 trees and/or stumps), meaning that a few stumps could make up a large proportion of stems and thus basal area. Considering the summed basal area for cottonwood and willow (because the stumps of these two species were not always readily distinguished) across all sites within each of the low-, moderate-, and high-use beaver intensity classes, extant beaver stumps represented a total of 1.9, 2.2, and 1.6 percent of total cottonwood/willow basal area within each class, respectively (fig. 1-2). Within the low-, moderate-, and high-use sites, beaver-gnawed (but standing) trees represented 5.5, 3.5, and 5.2 percent of the summed basal area of cottonwood trees, and 4.2, 7.9, and 3 percent of willow trees, respectively (fig. 1-2).
Beaver dams typically were located at or near wash inlets or other areas where obvious sediment deposits or exposed bedrock would obstruct channel morphology to such an extent that water might be pooled upriver from the inlet. The water impounded by beaver dams raised the water level in the river from 0.1 to greater than 1 m (in correlation with the size of dams), and in some cases also affected the water table in the surrounding riparian floodplain (U.S. Geological Survey, unpub. groundwater data, 1999). However, in many cases, the impounded backwater was restricted to areas where water was naturally pooled already or where the backwater was within an incised channel (that is, ≥ 1 m below the lower floodplain). Thus, the beaver-impounded water rarely breached the channel bank or created classic stream braiding along the lowest channel shelf and other areas of the lower floodplain. An exception to the above pattern was a unique area (between Hereford Road and Hunter Wash) that had reduced canopy cover because of two fires within the prior 10 years (one in 1999, another in 2003, M. Fredlake, Bureau of Land Management, oral commun.), and a generally less-incised channel. Here, braiding, multiple smaller channels, and a higher water table appeared to be associated with beaver presence. Perhaps because of the reduced woody canopy cover in this reach, beaver apparently consumed mostly cattail, bulrush, and other non-woody emergent riparian vegetation, in addition to willow and cottonwood where available. Dams in this area were largely constructed of mud, rocks, and a higher percentage of non-woody vegetation than seen in other reaches.
13
Non-Random Spatial Association between Beaver and Birds The majority of the eight species groupings we considered had higher richness and/or abundance
(P <0.001, from two-tailed t tests for difference in means, degrees of freedom=239) at sites where beaver presence had been documented as compared to where they had not (table 1-5, figs. 1-3 and 1-4). The greatest difference in the number of species was riparian specialists, with a 26.9 percent mean difference (2.3 species/survey), and the least significant difference was the number of conservation concern species with 7.4 percent more species (P = 0.035) found at sites where beaver have been documented (table 1- 5). Total breeding bird community species richness was greater at sites where beaver had been documented, with a mean difference of 12.8 percent (= 2.4 species). The only non-significant difference in mean number of species detected at beaver presence versus absence sites was for the number of riparian generalist species, with only a 0.2 percent difference (P=0.947, table 1-5). As well, relative abundance was higher at sites with beaver for the two groups for which this metric was analyzed, with 25.2 percent more insectivorous birds (= 1.66 more birds) and total breeding bird relative abundance 27.1 percent higher (= 2.7 more birds) on average per visit.
Of the 76 breeding species that we considered, a total of 31 had sufficient detections to test for non-random spatial association (two-tailed t tests, 239 degrees of freedom) with beaver (table 1-6). Of these 31 species, relative abundance was significantly greater (P ≤ 0.05) for 11, including three species of conservation concern—Yellow-billed Cuckoo, Northern Flicker (Colaptes auratus), and Yellow Warbler. Two species had significantly fewer (P ≤ 0.05) individuals detected per visit at sites where beaver were documented, Ash-throated Flycatcher (Myiarchus cinerascens) and Northern Beardless-Tyrannulet (Camptostoma imberbe), the latter being a species of conservation concern. Additionally, there were seven species that were more common at sites where beaver had been documented, although the differences were non-significant at the P ≤ 0.05 level; this group included Mallard, Ladder-backed Woodpecker (Picoides scalaris), and Gila Woodpecker (Melanerpes uropygialis) (table 1-6).
Bird-Habitat Associations We modeled bird-habitat associations for 13 species (table 1-7), 12 of which showed at least a 50
percent difference in relative abundance for beaver presence than for beaver absence sites and for which this difference was significant (P≤ 0.05) (table 1-6). Although Yellow Warbler relative abundance was only 32 percent greater at sites where beaver had been documented, we included this species in habitat models because the difference in relative abundance was highly significant (P <0.001), and because the Yellow Warbler was the most common bird detected, and is a species of regional conservation concern. Additionally, we built environmental covariate models (table 1-7) for the seven species groups that showed a non-random association with beaver presence (table 1-5).
Relative abundance of bird populations and species groups was consistently explained by a small set of the 18 environmental variables that we considered. Surface water was an important explanatory factor in more than one-half of models (table 1-7). For individual species, both the presence of surface water in May or the persistence of perennial surface water throughout the summer were included in 46 and 62 percent of the models, respectively, and for species groups, the presence of water in May was especially important (included in 86 percent of models) and perennial surface water was included in two models (29 percent). Perennial water was the only factor in the models that explained relative abundance of Brown-headed Cowbirds (Molothrus ater). Cottonwood and willow (cover and/or abundance) were included in 62 and 31 percent, respectively, of the individual species relative abundance models, whereas for species groups, cottonwood and willow were included in 43 and 86 percent of models, respectively. Relative abundance of 23 percent of species and no species group richness or relative abundance included mesquite cover or basal area, and relative abundance of two (15 percent) species and two (29 percent) species groups included tamarisk cover or basal area.

14
Despite the consistent importance of several factors in explaining relative abundance of birds, the proportion of variation explained by vegetation and water factors varied somewhat depending on the response variable. Percent variation in abundance that was explained by habitat models (R2) ranged from as low as 7–8 percent for species with fewer detections, such as Black Phoebe (Sayornis nigricans), Brown-headed Cowbird, and Yellow-billed Cuckoo, to as high as 35–42 percent for more common species such as Song Sparrow, Yellow Warbler, Common Yellowthroat (Geothlypis trichas), and Lesser Goldfinch (Spinus psaltria) (table 1-8). Among seven species groups, percent of variation in richness explained by the environmental covariates (table 1-7) was low for total number of conservation concern species (R2=0.13) and highest for the number of riparian specialist species (R2=0.44) (table 1-8). Percent variation explained by the two species groups’ relative abundance models was relatively high (R2=0.44), both for all breeding species and all insectivorous birds.
Effects of Beaver on Vegetation/Habitat After accounting for variation in relative abundance and species richness attributable to
environmental factors (table 1-7), models that included beaver presence, intensity, and number of years with dams within 50 m ranked higher for 46 percent of species and 71 percent of species groups (tables 1-8 and 1-9) than the habitat/covariate-only models. Conversely, models containing beaver-related factors did not explain more variation in relative abundance better than the habitat-only models for 54 percent of the 13 species, or more species richness for 28 percent of the 7 species groups (tables 1-8 and 1-9).
Models with beaver-related variables did not perform better for either of the two bird species for which mean relative abundance was negatively associated with beaver activity (Ash-throated Flycatcher and Northern Beardless-Tyrannulet, table 1-6), and although R2 values were marginally higher when beaver terms were included in the models, the habitat-only models were weighted with higher probabilities (wi=0.39 and 0.53 probability) of containing the best model, after delta AIC rankings (table 1-8). For the 11 species that were positively associated with beaver activity from t-tests (table 1-6), the multiple linear regression models that included beaver factors were ranked higher than those with only water or vegetation factors for 55 percent of species. For the remaining 45 percent of these 11 species, model weights indicated a <0.005–0.34 probability that beaver factors might explain relative abundance (table 1-8). For the four species of conservation concern included in the model-fitting because of their non-random association with beaver, beaver models for only one (Yellow Warbler, habitat + number of years dams present within 50 m) indicated this as the highest probability model (wi=0.57), whereas for the other three species (Yellow-billed Cuckoo, Northern Flicker, and Northern Beardless Tyrannulet), the habitat-only model was the best performing and model weights indicated a 0.22 to 0.28 probability that beaver factors explained relative abundance (table 1-8). For the six species for which beaver-related variables improved model performance, four of these [Common Yellowthroat, Lesser Goldfinch, White-breasted Nuthatch (Sitta carolinensis), and Cassin’s Kingbird (Tyrannus vociferans)] had habitat models further than 2.0 ΔAIC from the top-model, and two species (Yellow Warbler and Song Sparrow) still retained the habitat-only model within 2.0 ΔAIC.
There was little evidence that beaver-related variables explained relative abundance for 2 of the 7 species groups positively associated with beaver activity, including for the number of 14 riparian conservation concern species, or the relative abundance of insectivorous birds (table 1-8). For five of the seven species groups that were positively associated with beaver activity, model performance improved when we constructed models containing beaver-related variables over the environmental covariate-only model. These groups included the overall richness and relative abundance for all breeding bird species, and species richness of all 42 riparian-associated species, riparian specialists, and insectivorous birds

15
table 1-8). For the five groups for which beaver-related variables improved model performance, four had environmental covariate-only models that were displaced by the beaver models to greater than 2.0 ΔAIC within the top-model, with only one group (insectivorous bird species richness) still retaining the covariate-only model within 2.0 ΔAIC (table 1-8).
Multi-model inference, according to lowest AIC score and Akaike weights (wi), indicated that models including beaver-related variables better explained bird abundance or richness (6 of 13 species, and 5 of 7 species groups), although the estimates of the effects of beaver and their relative magnitude of influence were usually smaller relative to other covariates (table 1-9). For example, after accounting for habitat variables, there was some evidence (P=0.06) that Yellow Warbler abundance might decline with the greater number of years a site had beaver dams present within 50 m (table 1-9). However, because both the response and explanatory variables are in the log(10) scale, the effect (a 1 percent increase in the number of years with a dam would lead to a 0.097 percent decrease in mean relative abundance) turns out to be small, even though statistically significant and contributing to model performance (table 1-9). Similarly, a 1 percent increase in the number of years a site had dams within 50 m was associated with 0.07 percent increase in Song Sparrow abundance. For species groups, the models containing beaver-related variables contained estimates that were both on the same order of magnitude as other factors and the beaver-related variables were significant, or at least nearly so, at the P <0.05 level. For example, a 1 percent increase in the number of years a site had dams was associated with a 2.5 percent increase in the number of breeding species.
Discussion We found evidence that relative bird abundance and species richness along the upper San Pedro
River were better explained by models that included beaver presence or intensity of use than models that incorporated only environmental habitat factors. Whereas other researchers—all from outside the Southwestern United States—reported greater differences in bird communities in areas with or without beaver influence (for example, Bulluck and Rowe, 2006; Cooke and Zack, 2008), and sometimes soon after a reintroduction occurred (for example, Medin and Clary, 1990) on the upper San Pedro River the effect sizes of beaver-related variables were relatively small (although highly significant) compared to the other environmental factors. Considering previous avian research in the study area (Brand and others, 2008, 2010a, 2011; Krueper and others, 2003) and in the region (Carothers and others, 1974; Anderson and Ohmart, 1984), the finding that riparian vegetation and surface water strongly influence avian communities on the upper San Pedro is not unexpected. However, the strong association between beaver activity and bird abundance and richness on the upper San Pedro River indicates that beaver reintroduction in southwestern riparian systems may have an important additive influence on avian populations—especially given the relatively short length of time beavers had been in system.
In the majority of species or species groups where model performance was enhanced by fitting rich models containing beaver-related variables, the significance and effect size of the beaver variables was relatively small compared to the environmental factors related to woody vegetation and surface water. As well, the statistically significant relationship observed between beaver activity and bird metrics (from t-tests) and the associated effect sizes were reduced after accounting for the habitat/environment covariates (from multiple linear regressions). However, although the beaver-related parameter estimates associated with bird species groups and relative abundance of individual bird species may seem biologically negligible, these estimates pertain to average abundance and species richness at the scale of a 50-m sampling stations across a 68.5-km river reach. When extrapolated across the study area, even a seemingly negligible difference across 50-m plots may in fact scale up to be biologically important across the entire study area. For example, a 73.6 percent difference in Song Sparrow abundance at sites with beaver as compared to sites without beaver equates to only 0.33 more birds per station-visit (table 1-6); however,

16
this is a biologically significant number of individuals when considering all individual birds at the stations where both beavers and Song Sparrows were detected (78 stations=78 *0.33=25.74 more birds), or when extrapolated to the proportion of the study area, these sampling stations represent (78/240=32.5 percent of the study reach, 22.26 km is 32.5 percent of 68.5 km, 22.26 km would host 445.2 plots of 50-m, so [445.2 * 0.33]=146.9 birds per visit across the study area). For birds of conservation concern that are rare on the landscape (for example, Yellow-billed Cuckoo), even small differences in the total number of individual birds may be crucially important for population maintenance (table 1-6).
Jones and others (2010) described predictive equations related to four cause-and-effect criteria for interpreting ecosystem engineering. These included (1) the engineer causes structural change, (2) structural change leads to abiotic change, (3) structural and abiotic change leads to biotic change, and (4) structural, abiotic, and/or biotic change can feedback to the engineer (Jones and others, 2010). Although we did not formally incorporate their approach in our study, the upper San Pedro River would be well-suited for inclusion as a replicate sampling site in a comparative study that included other sites with different levels of the parameters described by Jones and others (2010; that is, time since engineering species establishment, magnitude of potential engineer effects given abiotic conditions and other species present, etc.).
In our study system, the anticipated abiotic effect of beavers on the bird community was either a reduction in canopy cover because of tree-felling, an increase in surface-water retention, or both. We did not find evidence that beavers had substantially reduced canopy cover since being reintroduced, as sites with beaver had similar tree stem density as sites without beaver. The potential for increased surface-water retention because of beaver dam construction was compromised because the dams on the San Pedro River typically failed every summer during monsoon flooding, and because active dams raised water levels within a highly entrenched channel that was often a natural backwater area already (M. Fredlake, Bureau of Land Management, oral commun.), and thus there was little widening of the water courses or a braiding effect on floodplain. Thus, the initial (abiotic) pathways of an ecosystem engineering interaction were not pronounced or obvious within the time between when the reintroduction began and when we conducted our study.
Nonetheless, USGS groundwater wells adjacent to beaver ponds showed a measurable increase in groundwater levels (C. van Riper, U.S. Geological Survey, oral commun.). Any increase in the soil-water interface during the dry season may facilitate increased riparian vegetation production, thus providing more vegetation and other habitat components for the breeding riparian bird community. An increase in water retention also likely will benefit water-obligate bird species. We included all water obligates detected within 50 m and the cottonwood-willow obligates into the “riparian specialist” group (because of low numbers of water-obligate birds detected), which as an entire group was indeed strongly associated with beaver activity.
Although beaver activity was associated with sites that contained a high number of species and relative abundance of many species and species groups, we could not rule out the possibility that beaver may have just selected habitat that already contained these features. The fairly short length of time between the reintroduction and our study, and the apparent lack of signature, pronounced ecosystem-engineering effects of beavers, supports this possibility. Future studies of the ecosystem engineering effects of beavers in relation to birds or other taxa need to account for the possibility that beaver habitat selection may confound the finding of an effect of beavers in relation to birds. This is especially the case in the desert Southwest, where riparian vegetation provides abiotic resources (amelioration of extreme temperatures and aridity, nest substrate, predator-free-space, etc.) and facilitates trophic opportunities (for example, herbivory, insect habitat and foraging, etc.). In fact, willow (Salicaceae) has recently been cited for its ecosystem engineer-like ability to alter river hydrology and how this feeds back to the (willow)

17
population as well as the surrounding riparian vegetation (Moggridge and Gurnell, 2009). No work to date has explicitly evaluated the relative or interactive ecosystem engineering effects of beaver and willow (or cottonwood) in relation to birds, but this is an important question for future research.
Beavers are potentially beneficial for some riparian attributes and the ecosystem engineering concept can provide valuable insights in the study of beaver, birds, and riparian restoration. However, land managers, scientists, and the public should have realistic expectations informed by the site-specific context of a potential reintroduction, and ideally make comparisons with other, similar sites before moving forward with a reintroduction project. Because the relative effect of any organism on its environment will likely be different in a given situation, it may be important to investigate potential engineering effects along environmental gradients in order to predict when the strongest “engineering” effects (that is, feedbacks to the engineer and other species in the area) are likely to occur (Wright and others, 2006; Jones and Gutiérrez, 2007). The reach of the San Pedro River we surveyed contains an environmental gradient in terms of water and riparian vegetation cover—both important explanatory factors for beaver and birds, and is situated in a more arid region than previous investigations of the relationship between bird metrics and beaver activity. In the Southwest region, beaver could potentially provide resources (namely water) and/or disturbance processes (opening canopy gaps through herbivory) that might not otherwise occur, or at least in greater proportion than would occur without the “engineer” species.
Although we found evidence that beaver activity was strongly associated with bird abundance and richness, the magnitude of the ecosystem engineering effect may have been reduced by the unique environmental context occurring on the San Pedro River. First, each year all beaver dams failed during heavy monsoon-season flooding (M. Fredlake, Bureau of Land Management, oral commun.). Second, because water is limited to certain reaches where groundwater from the local aquifer supplies the surface water in the river, and beavers were limited to these reaches, beaver are only able to settle in certain sites where water is already present. Third, geomorphic processes exert a dominant influence in the system, including large flood disturbances that create patches of early successional habitat, and also tributary washes dumping sediment loads within the main channel and creating a back-water behind them (an abiotic process mimicking the consequences of dam-building), where beavers often chose to settle. Within these back-water areas, channel morphology remained incised, and thus there was little opportunity for immediate increases in channel width, even after beaver built dams that raised the water level. Fourth, beavers were newly reintroduced (5–6 years before the study) to the system, and thus there was little time for the engineering effects to accrue, or for bird populations to respond to these changes. Lastly, the upper San Pedro River bird community is already highly diverse, and yet within this diverse community, there is actually a limited pool of the bird species groups that have (in other studies) shown the most marked responses to beaver activity (for example, Medin and Clary, 1990; Cook and Zack, 2008). For example, during the breeding season, there are only one waterfowl species, three woodpeckers, one shorebird, and two herons regularly present on the San Pedro River (Krueper, 1999).
Spatial or temporal scales can be important considerations in the study of ecosystem engineers, for example, beaver activity can influence stream morphology at the watershed scale, especially when many beavers are present (Wright and others, 2006). Similarly, the effect of a single beaver’s activity can extend for many decades beyond its lifetime; for example, impounded areas can become full of sediment and undergo succession from a wetland, to meadow, and finally to forest (Wright and others, 2002, 2003; Wright, 2009; Jones and others, 2010). For 2 years, we studied a 70-km reach of a watershed and 240 sampling stations within that reach, but did not investigate multiple temporal or spatial scales (for example, station as compared to a 1, 2, or 10-km reach). To gain further insight, it would likely be beneficial to consider other watersheds, or finer scale reaches within a watershed (for example, 1–2 km), and naturally occurring beavers at the same time as reintroduced beavers, and ideally within a before-after/control-impact study design. A collaboration is underway with other researchers who conducted

18
studies prior to beaver reintroduction on the San Pedro River (Krueper and others, 2003; Brand and others, 2010a) to re-survey sites with and without beaver influence (Johnson and van Riper, Chapter 2 of this report). We anticipate this study and future work in the upper San Pedro River will help determine the extent to which the bird community changed after beaver reintroduction in addition to our current study, which measured the association after the reintroduction occurred.
Conclusion Most organisms modify their environment to various degrees and interact with other organisms in
that environment. To the extent that an ecosystem engineering process and its consequences affect community dynamics, ecologists can consider whether this environmental modification constitutes an interaction, either through indirect, direct, or cascading effects. We found that although bird abundance and species richness were certainly associated with beaver activity, the ecosystem engineering-type interaction was not as pronounced compared to what has been found in other regions. More study is needed to ascertain whether this was because of the relatively short time beavers had been in the system, unique environmental conditions, or both. The environmental context of the San Pedro River that could limit the ecosystem engineering effect of beavers included disturbance effects greater than those of the beaver (monsoon floods) and a deeply entrenched channel that (together) may have resulted in an ephemeral or marginal influence of beaver dams. Other conditions important to consider at this site include the presence of cottonwood and willow, reaches without surface water (limiting the beaver settlement opportunities), and a bird community that was already known for being highly diverse and abundant (Brand and others, 2010b). These factors likely contributed to a situation in which the potential ecosystem engineering effects of beaver may not be as profound as those seen in other studies.
Riparian bird communities, especially in the Southwestern United States, are noted for their generally high bird abundance and diversity as well as other important ecosystem services, and consequently land managers, scientists, and the public support efforts to predict how human-influenced impacts such as groundwater withdrawal or climate change will affect this ecosystem type (for example, Steiner and others, 2000; Steinitz and others, 2005; Brand and others, 2011). Considerable effort and more than 400 million dollars has been allocated toward riparian restoration projects in the Southwest since 1990, and providing habitat for birds and other wildlife is one of the major intentions—as well as criterion for success—for these projects (Follstad-Shah and others, 2007). Restoration ecologists, land managers, and the public need to set realistic goals for ecosystem restoration (Hobbs, 2007), and part of this process, especially in the Southwest, should involve an evaluation of when and where beaver reintroduction may assist in well-defined restoration objectives.
Beaver reintroduction did not appear to have detrimental effects on any species of conservation concern and, in fact, there was evidence that a breeding bird community is more abundant and more diverse where beavers were present. Future research is needed to determine when, and under what conditions, beaver may be helpful to the full complement of riparian restoration goals as defined by Fredlake (1997) and under what conditions they may be detrimental to conservation objectives (for example, recovery or maintenance of Yellow-billed Cuckoo populations). Our findings indicate that there appears to be no cause for alarm when beavers are found actively utilizing riparian vegetation (for example, see also Longcore and others, 2007), at least in areas where beaver are native. Our study, as well as most of the prior avian research in the region, also suggests that beaver reintroduction and conservation of riparian bird communities in the Southwestern United States can co-exist, especially if monitoring of cottonwood and willow occurs in conjunction with the effort.

19
Although more time and investigation is needed to determine the full extent of beaver influence on the upper San Pedro River, it is clear that the spatial association of beaver activity and a highly abundant and diverse bird community represent an important opportunity to evaluate the ecosystem engineering effects of beaver in a unique environmental context. Although we did not investigate other attributes of ecosystem restoration that beaver may contribute to, we conclude that beaver are more likely to benefit rather than harm San Pedro’s bird community—as long as an adaptive management program continues along with monitoring in areas with beaver activity, dense willow or other riparian vegetation, and bird species of conservation concern. Rigorous assessment of beaver reintroduction projects need to incorporate before-after/control-impact studies (Johnson and van Riper, Chapter 2 of this report) and thorough evaluation of unique, site-level ecological context and history, so that the potential for beavers to act as riparian restoration agents through their ecosystem engineering behaviors and its consequences can be evaluated and repeated where appropriate.
Acknowledgments Many people made this research possible and a valuable undertaking for the authors. Mark
Fredlake, Bill Childress, and Marcia Radke with the Bureau of Land Management’s Sierra Vista office for the San Pedro Riparian National Conservation Area kindly facilitated access to the study area, housing during the field season, and data from previous research; discussions with Mark Fredlake and his introduction to the study area early in the project planning phase were invaluable. Funding for the field research was generously provided the U.S. Fish and Wildlife Service Sonoran Joint Venture, T & E, Inc., and the U.S. Geological Survey. We sincerely appreciate the funding awarded through the following University of Arizona programs: the Silliman Memorial Research Award, the Institute for the Study of Planet Earth Graduate Travel Award, Graduate and Professional Student Council Travel Grant, and both the International Wildlife Foundation Scholarship and the Arrington Memorial Scholarship provided through the College of Agriculture.
We were privileged to have some extraordinary field assistants: Brian Bielfelt, Morgan Jackson, and Sonja Smith were all focused, energetic, and thoroughly capable field biologists who collected excellent bird survey data; Jessica Gist, Josh Brown, Stacy Cossell, and Claire Zugmeyer all helped immensely with many different aspects of the extensive vegetation measurements and subsequent data entry process. We cannot thank all of them enough for their many contributions and great company. We also thank William Mannan, Courtney Conway, and Cecil Schwalbe, who all provided critical advice and much-needed guidance. Arriana Brand and Dave Krueper were both generous with their time, data, and wisdom derived from multiple years of avian study in the upper San Pedro River Valley—the solid foundation provided by their work made our research possible. In addition to the above, we also thank Robert Steidl, William Pine, Joseph Watkins, and Aaron Flesch for advice on different sampling design, statistical, or modeling considerations.

20
References Cited Albert, S., and Trimble, T., 2000, Beavers are partners in riparian restoration on the Zuni Indian
Reservation: Ecological Restoration, v. 18, no. 2, p. 87–92. Apple, L.L., 1985, Riparian habitat restoration and beavers—Riparian ecosystems and their
management—Reconciling conflicting uses: North American Riparian Conference, 1st, University of Arizona, Tucson, Ariz., April 16–18, 1985.
American Ornithologist’s Union, 2011, Checklist of North American birds (7th ed. with changes incorporated through 52nd supplement), http://www.aou.org.
Anderson, B.W., and Ohmart, R.D., 1977 Vegetation structure and bird use in the lower Colorado River Valley, in Johnson, R.R., and Jones, D.A., technical coordinators, Importance, preservation and management of riparian habitat—A symposium: U.S. Forest Service General Technical Report RM-43, Fort Collins, Colorado, p. 23–34.
Arner, D.H, 1963, Production of duck food in beaver ponds: Journal of Wildlife Management, v. 27, p. 76–81.
Aznar, J., and Desrochers, A., 2008, Building for the future—Abandoned beaver ponds promote bird diversity: Ecoscience, v. 15, no. 2, p. 250–257.
Badano, E.I., and Cavieres, L.A., 2006, Ecosystem engineering across ecosystems—Do engineer species sharing common features have generalized or idiosyncratic effects on species diversity?: Journal of Biogeography, v. 33, no. 2, p. 304–313.
Baker, B.W., and Hill, E.P., 2003, Beaver (Castor canadensis), in Feldhamer, G.A., Thompson, B.C., and Chapman, J.A., eds., Wild mammals of North America—Biology, management, and conservation (2d ed.): Baltimore, Maryland, The Johns Hopkins University Press, p. 288–310.
Berke, S.K., 2010, Functional groups of ecosystem engineers—A proposed classification with comments on current issues: Integrative and Comparative Biology, v. 50, no. 2, p. 147–157.
Boogert, N.J., Paterson, D.M., and Laland, K.N., 2006, The implications of niche construction and ecosystem engineering for conservation biology: BioScience v. 56, no. 7, p. 570–578.
Boyle, S., and Owens, S., 2007, North American beaver (Castor canadensis)—A technical conservation assessment: U.S. Forest Service, Rocky Mountain Region, Species Conservation Project, accessed November 11, 2011, at http://www.fs.fed.us/r2/projects/scp/assessments/northamericanbeaver.pdf.
Brand, L.A., Cerasale, D.J., Rich, T.D., and Krueper, D.J., 2010b, Breeding and migratory birds—Patterns and processes, in Stromberg, J.C., and Tellman, B., eds., Ecology and conservation of the San Pedro River, Tucson, Ariz., University of Arizona Press, p. 153–174.
Brand, L.A., Stromberg, J.C., Goodrich, D.C., Dixon, M.D., Lansey, K., Kang, D., Brookshire, D.S., and Cerasale, D.J., 2011, Projecting avian response to linked changes in groundwater and riparian floodplain vegetation along a dryland river—A scenario analysis: Ecohydrology, v. 4, no. 1, p. 130–142.
Brand, L.A, Stromberg, J.C., and Noon, B.R., 2010a, Avian density and nest survival on the San Pedro River—Importance of vegetation type and hydrologic regime: The Journal of Wildlife Management, v. 74, no. 4, p. 739–754.
Brand, L.A, White, G.C, and Noon, B.R., 2008, Factors influencing species richness and community composition of breeding birds in a desert riparian corridor: The Condor, v. 110, no. 2, p. 199–210.
Brown, M.K., and Parsons, G.R., 1979, Waterfall production on beaver flowages in a part of northern New York: New York Fish and Game Journal, v. 26, no. 2, p. 142–153.
Buckland, S.T., Anderson, D.R., Burnham, K.P., Laake, J.L., Borchers, D.L., and Thomas, L., 2001, Introduction to distance sampling—Estimating abundance of biological organisms: Oxford, United Kingdom, Oxford University Press, 448 p.
Bulluck, J.F., and Rowe, M.P., 2006, The use of southern Appalachian wetlands by breeding birds, with a focus on neotropical migratory species: The Wilson Journal of Ornithology, v. 118, p. 399–410.

21
Burnham, K. P., and Anderson, D. R., 2004, Multimodel Inference: Understanding AIC and BIC in Model Selection Sociological Methods Research v,33, p. 261-304.
Byers, J.E., Cuddington, K., Jones, C.G., Talley, T.S., Hastings, A., Lambrinos, J.G., Crooks, J.A., and Wilson, W.G., 2006, Using ecosystem engineers to restore ecological systems: Trends in Ecology and Evolution, v. 21, no. 9, p. 493–500.
Carothers, S.W., Johnson, R.R., and Aitchison, S.W., 1974, Population structure and social organization of southwestern riparian birds: American Zoology, v. 14, p. 97–108.
Carr, W.H., 1940, Beaver and birds: Bird Lore, v. 42, no. 2, p. 141–146. Chandler, R.B., King, D.I., and Destefano, S., 2009, Scrub–shrub bird habitat associations at multiple
spatial scales in Beaver Meadows in Massachusetts: The Auk, v. 126, p. 186–197. Cooke, H.A., and Zack, S., 2008, Influence of beaver dam density on riparian areas and riparian birds in
shrub steppe of Wyoming: Western North American Naturalist, v. 68, no. 3, p. 365–373. Crain, C.M., and Bertness, M.D., 2006, Ecosystem engineering across environmental gradients—
Implications for conservation and management: Bioscience, v. 56, no. 3, p. 211–218. Cuddington, K., Byers, J.E., Wilson, W.G., and Hastings, A., eds., 2007, Ecosystem engineers—Plants to
protists, v. 4 of Theoretical Ecology Series: Academic Press, 132 p. Cuddington, K., Wilson, W.G., and Hastings, A., 2009, Ecosystem engineers— Feedback and population
dynamics: The American Naturalist, v. 173, p. 488–498, doi:10.1086/597216. Davis, T., 2004, A thirst for growth: High Country News, v. 36, no. 16, p. 7–12. Dunster, J.A., and Dunster, K.J., eds., 1996, Dictionary of natural resource management: Vancouver,
British Columbia, University of British Columbia Press, 368 p. Edwards, N.T., and Otis, D.L., 1999, Avian communities and habitat relationships in South Carolina
piedmont beaver ponds: American Midland Naturalist, v. 141, p. 158–171. Emlen, J.T., 1971, Population densities of birds derived from transect counts: The Auk, v. 88, no. 2, p.
323–342. Finch, D.M., Agyagos, J., McCarthey, T., Marshall, R.M., Stoleson, S.H., and Whitfield, M.J., 2000,
Management recommendations, ch. 10 of Finch, D.M., and Stoleson, S.H., eds., Status, ecology, and conservation of the southwestern Willow Flycatcher: U.S. Forest Service General Technical Report RMRS-GTR-60, p. 107–118.
Follstad-Shah, J.J., Dahm, C.N., Gloss, S.P., and Bernhardt, E.S., 2007, River and riparian restoration in the southwest—Results of the National River Restoration Science Synthesis Project: Restoration Ecology, v. 15, no. 3, p. 550–562.
Fouty, S.C., 2002, Cattle and streams—Piecing together a story of change, in Wuerthner, G., and Matteson, Mollie, eds., Welfare ranching—The subsidized destruction of the American West: Island Press, p. 184–187.
Fredlake, M., 1997, Re-establishment of North American beaver (Castor Canadensis) into the San Pedro riparian National Conservation Reserve Area: Bureau of Land Management Environmental Assessment EA AZ-060-97-004, Tucson, Ariz.
Griffiths, C.J., Jones, C.G., Hansen, D.M., Puttoo, M., Tatayah, R.V., Muller, C.B., and Harris, S., 2010, The use of extant non-indigenous tortoises as a restoration tool to replace extinct ecosystem engineers: Restoration Ecology, v. 18, no. 1, p 1–7.
Grover, A.M., and Baldassarre, G.A., 1995, Bird species richness within beaver ponds in south-central New York: Wetlands, v. 15, no. 2, p. 108–118.
Gurnell, A.M., 1998, The hydrogeomorphological effects of beaver dam-building activity: Progress in Physical Geography, v. 22, p. 167–189.
Hartke, K.M., and Hepp, G.R., 2004, Habitat use preferences of breeding female wood ducks: Journal of Wildlife Management, v. 68, no. 1, p. 84–93.

22
Hobbs, R.J., 2007, Setting effective and realistic restoration goals—Key directions for research: Restoration Ecology, v. 15, no. 2, p. 354–357.
Hunter, W.C., Ohmart, R.D., and Anderson, B.W., 1987, Status of breeding riparian-obligate birds in southwestern riverine systems: Western Birds, v. 18, p. 10–18.
Hupp, C.R., and Osterkamp, W.R., 1996, Riparian vegetation and fluvial geomorphic processes: Geomorphology, v. 14, no. 4, p. 277–295.
Johnson, M.J., Magill, R.T., and van Riper, C., III, 2010, Yellow-billed cuckoo distribution and habitat associations in Arizona, 1998–1999—Future monitoring and research implications, in van Riper, C., III, Wakeling, B.F., and Sisk, T.D., eds., The Colorado Plateau IV—Integrating research and resources in management for effective conservation: Tucson, Ariz., University of Arizona Press, p. 197–212.
Jones, C.G., and Gutiérrez, J.L., 2007, On the purpose, meaning, and usage of the physical ecosystem engineering concept, in Cuddington, K., Byers, J.E., Wilson, W.G., and Hastings, A., eds., Ecosystem engineers—Plants to protists, v. 4 of Theoretical Ecology Series: Academic Press, p. 3–20.
Jones, C.G., Gutiérrez, J.L., Byers, J.E., Crooks, J.A., Lambrinos, J.G., and Talley, T.S., 2010, A framework for understanding physical ecosystem engineering by organisms: Oikos, v. 119, no. 12, p. 1862–1869.
Jones, C.G., Lawton, J.H., and Shachak, M., 1994, Organisms as ecosystem engineers: Oikos, v. 69, p. 373–386.
Jones, C.G., Lawton, J.H., and Shachak, M., 1997, Positive and negative effects of organisms as physical ecosystem engineers: Ecology, v. 78, no. 7, p. 1946–1957.
Krueper, D.J., 1999, Annotated checklist to the birds of the upper San Pedro River Valley, Arizona: U.S. Bureau of Land Management San Pedro Riparian National Conservation Area.
Krueper, D., Bart, J., and Rich, T.D., 2003, Response of vegetation and breeding birds to the removal of cattle on the San Pedro River, Arizona (U.S.A.): Conservation Biology, v. 17, no. 2, p. 607–615.
Laland, K.N., and Boogert, N.J., 2010, Niche construction, co-evolution and biodiversity: Ecological Economics, v. 69, no. 4, p. 731–736.
Leenhouts, J.M., Stromberg, J.C., and Scott, R.L., 2005, Hydrologic requirements of and consumptive ground-water use by riparian vegetation along the San Pedro River, Arizona: U.S. Geological Survey Scientific Investigations Report 2005-5163, 154 p.
Longcore, T., Rich, C., and Mueller-Schwarze, D., 2007, Management by assertion—Beavers and songbirds at Lake Skinner (Riverside County, California): Environmental Management, v. 39, no. 4, p. 460–471.
MacNish, R., Baird, K.J., and Madock, T., III, 2010, Groundwater hydrology of the San Pedro River Basin, in Stromberg, J.C., and Tellman, B., eds., Ecology and conservation of the San Pedro River: Tucson, Ariz., University of Arizona Press, p. 285–299.
Marques, T.A., Thomas, L., Fancy, S.G., and Buckland, S.T., 2007, Improving estimates of bird density using multiple covariate distance sampling: The Auk, v. 127, p. 1229–1243.
McFarland, T.M., van Riper, C., III, and Johnson, G.E., 2012, The usefulness of riparian NDVI models in assessing avian abundance and richness: Journal of Arid Environments, v. 77, p. 45–53.
McKinstry, M.C., Caffrey, P., and Anderson, S.H., 2001, The importance of beaver to wetland habitats and waterfowl in Wyoming: Journal of the American Water Resources Association, v. 37, no. 6, p. 1571–1577.
Medin, D.E., and Clary, W.P., 1990, Bird population in and adjacent to a beaver pond ecosystem in Idaho: U.S. Forest Service Research Paper INT-432, 8 p.
Merendino, M.T., McCullough, G.B., and North, N.R., 1995, Wetland availability and use by breeding waterfowl in southern Ontario: Journal of Wildlife Management, v. 59, no. 3, p. 527–532.

23
Moggridge, H.L., and Gurnell, A.M., 2009, Controls on the sexual and asexual regeneration of Salicaceae along a highly dynamic, braided river system: Aquatic Sciences, v. 71, no. 3, p. 305–317.
Moore, J.W., 2006, Animal ecosystem engineers in streams: BioScience, v. 56, no. 3, p. 237–246. Muller-Schwarze, D., 1992, Beaver waterworks: Natural History, p. 52–53. Naiman, R.J., Johnston, C.A., and Kelly, J.C., 1988, Alterations of North American streams by beaver:
Bioscience, v. 38, p. 753–762. Nijhuis, M., 2011, Beavers' comeback helps restore ecosystems—Long maligned as pests, beavers are
proving indispensable: Audubon, September-October 2011, v. 20. Nummi, P., 1989, Simulated effects of the beaver on vegetation, invertebrates and ducks: Annales-
Zoologici Fennici, v. 26, p. 43–52. Nummi, P., 1992, The importance of beaver ponds to waterfowl broods—An experiment: Annales-
Zoologici-Fennici, v. 29, no. 1, p. 47–55. Nummi, P., and Hahtola, A., 2008, The beaver as an ecosystem engineer facilitates teal breeding:
Ecography, v. 31, no. 4, p. 519–524. Nummi, P., and Poyosa, H., 1997, Population and community level responses in Anas species to patch
disturbance caused by an ecosystem engineer—The beaver: Ecography, v. 20, no. 6, p. 580–584. Olson, R., and Hubert, W.A., 1994, Beaver—Water resources and riparian habitat manager: Laramie,
Wyoming, University of Wyoming, U.S.A., 48 p. Prettyman, B., 2009, Utah wildlife—Leave it to beavers: The Salt Lake Tribune, October 16, 2009,
accessed November 11, 2011, at: http://archive.sltrib.com/article.php?id=13545172&itype=NGPSID&keyword=beaver&sdate=2009-10-15&edate=2009-10-20&qtype=.
Ralph, C.J., Geupel, G.R., Pyle, P., Martin, T.E., and DeSante, D.F., 1993, Handbook of field methods for monitoring landbirds: Pacific Southwest Research Station, General Technical Report PSW-GTR-144-www, 46 p.
Ramsey, F.L., and Schafer, D.W., 2002, The statistical sleuth—A course in methods and data analysis (2d ed.): Pacific Grove, Calif., Duxbury Press, 768 p.
Reese, K.P., and Hair, J.D., 1976, Avian species diversity in relation to beaver pond habitats in the Piedmont region of South Carolina: Annual Conference of Southeastern Association of Fish and Wildlife Agencies, 30th, 1976, p. 437–447.
Renouf, R.N., 1972, Waterfowl utilization of beaver ponds in New Brunswick: Journal of Wildlife Management, v. 36, no. 3, p. 740–744.
Reynolds, R.T., Scott, J.M., and Nussbaum, R.A., 1980, A variable circular-plot method for estimating bird numbers: The Condor, v. 82, p. 309–313.
Rojo, H.A., Bredehoeft, J., Lancewell, R., Price, J., Stromberg, J., and Thomas, G.A., 1999, Sustaining and enhancing riparian migratory bird habitat on the upper San Pedro River: Public review draft from the San Pedro Expert Study Team, prepared for the Commission for Environmental Cooperation, 141 p.
Rosell F., and Parker, H., 1996, The beaver’s (Castor sp.) role in forest ecology—A key species returns: Fauna (Oslo), v. 49, no. 4, p. 192–211.
Rosell, F., Bozser, O., Collen, P., and Parker, H., 2005, Ecological impact of beavers Castor fiber and Castor canadensis and their ability to modify ecosystems: Mammal Review, v. 35, nos. 3–4, p. 248–276.
Schwarz, G., 1978, Estimating the dimension of a model: Annals of Statistics, v. 6, p. 461–464. Skagen, S.K., Melcher, C.P., Howe, W.H., and Knopf, F.L., 1998, Comparative use of riparian corridors
and oases by migrating birds in southeast Arizona: Conservation Biology, v. 12, no. 4, p. 896–909.

24
Sogge, M.K., and Marshall, R.M., 2000, A survey of current breeding habitats, ch. 5 of Finch, D.M., and Stoleson, S.H., eds., Status, ecology, and conservation of the southwestern Willow Flycatcher: U.S. Forest Service General Technical Report RMRS-GTR-60, p. 13–24.
Speake, D.W., 1956, Waterfowl use of creeks, beaver swamps, and small impoundments in Lee County, Alabama: Southeast Association of Game and Fish Commissioners, 2d, 1956, p. 178–185.
Steiner, F., Blair, J., McSherry, L., Guhathakurta, S., Marruffo, J., and Holm, M., 2000, A watershed at a watershed—The potential for environmentally sensitive area protection in the upper San Pedro drainage basin (Mexico and USA): Landscape and Urban Planning, v. 49, p. 129–148.
Steinitz, C., Anderson, R., Arias, H., Bassett, S., Flaxman, M., Goode, T., Maddock, T., III, Mouat, D., Peiser, R., and Shearer, A., 2005, Alternative futures for landscapes in the upper San Pedro River Basin of Arizona and Sonora: U.S. Forest Service General Technical Report PSW-GTR-191, p. 93–100.
Stromberg, J., 1998, Dynamics of Fremont cottonwood (Populus fremontii) and saltcedar (Tamarix chinensis) populations along the San Pedro River, Arizona: Journal of Arid Environments: v. 40, p. 133–155.
Stromberg, J.C., 2001, Restoration of riparian vegetation in the south-western United States—Importance of flow regimes and fluvial dynamism: Journal of Arid Environments, v. 49, p. 17–34.
Stromberg, J.C., and Tiller, R., 1996, Effects of groundwater decline on riparian vegetation of semiarid regions—The San Pedro, Arizona: Ecological Applications, v. 6, no. 1, p. 113–131.
Stromberg, J.C., and Tellman, B., 2010, Ecology and conservation of the San Pedro River: Tucson, Ariz., University of Arizona Press, 544 p.
Thomas, L., Buckland, S.T., Rexstad, E.A., Laake, J.L., Strindberg, S., Hedley, S.L., Bishop, J.R.B., Marques, T.A., and Burnham, K.P., 2010, Distance software—Design and analysis of distance sampling surveys for estimating population size: Journal of Applied Ecology, v. 47, p. 5–14.
Thomsen, M.S., Wernberg, T., Altieri, A., Tuya, F., Gulbransen, D., McGlathery, K.J., Holmer, M., and Silliman, B.R., 2010, Habitat cascades: the conceptual context and global relevance of facilitation cascades via habitat formation and modification: Integrative and Comparative Biology, v. 50, no. 2, p. 158–175.
U.S. Fish and Wildlife Service, 2008, Birds of Conservation Concern 2008: United States Department of Interior, Fish and Wildlife Service, Division of Migratory Bird Management, Arlington, Virginia, 85 p. ]
Webb, R.H., Leake, S.A., and Turner, R.M., 2007, The ribbon of green—Change in riparian vegetation in the southwestern United States: Tucson, Ariz., University of Arizona Press, 480 p.
Wilkinson, T., 2003, The benefits of beavers: National Parks, v. 77, nos. 1–2, p. 30–35. Wright, J.P., Jones, C.G., and Flecker, A.S., 2002, An ecosystem engineer, the beaver, increases species
richness at the landscape scale: Oecologia, v. 132, p. 96–101. Wright, J.P., Flecker, A.S., and Jones, C.G., 2003, Local vs. landscape controls on plant species richness
in beaver meadows: Ecology, v. 84, no. 12, p. 3162–3173. Wright, J.P., and Jones, C.G., 2006, The concept of organisms as ecosystem engineers ten years on—
Progress, limitations, and challenges: BioScience, v. 56, no. 3, p. 203–209. Wright, J.P., Jones, C.G., Boeken, B., and Shachak, M., 2006, Predictability of ecosystem engineering
effects on species richness across environmental variability and spatial scales: Journal of Ecology, v. 94, p. 815–824.
Wright, J.P., 2009, Linking populations to landscapes—Richness scenarios resulting from changes in the dynamics of an ecosystem engineer: Ecology, v. 90, no. 12, p. 3418–3429.

25
Figures
0
100
200
300
400
500
Bird
s C
ount
ed
-10 0 10 20 30 40 50 60 70 80 90 100110
Distance
Figure 1-1. Number of birds counted (Y axis) within 1 meter distance bins (X axis) along the upper San Pedro River, May–July 2005 and 2006. A total of 22,166 bird detections are represented.
0%10%20%30%40%50%60%70%80%90%
100%
C-W
Bas
al A
rea
at S
ites Live C/W Tree
GnawedCottonwood
Gnawed Willow
Stumps
Figure 1-2. Percentage of total basal area of all beaver-gnawed (but standing) cottonwood (Populus fremontii) and willow trees (Salix spp.), and combined basal area of cottonwood-willow stumps and live trees (unaffected by beaver [Castor canadensis]) across all sites within each of the low-, moderate-, and high-use beaver intensity classes, and sites with no beaver use.

26
Figure 1-3. Breeding bird species richness (mean number of 76 species detected within 50 meters of stations) at sites where beavers (Castor canadensis) absent (n=154) and present (n=86); includes 95-percent confidence intervals from t test (table 1-5).
18.9
21.3
0
2
4
6
8
10
12
14
16
18
20
22
24
Absent
No.
Bre
edin
g Sp
ecie
s
Beaver - / +
Present

27
Figure 1-4. Relative abundance of all breeding birds (average number of individuals detected per survey visit within 50 m) at sites where beavers (Castor canadensis) absent (n=154) and present (n=86); includes 95-percent confidence intervals from t test (table 1-5).
10.0
12.7
0
2
4
6
8
10
12
14
Absent Present
All B
ird A
bund
ance
(N/e
ffort
)
Beaver - / +

28
Tables
Table 1-1. Environmental variables used in stepwise variable selection and final habitat/covariate models. [Variables followed by “Lg” were transformed using Log10 (X +1)]
Abbreviation Description
Wash <200 Indicator (=1) if a wash inlet within 200 m (brings in sediment, beavers may settle). H2O May Indicator (=1) if there is water at the point in late May. H2O PER Indicator (=1) if water persists throughout summer (perennial). Rip Veg Width Lg Total width of riparian area vegetation, measured perpendicular to river (includes river channel). BACH Av%Cov Lg Average percent cover of Baccharis (seep willow) within 3 lowest height layers. MESQ Av%Cov Lg Average percent cover of Mesquite within 5 lowest height layers. TAMI Av%Cov Lg Average percent cover of Tamarisk within 4 lowest height layers. SALI Av%Cov Lg Average percent cover of Willow (Salix goodingi) within 6 lowest height layers. POFR Av%Cov Lg Average percent cover of Cottonwood (Populus freemontii) within 9 height layers measured. SumPOFR %Cov 20-30m Lg The summed percent cover of Cottonwood from both of the upper canopy strata (20–25 m, 25–30 m). ALL TAMI LT Lg Summed basal area of live Tamarisk stems, in m²/2,826 m² (tree basal area per 30-m radius plot), all
size classes summed. ALL MESQ Lg Summed basal area of live Mesquite stems, in m²/2,826 m² (tree basal area per 30-m radius plot), all
size classes summed. SALI <12cmDBH Lg Summed basal area of small Willow stems (<12 cm DBH size class), per m²/2,826 m² (tree basal area,
per 30-m radius plot). POFR 12-25cmDBH Lg Summed basal area of medium Cottonwood stems (12–25 cm DBH size class), per m²/2,826 m² (tree
basal area, per 30-m radius plot). SALI 12-25cmDBH Lg Summed basal area of medium Willow stems (12–25 cm DBH size class), per m²/2,826 m² (tree basal
area, per 30-m radius plot). POFR >25cmDBH Lg Summed basal area of large Willow trees (>25 cm DBH size class), per m²/2,826 m² (tree basal area,
per 30-m radius plot). SALI >25cmDBH Lg Summed basal area of large Cottonwood trees (>25 cm DBH size class), per m²/2,826 m² (tree basal
area, per 30-m radius plot). Veg Diversity Lg Index of vegetation structure, from 1-8, summed values from allocating a "1" to each height strata
level with vegetation in it. Beaver Presence Presence inferred by dams and/or sign within 100 m of the station (in any year), and included gnawed
trees, stumps, bank dens, and other signs of occupation (= 1, indicator variable). Num Yr BD <51 Lg Number of years a beaver dam was within 50 m of point (continuous variable)

29
Abbreviation Description Beaver Level 1 Low use: beaver occupancy in one or more years (2000–2006) within 100 m of the avian survey
station, no dams documented (n=34) Beaver Level 2 Moderate use: stations where a dam was documented within 100 m upstream or 150 m downstream
during 1 or 2 years, and no more than 1 year with a dam within 50 m (n=33). Beaver Level 3 High use: stations where dams were located within 50 m for2 or more years, and/or where dams were
located within 100 m for 3 or more years (n=19).

30
Table 1-2. Number of survey stations where beaver (Castor canadensis) dams were documented and total number of dams documented each year from 2000 to 2006 within the San Pedro National Riparian Conservation Area, Arizona. [Survey stations were established in 2005. Dams were documented using GPS and/or GIS prior to spring 2005 by Bureau of Land Management personnel and by bird surveyors in 2005 and 2006, and were complete censuses]
2000 2001 2002 2003 2004 2005 2006 1All Dams on upper River 5 6 17 20 25 25 32
Stations with Dam ≤ 50 m 2 5 8 8 11 8 22 Stations with Dam 51–100 m 2 1 5 11 9 5 7 2Stations w/ Dam 101–150 m 0 0 2 1 3 2 3
Total stations with Dams 4 6 15 20 23 15 32 1Includes total count of dams, that is, when more than one dam was located within 100 m of a station, or when dams were more than 150 m downstream or 100 m upstream of any station. 2Includes only dams 100–150 m downstream of stations.
Table 1-3. Beaver (Castor canadensis) activity from 2000 to 2006 at 240 stations in the San Pedro Riparian National Conservation Area, Arizona, used to quantify beaver presence/absence and beaver intensity.
Beaver influence Number of stations Beaver occupancy within 100 m ≥ 1year, but no dams 34 Beaver dams impounding water within 100 m: Dam present 1 year 26 Dam present 2 years 8 Dam present 3 years 8 Dam present 4 years 5 Dam present 5 years 2 Dam present 6 years 2 Dam present 7 years 1 Total stations with dams 52 Total stations with some beaver influence 86 No beaver activity documented (within 100 m) 154 Total number of stations 240

31
Table 1-4. Common and scientific names of 76 breeding bird species detected within 50 meters of 240 survey stations on the San Pedro Riparian National Conservation Area, Arizona, 2005–2006. [Includes total detections, number and percent of stations where detected. Riparian and species groupings used for species richness, riparian and insectivorous species group analyses include the following grouping codes: Riparian (R) and if so whether a cottonwood, willow, and/or water specialist (CW) or riparian generalist (Gen) in our study system according to Kruper (1999) and/or Brand and others (2010a), if a conservation concern species as designated by the U.S. Fish and Wildlife Service (2008; “C”) and/or Hunter and others (1987, “c”), and if primarily insectivorous (I). Common and scientific nomenclature follow the American Ornithologists Union (2011).]
Common name Scientific name Total
detections
Number of stations detected Freq (%)
Riparian/ Spp. group
Yellow Warbler Setophaga petechial 1,721 224 93 R(CW),C, I Yellow-breasted Chat Icteria virens 1,170 227 95 R(Gen),c, I Lesser Goldfinch Spinus psaltria 991 191 80 R(CW) Bewick's Wren Thryomanes bewickii 724 217 90 R(Gen), I Song Sparrow Melospiza melodia 702 177 74 R(CW), I House Finch Carpodacus mexicanus 616 192 80 White-winged Dove Zenaida asiatica 612 199 83 Brown-headed Cowbird Molothrus ater 564 192 80 R(Gen), I Abert's Towhee Melozone aberti 562 196 82 R(Gen) Vermilion Flycatcher Pyrocephalus rubinus 518 183 76 R(CW),c, I Cassin's Kingbird Tyrannus vociferans 510 163 68 R(CW), I Gila Woodpecker Melanerpes uropygialis 494 188 78 R(CW),C, I Common Yellowthroat Geothlypis trichas 472 172 72 R(CW), I Summer Tanager Piranga rubra 424 178 74 R(CW),c, I Bell's Vireo Vireo bellii 357 149 62 R(Gen),C, I Mourning Dove Zenaida macroura 242 123 51 White-breasted Nuthatch Sitta carolinensis 233 130 54 R(CW), I Western Wood-Pewee Contopus sordidulus 227 116 48 R(CW), I Brown-crested Flycatcher Myiarchus tyrannulus 174 99 41 R(CW),c, I Lucy's Warbler Oreothlypis luciae 169 112 47 R(Gen),C, I Blue Grosbeak Passerina caerulea 166 104 43 R(Gen), I Ash-throated Flycatcher Myiarchus cinerascens 136 87 36 I Ladder-backed Woodpecker Picoides scalaris 129 94 39 R(Gen), I Northern Flicker Colaptes auratus 104 66 28 R(CW),c, I Black-chinned Hummingbird Archilochus alexandri 99 76 32 R(Gen) Phainopepla Phainopepla nitens 99 42 18 C Mallard Anas platyrhynchos 90 45 19 R(CW) Northern Beardless-Tyrannulet Camptostoma imberbe 89 62 26 R(Gen),C, I Common Ground-Dove Columbina passerina 84 61 25
32
Common name Scientific name Total
detections
Number of stations detected Freq (%)
Riparian/ Spp. group
Northern Mockingbird Mimus polyglottos 76 55 23 I Bullock's Oriole Icterus bullockii 74 57 24 R(CW), I Western Kingbird Tyrannus verticalis 70 37 15 I Gambel's Quail Callipepla gambelii 66 44 18 Northern Rough-winged Swallow Stelgidopteryx serripennis 65 32 13 R(CW), I Black Phoebe Sayornis nigricans 64 44 18 R(CW), I Cliff Swallow Petrochelidon pyrrhonota 62 14 6 R(CW), I Gray Hawk Buteo nitidus 62 39 16 R(CW) Yellow-billed Cuckoo Coccyzus americanus 61 45 19 R(CW),C, I Bushtit Psaltriparus minimus 58 23 10 I Northern Cardinal Cardinalis cardinalis 55 42 18 R(Gen), I Great Blue Heron Ardea herodias 50 35 15 R(CW) Red-winged Blackbird Agelaius phoeniceus 44 15 6 R(CW), I Botteri's Sparrow Peucaea botterii 26 17 7 C, I Black-throated Sparrow Amphispiza bilineata 24 12 5 I Verdin Auriparus flaviceps 22 14 6 I Great Horned Owl Bubo virginianus 21 14 6 R(CW) Turkey Vulture Cathartes aura 17 8 3 Chihuahuan Raven Corvus cryptoleucus 15 9 4 Killdeer Charadrius vociferus 15 5 2 R(CW), I Cooper's Hawk Accipiter cooperii 13 9 4 R(CW),c Common Raven Corvus corax 12 7 3 House Sparrow Passer domesticus 12 2 1 Tropical Kingbird Tyrannus melancholicus 11 5 2 R(CW), I Varied Bunting Passerina versicolor 11 9 4 C, I Black-headed Grosbeak Pheucticus melanocephalus 10 10 4 R(Gen), I Bridled Titmouse Baeolophus wollweberi 10 4 2 R(CW), I Canyon Towhee Melozone fusca 9 6 3 C Crissal Thrasher Toxostoma crissale 9 6 3 I Red-tailed Hawk Buteo jamaicensis 8 7 3 American Kestrel Falco sparverius 7 7 3 I Cassin's Sparrow Peucaea cassinii 7 7 3 ,C, I Hooded Oriole Icterus cucullatus 7 6 3 R(Gen),c, I Lesser Nighthawk Chordeiles acutipennis 6 4 2 I Common Nighthawk Chordeiles minor 5 5 2 I Greater Roadrunner Geococcyx californianus 4 4 2 Curve-billed Thrasher Toxostoma curvirostre 3 3 1 I European Starling Sturnus vulgaris 3 1 0 I

33
Common name Scientific name Total
detections
Number of stations detected Freq (%)
Riparian/ Spp. group
Pyrrhuloxia Cardinalis sinuatus 3 2 1 Say's Phoebe Sayornis saya 3 3 1 I Willow Flycatcher Empidonax traillii 3 2 1 R(CW),c, I Cactus Wren Campylorhynchus brunneicapillus 2 2 1 I Green Heron Butorides virescens 2 2 1 R(CW) Scaled Quail Callipepla squamata 2 2 1 Eastern Meadowlark Sturnella magna 1 1 0 I Western Screech-Owl Megascops kennicottii 1 1 0 R(Gen) White-tailed Kite Elanus leucurus 1 1 0

34
Table 1-5. Species richness and relative abundance of species groups at sites with and without beavers (Castor canadensis). (Two sided t test for difference in means, DF=239).
Beaver absent
(n= 154) Beaver present
(n=86) Difference
(%) Significance
Species roup Freq. (%) Mean SE
Freq. (%) Mean SE t P
Number of Breeding Bird Species (of 76 spp.) 100 18.90 0.29 100 21.31 0.38 12.8 5.44 <0.001 Relative Abundance of Breeding Bird Species 100 9.99 0.23 100 12.70 0.31 27.1 7.04 <0.001 Number of Riparian Species (of 42) 100 14.76 0.25 100 17.08 0.33 15.7 5.67 <0.001 Number of Riparian Specialists Species (of 14) 100 8.56 0.21 100 10.87 0.28 26.9 6.61 <0.001 Number of Riparian Generalist Species (of 28) 100 6.19 0.13 100 6.21 0.17 0.2 0.07 0.947 Number of Riparian Conservation C. spp. (of 14) 100 6.29 0.13 100 6.76 0.17 7.4 2.12 0.035 Number of Insectivorous spp. (of 52) 100 12.42 0.22 100 14.20 0.29 14.3 4.90 <0.001 Relative Abundance of Insectivorous Group 100 6.59 0.18 100 8.25 0.24 25.2 5.60 <0.001

35
Table 1-6. Mean relative abundance for most commonly detected bird species (n=31) at sites with and without beaver (Castor canadensis) . [Two sided t test for difference in means, DF=239). * denotes species of conservation concern from U.S. Fish and Wildlife Service (2008) and/or Hunter and others (1987).
Beaver absent (n= 154)
Beaver present (n=86)
Difference (%) Significance
Species Freq. (%)
Mean SE Freq. (%)
Mean SE t P
Yellow-billed Cuckoo* 12 0.03 0.010 30 0.08 0.013 167.4 3.14 0.002 Common Yellowthroat 63 0.28 0.029 87 0.57 0.039 105.2 5.95 <0.001 Black Phoebe 15 0.04 0.010 24 0.07 0.014 90.4 2.06 0.041 Lesser Goldfinch 73 0.63 0.059 92 1.13 0.078 79.4 5.11 <0.001 Northern Flicker* 21 0.07 0.014 38 0.12 0.018 78.0 2.27 0.024 Song Sparrow 64 0.45 0.042 91 0.78 0.056 73.6 4.75 <0.001 White-breasted Nuthatch 50 0.15 0.019 62 0.25 0.025 65.2 3.24 0.001 Mallard 14 0.06 0.017 27 0.10 0.023 59.4 1.27 0.205 Western Wood-Pewee 39 0.15 0.020 65 0.24 0.027 55.8 2.58 0.011 Brown-headed Cowbird 77 0.39 0.034 85 0.59 0.046 50.2 3.41 0.001 Cassin's Kingbird 64 0.35 0.035 76 0.52 0.047 48.6 2.91 0.004 Ladder-backed Woodpecker 34 0.09 0.012 49 0.13 0.017 45.1 1.94 0.054 Blue Grosbeak 40 0.12 0.015 49 0.17 0.020 44.2 2.01 0.045 Mourning Dove 45 0.17 0.021 62 0.24 0.028 43.4 2.11 0.036 House Finch 74 0.44 0.041 91 0.61 0.054 40.6 2.61 0.010 White-winged Dove 81 0.44 0.032 87 0.60 0.043 37.9 3.07 0.002 Yellow Warbler* 90 1.24 0.062 99 1.64 0.083 32.1 3.81 0.000 Gila Woodpecker* 75 0.37 0.032 85 0.46 0.042 25.8 1.80 0.073 Common Ground-Dove 25 0.07 0.011 26 0.08 0.015 13.9 0.49 0.626 Lucy's Warbler* 45 0.13 0.016 49 0.14 0.021 5.5 0.28 0.780 Summer Tanager* 74 0.34 0.026 74 0.35 0.034 3.2 0.25 0.799 Yellow-breasted Chat* 95 0.93 0.046 93 0.94 0.061 1.6 0.20 0.844 Abert's Towhee 81 0.45 0.029 83 0.45 0.039 -0.7 -0.06 0.951 Brown-crested Flycatcher* 39 0.14 0.018 45 0.14 0.023 -0.9 -0.04 0.966 Gray Hawk* 15 0.05 0.010 19 0.05 0.014 -4.7 -0.14 0.892 Bell's Vireo* 65 0.29 0.025 57 0.27 0.034 -6.7 -0.47 0.642 Vermilion Flycatcher 75 0.43 0.029 78 0.39 0.039 - 8.8 -0.79 0.433 Bullock's Oriole 25 0.06 0.010 21 0.06 0.013 -10.8 -0.40 0.686 Bewick's Wren 90 0.61 0.034 91 0.53 0.046 -13.4 -1.42 0.158 Ash-throated Flycatcher 44 0.14 0.015 23 0.06 0.020 -55.3 -3.03 0.003 Northern Beardless-Tyrannulet* 31 0.09 0.011 17 0.04 0.014 -60.0 -3.02 0.003

36
Table 1-7. Habitat and Environmental Covariate models for species and species groups from multiple linear regression (n=240) using stepwise variable-selection (minimum BIC to enter) selected model terms. [Significant P-values (≤0.05) indicated by *]
Parameter Estimate SE t P Yellow-billed Cuckoo
Intercept 0.002 0.005 0.420 0.6745 H2O PER 0.016 0.006 2.790 0.0057* SumPOFR %Cov 20-30m Lg 0.017 0.006 2.610 0.0097*
Common Yellowthroat Intercept -0.094 0.073 -1.280 0.2034 H2O May 0.048 0.019 2.530 0.0121* BACH Av%Cov Lg 0.102 0.021 4.800 <.0001* MESQ Av%Cov Log -0.061 0.017 -3.490 0.0006* TAMI Av%Cov Lg -0.047 0.019 -2.500 0.0132* POFR Av%Cov Lg -0.121 0.028 -4.380 <.0001* POFR 12-25cmDBH Lg -0.163 0.060 -2.700 0.0075* Veg Diversity Lg 0.306 0.098 3.110 0.0021*
Black Phoebe Intercept 0.000 0.008 -0.060 0.9494 H2O PER 0.020 0.006 3.420 0.0007* POFR Av%Cov Lg 0.040 0.012 3.190 0.0016* POFR >25cmDBH Lg -0.047 0.016 -2.970 0.0033*
Lesser Goldfinch Intercept 0.087 0.020 4.310 <.0001* H2O May 0.086 0.028 3.100 0.0022* H2O PER 0.106 0.023 4.680 <.0001* SALI <12cmDBH Lg 1.573 0.494 3.180 0.0016* POFR 12-25cmDBH Lg 0.437 0.085 5.110 <.0001* SumPOFR %Cov 20-30m Lg -0.073 0.023 -3.160 0.0018*
Northern Flicker Intercept 0.046 0.008 5.760 <.0001* H2O PER 0.026 0.008 3.440 0.0007* MESQ Av%Cov Lg -0.036 0.010 -3.470 0.0006* POFR >25cmDBH Lg -0.034 0.014 -2.350 0.0197*
Song Sparrow Intercept 0.014 0.015 0.950 0.3417 H2O May 0.148 0.019 7.610 <.0001* H2O PER 0.047 0.017 2.840 0.0049* SALI <12cmDBH Lg 1.555 0.374 4.160 <.0001*

37
Parameter Estimate SE t P White-breasted Nuthatch
Intercept 0.027 0.009 3.000 0.0030* POFR >25cmDBH Lg 0.055 0.023 2.360 0.0192* SumPOFR %Cov 20-30m Lg 0.034 0.013 2.540 0.0117*
Western Wood-Pewee Intercept -0.003 0.011 -0.320 0.7528 H2O May 0.054 0.013 4.320 <.0001* POFR >25cmDBH Lg 0.069 0.021 3.330 0.0010*
Brown-headed Cowbird Intercept 0.117 0.010 11.950 <.0001* H2O PER 0.068 0.015 4.630 <.0001*
Cassin's Kingbird Intercept 0.091 0.011 8.320 <.0001* H2O PER 0.058 0.016 3.600 0.0004* SALI <12cmDBH Lg 0.976 0.401 2.430 0.0157*
Yellow Warbler Intercept 0.080 0.023 3.470 0.0006* Wash <200 0.057 0.021 2.710 0.0073* H2O May 0.148 0.020 7.290 <.0001* POFR Av%Cov Lg 0.180 0.026 6.820 <.0001* SALI >25cmDBH Lg 0.242 0.092 2.620 0.0094*
Ash-throated Flycatcher Intercept 0.072 0.009 8.310 <.0001* Wash <200 -0.026 0.010 -2.580 0.0105* H2O May -0.039 0.009 -4.150 <.0001* ALL TAMI LT Lg 0.419 0.174 2.410 0.0168*
Northern Beardless-Tyrannulet Intercept 0.037 0.004 8.780 <.0001* H2O PER -0.029 0.006 -4.740 <.0001* ALL MESQ Lg 0.155 0.045 3.480 0.0006*
Species Richness 76 Breeding Bird Species (BBS) Intercept 22.075 2.076 10.630 <.0001* H2O May 2.679 0.590 4.540 <.0001* Rip Veg Width Lg -2.977 0.972 -3.060 0.0025* SALI Av%Cov Lg 2.279 0.834 2.730 0.0068*
Relative Abundance of 76 BBS Intercept 3.168 1.575 2.0100 0.0455* H2O May 2.675 0.456 5.8700 <.0001* H2O PER 1.045 0.361 2.8900 0.0042* SALI <12cmDBH Lg 36.390 8.085 4.5000 <.0001* Veg Diversity Lg 5.465 1.951 2.8000 0.0055*

38
Parameter Estimate SE t P Species Richness of 42 Riparian BBS
Intercept 11.811 0.630 18.760 <.0001* H2O May 2.027 0.547 3.700 0.0003* TAMI Av%Cov Lg -1.512 0.537 -2.820 0.0053* SALI Av%Cov Lg 2.008 0.664 3.030 0.0028* POFR Av%Cov Lg 1.876 0.559 3.360 0.0009*
Species Richness of Riparian Specialists Intercept 0.893 1.403 0.640 0.5254 H2O May 2.771 0.403 6.870 <.0001* H2O PER 1.115 0.315 3.540 0.0005* Veg Diversity Lg 6.774 1.739 3.900 0.0001*
Species Richness of 14 conservation concern species Intercept 1.629 0.976 1.670 0.0966 SALI >25cmDBH Lg 3.143 1.134 2.770 0.0060* Veg Diversity Lg 5.346 1.134 4.720 <.0001*
Species Richness of Insectivorous Riparian Birds Intercept 10.350 0.576 17.960 <.0001* H2O May 1.446 0.501 2.890 0.0042* TAMI Av%Cov Lg -1.457 0.491 -2.970 0.0033* SALI Av%Cov Lg 1.494 0.608 2.460 0.0147* POFR Av%Cov Lg 1.447 0.512 2.830 0.0051*
Relative Abundance of Insectivorous Riparian Birds Intercept 1.013 1.201 0.840 0.3996 H2O May 2.065 0.339 6.090 <.0001* BACH Av%Cov Lg 1.403 0.426 3.290 0.0012* POFR 12-25cmDBH Lg -2.926 1.053 -2.780 0.0059* SALI 12-25cmDBH Lg 6.220 1.960 3.170 0.0017* Veg Diversity Lg 4.261 1.525 2.790 0.0056*
39
Table 1-8. Comparison of models incorporating beaver-related variables to habitat- and environmental covariate-only models for species and species groups, respectively. [Habitat and Environmental Covariate models for species and species groups, from multiple linear regression (n=240) using stepwise variable selection (minimum BIC to enter) selected model terms]
Species Model R2 K LL AICc BIC ΔAIC Wi
Yellow-billed Cuckoo Habitat 0.083 3 10122.93 -829.52 -815.77 0.00 0.4261 Habitat + Beaver presence 0.088 4 13541.18 -828.69 -811.55 0.83 0.2819 Habitat + No. years with dam 0.083 4 13522.09 -827.52 -810.38 1.99 0.1572 Habitat * Beaver presence 0.093 6 20414.80 -825.81 -801.93 3.71 0.0666 Habitat + Beaver intensity 0.088 6 20383.28 -824.53 -800.65 4.99 0.0352 Habitat * No. years with dam 0.086 6 20372.06 -824.08 -800.20 5.44 0.0281 Habitat * Beaver intensity 0.097 9 30825.23 -820.58 -786.73 8.94 0.0049
Common Yellowthroat Habitat * Beaver presence 0.400 10 19799.39 -472.30 -435.17 0.00 0.4046 Habitat + Beaver presence 0.391 9 17686.49 -470.82 -436.98 1.48 0.1933 Habitat + No. years with dam 0.390 9 17668.01 -470.33 -436.48 1.97 0.1512 Habitat 0.384 8 15634.42 -470.25 -439.71 2.04 0.1456 Habitat + Beaver intensity 0.399 11 21750.17 -469.61 -429.21 2.69 0.1053
Black Phoebe Habitat 0.074 4 13283.43 -812.92 -795.77 0.00 0.4767 Habitat + No. years with dam 0.078 5 16654.03 -811.88 -791.36 1.03 0.2842 Habitat + Beaver presence 0.076 5 16639.10 -811.16 -790.63 1.76 0.1975 Habitat + Beaver intensity 0.080 7 23405.33 -808.04 -780.82 4.88 0.0416
Lesser Goldfinch Habitat + Beaver presence 0.353 7 7309.42 -252.35 -225.13 0.00 0.6760 Habitat + Beaver intensity 0.359 9 9400.81 -250.25 -216.41 2.10 0.2370 Habitat 0.334 6 6118.41 -247.50 -223.62 4.85 0.0598 Habitat + No. years with dam 0.336 7 7123.20 -245.92 -218.70 6.43 0.0272
40
Species Model R2 K LL AICc BIC ΔAIC Wi
Northern Flicker Habitat 0.118 4 11451.70 -700.82 -683.67 0.00 0.5347 Habitat + Beaver presence 0.119 5 14340.68 -699.11 -678.59 1.71 0.2272 Habitat + No. years with dam 0.118 5 14334.03 -698.78 -678.26 2.04 0.1932 Habitat + Beaver intensity 0.123 7 20156.18 -695.87 -668.65 4.95 0.0450
Song Sparrow Habitat + No. years with dam 0.424 5 7734.22 -377.04 -356.52 0.00 0.4922 Habitat 0.417 4 6148.79 -376.29 -359.15 0.75 0.3383 Habitat + Beaver presence 0.417 5 7675.94 -374.20 -353.68 2.84 0.1189 Habitat + Beaver intensity 0.423 7 10789.54 -372.50 -345.27 4.55 0.0507
White-breasted Nuthatch Habitat + Beaver presence 0.134 4 9265.38 -567.02 -549.88 0.00 0.5456 Habitat + Beaver intensity 0.144 6 13982.59 -565.62 -541.73 1.41 0.2700 Habitat 0.116 3 6884.05 -564.11 -550.36 2.91 0.1272 Habitat + No. years with dam 0.117 4 9191.67 -562.51 -545.36 4.51 0.0572
Western Wood-Pewee Habitat 0.172 3 6783.03 -555.83 -542.08 0.00 0.4971 Habitat + Beaver presence 0.175 4 9062.17 -554.59 -537.44 1.25 0.2666 Habitat + No. years with dam 0.172 4 9049.93 -553.84 -536.69 2.00 0.1833 Habitat + Beaver intensity 0.178 6 13630.09 -551.36 -527.48 4.48 0.0530
Brown-headed Cowbird Habitat 0.083 2 2940.18 -362.93 -352.59 0.00 0.3884 Habitat + Beaver presence 0.088 3 4421.74 -362.34 -348.58 0.59 0.2889 Habitat + Beaver intensity 0.101 5 7413.46 -361.41 -340.88 1.52 0.1814 Habitat + No. years with dam 0.083 3 4404.28 -360.91 -347.15 2.02 0.1413
Cassin's Kingbird Habitat + Beaver intensity 0.134 6 8457.73 -342.13 -318.25 0.00 0.6016 Habitat 0.101 3 4144.77 -339.64 -325.89 2.49 0.1736 Habitat + No. years with dam 0.108 4 5544.08 -339.29 -322.14 2.84 0.1453 Habitat + Beaver presence 0.103 4 5524.34 -338.08 -320.93 4.05 0.0795

41
Species Model R2 K LL AICc BIC ΔAIC Wi
Yellow Warbler Habitat + No. years with dam 0.420 6 7810.14 -315.93 -292.05 0.00 0.5665 Habitat 0.411 5 6450.42 -314.46 -293.94 1.47 0.2712 Habitat + Beaver presence 0.412 6 7729.67 -312.68 -288.80 3.26 0.1113 Habitat + Beaver intensity 0.418 8 10343.60 -311.12 -280.57 4.82 0.0510
Ash-throated Flycatcher Habitat 0.122 4 10847.07 -663.82 -646.67 0.00 0.3943 Habitat + No. years with dam 0.129 5 13611.57 -663.56 -643.04 0.25 0.3472 Habitat + Beaver presence 0.126 5 13594.09 -662.71 -642.19 1.11 0.2268 Habitat + Beaver intensity 0.127 7 19081.82 -658.78 -631.56 5.04 0.0317
Northern Beardless-Tyrannulet Habitat 0.126 3 9572.06 -784.38 -770.63 0.00 0.5395 Habitat + Beaver presence 0.128 4 12789.83 -782.71 -765.57 1.67 0.2345 Habitat + No. years with dam 0.126 4 12784.03 -782.36 -765.21 2.02 0.1964 Habitat + Beaver intensity 0.128 6 19247.15 -778.57 -754.69 5.80 0.0296
Species Groups Species Richness 76 Breeding Bird Species
Habitat + Beaver intensity 0.296 7 -36014.83 1243.37 1270.59 0.00 0.7948 Habitat + Beaver presence 0.274 5 -25572.86 1246.68 1267.20 3.31 0.1520 Habitat + No. years with dam 0.265 5 -25631.20 1249.52 1270.04 6.15 0.0367 Habitat 0.254 4 -20443.72 1251.11 1268.26 7.74 0.0165
Relative Abundance of 76 Breeding Bird Species Habitat + Beaver presence 0.457 6 -27095.11 1096.04 1119.92 0.00 0.6868 Habitat + Beaver intensity 0.460 8 -36532.86 1098.84 1129.38 2.80 0.1689 Habitat 0.443 5 -22561.15 1099.86 1120.38 3.82 0.1016 Habitat + No. years with dam 0.444 6 -27232.54 1101.59 1125.48 5.56 0.0426
Species Richness of 42 Riparian Breeding Bird Species Habitat + Beaver intensity 0.393 8 -37986.41 1142.56 1173.10 0.00 0.5584 Habitat + Beaver presence 0.379 6 -28279.08 1143.93 1167.81 1.37 0.2818 Habitat + No. years with dam 0.373 6 -28329.78 1145.98 1169.86 3.42 0.1010 Habitat 0.365 5 -23529.50 1147.06 1167.59 4.50 0.0588

42
Species Model R2 K LL AICc BIC ΔAIC Wi
Species Richness of Riparian Specialists Habitat + Beaver intensity 0.467 7 -30194.09 1042.42 1069.64 0.00 0.3540 Habitat + Beaver presence 0.457 5 -21384.78 1042.51 1063.03 0.09 0.3380 Habitat 0.450 4 -17052.20 1043.56 1060.71 1.14 0.1998 Habitat + No. years with dam 0.452 5 -21431.51 1044.79 1065.31 2.37 0.1082
Species Richness of 14 Conservation Concern Spp. Habitat 0.134 3 -10851.80 889.24 903.00 0.00 0.5283 Habitat + No. years with dam 0.135 4 -14558.93 890.98 908.12 1.73 0.2223 Habitat + Beaver presence 0.134 4 -14562.27 891.18 908.33 1.94 0.2007 Habitat + Beaver intensity 0.139 6 -22100.92 894.01 917.89 4.77 0.0487
Species Richness of Insectivorous Riparian Birds Habitat + Beaver intensity 0.319 8 -36691.52 1103.61 1134.16 0.00 0.3587 Habitat + Beaver presence 0.306 6 -27286.92 1103.79 1127.68 0.18 0.3275 Habitat 0.298 5 -22658.75 1104.61 1125.14 1.00 0.2174 Habitat + No. years with dam 0.299 6 -27347.42 1106.24 1130.12 2.63 0.0964
Relative Abundance of Insectivorous Riparian Birds Habitat 0.433 6 -23896.12 966.63 990.51 0.00 0.3866 Habitat + Beaver presence 0.436 7 -28025.13 967.53 994.76 0.90 0.2461 Habitat + Beaver intensity 0.446 9 -36351.82 967.70 1001.55 1.07 0.2267 Habitat + No. years with dam 0.433 7 -28057.59 968.65 995.88 2.02 0.1406
43
Table 1-9. Result of multiple linear regression (n=240) models after adding beaver-related factors to habitat/covariate models (table 1-7), for species and species groups. [Significant P-values (≤ 0.05) indicated by *]
Parameter Estimate SE t P Yellow-billed Cuckoo
Habitat + Beaver Presence Intercept 0.001 0.005 0.310 0.7554 H2O PER 0.012 0.007 1.860 0.0644 SumPOFR %Cov 20-30m Lg 0.016 0.007 2.430 0.0160* Beaver Presence 0.008 0.007 1.110 0.2660
Habitat + Number of years with dam Intercept 0.002 0.005 0.420 0.6744 H2O PER 0.016 0.006 2.570 0.0108* SumPOFR %Cov 20-30m Lg 0.017 0.006 2.570 0.0107* Num Yr BD <51 Lg 0.005 0.018 0.300 0.7627
Common Yellowthroat Habitat * Beaver presence
Intercept -0.051 0.075 -0.680 0.4983 BACH Av%Cov Lg 0.100 0.021 4.720 <.0001* MESQ Av%Cov Lg -0.056 0.018 -3.210 0.0015* TAMI Av%Cov Lg -0.036 0.019 -1.860 0.0640 POFR Av%Cov Lg -0.122 0.028 -4.410 <.0001* POFR 12-25cmDBH Lg -0.155 0.060 -2.570 0.0108* Veg Diversity Lg 0.296 0.098 3.020 0.0028* H2O May -0.012 0.035 -0.330 0.7397 Beaver Presence 0.059 0.024 2.480 0.0137* (H2O May)*(Beaver Presence) -0.171 0.091 -1.880 0.0609
Habitat + Beaver Presence Intercept -0.088 0.073 -1.200 0.2316 H2O May 0.043 0.019 2.260 0.0245* BACH Av%Cov Lg 0.100 0.021 4.660 <.0001* MESQ Av%Cov Lg -0.055 0.018 -3.120 0.0020* TAMI Av%Cov Lg -0.040 0.019 -2.090 0.0378* POFR Av%Cov Lg -0.117 0.028 -4.230 <.0001* POFR 12-25cmDBH Lg -0.153 0.061 -2.530 0.0121* Veg Diversity Lg 0.287 0.099 2.910 0.0040* Beaver Presence 0.022 0.014 1.630 0.1045
44
Parameter Estimate SE t P Habitat +Number of years with dam
Intercept -0.087 0.073 -1.190 0.2358 H2O May 0.048 0.019 2.520 0.0123* BACH Av%Cov Lg 0.098 0.022 4.550 <.0001* MESQ Av%Cov Lg -0.058 0.017 -3.310 0.0011* TAMI Av%Cov Lg -0.043 0.019 -2.280 0.0234* POFR Av%Cov Lg -0.118 0.028 -4.290 <.0001* POFR 12-25cmDBH Lg -0.158 0.060 -2.620 0.0094* Veg Diversity Lg 0.292 0.098 2.970 0.0032* Num Yr BD <51 Lg 0.055 0.037 1.480 0.1413
Black Phoebe Habitat + Number of years with dam
Intercept -0.001 0.008 -0.080 0.9398 H2O PER 0.018 0.006 2.870 0.0044* POFR Av%Cov Lg 0.039 0.012 3.140 0.0019* POFR >25cmDBH Lg -0.046 0.016 -2.910 0.0040* Num Yr BD <51 Lg 0.019 0.019 1.030 0.3064
Habitat + Beaver presence Intercept -0.001 0.008 -0.130 0.8967 H2O PER 0.018 0.007 2.570 0.0108* POFR Av%Cov Lg 0.040 0.012 3.170 0.0017* POFR >25cmDBH Lg -0.047 0.016 -2.950 0.0035* Beaver Presence 0.004 0.007 0.580 0.5628
Lesser Goldfinch Habitat + Presence
Intercept 0.087 0.020 4.360 <.0001* H2O May 0.077 0.028 2.790 0.0057* H2O PER 0.080 0.024 3.310 0.0011* SALI <12cmDBH Lg 1.516 0.488 3.110 0.0021* POFR 12-25cmDBH Lg 0.448 0.085 5.300 <.0001* SumPOFR %Cov 20-30m Lg -0.079 0.023 -3.440 0.0007* Beaver Presence 0.060 0.023 2.620 0.0093*
Habitat + Beaver intensity Intercept 0.085 0.020 4.260 <.0001* H2O May 0.073 0.028 2.620 0.0094* H2O PER 0.087 0.025 3.510 0.0005* SALI <12cmDBH Lg 1.583 0.491 3.230 0.0014* POFR 12-25cmDBH Lg 0.459 0.085 5.410 <.0001* SumPOFR %Cov 20-30m Lg -0.077 0.023 -3.310 0.0011* Beaver Level 1 0.082 0.029 2.870 0.0045* Beaver Level 2 0.030 0.031 0.950 0.3406 Beaver Level 3 0.059 0.037 1.600 0.1108

45
Parameter Estimate SE t P Northern Flicker
Habitat + Beaver presence Intercept 0.045 0.008 5.570 <.0001* H2O PER 0.023 0.009 2.580 0.0104* MESQ Av%Cov Lg -0.036 0.010 -3.440 0.0007* POFR >25cmDBH Lg -0.033 0.014 -2.330 0.0207* Beaver Presence 0.006 0.009 0.620 0.5359
Song Sparrow Number of years with dam
Intercept 0.014 0.015 0.970 0.3329 H2O May 0.146 0.019 7.580 <.0001* H2O PER 0.040 0.017 2.320 0.0209* SALI <12cmDBH Lg 1.514 0.374 4.050 <.0001* Num Yr BD <51 Lg 0.077 0.046 1.680 0.0949
White-breasted Nuthatch Habitat + Beaver presence
Intercept 0.022 0.009 2.360 0.0193* POFR >25cmDBH Lg 0.060 0.023 2.560 0.0110* SumPOFR %Cov 20-30m Lg 0.026 0.014 1.840 0.0671 Beaver Presence 0.023 0.010 2.230 0.0268*
Habitat + Beaver intensity Intercept 0.022 0.009 2.400 0.0172* POFR >25cmDBH Lg 0.058 0.023 2.470 0.0142* SumPOFR %Cov 20-30m Lg 0.026 0.014 1.900 0.0590 Beaver Level 1 0.036 0.014 2.540 0.0118* Beaver Level 2 0.022 0.015 1.540 0.1261 Beaver Level 3 0.001 0.018 0.050 0.9634
Western Wood-Pewee Habitat + Beaver presence
Intercept -0.004 0.011 -0.350 0.7252 H2O May 0.049 0.014 3.650 0.0003* POFR >25cmDBH Lg 0.070 0.021 3.380 0.0008* Beaver Presence 0.010 0.011 0.910 0.3641
Habitat + Number of years with dam Intercept -0.003 0.011 -0.310 0.7566 H2O May 0.055 0.013 4.290 <.0001* POFR >25cmDBH Lg 0.068 0.021 3.320 0.0011* Num Yr BD <51 Lg -0.009 0.031 -0.300 0.7648

46
Parameter Estimate SE t P Brown-headed Cowbird
Beaver presence Intercept 0.115 0.010 11.410 <.0001* H2O PER 0.056 0.017 3.220 0.0015* Beaver Presence 0.022 0.018 1.210 0.2277
Beaver intensity Intercept 0.113 0.010 11.280 <.0001* H2O PER 0.061 0.018 3.440 0.0007* Beaver Level 1 0.038 0.022 1.710 0.0880 Beaver Level 2 -0.009 0.025 -0.350 0.7293 Beaver Level 3 0.033 0.030 1.100 0.2711
Cassin's Kingbird Beaver intensity
Intercept 0.086 0.011 7.830 <.0001* H2O PER 0.060 0.019 3.200 0.0016* SALI <12cmDBH Lg 0.998 0.398 2.510 0.0128* Beaver Level 1 0.053 0.023 2.260 0.0245* Beaver Level 2 -0.016 0.026 -0.600 0.5485 Beaver Level 3 -0.031 0.031 -1.020 0.3089
Yellow Warbler Habitat + Number of years with dam
Intercept 0.078 0.023 3.400 0.0008* Wash <200 0.065 0.021 3.040 0.0027* H2O May 0.155 0.020 7.550 <.0001* POFR Av%Cov Lg 0.178 0.026 6.800 <.0001* SALI >25cmDBH Lg 0.272 0.093 2.910 0.0040* Num Yr BD <51 Lg -0.098 0.052 -1.880 0.0614
Ash-throated Flycatcher Habitat + Number of uears w/ dam
Intercept 0.072 0.009 8.260 <.0001* Wash <200 -0.024 0.010 -2.270 0.0243* H2O May -0.036 0.010 -3.790 0.0002* ALL TAMI LT Lg 0.407 0.174 2.340 0.0201* Num Yr BD <51 Lg -0.034 0.025 -1.350 0.1787
Habitat + Beaver presence Intercept 0.072 0.009 8.300 <.0001* Wash <200 -0.024 0.010 -2.350 0.0198* H2O May -0.035 0.010 -3.450 0.0007* ALL TAMI LT Lg 0.405 0.175 2.320 0.0211* Beaver Presence -0.009 0.009 -0.990 0.3234

47
Parameter Estimate SE t P Northern Beardless-Tyrannulet Habitat + Beaver presence Intercept 0.037 0.004 8.700 <.0001* H2O PER -0.026 0.007 -3.610 0.0004* ALL MESQ Lg 0.155 0.045 3.470 0.0006* Beaver Presence -0.005 0.008 -0.640 0.5206
Species Groups
Species Richness 76 Breeding Bird Species (BBS) Intensity
Intercept 22.075 2.076 10.630 <.0001* H2O May 2.679 0.590 4.540 <.0001* Rip Veg Width Lg -2.977 0.972 -3.060 0.0025*
SALI Av%Cov Lg 2.279 0.834 2.730 0.0068* Beaver Level 1 1.849 0.604 3.060 0.0025 Beaver Level 2 0.012 0.064 0.020 0.9855 Beaver Level 3 2.061 0.777 2.650 0.0086
Beaver presence Intercept 22.423 2.057 10.900 <.0001* H2O May 2.248 0.607 3.700 0.0003* Rip Veg Width Lg -3.114 0.963 -3.230 0.0014* SALI Av%Cov Lg 1.996 0.832 2.400 0.0173* Beaver Presence 1.204 0.473 2.550 0.0115*
Number of years with dam Intercept 22.338 2.069 10.800 <.0001* H2O May 2.538 0.592 4.290 <.0001* Rip Veg Width Lg -3.082 0.968 -3.180 0.0017* SALI Av%Cov Lg 2.124 0.834 2.550 0.0115*
Num Yr BD <51 Lg 2.522 1.321 1.910 0.0574 Relative Abundance of 76 BBS
Beaver presence Intercept 3.3385 1.5608 2.14 0.0335* H2O May 2.5347 0.455 5.57 <.0001* H2O PER 0.6368 0.3954 1.61 0.108 SALI <12cmDBH Lg 35.849 8.0052 4.48 <.0001* Veg Diversity Lg 5.232 1.9332 2.71 0.0073* Beaver Presence 0.9223 0.3808 2.42 0.0162*

48
Parameter Estimate SE t P Intensity
Intercept 3.2037 1.5676 2.04 0.0421* H2O May 2.4921 0.4573 5.45 <.0001* H2O PER 0.702 0.403 1.74 0.0828 SALI <12cmDBH Lg 36.726 8.0481 4.56 <.0001* Veg Diversity Lg 5.3918 1.9411 2.78 0.0059* Beaver Level 1 1.1451 0.4729 2.42 0.0162* Beaver Level 2 0.4944 0.5214 0.95 0.344 Beaver Level 3 1.099 0.6189 1.78 0.0771
Species Richness of 42 Riparian BBS Intensity
Intercept 11.472 0.629 18.250 <.0001* H2O May 1.814 0.547 3.320 0.0011* TAMI Av%Cov Lg -1.159 0.542 -2.140 0.0335* SALI Av%Cov Lg 1.957 0.658 2.980 0.0032* POFR Av%Cov Lg 2.030 0.553 3.670 0.0003* Beaver Level 1 1.336 0.514 2.600 0.0099* Beaver Level 2 0.076 0.522 0.150 0.8840 Beaver Level 3 1.541 0.656 2.350 0.0197*
Beaver presence Intercept 11.600 0.631 18.390 <.0001* H2O May 1.804 0.551 3.270 0.0012* TAMI Av%Cov Lg -1.253 0.544 -2.300 0.0222* SALI Av%Cov Lg 1.859 0.661 2.810 0.0053* POFR Av%Cov Lg 1.992 0.557 3.580 0.0004* Beaver Presence 0.890 0.391 2.280 0.0237*
Species Richness of Riparian Specialists Intensity
Intercept 0.804 1.396 0.580 0.5653 H2O May 2.621 0.404 6.480 <.0001* H2O PER 0.957 0.354 2.700 0.0074* Veg Diversity Lg 6.865 1.730 3.970 <.0001* Beaver Level 1 0.947 0.421 2.250 0.0256* Beaver Level 2 -0.048 0.463 -0.100 0.9169 Beaver Level 3 0.864 0.552 1.570 0.1186
Beaver presence Intercept 1.002 1.399 0.720 0.4744 H2O May 2.677 0.405 6.610 <.0001* H2O PER 0.846 0.349 2.420 0.0162* Veg Diversity Lg 6.622 1.733 3.820 0.0002* Beaver Presence 0.602 0.341 1.760 0.0791

49
Parameter Estimate SE t P Species Richness of 14 Conservation Concern Spp.
Number of years with dam Intercept 1.694 0.984 1.720 0.0864 SALI >25cmDBH Lg 3.022 1.154 2.620 0.0094* Veg Diversity Lg 5.254 1.146 4.580 <.0001* Num Yr BD <51 Lg 0.372 0.630 0.590 0.5552
Beaver presence Intercept 1.684 0.989 1.700 0.0898 SALI >25cmDBH Lg 3.048 1.163 2.620 0.0093* Veg Diversity Lg 5.255 1.161 4.530 <.0001* Beaver Presence 0.084 0.217 0.380 0.7010
Species Richness of Insectivorous Riparian Birds Intensity
Intercept 10.115 0.580 17.450 <.0001* H2O May 1.300 0.504 2.580 0.0106* TAMI Av%Cov Lg -1.219 0.500 -2.440 0.0154* SALI Av%Cov Lg 1.481 0.607 2.440 0.0154* POFR Av%Cov Lg 1.541 0.510 3.020 0.0028* Beaver Level 1 1.142 0.474 2.410 0.0166* Beaver Level 2 -0.046 0.481 -0.100 0.9240 Beaver Level 3 0.801 0.605 1.320 0.1866
Beaver presence Intercept 10.205 0.580 17.590 <.0001* H2O May 1.293 0.507 2.550 0.0114* TAMI Av%Cov Lg -1.280 0.501 -2.560 0.0112* SALI Av%Cov Lg 1.392 0.608 2.290 0.0230* POFR Av%Cov Lg 1.527 0.512 2.980 0.0032* Beaver Presence 0.611 0.360 1.700 0.0907
Relative Abundance of Insectivorous Riparian Birds Beaver presence
Intercept 1.092 1.203 0.910 0.3649 H2O May 1.969 0.350 5.630 <.0001* BACH Av%Cov Lg 1.385 0.427 3.250 0.0013* POFR 12-25cmDBH Lg -2.746 1.065 -2.580 0.0106* SALI 12-25cmDBH Lg 5.756 2.004 2.870 0.0045* Veg Diversity Lg 4.160 1.527 2.720 0.0069* Beaver Presence 0.297 0.271 1.100 0.2736
50
Parameter Estimate SE t P Intensity Intercept 0.955 1.199 0.800 0.4265 H2O May 1.903 0.350 5.440 <.0001* BACH Av%Cov Lg 1.476 0.430 3.430 0.0007* POFR 12-25cmDBH Lg -2.683 1.062 -2.530 0.0122* SALI 12-25cmDBH Lg 6.549 2.047 3.200 0.0016* Veg Diversity Lg 4.266 1.522 2.800 0.0055* Beaver Level 1 0.743 0.353 2.100 0.0365* Beaver Level 2 -0.136 0.377 -0.360 0.7188 Beaver Level 3 0.111 0.453 0.240 0.8070

51
Table 1-10. Name and location of the 240 point count stations used to survey breeding birds in 2005–2006 on the San Pedro Riparian National Conservation Area, listed from northern-most to southernmost station.
[Included are the unique station number identifier, station identifier used during field work (an abbreviation of local landmarks and station number within the reach), and geographic coordinates (Universal Transverse Mercator, North American Datum of 1983)]
Unique Station ID Reach-station ID (Field Name) Easting Northing
1 AF1 574901 3525266 2 AF2 575028 3524992 3 AF3 574785 3524935 4 AF3.5 574515 3524859 5 AF4 574439 3524571 6 AF5 574615 3524397 7 AF6 574797 3524203 8 AF7 574627 3524028 9 AF7.5 574712 3523791
10 AF8 574845 3523549 11 AF9 574682 3523324 12 AF10 574420 3523215 13 AF11 574252 3522987 14 AF12 574143 3522718 15 AF13 574200 3522452 16 AF14 574356 3522217 17 AF15 574230 3521984 18 AF16 574151 3521718 19 AF17 574156 3521469 20 AF18 574136 3521192 21 AF19 574122 3520942 22 SDD7 574118 3520681 23 SDD6 574155 3520425 24 SDD5 574264 3520157 25 SDD4 574452 3519970 26 SDD3 574566 3519741 27 SDD2 574725 3519550 28 SDD1 574887 3519362 29 CWW13 574910 3519121 30 CWW12 574714 3518965 32 CWW10 574401 3518602 33 CWW9 574269 3518379 34 CWW8 574078 3518169 35 CWW7 573997 3517911 36 CWW6 574057 3517653 37 CWW5 573972 3517389 38 CWW4 573648 3517281 39 CWW3.5 573500 3517056 40 CWW2 573847 3516907 41 CWW1 574124 3516815 42 CON16 574184 3516549 43 CON15 574124 3516323 44 CON14 574288 3516098 45 CON13 574529 3516035

52
Unique Station ID Reach-station ID (Field Name) Easting Northing
46 CON12 574803 3515915 47 CON11 575041 3515798 48 CON10 575199 3515617 49 CON9 575108 3515394 50 CON8 574891 3515248 51 CON7 575109 3515099 52 CON6 575310 3514923 53 CON5 575584 3514876 54 CON4 575620 3514579 55 CON3 575502 3514345 56 CON2 575429 3514100 57 CON1 575464 3513848 58 FBN15 575450 3513571 59 FBN14 575531 3513326 60 FBN13 575686 3513093 61 FBN12 575818 3512857 62 FBN11 576005 3512672 63 FBN10 576124 3512457 64 FBN9 576197 3512191 65 FBN8 576184 3511902 66 FBN7 576245 3511662 67 FBN6 576325 3511393 68 FBN5 576351 3511128 69 FBN4 576253 3510871 70 FBN3 576160 3510603 71 FBN2 576160 3510352 72 FBN1 576373 3510194 73 FBS1 576390 3509781 74 FBS2 576471 3509555 75 FBS3 576567 3509305 76 FBS4 576786 3509104 77 BRWE12 576833 3508725 78 BRWE11 577034 3508499 79 BRWE10 577294 3508372 80 BRWE9 577454 3508108 81 BRWE8 577532 3507875 82 BRWE7 577597 3507615 83 BRWE6 577606 3507376 84 BRWE5 577485 3507144 85 BRWE4 577498 3506872 86 BRWE3 577465 3506607 87 BRWE2 577264 3506432 89 BRS3 576723 3506516 90 BRS4 576474 3506505 91 BRS5 576226 3506427 92 BRS6 576206 3506186 93 BRS7 576384 3505993 94 BRS8 576574 3505814 95 BRS9 576760 3505649 96 BRS10 576982 3505505 97 BRS11 577058 3505279 98 BRS12 577278 3505126

53
Unique Station ID Reach-station ID (Field Name) Easting Northing
99 BRS2 577346 3504874 100 BRS1 577556 3504777 101 GNAR1 577486 3504504 102 GNAR2 577727 3504398 103 GNAR3 577947 3504225 104 GNAR4 578041 3503974 105 GNAR5 577879 3503743 106 GNAR6 577725 3503521 107 GNAR7 577574 3503290 108 GNAR8 577588 3503031 109 GNAR9 577504 3502787 110 GNAR10 577570 3502517 111 GNAR11 577839 3502440 112 GNAR12 578029 3502283 113 NAR1 578111 3502022 114 NAR2 578066 3501761 115 NAR3 577930 3501529 116 NAR4 577851 3501263 117 NAR5 577883 3501015 118 NAR6 578059 3500823 119 NAR7 578152 3500593 120 NAR8 578214 3500334 121 NAR9 577969 3500176 122 NAR10 577849 3499920 123 NAR11 578016 3499696 124 NAR12 578179 3499506 125 GHEW10 578467 3499057 126 GHEW9 578706 3498949 127 GHEW8 578885 3498701 128 GHEW7 579086 3498514 129 GHEW6 579234 3498276 130 GHEW5 579030 3498115 131 GHEW4 578923 3497841 132 GHEW3 579118 3497623 133 GHEW2 579444 3497557 134 GHEW1 579512 3497308 135 GRHA5 579651 3497103 136 GRHA4 579908 3497110 137 GRHA3 580144 3497196 138 GRHA2 580300 3496972 139 GRHA1 580378 3496729 140 LBN18 580866 3495255 141 LBN17 580975 3494966 142 LBN16 581095 3494719 143 LBN15 581060 3494416 144 LBN14 581005 3494154 145 LBN13 581188 3493975 146 LBN12 581400 3493808 147 LBN11 581563 3493598 148 LBN10 581615 3493296 149 LBN9 581468 3493090 150 LBN8 581375 3492868

54
Unique Station ID Reach-station ID (Field Name) Easting Northing
151 LBN7 581301 3492646 152 LBN6 581351 3492435 153 LBN5 581400 3492159 154 LBN4 581485 3491940 155 LBN3 581558 3491745 156 LBN2 581628 3491504 157 LBN1 581616 3491265 158 LBS1 581937 3490730 159 LBS2 582100 3490579 160 LBS3 582194 3490372 161 LBS4 582354 3490194 162 LBS5 582453 3489917 163 LBS6 582424 3489692 164 LBS7 582322 3489458 165 LBS8 582344 3489235 166 LBS9 582481 3489045 167 LBS10 582643 3488804 168 LBS11 582705 3488630 169 LBS12 582810 3488358 170 LBS13 582792 3488145 171 LBS14 582776 3487930 172 COT1 582723 3487684 173 COT2 582707 3487444 174 COT3 582659 3487192 175 COT4 582755 3486965 176 COT5 582918 3486757 177 COT6 582858 3486505 178 COT7 582756 3486323 179 COT8 582658 3486074 180 COT9 582696 3485827 181 COT10 582938 3485807 182 COT11 583040 3485564 183 COT12 582890 3485363 184 COT13 582874 3485090 185 COT14 583089 3484917 186 HNWA1 583061 3484658 187 HNWA2 583126 3484415 188 HNWA3 583342 3484319 189 HNWA4 583567 3484124 190 HNWA5 583544 3483860 191 HNWA6 583603 3483641 192 HNWA7 583723 3483474 193 HNWA8 583722 3483253 194 HNWA9 583829 3483006 195 HNWA10 584097 3482901 196 HNWA11 583987 3482632 197 HNWA12 584174 3482402 198 HBN21 584338 3482229 199 HBN20 584588 3482259 200 HBN19 584777 3482112 201 HBN18 584626 3481876 202 HBN17 584878 3481868

55
Unique Station ID Reach-station ID (Field Name) Easting Northing
203 HBN16 585000 3481646 204 HBN15 584961 3481376 205 HBN14 584689 3481339 206 HBN13 584594 3481102 207 HBN12 584859 3481033 208 HBN11 585050 3480836 209 HBN10 584930 3480641 210 HBN9 584711 3480497 211 HBN8 584575 3480260 212 HBN7 584590 3480040 213 HBN6 584733 3479805 214 HBN5 584928 3479601 215 HBN4 584755 3479391 216 HBN3 584701 3479123 217 HBN2 584711 3478872 218 HBN1 584768 3478665 219 HBS1 584825 3478417 220 HBS2 584843 3478161 221 HBS6 585325 3477388 222 HBS7 585332 3477124 223 HBS8 585206 3476894 224 HBS9 585109 3476659 225 HBS10 585031 3476416 226 HBS11 584991 3476175 227 HBS12 585067 3475932 228 HBS13 585112 3475645 229 HBS14 585269 3475437 230 PAL1 584489 3471806 231 PAL2 584554 3471553 232 PAL3 584330 3471407 233 PAL4 584135 3471274 234 PAL5 584006 3471046 235 PAL6 583821 3470897 236 PAL7 583844 3470661 237 PAL8 583653 3470486 238 PAL9 583441 3470367 239 PAL10 583441 3470125 240 PAL11 583278 3469912 241 PAL12 583296 3469647 242 PAL13 583083 3469509

56
This page left intentionally blank

57
Chapter 2. An Investigation of Important Factors Associated with Riparian Bird Community Structure Along the Upper San Pedro River in Southeastern Arizona and Northern Sonora, Mexico: Effects of Reintroduced Beaver Abstract
We conducted bird surveys in riparian areas along the upper San Pedro River in southeastern Arizona (United States) and northern Sonora (Mexico) in order to describe factors influencing bird community dynamics and the distribution and abundance of species of conservation concern. These surveys were conducted to determine the effects of the ecosystem-altering activities of a recently reintroduced beaver population. Beginning in the summer of 2005, we established and surveyed 245 avian point count stations within the San Pedro Riparian National Conservation Area in Arizona, where we also re-visited bird survey sites in riparian portions of two different avian studies that were originally surveyed prior to the beaver reintroduction. In 2006 and 2007, we established and surveyed an additional 70 point count survey stations in northern Sonora, starting along the main stem of the San Pedro River just south of the international border (33 stations on collectively owned Ejido lands) and extending up and to the western portion of the upper watershed at Las Nutrias Reservoir (8 stations on private land) and Los Fresnos Land Trust [28 stations on private land jointly owned and managed by TNC-Mexico and two other Mexican non-government organizations— Biodiversidad y Desarrollo Armónico (BIDA). and Naturalia]. Here, we report a summary of our efforts and a comparison of breeding bird species found in the United States and Mexico. More than one-half of 126 species that we detected are considered “conservation priority” at some level by at least one of several initiatives to recommend management and monitoring of bird populations. Additional activities documented herein include field-skills training of several Mexican biologists, both at a formal avian identification and monitoring workshop in May 2007 at Los Fresnos Land Trust, as well as continual individualized training of several biologists throughout the collaboration in 2006 and 2007.
Background The upper San Pedro River riparian corridor of southeastern Arizona is recognized as a regionally
important area for breeding and migrating birds (Skagen and others, 1998; Krueper and others, 2003). It is a well-known area for bird-watching opportunities and as a region where there exists a controversy, regarding local groundwater pumping and its effect on the river’s surface water (Stromberg and Tiller, 1996; Rojo and others, 1999; Davis, 2004; Caicedo and others, 2006). In 1999, the Bureau of Land Management (BLM), in cooperation with the Arizona Game and Fish Department, began to successfully reintroduce beaver (Castor canadensis) in to the San Pedro Riparian National Conservation Area (SPRNCA) in the United States, where historical accounts show it once thrived. The purpose was to increase total riparian area water retention and to restore habitat structural heterogeneity, thus enhancing conditions for birds and other wildlife (Fredlake, 1997).
Many land managers and restoration ecologists consider the re-establishment of beaver as an efficient method of restoring riparian attributes and functionality (Apple, 1985; Olson and Hubert, 1994; Albert and Trimble, 2000). To assess this expectation, as well as describe other variables important to riparian bird community structure along the upper San Pedro River, we studied avian abundance along a gradient of riparian conditions along the upper San Pedro River in southeastern Arizona (2005–2007) and northern Sonora (2006–2007). Sites varied naturally in vegetation cover and species assemblage, tree age/size classes and basal area, surface-water depth and persistence (dry, intermittent, and perennial), and intensity of beaver activity. Our study is one of the first to investigate the influence of beaver on avian communities in a Southwest riparian ecosystem.
58
Methods
Seven-Minute Point Count Sampling Avian survey stations (point counts) were established every 280 m along the San Pedro River. Our
initial survey points were placed at 100, 200, or 300 m (that is, randomly chosen among these three) from bridges or other road access points. We used modified variable-circular plot point counts (Reynolds and others, 1980; Ralph and others, 1993), incorporating distance sampling methods of Buckland and others (2001) to estimate bird abundance and species richness at a total of 245 stations in the United States and 70 stations in Mexico. In 2005–2007, we conducted 7-minute point count surveys from mid-May to late July or early August. For every bird detected, we noted distance from observer (as measured with a Bushnell Yardage-Pro® laser Range Finder), detection type (song, call, visual/perched, or moving/flying, flying high overhead), if detected in first 5 or last 2 minutes, and any breeding information (for example, nest found, carrying nest material or fecal sacs or food, young fledglings being fed, etc.). Indications of breeding activity were documented at every opportunity during or between surveys; as well, incidental sightings of rare species and those of conservation concern were noted when walking between survey stations and while scouting new routes (for example, at reservoirs in Mexico adjacent or near riparian areas). Data from all birds encountered through the 7-minute point count sampling effort are summarized and presented in section, “Results” of this chapter.
Immediately after each visit, we recorded beaver sign (dam, gnawed trees, stumps, downed trees) and condition of river (deep or shallow water, drying or recently dried, etc). Additionally, we measured more than 40 environmental variables at each survey site, including percent canopy cover for each tree and shrub species in seven different height strata (0–1, 1–3, 3–5, 5–10, 10–15 m, etc.) and diameter breast height of all trees within 30 m, width of riparian vegetation perpendicular to orientation of river, distance from the survey center point to river edges and to riparian vegetation edges, width and depth of river, persistence of surface water throughout dry season, and numerous other vegetative, hydrologic, and geomorphic factors such as vegetation community type(s) in each area and depth of entrenchment/terracing. These environmental measurements will be included as independent variables, and bird density and diversity will be included as dependent variables, in different modeling efforts and are not utilized further in this report.
Resampling of Historical Surveys In order to investigate whether any changes in the bird community have occurred since the
reintroduction of beaver, we revisited a subset (that is, the riparian portions) of two different studies in the SPRNCA, both of which were originally conducted prior to beaver establishment. David Krueper and associates at the BLM conducted Emlen line transects from 1986 to 1996 (Krueper and others, 2003), of which we repeated six riparian transects (Hereford, one transect north and another just south of U.S. Highway 90Highway 90, Gray Hawk Ranch, Curtis Windmill, and St. David Ditch). Arriana Brand conducted point counts at more than 260 stations throughout the upper San Pedro River from 1999 to 2001 (Brand and others, 2006, 2010, for details), of which we re-visited 63 stations at 17 sites—essentially all of that study’s survey stations that were within riparian vegetation on the SPRNCA. The dataset resulting from resurveying these historical sites is being utilized for a before-after control-impact study (following methods recommended by McDonald and others, 2000) to test for differences in individual bird species densities and overall species diversity associated with the impacts of beaver activity.

59
Conservation Priority Index Ranking In order to assess the upper San Pedro River study area for its conservation value to birds, and to
inform management and research decisions regarding birds in the study area, we analyzed how the bird species we encountered in the United States and Mexico were listed or ranked by five different efforts to prioritize species for conservation action or concern. From these five efforts, we used 17 lists, ranging from critically imperiled species listed by the U.S. Fish and Wildlife Service (USFWS) through the Endangered Species Act (U.S. Fish and Wildlife Service, 2007) to birds whose populations are viable and stable, yet recommended for monitoring as “stewardship species” that can serve as environmental indicators (for example, Rich and others, 2004). We scanned the 17 lists and noted the rank, score, or other designation for all species we detected in the upper San Pedro River Basin. Many of the efforts used the Partners in Flight assessment criteria (Panjabi and others, 2005) as a starting point, but additional considerations relating to the different objectives of each organization yielded lists of conservation concern species for our study area that were different. This variation was expected as the five entities have different missions, and of course some of the lists were concerned with birds of the highest priority, while others are meant as a guide to encourage monitoring populations and not necessarily prompting immediate conservation action. The total number of the 17 lists that each species was ranked or listed on is reported in table 2-2 under “Conservation Priority Index.” Appendix 2-A contains a table of all species that were mentioned by at least one effort and their ranks/designations on each of the 17 lists, and follows with details and references regarding evaluation criteria used by each effort.
Results For this report, we present abundance and distribution information for each bird species
encountered in the United States and Mexico, and we then provide an analysis of how these species were ranked or listed throughout several conservation planning initiatives. Further analyses regarding specific variables of importance to bird communities on the San Pedro River, and the relative influence of beaver, are also provided. From 2005 to 2007, we established and repeatedly surveyed 315 avian point count stations in the United States and Mexico, and re-visited 63 point count stations and six transects from two historical studies (table 2-1). Repeated visits to these sites resulted in 3,235 individual surveys, distributed over 307 person-days by Glenn Johnson and field assistants (table 2-1). These efforts yielded 42,691 individual bird detections from 126 species. In conducting these surveys, we sampled from over 102 linear kilometers of riparian habitat in the United States and Mexico, and re-visited 17 km of historical survey sites (which overlapped with the same riparian areas visited during the 7-minute point count sampling on the SPRNCA). Thus, our efforts spanned from the northern edge of the SPRNCA near St. David, Arizona, south and up-river to the international border, then south through 12 km of the main stem of the San Pedro River in Sonora, Mexico, and finally up to the slightly higher elevation riparian areas at Las Nutrias and Los Fresnos in Mexico.
Breeding Birds of the Upper San Pedro River Riparian Areas The majority of our bird detections were associated with the 7-minute point count surveys that we
established, while the historical survey efforts yielded a relatively small proportion of detections (table 2-1). Moreover, there were no species detected on the historical surveys that were not encountered on the 7-minute point count surveys, because of the more limited spatial and temporal extent of the historical surveys. We report the total detections and relative distribution (number of stations and occupancy as total percent of stations in each area) for 126 species encountered while conducting the (7-minute) point count sampling efforts in the United States, Mexico, and combined throughout the total study area (table 2-2,). Standard English and scientific names of birds in table 2-2 follow the American Ornithologist’s Union latest checklist for the bird species known from North America (American Ornithologists Union, 2007),

60
which is the 7th edition checklist (American Ornithologists Union, 1998) but incorporates recent changes through the 48th supplement (Banks and others, 2007). Spanish names are from Kauffman (2005) and/or our collaborators in Mexico.
Of the 126 species that we detected, at least 83 were actively breeding in the area (English name in table 2-2). We documented confirmatory evidence such as active nests, nest-building or carrying nest materials, carrying food (presumably to nestlings or potential mate) or fecal sacs, courtship displays in presence of female or other evidence of pairing, or feeding very recently fledged young that had limited mobility. Eighty-six species were neotropical migrants as defined by the U.S. Fish and Wildlife Service (2007) and Rappole (1995) (table 2-2).
Because the amount of time, spatial extent, and elevation varied between the United States and Mexico sampling efforts (table 2-1), our species list and results (table 2-2) are intended for summary purposes only and should not be construed as direct population comparisons among sites. For example, while the United States’ effort was essentially one long transect along the mid-elevation riparian habitat throughout the SPRNCA, in Mexico we sampled in three distinct areas—(1) along the main stem of the San Pedro on collectively owned Ejido-lands from border south 12 km, (2) on private land at Las Nutrias, and (3) on private land at Los Fresnos Land Trust, TNC-Mexico, the latter incorporating 3 km of high elevation (up to 1,600 m) riparian forest containing sycamores and surrounded by oak mixed with grasslands. This additional riparian forest type accounts for some of the differences in species’ abundance and distribution seen in Mexico, yet similar forest types exist in high elevation portions of the San Pedro River watershed in the United States; and one would find similar bird species [for example, abundant Dusky-capped Flycatcher (Myiarchus tuberculifer), Montezuma Quail (Cyrtonyx montezumae)] if one were to sample the biological community at the latter location.
Species of Conservation Concern We found that 59 of 126 species were listed on at least one or more efforts to prioritize species for
conservation actions (table 2-2, column 13). Our “Conservation Priority Index” is not weighted by the highest-priority species or threats to populations, and because passerine landbirds have been the subject of a greater number of evaluation efforts, our index score may be lower for more imperiled species [for example, federally listed Endangered birds such as the Least Tern (Sternula antillarum)]. Thus, our “index” should be used as a relative quantification of different conservation-consideration efforts, and not a tool for evaluating the relative conservation concerns of each species. Nonetheless, almost one-half the species we found along the upper San Pedro River are of some level of conservation concern, demonstrating the importance of these riparian areas for bird conservation at the local, regional, and bi-national scale (see appendix 2-A for detailed list of species and their designations, and each conservation initiative’s criteria under each list).
Incidental and Noteworthy Species, Excluded Observations Sixteen species (204 individuals) are included although they were incidental to our surveys, in that
they were encountered between survey points or at riparian areas en route to survey areas (table 2-2). Several of these species are waterfowl or water-associated birds that were detected at Los Fresnos and Las Nutrias Reservoirs while scouting nearby riparian areas for the Mexican portion of the study. The 16 species were included in this summary because their presence in the area is noteworthy from either a distributional and/or conservation perspective. Few accounts of species abundance and distribution are available for the upper San Pedro River watershed, and indeed for much of extreme northern Sonora (Flesch, 2008a), so we felt that including all information of potential interest was warranted. With this in mind, appendix 2-A contains detailed location and observation information for noteworthy species (table 2-2) detected throughout the study area.
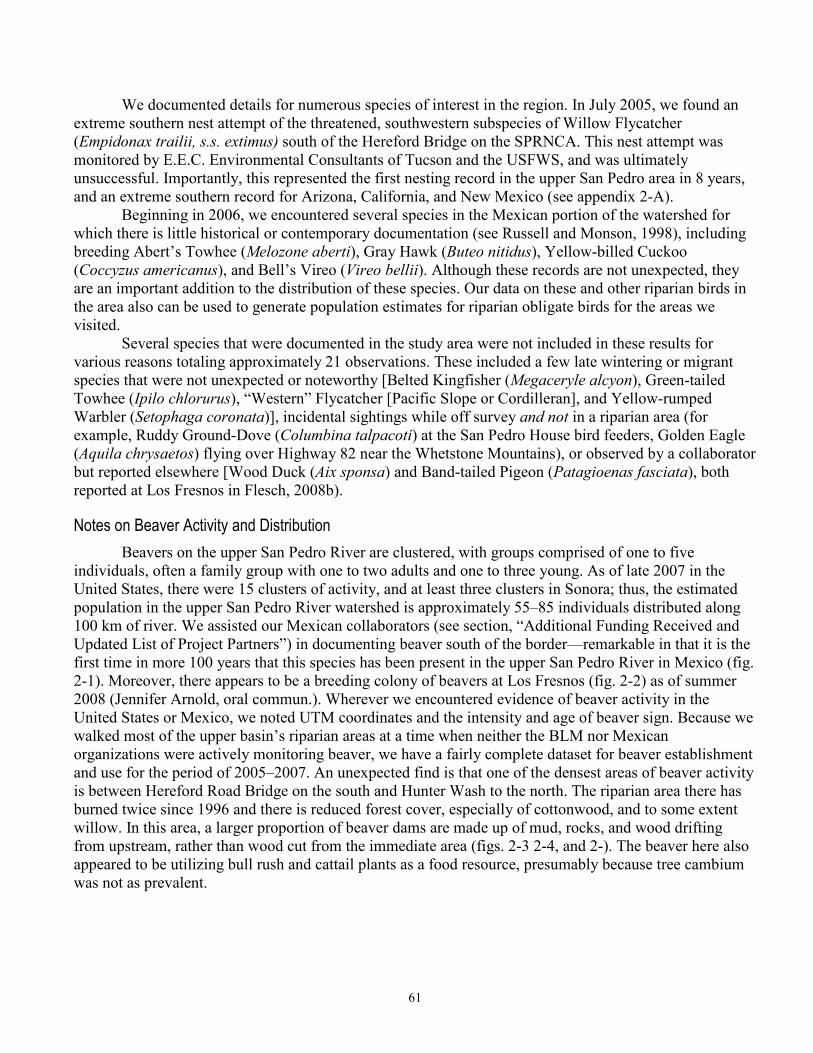
61
We documented details for numerous species of interest in the region. In July 2005, we found an extreme southern nest attempt of the threatened, southwestern subspecies of Willow Flycatcher (Empidonax trailii, s.s. extimus) south of the Hereford Bridge on the SPRNCA. This nest attempt was monitored by E.E.C. Environmental Consultants of Tucson and the USFWS, and was ultimately unsuccessful. Importantly, this represented the first nesting record in the upper San Pedro area in 8 years, and an extreme southern record for Arizona, California, and New Mexico (see appendix 2-A).
Beginning in 2006, we encountered several species in the Mexican portion of the watershed for which there is little historical or contemporary documentation (see Russell and Monson, 1998), including breeding Abert’s Towhee (Melozone aberti), Gray Hawk (Buteo nitidus), Yellow-billed Cuckoo (Coccyzus americanus), and Bell’s Vireo (Vireo bellii). Although these records are not unexpected, they are an important addition to the distribution of these species. Our data on these and other riparian birds in the area also can be used to generate population estimates for riparian obligate birds for the areas we visited.
Several species that were documented in the study area were not included in these results for various reasons totaling approximately 21 observations. These included a few late wintering or migrant species that were not unexpected or noteworthy [Belted Kingfisher (Megaceryle alcyon), Green-tailed Towhee (Ipilo chlorurus), “Western” Flycatcher [Pacific Slope or Cordilleran], and Yellow-rumped Warbler (Setophaga coronata)], incidental sightings while off survey and not in a riparian area (for example, Ruddy Ground-Dove (Columbina talpacoti) at the San Pedro House bird feeders, Golden Eagle (Aquila chrysaetos) flying over Highway 82 near the Whetstone Mountains), or observed by a collaborator but reported elsewhere [Wood Duck (Aix sponsa) and Band-tailed Pigeon (Patagioenas fasciata), both reported at Los Fresnos in Flesch, 2008b).
Notes on Beaver Activity and Distribution Beavers on the upper San Pedro River are clustered, with groups comprised of one to five
individuals, often a family group with one to two adults and one to three young. As of late 2007 in the United States, there were 15 clusters of activity, and at least three clusters in Sonora; thus, the estimated population in the upper San Pedro River watershed is approximately 55–85 individuals distributed along 100 km of river. We assisted our Mexican collaborators (see section, “Additional Funding Received and Updated List of Project Partners”) in documenting beaver south of the border—remarkable in that it is the first time in more 100 years that this species has been present in the upper San Pedro River in Mexico (fig. 2-1). Moreover, there appears to be a breeding colony of beavers at Los Fresnos (fig. 2-2) as of summer 2008 (Jennifer Arnold, oral commun.). Wherever we encountered evidence of beaver activity in the United States or Mexico, we noted UTM coordinates and the intensity and age of beaver sign. Because we walked most of the upper basin’s riparian areas at a time when neither the BLM nor Mexican organizations were actively monitoring beaver, we have a fairly complete dataset for beaver establishment and use for the period of 2005–2007. An unexpected find is that one of the densest areas of beaver activity is between Hereford Road Bridge on the south and Hunter Wash to the north. The riparian area there has burned twice since 1996 and there is reduced forest cover, especially of cottonwood, and to some extent willow. In this area, a larger proportion of beaver dams are made up of mud, rocks, and wood drifting from upstream, rather than wood cut from the immediate area (figs. 2-3 2-4, and 2-). The beaver here also appeared to be utilizing bull rush and cattail plants as a food resource, presumably because tree cambium was not as prevalent.

62
Modeling Bird and Beaver Associations Relative to Vegetation and Surface Water Our preliminary analyses indicated that areas of beaver activity are associated with greater bird
species richness, abundance of riparian bird species, and conservation concern species. We first eliminated highly correlated variables, and then used stepwise variable selection to build a multiple linear regression model that explained bird species richness within the riparian corridor, within 50 m of the station centers. Models incorporated perpendicular width of riparian vegetation, maximum percent cover of upper canopy layers, the presence and late-season persistence surface water, percent willow cover, and heterogeneity of habitat at several scales. After accounting for variation attributable to these sources, several beaver-related variables were chosen by stepwise variable selection as significantly influencing riparian bird species richness, including presence or absence of any beaver sign, intensity of beaver sign, and number of years within last 7 where a beaver dam was located within 250 m. Similarly, models comparing relative abundance of riparian obligate species or species of conservation concern (for example, Yellow Warbler) showed that beaver sign was correlated with higher abundance of these birds. These relationships held true even after controlling for the effect of water presence or depth, width of riparian vegetation area, canopy coverage, etc. The most recent analyses involve the use of density estimates for abundant species as derived from distance sampling methods, and comparing the historical data to those we collected at the same sites.
Additional Funding Received and Updated List of Project Partners (In Bold) Two Mexican partners new to the project who are actively involved in various conservation and
avian management activities in the upper San Pedro River watershed of Sonora provided us with key logistical, translation, and field assistance as well as providing field accommodations. Beginning in 2006, staff from the Ajos-Bavispe National Forest Reserve (Cananea office) facilitated our efforts by providing vehicle transportation in the field, initial landowner contacts and securing permission to survey, as well as field accompaniment and assistance. This group is part of the Mexican federal land management agency Comisión Nacional de Áreas Naturales Protegidas (CONANP), which in turn is under the Secretaría de Medio Ambiente y Recursos Naturales (SEMARNAT), a cabinet level department of the federal executive branch that develops and implements environmental policy and legislation. In 2007, a second group, Biodiversidad y Desarrollo Armónico (BIDA), A.C. , a non-governmental organization with offices in Cananea and Hermosillo, Sonora, began assisting with logistical support and additional landowner contacts in the upper watershed. Both of these organizations provided field vehicle transportation for the study in Mexico, as well as salary for their respective individual employees while working with this project, for a total estimated contribution of $3,500 ($1,800 from CONANP in 2006 and 2007, and $1,700 from BIDA in 2007). It is our understanding that an important part of the mission of both CONANP (SEMARNAT) and BIDA is to facilitate and direct conservation efforts, and specifically avian research, in the upper San Pedro watershed of Sonora. They were quite open to collaborating with us (including intensive training in bird and habitat survey techniques) as the activities were in-line with their priorities.
Individuals from CONANP included Eduardo Hinojosa Robles (2006), Luis Portillo (2006, 2007), Rosa Elena Jimenez Maldonado and Daniel Toyos Martinez (2007), as well as ecologist and director Elvira Rojero Diaz who authorized their participation. Individuals from BIDA greatly assisted the project in 2007 and mainly included Sergio Juàrez and Eduardo E. López Saavedra (director). These people were all crucial to the effort in Sonora and were a pleasure to work with.

63
Additionally, individual researchers and/or graduate students from the University of Arizona collaborated on avian studies in the high-elevation portion of the watershed at Rancho Los Fresnos, a conservation land trust jointly owned and managed by The Nature Conservancy (Mexico), BIDA, and the Mexican conservation organization Naturalia. They participated in this study either through contributing their incidental bird or beaver observations and/or participating directly in the current study as contractor-surveyors. They include Aaron Flesch, Emilie Snell-Rood, Christine Lamanna, Greta Anderson, and Brad Boyle.
Changes to Original Proposal - Interactions with People The major change to the original Sonoran Joint Venture proposal was the extension of the work to
include the Mexican portion of the watershed. This resulted in interactions with 12 biologists and natural resources agents that work in northern Sonora, 9 of whom attended the “Field Methods for Conducting Riparian Bird Surveys” intensive workshop on May 17–18, 2007 (fig. 2-1). We also facilitated the annual wet/dry surface water monitoring in 2006 and 2007 in the Mexican portion of the San Pedro River watershed along the main stem of river south of the border, where seven Mexican collaborators assisted. This partner program organized by TNC and the BLM in the United States now includes more Mexican collaborators in the upper watershed, in part due to our efforts. Eight individuals helped with that effort, which we integrated with some of our avian, vegetation and hydrology measurements. Additionally, three of the biologists mentioned in the “partners” section above accompanied surveyors at nearly all points while we were surveying in Sonora, and this was treated largely as an extended training session for bird identification and survey techniques.
Conclusion We conducted more than 2,000 individual surveys at the 315 point count stations, and at historical
bird survey sites throughout the upper San Pedro River watershed in southeastern Arizona and northern Sonora. In total, we recorded well over 30,000 bird detections and much more environmental measurement data, which are being incorporated into modeling efforts. These survey data documented the abundance, distribution and breeding status of 126 species, nearly one-half of which are species recommended for monitoring or conservation concern. Little prior information was available from this area of northern Mexico for many of these species. We also documented beaver at numerous locations in the United States and Mexico, and make these data available to other researchers who would like to investigate beaver activity and distribution in the area. These data and preliminary analyses all indicate a positive correlation between beaver activity and greater species richness and abundance of riparian obligate birds. These riparian bird community metrics are of great interest to ecologists, conservation biologists, land managers and others interested in the conservation, restoration and management of riparian areas.
Largely because of Sonoran Joint Venture support, we worked with several important partners in the United States and Mexico that increased the breadth of our study and enhanced the overall impact on management activities. These management activities included intensive training with several Mexican biologists over the course of two survey seasons and a formal workshop in bird survey techniques, mapping surface-water distribution in Mexico, and providing information in scientific and public forums.

64
References Cited Albert, S., and Trimble, T., 2000, Beavers are partners in riparian restoration on the Zuni Indian Reservation:
Ecological Restoration, v. 18, no. 2, p. 87–92. American Ornithologists’ Union, 1998, Check-list of North American Birds (7th ed): American Ornithologists’
Union, Washington, D.C. American Ornithologists’ Union, 2007, List of the 2,046 bird species (with scientific and English names)
known from the A.O.U. check-list area (Based on 7th edition list incorporating changes from 48th supplement), accessed December 2007 as a Microsoft® Excel file at http://www.aou.org/checklist/index.php3.
Apple, L.L., 1985, Riparian habitat restoration and beavers—Riparian ecosystems and their management—Reconciling conflicting uses: North American Riparian Conference, 1st, University of Arizona, Tucson, Ariz., April 16–18, 1985.
Audubon.org, 2008a, North American bird species undergoing the greatest population declines from 1966–2003 (from USGS/BBS data), accessed March 2008, at http://www.audubon.org/bird/stateofthebirds/popdeclines.html.
Audubon.org, 2008b, Common birds in decline—What's happening to birds we know and love? (Based on Christmas Bird Count and USGS BBS data), accessed March 2008, at http://stateofthebirds.audubon.org/cbid/.
Audubon.org, and American Bird Conservancy, 2007, The 2007 Audubon watch list, accessed December 2007, at http://web1.audubon.org/science/species/watchlist/.
Banks, R.C., Chesser, R.T., Cicero, C., Dunn, J.L., Kratter, A.W., Lovette, I.J., Rasmussen, P.C., Remsen, J.V., Rising, J.D., and Stotz, D.F., 2007, Forty-eighth supplement to the American Ornithologists’ Union Checklist of North American Birds: Auk, v. 124, no. 3, p.1109–1115.
Brand, L.A., Noon, B.R., and Sisk, T.D., 2006, Predicting abundance of desert riparian birds—Validation and calibration of the effective area model: Ecological Applications, v. 16, no. 3, p. 1090–1102.
Brand, L.A., Stromberg, J.C., and Noon, B.R., 2010, Avian density and nest survival on the San Pedro River—Importance of vegetation type and hydrologic regime: Journal of Wildlife Management, v. 74, no. 4, p. 739–754.
Buckland, S.T., Anderson, D.R., Burnham, K.P., Laake, J.L., Borchers, D.L., and Thomas, L., 2001, Introduction to distance sampling—Estimating abundance of biological organisms: Oxford, United Kingdom, Oxford University Press, 448 p.
Caicedo, J., Duberstein, J.N., Gómez-Limón, E., Marcias-Duarte, A., Wethington, S., and Wilbor, S., 2006, Mexican highlands region chapter—BCR 34 in Beardmore, C.J., ed., Sonoran Joint Venture—Bird Conservation Plan, Version 1.0: Sonoran Joint Venture—Binational Bird Conservation, p. 122–171, accessed December 2007, at http://www.sonoranjv.org/planning/cons_plan/Ver1_Chapter_ Oct2006/SJV_ConsPlan_Mexican_Highlands_Region_Chapter.pdf. Introduction to Sonoran Joint Venture Bird Conservation Plan, or to download portions or entire SJV Plan: http://www.sonoranjv.org/planning/cons_plan/SJVConsPlan.html.
Davis, T., 2004, A thirst for growth: High Country News, v. 36, no. 16, p. 7–12. Flesch, A.D., 2008a, Distribution and status of breeding landbirds in northern Sonora Mexico: Studies in Avian
Biology, v. 37, p. 28-45. Flesch, A.D., 2008b, Status and population size of breeding grassland birds on Rancho Los Fresnos, northern
Sonora, Mexico: Report to Biodiversidad y Desarrollo Armónica (BIDA), A.C., 18 p. Fredlake, M., 1997, Re-establishment of North American beaver (Castor Canadensis) into the San Pedro
riparian National Conservation Reserve Area: Bureau of Land Management Environmental Assessment EA AZ-060-97-004, Tucson, Ariz.

65
Kaufman, K., Gomez de Silva, H., and Manzano Fischer, P., 2005, Guia de campo Kaufman a las aves de NorteAmerica (Kaufman Guide to Birds of North America, Spanish Language Version): Boston, Mass., Houghton Mifflin Harcourt, 392 p.
Krueper, D.J., 2000, Annotated checklist of the birds of the upper San Pedro River Valley, Arizona: U.S. Bureau of Land Management San Pedro Riparian National Conservation Area.
Krueper, D., Bart, J., and Rich, T.D., 2003, Response of vegetation and breeding birds to the removal of cattle on the San Pedro River, Arizona (U.S.A.): Conservation Biology, v. 17, no. 2, p. 607–615.
Latta, M.J., Beardmore, C.J., and Corman, T.E., 1999, Arizona partners in flight bird conservation plan, version 1.0: Arizona Game and Fish Department Nongame and Endangered Wildlife Program Technical Report 142, accessed March 2008, at http://www.blm.gov/wildlife/plan/pl_az_10.pdf.
McDonald, T.L., Erickson, W.P., and McDonald, L.L., 2000, Analysis of count data from before–after control–impact studies: Journal of Environmental Statistics, v. 5, no. 3, p. 262–279.
Panjabi, A.O., Dunn, E.H., Blancher, P.J., Hunter, W.C., Altman, B., Bart, J., Beardmore, C.J., Berlanga, H., Butcher, G.S., Davis, S.K., Demarest, D.W., Dettmers, R., Easton, W., Gomez de Silva Garza, H., Iñigo-Elias, E.E., Pashley, D.N., Ralph, C.J., Rich, T.D., Rosenberg, K.V., Rustay, C.M., Ruth, J.M., Wendt, J. S., and Will, T.C., 2005, The partners in flight handbook on species assessment, version 2005: Partners in Flight Technical Series No. 3, accessed January 2008, at http://www.rmbo.org/pubs/downloads/Handbook2005.pdf.
Partners in Flight, 2005, BCR breeding season assessment scores, accessed December 2007, at http://rmbo.org/pifassessment/Archives.aspx.http://www.rmbo.org/pif/downloads/downloads.html.
Ralph, C.J., Geupel, G.R., Pyle, P., Martin, T.E., and DeSante, D.F., 1993, Handbook of field methods for monitoring landbirds: Pacific Southwest Research Station General Technical Report PSW-GTR-144-www, 46 p.
Rappole, J.H., 1995, The ecology of migrant birds—A neotropical perspective: Washington, D.C., Smithsonian Institution Press, p. 173–182.
Reynolds, R.T., Scott, J.M., and Nussbaum, R.A., 1980, A variable circular-plot method for estimating bird numbers: The Condor, v. 82, p. 309–313.
Rich, T.D., Beardmore, C.J., Berlanga, H., Blancher, P.J., Bradstreet, M.S.W., Butcher, G.S., Demarest, D.W., Dunn, E.H., Hunter, W.C., Iñigo-Elias, E.E., Kennedy, J.A., Martell, A.M., Panjabi, A.O., Pashley, D.N., Rosenberg, K.V., Rustay, C.M., Wendt, J.S., and Will, T.C., 2004, Partners in flight—North American landbird conservation plan: Ithaca, N.Y., Cornell Lab of Ornithology, 2005, at http://www.partnersinflight.org/cont_plan/ (Version: March 2005).
Rojo, H.A., Bredehoeft, J., Lancewell, R., Price, J., Stromberg, J., and Thomas, G.A., 1999, Sustaining and enhancing riparian migratory bird habitat on the upper San Pedro River: Public review draft from the San Pedro Expert Study Team, prepared for the Commission for Environmental Cooperation, 141 p.
Russell, S.M., and Monson, G., 1998, The birds of Sonora: Tucson, Ariz., University of Arizona Press. Skagen, S.K., Melcher, C.P., Howe, W.H., and Knopf, F.L., 1998, Comparative use of riparian corridors and
oases by migrating birds in southeast Arizona: Conservation Biology, v. 12, no. 4, p. 896–909. Stromberg, J.C., and Tiller, R., 1996, Effects of groundwater decline on riparian vegetation of semiarid
regions—The San Pedro, Arizona: Ecological Applications, v. 6, no. 1, p. 113–131. U.S. Fish and Wildlife Service, 2002, Birds of conservation concern 2002: U.S. Fish and Wildlife Service
Division of Migratory Bird Management, Arlington, Va., 99 p. [Online version available at <http://migratorybirds.fws.gov/reports/bcc2002.pdf>].
U.S. Fish and Wildlife Service, 2007, Division of Bird Habitat Conservation—List of nearctic and neotropical migrants, all or part of whose populations breed north of the Tropic of Cancer and winter south of that line (based on Rappole, 1995), accessed January 2008, at http://www.fws.gov/birdhabitat/Grants/NMBCA/BirdList.shtm.
U.S. Fish and Wildlife Service, 2008, Threatened & Endangered Species System, [Query to determine relation of detected bird species to Endangered Species Act listings], accessed January 2008, at http://ecos.fws.gov/tess_public/.

66
Figures
Figure 2-1 Scanning riparian vegetation for a bird heard during a training session lead by the investigator at Los Fresnos Land Trust, TNC~Mexico, in the Sonoran portion of the upper San Pedro River watershed, May 16, 2007. Pictured are biologists from Comisión Nacional de Áreas Naturales Protegidas-Secretaría de Medio Ambiente y Recursos Naturales, Naturalia, and Biodiversidad y Desarrollo Armónico A.C. (BIDA A.C.). Photograph by Sergio Juàrez, BIDA, A.C.
Figure 2-2. Beaver (Castor canadensis) sign along upper San Pedro River 7.2 kilometers south of the U.S.-Mexico International border. The individuals responsible are presumed to have immigrated south from the recently reintroduced population in the United States, as there have been no beaver documented on the upper San Pedro of Sonora in over 100 years. Photograph by Sergio Juàrez, BIDA, A.C.
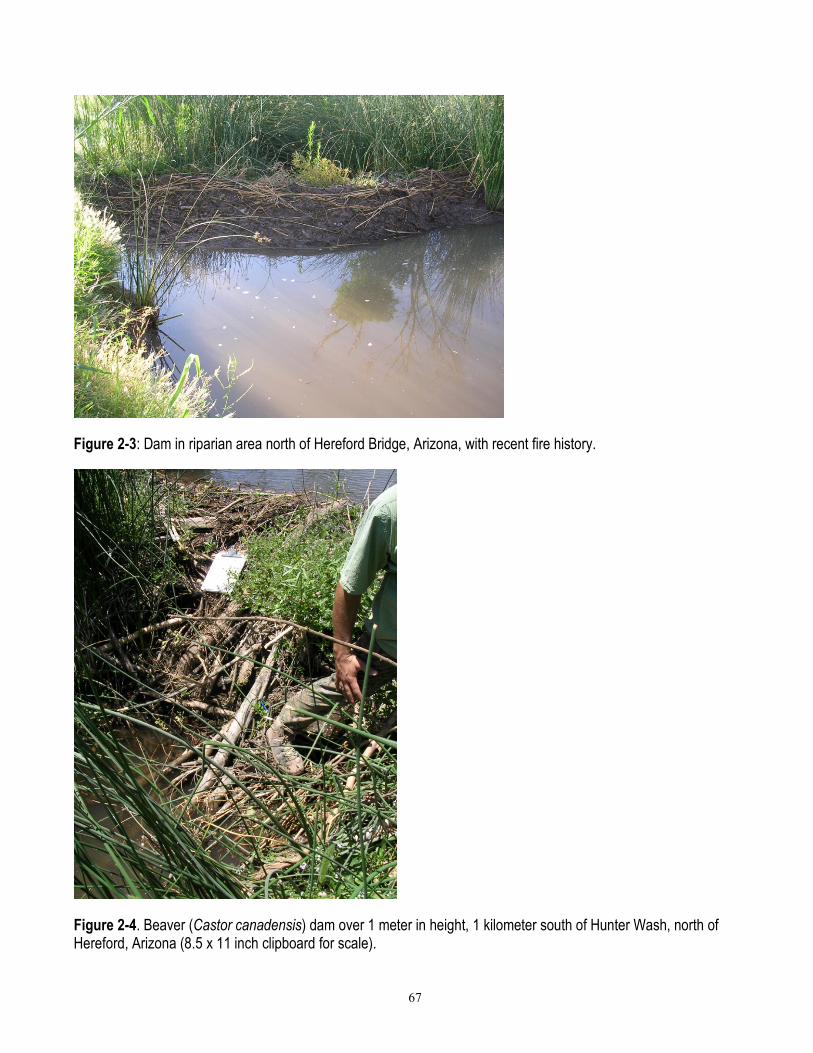
67
Figure 2-3: Dam in riparian area north of Hereford Bridge, Arizona, with recent fire history.
Figure 2-4. Beaver (Castor canadensis) dam over 1 meter in height, 1 kilometer south of Hunter Wash, north of Hereford, Arizona (8.5 x 11 inch clipboard for scale).
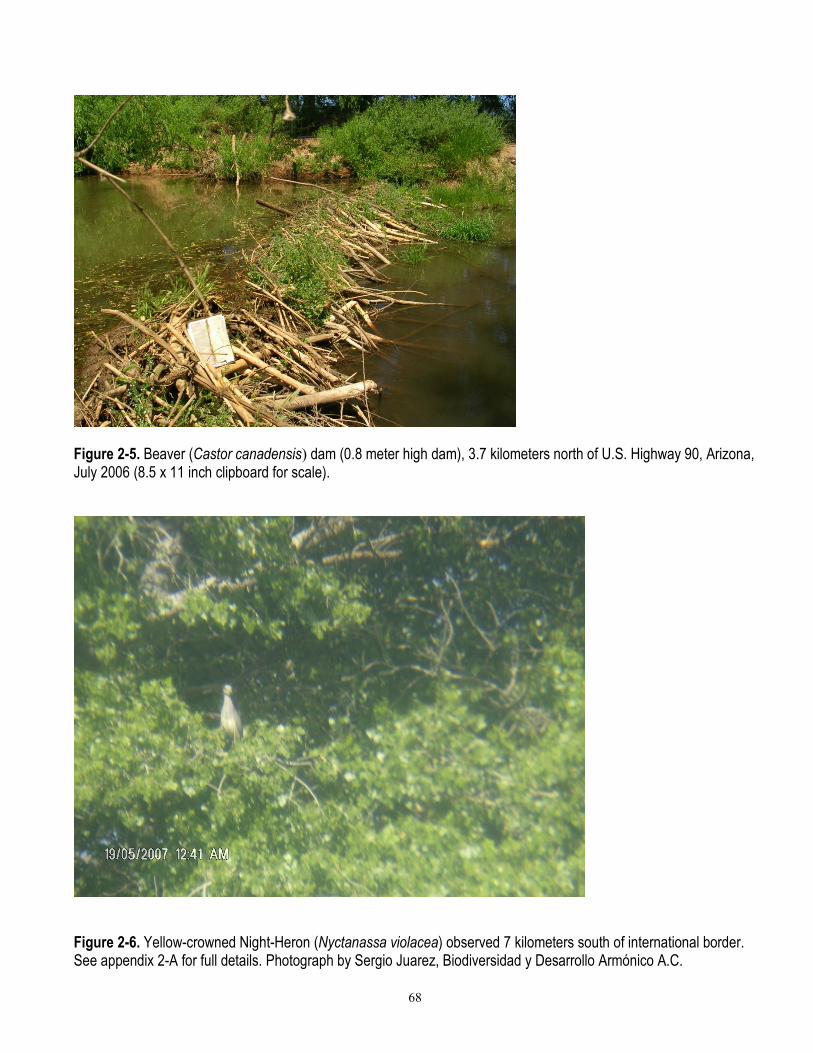
68
Figure 2-5. Beaver (Castor canadensis) dam (0.8 meter high dam), 3.7 kilometers north of U.S. Highway 90, Arizona, July 2006 (8.5 x 11 inch clipboard for scale).
Figure 2-6. Yellow-crowned Night-Heron (Nyctanassa violacea) observed 7 kilometers south of international border. See appendix 2-A for full details. Photograph by Sergio Juarez, Biodiversidad y Desarrollo Armónico A.C.

69
69
Tables
Table 2-1. Four components of the investigation of bird community dynamics in riparian areas in the upper San Pedro River watershed and details of survey technique, effort, total detections, and study design.
Study component
Number (time length) and type of survey, and spatial
arrangement
Number of pers-on days Years
Number of
detect-ions
Number of linear kilometers of riparian
habitat sampled; elevation
Test/design considerations
Extensive systematic sampling throughout the SPRNCA, U.S.A.
245 (7-minute) point count stations, in one long transect along river, about 280 m apart
203 2005–2007 32,475
69 km, cottonwood-willow, some tamarisk, mesquite, early successional; 1,130–1,310 m
> 40 environmental variables measured, test for most important influences on birds as well as relative influence of beaver activity
Systematic sampling in Mexican portion of San Pedro River Watershed
70 (7-minute) point count stations, on seven routes along river and other riparian zones, about 280 m apart
21 2006–2007 4,041
23 km, cottonwood-willow, (including 3km of sycamore/ cottonwood at highest elevation); 1,310–1,600m
24 environmental Variables measured, test for important factors in upper watershed, differences between U.S. and MX, and recent beaver activity.
Repeat of riparian portions of Brand and others (2006,2010) studies
63 (5-minute) point count stations at 17 sites, in riparian area along river, 100 m apart
53
(1999–2001); 2005–2007
2,147
10 km, mostly cottonwood-willow, tamarisk, early successional; 1,130–1,310m
Historical: Before/After to investigate if bird community different in areas where beaver have moved in.
Repeat of riparian portions of Krueper and others (2003) study
6 (30m/minute) Emlen line transects 1 to 1.5 km in length, along river/riparian.
30
(1986–1996); 2005–2007
4,028
7 km, cottonwood-willow and post fire. 1,150–1,275m
Historical: Before/After to investigate if bird community different in areas where beaver have moved in.
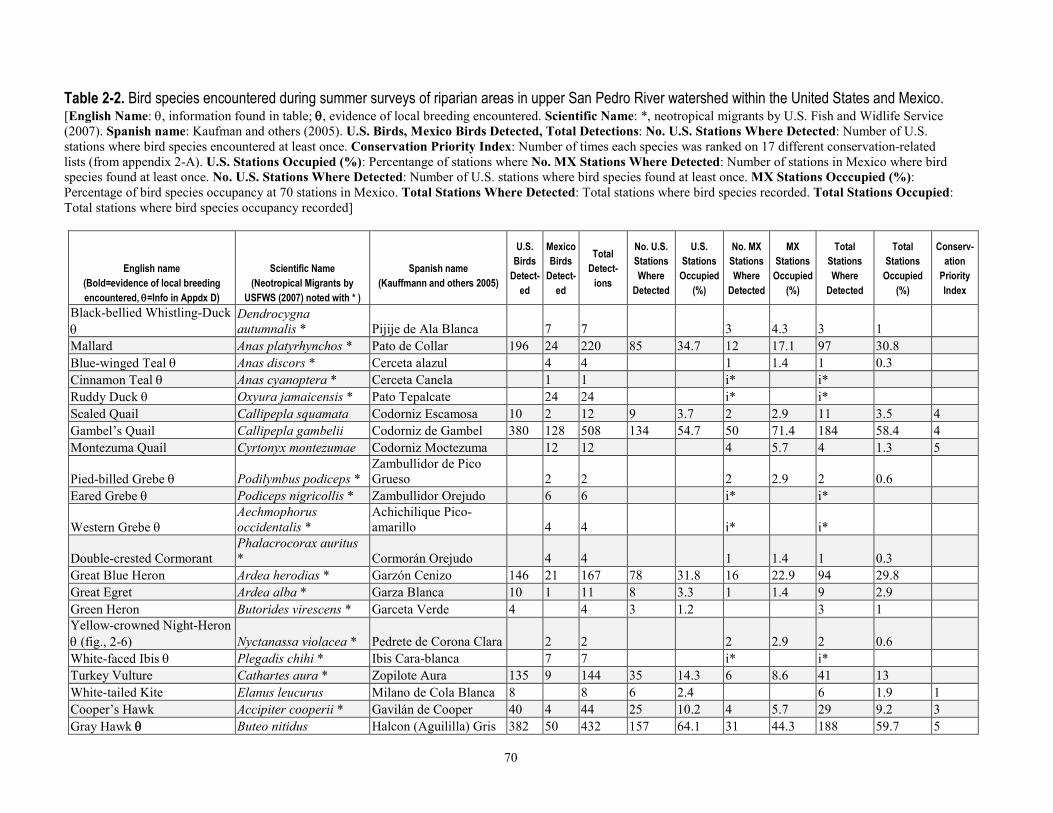
70
Table 2-2. Bird species encountered during summer surveys of riparian areas in upper San Pedro River watershed within the United States and Mexico. [English Name: θ, information found in table; θ, evidence of local breeding encountered. Scientific Name: *, neotropical migrants by U.S. Fish and Widlife Service (2007). Spanish name: Kaufman and others (2005). U.S. Birds, Mexico Birds Detected, Total Detections: No. U.S. Stations Where Detected: Number of U.S. stations where bird species encountered at least once. Conservation Priority Index: Number of times each species was ranked on 17 different conservation-related lists (from appendix 2-A). U.S. Stations Occupied (%): Percentange of stations where No. MX Stations Where Detected: Number of stations in Mexico where bird species found at least once. No. U.S. Stations Where Detected: Number of U.S. stations where bird species found at least once. MX Stations Occcupied (%): Percentage of bird species occupancy at 70 stations in Mexico. Total Stations Where Detected: Total stations where bird species recorded. Total Stations Occupied: Total stations where bird species occupancy recorded]
English name (Bold=evidence of local breeding encountered, θ=Info in Appdx D)
Scientific Name (Neotropical Migrants by
USFWS (2007) noted with * )
Spanish name (Kauffmann and others 2005)
U.S. Birds
Detect-ed
Mexico Birds
Detect-ed
Total Detect-
ions
No. U.S. Stations Where
Detected
U.S. Stations
Occupied (%)
No. MX Stations Where
Detected
MX Stations
Occupied (%)
Total Stations Where
Detected
Total Stations
Occupied (%)
Conserv-ation
Priority Index
Black-bellied Whistling-Duck θ
Dendrocygna autumnalis * Pijije de Ala Blanca 7 7 3 4.3 3 1
Mallard Anas platyrhynchos * Pato de Collar 196 24 220 85 34.7 12 17.1 97 30.8 Blue-winged Teal θ Anas discors * Cerceta alazul 4 4 1 1.4 1 0.3 Cinnamon Teal θ Anas cyanoptera * Cerceta Canela 1 1 i* i* Ruddy Duck θ Oxyura jamaicensis * Pato Tepalcate 24 24 i* i* Scaled Quail Callipepla squamata Codorniz Escamosa 10 2 12 9 3.7 2 2.9 11 3.5 4 Gambel’s Quail Callipepla gambelii Codorniz de Gambel 380 128 508 134 54.7 50 71.4 184 58.4 4 Montezuma Quail Cyrtonyx montezumae Codorniz Moctezuma 12 12 4 5.7 4 1.3 5
Pied-billed Grebe θ Podilymbus podiceps * Zambullidor de Pico Grueso 2 2 2 2.9 2 0.6
Eared Grebe θ Podiceps nigricollis * Zambullidor Orejudo 6 6 i* i*
Western Grebe θ Aechmophorus occidentalis *
Achichilique Pico-amarillo 4 4 i* i*
Double-crested Cormorant Phalacrocorax auritus * Cormorán Orejudo 4 4 1 1.4 1 0.3
Great Blue Heron Ardea herodias * Garzón Cenizo 146 21 167 78 31.8 16 22.9 94 29.8 Great Egret Ardea alba * Garza Blanca 10 1 11 8 3.3 1 1.4 9 2.9 Green Heron Butorides virescens * Garceta Verde 4 4 3 1.2 3 1 Yellow-crowned Night-Heron θ (fig., 2-6) Nyctanassa violacea * Pedrete de Corona Clara 2 2 2 2.9 2 0.6 White-faced Ibis θ Plegadis chihi * Ibis Cara-blanca 7 7 i* i* Turkey Vulture Cathartes aura * Zopilote Aura 135 9 144 35 14.3 6 8.6 41 13 White-tailed Kite Elanus leucurus Milano de Cola Blanca 8 8 6 2.4 6 1.9 1 Cooper’s Hawk Accipiter cooperii * Gavilán de Cooper 40 4 44 25 10.2 4 5.7 29 9.2 3 Gray Hawk θ Buteo nitidus Halcon (Aguililla) Gris 382 50 432 157 64.1 31 44.3 188 59.7 5
71
71
English name (Bold=evidence of local breeding encountered, θ=Info in Appdx D)
Scientific Name (Neotropical Migrants by
USFWS (2007) noted with * )
Spanish name (Kauffmann and others 2005)
U.S. Birds
Detect-ed
Mexico Birds
Detect-ed
Total Detect-
ions
No. U.S. Stations Where
Detected
U.S. Stations
Occupied (%)
No. MX Stations Where
Detected
MX Stations
Occupied (%)
Total Stations Where
Detected
Total Stations
Occupied (%)
Conserv-ation
Priority Index
Swainson’s Hawk θ Buteo swainsoni * Halcon (Aguililla) de Swainson 5 5 10 5 2 5 7.1 10 3.2 7
Zone-tailed Hawk θ Buteo albonotatus * Aguililla cola roja 1 1 1 0.4 1 0.3 2
Red-tailed Hawk Buteo jamaicensis * Halcon (Aguililla) Cola Roja 48 16 64 33 13.5 10 14.3 43 13.7
American Kestrel Falco sparverius Cernícalo Americano 46 20 66 32 13.1 15 21.4 47 14.9 Peregrine Falcon θ Falco peregrinus * Halcón peregrino 2 2 1 0.4 1 0.3 6 American Coot θ Fulica americana * Gallareta Americana 2 2 2 2.9 2 0.6 Killdeer Charadrius vociferus * Chorlo Tildío 27 43 70 12 4.9 20 28.6 32 10.2 Spotted Sandpiper θ Actitis macularius * Playero Alzacolita 4 1 5 4 1.6 1 1.4 5 1.6 Wilson’s Phalarope θ Phalaropus tricolor * Falaropo Picolargo 12 12 i* i* Least Tern θ Sternula antillarum * Charrán Mínimo 1 1 i* i* 4 White-winged Dove Zenaida asiatica * Paloma de Ala Blanca 3113 123 3236 245 100 37 52.9 282 89.5 Mourning Dove Zenaida macroura * Paloma Huilota 856 151 1007 228 93.1 62 88.6 290 92.1 Common Ground-Dove Columbina passerina Tórtola Común 307 77 384 138 56.3 43 61.4 181 57.5 1 Yellow-billed Cuckoo Coccyzus americanus * Cuco de Pico Amarillo 208 49 257 118 48.2 29 41.4 147 46.7 7
Greater Roadrunner Geococcyx californianus Correcaminos Norteño 20 24 44 19 7.8 17 24.3 36 11.4
Barn Owl θ Tyto alba Lechuza de Campanario 2 2 i* i* 1 Western Screech-Owl θ Megascops kennicottii Tecolote Occidental 4 3 7 2 0.8 2 2.9 4 1.3 2 Great Horned Owl Bubo virginianus Búho Cornudo Grande 44 13 57 29 11.8 9 12.9 38 12.1
Lesser Nighthawk θ Chordeiles acutipennis * Chotocabras menor 35 5 40 24 9.8 3 4.3 27 8.6
Common Nighthawk θ Chordeiles minor * Chotacabras Zumbón 18 8 26 15 6.1 7 10 22 7
Common Poorwill θ Phalaenoptilus nuttallii * Tapacaminos Tevíi 70 1 71 i* i* i* 2
Vaux’s Swift θ Chaetura vauxi * Vencejo de Vaux 1 1 1 0.4 1 0.3
Black-chinned Hummingbird Archilochus alexandri * Colibrí Garganta Morada 133 8 141 93 38 6 8.6 99 31.4
Acorn Woodpecker Melanerpes formicivorus Carpintero Arlequín 32 32 14 20 15 4.8
Gila Woodpecker Melanerpes uropygialis Carpintero del Desierto 1496 150 1646 244 99.6 46 65.7 290 92.1 2 Ladder-backed Woodpecker Picoides scalaris Carpintero Mexicano 336 39 375 167 68.2 28 40 195 61.9
Northern Flicker Colaptes auratus Carpintero de Pechera Comun 257 103 360 137 55.9 47 67.1 184 58.4
72
72
English name (Bold=evidence of local breeding encountered, θ=Info in Appdx D)
Scientific Name (Neotropical Migrants by
USFWS (2007) noted with * )
Spanish name (Kauffmann and others 2005)
U.S. Birds
Detect-ed
Mexico Birds
Detect-ed
Total Detect-
ions
No. U.S. Stations Where
Detected
U.S. Stations
Occupied (%)
No. MX Stations Where
Detected
MX Stations
Occupied (%)
Total Stations Where
Detected
Total Stations
Occupied (%)
Conserv-ation
Priority Index
Northern Beardless-Tyrannulet
Camptostoma imberbe * Mosqero Lampino 218 36 254 114 46.5 28 40 142 45.1 4
Olive-sided Flycatcher θ Contopus cooperi * Pibí boreal 1 1 2 1 0.4 1 1.4 1 0.3 7 Western Wood-Pewee Contopus sordidulus * Pibí Occidental 663 48 711 181 73.9 31 44.3 212 67.3 Willow Flycatcher θ Empidonax traillii * Mosquero saucero 9 9 5 2 5 1.6 7 Black Phoebe Sayornis nigricans * Papamoscas Negro 120 31 151 73 29.8 20 28.6 93 29.5 Says Phoebe Sayornis saya * Papamoscas Llanero 6 11 17 6 2.4 7 10 13 4.1 Vermilion Flycatcher Pyrocephalus rubinus * Mosquero Cardenalito 902 167 1069 216 88.2 60 85.7 276 87.6
Dusky-capped Flycatcher θ Myiarchus tuberculifer * Copetón Triste 4 28 32 2 0.8 13 18.6 15 4.8 1
Ash-throated Flycatcher Myiarchus cinerascens * Copetón Cenizo 363 95 458 164 66.9 47 67.1 211 67 1
Brown-crested Flycatcher Myiarchus tyrannulus * Copetón Tirano 509 76 585 187 76.3 30 42.9 217 68.9 1
Tropical Kingbird θ Tyrannus melancholicus * Tirano tropical 18 18 8 3.3 8 2.5 1
Cassins Kingbird Tyrannus vociferans * Tirano Gritón 1517 257 1774 235 95.9 63 90 298 94.6 4
Western Kingbird Tyrannus verticalis * Tirano de Bordes Blancos 208 46 254 98 40 29 41.4 127 40.3
Loggerhead Shrike Lanius ludovicianus * Alcaudón Verdugo 4 8 12 1 0.4 2 2.9 3 1 7 Bell’s Vireo Vireo bellii * Vireo de Bell 744 37 781 187 76.3 20 28.6 207 65.7 8 Plumbeous Vireo Vireo plumbeus * Vireo Plomizo 15 2 17 9 3.7 2 2.9 11 3.5 3 Hutton’s Vireo θ Vireo huttoni Vireo Reyezuelo 1 1 1 0.4 1 0.3 1 Warbling Vireo θ Vireo gilvus * Vireo Gorjeador 1 1 1 1.4 1 0.3 1 Chihuahuan Raven Corvus cryptoleucus Cuervo Llanero 95 1 96 41 16.7 1 1.4 42 13.3 Common Raven Corvus corax Cuervo Comun 50 22 72 35 14.3 12 17.1 47 14.9 Horned Lark θ Eremophila alpestris Alondra Cornuda 60 60 i* i*
Violet-green Swallow Tachycineta thalassina *
Golondrina Verde Tornasol 6 6 i* i* 1
North. Rough-winged Swallow
Stelgidopteryx serripennis*
Golondrina de Ala Aserrada 98 13 111 42 17.1 7 10 49 15.6
Cliff Swallow Petrochelidon pyrrhonota * Golondrina Risquera 124 124 22 9 22 7
Barn Swallow Hirundo rustica * Golondrina Tijereta 10 6 16 6 2.4 1 1.4 7 2.2 Bridled Titmouse Baeolophus wollweberi Carbonero Embridado 17 4 21 9 3.7 1 1.4 10 3.2 3 Verdin Auriparus flaviceps Baloncillo 48 1 49 28 11.4 1 1.4 29 9.2 2

73
73
English name (Bold=evidence of local breeding encountered, θ=Info in Appdx D)
Scientific Name (Neotropical Migrants by
USFWS (2007) noted with * )
Spanish name (Kauffmann and others 2005)
U.S. Birds
Detect-ed
Mexico Birds
Detect-ed
Total Detect-
ions
No. U.S. Stations Where
Detected
U.S. Stations
Occupied (%)
No. MX Stations Where
Detected
MX Stations
Occupied (%)
Total Stations Where
Detected
Total Stations
Occupied (%)
Conserv-ation
Priority Index
Bushtit Psaltriparus minimus Sastrecillo 90 16 106 29 11.8 6 8.6 35 11.1 1 White-breasted Nuthatch Sitta carolinensis Sita de Pecho Blanco 443 49 492 188 76.7 32 45.7 220 69.8
Cactus Wren Campylorhynchus brunneicapillus Salltapared Barranqueao 4 2 6 4 1.6 3 4.3 7 2.2 2
Rock Wren Salpinctes obsoletus Saltapared Roquero 2 8 10 2 0.8 4 5.7 6 1.9 Canyon Wren θ Catherpes mexicanus Saltapared barranqueño 25 25 14 5.7 14 4.4 3 Bewick’s Wren Thryomanes bewickii Saltapared de Bewick 1557 190 1747 241 98.4 61 87.1 302 95.9 House Wren θ Troglodytes aedon * Saltapared Continental 1 1 2 i* i* i* Blue-gray Gnatcatcher θ Polioptila caerulea * Perlita Azul Gris 3 1 4 i* i* i* Northern Mockingbird Mimus polyglottos Cenzontle Norteño 215 137 352 119 48.6 56 80 175 55.6
Curve-billed Thrasher Toxostoma curvirostre Cuitlacoche de Pico Curvo 14 19 33 14 5.7 15 21.4 29 9.2 1
Crissal Thrasher θ Toxostoma crissale Cuitlacoche crisal 39 39 31 12.7 31 9.8 9 European Starling Sturnus vulgaris Estornino Europeo 4 1 5 1 0.4 1 1.4 2 0.6 Phainopepla Phainopepla nitens Capulinero Negro 186 76 262 75 30.6 23 32.9 98 31.1 6 Orange-crowned Warbler θ Vermivora celata * Chipe Oliváceo 1 1 i* i* 1 Lucy’s Warbler Vermivora luciae * Chipe de Rabadilla Rufa 440 130 570 182 74.3 54 77.1 236 74.9 9 Northern Parula θ Parula americana * Parula Norteña 1 1 2 1 0.4 1 1.4 2 0.6 Yellow Warbler θ Dendroica petechia * Chipe Amarillo 3102 245 3347 242 98.8 58 82.9 300 95.2 1 Palm Warbler θ Dendroica palmarum * Chipe Playero 1 1 i* i* American Redstart θ Setophaga ruticilla * Chipe flameante 1 1 1 0.4 1 0.3 1 Common Yellowthroat Geothlypis trichas * Mascarita Común 1053 68 1121 222 90.6 30 42.9 252 80 Wilson’s Warbler θ Wilsonia pusilla * Chipe de Corona Negra 6 4 10 6 2.4 4 5.7 10 3.2 Yellow-breasted Chat Icteria virens * Buscabrena 3036 120 3156 241 98.4 37 52.9 278 88.3 Summer Tanager Piranga rubra * Tangara Roja 984 120 1104 222 90.6 57 81.4 279 88.6 2
Western Tanager θ Piranga ludoviciana * Tangara de Capucha Roja 7 6 13 6 2.4 5 7.1 11 3.5
Canyon Towhee Pipilo fuscus * Rascador (Toqui) Pardo 23 15 38 16 6.5 10 14.3 26 8.3 5
Abert’s Towhee θ Pipilo aberti Rascador (Toqui) de Abert 989 63 1052 234 95.5 35 50 269 85.4 5
Rufous-winged Sparrow Aimophila carpalis * Zacatonero de Ala Rufa 1 8 9 1 0.4 7 10 8 2.5 9 Cassin’s Sparrow Aimophila cassinii * Zacatonero de Cassin 30 11 41 21 8.6 5 7.1 26 8.3 7 Botteri’s Sparrow Aimophila botterii * Zacatonero de Botteri 88 31 119 53 21.6 19 27.1 72 22.9 6
Rufous-crowned Sparrow Aimophila ruficeps * Zacatonero de Corona Rufa 1 23 24 1 0.4 15 21.4 16 5.1 2
74
74
English name (Bold=evidence of local breeding encountered, θ=Info in Appdx D)
Scientific Name (Neotropical Migrants by
USFWS (2007) noted with * )
Spanish name (Kauffmann and others 2005)
U.S. Birds
Detect-ed
Mexico Birds
Detect-ed
Total Detect-
ions
No. U.S. Stations Where
Detected
U.S. Stations
Occupied (%)
No. MX Stations Where
Detected
MX Stations
Occupied (%)
Total Stations Where
Detected
Total Stations
Occupied (%)
Conserv-ation
Priority Index
Lark Sparrow Chondestes grammacus * Gorrión Arlequin 1 14 15 1 0.4 11 15.7 12 3.8 1
Black-throated Sparrow Amphispiza bilineata Gorrión de Gargante negra 42 5 47 18 7.3 4 5.7 22 7 4
Grasshopper Sparrow θ Ammodramus savannarum * Gorrión Saltamontes 2 2 1 1.4 1 0.3 7
Song Sparrow Melospiza melodia Gorrión Cantor 1217 91 1308 206 84.1 35 50 241 76.5 Northern Cardinal Cardinalis cardinalis Cardinal Norteño 186 13 199 103 42 11 15.7 114 36.2 Pyrrhuloxia Cardinalis sinuatus Cardenal desértico 6 6 5 2 5 1.6 3
Rose-breasted Grosbeak θ Pheucticus ludovicianus *
Picogordo de pecho rosa 1 1 1 0.4 1 0.3 1
Black-headed Grosbeak Pheucticus melanocephalus * Picogordo Tigrillo 23 9 32 19 7.8 6 8.6 25 7.9
Blue Grosbeak Passerina caerulea * Picogordo Azul 382 102 484 175 71.4 53 75.7 228 72.4 Indigo Bunting θ Passerina cyanea * Colorín Azul 2 2 1 0.4 1 0.3 1 Varied Bunting Passerina versicolor * Colorín Morado 17 2 19 13 5.3 2 2.9 15 4.8 6 Red-winged Blackbird Agelaius phoeniceus * Tordo Sargento 119 18 137 33 13.5 9 12.9 42 13.3
Eastern Meadowlark Sturnella magna * Pradero Tortilla con Chile 4 26 30 3 1.2 16 22.9 19 6 4
Great-tailed Grackle θ Quiscalus mexicanus Zanate mexicano 2 2 1 0.4 1 0.3 Brown-headed Cowbird Molothrus ater * Vaquero de Cabeza Café 1022 111 1133 232 94.7 50 71.4 282 89.5 Hooded Oriole Icterus cucullatus * Bolsero Enmascarado 20 1 21 16 6.5 1 1.4 17 5.4 4 Bullocks Oriole Icterus bullockii * Bolsero de Bullock 177 62 239 110 44.9 42 60 152 48.3 Scott’s Oriole Icterus parisorum * Bolsero Tunero 4 3 7 4 1.6 3 4.3 7 2.2 6 House Finch Carpodacus mexicanus Pinzón Mexicano 1037 100 1137 228 93.1 47 67.1 275 87.3
Lesser Goldfinch Carduelis psaltria * Dominico de Dorso Oscuro 1802 114 1916 227 92.7 37 52.9 264 83.8
House Sparrow θ Passer domesticus Gorrión Doméstico 38 10 48 6 2.4 i* 6 1.9 TOTALS: Detections (includes incidental), and on stations only (d) and number stations possible (/) 32533 4187 36720
32475 (d)
/ 245 sta.
4041 (d)
/ 70 sta. 36516 (d) / 315 sta. 59 spp.
75
75
Appendix 2-A. Table of 59 species of conservation interest detected throughout study area along the San Pedro River and associated riparian areas in southeastern Arizona and northern Sonora, and designation under each of 17 lists intended to aid in the prioritization of species for conservation action. [Each list and/or ranking is from one of five separate (though often overlapping) national efforts on the part of government agencies and/or conservation organizations. See numbered notes below for citation and guide to each column’s corresponding list and codes used to designate different rankings]
English name (in Bold if evidence of local
breeding encountered)
Scientific Name (Neotropical Migrants by
USFWS (2007) noted with * )
AZ PIF Priority Score (≥20) 1
AZPIF Priority Spp (by Hab) 2
BBS % Drop 1966-2003 3
Comn. Spp % Drop 1967-2007 4
Aud Watch
List 2007 5
PIF Cont. Watch List 6
PIF S.west Stwd Spp 7
PIF Wet-land Spp 8
BCR 34
Reg Conc Spp 9
BCR 34
Cont Stwd Spp 10
BCR 34
Reg Stwd Spp 11
US FWS BCR 34 12
US FWS Reg 2
13
US FWS USA/ Nat 14
US FWS
ESA 15
Mex. BCR 34 SJV Reg
Conc Spp 16
Mex BCR 34
SJV Stwd Spp 17
Conserv-ation
Priority Initiatives Index 18
Scaled Quail Callipepla squamata YLLW 2 SW Y 4
Gambel’s Quail Callipepla gambelii SW ST Y Y 4
Montezuma Quail Cyrtonyx montezumae MPO YLLW 3 Y Y 5
White-tailed Kite Elanus leucurus 20 1 Cooper’s Hawk Accipiter cooperii * 21 Y 2 3 Gray Hawk Buteo nitidus 26 Y 1 1 3 5
Swainson’s Hawk Buteo swainsoni * 21 HG YLLW 2 WL Y 1 7
Zone-tailed Hawk Buteo albonotatus * 23 R 2 Peregrine Falcon Falco peregrinus * 21 1 1 1 DL DS 6
Least Tern Sternula antillarum * RED 1 1 LE, LT 4
Common Ground-Dove Columbina passerina 2 1 Yellow-billed Cuckoo Coccyzus americanus * 35 Rip. 1 1 1 C** 5 7 Barn Owl Tyto alba R,DS 1 Western Screech-Owl Megascops kennicottii Y 3 2 Common Poorwill Phalaenoptilus nuttallii * Y 3 2 Gila Woodpecker Melanerpes uropygialis 21 4 2 Northern Beardless-Tyrannulet Camptostoma imberbe * 23 1 1 3 4
Olive-sided Flycatcher Contopus cooperi * 23 MC,P 73.2 YLLW 2 WL 1 7
Willow Flycatcher (see Ap. A, D) Empidonax traillii * 38 Rip.
YLLW 2 WL LE ** 5 7
Dusky-capped Flycatcher Myiarchus tuberculifer * R 1 Ash-throated Flycatcher Myiarchus cinerascens * Y 1

76
English name (in Bold if evidence of local
breeding encountered)
Scientific Name (Neotropical Migrants by
USFWS (2007) noted with * )
AZ PIF Priority Score (≥20) 1
AZPIF Priority Spp (by Hab) 2
BBS % Drop 1966-2003 3
Comn. Spp % Drop 1967-2007 4
Aud Watch
List 2007 5
PIF Cont. Watch List 6
PIF S.west Stwd Spp 7
PIF Wet-land Spp 8
BCR 34
Reg Conc Spp 9
BCR 34
Cont Stwd Spp 10
BCR 34
Reg Stwd Spp 11
US FWS BCR 34 12
US FWS Reg 2
13
US FWS USA/ Nat 14
US FWS
ESA 15
Mex. BCR 34 SJV Reg
Conc Spp 16
Mex BCR 34
SJV Stwd Spp 17
Conserv-ation
Priority Initiatives Index 18
Brown-crested Flycatcher Myiarchus tyrannulus * 21 1 Tropical Kingbird Tyrannus melancholicus * 20 1 Cassins Kingbird Tyrannus vociferans * 21 Y Y 5 4 Loggerhead Shrike Lanius ludovicianus * 22 77.1 71 Y 1 1 3 7 Bell’s Vireo Vireo bellii * 25 RED 2 WL Y 1 1 1 8 Plumbeous Vireo Vireo plumbeus * 22 Y R 3 Hutton’s Vireo Vireo huttoni 23 1 Warbling Vireo Vireo gilvus * 3 1 Violet-green Swallow Tachycineta thalassina * R 1 Bridled Titmouse Baeolophus wollweberi 20 Y R,PO 3 Verdin Auriparus flaviceps 85.6 SW 2 Bushtit Psaltriparus minimus 2 1
Cactus Wren Campylorhynchus brunneicapillus SW Y 2
Canyon Wren Catherpes mexicanus 70 Y DS,R 3 Curve-billed Thrasher Toxostoma curvirostre SW 1 Crissal Thrasher Toxostoma crissale 20 SW ST Y Y 1 1 1 R 9 Phainopepla Phainopepla nitens SW ST Y Y Y 3 6 Orange-crowned Warbler Vermivora celata * 21 1
Lucy’s Warbler Vermivora luciae * 29 Rip. YLLW 3 SW WL Y Y Y 9
Yellow Warbler Dendroica petechia * 4 1 American Redstart Setophaga ruticilla * 25 1 Summer Tanager Piranga rubra * 22 4 2 Canyon Towhee Pipilo fuscus * SW Y Y Y 4 5
Abert’s Towhee Pipilo aberti 25 YLLW 3 SW WL 5
Rufous-winged Sparrow Aimophila carpalis * 28 DS,DG YLLW 3 SW Y 1 1 1 9
Cassin’s Sparrow Aimophila cassinii * 28 DG SW Y 1 1 3 7 Botteri’s Sparrow Aimophila botterii * 28 DG 1 1 2 5 Rufous-crowned Sparrow Aimophila ruficeps * 21 Y 5 3 Lark Sparrow Chondestes grammacus * 63 1 Black-throated Sparrow Amphispiza bilineata 79.6 63 SW Y DS, G 5 Grasshopper Sparrow Ammodramus savannarum * 28 DG,HG 77.1 65 1 1 5 7

77
English name (in Bold if evidence of local
breeding encountered)
Scientific Name (Neotropical Migrants by
USFWS (2007) noted with * )
AZ PIF Priority Score (≥20) 1
AZPIF Priority Spp (by Hab) 2
BBS % Drop 1966-2003 3
Comn. Spp % Drop 1967-2007 4
Aud Watch
List 2007 5
PIF Cont. Watch List 6
PIF S.west Stwd Spp 7
PIF Wet-land Spp 8
BCR 34
Reg Conc Spp 9
BCR 34
Cont Stwd Spp 10
BCR 34
Reg Stwd Spp 11
US FWS BCR 34 12
US FWS Reg 2
13
US FWS USA/ Nat 14
US FWS
ESA 15
Mex. BCR 34 SJV Reg
Conc Spp 16
Mex BCR 34
SJV Stwd Spp 17
Conserv-ation
Priority Initiatives Index 18
Pyrrhuloxia Cardinalis sinuatus 22 SW 3 3 Rose-breasted Grosbeak Pheucticus ludovicianus * 0 1 Indigo Bunting Passerina cyanea * 20 1
Varied Bunting Passerina versicolor * 22 YLLW 2 WL 1 1 6
Eastern Meadowlark Sturnella magna * 25 72 Y 5 4 Hooded Oriole Icterus cucullatus * 23 Y 1 R 4 Scott’s Oriole Icterus parisorum * 21 SW ST Y Y DS, G 6
TOTAL NUMBER of San Pedro Species on each list 36 10 7 5 11 10 15 11 14 6 18 10 13 11 4 23 12 59

78
1Arizona Partners in Flight (PIF), Potential Consideration for Priority Status (score of 20 or above).
2Arizona Partners in Flight, Priority Species (listed by habitat). Latta and others (1999) used 11 criteria developed by Arizona Partner’s in Flight (AZPIF) to prioritize bird species most in need of conservation efforts in the state. Species were ranked higher for relative low abundance compared to species sharing similar habitats throughout the entire range of that species, relative low abundance as compared to other Arizona species in similar habitats, narrow distribution overall or within Arizona, more or graver threats on the breeding grounds or wintering grounds (over the species range or within Arizona), and if a high proportion of a species’ breeding range is in Arizona (See appendix 2-A and Latta and others, 1999, for more details). This ranking did not use Breeding Bird Survey (BBS) data because of inadequate coverage in Arizona. Latta and others (1999) assessed Arizona’s 280 species of landbirds, of which 234 that breed in with high scores of 38 (Willow Flycatcher) to low scores of 8 (Common Raven). Initially, the authors decided to consider any species with a score of 20 or higher for consideration as a species of conservation concern (thus, we include the score for all species with a score of 20 or higher as one of our conservation prioritization efforts, column 1). For choosing the final list of Arizona’s PIF priority bird species, the authors assigned all birds as belonging to one of more than 20 habitat types. From the pool of species with scores of 20 or higher resulting from the initial quantitative assessment, they chose the highest scoring species’ found within a habitat type as one of Arizona’s top 43 conservation concern species (thus we included this as another effort, by denoting their habitat type in column 2).
3Breeding Bird Survey Percent Drop from 1966–2003, noted only if on Audubon Society’s list of “Sixteen species undergoing most severe population declines in North America” (Audubon.org, 2008a). This is the percentage of decline for continental populations, from an analysis of BBS route data from 1966 to 2003.
4Common Species percentDrop from 1967–2007, noted only if on Audubon Society’s list of “Common Birds in Decline: What's happening to birds we know and love?” (Audubon.org, 2008b). This is based on both Christmas Bird count and U.S. Geological Survey (USGS) breeding bird survey data.
5Audubon Watch List 2007, Audubon and the American Bird Conservancy used two categories to delineate level of concern. RED=Declining rapidly and/or small populations, and face major conservation threats (typically of global conservation concern), whereas yellow YLLW=declining or rare (national conservation concern). This list utilized similar criteria to Panjabi and others (2005), but included water-associated birds as well, and included species such as Least Tern, and endangered, federally listed species not included on other lists (Audubon.org and American Bird Conservancy, 2007).
6Partners in Flight Continental Watch List, from table 1 of the North American Landbird Conservation Plan: “Partners in Flight Species of Continental Importance for the U.S. and Canada," (table 1, p. 18–19) (Rich and others, 2004). Score=2 if a PIF “Continental Watch List” species that is moderately abundant or widespread but with declines or high threats (higher priority); 3=if a Watch List Species that has a restricted distribution or low population size (slightly lower priority). There were no species in our area with the highest priority (multiple causes for concern across entire range and sharp declines). “Continental Watch List Species are those which are most vulnerable at the continental scale, because of a combination of small and declining populations, limited distributions, and high threats throughout their ranges. Some of these species are already recognized as threatened or endangered at federal levels.” (Panjabi and others, 2005). The Watch List is “comprised of species that have multiple reasons for conservation concern across their entire ranges” (Rich and others, 2004).
7Partners in Flight Southwest Stewardship Species, from the North American Landbird Conservation Plan, table 1: “Partners in Flight Species of Continental Importance for the U.S. and Canada", (table 1, p. 20–21) (Rich and others, 2004). If species designated with “SW”=Southwest is of Global Importance to the species, or it is a "Stewardship Species" where the Southwest is listed as "Avifaunal Biome with Global Stewardship Responsibility."
8Partners in Flight Wetland-Associated Species, from Rich and others (2004), table C: “Species of Continental Importance associated with wetland habitats in all or part of their range.” If designated here with WL=it is a wetland associated species that is also on the PIF watch list; if designated with ST=it is a wetland associated species that is also a “Stewardship Species” in the Southwest.
9Bird Conservation Region 34 (Sierra Madre Occidental) Regional Concern Species. From North American Bird Conservation Initiative (NABCI) Committee (see North American Bird Conservation Initiative, 2008, for more information). Y=Species of Regional Concern in Bird Conservation Region 34 (BCR 34), based on Partners in Flight assessment efforts for landbirds (Partners in Flight, 2005 for data, Panjabi, 2005, for methodology).

79
10Bird Conservation Region 34 (Sierra Madre Occidental) Continental Stewardship Species. From North American Bird Conservation Initiative (NABCI) Committee (see North American Bird Conservation Initiative, 2008, for more information). Y=Species is a “Continental Stewardship Species” for Bird Conservation Region (BCR) 34, from Partners in Flight assessment efforts (Partners in Flight, 2005, for data; Panjabi, 2005, for methodology).
11Bird Conservation Region 34 (Sierra Madre Occidental) Regional Stewardship Species. From North American Bird Conservation Initiative (NABCI) Committee (see NABCI 2008 for more information). Y=Species is a “Regional Stewardship Species” for BCR 34, from Partners in Flight assessment efforts (Partners in Flight, 2005, for data, Panjabi, 2005, for methodology).
12U.S. Fish and Wildlife Service (USFWS) BCR 34. 1=Birds listed as a priority within BCR 34 for USFWS planning and consideration, from U.S. Fish and Wildlife Service (2002) (table 34, p. 57). Listed here if scoring as a high priority on assessment methodologies. See page 7–9, U.S. Fish and Wildlife Service (2002) for more details on inclusion on this and next two lists. U.S. Fish and Wildlife Service (2002) lists birds species of conservation concern at three different scales, this and the next two lists moving from smaller to larger scales. Inclusion in “Bird Conservation Region (BCR) 34—The Sierra Madre Occidental” is based on a species importance at the eco-regional scale, meaning a high proportion of population (or geographic distribution) of a species is concentrated within a region bearing similar topography and vegetation communities. “By concentrating on the importance of these populations to the persistence of a species as a whole and then assessing the threats to these eco-regional populations, the Bird Conservation Region approach directs conservation actions that maintain or enhance these populations” (North American Bird Conservation Initiative, 2007, see Panjabi and others, 2005 for details on the assessment methodology). U.S. Fish and Wildlife Service (2002) also lists birds of importance at the scale of USFWS regional administrative Units (for example, Region 2, “Southwest”) and birds that are important to consider as a national priority for the USFWS across the United States.
13U.S. Fish and Wildlife Service Region 2. 1=Birds as high priority for planning efforts for USFWS for Region 2 (Southwest administrative planning region for the agency). From USFWS (2002), table 42, p. 55–56.
14U.S. Fish and Wildlife Service National-level Watch List. 1=Birds on USFWS National Watch List, of high priority at the national level. From USFWS (2002), table 43, p. 73–74.
15U.S. Fish and Wildlife Service Endangered Species Act Relation of species to Endangered Species Act listings (United States), from USFWS (2008). DL=De-Listed, Cand=Candidate Species, LE=Listed Endangered, LT=Listed Threatened.
16Mexican Highlands Portion of BCR 34 Sonoran Joint Venture Regional Concern Species. If a Mexican Highlands (BCR 34 in Mexico) Regional Concern Species, then Relative Density score is given from Ciacedo and others (2006), table 11, "Species of Regional Concern in the Mexican Highlands." From Ciacedo and others (2006): “Scores reflect the "magnitude of stewardship responsibility" that the BCR 34 in Mexico shares for the maintenance of the species, with 5 being the highest (populations are concentrated in this region and are under high threat) and 2 meaning lower responsibility for the persistence of the species (for example, populations of this species are more spread out and not concentrated in this region, but still these regional populations are still important to the species as a whole). These are species that have a combination of moderately high vulnerability, high regional threats, and declining population trends. High scoring subspecies only were included in table 11 and thus in this column.
17Mexican Highlands Portion of BCR 34 Sonoran Joint Venture Stewardship Species. If a Mexican Highlands (BCR 34 in Mexico) Stewardship Species, then signature habitat is given from Ciacedo and others (2006), table 12: "Stewardship Responsibility Species for the Mexican Highlands". R=Riparian, DS=Desert Scrub, G=Grassland, PO=Pine Oak. “These are species for which the SJV has a "stewardship responsibility". They are species in which a large percentage of the population inhabits this Region during...either portion of their annual cycle. Concern level for them is not high at present, but it is the SJV's responsibility to ensure that they do not slip into the "concern" category. This usually means monitoring is an action and these species and their habitats need to be maintained and considered in long-term planning" (Ciacedo and others, 2006).
Black-bellied Whistling-Duck (Dendrocygna autumnalis): Several presumably breeding at Las Nutrias reservoir, Mexico. Two sightings at Los Fresnos (lower riparian area as well as reservoir).
Blue-winged Teal (Anas discors): Four seen in May 2007 at Las Nutrias.
Cinnamon Teal (Anas cyanoptera): One at Las Nutrias, June 2007.
80
Ruddy Duck (Oxyura jamaicensis): Mexican reservoirs May-July 2006 and 2007.
Pied-billed Grebe (Podilymbus podiceps): Several presumably breeding at Los Fresnos and Las Nutrias reservoirs, Mexico.
Eared Grebe (Podiceps nigricollis): Six late migrants at Las Nutrias, May 2007.
Western Grebe (Aechmophorus occidentalis): Four Las Nutrias, May 2007.
Yellow-crowned Night-Heron (Nyctanassa violacea): Presumably, the same individual was seen at nearly the same location on May 19 and again on June 20, 2007 along the upper San Pedro River, Ejido San Pedro, Sonora, 7 km south and up-river from the international border with the United States (12 R 577985 3460074). Each time the bird was seen by two observers (Glenn Johnson and Sergio Juarez, or Aaron Flesch and Sky Jacobs), and a few pictures were obtained during the first sighting when the bird perched in a cottonwood tree across the river (fig. 6). All viewing was within 30 to 100 m. The long legs were very noticeable, extending well beyond the tail when observed in flight and when perched as well. It's obvious cream-yellow crown, longish-crown-plumes, pale cheek and dark eyeline, as well as brownish body plumage with small white streaks, were all noted after it landed across the river in the cottonwood. This combination of characters indicates that the bird was a second year in alternate plumage (within the variation described in Birds of North America species account #161). While perched, its long legs, neck, and upright stance helped further confirm the species ID (versus a Black Crowned Night-heron). We obtained several pictures of varying quality using a digital camera and binoculars that, at the very least, confirm the stance and crown color of the bird.
By making this photo available to respected regional field ornithologists for scrutiny, our species identification was confirmed by several ornithologists in the region (Troy Corman, oral commun; Dave Stejskal, oral commun.).
White-faced Ibis (Plegadis chihi): Flock migrating north high in sky, May 2007.
Gray Hawk (Buteo nitidus): Common breeder in SPRNCA, at least eight territories on main stem south of border, 3–4 territories on Los Fresnos.
Swainson’s Hawk (Buteo swainsoni): Nesting on San Pedro Riparian National Conservation Area (SPRNCA, BLM) and one pair at Los Fresnos.
Zone-tailed Hawk (Buteo albonotatus): Rare in riparian sites in U.S., one possibly nesting south of Boquillas Ranch (SPRNCA) in May 2007.
Peregrine Falcon (Falco peregrinus): Adult and immature at Hereford, May 30, 2006.
American Coot (Fulica americana): Several presumably breeding at Los Fresnos and Las Nutrias reservoirs, Mexico.
Spotted Sandpiper (Actitis macularius): Infrequently seen in August throughout study area.
Wilson’s Phalarope (Phalaropus tricolor): Twelve observed for one day at Las Nutrias reservoir, May 2007.
Least Tern (Sternula antillarum): Two individuals observed over a half hour period by three observers on May 19, 2007. Viewed from north side of reservoir at Las Nutrias Ranch reservoir,
12 R 568430 3452278. One individual observed over a half hour period starting at 3 p.m., including several flights 30 m directly above the observer and many more within 100 m of the observers. The second individual joined the first, but was mostly seen from across the reservoir at approximate distances of 150–300 m. Observed the following distinguishing characters: very small size, fast and direct yet lilting/buoyant flight, dark leading edge and very faint dark tips to outer wing primaries, and especially the black crown and eye stripe with white forehead, yellow bill w/ black tip. Three observers: Glenn Johnson, Sergio Juarez, and Casey Fitzgerald.

81
In recent years there are regular reports of non-breeding Least Terns in May and early June from nearby southeastern Arizona, indicating that the species moves through the region during this time. For example, on May 20, 2005, June 6, 2006, and May 12, 2007, at least one Least Tern was present at Cochise Lake (Twin Lakes) in Wilcox, Arizona (see http://listserv.arizona.edu/cgi-bin/wa?A2=ind0505c&L=birdwest&P=1962; http://www.rarebirds.com/listing/2599/; http://www.huachuca-audubon.org/NAMC.php). Another individual was seen at this site on May 19, 2007, the same day as our observations to the south (Dave Beaudette, oral commun.). The Cochise Lake site is 123 km at a bearing of 20 degrees from the Las Nutrias site, and both sites could be regular stopover points in migration to breeding sites farther to the northeast in the Midwestern United States in the Mississippi drainage, or even to coastal California populations. Other sites where Least Tern has been seen nearby include nearby Benson sewage ponds (84 km north of Las Nutrias) on May 9, 2006, Rio Rico area south of Tucson (83 km, 300 degrees) on May 10, 2006, Hereford/Sierra Vista (31.5 km, 214 degrees) on May 11, 2006 (http://www.rarebirds.com/listing/2400/), and Gilbert Water Ranch south of Phoenix (292 km at 332 degrees) (http://www.azfo.org/gallery/lete_gilbert.html) on May 12, 2007.
Krueper (2000) lists the Least Tern as a casual to rare vagrant to southern Arizona from May to September, with five detections in the Upper San Pedro River valley in the Sierra Vista area.
Barn Owl (Tyto alba): Resident pair at Los Fresnos.
Western Screech-Owl (Megascops kennicottii): Commonly detected at night where trees present.
Great Horned Owl (Bubo virginianus): Commonly Detected at night.
Lesser Nighthawk (Chordeiles acutipennis): Uncommon at dusk and throughout night.
Common Nighthawk (Chordeiles minor): Uncommon at dusk, night, and in early morning.
Common Poorwill (Phalaenoptilus nuttallii): Commonly detected at night.
Vaux’s Swift (Chaetura vauxi): Rare migrant.
Olive-sided Flycatcher (Contopus cooperi): Late migrants observed in May at Boquillas (SPRNCA) and at Los Fresnos lower riparian area.
Willow Flycatcher (Empidonax traillii): Migrants uncommonly seen in late May and early June. One nest found in July 2005, the southern most documented attempt for all southwestern states except Texas, where several historical nesting attempts occurred at more southerly latitudes.
Dusky-capped Flycatcher (Myiarchus tuberculifer): Commonly detected in our study only in upper Los Fresnos in association with oak forests. Only two pairs noted in SPRNCA, one at Curtis Windmill and another just south of Green Kingfisher Pond (where appeared to be nesting in June–July 2007).
Tropical Kingbird (Tyrannus melancholicus) : Common only within 2 km of U.S. Highway 90.
Hutton’s Vireo (Vireo huttoni): One singing north of Charleston Bridge (SPRNCA), 2006. Otherwise, found commonly in oaks in upper portions of the watershed.
Warbling Vireo (Vireo gilvus): Singing in May, presumably migrants.
Horned Lark (Eremophila alpestris): Occasionally seen in grasslands between routes.
Canyon Wren (Catherpes mexicanus): Only detected in area from 1 km north of U.S. Highway 90 to 2 km north of Charleston Bridge.
House Wren (Troglodytes aedon): Two detected in late May, one 500 m. south of U.S. Highway 90, 2005, another at Los Fresnos, 2007.
Blue-gray Gnatcatcher (Polioptila caerulea): Occasionally wander to riparian area in late summer.

82
Crissal Thrasher (Toxostoma crissale): Detected numerous times in northern SPRNCA riparian areas only during 2005 season.
Orange-crowned Warbler (Vermivora celata): August migrant at Los Fresnos, late-wintering/migrating individuals seen on SPRNCA in May as well.
Northern Parula (Parula americana): Late (June 16) singing migrants, one in SPRNCA at Curtis Windmill in 2006, one at Los Fresnos 2007. Both detected by Glenn Johnson. On June 6, 2006, one individual was heard singing in the Curtis Windmill area of the SPRNCA in the U.S., although not seen. On May 18, 2007, one individual was heard singing and confirmed visually at Los Fresnos Nature Preserve, north of Cananea, Sonora, Mexico, and 7.5 km south of the international border with the United States, 12 R 557766 3458788. One singing male was detected singing, and then observed briefly, while conducting multi-species bird surveys on the ranch-preserve. The typical ascending, buzzy, “type A” song (for example, similar to Birds of North America Online, issue #215) was heard twice while conducting the survey, after which the bird was tracked for approximately 5 minutes and several brief yet good views were obtained. The bird was flying rapidly between gleaning from the outer tips of cottonwood (Populus freemontii) branches and briefly perching in yew-leaf willow (Salix taxifolia). It was not seen subsequently when several observers returned in the afternoon, or the next day, so it was assumed that the individual was a vagrant in migration.
Yellow Warbler (Dendroica petechia): Very common throughout all Cottonwood/Willow Riparian forests. Some survey stations had as many as six singing males for much of the breeding season. Although some of these could have been singing migrants, this was obviously one of the most abundant breeding birds throughout the study area.
Palm Warbler (Dendroica palmarum): One rare migrant seen by two observers, August 18, 2006, at Los Fresnos. Of the western race (Dendroica palmarum, s.s. palmarum) in migration at Los Fresnos Nature Preserve (north of Cananea, Sonora, Mexico, and 7.7 km south of the international border with the United States,12 R 558800 3459003). Christine Lamanna and Glenn Johnson observed the bird for several minutes from 30–40 m, foraging on the ground and perching on a corral fence post. Clearly seen were its yellow under tail coverts, russet-red crown, white supercillium, darkish streaking on breast and flanks. It also had a slight yellowish wash on the lower flanks, but not as yellow as the under tail coverts.
Although there are scattered winter records throughout Baja California and in Pacific lowlands of Mexico from Sonora south to Oaxaca and on offshore islands (Howell and Webb, 1995 as cited in Birds of North America on-line, issue # 238), this is the first record we know of from Sonora in August.
American Redstart (Setophaga ruticilla): One female south of Boquillas (SPRNCA), June 2006.
Wilson’s Warbler (Wilsonia pusilla): Migrants often seen through May and occasionally in June.
Western Tanager (Piranga ludoviciana): Late migrants in May, early migrants in July–August.
Abert’s Towhee (Pipilo aberti): Common breeder throughout SPRNCA, and to a lesser extent along main stem San Pedro in Mexico just south of border. Only a few pairs, though, at Los Fresnos throughout riparian sections there. One individual appeared to be paired with a Canyon Towhee at Los Fresnos (A. Flesch, oral commun..
Grasshopper Sparrow (Ammodramus savannarum): Breeding at Los Fresnos, common in grasslands there in late summer.
Rose-breasted Grosbeak (Pheucticus ludovicianus): One male detected, Hereford, May 2005.
Indigo Bunting (Passerina cyanea): Probable breeding pair 500 m south of Gas line Bridge, St. David, 2007.
Great-tailed Grackle (Quiscalus mexicanus): Rare visitor to riparian area.
House Sparrow (Passer domesticus): Several breeding at ranch house at Los Fresnos.

83
Chapter 3. Southwestern Willow Flycatcher Nest Records and Potential for Future Breeding along the Upper San Pedro River, Arizona Abstract
We reviewed Southwestern Willow Flycatcher (Empidonax traillii extimus) nest records and investigated the potential for future breeding along the upper San Pedro River in southeastern Arizona, where in July 2005, we encountered the southernmost verifiable nest attempt for the species. We confirmed evidence of 20 other nests from the area, the majority (n=17) of which are historical records. Application of spatially explicit habitat models classified the riparian vegetation distributed along 64.12 river km north of the United States-Mexico international border, and identified 7.7 percent (4.9 km) of the reach as having a greater than 80 percent likelihood of supporting nesting pairs of E. t.extimus. The active nest we found in 2005 was within the largest (a 910 m-reach) of several high-probability habitat patches identified by the model, and environmental measurements were similar to nest-site characteristics reported regionally. Continued conservation and management of the area’s riparian vegetation and surface water has potential to contribute additional breeding sites for this endangered subspecies. Given the nest record along the upper San Pedro River and the presence of high-density breeding sites to the north, the native cottonwood-willow forests of the upper San Pedro River could become increasingly important to E. t. extimus recovery, especially considering the anticipated effect of the tamarisk leaf beetle (Diorhabda carinulata) north of the region.
Introduction Conservation and recovery of endangered species necessitates data on current and historical
distribution along with habitat use so that specific sites with high potential to support populations can be identified and managed. Although the exact historical distribution of Southwestern Willow Flycatchers (Empidonax traillii extimus) is poorly known, habitat losses and other factors led to declines across their range in the Southwestern United States in the 20th century (Phillips and others, 1964; Hunter and others, 1987; Unitt, 1987) resulting in a listing as federally endangered by the U.S. Fish and Wildlife Service (1995). Southwestern Willow Flycatchers breed in dense riparian vegetation near surface water, often in forest environments comprised of native willow (Salix sp.) and Fremont cottonwood (Populus fremontii), and also in dense thickets of exotic salt cedar (Tamarix spp.) (Sogge and others, 1997; Sedgwick, 2000; Durst and others, 2007). Currently, E.t. extimus breed locally in widely scattered locations in six States where they are threatened by nest predation, nest-parasitism by Brown-headed Cowbirds (Molothrus ater), water diversion, and loss of riparian vegetation, which is already naturally limited in spatial extent throughout the arid, southwestern United States (U.S. Fish and Wildlife Service, 2002, 2005).
After encountering a nesting pair of E.t. extimus in 2005 along the upper San Pedro River within the Bureau of Land Management-administered San Pedro Riparian National Conservation Area (SPRNCA) in the vicinity of Hereford, Arizona (reported in Engineering and Environmental Consultants, Inc., 2005; English and others, 2006; Ellis and others, 2008; and see appendix 3-A for details), we investigated the known nesting records and current habitat conditions in the area. Although unspecific reports of historical nesting at Charleston on the upper San Pedro River are mentioned by several authors (Phillips, 1948; Phillips and others, 1964; Krueper, 1999; Pardzick and Woodward, 2003), and surveys are conducted along several kilometers of the upper river corridor as recommended and reported in annual survey and recovery efforts (U.S. Fish and Wildlife Service, 2002; Ellis and others, 2008), no one has reviewed the nesting records there or compared these with other records along the southern extent of summer E.t. extimus breeding distribution. Whereas the lower (northern) portion of the San Pedro River, near its confluence with the Gila River, is well-known as an important complex of E.t. extimus breeding sites, the upper (southern) portion of the watershed is viewed in diverse ways: as an E.t. extimus migration

84
corridor only, as containing only historical-but-not-extant breeding habitat, or conversely as containing high-value, suitable breeding habitat (Krueper, 1999; U.S. Fish and Wildlife Service, 2002, 2005; Pardzick and Woodward, 2003; Sogge and others, 2003; Steinitz and others, 2005; Durst and others, 2007; Ellis and others, 2008;).
Correctly assessing the historical and current value of the habitat along the upper San Pedro is important, because it is likely that current resource management decisions throughout the upper San Pedro River Basin could potentially affect habitat that might exist along the upper river. For example, groundwater pumping of the aquifer-source of the upper river threatens to reduce surface water and vegetation cover that E.t. extimus and other riparian birds utilize (Stromberg and Tiller, 1996; Dougherty, 2007; Webb and others, 2007; Brand and others, 2010; Davis, 2013). Also, the recent (1999–2001) reintroduction of beaver (Castor canadensis) could be viewed as either a threat or a potential benefit to E. t. extimus breeding habitat (U.S. Fish and Wildlife Service, 1998 p. 30; Finch and others, 2000; U.S. Fish and Wildlife Service, 2002, p. 117; Longcore and others, 2007). Our objectives in this paper are to explore recovery potential for E.t. extimus in the upper San Pedro River through (1) a review of the historical and contemporary nesting record from the upper San Pedro River and nearby areas, (2) a comparison of the 2005 Hereford nest site with regionally reported nest site characteristics, and (3) a comparison of the environmental characteristics at the 2005 nest site with nearby sites along the upper San Pedro River, including application of a spatially explicit geographic information systems (GIS) model which successfully predicted E.t. extimus breeding sites elsewhere.
Methods
Historical and Contemporary Breeding Records We scanned regional bird distribution accounts, conducted literature searches using ISI/Web of
Science and the Searchable Ornithological Research Archive (SORA; http://elibrary.unm.edu/sora/) hosted by the University of New Mexico, and initially accessed many of the museum records on March 31, 2009, through two online holdings databases, the Ornithology Information System (ORNIS; http://olla.berkeley.edu/ornisnet/) and the Global Biodiversity Information Facility (GBIF; http://www.gbif.org/). We augmented this initial search by looking through individual institution’s specimen holdings as found on-line, by contacting collections and curatorial staff, and by attempting to match literature-reported observations with catalogued specimen(s) or field notes. We considered a record as “confirmed breeding” when we found egg sets and/or nests housed in museum collections, specimen skins with associated notes that unequivocally indicated the specimen was nesting and/or clearly described nesting events reported directly by the observer, where corroborating details, such as date, number of eggs, behaviors, etc., were included.
Upper San Pedro River 2005 Nest–Site Characteristics Compared to Regional Measurements After the 2005 breeding attempt was over, we measured that nest-site’s characteristics using a
standardized protocol (Rourke and others, 1999) to compare with other reported nest-sites in the region. We measured nest height above ground, nest-tree height and diameter at breast height (DBH), nest-stem diameter and branching, and nearest horizontal distance to foliage/canopy opening and surface water. We also estimated the percent canopy cover within 5 m of the nest in three height strata (<4.5, 4.5–7.5, and >7.5 m). Several general habitat features were documented within 50 m of the 2005 nest, including tree species and height range, proximity to beaver activity, and late-summer persistence of surface water, to compare with other nesting sites throughout breeding range of extimus (Sogge and Marshall, 2000; Sogge and others, 2003).

85
Environmental Conditions Along the Upper San Pedro River
2005 Nest Site Compared to Local Survey Stations We compared the 2005 nest site with nearby riparian sites along 68.5 km of the upper San Pedro
River, using environmental data from a separate study (Johnson, 2011) within the San Pedro Riparian National Conservation Area (SPRNCA). We compared vegetation and surface water persistence at a point-count survey station 2 m from the nest site with 239 other survey stations uniformly distributed at approximately 275 m intervals within the SPRNCA, from the southernmost point located less than 3 km north of the international border to the northernmost point near St. David, Arizona. We screened over 20 measured variables, using descriptions of E.t. extimus breeding habitat from the literature to identify characteristics of the nest site, which might help to explain why E.t. extimus had settled there. These variables included total width of riparian vegetation perpendicular to the river, percent cover of each woody species within nine canopy-height strata (0–1, 1–3, 3–5, 5–7, 7–10, 10–15, 15–20, 20–25, >25 m), and a count of all plants/stems and their mean DBH all of which were measured within 30 m of the station centers. The nest was located 2 m from the center point of the avian survey station, so the 30 m measurements at that site were within 28–32 m of the nest.
2005 Nest Site Compared to Local Application of Geographic Information Systems Model
We applied a spatially explicit GIS model originally designed to predict E.t. extimus breeding habitat in Arizona using vegetation data from remotely sensed Landsat Thematic Mapper imagery and landscape features from a Digital Elevation Model (Hatten and Paradzick, 2003). The model assigns riparian vegetation to one of five probability classes based on floodplain width and the metric Normalized Difference Vegetation Index, which is calculated from the reflectance values of the vegetation at a 30 m resolution. Although originally developed in central Arizona at the confluence of San Pedro and Gila Rivers and another site at Lake Roosevelt, this model has also successfully predicted the presence of E.t. extimus breeding territories in riparian vegetation at many sites across the subspecies’ range (Hatten and Paradzick, 2003; Dockens and others, 2004; Hatten and Sogge, 2007).
Results
Historical and Contemporary Breeding Records In addition to the nest encountered in 2005 at Hereford, we found 20 other nest records along the
upper San Pedro River (table 1), with a total of 4 contemporary and 17 historical (that is, pre-1920) records. We did not find verifiable evidence of any known breeding populations or single nesting attempts south in latitude from the upper San Pedro area, and apparently the upper San Pedro represents the southern extent of confirmed nesting for E.t. extimus and the breeding attempt we reported in 2005 is the southernmost verifiable nest record. Currently, the southernmost locations where E.t. extimus are consistently found breeding are 85–150 km to the north, along the middle and lower San Pedro, near the confluence with the Gila River (Durst and others, 2007; Ellis and others, 2008).
Historical Nest Records The earliest record of breeding for the upper San Pedro is from an 1887 egg set collected at
unspecified location on Fort Huachuca by Lieutenant H.C. Benson (table 1), which contemporary U.S. Army workers believe may actually have been collected on the upper San Pedro River and not the Fort proper (Sheridan Stone, oral commun.). Swarth (1904) reported the species (“E. trailli”) as “a fairly common summer resident in suitable spots along the San Pedro River.” Although Swarth did not publish any more specific accounts of nesting sites or occurrences, it is obvious from his introductory chapter that

86
his references to the San Pedro River were intended for the upper portion of the watershed where they conducted “considerable work along the valley of the San Pedro, but a few miles distant” from his main study area of the Huachuca Mountains. In June 1896, two partners in a scientific expedition Swarth was leading, O.W. Howard and W.B. Judson, each collected an adult female E.t. extimus during a couple days spent on the upper San Pedro River at Charleston (table 1), and in addition to egg sets of several other species, “They also took (egg) sets of Traill’s Flycatcher, and Yellow Warbler with Cowbird eggs” (see Swarth, 1896). In later work, Swarth again indicated the species (“E. trailli trailli”) as breeding along the river, and stated again that the early work from him and others was along the upper river adjacent to the Huachuca Mountains (Swarth, 1914), not along the lower San Pedro as cited elsewhere (that is, U.S. Fish and Wildlife Service, 2005). The majority of historical E. traillii nest documentation on the upper San Pedro occurred at or near Fairbank (32.6 km north of the 2005 nest site) by Fred C. Willard (table 1), who lived in nearby Tombstone and visited Fairbank to collect eggs and nests of different species. Thus far, Willard (1912) represents the only historical nest account from the upper San Pedro River directly noted in the primary literature, where he related finding two nests at Fairbank, Arizona (one egg set of these is currently at SBNHM, table 1). Unitt (1987) used another nest from this site to determine nest measurements for the subspecies, but the collector or other details were not available (Phillip Unitt, oral commun.).
Contemporary Nest Records Although E.t. extimus are regularly detected in migration along the upper San Pedro and singing
males can persist in an area for a few days to 1 week or more (Krueper ,1999; U.S. Fish and Wildlife Service, 2002; Engineering and Environmental Consultants, Inc., only three contemporary nests were documented in the area prior to the 2005 nest (table 1). The last documented successful nest along the upper/southern portion of the San Pedro River was at Lewis Springs near U.S. Highway 90in 1977 (12 km north from the 2005 nest site), near where another pair built two nests in 1997 that failed because of predation and Brown-headed Cowbird nest parasitism (Doug Danforth, oral commun.; Krueper, 1999; Paradzick and Woodward, 2003). The reach of river containing the 2005 nest site had been regularly surveyed for Southwestern Willow Flycatchers during several preceding years, although 2005 was the only time breeding activity had been documented (English and others, 2006). Other detections of individual birds include several near St. David in 1996, three singing males near U.S. Highway 90 in 1997 (near the nesting pair), one near Green Kingfisher Pond and another at the Hereford Bridge in 1998, two at Green Kingfisher Pond in 1999, and at least 19 more “prospecting” singing males since 2001, all within the San Pedro Riparian Conservation Area in the upper river corridor (Krueper, 1999; U.S. Fish and Wildlife Service, 2002).
Upper San Pedro 2005 Nest-Site Characteristics Compared to Regional Measurements The 2005 nest near Hereford was 5.4 m above ground in an 11.5 m tall Goodding’s willow (Salix
gooddingii), with a 26.5 cm dbh main trunk, from which several smaller stems (10–18 cm diameter) arose at about 1.5–2 m above the ground. The nest was located along one of these stems, where a small branch (approximately 0.75 cm diameter) forked and split into three smaller, upright stems and was composed of small twigs, grass, spider webbing, and other unidentified materials that appeared typical of other extimus nests in the region. The nest was 3.65 m from the nearest foliage edge/canopy opening and 4.35 m from the river’s edge, although late-summer floods at the end of the nest attempt resulted in flowing water directly below the nest approximately 1 m deep and extending 25 m inland past the initial river’s edge. We estimated percent canopy cover within a 5 m radius was 45 percent in the understory (under 4.5 m) and 70 percent in the two upper canopy layers (4.5–7.5 m, and >7.5 m). Nest and canopy height, stem diameter, and distance from water were all well within the reported ranges reported from Arizona (Paradzick and Woodward, 2003; Smith and others, 2003; Corman and Wise-Gervais, 2005).

87
General habitat features around the nest were similar to those identified in the E.t. extimus ecological literature (for example, Sogge and others, 1997;), including tall Goodding’s willow (8–14 m) and Frémont cottonwood (≤24 m) within 50 m, nearby dense stands of seep willow, and close proximity to open water. Surface water was present and flowing at the site through the arid summer (that is, to the late-July monsoon-season), although it was a particularly dry year and most (64 percent) of the SPRNCA contained no surface water by late June (The Nature Conservancy, 2007). A small beaver dam (0.2 m high) constructed 35 m upstream was initiated 2 weeks before nest commencement, and a larger beaver dam (0.8 m high) was present all summer 495 m down-river, and had caused water to pond within 120 m of the nest.
Environmental Conditions Along Upper San Pedro
2005 Nest Site Compared to Local Survey Stations Compared to the mean values from the 239 other sampling stations along the upper San Pedro
River, values measured at the nest site were significantly greater (p<0.001, one-sample, one-sided t-tests) with respect to the following variables: Goodding’s willow percent cover at the 3–5m and 5–7m canopy layers (T239=-30.7 and T239=-24.4, respectively), total number of Goodding’s willow stems (T239=-78.6), total number of seep willow stems (T239=-167.7), and total number of all woody plant stems (T239=-48.4) (table 2). The width of the cottonwood-willow riparian vegetation as measured perpendicular to the river on both sides at the nest site was not greatly different (P>0.05) from the mean measurements taken from the other sites within the SPRNCA.
2005 Nest Site Compared to Local Application of Geographic Information Systems Model
Application of the spatially explicit, GIS-based E.t. extimus-breeding site prediction model to our study area revealed that 11 (4.5 percent) of our 240 uniformly distributed point count stations in the upper San Pedro fell directly into an area of the highest probability class, defined as 80–100 percent probability of a supporting E.t. extimus nesting, and 35 (14.5 percent) stations fell within 180 m of an area of this highest probability. The nest site was located within the largest and most contiguous patch (approximately 6.6 ha, 970 m in length along river) of the 80–100 percent probability class that was identified. Overall, the model was applied to 64.2 km of the upper San Pedro river corridor within the SPRNCA, and showed high-probability breeding sites along 4.8 km (7.7 percent) of this upper reach, as distributed in 15 patches and averaging 331.6 m in length (range: 90–970) along the upper river (McFarland and others 2012).
Discussion Except for references to unspecified “historical nesting” at Charleston (Phillips, 1948; Phillips and
others, 1964), the verifiable E.t. extimus nesting records from the upper San Pedro River have not received much attention by contemporary authors, including in recovery planning documents (U.S. Fish and Wildlife Service, 2002, 2005). The southernmost consistently active, current San Pedro River nesting sites for the subspecies are located along the middle and lower reaches, 85–185 km north of the 2005 Hereford nest site. The southernmost of these (“Three Links”) was established in 2004, and to our knowledge has been occupied consistently since that time (based on Ellis and others, 2008). The three most abundant currently active E.t. extimus breeding sites are 150 km or more north and northeast of the Hereford nest site, in Arizona near the confluence of the lower San Pedro and middle Gila Rivers and at Lake Roosevelt, and in New Mexico along the upper Gila River (Durst and others, 2007).

88
We are not suggesting a viable breeding population in the upper San Pedro River that has gone undetected, as there are many keen observers in the area, including numerous bird watchers as well as regular E.t. extimus survey attempts on approximately 12 km of river each year. In extensive efforts conducting multiple species surveys from 2005 to 2008 along most of the length of river from St. David, Arizona to 12 km south of the Arizona-Sonora border, we encountered just the one nest in 2005 and scattered individuals that were either migrants or had temporarily occupied sites (Johnson and van Riper, 2008), and other workers in the area also documented the species only intermittently (Krueper, 1999). There is, however, substantial evidence that E.t. extimus once bred consistently in the upper San Pedro Valley, and that individuals still migrate through, continue to regularly investigate, and indeed sometimes breed along the upper reaches of the river. The consistent frequency of detections, singing males, and occasional breeding attempts combined with detections in nearby drainages (including a nest in 2001 at Cienega Creek, Arizona; Ellis and others, 2008) and newly occupied breeding sites as close as 85 km north (“Three Links South”), all suggest the possibility that the subspecies may re-establish breeding sites in the upper portion of the San Pedro.
The 2005 nest site was typical as compared to others regionally reported for E. t. extimus, and application of the GIS habitat-prediction model to a 64 km reach of upper San Pedro, comprising most of the SPRNCA, showed that nearly 8 percent of the reach appeared to contain suitable breeding habitat. The nest site’s relatively high percent cover of willow at the canopy height layers typical for E.t. extimus nests (3–7 m), combined with a high number of stems, but with a relatively low mean dbh (table 2), all indicate that this site is within the top percentiles of “suitable” sites we sampled along the upper San Pedro River, in terms of shrub-cover and density of woody plant stems. Thus, although suitable breeding sites on the upper San Pedro River do not appear to be consistently located throughout the predominantly native, cottonwood-willow habitat of the upper river corridor (contrary to assumptions in Steinitz and others, 2005), there are at least some suitable sites present along portions of the upper river reach.
Threats in other parts of the breeding range of E.t. extimus indicate that the native riparian vegetation and un-altered hydrology of the San Pedro River may become an important refugia habitat for future immigrants. The recent release of the tamarisk leaf beetle (Diorhabda carinulata), in an attempt at bio-control of the exotic and invasive salt cedar (Tamarix spp.), could, within a few years, reduce the suitability of many E.t. extimus breeding sites along the lower Colorado where salt cedar is an important habitat component (Sogge and others, 2008, 2013). The tamarisk leaf beetle is expected to continue to colonize new areas and become established along the middle and lower Colorado River in the next several years, and the warmer temperatures found farther south may in fact encourage the spread of the beetle, depending on the genetics and adaptation of the beetles (Tracy and Robbins, 2009). The majority of E.t. extimus nests in Arizona occur in tamarisk (for example, 63 percent in 2002; Smith and others, 2003), and at sites with drastically altered hydrology (which facilitates tamarisk establishment). In contrast, the upper San Pedro is dominated by native cottonwood and willow vegetation and is free-flowing (Webb and others, 2007; Stromberg and others, 2010) and therefore is not as susceptible to threats from the tamarisk leaf beetle (for example, Colorado River sites) or inundation (for example, Roosevelt Lake) like many sites in other parts of the breeding range.
The presence of beaver, especially the water impoundments and changes to vegetation created by dams that can persist long after abandonment, are associated with E.t. extimus presence in numerous locations throughout the subspecies’ range (Sogge and Marshall, 2000; Ellis and others, 2008). Beaver were common on the San Pedro well over a century ago (Webb and others, 2007), and a reintroduction program in 1999–2001 resulted in several consistently active beaver dams near the 2005 nest site (5 dams within 12 km in that year; Johnson, 2011). The two dams constructed in 2005 near the nest represent the first time, since at least the early 20th century, that beaver regularly utilized sites within 1 km of the Hereford nest site (M. Fredlake, Bureau of Land Management, unpub. data, 1999). Finch and others (2000) note that beaver reintroduction efforts should be monitored closely wherever breeding Willow

89
Flycatchers have been found, to determine whether beaver activities are beneficial to E.t. extimus populations or are detrimental (that is, decrease habitat through removal of willow trees). The decision of land managers to remove beaver from a site in California with endangered Willow Flycatchers and Least Bell’s Vireo (Vireo bellii subspecies pusillus) was strongly critiqued by Longcore and others (2007), who argued that the available data on the subject was more in support of leaving rather than removing beaver. Following beaver establishment along the lower San Pedro from 2002–2007, Ellis and others (2008) reported newly established E.t. extimus breeding sites, as well as increases in number of breeding territories at several existing breeding sites, in several locations where beavers had recently settled (these beaver were not emigrants from the reintroduction effort on the upper San Pedro, which were radio-tagged and monitored, but were suspected immigrants from the Gila River, as they were not radio-tagged; M. Fredlake, Bureau of Land Management, oral commun.).
Beaver were historically quite abundant on the entire San Pedro (James Ohio Pattie named it “Beaver River” in 1825; Webb and others, 2007), and their extirpation from the area in the late 19th century coincided generally with a region-wide episode of channel entrenchment and down-cutting that resulted in riparian vegetation communities changing from marshy, cienega-like conditions to more coverage of cottonwood stringer and gallery forests present today (Webb and others, 2007). Although it is interesting that most of the breeding E.t. extimus records we found from the area were from the late 19th century to the mid-1910s—that is, when beaver were present and just after being trapped out of the system—this period also coincided with the popular avocation of oology (Barrow, 2000), and we did not find ornithological efforts to document nesting in the area from the late 1910s to the early 1980s. So, while we cannot confidently infer that the extirpation of the beaver from the upper San Pedro precipitated the changing vegetation and subsequent extirpation of E.t. extimus, it is important to at least note that the two species coexisted previously in the locally beaver-modified environment.
Conclusions and Management Implications Although perhaps of little practical significance, the nest found in 2005 along the upper San Pedro
was just south of historically occupied breeding habitat, and apparently is the southernmost confirmable breeding attempt ever recorded that is attributable to the E.t. extimus subspecies, or even the species E. traillii. This and other contemporary records from the upper and middle San Pedro are the only recently documented instances of breeding along the southernmost extent of historical E.t. extimus distribution, whereas E.t. extimus is apparently still extirpated at all other historical, southern breeding locations. While the “southernmost” aspects of the confirmed historical and contemporary breeding in the area may mainly be of interest to those studying bird distribution, range margins, etc., local land managers and regional biologists should be aware of the relatively strong historical record and persistence of occasionally occupied, potentially suitable habitat along the upper San Pedro.
Contemporary recovery and planning documents (for example, U.S. Fish and Wildlife Service, 2002, p. 8, 31–32) promote the idea that earlier researchers (Willard, 1912; Swarth, 1914) documented nesting along the lower San Pedro where E.t. extimus currently nest, but the early ornithologists invoked actually worked on the upper portion of the river, and that is where the authors’ only records occurred (table 1), at least to our knowledge. Recently, the lower 126.2 km of the San Pedro River was designated as critical habitat (U.S. Fish and Wildlife Service, 2013) because of the important breeding sites closer to the confluence with the Gila River. The upper 120 km of river north of the international border was originally considered (U.S. Fish and Wildlife Service, 1997), and later the area was recommended for surveys and potential recovery (U.S. Fish and Wildlife Service, 1998, 2002), but this upper reach was eventually removed from explicit evaluation in final determinations of critical habitat (U.S. Fish and Wildlife Service, 2005, 2013). Perhaps the assumption that the historically documented breeding population was in the lower portion of the river corridor led to the upper San Pedro (where the historical nesting actually was documented) being excluded from consideration. Although eventually granted an
90
exclusion under section 4(b)(2) of the Endangered Species Act because of pro-active, multi-species management agreements in the area, the lowest reach of the Colorado River in the U.S. was explicitly evaluated for critical habitat designation (U.S. Fish and Wildlife Service, 2005, 2013) because of historical occupancy and contemporary records. This area is similar to the upper San Pedro, in that E.t. extimus has been mostly extirpated as a breeder, but currently individual birds migrate through or temporarily establish territories there. Future studies, recovery documents, and other planning efforts related to the upper San Pedro should endeavor to incorporate ours or other accurate assessments of the historical record and current extent of suitable habitat, in order to assess recovery potential in the area or investigate how changes in depth to groundwater and surface water may affect current and/or potential future habitat in the area (for example, Steinitz and others, 2005).
The importance of the upper San Pedro as a potential recovery area for E.t. extimus is indicated by consistent breeding attempts, both historically and more recent (if intermittent) events such as the 2005 nest we encountered, as well as environmental factors. Even though the 2005 nest did not produce young, the environmental characteristics of the site generally matched those at sites regionally reported as hosting successful nesting, and the existence of potentially suitable E.t. extimus breeding habitat on the upper San Pedro was further indicated by results of the GIS model application and our other analyses of site conditions along the upper San Pedro River.
Continued survey and management efforts on the upper San Pedro are also warranted given the presence of an established, consistent breeding population from 81 to 182 km to the north-northwest at scattered sites along the same river and north of its confluence with the Gila, all of which are a likely source of immigrants because the populations probably migrate through the upper San Pedro. Although ours and other multi-species efforts in the upper San Pedro River (Krueper and others, 2003; Brand and others, 2008), and those of other biologists focused on E.t. extimus, do not indicate any substantial or consistent breeding population in the upper San Pedro River, it appears that individuals are regularly prospecting the area and are at least occasionally attempting to breed. Similar to state wildlife biologists considering potential E.t. extimus recovery in the region (Ellis and others, 2008), we recommend continued or even increased annual survey efforts in the SPRNCA and other areas south of the consistently occupied breeding sites to the north. Also, biologists should work with cooperators south of the border in Sonora where suitable habitat may exist in the portions of the upper San Pedro watershed (for example, especially the western inlet to Las Nutrias Reservoir).
Even if only small groups of flycatchers eventually become established in the upper San Pedro River, these could contribute to recovery efforts, as most of the known E.t. extimus breeding sites contain five or fewer territories (Durst and others, 2007). In fact, encouragement of widely distributed, small populations can minimize the risk of simultaneous catastrophic loss and genetic isolation of populations at more abundant sites (U.S. Fish and Wildlife Service, 2002). Busch and others (2000) noted that small, well-distributed populations of E.t. extimus would not be genetically isolated, and would in fact act as a meta-population, especially for groups distributed along drainages and connected by riparian vegetation.
The recently introduced beaver (Castor canadensis) population could have positive and/or negative effects on E.t. extimus habitat. Specifically along the upper San Pedro River, the BLM and other cooperators can sustain a program to monitor the effects of the reintroduced beaver populations in Arizona and adjacent areas where it has become recently established in Sonora, particularly in areas with high willow cover or otherwise classified by GIS modeling efforts as being the highest probability E.t. extimus breeding habitat. It is also important that monitoring occur in any areas where beavers settle, even if not previously identified as high probability E.t. extimus breeding sites, because beaver activity has the potential to create favorable conditions for breeding E.t. extimus and other riparian bird species. Although it may be the case that E.t. extimus and beaver both just share a similar preference for sites with high willow cover (which could explain the association between the two and could actually result in loss of potential E.t. extimus habitat), it is also possible that the reintroduction of beaver may encourage E.t.

91
extimus recovery in the upper San Pedro River area by facilitating early-succession riparian vegetation (through removal of overstory canopy), increasing surface water, and availability of groundwater needed for the establishment, growth, and survival of riparian vegetation.
Given historical use and indications of current suitable habitat in the upper and lower reaches of the San Pedro River, and regional and local threats to E.t. extimus populations and habitats, we recommend expanded E.t. extimus survey efforts and intentional management of the upper San Pedro River riparian vegetation as potential breeding habitat. Much of the upper reach is protected in the SPRNCA and managed for natural hydrological flow and vegetation dynamics conducive to E. t. extimus habitat creation and maintenance. However, additional considerations such as beaver activity, groundwater depletion, and overgrazing by livestock, in areas where not currently excluded, warrant careful monitoring and intentional management decisions, as they may negatively impact riparian characteristics conducive to extimus breeding. Consideration of these issues along with expanded E.t. extimus surveys and monitoring in all appropriate areas will thus provide a tangible opportunity for recovery of the Southwestern Willow Flycatcher at the southernmost portion of its known breeding range.
Acknowledgments We would like to thank the following staff and institutions for verifying on-line specimen data,
responding to requests to search for records, or otherwise providing invaluable assistance that made this project possible: James Dean, U.S. National Museum of Natural History (Smithsonian); Mike Westberg, Bell Museum of Natural History at University of Minnesota; Moe Flannery and Danielle Castronovo, California Academy of Sciences; Krista A. Fahy, Santa Barbara Museum of Natural History; Gregory J. Watkins-Colwell and Susan Hochgraf, Yale Peabody Museum of Natural History; Philip Unitt, San Diego Natural History Museum; Jean Woods, Delaware Museum of Natural History; Dave Willard, Field Museum of Natural History; Thomas Erdman, Richter Museum of Natural History, University of Wisconsin-Green Bay; and René Corado, Western Foundation of Vertebrate Zoology. Eben Paxton, Mark Stevenson, Doug Danforth, Sheridan Stone, and Dave Brown all took time to provide valuable information. Jennifer Arnold, Aaron Flesch, Eben Paxton, and Dave Krueper provided helpful comments on early drafts. Brian Bielfelt, Sonya Smith, Morgan Jackson, Christine Lamanna, Josh Brown, and Jessica Gist assisted with field surveys or measurements. Tiffany Harvey applied the GIS model and provided GIS-derived data from the spatially explicit habitat-prediction model, which was developed and provided by James Hatten. The Bureau of Land Management, U.S. Geological Survey, T & E., Inc, and the USFWS Sonoran Joint Venture provided funding or other support for this project.

92
References Cited Barrow, M.V., 2000, A passion for birds—American ornithology after Audubon: Princeton, N.J.,
Princeton University Press, 326 p. Brand, L.A, White, G.C, and Noon, B.R., 2008, Factors influencing species richness and community
composition of breeding birds in a desert riparian corridor: The Condor, v. 110, no. 2, p. 199–210. Brand, L.A., Stromberg, J.C., Goodrich, D.C., Dixon, M.D., Doosun Kang, K.L., Brookshire, D.S., and
Cerasale, D.J., 2010, Projecting avian response to linked changes in groundwater and riparian floodplain vegetation along a dryland river—A scenario analysis: Ecohydrology, no. 7, doi:10.1002/eco.143.
Busch, J.D., Miller, M.P., Paxton, E.H., Sogge, M.K., and Keim, P., 2000, Genetic variation in the endangered southwestern Willow Flycatcher: Auk, v. 117, no. 3, p. 586–595.
Corman, T., and Wise-Gervais, C., 2005, Arizona breeding bird atlas: Albuquerque, New Mexico, University of New Mexico Press, 646 p.
Davis, T., 2013, The BLM fights for the Southwest’s last free-flowing river: High Country News, February 18, 2013 issue, http://www.hcn.org/issues/45.3.
Dockens, P.E.T., Paradzick, C.E., and Hatten, J.R., 2004, Application of a southwestern Willow Flycatcher GIS-based habitat model—An estimate of breeding habitat in Arizona, 2001, in Dockens, P., and Paradzick, C., eds., Mapping and monitoring southwestern Willow Flycatcher breeding habitat in Arizona—A remote sensing approach: Arizona Game and Fish Department Nongame and Endangered Wildlife Program Technical Report 223, p. 28–59, http://sbsc.wr.usgs.gov/cprs/research/projects/swwf/reports.asp.
Dougherty, J., 2007, Of politics and the river: High Country News, August 06, 2007 issue, http://www.hcn.org/issues/351/17143.
Durst, S.L., Sogge, M.K., Stump, S.D., Williams, S.O., Kus, B.E., and Sferra, S.J., 2007, Southwestern Willow Flycatcher breeding site and territory summary – 2006: U.S. Geological Survey Open-File Report 2007-1391, 28 p., http://pubs.usgs.gov/of/2007/1391/
E.E.C. (Engineering and Environmental Consultants Inc.), 2005, Year 2005 southwestern Willow Flycatcher (Empidonax traillii extimus) survey and Yellow-Billed Cuckoo (Coccyzus americanus) detections on the San Pedro riparian National Conservation Area and the Babocomari Cienega: Unpublished report prepared for Directorate of Installation Support, U.S. Army Garrison, Fort Huachuca, Arizona.
Ellis, L.A., Weddle, D.M., Stump, S.D., English, H.C., and Graber, A.E., 2008, Southwestern Willow Flycatcher final survey and nest monitoring report: Arizona Game and Fish Department Research Branch, Wildlife Management Division, Research Technical Guidance Bulletin #10, 318 p., http://sbsc.wr.usgs.gov/cprs/research/projects/swwf/reports.asp.
English, H.C., Graber, A.E., Stump, S.D., Telle, H.E., and Ellis, L.A., 2006, Southwestern Willow Flycatcher 2005 survey and nest monitoring report: Arizona Game and Fish Department, Nongame and Endangered Wildlife Program Technical Report 248., 90 p., http://sbsc.wr.usgs.gov/cprs/research/projects/swwf/reports.asp
Finch, D.M., Agyagos, J., McCarthey, T., Marshall, R.M., Stoleson, S.H., and Whitfield, M.J., 2000, Management recommendations, ch. 10 of Finch, D.M., and Stoleson, S.H., eds., Status, ecology, and conservation of the southwestern Willow Flycatcher: U.S. Forest Service General Technical Report RMRS-GTR-60, p. 107–118.
Hatten, J.R., Paradzick, C.E., 2003, A multi-scaled model of southwestern Willow Flycatcher breeding habitat: Journal of Wildlife Management, v. 67, no. 4, p.774–788.
Hatten, J.R., and Sogge, M.K., 2007, Using a remote sensing/GIS model to predict southwestern Willow Flycatcher breeding habitat along the Rio Grande, New Mexico: U.S. Geological Survey Open-File Report 2007-1207, 27 p., http://pubs.usgs.gov/of/2007/1207/.

93
Hunter, W.C., Ohmart, R.D., and Anderson, B.W., 1987, Status of breeding riparian-obligate birds in southwestern riverine systems: Western Birds, v. 18, p. 10–18.
Johnson, G.E., and van Riper, C., 2008, An investigation of important factors associated with riparian bird community structure along the upper San Pedro River in southeastern Arizona and northern Sonora: Unpublished report to Sonoran Joint Venture/U.S. Fish and Wildlife Service.
Johnson, G.E., 2011, Bird abundance and richness in a desert riparian area following beaver reintroduction: M.S. Thesis, School of Natural Resources and the Environment, University of Arizona, Tucson Arizona.
Krueper, D.J., 1999, Annotated checklist to the birds of the upper San Pedro River Valley, Arizona. U.S. Bureau of Land Management San Pedro Riparian National Conservation Area.
Krueper, D., Bart, J., and Rich, T.D., 2003, Response of vegetation and breeding birds to the removal of cattle on the San Pedro River, Arizona (U.S.A.): Conservation Biology, v. 17. No. 2, p. 607–615.
Longcore, T., Rich, C., and Mueller-Schwarze, D., 2007, Management by assertion—Beavers and songbirds at Lake Skinner (Riverside County, California): Environmental Management, v. 39, no. 4, p. 460–471.
McFarland, T.M., van Riper, C., III, and Johnson, G.E., 2012, The usefulness of riparian NDVI models in assessing avian abundance and richness: Journal of Arid Environments, v. 77, p. 45–53.
Paradzick, C.E., and Woodward, A.A., 2003, Distribution, abundance, and habitat characteristics of southwestern Willow Flycatchers (Empidonax traillii extimus) in Arizona, 1993–2000: Studies in Avian Biology, no. 26, p. 22–29.
Phillips, A.R., 1948, Geographic variation in Empidonax traillii: Auk, v. 65, no. 4, p. 507–514. Phillips, A.R., Marshall, J., and Monson, G., 1964, The birds of Arizona: Tucson, Ariz., The University of
Arizona Press, 212 p. Rourke, J.W., McCarthey, T.D., Davidson, R.F., and Santaniello, A.M., 1999, Southwestern Willow
Flycatcher nest monitoring protocol: Arizona Game and Fish Department, Nongame and Endangered Wildlife Program Technical Report 144, 39 p., http://sbsc.wr.usgs.gov/cprs/research/projects/swwf/reports.asp
Sedgwick, J.A., 2000, Willow Flycatcher (Empidonax traillii), The Birds of North America Online: Cornell Lab of Ornithology, accessed March 19, 2014, at http://bna.birds.cornell.edu/bna/.Smith, A.B., Woodward, A.A., Dockens, P.E.T., Martin, J.S., and McCarthey, T.D., 2003, Southwestern Willow Flycatcher 2002 survey and nest monitoring report: Arizona Game and Fish Department, Nongame and Endangered Wildlife Program Technical Report 210, 57 p., http://sbsc.wr.usgs.gov/cprs/research/projects/swwf/Reports/AGFD_WIFL_2002_Season_NGTR_210.pdf.
Sogge, M.K., Marshall, R.M., Sferra, S.J., and Tibbitts, T.J., 1997, A southwestern Willow Flycatcher natural history summary and survey protocol. Technical Report NPS/NAUCPRS/NRTR-97/12, 34 p., http://sbsc.wr.usgs.gov/cprs/research/projects/swwf/reports.asp.
Sogge, M.K., and Marshall, R.M., 2000, A survey of current breeding habitats, ch. 5 of Finch, D.M., and Stoleson, S.H., eds., Status, ecology, and conservation of the southwestern Willow Flycatcher: U.S. Forest Service General Technical Report RMRS-GTR-60, p. 13–24.
Sogge, M.K., Sferra, S.J., McCarthey, T.D., Williams, S.O., and Kus, B.E., 2003, Distribution and characteristics of southwestern Willow Flycatcher breeding sites and territories—1993–2001: Studies in Avian Biology, no. 26, p. 5–11.
Sogge, M.K., Sferra, S.J. and Paxton, E.H., 2008, Tamarix as habitat for birds—Implications for riparian restoration in the southwestern United States: Restoration Ecology, v. 16, p. 146–154.
Sogge, M.K., Paxton, E.P., and van Riper, C., III, 2013, Changing perspectives on the role of tamarisk in riparian woodlands—A bird’s eye view, ch. 11 in Sherr, A., and others, eds., Tamarisk: New York, The Elsevier Press, p. 189–206.

94
Steinitz, C., Anderson, R., Arias, H., Bassett, S., Flaxman, M., Goode, T., Maddock, T., III, Mouat, D., Peiser, R., and Shearer, A., 2005, Alternative futures for landscapes in the upper San Pedro River Basin of Arizona and Sonora: U.S. Forest Service General Technical Report PSW-GTR-191, p. 93–100.
Stromberg, J.C., and Tiller, R., 1996, Effects of groundwater decline on riparian vegetation of semiarid regions—The San Pedro, Arizona: Ecological Applications, v. 6, no. 1, p. 113–131.
Stromberg J.C., Tluczek, M.G.F., Hazelton, A.F., and Ajami, H., 2010, A century of riparian forest expansion following extreme disturbance—Spatio-temporal change in Populus/Salix forests along the upper San Pedro River, Arizona: Forest Ecology and Management, v. 259, p. 1181–1189.
Swarth, H.S., 1896, From Los Angeles to Ramsey Canyon—Three months of bird collecting: Unpublished, privately-held field notes as transcribed by Chris Swarth, graciously shared with the author and now held at the California Academy of Sciences with H.S. Swarth’s other journals.
Swarth, H.S., 1904, Birds of the Huachuca Mountains, Arizona: Pacific Coast Avifauna, no. 4. Swarth, H.S., 1914, A distributional list of the birds of Arizona: Pacific Coast Avifauna, no. 10. The Nature Conservancy, 2007, Wet/dry mapping of the San Pedro River, 1999–2007, (PDF map),
http://www.srnr.arizona.edu/nemo/review/wd_SanPedro_AllYears24x30.pdf. Tracy, J.L., and Robbins, T.O., 2009, Zootaxa 2101—Taxonomic revision and biogeography of the
Tamarix-feeding Diorhabda elongata (Brullé, 1832) species group (Coleoptera: Chrysomelidae: Galerucinae: Galerucini) and analysis of their potential in biological control of Tamarisk: Auckland, New Zealand, Magnolia Press,. 152 p., http://www.mapress.com./zootaxa/2009/f/zt02101p152.pdf.
Unitt, P., 1987, Empidonax traillii extimus—An endangered subspecies: Western Birds, v. 18, no. 3, p. 137–162.
U.S. Fish and Wildlife Service, 1995, Endangered and threatened wildlife and plants—Final rule determining endangered status for the southwestern Willow Flycatcher: Federal Register, v. 60, no. 38, p. 10694–10715.
U.S. Fish and Wildlife Service, 1997, Endangered and threatened wildlife and plants—Final determination of critical habitat for the southwestern Willow Flycatcher: Federal Register, v. 62, no. 140, p. 39129–39147, http://ecos.fws.gov/docs/federal_register/fr3108.pdf.
U.S. Fish and Wildlife Service, 1998, Memorandum to Tucson field office, Bureau of Land Management—Biological opinion on reintroduction of beaver into the San Pedro riparian Conservation Area: Arizona Ecological Services Field Office, April 17, 1998, AESO/SE 2-21-97-F-097.
U.S. Fish and Wildlife Service, 2002, Southwestern Willow Flycatcher recovery plan, Albuquerque, New Mexico, 210 p., Apendices A–O, http://www.fws.gov/southwest/es/arizona/Recovery.htm.
U.S. Fish and Wildlife Service, 2005, Designation of critical habitat for the southwestern Willow Flycatcher (Empidonax traillii extimus)—Final rule: Federal Register, v. 70, no. 201, p. 60886–61009, http://www.fws.gov/southwest/es/arizona/SWWF_CH_Oct05.htm
U.S. Fish and Wildlife Service, 2013, Endangered and threatened wildlife and plants—Designation of critical habitat for southwestern Willow Flycatcher: Federal Register, v. 78, no. 2, p. 344–534, http://ecos.fws.gov/speciesProfile/profile/speciesProfile.action?spcode=B094.
Webb, R.H., Leake, S.A., and Turner, R.M., 2007, The ribbon of green—Change in riparian vegetation in the southwestern United States: Tucson, Arizona, University of Arizona Press, 480 p.
Willard, F.C., 1912, A week afield in southern Arizona: Condor, v. 14, no. 2, p. 53–63.

95
Tables
Table 3-1. Records of breeding Southwestern Willow Flycatchers (E.t. extimus) within the upper San Pedro River watershed in Arizona, including: locality, number of nests documented, date(s) of record, sources used to find or investigate record (specimen information given in parentheses: institution abbreviation*, catalog number, and collector), and further information and comments on the record. [BMNH, Bell Museum of Natural History, University of Minnesota; DMNH, Delaware Museum of Natural History; FMNH, The Field Museum (Chicago); MVZ, Museum of Vertebrate Zoology at Berkeley; RMNH, Richter Museum of Natural History, University of Wisconsin-Green Bay; SBMNH, Santa Barbara Museum of Natural History; USNM, U.S. National Museum of Natural History (Smithsonian); YPMNH, Yale Peabody Museum of Natural History]
Locality Number of nests Date(s)
Sources for record, specimen information (institution, cat. no.,
collector) Comments
Hereford 1 7/1-
7/30/2005 Originally reported in E.E.C. 2005, Ellis, 2008
2005 nest site near Hereford
Lewis Springs 1 1977 Krueper, 1999, D. Danforth oral comm.
Last documented successful nest on upper San Pedro.
Lewis Springs 2 1997 Krueper, 1999; Paradzick and Woodward, 2003
Two nests attempted in area, both depredated.
Fairbank 1 5/27/1906 ORNIS (SBMNH AV 23889 Willard, F.)
"25 feet up in an alder tree.
Fairbank 1 6/17/1906 ORNIS (SBMNH AV 23890 Willard, F.)
"About 10 feet up in a slender willow sapling in a thicket."
Fairbank 1 6/14/1908 ORNIS (SBMNH AV 23891 Willard, F.)
3 eggs, "7 feet up among twigs against trunk of a small willow in a thicket."
Fairbank 1 6/5/1910 ORNIS (SBMNH AV 23892 Willard, F.)
"8 feet up in some slender willow brush growing along an irrigating ditch. Made as usual."
Fairbank 1 6/5/1910 GBIF.org, M. Westberg oral. comm. (BMNH 40678 Langevin)
Complete nest with 3 eggs (Mike Westberg at BMNH)
Fairbank 1 6/10/1910 DMNH (DMNH E64699 Willard, F.C.)
"Female flushed, 9 feet up in a slender willow; made as usual, nest with set; San Pedro River near Fairbank."
Fairbank 1 6/29/1910 RMNH (RMNH uncataloged Willard, F.C.)
Record provided by Thomas Erdman, oral commun. No catalog number "A.O.U. set mark 466 s/3"Nest: 12 ft up in a slender willow growing in a thicket. Made as usual. Nest with set. Both birds present."
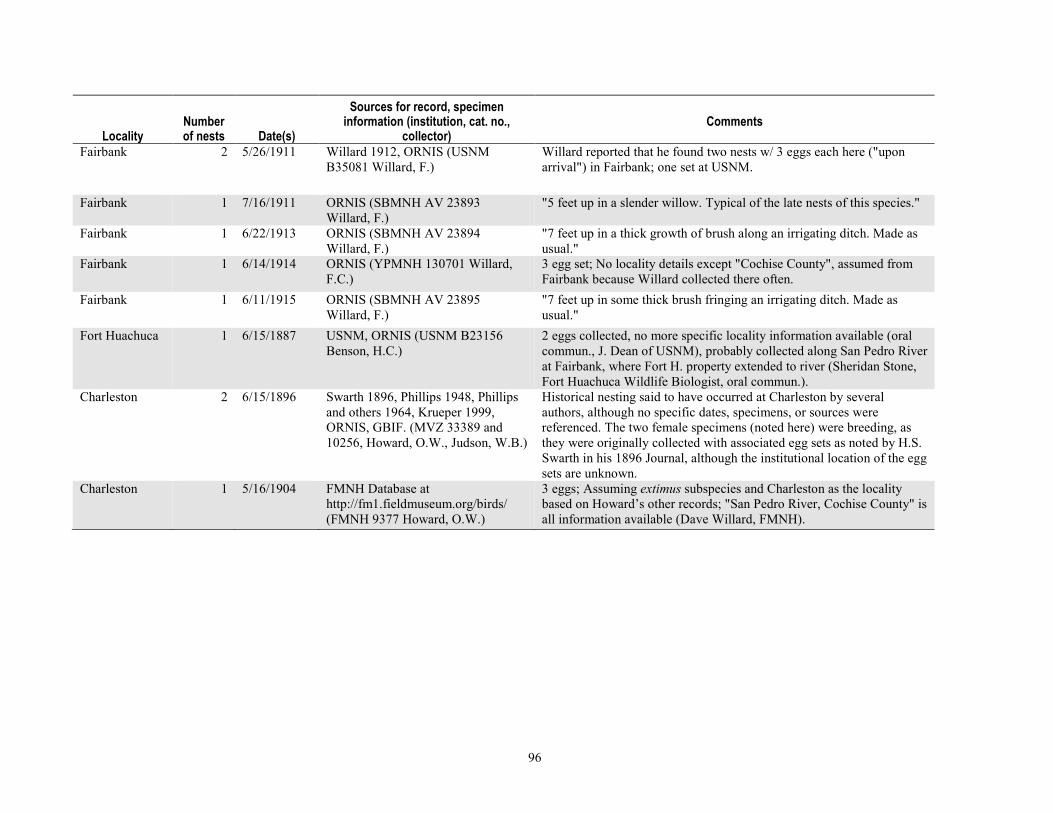
96
Locality Number of nests Date(s)
Sources for record, specimen information (institution, cat. no.,
collector) Comments
Fairbank 2 5/26/1911 Willard 1912, ORNIS (USNM
B35081 Willard, F.) Willard reported that he found two nests w/ 3 eggs each here ("upon arrival") in Fairbank; one set at USNM.
Fairbank 1 7/16/1911 ORNIS (SBMNH AV 23893 Willard, F.)
"5 feet up in a slender willow. Typical of the late nests of this species."
Fairbank 1 6/22/1913 ORNIS (SBMNH AV 23894 Willard, F.)
"7 feet up in a thick growth of brush along an irrigating ditch. Made as usual."
Fairbank 1 6/14/1914 ORNIS (YPMNH 130701 Willard, F.C.)
3 egg set; No locality details except "Cochise County", assumed from Fairbank because Willard collected there often.
Fairbank 1 6/11/1915 ORNIS (SBMNH AV 23895 Willard, F.)
"7 feet up in some thick brush fringing an irrigating ditch. Made as usual."
Fort Huachuca 1 6/15/1887 USNM, ORNIS (USNM B23156 Benson, H.C.)
2 eggs collected, no more specific locality information available (oral commun., J. Dean of USNM), probably collected along San Pedro River at Fairbank, where Fort H. property extended to river (Sheridan Stone, Fort Huachuca Wildlife Biologist, oral commun.).
Charleston 2 6/15/1896 Swarth 1896, Phillips 1948, Phillips and others 1964, Krueper 1999, ORNIS, GBIF. (MVZ 33389 and 10256, Howard, O.W., Judson, W.B.)
Historical nesting said to have occurred at Charleston by several authors, although no specific dates, specimens, or sources were referenced. The two female specimens (noted here) were breeding, as they were originally collected with associated egg sets as noted by H.S. Swarth in his 1896 Journal, although the institutional location of the egg sets are unknown.
Charleston 1 5/16/1904 FMNH Database at http://fm1.fieldmuseum.org/birds/ (FMNH 9377 Howard, O.W.)
3 eggs; Assuming extimus subspecies and Charleston as the locality based on Howard’s other records; "San Pedro River, Cochise County" is all information available (Dave Willard, FMNH).

97
Table 3-2. Comparison of mean and range of values from 240 sites, value at nest site, and rank and percentile (= percent sites with lesser values) of nest site in relation to range of values for all stations, for each of seven environmental variables: percent Goodding’s willow (Salix gooddingii) cover in 3–5 m and 5–7 m canopy layers, total number of Goodding’s willow, seep willow and all woody plant stems, mean diameter-at-breast-height (DBH) of all woody species’ main stems, and total width of riparian vegetation.
Environmental Variable
Mean value from 240 stations
Range of values at 240
stations
Value measured at
nest site
Rank of nest site among 240
stations
Percentile of nest site among
240 stations
Goodding’s willow percent cover, 3-5 m
6.9 0-25 17 9 96.2
Goodding’s willow percent cover, 5-7 m
5.8 0-27 14 23 89
Total number of Goodding’s willow stems
21 0-195 143 2 99.5
Total number of seep willow stems
2 0-77 77 1 100
Total number of all woody stems
75 4-278 220 5 98.3
Mean DBH of all woody main stems (cm)
16.6 2-64 7.85 213 10.9

98
Appendix 3-A. Discovery, Location, Subsequent Monitoring, and Fate of the 2005 Hereford Nest The breeding pair of Southwestern Willow Flycatchers was detected after the distinctive “fitz-
bew!” song was heard on July 5, 2005 by Brian Bielfelt while conducting surveys for a multi-species bird study in the SPRNCA. The location was 200 m south of the Hereford Road Bridge over the San Pedro River, 15 km southeast of Sierra Vista, Arizona, and 11.6 km north of the international border (elevation 1,266 m). The surveyor and G. Johnson visited the site later that day and confirmed the observation, noting the singing male had a silver USFWS aluminum band on one leg and was engaged in typical pair-interactions with an unbanded bird that was repeatedly flying to a patch of Goodding’s willow while carrying nest materials. After observing the unbanded bird building a nest, which appeared to be approximately one-third completed, we notified the BLM and USFWS. On several dates from July 7 to August 3, 2005, authorized personnel from Engineering and Environmental Consultants, Inc. observed nest completion, two eggs in the nest, female incubation and rotation of the eggs, and continued occupancy by the male. By August 3, 2005, the nest was determined a failure as the adults had vacated the area and apparently abandoned one remaining egg, possibly after a predation and/or one of several flood events (Engineering and Environmental Consultants, Inc., 2005). On July 20, USGS E. t. extimus research-biologists captured both the male and female near the nest site using mist nets with an audio lure. The male had originally been captured and banded with a USFWS aluminum band (number 2270-30306) as an adult in apparent non-breeding condition on July 11, 2002, at a BLM multi-species bird banding operation located 11.5 km downriver (at Green Kinfisher Pond) to the north of the nest site. After removing the old band from the male, both the male and female were fitted with new, unique colored aluminum band combinations (E. Paxton, oral commun.). To our knowledge, the pair has not been re-sighted since the breeding attempt ended.

Publishing support provided by the U.S. Geological SurveyPublishing Network, Tacoma Publishing Service Center
For more information concerning the research in this report, contact the SBSC staff, Southwest Biological Science Center
U.S. Geological Survey 2255 N. Gemini Drive Flagstaff, AZ 86001 http://sbsc.wr.usgs.gov/

Johnson and van Riper III—Effects of Reintroduced B
eaver on Riparian Bird Comm
unity Structure along the Upper San Pedro River—
Open-File Report 2014–1121
ISSN 2331-1258 (online)http://dx.doi.org/10.3133/ofr20141121