Embed Size (px)
Citation preview

EFFECTS OF RACIAL DISCRIMINATION ON HIGH SCHOOL PERFORMANCE
AND COLLEGE ADMISSION IN BRAZIL
by
Rubia da Rocha Valente
APPROVED BY SUPERVISORY COMMITTEE:
Dr. Brian J. L. Berry, Chair
Dr. Euel Elliott
Dr. Jennifer S. Holmes
Dr. Richard K. Scotch

c© Copyright 2013
Rubia da Rocha Valente
All Rights Reserved

To Frederico.


EFFECTS OF RACIAL DISCRIMINATION ON HIGH SCHOOL PERFORMANCE
AND COLLEGE ADMISSION IN BRAZIL
by
RUBIA DA ROCHA VALENTE, BS, MS
DISSERTATION
Presented to the Faculty of
The University of Texas at Dallas
in Partial Fulfillment
of the Requirements
for the Degree of
DOCTOR OF PHILOSOPHY IN
PUBLIC POLICY AND POLITICAL ECONOMY
THE UNIVERSITY OF TEXAS AT DALLAS
May 2013

All rights reserved
INFORMATION TO ALL USERSThe quality of this reproduction is dependent upon the quality of the copy submitted.
In the unlikely event that the author did not send a complete manuscriptand there are missing pages, these will be noted. Also, if material had to be removed,
a note will indicate the deletion.
Microform Edition © ProQuest LLC.All rights reserved. This work is protected against
unauthorized copying under Title 17, United States Code
ProQuest LLC.789 East Eisenhower Parkway
P.O. Box 1346Ann Arbor, MI 48106 - 1346
UMI 3564647Published by ProQuest LLC (2013). Copyright in the Dissertation held by the Author.
UMI Number: 3564647

ACKNOWLEDGEMENTS
This has been an amazing life experience, surrounded by amazing and extraordinary people
who made this great achievement possible.
I would like to express profound gratitude to my dissertation chair, Dr. Brian J. L. Berry, for
his unyielding support and guidance in writing this dissertation. I am proud and humbled
to have had the great opportunity to study under such a distinguished scholar. I appreciate
the countless hours of wise counsel, and also the funny anecdotes you shared with me. You
are truly amazing, and always will be an inspiration to me. Muito obrigada.
I would also like to thank my committee members: Dr. Jennifer Holmes, Dr. Richard
Scotch and Dr. Euel Elliott. I appreciate your willingness to serve in my committee and
your readily available assistance throughout this process. I am thankful to all of you for
your time and contribution. It has been my greatest honor to be guided by a committee of
such extraordinary mentors.
I am very thankful to Dr. Holmes, my mentor since I entered the Master program, for shar-
ing her time and interest with regards to Latin America. Your support, guidance and sense
of humor helped me get through this process. Gracias!
Likewise, I will forever be indebted to Dr. Scotch for his support, advise and great insights
on my research. Thank you for giving me the opportunity to teach my first class; I will never
forget your support and confidence in me.
I would like to thank Dr. Elliott for graciously accepting to be part of my committee. I have
greatly enjoyed the opportunity to work with you and appreciate your helpful suggestions.
I am also grateful to Dr. Adam Okulicz-Kozaryn for providing econometric and method-
ological guidance and for always being prompt and happy to assist me even after moving to
another state.
I am filled with gratitude to all of my professors who have nurtured my ability to learn
v

during this process, especially Dr. Sheryl L. Skaggs, Dr. Lloyd J. Dumas, Dr. Karl Ho and
Dr. Murray J. Leaf. I am also thankful to Ms. Betsy Albritton for her kind assistance.
I would also like to acknowledge Renan Leite from FUVEST who provided invaluable assis-
tance and data that made this dissertation possible.
To my extended family and to my friends, Alejandro Tirado, Osamah Almuayyad and
Razan Kattoa, Alero Akporiaye, Imrana Iqbal, Olga Taylor, Mea Ahlberg, Julie Burlingame,
William Grover, Young Oh, Mohammad Zinatti, Monica de Andrade and all the others, who
in one way or another made this a memorable journey.
To my “little” sisters, Junia and Sarah, thanks for always being there for me, for always
supporting and cheering me on. To my sister Anita (in memory), for inspiring me to live
life to the fullest as if there’s no tomorrow, this is also for you. Special thanks to Sarah for
her patience in proofreading and helping me edit many of my written works, including this
dissertation. Without you “who” would be “that.” Amo voces.
I am mostly thankful to my parents for their unwavering love and support. Mamae, for your
love, prayers, and guidance in every single step of my life; thank you for who I am. Papai, for
always being interested in my research and education; I always enjoy our conversations and
the clever things you have to say. I am where I am because of you two, in part because of
your sacrifice and hard work, but mostly because of your love and encouragement. Without
you, I would not have achieved this opportunity for a brighter future. Eu amo muito voces.
To my dear husband, Frederico, for his unconditional love, understanding, and support
throughout this process. Lindo, I have known you for half of my life and ever since we first
met, fourteen years ago, you have filled my life with much happiness and love. You are the
reason I smile every day. Thank you for the best yesterdays I have ever had, for all the years
that went by so fast. I love you with all of my heart, com todo amor, todo carinho, sempre.
Here’s to us, to morrows, cheers!
Estou muito agradecida; o meu coracao se regozija no Senhor.
February 2013
vi

EFFECTS OF RACIAL DISCRIMINATION ON HIGH SCHOOL PERFORMANCE
AND COLLEGE ADMISSION IN BRAZIL
Publication No.
Rubia da Rocha Valente, PhDThe University of Texas at Dallas, 2013
Supervising Professor: Dr. Brian J. L. Berry
This research uses national survey data from the Exame Nacional do Ensino Medio (National
Secondary Education Exam - ENEM) in Brazil to explore the impact of racial discrimination
on high school students between 2004 and 2008. The analysis shows that being a victim of
racism can reduce a student’s ENEM scores, as well as diminish the perceived quality of their
education. These results suggest that racial discrimination in the school environment can be
detrimental to the learning experience and to educational attainment. In addition, the study
analyzes the characteristics of students admitted to the University of Sao Paulo (USP) and
finds a great racial disparity in acceptance rates. Those accepted at the University of Sao
Paulo are more likely to be white, to come from high income families, to come from private
high schools, to enroll in cursinho (prep course) and to have a mother with high educational
attainment. Thus, the study concludes that higher education in Brazil is synonymous with
elitism and that the lack of accessibility by the general population is an impediment to
social mobility, especially to Afro-descendants. This work provides a valuable contribution
to both race relation studies and educational attainment research in Brazil and it paves the
way for future research on the recent implementation of affirmative action policies in federal
Brazilian universities.
vii

TABLE OF CONTENTS
ACKNOWLEDGEMENTS . . . . . . . . . . . . . . . . . . . . . . . . . . . . . . . . v
ABSTRACT . . . . . . . . . . . . . . . . . . . . . . . . . . . . . . . . . . . . . . . . vii
LIST OF FIGURES . . . . . . . . . . . . . . . . . . . . . . . . . . . . . . . . . . . . x
LIST OF TABLES . . . . . . . . . . . . . . . . . . . . . . . . . . . . . . . . . . . . . xi
CHAPTER 1 INTRODUCTION . . . . . . . . . . . . . . . . . . . . . . . . . . . . 1
CHAPTER 2 DISCRIMINATION AND EDUCATIONAL OPPORTUNITY IN
BRAZIL . . . . . . . . . . . . . . . . . . . . . . . . . . . . . . . . . . . . . . . . . 5
2.1 Discrimination in Brazil . . . . . . . . . . . . . . . . . . . . . . . . . . . . . 5
2.2 Discrimination and Educational Opportunity . . . . . . . . . . . . . . . . . . 9
2.3 A Closer look at the ENEM . . . . . . . . . . . . . . . . . . . . . . . . . . . 14
2.4 Data Availability and Source . . . . . . . . . . . . . . . . . . . . . . . . . . . 17
CHAPTER 3 MODEL SPECIFICATION AND VARIABLE SELECTION . . . . . 18
3.1 The Socio-Economic Questionnaire and Participants . . . . . . . . . . . . . . 20
3.2 What is Discrimination? . . . . . . . . . . . . . . . . . . . . . . . . . . . . . 23
3.3 How to Measure Racial Discrimination? . . . . . . . . . . . . . . . . . . . . . 28
3.3.1 Perceptions . . . . . . . . . . . . . . . . . . . . . . . . . . . . . . . . 29
3.3.2 Statistical Analysis . . . . . . . . . . . . . . . . . . . . . . . . . . . . 29
3.3.3 Experimental Approaches . . . . . . . . . . . . . . . . . . . . . . . . 30
3.4 Racial Classification . . . . . . . . . . . . . . . . . . . . . . . . . . . . . . . 31
3.5 Regional Differences . . . . . . . . . . . . . . . . . . . . . . . . . . . . . . . 31
3.6 Type of School and Cursinho Pre-Vestibular . . . . . . . . . . . . . . . . . . 33
3.7 Other Personal and Family Background Characteristics . . . . . . . . . . . . 34
CHAPTER 4 EMPIRICAL ESTIMATION OF THE MODEL . . . . . . . . . . . . 36
4.1 Data and Results for Regression Models . . . . . . . . . . . . . . . . . . . . 36
viii

4.2 The Effects of Discrimination on Quality of Education . . . . . . . . . . . . 42
4.3 The Effects of Discrimination on ENEM Performance . . . . . . . . . . . . . 44
4.3.1 Limitations . . . . . . . . . . . . . . . . . . . . . . . . . . . . . . . . 45
CHAPTER 5 THE UNIVERSITY OF SAO PAULO COMPARISON . . . . . . . . 49
5.1 Impediment to Social Mobility . . . . . . . . . . . . . . . . . . . . . . . . . . 49
5.2 The Vestibular . . . . . . . . . . . . . . . . . . . . . . . . . . . . . . . . . . 51
5.3 The Dataset . . . . . . . . . . . . . . . . . . . . . . . . . . . . . . . . . . . . 52
5.3.1 Chi-Square tests for Type of School . . . . . . . . . . . . . . . . . . . 54
5.3.2 ENEM Score Comparison . . . . . . . . . . . . . . . . . . . . . . . . 55
5.3.3 Data Analysis . . . . . . . . . . . . . . . . . . . . . . . . . . . . . . . 59
5.4 Summary . . . . . . . . . . . . . . . . . . . . . . . . . . . . . . . . . . . . . 90
CHAPTER 6 CONCLUSIONS . . . . . . . . . . . . . . . . . . . . . . . . . . . . . 95
6.1 Main Conclusions . . . . . . . . . . . . . . . . . . . . . . . . . . . . . . . . . 95
6.2 Future Research . . . . . . . . . . . . . . . . . . . . . . . . . . . . . . . . . . 98
6.3 Concluding Remarks . . . . . . . . . . . . . . . . . . . . . . . . . . . . . . . 100
APPENDIX A BRAZILIAN STATES . . . . . . . . . . . . . . . . . . . . . . . . . . 101
APPENDIX B BRAZILIAN MAP . . . . . . . . . . . . . . . . . . . . . . . . . . . . 102
APPENDIX C STUDENTS DISTRIBUTION BY BRAZILIAN STATES . . . . . . 103
APPENDIX D COLLINEARITY AND LOGIT OUTPUTS . . . . . . . . . . . . . . 104
REFERENCES . . . . . . . . . . . . . . . . . . . . . . . . . . . . . . . . . . . . . . . 115
VITA
ix

LIST OF FIGURES
2.1 Racial Distribution 2000 and 2010 IBGE . . . . . . . . . . . . . . . . . . . . . . 7
3.1 Race of Victims . . . . . . . . . . . . . . . . . . . . . . . . . . . . . . . . . . . . 24
3.2 Victims by ENEM score . . . . . . . . . . . . . . . . . . . . . . . . . . . . . . . 24
3.3 Victims Perception of Quality of Education . . . . . . . . . . . . . . . . . . . . 24
3.4 Mean for Victims vs. Witnesses per year . . . . . . . . . . . . . . . . . . . . . . 27
3.5 Mean for Victims vs. Family Income per year . . . . . . . . . . . . . . . . . . . 28
3.6 Distribution of Blacks by Regions - IBGE (National Household Survey, 1996-2005) 32
3.7 White/Black Income by Regions - IBGE (National Household Survey, 1996-2005) 33
5.1 ENEM Score Distribution by Race . . . . . . . . . . . . . . . . . . . . . . . . . 60
5.2 ENEM Score Distribution by Race . . . . . . . . . . . . . . . . . . . . . . . . . 66
5.3 ENEM Score Distribution by Race . . . . . . . . . . . . . . . . . . . . . . . . . 72
5.4 ENEM Score Distribution by Race . . . . . . . . . . . . . . . . . . . . . . . . . 77
5.5 ENEM Score Distribution by Race . . . . . . . . . . . . . . . . . . . . . . . . . 83
B.1 Brazil’ Five Macro-Regions . . . . . . . . . . . . . . . . . . . . . . . . . . . . . 102
x

LIST OF TABLES
2.1 Number of students registered per year . . . . . . . . . . . . . . . . . . . . . . . 15
3.1 Student-level variables included in X. . . . . . . . . . . . . . . . . . . . . . . . . 21
3.2 Background Characteristics of ENEM Students (n=2,489,509) . . . . . . . . . . 22
3.3 Racist Person by Race . . . . . . . . . . . . . . . . . . . . . . . . . . . . . . . . 25
3.4 Values Equivalent to One Minimum Wage by date . . . . . . . . . . . . . . . . . 35
4.1 OLS and Ologit estimation for Quality of Education . . . . . . . . . . . . . . . . 37
4.2 OLS and Ologit estimation for ENEM Score . . . . . . . . . . . . . . . . . . . . 39
4.3 Quality of Education by Race . . . . . . . . . . . . . . . . . . . . . . . . . . . . 44
4.4 Ordered Logit: Percentage Change in Odds (Model 1 - Quality) . . . . . . . . . 47
4.5 Ordered Logit: Percentage Change in Odds (Model 2 - Score) . . . . . . . . . . 48
5.1 Vestibular Acceptance vs. Type of High School in 2004 . . . . . . . . . . . . . . 54
5.2 Vestibular Acceptance vs. Type of High School in 2005 . . . . . . . . . . . . . . 54
5.3 Vestibular Acceptance vs. Type of High School in 2006 . . . . . . . . . . . . . . 54
5.4 Vestibular Acceptance vs. Type of High School in 2007 . . . . . . . . . . . . . . 55
5.5 Vestibular Acceptance vs. Type of High School in 2008 . . . . . . . . . . . . . . 55
5.6 ENEM Scores for Students Accepted at USP - 2008 . . . . . . . . . . . . . . . . 56
5.7 ENEM Scores for Students Accepted at USP - 2007 . . . . . . . . . . . . . . . . 56
5.8 ENEM Scores for Students Accepted at USP - 2006 . . . . . . . . . . . . . . . . 56
5.9 ENEM Scores for Students Accepted at USP - 2005 . . . . . . . . . . . . . . . . 57
5.10 ENEM Scores for Students Accepted at USP - 2004 . . . . . . . . . . . . . . . . 57
xi

5.11 Student-level variables . . . . . . . . . . . . . . . . . . . . . . . . . . . . . . . . 58
5.12 Logit: Percentage Change in Odds (2008 Passing Avg. Score Full Model) . . . 62
5.13 Race vs. Acceptance in Medicine USP - 2008 . . . . . . . . . . . . . . . . . . . 63
5.14 Race vs. Acceptance in Natural Sciences USP - 2008 . . . . . . . . . . . . . . . 63
5.15 Logit: Percentage Change in Odds (2008 Passing Medicine - Full Model) . . . . 64
5.16 Logit: Percentage Change in Odds (2008 Passing Natural Sciences - Full Model) 65
5.17 Race vs. Acceptance in Medicine USP - 2007 . . . . . . . . . . . . . . . . . . . 67
5.18 Race vs. Acceptance in Natural Sciences USP - 2007 . . . . . . . . . . . . . . . 67
5.19 Logit: Percentage Change in Odds (2007 Passing Avg. Score - Full Model) . . . 68
5.20 Logit: Percentage Change in Odds (2007 Passing Medicine - Full Model) . . . . 69
5.21 Logit: Percentage Change in Odds (2007 Passing Natural Sciences - Full Model) 70
5.22 Race vs. Acceptance in Medicine USP - 2006 . . . . . . . . . . . . . . . . . . . 71
5.23 Race vs. Acceptance in Natural Sciences USP - 2006 . . . . . . . . . . . . . . . 71
5.24 Logit: Percentage Change in Odds (2006 Passing Medicine - Full Model) . . . . 73
5.25 Logit: Percentage Change in Odds (2006 Passing Avg. Score - Full Model) . . . 75
5.26 Logit: Percentage Change in Odds (2006 Passing Natural Sciences - Full Model) 76
5.27 Race vs. Acceptance in Medicine USP - 2005 . . . . . . . . . . . . . . . . . . . 78
5.28 Race vs. Acceptance in Audiology USP - 2005 . . . . . . . . . . . . . . . . . . . 78
5.29 Logit: Percentage Change in Odds (2005 Passing Medicine - Full Model) . . . . 79
5.30 Logit: Percentage Change in Odds (2005 Passing Avg. Score - Full Model) . . . 80
5.31 Logit: Percentage Change in Odds (2005 Passing Audiology - Full Model) . . . 81
5.32 Race vs. Acceptance in Medicine USP - 2004 . . . . . . . . . . . . . . . . . . . 84
5.33 Race vs. Acceptance in Audiology USP - 2004 . . . . . . . . . . . . . . . . . . . 84
5.34 Logit: Percentage Change in Odds (2004 Passing Avg. Score - Full Model) . . . 85
5.35 Logit: Percentage Change in Odds (2004 Passing Medicine - Full Model) . . . . 86
5.36 Logit: Percentage Change in Odds (2004 Passing Audiology - Full Model) . . . 87
xii

5.37 Logit: Percentage Change in Odds (2008-2004 Full Models) . . . . . . . . . . . 92
5.38 All Majors Acceptance by Race at USP 2008-2004 . . . . . . . . . . . . . . . . . 93
5.39 Medicine Acceptance by Race at USP 2008-2004 . . . . . . . . . . . . . . . . . . 93
5.40 All Majors Acceptance by Type of School at USP 2008-2004 . . . . . . . . . . . 94
5.41 Medicine Acceptance by Type of School at USP 2008-2004 . . . . . . . . . . . . 94
A.1 Brazilian States . . . . . . . . . . . . . . . . . . . . . . . . . . . . . . . . . . . . 101
C.1 Number of Students by Brazilian States . . . . . . . . . . . . . . . . . . . . . . 103
D.1 Collinearity Diagnostics for Model 1 and Model 2 . . . . . . . . . . . . . . . . . 104
D.2 Collinearity Diagnostics for Chapter 5 - Year 2008 . . . . . . . . . . . . . . . . . 105
D.3 Collinearity Diagnostics for Chapter 5 - Year 2008 . . . . . . . . . . . . . . . . . 105
D.4 Collinearity Diagnostics for Chapter 5 - Year 2007 . . . . . . . . . . . . . . . . . 106
D.5 Collinearity Diagnostics for Chapter 5 - Year 2007 . . . . . . . . . . . . . . . . . 106
D.6 Collinearity Diagnostics for Chapter 5 - Year 2006 . . . . . . . . . . . . . . . . . 107
D.7 Collinearity Diagnostics for Chapter 5 - Year 2006 . . . . . . . . . . . . . . . . . 107
D.8 Collinearity Diagnostics for Chapter 5 - Year 2005 . . . . . . . . . . . . . . . . . 108
D.9 Collinearity Diagnostics for Chapter 5 - Year 2005 . . . . . . . . . . . . . . . . . 108
D.10 Collinearity Diagnostics for Chapter 5 - Year 2004 . . . . . . . . . . . . . . . . . 109
D.11 Collinearity Diagnostics for Chapter 5 - Year 2004 . . . . . . . . . . . . . . . . . 109
D.12 Logit estimation for pavg, pmed and pnsci . . . . . . . . . . . . . . . . . . . . . 110
D.13 Logit estimation for pavg, pmed and pnsci . . . . . . . . . . . . . . . . . . . . . 111
D.14 Logit estimation for pavg, pmed and pnsci . . . . . . . . . . . . . . . . . . . . . 112
D.15 Logit estimation for pavg, pmed and pfono . . . . . . . . . . . . . . . . . . . . . 113
D.16 Logit estimation for pavg, pmed and pfono . . . . . . . . . . . . . . . . . . . . 114
xiii

CHAPTER 1
INTRODUCTION
I am against education as an exclusive mechanism to form an elite, keeping the majorityof the [Brazilian] population in a state of illiteracy and ignorance.
–Anısio Teixeira, lawyer, intellectual, educator and writerO Jornal, 1958 [Teixeira, 1958].
Access to higher education in Brazil is particularly inaccessible to lower socioeconomic
groups composed mostly of African descents. Although the Brazilian government has ar-
gued for many years that Brazil is a racial democracy it is evident in the literature that
Afro-Brazilians’ descendants do not have a fair opportunity to attend the university of their
choice. I propose to explore this issue using a very rich Brazilian data set that has not yet
been used to measure racial discrimination.
Admission to Brazilian universities is determined by an entrance exam called the vestibu-
lar. The vestibular is unique to each institution and candidates are selected based on aca-
demic performance on this exam alone. The exam is highly competitive in public universities
since they are tuition free, with even greater competition for prestigious disciplines such as
medicine, law and engineering [INEP, 2004].
This creates a cruel paradox because given the highly competitive nature of the vestibular
it is very hard to enter a public university and receive a free college education without having
previously received a private high school education [McCowan, 2007]. As a result, access is
limited to the higher socioeconomic groups, resulting in a great racial inequity with low
representation of African Brazilians and indigenous peoples [INEP, 2003; McCowan, 2007].
According to the National Census of 2000, African descendants make up 46.5 percent of the
1

2
Brazilian population, however, when looking at the higher education census one finds that
they represent fewer than 20 percent of the students attending Brazilian universities [IBGE,
2000].
In 1998, the Ministry of Education created the Exame Nacional do Ensino Medio (Na-
tional Examination of Secondary Education - ENEM). The exam was created to analyze
the academic performance of students finishing secondary education, as well as, the overall
quality of high school education in Brazil. It is given to seniors or students who have already
graduated from high school. The goal was to eventually replace the vestibular with the
ENEM examination in all public universities. In 2009 the Sistema de Selecao Unificada or
SISU was developed by the Brazilian Ministry of Education to select a number of candidates
to public universities using the ENEM score as the only admission criteria, however, just a
few institutions have adopted SISU. The Federal University of Rio de Janeiro has adopted
this measure, designating 3,600 slots to students in the SISU [UOL Notıcias, 2011] [Brazilian
Ministry of Education, 2011]. However, there is only a total of 30,548 slots offered to students
through the SISU and only a few institutions are part of this program [Brazilian Ministry of
Education, 2011]. Prestigious universities such as the University of Sao Paulo and University
of Campinas, are not part of the SISU program but, like most universities, they do provide
bonus points in the vestibular for students who performed well on the ENEM exam.
This study aims to look at the effects of discrimination in Brazil in the secondary and
higher educational sectors. Racial discrimination is a serious problem at different levels of
education in Brazil, and is negatively associated with the student’s perception of the learning
environment. Schools, after the immediate family, are still considered very important to so-
cialization, as well as to the human development of the individuals [Asinelli-Luz and Cunha,
2011]. Discrimination can be any behavior that makes the school campus an uncomfortable
place; that creates an environment that is hostile to a minority group in general, or just to

3
one person because of her or his race, ethnicity, gender, sexual orientation, disabilities or
socioeconomic status.
The learning environment in a school ought not to be a place where students are differ-
entiated simply because of their race, gender, sexual orientation, ethnicity or socioeconomic
status. Instead, schools should be a safe zone, where mutual respect is expected and differ-
ences are respected. Regardless of the reason, any type of discrimination can be disruptive
to the student’s learning objectives. The purpose of this study is to analyze the effect that
racial discrimination has on the student’s quality of education and grade on the ENEM ex-
amination. The hypothesis is that students who are racially discriminated against will have
a more negative experience in high school than students who are not. In addition, because
the learning environment becomes a hostile place for students who are discriminated against,
I hypothesize that this will result in lower ENEM scores.
The main questions to be explored are the following:
1. Does racial discrimination affect the overall quality of the learning environment in high
schools?
2. Is there any evidence that racial discrimination decreases grades achieved in the ENEM
exam?
3. Is there any evidence that racial discrimination has an impact on college admission?
The answers to these questions are essential if Brazil is to truly become a racial democracy.
Before outlining the specifics of this study, however, it is necessary to understand race
relations in Brazil and how higher education has been the privilege of a few. Chapter 2
therefore reviews the literature on the impact of race, race relations, and opportunities in
higher education. Chapter 3 focuses on the proposed study, discussing the model, the key
hypotheses, and the variables to be used. Chapter 4 is devoted to empirical estimation of

4
the model and its results. Chapter 5 looks at the characteristics of students approved at
the University of Sao Paulo by comparing their ENEM score to the national dataset and
Chapter 6 draws together the main conclusions.

CHAPTER 2
DISCRIMINATION AND EDUCATIONAL OPPORTUNITY IN BRAZIL
The history of Brazil is a history that has been written by whites, for whites, just asall of her economic, socio-cultural, military and political structures have been usurpedby whites for whites.
–Abdias Nascimento, Brazil: Mixture or Massacre?Essays on the Genocide of a Black People, 1989, 2-3 [Nascimento, 1989].
2.1 Discrimination in Brazil
Social status in Brazil is not just a function of wealth or occupation. It is also a matter of race
[Skidmore and Smith, 1997]. Historically in Brazil, European colonists and their descendants
enslaved and imported eleven times as many Africans as the United States [Telles, 2004]. In
the late nineteenth and early twentieth centuries Brazil also received millions of immigrants
from Europe and since then, light-skinned descendants have come to dominate their darker-
skinned compatriots through discriminatory practices [Telles, 2004].
In Brazil, there tends to be a strong correlation between race and social standing: most
on the top are white, most blacks are on the bottom, and mixed-bloods are largely in between
[Skidmore and Smith, 1997]. Unlike in the United States, race in Brazil refers mostly to skin
color or physical appearance rather than to ancestry. Since race is not purely defined on
biological grounds, it is open to interpretation [Skidmore and Smith, 1997]. This concept of
Brazilian race allows for multiple interpretations of certain characteristics that complicate
the distinguishing of those on the border of whiteness and brownness [Reiter and Mitchell,
2010]. To be black in Brazil one has to be totally black, in contrast to the United States
where partly black in ethnic origin means being black. Therefore mulatos, mesticos and
5

6
morenos, which are all different mixtures of whites and blacks, have a greater opportunity
for upward mobility than blacks; however, they also suffer from prejudice and bias.
Gilberto Freyre (1933) argued that Brazil’s continual miscegenation between whites,
African slaves and indigenous peoples was going to lead to a “meta-race” [Freyre, 1933],
the “Brazilian race”. This created the myth of democracia racial or racial democracy, the
belief that Brazil has escaped racism due to miscegenation. As a result, racism became
a taboo subject in Brazil. Brazilians imagine themselves as living in an anti-racist nation
and take pride in it, since it is proof of their status as a civilized nation [Guimaraes, 1995].
According to Nascimento (1989, 59),
Brazil as a nation proclaims herself to be the only racial democracy in the world, andmuch of the world views and accepts her as such. But an examination of the historicaldevelopment of my country reveals the true nature of her social, cultural, political andeconomic anatomy: it is essentially racist and vitally threatening to black people.[Nascimento, 1989]
Similarly, Skidmore (1974) argues that the white elite promoted the myth of racial democracy
to obscure very real forms of racial oppression.
The Brazilian state avoided any explicit race-based intervention, against or in favor of
blacks, for nearly a century [Telles, 2004]. During this time, the elite placed its faith in
branqueamento (whitening), presumed to be the inevitable result of miscegenation, with
the unequivocally racist intention of purging Brazil of the presumably negative influence of
black blood [Skidmore and Smith, 1997]. The Brazilian government not only promoted, but
subsidized the immigration of Italians, Germans, Portuguese and Spanish in order to whiten
the country and avoid the consolidation of an Afro-Brazilian majority after slavery [Johnson,
2008]. The white elite that stimulated European immigration held strong negative and racist
views about blacks. In fact according to Johnson (2008), fear of the impact that blacks would
have on the country’s progress contributed to the push for immigration. Attitudes based
on the slave past and post emancipation white racist views contributed to the widespread

7
public and private, formal and informal images of blacks and blackness as ugly, deficient,
suspicious, and less than human [Skidmore, 1993; Schwarcz, 1999]. As a result, many African
descendants have accepted the ideal of whitening and the myth of racial democracy, believing
that a lighter complexion and more European facial features or hair textures are superior to
dark skin and African features [Almeida, 2008].
Figure 2.1. Racial Distribution 2000 and 2010 IBGE
Nevertheless, racial discrimination and racial inequality have persisted and race has been
consistently used to exclude non-whites throughout Brazil’s history, despite rhetoric of in-
clusion [Telles, 2004]. Several recent studies have shown significant differences in income by
race (controlling for all other factors) drawing the conclusion that race is a separate and
significant variable in the Brazilian socio-economic system [Skidmore and Smith, 1997].
When discussing racial discrimination in the school environment, one not only alludes to
exclusion because of race, but also to bullying practices against a race group. Race-based
bullying is a serious form of racial discrimination that may consist of physical violence, verbal

8
assaults or excluding a classmate from group activities or ignoring the classmate. Although
racial bullying has received attention in developed countries, only one study was found that
examined bullying in Brazilian high school [DeSouza and Ribeiro, 2005]. However, this
study used a very small cross-sectional dataset (n=400), sampling students from two schools
on-line. Thus it suffers from external validity problems.
Ethnic bullying should be of a particular worry in multi-racial communities like Brazil
[Smith, 2002]. However, most of the studies of racial bullying are still divided on whether
ethnic differences cause bullying. While a study in Australia found no ethnic differences in
incidence of bullying [Nguy and Hunt, 2004] another in England found more victimization of
Asian students than of students of traditional English heritage [Eslea and Mukhtar, 2000].
A study in the U.S. found that only 8 percent of bullied adolescents thought that their race
or religion was the reason for bullying [Nansel et al., 2001].
A related hypothesis in the literature is that socio-economic status creates bullies or
victims [Berger, 2007]. Again, the literature is mixed. While a study of Dutch children
found no economic differences [Veenstra et al., 2005] another in Portugal found that lower
income students were more often bullied and victimized [Pereira et al., 2004]. A simple
statistical summary of my dataset will allow me to see whether students from lower socio-
economic status are more likely to be victims of racial discrimination than students from
higher income families in Brazil.
The purpose of this study is to examine racial discrimination, which includes racial
bullying, among seniors graduating from Brazilian high schools. The main advantage of this
study is that the dataset is very rich and one is able to analyze the attitudes and perceptions
of almost 3 million students. At the present time, I am unaware of any published studies
on racial discrimination or racial bullying in Brazil using the dataset here presented. It is
important to point out that the main goal of this study is not to find out the causes of racial

9
discrimination, rather the effect that it has on student’s learning abilities and perception of
the quality of their education.
2.2 Discrimination and Educational Opportunity
Education has long been viewed as a key factor in the pursuit of both democracy and
development. The lack of education is a factor that limits the development of a group within
their own society and helps maintain overall inequality [Beltrao and Novellino, 2002]. Thus
it is important to understand how Afro-Brazilians were excluded from higher education and
alienated within their own society in order to explain the racial disparities seen in Brazil
today.
Stohl and Lopez (1984) pointed out that institutions created during Brazil’s Iberian
colonization gave rise to a style of governance in which only a few European descendants
had great power and wealth in their hands while the Afro-descendants, although the majority,
were non-participants exploited by the elite [Stohl and Lopez, 1984]. When most institutions
were created in Brazil, the Afro-Brazilians were slaves and did not have access to wealth or
political positions, and as a consequence, blacks and people of dark skin are still at the bottom
of the social ladder. Carlos Hasenbalg (1979) argued that in regards to social mobility, the
differences between blacks and whites are due to discriminatory circumstances that emerged
after the abolition of slavery in Brazil. Opportunities were not equally distributed, and the
massive migration of Europeans resulted in the marginalization of former slaves [Hasenbalg
and Burglin, 1979]. Today, the Brazilian educational system provides clear evidence that
opportunities for ascension are still discriminatory, since it is not equally distributed in the
society, and studies have shown that despite democratization of access to education at lower
levels, access to higher education is racially unequal, even after controlling for education of
parents [Ribeiro, 2006].

10
In the 20th century, private education became the preferred option for the children of
elite groups. There is clear evidence in the literature showing that the overall performance
of students in public schools is much inferior to students in private schools [Guimaraes and
Sampaio, 2007; Akkari, 2001]. The reason is in the many flaws and qualitative as well as
quantitative weaknesses of public education [Akkari, 2001]. The present educational system
in Brazil is fragmented and organized in different regions in different patterns [Akkari, 2001].
The fact that a student studies in a private school indicates his/her economic status, and
is positively related to the level of his/her parents’ education. The income of a student’s
family at a private school is on average three times the income of a student in a public school
and parents of children in a private school have on average four or more years of education
than the parents of children in a public school. These two factors result in a favorable
environment for the intellectual development of the higher status student [Guimaraes and
Sampaio, 2007]. In addition, families who take their children from public high school and
enroll them in private high school greatly enhance their children’s chances of passing the
vestibular [Castro, 1997]. It is clear that there is a great disparity between the material,
curriculum, quality and infrastructure of public and private school facilities in Brazil. As
a result one can see a great social and racial disparity in the education system in Brazil
and its contribution to social inequality [Cunha, 1985; Cury, 1989; Saviani, 2005; Guimaraes
and Sampaio, 2009]. Researchers like Cury (1989) and Guimaraes and Sampaio (2009) have
denounced this disparity between the public and private sector, stressing that educational
opportunity has become stratified by social class. They argue that the state is giving power
to hegemonic groups in Brazilian society and not allowing access to participation for the
poorer groups by making it difficult for them to go to college and eventually move up the
social status ladder [Cury, 1989].
What is even more problematic is the racial disparity among students from public and
private schools. The families of students in private school have higher income and the

11
percentage of whites and blacks is respectively 56.58 percent and 5.63 percent, with 32
percent being brown. In public school the percentage is 13.6 percent for black, 34 percent for
white and 45 percent for brown [Guimaraes and Sampaio, 2007]. As argued by these authors,
there is clear evidence that the performance of students in public schools is much inferior to
students in private schools [Guimaraes and Sampaio, 2007]. The majority of students who
attend public schools are non-whites and as a consequence of the lack of quality in public
schools they perform below the average on the vestibular and are not admitted into public
universities [Telles, 2004]. Therefore wealthy students, because of their superior private pre-
college education, get into the best universities, and these are public. Wealthy students
are also admitted disproportionately into the more prestigious and financially rewarding
disciplines such as medicine, law and engineering [Telles, 2004]. When they are admitted
to prestigious universities, poorer and non-white students are more likely to be sorted into
fields, such as education and the humanities. When they are not, poorer students often
must pay for their education in an inferior expensive private college [Telles, 2004] and in
most cases they enter the labor force and give up pursuing a higher education. Thus, having
the majority of black and brown students in the public sector is very disturbing when the
literature suggests that they will not perform as well in the vestibular as the students from
the private sector who are mostly whites.
Due to the large number of black and dark-skinned students in the public schools and
the fact that most of them will not go to college because of the difficulty of the vestibular, in
2001 the Brazilian government, hoping to address racial inequality, implemented affirmative
action. This caused huge controversy because, as Mala Htun (2004) argues, Brazilians have
thought of themselves not as people of distinct races but as multi-coloured national race.
Htun (2004) argues that even though politicians overwhelmingly ignored the issue in the
past, the policy was passed because of the great number of people that were convinced by
the idea that racism is pervasive and something needed to be done about racial inequality.

12
Blacks are almost never seen amidst the country’s political, economic, and media elite. In the
Brazilian Congress, for example, only 9 out of 513 deputies (2 percent) actively identified
themselves as black in 2003 [Htun, 2004]. This is a direct result of the lack of superior
education and lack of opportunity for blacks and people of dark skin. Only by having access
to universities will they be able to move up the social ladder and break the poverty cycle
they have been trapped in.
Some scholars have deemed affirmative action to be inappropriate for Brazil’s style of
racism, which is not structural. Correa Coelho (2001) has argued that racist acts should be
punished, but that the problem requires social policies directed at the poor not at a race
group [Correa Coelho, 2001]. De Goes (2001) argues that many fear that quotas are based
on U.S. race relations and policy, and that they will introduce a false racial division to Brazil
that would generate greater injustice. However, injustice against Afro-Brazilians is evident
in many sectors of the society, and many have deemed the measure appropriate. As scholar
Peter Fry (2000, 100) said:
For the first time since the abolition of slavery the Brazilian government has not onlyrecognized the existence and inequity of racism but has chosen to contemplate the passageof legislation that recognizes the existence and importance of distinct racial communitiesin Brazil. [Fry, 2000]
In addition, former President Fernando Henrique Cardoso was a major supporter of the
policy. Cardoso’s Ph.D. dissertation as a sociologist explored race relations in Brazil. During
a public speech in December 19, 2001 he said:
Everyone knows that this is an issue I’m very involved in, because I spent several yearsof my life at the beginning of my career as a sociologist studying blacks and racialdiscrimination among the poorest sectors of the country. From Sao Paulo to Rio Grandedo Sul, at that time, the 1950s, I don’t think there was a favela that I didn’t visit, notjust to study, but also to portray a Brazilian reality that elites ignored in those days.Brazilians’ lives [were] wrapped in the illusion that this was a perfect racial democracywhen it was not, when even today it isn’t. [Cardoso, December 19, 2001]

13
Never before had a president recognized that Brazil was not a racial democracy and
denounced the prejudice against blacks publicly. The Brazilian state avoided any explicit
race-base intervention, against or in favor of blacks, for nearly a century [Telles, 2004].
Nevertheless, racial discrimination and racial inequality have persisted and race has been
consistently used to exclude non-whites throughout Brazil’s history, despite rhetoric about
inclusion [Telles, 2004]. The main problem with race-based policies is with those who lie in
the middle of the color spectrum and are defined as morenos (browns with lighter-skin) or
mulatos (browns with darker-skin). However, a claim for blackness must be accepted since
there is no rule about who is black in Brazil [Telles, 2004].
The passionate reactions against affirmative action in Brazil show a picture of the struggle
over inherited and normalized privilege, as many white Brazilians perceive their access to free
university education not as a privilege exercised over centuries and bought with the exclusion
of the non-white majority, but as their right [Reiter and Mitchell, 2010]. The truth is that
to become democratic and to rescue the dignity of those who have unfairly been privileged,
and thus save the moral grounding of the entire community, more and more Brazilians have
begun to openly address the injustices produced by racism [Reiter and Mitchell, 2010]. Those
against policies such as affirmative action need to realize that defending historically inherited
privilege has no moral grounding and can only lead to social inequality.
Today, most students who graduate from public high school in Brazil are never going
to be able to attend college. The fierce competition of the vestibular examination in public
universities and lack of financial means to have a private college education, make access to
college a far away dream. Furthermore, opportunities for black students are slim in Brazil,
as the ideal of racial democracy proves to be a founding myth of Brazilian nationality and
can only be denounced as myth [Guimaraes, 1995]. Studies by Andrews [1992]; Guimaraes
[2003]; Hasenbalg and Burglin [1979]; Lovell [1989]; Silva [1980]; Telles [1992, 2004] and many
others reveal the truth behind Brazilian racial democracy. They show profound inequalities

14
that separate blacks from other groups and reveal a de facto job, residential, and educational
segregation between white and non-white in Brazil.
2.3 A Closer look at the ENEM
In 1998, the Exame National do Ensino Medio (The National Exam of Secondary Education-
ENEM) was created to assess the performance of students as they conclude high school and
analyze the quality of their education and whether or not the schools had prepared their
students for college. Before the ENEM examination, the only way of assessing high school’s
was through graduation rates.
The ENEM exam is given yearly to graduating seniors and high school graduate students
in Brazil. The exam was created by the Instituto Nacional de Estudos e Pesquisas Educa-
cionais (National Institute of Studies and Educational Research- INEP). From 1998 to 2008
the exam was divided into two parts: an objective part with 63 multiple choice questions,
and an essay part. However, in 2009 after the Sistema de Selecao Unificada or SISU was
developed by the Brazilian Ministry of Education to select a number of candidates to public
universities using the ENEM exam as the only admission criteria, the exam changed and
now has 180 multiple choice questions in five main areas: natural sciences, human sciences,
math, Portuguese, foreign language and an essay [Brazilian Ministry of Education, 2011].
Since 2001, many universities have used the ENEM as a bonus to the vestibular. With the
SISU program, some public universities like the the Federal University of Rio de Janeiro
abolished the vestibular and use ENEM as its only admission exam. Although the ENEM is
not a mandatory exam, as universities started to give bonuses on the vestibular to students
who performed well on the ENEM, the number of students taking the exam grew rapidly as
shown in Table 2.1 and grew drastically after the implementation of the SISU program in
2009.

15
Table 2.1. Number of students registered per year
Year Students Registered
2012 6,497,466
2011 6,221,697
2010 4,611,441
2009 4,576,126
2008 4,018,070
2007 3,568,592
2006 3,742,827
2005 3,004,491
2004 1,552,316
2003 1,882,393
2002 1,829,170
2001 1,624,131
2000 390,180
1999 346,953
1998 157,221
The National Institute of Studies and Educational Research (INEP) provides a rich data
resource available on-line using the individual students who take the ENEM examination as
units of analysis. The data include the scores that each individual made on the ENEM as
well as the answers to a socio-economic questionnaire which contains three main objectives:
to learn the socio-economic status of the students and their families, to know the perception
of students regarding their high school education, and to learn the students’ opinions on
general subjects, their interests and future plans.
Many researchers have used this dataset to analyze different aspects of the student’s life
and perceptions during high school. Asinelli-Luz and Cunha (2011) used the dataset to
learn the perceptions of homophobic discrimination among High School graduates in Brazil
from 2004 to 2008. Their research found that students who were discriminated against said
that their overall high school experience was much more negative than students who had
16
not been discriminated against because of their sexual orientation [Asinelli-Luz and Cunha,
2011]. This was the only study in the literature that used the ENEM database to see the
perception of students regarding a specific type of discrimination in high school. With such
a vast and rich dataset, it would be possible to analyze racial discrimination and attitudes
towards people of different color and ethnicity in Brazil using the same dataset.
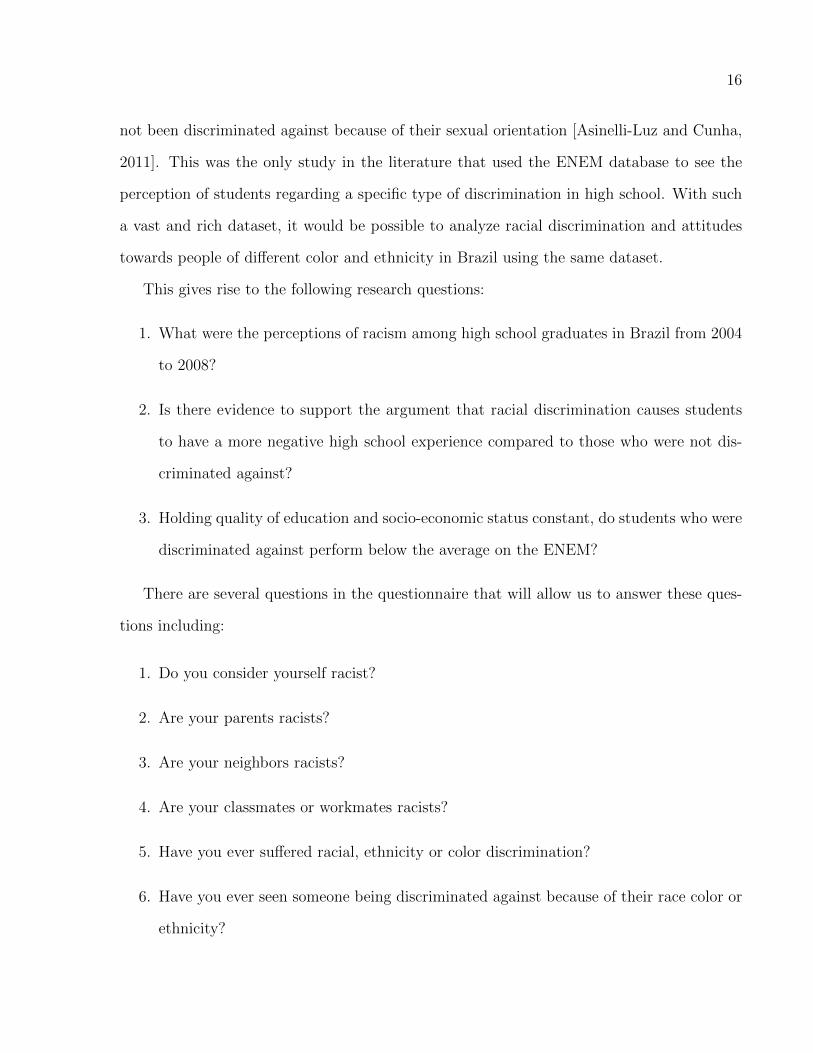
This gives rise to the following research questions:
1. What were the perceptions of racism among high school graduates in Brazil from 2004
to 2008?
2. Is there evidence to support the argument that racial discrimination causes students
to have a more negative high school experience compared to those who were not dis-
criminated against?
3. Holding quality of education and socio-economic status constant, do students who were
discriminated against perform below the average on the ENEM?
There are several questions in the questionnaire that will allow us to answer these ques-
tions including:
1. Do you consider yourself racist?
2. Are your parents racists?
3. Are your neighbors racists?
4. Are your classmates or workmates racists?
5. Have you ever suffered racial, ethnicity or color discrimination?
6. Have you ever seen someone being discriminated against because of their race color or
ethnicity?

17
Responses to these questions allow us to look at racism through three different lenses: the
victim of discrimination, the witness of discrimination, and those that consider themselves
racists and would prefer not to be involved with people of other color or ethnicity. The
ENEM database allows for comparison between different sectors, e.g type of schools (public
vs. private), as well as between regions (municıpios), allowing us to see where racism is more
prevalent.
2.4 Data Availability and Source
The dataset that I will use to test my hypotheses was created by the National Institute of
Educational Research (INEP). It is a socio-economic questionnaire that provides yearly data
on the students who took the ENEM examination.
The dataset has individual students’ answers to the socio-economic questionnaire, as
well as their score on the ENEM, permitting students to be used as the unit of analysis.
Data for the years of 2004 to 2008 are available on-line to download and are used in the
investigation.1
1The rough data can be found at: http://portal.inep.gove.br/basica-levantamentos-acessar [INEP, 2008]

CHAPTER 3
MODEL SPECIFICATION AND VARIABLE SELECTION
The years of racial oppression in the slave-owner Brazilian society, left scars that reflectin the discrimination of Afro-descendants.[...] The injustice of the system is absolutelyintolerable.
–Luiz Fux, Justice of the Brazilian Supreme CourtDeliberation on Affirmative Action Decision, 2012 [Lux, 2012].
The purpose of this study is to determine how racial discrimination affects the quality of
education and ENEM score. Since educational quality and performance on the ENEM
examination also may be affected by, other variables, the effect if discrimination is explored
in the context of several control variables including race, age, geographic region, gender,
family income, parent’s educational level, and type of school (public vs. private). Because
I am suggesting that discriminated students have a more negative experience in high school
and lower test scores, the hypothesized causal relationship runs from discrimination to test
score and experience. Thus, I run the model twice to address two tentative hypotheses:
1. Discriminated students have a more negative experience in high school than students
not discriminated, other things being equal.
2. Discriminated students have lower ENEM scores than students who were not discrim-
inated, other things being equal.
This allows me to look at the effect that discrimination has on the students’ performance
at the ENEM examination.
Then using data provided by the University of Sao Paulo (USP), I look at the charac-
teristics of students who were admitted to USP and how they compare with students who
18

19
took the ENEM examination. I am able to do that by looking at the average ENEM score of
students who were accepted into USP, and compare that against other characteristics that
I controlled for in my examination. Thus, I am able to see if race plays any role in college
admission.
The two models tested therefore have the following form:
Qualityi = Ximβim + εi (3.1)
The dependent variable Qualityi is a measure based on individual responses to the ques-
tion “What score would you give to the overall experience you had in high school?” Students
were asked to give a score ranging from 0 (low) to 10 (high). This first model, analyzes the
perception of quality of education and how it is affected by different independent variables
in the X matrix.
The second model is:
GradeENEMi = Ximβim + εi (3.2)
The dependent variable GradeENEMi is composed of the individual’s score on the ob-
jective part of the ENEM exam that had 63 questions worth 100 points. The performance is
divided in four categories: 1 = insufficient (scores between 0 and 20 included), 2 = regular
(scores between 20 and 55 included), 3 = good (scores between 55 and 85 included) and
4 = excellent (scores between 85 and 100 included). This second model analyzes how the
performance of students on the ENEM score is affected by different independent variables
in the X matrix.
The main independent variable is measured based on the answers to the question “Have
you ever suffered racial or ethnic discrimination?” (coded 1 = yes, 0 = no). Social scientists
have acknowledged that measuring racial discrimination is not an easy task, Pager and Shep-

20
herd (2008) argue that racial discrimination is a fascinating yet frustrating topic because of
the evasiveness of its measures [Pager and Shepherd, 2008]. In this study, racial discrimi-
nation is measured by the perception that students had of being discriminated against or
not, captured by their answers to that particular survey question and through statistical
analyzes. Although relying on perceptions can underestimate or overestimate discrimination
they are an important way to capture cognitions, norms and values [Pager and Shepherd,
2008; da Silva and Reis, 2011]. Racial discrimination is also measured indirectly by compar-
ing racial groups performance on the ENEM exam.
The data used to estimate Model 3.1 and Model 3.2 comprises a questionnaire given to
i = 7.5 million students before taking the ENEM exam. The questionnaire was designed
by the Instituto Nacional de Estudos e Pesquisa [INEP, 2008]. The observations are all
high school graduates who took the ENEM examination throughout the 27 states of Brazil
during 2004-2008. These data are filtered and only students with the following characteristics
are analyzed: (1) students who completed the Socio-Economic Questionnaire, (2) took the
objective section of the exam, and (3) graduated during the 3 years prior to taking the exam
or will graduate on the year of the exam or after. After filtering the data, the number of
students was still very large since a period of 5 years is covered.
The matrix X contains up to m = 18 student level variables shown to be associated with
high scores and quality of education. They are listed in Table 3.1.
3.1 The Socio-Economic Questionnaire and Participants
Table 3.2 provides a summary of the students background characteristics. All students are
required to fill out a socio-economic questionnaire upon registering for the ENEM exam.
The Socio-Economic Questionnaire was created and designed by the Instituto Nacional de
Estudos e Pesquisas Educacionais Anısio Teixeira (INEP) in cooperation with the Brazilian

21
Table 3.1. Student-level variables included in X.
Variable Definition and Source
Instituto Nacional de Estudos e Pequisas
Victim Have you ever suffered racial or ethnic discrimination? 1(yes); 0(no)
Witness Have you ever witnessed racial or ethnical discrimination? 1(yes); 0(no)
Racist Do you consider yourself racist? 1(yes); 0(no)
Racist environment
Home Are your parents and/or friends racist? 1(yes); 0(no)
School Are your classmates racists? 1(yes); 0(no)
Neighborhood Are your neighbors or acquaintances in general racist? 1(yes); 0(no)
Non-white Non-white (Black, Mulatto): 1(yes); 0(white)
Female 1(female); 0(male)
Age Student’s age
Family Income All wages and other incomes by monthly minimum wage: 0 (low) to 7(high)
Public School Type of high school attended: 1(public school); 0(private school)
Prep Course Did you do a preparatory course for the vestibular examination? 1(yes); 0(no)
Father education
High School Graduate 1(yes); 0(otherwise)
Some College 1(yes); 0(otherwise)
College Graduate 1(yes); 0(otherwise)
Unknown Student do not know father education 1(yes); 0(otherwise)
Mother education
High School Graduate 1(yes); 0(otherwise)
Some College 1(yes); 0(otherwise)
College Graduate 1(yes); 0(otherwise)
Unknown Student do not know mother education 1(yes); 0(otherwise)
Married 1 (married or living together as married); 0(otherwise)
Children 1(have children); 0(no children)
Work Did you work during high school? 1(yes); 0(no)
Southeast If students are from the following states: SP, RJ, MG and ES 1(yes); 0(no)
Urban Location of school 1(urban); 0(rural)
Favela
Pavement Is your house on a paved street? 1(no); 0(yes)
Water Does your house have running water? 1(no); 0(yes)
Location Urban

22
Ministry of Education. The INEP allows anyone to download the questionnaire for each
year, along with a codebook, the raw data, the ENEM exams and solutions for each year at
their website (www.inep.gov.br). Although the ENEM Socio-Economic Questionnaire has
changed over the years, for the years of 2004-2008 all questions relevant for this dissertation
were exactly the same. Once the student registers for the ENEM exam, a Socio-Economic
questionnaire along with a Student Manual is sent to the candidate’s home. The students
are asked to fill out the questionnaire and turn it in at the place of the examination before
taking the ENEM exam. The Questionnaires for the years of 2004-2008 have a total of 223
multi-choice questions, divided into five sections: ‘You and Family’, ‘You and Work’, ‘You
and School’, ‘Values’, and an extra section only for students who had already graduated high
school. In 2010, the socio-economic questionnaire was drastically changed and reduced to
only 25 questions. As a result, questions about discrimination were excluded [INEP, 2008].
A total of 7.5 million students registered for the ENEM exam between 2004-2008. How-
ever, after filtering the data only 2,489,509 students remained in the study. Respondents
had a mean age of 19, with ages ranging from 16 to 26. The sample was 55.46 percent white
and 58.7 percent female.
Table 3.2. Background Characteristics of ENEM Students (n=2,489,509)
Variable Mean S.D.
Age 18.8905 2.661729
Non-white .4453914 .4970091
Female .587364 .4923085
Married .0856165 .2797969
Public School .8930705 .3090237
Family Income 2.459715* 1.104913
Urban .9840912 .1251226
Family income was divided into eight categories, see section:‘Other Personal and Family Background Characteristics’ belowfor more details.

23
Looking at the summary statistics for the participants, some interesting patterns ap-
peared. The majority of students who were victims of racial discrimination were non-whites,
as illustrated by Figure 3.1. As discussed in Chapter 2, many Brazilians who are of mixed
race but look white identify themselves as ‘white’, which could explain why 33 percent of
‘whites’ were discriminated against as shown in Figure 3.1.
Students who were victims of racial discrimination seemed to score in lower categories of
the ENEM exam as shown by Figure 3.2 and students who were victims of racial discrimi-
nation were more likely to give a low score for the quality of their education in high school
as illustrated in Figure 3.3.
3.2 What is Discrimination?
Racial discrimination refers to unequal treatment of persons or groups on the basis of their
race or ethnicity. There are conceptual differences between discrimination, racism (ideolo-
gies), prejudice (attitudes) and negative stereotyping (beliefs) [Pager and Shepherd, 2008].
Brazilians, in general, acknowledge the existence of racial inequality, but not so many are
willing to accept the existence of racial discrimination (which would be the active exclu-
sion of blacks from resources and institutions) and racism (the existence of a racial social
structure with whites at the top) [da Silva and Reis, 2011]. In this study, both racial dis-
crimination and racism are used as synonyms without distinction. In the two models there
are four variables that address the issue of discrimination in Brazilian high schools: victim,
witness, racist and racist environment. The variable victim is basically students who felt
that they were racially discriminated in high school. Variable witness represents students
who saw someone being discriminated against because of their race or ethnicity in the school
environment. The variable racists are students who claim to be racist as show in Table 3.3.
A chi-square test indicates that there is a statistically significant relationship between
racist students and their race (chi-square with one degree of freedom = 166.8628, p = 0.000).

24
Figure 3.1. Race of Victims
Figure 3.2. Victims by ENEM score
Figure 3.3. Victims Perception of Quality of Education

25
Table 3.3. Racist Person by Race
Racist Person White Non-white Total
No 1,332,978 1,073,754 2,406,732
Yes 47,725 35,052 82,777
Total 1,380,703 1,108,806 2,489,509
When analyzing the victim and witness variables, it is important to acknowledge that the
perception of being discriminated against can be different from person to person. However,
even though perceptions may vary, race is still considered an element of inferiority in the
school environment to those identified as black, both public and private schools [Lima et al.,
1998; dos Santos Cavalleiro, 2000; Botelho, 2000; Neves, 2002; Cabral, 2007]. Pejorative
name calling, sometimes disguised as ‘loving’ nicknames, identify black students as ‘negao,
neguinha, negona, nega, aquele moreno, macaco, piche, asfalto, alemao, maizena, xuxa, etc’
or ‘big black, little black woman, big black woman, nigger, that black, monkey, pitch, tar,
german, corn-starch, blond, etc’1 [Cavalleiro, 2005]. Depending on the student, s/he can find
name calling as described above as a ‘normal practice’ due to frequent occurrence in daily
discourse but some can find it offensive.
According to Guimaraes (2003) racial insults, as described above, make the insulted per-
son return to an already historically constituted inferior place. The attribution of inferiority
consists of apposition of color, as well as negative qualities or properties relating to physi-
cal constitution, morality, social organization, habits of hygiene and humanity to a certain
group of people considered ‘negras ’ or ‘pretas ’ (very black) [Guimaraes, 2003]. In Brazil
‘racial inferiority’ is constituted based on the following stigmas: ‘a supposed slave essence;
dishonesty and delinquency; precarious housing; moral depravity; lack of religiosity; lack of
hygiene; and incivility, bad manners or illiteracy.’ These stigmas are repeatedly associated
with people’s black color [Guimaraes, 2003].
1The English translation of these slurs are meant to give the reader a very rough idea of meaning, withoutreproducing the Portuguese colloquial.

26
In such a hostile school environment, which results in an education that devaluate and
disrespect racial diversity in the classrooms, there are few opportunities for success [Silva,
2001; Cavalleiro, 2005]. This indicates that, even in the school environment, black children
have to cope and learn to live in racist and discriminatory relations with other students.
Because many black students are used to being called a pejorative name, many do not
perceive this as discrimination. A survey study by Yvonne Maggie (2006) in twenty-one
high schools in Rio de Janeiro observed that racial discrimination mainly happens among
students through name calling, swearing, and jokes [Maggie, 2006] and can easily be disguised
as ‘normal’ practice. Reis and Da Silva (2011) argue that although environmental racism
(practice by friends, family or neighbours) is common in Brazil, the initial tensions that it
causes tend to disappear or at least become silent over time, which might explain why some
people do not recognize such incidents as discrimination.
As a result, there is often a disparity between the number of students who felt that they
were being discriminated against and students who witness a discriminatory occurrence.
In this study the witness variable indicates students who claim to have witnessed another
student being discriminated against because of their race and ethnicity. The data indicate
that non-white students were slightly more likely to say they witnessed discrimination than
white students. This supports what Reis and Da Silva (2011) found in their study: African
Brazilians often accuse their white friends of being race insensitive and not aware of racial
discrimination in everyday life as described in one incident:
We (interviewee and white university friends) were in a group around a table in a bar,and I was the only black. A friend, who I really like, but on that day was very unpleasantsaid: ‘You are the black with the whitest soul I know,’ and that hurt me. I ended uparguing with him and leaving the bar, really upset with him. He called me later, and Itried to explain, but he thought I was joking. And I was not...Since then, nobody hastalked about it. This topic is far too sensitive. [da Silva and Reis, 2011]
The data also shows an interesting pattern on the reporting of racial discrimination
that appears to be significant. The number of students who said that they saw racial

27
discrimination was on average five times more than the number of students who admitted
to being discriminated against as shown in Figure 3.4.
Figure 3.4. Mean for Victims vs. Witnesses per year
This could indicate a huge under-reporting of racial discrimination by the students. Some
psychology studies have suggested that because discrimination appears to adversely impact
self-esteem and perceptions of control, minority group members, especially those of low
status, are likely to minimize and deny experiences of discrimination [Williams et al., 2001;
Ruggiero and Taylor, 1997; Ruggiero and Major, 1998; Crosby, 1984].
Evidence was also found to support the Pereira et al. [2004] study which found that lower
income students were more often bullied and victims of discrimination [Pereira et al., 2004].
The data indicates that students from lower income households are more likely to be victims
of racial discrimination as shown in Figure 3.5, but only to a certain point. Wealthy students,
whose family monthly income exceeds fifty minimum monthly wages, roughly an average of
R$17,000 reais, appear to be more racially discriminated against than other children.
Although the variables victim, witness and racist, are used in the school context, the
variable racist environment is used outside of the school environment. This variable il-
lustrates whether or not the student lives in a non-discriminatory environment. Regardless
of the race of the student, living in a racist environment can affect a student’s self-esteem.

28
Figure 3.5. Mean for Victims vs. Family Income per year
A study by da Silva and Reis [2011] found that it was very common for blacks to report
racism in their own families, or in their partner’s family, and although most claimed to have
multiracial friendships, they also claimed that some of their friends were racist or racially
insensitive. This analysis will be able to indicate whether a racist environment plays a role
in students’ educational success and experience in high school.
3.3 How to Measure Racial Discrimination?
Extensive research by social scientists trying to address the question of discrimination has
resulted in several techniques to isolate and identify its presence and to document its effects
[Blank, 2004]. Although every method has limitations, together some of these techniques
provide insightful results to help us understand how and to what degree discrimination mat-
ters in the lives of African descendants in Brazil. Thus, this study combines both perceptions
of discrimination and statistical analysis techniques to measure racial discrimination among
students who took the ENEM exam.

29
3.3.1 Perceptions
One common technique used to measure discrimination involves asking racial minorities
about their experience with discrimination in the workplace, school environment, in their
search for housing and in other everyday social settings [Schuman, 1997]. These studies
produce patterns of discrimination, which are highly important since a study by Kessler
et al. [1999] found that those who perceive high levels of discrimination are more likely to
experience depression, anxiety and other negative health outcomes. It may also lead to
diminished effort or performance in education or the labor market giving rise to negative
outcomes [Ogbu, 1991; Steele, 1997; Loury, 2002]. In this study, when analyzing the variable
victim and witness I rely solely on the student’s perception of racial discrimination. It is,
however, unclear to what extent perceptions of discrimination depict the reality. Studies
that use perception to measure racial discrimination may over or underestimate the actual
incident of discrimination.
3.3.2 Statistical Analysis
The most common approach to measuring discrimination is by analyzing inequality outcomes
between groups. This approach looks to the possible consequences of discrimination in the
unequal distribution of housing, employment or other social and economic resources [Pager
and Shepherd, 2008]. Using large-scale datasets, like the ENEM database, researchers can
identify systematic disparities between groups and predict their direction over time. In
statistical models discrimination is measured as the residual race gap in any outcome that
remains after controlling for all other race-related influences. The limitation of this approach
is that it is difficult to account for many factors relevant to unequal outcomes. There is
always a possibility that the disparity attributed to discrimination may in fact be explained
by another unmeasured cause. Although this approach is used in this study, it is important
to highlight characteristics such as motivation, intelligence, and interpersonal skills that can

30
be important to achieving higher test scores and to having a better experience in high school
that are not measured. These are characteristics that are often difficult to capture with
survey data, yet they may be important to the analysis. According to Blank [2004] although
statistical models are an important approach to the study of race inequality, researchers
should use caution in making causal interpretations of the indirect measures of discrimination
derived from residual estimates.
3.3.3 Experimental Approaches
According to Pager and Shepherd [2008] field experiments are very effective in measuring
discrimination because they allow researchers to measure causal effects more directly by
presenting carefully constructed and controlled comparisons. These experiments, referred to
as audit studies, allow researchers to carefully select, match and train individuals to play
the part of a job/apartment-seeker or consumer [Pager and Shepherd, 2008]. By presenting
equally qualified individuals who differ only by race or ethnicity, researchers can assess the
degree to which racial considerations affects access to opportunities [Pager and Shepherd,
2008]. This approach offer a direct measurement of discrimination in real-world contexts
and has proven to be effective in showing evidence of racial discrimination in the context
of employment [Pager, 2007], housing searches [Yinger, 1997], applications for insurance
[Wissoker et al., 1998], car sales [Ayres, 1995], home mortgages [Turner, 1999], hailing taxis
[Ridley et al., 1989] and even the provision of health care [Schulman et al., 1999]. However,
this method often suffers from internal validity due to experimenter effects, for example. In
addition, some of the shortcomings of this approach are that it is very limited, expensive,
difficult to implement and can only be used in very specific situations. For example, for
measuring discrimination in the accessibility to Brazilian universities I cannot use the exper-
imental approach, because the vestibular or the ENEM exam are the only two criteria for
admission. Although, this model would not be appropriate for the Brazilian case, it could

31
be used in American universities where equally qualified students who differ only by race
could apply for the same admission slot.
3.4 Racial Classification
Because the definition of race in Brazil is based on the color of the skin and not on biological
factors, this study will merge blacks and browns (negros, mulatos or morenos) under the
same category. Many other researchers have merged these two groups, since their statistical
socioeconomic characteristics are very similar [Telles and Lim, 1998]. In addition, in Brazilian
racial relations, a mulato is always identified with his black origins. Even a lighter skin
mulato, who could pass as white, but has an African phenotype such as curly hair or a flat
nose, can be said to have a ‘foot in Africa’ [Osorio, 2008]. Regardless of the fact that many
mulatos claim to be white, other people judging their appearance may not agree with that
self-classification. Thus mulatos and blacks suffer from the same type of discrimination and
can be classified as Afro-Brazilians because of their heritage. Therefore, since both groups
suffer similar prejudice and are very homogeneous in socioeconomic characteristics it makes
sense to analyze them together as non− whites [Ribeiro, 2006].
The racial classification non-whites should, in theory, also include indigenous people and
Asians (yellow). However, because these groups are so small in Brazil and because the Asian
group tends to be privileged in its socio-economic characteristics, they will not be considered
in this analysis.
3.5 Regional Differences
In order to better understand the effects of racism in Brazil, regional disparities need to be
taken into consideration. Brazil is the fifth largest country in the world, with a vast territory
that is very diversified both in terms of racial composition as well as with socioeconomic
characteristics. Brazil has 27 states (including a federal district) but it is common to aggre-
gate the states into five macro-regions. The Southern region of the country, where most of

32
Figure 3.6. Distribution of Blacks by Regions - IBGE (National Household Survey, 1996-2005)
the European immigrants settled during the 19th and 20th centuries has a larger proportion
of whites than the northern region as shown in Figure 3.6.
Besides racial composition, the regions differ in terms of income levels. According to
a United Nations Development Program study by Osorio [2008] in the period of 1996 to
2005, the poorest region of Brazil was the Northeast, followed by the North region, while
the Central-West was the third poorest region, and the Southeast was the richest region in
all years. Relevant to this study is the fact that whites in the Southeast and Central-West
have an income level above the national average2 while the income level of blacks in those
regions is only just above half of the national average as shown in Figure 3.7. Most striking
is the fact that the ratio between the income average of whites and blacks is close to two in
all regions and for all years.
Due to these regional disparities, macro-regions will be controlled for through a southeast
variable. In addition, I will control for rural and urban regions with an urban variable. The
Brazilian states are listed in Appendix A and the macro-regions are shown on Appendix B.
2The national average income was set at 100 for both years.

33
Figure 3.7. White/Black Income by Regions - IBGE (National Household Survey, 1996-2005)
3.6 Type of School and Cursinho Pre-Vestibular
As discussed in Chapter 2, there is a great racial disparity among students from public and
private schools. The majority of students who attend public schools are non-whites and
as a consequence of the lack of quality in public schools they perform below the average
on the vestibular and are not admitted into public universities [Telles, 2004]. On average
families of students in private school have higher income and the percentage of whites and
blacks in private school is respectively 56.58 percent and 5.63 percent, with 32 percent being
brown. In public school the percentage is 13.6 percent for black, 34 percent for white and
45 percent for brown [Guimaraes and Sampaio, 2007]. Because there is clear evidence that
the performance of students in public schools is much inferior to students in private schools
[Guimaraes and Sampaio, 2007] I control for type of school. In addition, wealthier students
are able to afford preparatory courses that are specifically designed to prepare students to
take the vestibular exam. These prep courses are called curso pre-vestibular or just cursinho
and can be very expensive. Having access not only to private schools but also to a prep
course gives students a better chance of going to a public university. Thus, I also control for
attendance in prep courses.

34
3.7 Other Personal and Family Background Characteristics
Other explanatory variables include gender, age, parents educational levels and family income
(both measures of socio-economic status), marital status, having children and working. When
mother and father educations were listed as unknown, a dummy variable was created for the
missing data. A favela variable was created to identify students who live in favelas based
on three criteria, students who lived in an urban area, and had no running water and no
pavement on the street of their homes.
In Brazil, income is reported monthly and is set by monthly minimum wage. In 2012, one
minimum wage was reported as R$622 reais which is roughly equivalent to $305 dollars as
of July 11, 2012 [Tributario, 2012]. Thus, the variable income was divided into 8 categories
by minimum wages in the ENEM Questionnaire: No income, less than one minimum wage,
between one and 2 minimum wages, between 2 and 5 minimum wages, between 5 and 10
minimum wages, between 10 and 30 minimum wages, between 30 and 50 minimum wages
and more than 50 minimum wages. Table 3.4 shows the values for one minimum wage for
the past 8 years.
Although the data set covers 5 years it is not a panel study: the individual students
vary each year. Increasingly, micro data sets in the form of a series of repeated cross-section
sample surveys are available to social scientists and generally these data sets are grouped
together for analysis.

35
Table 3.4. Values Equivalent to One Minimum Wage by date
Date Monthly R$ Daily R$ Hourly R$
01/01/2012 622.00 20.73 2.83
03/01/2011 545.00 18.17 2.48
01/01/2011 540.00 18.00 2.45
01/01/2010 510.00 17.00 2.32
01/02/2009 465.00 15.50 2.11
03/01/2008 415.00 13.83 1.89
04/01/2007 380.00 12.67 1.73
04/01/2006 350.00 11.67 1.59
05/01/2005 300.00 10.00 1.36
05/01/2004 260.00 8.67 1.18
Source: Tributario [2012]

CHAPTER 4
EMPIRICAL ESTIMATION OF THE MODEL
Racism is the key to understand and overcome increasing poverty and social inequalitiesin Brazil.
–Mario Lisboa Teodoro, Director of the Research and Applied Studies Institute(IPEA)Teodoro [2007]
4.1 Data and Results for Regression Models
My main data source was the ENEM Socio-Economic Questionnaire answers for the years of
2004-2008. The model was run twice. Model 3.1 looked at the quality of education and how
discrimination influences students’ responses, while Model 3.2 examined how the student’s
ENEM score was affected by discrimination. Both models included identical variables on
perceptions of discrimination, family, work and individual characteristics. The individual
students were my unit of analysis and n = 2, 489, 509 students.
Since both dependent variables are ordinal, I first used ordered logit regression models to
analyze the data. However, I also ran OLS estimates with the same specifications to compare
the values of the coefficients.1 This has been a common practice, especially in the ‘Happiness’
literature, where happiness is measured on a scale of 1 to 10 and is a categorical variable.
As suggested by Dr.Okulicz-Kozaryn, authors seem to agree that both estimation methods
yield similar results [Ferrer-i Carbonell and Frijters, 2004; Blanchflower and Oswald, 2011;
Rodrıguez-Pose and Maslauskaite, 2012].
1Because quality of education (quality) and ENEM score (score) are measured as categorical variables,ordered logit is the correct econometric approach. Comparing the results of ordered logit and OLS, we getalmost identical results and coefficient values.
36

37
The results for the first model, looking at the quality of education, are shown in Table 4.1.
Ordered Logit results can be interpreted as follows: positive coefficients increase the chance
that the subject will be observed in a higher category, and negative coefficients increase the
chance that the subject will be observed in a lower category. Note significance levels. Most
coefficients are significant at the .001 level.
Table 4.1. OLS and Ologit Quality of Education
Ordered Logit OLS OLS Robust
Victim -0.180*** -0.198*** -0.198***
(0.00339) (0.00305) (0.00329)
Witness -0.0683*** -0.0365*** -0.0365***
(0.00244) (0.00220) (0.00222)
Racist -0.280*** -0.371*** -0.371***
(0.00652) (0.00575) (0.00721)
Racist environment -0.0912*** -0.0812*** -0.0812***
(0.00315) (0.00285) (0.00289)
Non-white -0.00757** 0.000290 0.000290
(0.00259) (0.00234) (0.00235)
Female 0.137*** 0.113*** 0.113***
(0.00234) (0.00213) (0.00213)
Age -0.0276*** -0.0238*** -0.0238***
(0.000706) (0.000630) (0.000678)
Income -0.0678*** -0.0502*** -0.0502***
(0.00125) (0.00112) (0.00117)
Public school -0.880*** -0.711*** -0.711***
(0.00427) (0.00381) (0.00374)
Prep course 0.0497*** -0.0108*** -0.0108***
(0.00359) (0.00321) (0.00342)

38
Table 4.1. (continued)
Ordered Logit OLS OLS Robust
Father education
High school graduate -0.137*** -0.117*** -0.117***
(0.00332) (0.00302) (0.00300)
Some college -0.183*** -0.157*** -0.157***
(0.00724) (0.00658) (0.00654)
College graduate -0.0580*** -0.0579*** -0.0579***
(0.00584) (0.00526) (0.00526)
Unknown -0.195*** -0.160*** -0.160***
(0.00436) (0.00392) (0.00404)
Mother education
High school graduate -0.152*** -0.127*** -0.127***
(0.00310) (0.00282) (0.00279)
Some college -0.152*** -0.133*** -0.133***
(0.00686) (0.00625) (0.00619)
College graduate -0.0499*** -0.0464*** -0.0464***
(0.00533) (0.00482) (0.00477)
Unknown -0.139*** -0.131*** -0.131***
(0.00742) (0.00659) (0.00720)
Married 0.0545*** 0.0527*** 0.0527***
(0.00539) (0.00478) (0.00517)
Children -0.0544*** -0.0722*** -0.0722***
(0.00522) (0.00462) (0.00516)
Work -0.175*** -0.147*** -0.147***
(0.00249) (0.00224) (0.00224)
Southeast -0.214*** -0.216*** -0.216***
(0.00233) (0.00211) (0.00210)
Urban -0.307*** -0.248*** -0.248***

39
Table 4.1. (continued)
Ordered Logit OLS OLS Robust
(0.00908) (0.00820) (0.00776)
Favela 0.155*** 0.0804*** 0.0804***
(0.00683) (0.00606) (0.00644)
cons 8.548*** 8.548***
(0.0102) (0.00986)
N 2489509 2489509 2489509
R-sq 0.035 0.035
∗p < 0.05, ∗ ∗ p < 0.01, ∗ ∗ ∗p < 0.001
The results for the second model, examining ENEM score are shown in Table 4.2.
Table 4.2. OLS and Ologit ENEM Score
Ordered Logit OLS OLS Robust
Victim -0.0617*** -0.00944*** -0.00944***
(0.00512) (0.000777) (0.000759)
Witness 0.342*** 0.0507*** 0.0507***
(0.00369) (0.000563) (0.000561)
Racist -0.200*** -0.0277*** -0.0277***
(0.00953) (0.00147) (0.00155)
Racist environment 0.116*** 0.0189*** 0.0189***
(0.00470) (0.000728) (0.000742)
Non-white -0.282*** -0.0417*** -0.0417***
(0.00391) (0.000597) (0.000594)
Female -0.529*** -0.0815*** -0.0815***

40
Table 4.2. (continued)
Ordered Logit OLS OLS Robust
(0.00354) (0.000542) (0.000559)
Age -0.157*** -0.0208*** -0.0208***
(0.00110) (0.000161) (0.000154)
Income 0.315*** 0.0506*** 0.0506***
(0.00183) (0.000285) (0.000308)
Public school -1.228*** -0.262*** -0.262***
(0.00549) (0.000971) (0.00124)
Prep course 0.384*** 0.0646*** 0.0646***
(0.00508) (0.000818) (0.000929)
Father education
High school graduate 0.240*** 0.0335*** 0.0335***
(0.00486) (0.000791) (0.000816)
Some college 0.540*** 0.103*** 0.103***
(0.00951) (0.00168) (0.00208)
College graduate 0.540*** 0.121*** 0.121***
(0.00753) (0.00134) (0.00172)
Unknown 0.0494*** 0.00808*** 0.00808***
(0.00675) (0.00100) (0.000916)
Mother education
High school graduate 0.220*** 0.0292*** 0.0292***
(0.00460) (0.000721) (0.000750)
Some college 0.425*** 0.0733*** 0.0733***
(0.00927) (0.00159) (0.00190)
College graduate 0.459*** 0.0947*** 0.0947***
(0.00704) (0.00123) (0.00153)
Unknown -0.300*** -0.0413*** -0.0413***
(0.0113) (0.00168) (0.00154)

41
Table 4.2. (continued)
Ordered Logit OLS OLS Robust
Married 0.206*** 0.0287*** 0.0287***
(0.00825) (0.00122) (0.00108)
Children 0.209*** 0.0308*** 0.0308***
(0.00789) (0.00118) (0.00109)
Work 0.146*** 0.0183*** 0.0183***
(0.00371) (0.000573) (0.000576)
Southeast 0.170*** 0.0250*** 0.0250***
(0.00350) (0.000537) (0.000538)
Urban 0.108*** 0.0143*** 0.0143***
(0.0140) (0.00209) (0.00200)
Favela -0.288*** -0.0327*** -0.0327***
(0.0103) (0.00155) (0.00142)
cons 2.262*** 2.262***
(0.00264) (0.00268)
N 2489509 2489509 2489509
R-sq 0.212 0.212
∗p < 0.05, ∗ ∗ p < 0.01, ∗ ∗ ∗p < 0.001
For both models, I included time dummies (year) in the equation, that is time fixed
effects. Such a specification simply tests whether there are unaccounted for contextual
effects due to year differences. Also the multicollinearity test collin was run for the models
and all variables had very low vif coefficients well below the threshold that would indicate
multicollinearity (see Appendix D.1).
Although ologit results are interpreted in a similar way to OLS with respect to its sign
and significance, it is much easier to interpret ordered logit by the percentage change in

42
odds ratios. See Table 4.4 for the first model results and Table 4.5 for the second model
results. In Table 4.4, column ‘% Percentage Change in Odds Ratio’ gives for a unit increase
of each covariate of the response variable, the percentage of change in odds. Thus, the
odds of having a higher score for quality of education are 16.5 percent less for victims of
discrimination, holding all other variables constant. Column ‘%StdX’ gives the percent
change in odds ratio for a standard deviation increase in a covariate and ‘SDofX’ gives the
standard deviation of X.
4.2 The Effects of Discrimination on Quality of Education
Based on these results, interesting patterns were established. Students who experienced
victimization ranked the quality of education in their high school in much lower categories
than students who were not discriminated against. In fact, the odds of having a higher
quality of school experience is 16.5 percent less for victims of discrimination, holding all
other variables constant.
The ENEM Socio-Economic Questionnaire failed to ask whether or not students were
constantly being discriminated against, which would indicate if it was an isolated event or
a constant occurrence that could be classified as bullying. According to Leao and Carvalho
(2011), race is directly linked to frequent cases of bullying in Brazilian schools. Other
individual characteristics that heighten risks of being victimized besides race include: weight
(obese or too thin), height (short or too tall), hygiene (smell), sexual orientation, handicap,
physical appearance, and socio economic status [Leao and Carvalho, December 2011].
This result could be linked to student’s perception of an unsafe school environment that
becomes an undesirable place because of its hostility. Some studies have demonstrated that
children who are bullied are more likely to avoid school, drop out and lose concentration and
enthusiasm for school [Kochenderfer and Ladd, 1996; Olweus, 1992; Fried and Fried, 1996;
CEATS, 2010].

43
One interesting finding is that said racist students have an even lower odds. For this
group of students the odds of having a higher quality of school experience is 24.4 percent
less, holding all other variables constant. This is a relevant finding that indicates that
perpetrators of discrimination, possible bullies, also have their quality of education affected
negatively.
As parents’ level of education rises, students become less critical of the quality of their
education. A student whose father highest level of education was high school, was 12.8
percent less likely to give a higher score for quality of education compared to 5.6 percent less
likely for a student whose father highest level education was college graduate. This same
pattern can be observed for mother education (see Table 4.4). Perhaps, this is due to the
fact that parents level of education is directly related to income and students whose parents
have high levels of education are more likely to go to a private school which have a better
quality of education than public school.
Another interesting factor is that the odds of a student from the public sector having a
higher quality of school experience is 58.5 percent less, holding all other variables constant.
This reflects the poor quality of education in the public sector throughout the country.
Student workers had a worse high school experience than students who did not work, and
female and older students had a better high school experience than males and younger
students. Students who live in favelas had a much better experience in high school than
other students, perhaps because their perception of quality of education has a much lower
threshold compared to other students. This is also true for rural areas, where the odds of
giving a higher score for quality of education are 26.4 percent less for students from urban
areas.
Race appears to be significant in the ordinal logit solution but loses significant when doing
OLS and OLS robust estimation. The reason is that the way white and non-white students

44
ranked quality of education was actually very similar, as indicated by the percentages in the
table 4.3 below:
Table 4.3. Quality of Education by Race
Race Rank
0 1 2 3 4 5 6 7 8 9 10 Total
white 6,345 8,194 7,901 14,955 35,218 147,041 162,514 346,137 433,788 164,769 53,841 1,380,703
0.46 0.59 0.57 1.08 2.55 10.65 11.77 25.07 31.42 11.93 3.90 100.00
non-white 5,654 8,307 6,177 10,416 25,354 120,404 129,180 271,387 347,383 137,396 47,148 1,108,806
0.51 0.75 0.56 0.94 2.29 10.86 11.65 24.48 31.33 12.39 4.25 100.00
Total 11,999 16,501 14,078 25,371 60,572 267,445 291,694 617,524 781,171 302,165 100,989 2,489,509
0.48 0.66 0.57 1.02 2.43 10.74 11.72 24.81 31.38 12.14 4.06 100.00
4.3 The Effects of Discrimination on ENEM Performance
Looking at the second percent change in odds model presented in Table 4.5, one finds the
odds of having a higher score on the ENEM is lowered by 6 percent for students who were
victims of racial discrimination. Although this result is small, it is statistically significant at
p < 0.001. Students who admitted to being racist, and could possibly be the perpetrators
of racism, have an even lower odds of scoring higher in the ENEM examination. The odds
of a said racist student is 18.1 percent less, holding all other variables constant.
Other variables had a greater impact on students performance at the ENEM exam. Non-
white students are 24.6 percent less likely to score in a higher category of the ENEM exam
compared to white students. Also the odds of having a higher score on the ENEM exam
is 70.7 percent less for students of public schools, holding everything else constant. Female
students and older students were 41.1 percent and 14.5 percent less likely to score higher on
the ENEM than male students and younger students. On the other hand, an increase in the
income category improved the odds of scoring higher on the ENEM exam by 37 percent.
Also, for both father’s and mother’s education, there is a clear increase that is statistically
significant: the more educated the student’s parents are the more likely the student is to
score higher in the ENEM. Students’ whose father’s highest level of education is high school

45
were 27.1 percent more likely to score in a higher category. However, having a father with a
college degree increases the odds by 71.5 percent.
Students who did not know their mother’s education, which could possibly indicate that
they were not raised by their mothers, were actually 26 percent less likely of scoring higher
on the ENEM, while students whose mothers had a college degree were 58.3 percent more
likely to score in a higher category.
Not surprisingly, although students who live in favelas were more likely to give a high
score for their quality of education in the previous model, they were 25 percent less likely
to score higher on the ENEM than students not living in the favelas. Students from the
Southeast region were also more likely to score 18.5 higher on the ENEM than from other
regions in Brazil. This reflects the fact that the quality of education in this region is superior
to other regions of the country.
An interesting finding is that being married, having children and working actually have
a positive effect on how a student performs in the ENEM exam. Perhaps the responsibilities
that these roles entail is what is at play here. Being married, having children and working
increases the odds of having a higher ENEM score by 22.8 percent, 23.2 percent and 15.7
percent respectively.
4.3.1 Limitations
The analysis do have limitations. The dataset is based on questionnaire answers, and it is
very likely that there will be reporting biases. Questionnaires cannot measure discrimination
directly, since they capture self-reported evidence and experiences of discrimination that are
not validated [Blank, 2004]. Discrimination that is subtle or indirect, for instance, may not
be readily detected by the victims. In addition, students may also use different meanings for
discrimination than reported accounts, resulting in the under-reporting of discrimination and
a discrepancy between witnessing and reporting discrimination. Some studies in psychology

46
have suggested that because discrimination appears to adversely impact self-esteem and
perceptions of control, minority group members, especially those of low status, are likely to
minimize and deny experiences of discrimination [Williams et al., 2001; Ruggiero and Taylor,
1997; Ruggiero and Major, 1998; Crosby, 1984].
Another limitation is that the model was filtered to include only students who fully
answered the Socio-Economic Questionnaire, and as a result excluded those who did not
complete it. These students are inherently different than the students who answered the
whole questionnaire: in survey research refusal or inability to respond all of the question-
naire’s question may be correlated with such things as education, income, and geographic
location.
Also, although the sample size is very large, some states, such as Acre and Roraima,
accounted for only .26 percent of the dataset whereas, the state of Sao Paulo alone accounted
for 30.21 percent of the dataset. Thus, I created the dummy variable southeast to control
for regional differences, since the state of Sao Paulo, Minas Gerais, Espırito Santos and Rio
de Janeiro account for 50.81 percent of the students in this sample. The remaining 49.19
percent of the dataset is distributed among the other states as shown in Appendix C.1.
Nevertheless, I re-ran the models several times randomly picking smaller percentages such
as 25 and 10 percent of my dataset and the results were similar in magnitude, direction and
significance to the models using the whole set of data.

47
Table 4.4. Ordered Logit: Percentage Change in Odds (Model 1 - Quality)
Quality b z P > |z| % %Stdx SDofxVictim -0.18034 -53.159 0.000 -16.5 -6.2 0.3522Witness -0.06835 -27.976 0.000 -6.6 -3.2 0.4833Racist -0.28017 -42.980 0.000 -24.4 -4.9 0.1793Racist environment -0.09123 -28.997 0.000 -8.7 -3.3 0.3729Non-white -0.00757 -2.928 0.003 -0.8 -0.4 0.4970Female 0.13722 58.523 0.000 14.7 7.0 0.4923Age -0.02764 -39.133 0.000 -2.7 -6.0 2.2417Income -0.06779 -54.293 0.000 -6.6 -7.2 1.1049Public school -0.87960 -205.936 0.000 -58.5 -23.8 0.3090Prep course 0.04973 13.837 0.000 5.1 1.6 0.3229Father Education
High school graduate -0.13728 -41.391 0.000 -12.8 -5.0 0.3699Some college -0.18269 -25.224 0.000 -16.7 -2.9 0.1620College graduate -0.05802 -9.940 0.000 -5.6 -1.3 0.2186Unknown -0.19520 -44.819 0.000 -17.7 -5.4 0.2838
Mother EducationHigh school graduate -0.15221 -49.113 0.000 -14.1 -5.8 0.3951Some college -0.15214 -22.163 0.000 -14.1 -2.6 0.1701College graduate -0.04994 -9.371 0.000 -4.9 -1.2 0.2383Unknown -0.13947 -18.792 0.000 -13.0 -2.3 0.1671
Married 0.05447 10.114 0.000 5.6 1.5 0.2798Children -0.05440 -10.424 0.000 -5.3 -1.7 0.3171Work -0.17508 -70.200 0.000 -16.1 -7.9 0.4676Southeast -0.21355 -91.723 0.000 -19.2 -10.1 0.4999Urban -0.30668 -33.790 0.000 -26.4 -3.8 0.1251Favela 0.15535 22.752 0.000 16.8 2.7 0.1715
N=2489509b = raw coefficient
z = z-score fore test of b=0P > z = p-value for z-test
% = percentage change in odds for unit increase in X% StdX = percentage change in odds for SD increase in X
SDofX = standard deviation of X

48
Table 4.5. Ordered Logit: Percentage Change in Odds (Model 2 - Score)
Score b z P > |z| % %Stdx SDofxVictim -0.06174 -12.048 0.000 -6.0 -2.2 0.3522Witness 0.34218 92.728 0.000 40.8 18.0 0.4833Racist -0.20000 -20.983 0.000 -18.1 -3.5 0.1793Racist environment 0.11582 24.662 0.000 12.3 4.4 0.3729Non-white -0.28201 -72.197 0.000 -24.6 -13.1 0.4970Female -0.52893 -149.291 0.000 -41.1 -22.9 0.4923Age -0.15664 -142.936 0.000 -14.5 -29.6 2.2417Income 0.31502 172.548 0.000 37.0 41.6 1.1049Public school -1.22833 -223.594 0.000 -70.7 -31.6 0.3090Prep course 0.38441 75.640 0.000 46.9 13.2 0.3229Father education
High school graduate 0.24019 49.424 0.000 27.1 9.3 0.3699Some college 0.53997 56.758 0.000 71.6 9.1 0.1620College graduate 0.53951 71.686 0.000 71.5 12.5 0.2186Unknown 0.04942 7.326 0.000 5.1 1.4 0.2838
Mother educationHigh school graduate 0.21975 47.756 0.000 24.6 9.1 0.3951Some college 0.42480 45.842 0.000 52.9 7.5 0.1701College graduate 0.45905 65.219 0.000 58.3 11.6 0.2383Unknown -0.30049 -26.638 0.000 -26.0 -4.9 0.1671
Married 0.20561 24.908 0.000 22.8 5.9 0.2798Children 0.20853 26.418 0.000 23.2 6.8 0.3171Work 0.14572 39.322 0.000 15.7 7.1 0.4676Southeast 0.16954 48.457 0.000 18.5 8.8 0.4999Urban 0.10805 7.702 0.000 11.4 1.4 0.1251Favela -0.28790 -27.950 0.000 -25.0 -4.8 0.1715
N=2489509b = raw coefficient
z = z-score fore test of b=0P > z = p-value for z-test
% = percentage change in odds for unit increase in X% StdX = percentage change in odds for SD increase in X
SDofX = standard deviation of X

CHAPTER 5
THE UNIVERSITY OF SAO PAULO COMPARISON
If blacks do not reach the university, obviously they do not share the equality of conditionsand opportunities given to whites. [Only] if the quantity of whites and blacks werebalanced we could say that color is not a relevant factor.
–Rosa Weber, Justice of the Brazilian Supreme Court [Weber, 2012]
5.1 Impediment to Social Mobility
Many researchers claim that the performance of public high school students in national exams
are worse than the performance of students from private schools [Telles, 2004; Guimaraes
and Sampaio, 2009; Castro and Guimaraes, 1993]. The argument follows that the majority
of students who attend public schools are non-whites and as a consequence of the lack of
quality in public schools they perform below average on the vestibular and are not admitted
into public universities. A study by Tomelin [2002] analyzed the opportunities for higher
education in Brazil from colonial period to 2000 and found that there is a long-lasting
reduction of access to higher education for segments of the Brazilian society on the basis of
race and social class. Other researchers have argued that education is one of the foundations
to economic and social development of a society because it unquestionably results in the
growth of the individual’s economic and social status in the society, and the economic growth
of the country as a whole.
This is the reason why it is important to understand whether or not the vestibular is
a fair tool used by the universities, or if it is an impediment to social mobility in Brazil.
By analyzing the socioeconomic characteristics of students admitted to public universities in
49

50
Brazil one is able to form a better opinion on the matter and perhaps help lawmakers create
policies that will promote equity in higher education.
Two research question need to be answered:
1. Whether or not there is no relationship between type of high school attended and
vestibular acceptance.
2. Whether or not there is no relationship between race and vestibular acceptance.
In order to test these hypotheses, I chose the University of Sao Paulo (USP), the largest
Brazilian university as well as one of the country’s most prestigious universities. The USP
vestibular is prepared and administered by a federal agency called FUVEST (University
Foundation for Vestibular) that also gives a Socio-Economic Questionnaire to all applicants
of the vestibular. I contacted FUVEST officials requesting access to a dataset that would
have included the socio-economic status of all applicants to the vestibular as well as a variable
indicating whether or not the student had passed the exam, but my request was denied. The
only data available to the public are the summary statistics for each major which allows for
chi-square tests only. After a compromise, I was able to acquire the mean ENEM score with
the standard deviation (for the objective part of the exam) for every student admitted at
USP during the years of 2004-2008 by major. Since I have the dataset with the characteristics
for all students who took the ENEM exam during 2004-2008, I was able to make inferences
based on the ENEM dataset.
The limitation is obvious: although I have the dataset of students who took the ENEM
score with national probabilities, there is no way of telling whether or not the student
actually applied to the vestibular at USP. However, I am able to observe the characteristics
of students who have the same score on the ENEM exam as those who were accepted at the
University of Sao Paulo (USP).

51
5.2 The Vestibular
Before stating what I found about the students admitted to USP, it is important to explain
in more detail what the vestibular exam is and how it is used in the admission process of
universities.
University access in Brazil is a very competitive process. Public universities are not only
free but are also the most prestigious universities in the country. It is estimated by the
Ministry of Education and Culture that in 2006 a total of 5,181,699 students struggled to
get access to one of the 2,629,598 available places in Brazilian universities [INEP, 2008]. For
some majors, such as Medicine, Engineering and Law, the ratio of students to available places
can be as high as 20 or more in public universities [Carvalho and Magnac, 2010]. Different
than other countries like the United States that uses multiple criteria for admission, Brazil
uses an objective-grading exam called the vestibular.
The vestibular has the following general features. First, students must choose a single
undergraduate major before taking the test and compete against those students who made
the same choice [Carvalho and Magnac, 2010]. Second, the exam comprises of many sub-
exams, each one evaluating knowledge in a specific subject, i.e. Mathematics, Physics,
Chemistry, Biology, Portuguese, History, Geography and a Foreign Language [Carvalho and
Magnac, 2010]. In general, the vestibular consists of two stages. The first stage is common
to all majors and the second stage is more specific to each major. The different departments
within the university that are providing the undergraduate major courses can weight the
sub-exams differently in order to reflect their priorities. All candidates must pay a fee that
differs in amount depending on the university before taking the vestibular. Some universities
exempt this fee for students based on their financial needs. The University of Sao Paulo
saw a great increase in the number of students from public schools taking the vestibular

52
after 2005 because it decided to increase the number of exemptions given to students with
financial need from 20,000 to 65,000 [FUVEST, 2010].
Once the students take the vestibular exam, the different departments rank all their
applicants by grade and reject those exceeding the number of seats for each major [Carvalho
and Magnac, 2010]. Generally, students can have up to three choices of major and if they are
not accepted into their first choice they can be considered for the other two if their vestibular
grade makes the cut for those majors. The vestibular is a very fierce competition in Brazil
that is not equally fair to all students. As my results will show in the next section, students
from public universities are not as well prepared to take the exam as students from private
schools. As a result the vestibular has been argued to be a social mobility impediment in
Brazilian society. Cavalcanti et al. [2010] quantified the difference in performance of public
and private school students in the vestibular of a major public university in Pernambuco,
Brazil. They found that the elitist Brazilian higher education system is an important channel
for inequality persistence, and that going to a private school versus a public school matters
when taking the vestibular.
5.3 The Dataset
In order to analyze the characteristics of students who could have passed the vestibular exam
at the University of Sao Paulo I used three datasets:
1. The ENEM Socio-Economic Questionnaire for the years of 2004-2008 provided by the
National Institute of Educational Research (INEP).1
2. The FUVEST Socio-Economic Questionnaire dataset available online.2
1This is the same dataset used in the previous chapters.
2The FUVEST Socio-Economic Questionnaire for every year can be found at the FUVEST website at:http://www.fuvest.br/vest2008/estat/estat.stm

53
Every student who applies to the vestibular in the University of Sao Paulo answers a
socio-economic questionnaire. Since this data is bivariate, I use this dataset to conduct
chi square tests of independence to determine if there is an association between passing
the vestibular and the type of school that a student study at, divided into three options:
private high school, public high school and others (which includes: study abroad, GED
equivalent, mostly in private, mostly in public, half in private and half in public). The
public high schools include municipal, state and federal public high schools. The type
of high school was chosen as a variable here because it indicates the socio-economic
status of the students. Although data was available for each specific major, the data
analyzed for the chi-square tests comprises of the average percentage for all majors
together.
3. The ENEM score and standard deviation of students accepted at USP provided by
FUVEST.
After contacting FUVEST I was able to acquire the ENEM score for each major at
USP for the years 2004-2008. This ENEM score is only for the objective part of the
exam and the maximum score is 63. For the year of 2004, 2005, 2006, 2007 and 2008
there were a total of 86, 98, 101, 105 and 107 majors respectively at USP. Instead of
looking at every since major, I decided to analyze the major with the highest ENEM
score, the major with the lowest ENEM score and the total average score for all majors
for each year. I used this dataset to create three dummy variables in my main dataset
(the ENEM dataset) to indicate whether or not looking at the ENEM score alone, a
student would be able to pass with the lowest ENEM score achieved by the students
who passed the vestibular in these three categories.

54
5.3.1 Chi-Square tests for Type of School
The first step in examining the data was to simply use the FUVEST dataset to run chi-
square tests and see whether or not type of school was associated with acceptance at USP.
For every year analyzed (2004-2008) the chi-square test results indicate that the type of high
school attended has some bearing on passing the USP vestibular, being significant at the
0.01 level. See Tables 5.1 to 5.5.
Starting in 2005, one can see an increase in the number of students from public schools
applying to USP due to an increase in the number of exemption fees awarded to students
with financial need in 2005. This is evident by the increase in the percentage of students
not approved coming from public schools. Although there was an increase in the number of
students who applied from public schools the approval rate remained close to 20 percent.
Table 5.1. Vestibular Acceptance vs. Type of High School in 2004
Category Private Public Other Total
Approved 72.8% 21.5% 5.7% 10,051
Not approved 55.0% 37.0% 8.0% 145,830
df = 2 α = 0.01 χ2 = 1230.718 p− value = 0 reject null
Table 5.2. Vestibular Acceptance vs. Type of High School in 2005
Category Private Public Other Total
Approved 71.9% 23.0% 5.1% 11,025
Not approved 51.6% 41.1% 7.2% 142,431
df = 2 α = 0.01 χ2 = 1707.192 p− value = 0 reject null
Table 5.3. Vestibular Acceptance vs. Type of High School in 2006
Category Private Public Other Total
Approved 73.2% 21.2% 5.6% 11,315
Not approved 48.8% 44.5% 6.7% 157,739
df = 2 α = 0.01 χ2 = 2590.688 p− value = 0 reject null

55
Table 5.4. Vestibular Acceptance vs. Type of High School in 2007
Category Private Public Other Total
Approved 71.6% 23.8% 4.6% 11,397
Not approved 56.8% 37.0% 6.2% 130,169
df = 2 α = 0.01 χ2 = 955.695 p− value = 0 reject null
Table 5.5. Vestibular Acceptance vs. Type of High School in 2008
Category Private Public Other Total
Approved 70.9% 23.6% 5.5% 11,242
Not approved 59.9% 33.9% 6.2% 128,650
df = 2 α = 0.01 χ2 = 550.063 p− value = 0 reject null
5.3.2 ENEM Score Comparison
Since the chi-square test can only indicate the similarity or difference of two variables, but
cannot demonstrate whether there is a causal link between these two variables a more ap-
propriate statistical method is required. Thus, I used the ENEM dataset and the dataset
provided by FUVEST to make inferences about the characteristics of students. Using the
ENEM dataset I filtered the data and kept only students who answered all questions rele-
vant to my study. The FUVEST dataset was used to indicate the ENEM score of students
who passed the USP vestibular by major and by year. Thus, I merged the two datasets
and created dummy variables to indicate if a student’s ENEM score would allow them to
be accepted into USP by comparing it to the lowest score achieved by an accepted student.
I then separated the dataset by year and examined each year individually. Also, I created
race dummy variables, black, brown, indio and asian to analyze each different race’s effects,
using white as my reference race in my statistical analysis.
Tables 5.6, 5.7, 5.8, 5.9, and 5.10 indicate some of the most competitive majors, the
average ENEM score of all majors, and the major with the lowest ENEM score with its
respectively standard deviation. Again, the maximum ENEM score that a student could
make, for all of these years, was 63. The highest ENEM score was achieved in the most

56
Table 5.6. ENEM Scores for Students Accepted at USP - 2008
Major Mean S.D.
Medicine 60.05 1.95Engineering (Poli) 58.40 2.60Law 58.97 2.27Social Science 55.93 3.32Natural Sciences 45.83 7.14All Majors Average* 55.27 4.79
* There were 107 majors in 2008.
Table 5.7. ENEM Scores for Students Accepted at USP - 2007
Major Mean S.D.
Medicine 56.63 2.26Engineering (Poli) 53.88 3.24Law 54.00 3.13Social Science 50.05 4.79Natural Sciences 33.87 7.04All Majors Average* 48.80 6.20
* There were 105 majors in 2007.
Table 5.8. ENEM Scores for Students Accepted at USP - 2006
Major Mean S.D.
Medicine 58.51 2.07Engineering (Poli) 56.00 2.89Law 56.20 3.05Social Science 53.34 3.82Natural Sciences 40.45 5.61All Majors Average* 51.74 5.40
* There were 101 majors in 2006.
competitive major, Medicine. The lowest ENEM score for 2008, 2007 and 2006 was found
in the Ciencias da Natureza (Natural Sciences) major. The Natural Sciences major offers
an integrated degree in Mathematics, Natural Sciences and Education and is designed to
prepare science teachers for the elementary and primary education levels in private and public

57
Table 5.9. ENEM Scores for Students Accepted at USP - 2005
Major Mean S.D.
Medicine 59.65 1.92Engineering (Poli) 57.88 2.71Law 58.24 2.56Social Science 55.33 3.42Audiology (Santa Casa) 32.07 7.78All Majors Average* 54.12 5.46
* There were 98 majors in 2005.
Table 5.10. ENEM Scores for Students Accepted at USP - 2004
Major Mean S.D.
Medicine 59.01 2.12Engineering (Poli) 57.11 3.12Law 57.59 2.92Social Science 54.63 4.62Audiology (Bauru) 48.23 7.30All Majors Average* 54.34 4.75
* There were 86 majors in 2004.
schools, but graduates are also qualified to teach at the secondary education level in Biology,
Physics and Chemistry or to work in museums, centers of science, parks, NGOs, projects
of environmental education, scientific disclosure and in the output of educational material.
In 2005 the lowest ENEM score was in Fonoaudiologia major at Santa Casa campus. The
Fonoaudiologia (Audiology) major is equivalent to the degree that prepares speech pathology
professionals in the United States. They specialize in communication disorders as well as
swallowing disorders. In 2004, the Audiology major at the Bauru campus was again the
major with the lowest ENEM score.
Table 5.11 provides a summary and a description of variables used in this analysis.

58
Table 5.11. Student-level variables
Variable Definition and Source
Instituto Nacional de Estudos e Pequisas and FUVEST
Race
White 1(yes); 0(no)
Black 1(yes); 0(no)
Brown 1(yes); 0(no)
Asian 1(yes); 0(no)
Indigenous 1(yes); 0(no)
Female 1(female); 0(male)
Age Student’s age
Family Income All wages by monthly minimum wage: 0(low) to 7(high)
Public School Type of high school attended: 1(public); 0(private)
Prep Course Attended cursinho for the vestibular? 1(yes); 0(no)
Mother education
High School Graduate 1(yes); 0(otherwise)
Some College 1(yes); 0(otherwise)
College Graduate 1(yes); 0(otherwise)
Unknown 1(yes); 0(otherwise)
Victim Have you ever suffered racial or ethnic discrimination?
1(yes); 0(no)
Racist Do you consider yourself racist? 1(yes); 0(no)
Escore ENEM score: min 0, max 63
Dummies for ENEM scores
pavg Total ENEM average of students accepted at USP
pmed Accepted in Medical School at USP
pnsci Accepted in Natural Sciences at USP
pfonosc Accepted into Audiology Santa Casa at USP
pfonob Accepted into Audiology Bauru at USP

59
5.3.3 Data Analysis
As seen in Tables 5.6, 5.7, 5.8, 5.9, and 5.10, the ENEM score of students accepted at USP
changed each year. For this reason, the dataset had to be analyzed year by year. Also,
an important law of geography states that, “everything is related to everything else, but
near things are more related than distant things” [Tobler, 1970]. Thus, since most students
who apply to the University of Sao Paulo are from the state of Sao Paulo, I divided my
dataset into a sub-sample that included only students from that state. Although, I might
lose statistical significance due to a reduction in number of students, it is well known in the
literature that the quality of education both in public and private high schools in Sao Paulo
is superior than in other states along with other variables such as standard of living, and
income. Hence, it makes sense to consider in this analysis just students from the state of
Sao Paulo.
I present the results in reserve order so that the most recent years’ are shown first, starting
in 2008 and going back to 2004.
2008. The lowest ENEM score of a student accepted at USP in 2008 was in the Natural
Sciences major. Thus, every student who made an ENEM score ≥ 38.69 was assigned a
dummy variable pnsci to indicate that s/he would have exceeded the ENEM threshold for
acceptance in this particular major and this variable became a proxy for acceptance at USP
in Natural Sciences. Since this was the major with the lowest ENEM score, it is obvious
that students in this group would not have passed in Medicine where the lowest ENEM score
was ≥ 58.1. Hence a dummy variable pmed was created for students who scored the same
or exceeded the threshold for Medicine. These thresholds are indicate in Figure 5.1 along
with the racial distribution of students by ENEM score.
The first step in examining the data is simply to get an idea of how many students would
have passed the vestibular from the original sample. Considering the major with the lowest

60
Figure 5.1. ENEM Score Distribution by Race
ENEM score, out of 991,810 students nationwide, 14.94% (148,170) would have scored ≥
38.69. Looking at the average score of all students accepted at USP, a student would have
had to score ≥ 50.48 on average to be accepted in 2008. Out of the 991,810 students
nationwide only 2.35% (23,330) would meet this criterion. A more disturbing image emerges
when looking at the most competitive major, Medicine. Nationwide in 2008 only 0.08%
(807) would have exceeded the threshold for Medicine acceptance at USP. Furthermore,
when looking at race only 14.62% (118) of students who met the ENEM score required for
Medicine were black, 1.12% (9) were brown, and 0.12% (1) was indigenous. The majority
race of students meeting the required ENEM score for Medicine were whites 76.70% (619)
and Asians 7.43% (60).
Now, looking at the sub-sample that examined only the state of Sao Paulo, out of 300,870
students, 19.91% (59,909) would have score ≥ 38.69, the minimum score to be accepted in

61
Natural Sciences. The average ENEM score of all students admitted at USP was ≥ 50.48 in
2008. Only 3.58% (10,760) would have met this threshold in the state of Sao Paulo. For the
most competitive major, Medicine, only .13% (403) students would have met the criterion
to be accepted. Note that all percentages in the state of Sao Paulo are higher than the same
estimates nationwide.
Using the ENEM score dummy variables equivalent to the lowest ENEM score achieved
by an accepted student at USP (pnsci), the average ENEM score of all students (pavg) and
the lowest ENEM score of the most competitive major (pmed), I ran logistic regressions to
see the significance of student’s characteristics on these variables. Logit regression estimates
results are shown in Appendix D.12 for students with the characteristics described in Table
5.11, indicating what characteristics have the most influence for passing the vestibular exam
at USP at the highest, average and lowest criteria. Again, because it is easier to interpret
logit results by looking at the odds percentages, I provide these results in Tables 5.12, 5.15
and 5.16.
The results for the year 2008 indicate that the odds of being accepted into the average
(pavg) ENEM category at USP, are 35 percent smaller for black students, 66.3 percent
smaller for brown students and 58.3 percent smaller for indigenous students. Asian students
on the other hand, have an odds of 44.8 percent larger, holding all other variables constant.
The odds of being accepted into the pavg category, are 81 percent smaller for students
from public school and going to a vestibular prep course raises the odds to 125.5 percent.
Furthermore, the higher the level of education of a student’s mother, the higher the odds of
passing into this category. Income also plays an important role, an increase in the income
category increases the odds of passing to 54.8 percent.
Some interesting facts are that being a racist is not significant and victims of racial
discrimination had a small but positive odd of being admitted. These results will be discussed
in more detail later as I compare these results to other years in Section 5.3.3.

62
Table 5.12. Logit: Percentage Change in Odds (2008 Passing Avg. Score Full Model)
Odds of: yes vs. noVariables (pavg) b z P > |z| % %Stdx SDofxBlack -0.43115 -11.413 0.000 -35.0 -17.1 0.4347Brown -1.08716 -11.170 0.000 -66.3 -23.4 0.2457Indigenous -0.87562 -2.821 0.005 -58.3 -5.9 0.0696Asian 0.37001 8.936 0.000 44.8 6.7 0.1756Victim 0.13328 3.468 0.001 14.3 4.3 0.3146Racist -0.02851 -0.484 0.629 -2.8 -0.4 0.1579Female -0.76434 -35.715 0.000 -53.4 -31.3 0.4918Age 0.13646 16.578 0.000 14.6 26.2 1.7070Public school -1.65841 -50.475 0.000 -81.0 -52.6 0.4504Prep course 0.81314 35.038 0.000 125.5 31.3 0.3347Income 0.43724 45.278 0.000 54.8 70.9 1.2255Mother Education
High school graduate 0.05299 1.642 0.101 5.4 2.3 0.4295Some college 0.27284 6.355 0.000 31.4 6.0 0.2150College graduate 0.51791 19.084 0.000 67.9 21.3 0.3729Unknown -0.52218 -4.251 0.000 -40.7 -7.2 0.1429
N = 300870b = raw coefficient
z = z-score fore test of b = 0P > z = p-value for z-test
% = percentage change in odds for unit increase in X%StdX = percentage change in odds for SD increase in X
SDofX = standard deviation of X
Looking at the most competitive major, Medicine, both the black and brown variables
are significant at .05 and that the indigenous variable lost its significance. The reason is
that only .25% (1) out of 1,462 indigenous students fell into this category. Tables 5.13 and
5.14 show the distributions for acceptance in Medicine and in Natural Sciences. In both
majors, it becomes clear that there is a significant disparity between races that could have
been admitted to the University of Sao Paulo from the total population of students.
The odds of being accepted into Medicine is 85.6 percent smaller for students from public
schools. The odds of being accepted are 63.2 percent smaller for females, 35.8 percent smaller
for blacks, and 89.9 percent smaller for browns, holding everything else constant. On the

63
Table 5.13. Race vs. Acceptance in Medicine USP - 2008
Accepted White Black Brown Indigenous Asian Total
Yes 329 28 1 1 44 403
81.64% 6.95% 0.25% 0.25% 10.92% 100%
No 194,008 76,055 19,407 1,462 9,535 300,467
64.57% 25.31% 6.46% 0.49% 3.17% 100%
Total 194,337 76,083 19,408 1,463 9,579 300,870
64.59% 25.29% 6.45% 0.49% 3.18% 100%
Table 5.14. Race vs. Acceptance in Natural Sciences USP - 2008
Accepted White Black Brown Indigenous Asian Total
Yes 47,713 6,992 1,376 86 3,742 59,909
79.64% 11.67% 2.30% 0.14% 6.25% 100%
No 146,624 69,091 18,032 1,377 5,837 240,961
60.85% 28.67% 7.48% 0.57% 2.42% 100%
Total 194,337 76,083 19,408 1,463 9,579 300,870
64.59% 25.29% 6.45% 0.49% 3.18% 100%
other hand, going to a prep course, having a mother with a college degree, having a high
income and being Asian, increases the odds by 79.2 percent, 34.7 percent, 65.7 percent and
85.7 percent respectively.
When looking at the major that had the lowest ENEM score in 2008, Natural Sciences, I
find similar results. Looking at the race variables, the odds of being accepted are 35.6 percent
smaller for blacks, 52.5 percent smaller for browns and 59.6 percent smaller for indigenous
students. On the other hand, being Asian increases the odds significantly. Here again, one
of the variables with the largest influence is public school and prep course. The odds of
being accepted into Natural Sciences are 74.2 percent smaller for public high school students
than for students coming from private school and going to a preparatory vestibular school
increases the odds of acceptance by 134 percent. Also, mother’s educational attainment is

64
Table 5.15. Logit: Percentage Change in Odds (2008 Passing Medicine - Full Model)
Odds of: yes vs noVariables (pmed) b z P > |z| % %Stdx SDofxBlack -0.44263 -2.168 0.030 -35.8 -17.5 0.4347Brown -2.28991 -2.274 0.023 -89.9 -43.0 0.2457Indigenous 0.23205 0.230 0.818 26.1 1.6 0.0696Asian 0.61922 3.600 0.000 85.7 11.5 0.1756Victim -0.02583 -0.139 0.890 -2.6 -0.8 0.3146Racist -0.06460 -0.235 0.814 -6.3 -1.0 0.1579Female -0.99859 -9.119 0.000 -63.2 -38.8 0.4918Age 0.21114 5.472 0.000 23.5 43.4 1.7070Public school -1.93457 -10.020 0.000 -85.6 -58.2 0.4504Prep course 0.58359 5.362 0.000 79.2 21.6 0.3347Income 0.50481 11.349 0.000 65.7 85.6 1.2255Mother Education
High school graduate -0.43295 -2.443 0.015 -35.1 -17.0 0.4295Some college -0.14088 -0.638 0.523 -13.1 -3.0 0.2150College graduate 0.29810 2.427 0.015 34.7 11.8 0.3729Unknown -1.64151 -1.632 0.103 -80.6 -20.9 0.1429
N = 300870b = raw coefficient
z = z-score fore test of b = 0P > z = p-value for z-test
% = percentage change in odds for unit increase in X%StdX = percentage change in odds for SD increase in X
SDofX = standard deviation of X
directly related to an increase in the acceptance rate. The higher the level of education
of the student’s mother the higher the odds of being accepted while not knowing mother’s
education lowers the odds of being accepted by 27.6 percent and having a mother with high
school diploma increases the odds by 31.4 percent. Having a mother with higher education
has an even greater influence: while some college increases the odds by 68.3 percent, having
a mother with college education increases the odds by 79.7 percent, holding everything else
constant. See Table 5.16.

65
Table 5.16. Logit: Percentage Change in Odds (2008 Passing Natural Sciences - Full Model)
Odds of: yes vs noVariables (pnsci) b z P > |z| % %Stdx SDofxBlack -0.43989 -28.186 0.000 -35.6 -17.4 0.4347Brown -0.74374 -23.178 0.000 -52.5 -16.7 0.2457Indigenous -0.90624 -7.517 0.000 -59.6 -6.1 0.0696Asian 0.32861 12.511 0.000 38.9 5.9 0.1756Victim 0.19702 10.033 0.000 21.8 6.4 0.3146Racist -0.03701 -1.123 0.261 -3.6 -0.6 0.1579Female -0.62410 -57.261 0.000 -46.4 -26.4 0.4918Age -0.03570 -8.388 0.000 -3.5 -5.9 1.7070Public school -1.35476 -101.652 0.000 -74.2 -45.7 0.4504Prep course 0.85074 60.895 0.000 134.1 32.9 0.3347Income 0.42355 78.834 0.000 52.7 68.0 1.2255Mother Education
High school graduate 0.27312 19.595 0.000 31.4 12.4 0.4295Some college 0.52067 23.493 0.000 68.3 11.8 0.2150College graduate 0.58612 40.192 0.000 79.7 24.4 0.3729Unknown -0.32267 -6.512 0.000 -27.6 -4.5 0.1429
N = 300870b = raw coefficient
z = z-score fore test of b = 0P > z = p-value for z-test
% = percentage change in odds for unit increase in X%StdX = percentage change in odds for SD increase in X
SDofX = standard deviation of X
2007. For the year of 2007, the ENEM scores were much lower among students accepted
at USP compared to the other four years in this analysis. However, the lowest ENEM score
of a student accepted at USP was again in the Natural Sciences major. Every student who
made an ENEM score ≥ 26.83 was assigned a dummy variable, pnsci, to indicate that s/he
would have exceeded the threshold for acceptance in this particular major. Because this was
the major with the lowest ENEM score, this student would only have passed at USP if s/he
had chosen this major. The highest ENEM scores were found in the Medicine major and
the students who were accepted scored ≥ 54.37. A dummy variable, pmed, was also created
for students who would have exceeded the threshold grade for Medicine. Looking at the

66
average score of all students accepted at USP, a student would have had to score ≥ 42.6 on
average to be accepted in 2007. A dummy variable, pavg, was created to indicate students
who would have met this criteria. This is illustrated in Figure 5.2.
Figure 5.2. ENEM Score Distribution by Race
The logit regression estimates can be found at Appendix D.13 and the percent change in
odds can be found in Tables 5.19, 5.20, and 5.21. Because of the small number of indigenous
students who would have passed in Medicine, that variable loses statistical significance. As
shown in Table 5.17 and Table 5.18, even though the ENEM scores were much lower in 2007,
there is a significant disparity among racial groups.
Looking at the logit results for Medicine in column (3), it is evident that the variable
indigenous loses statistical significance compared to the results for Natural Sciences (pnsci)
in column (3) and for the average score (pavg) columns (see Appendix D.13). The main

67
Table 5.17. Race vs. Acceptance in Medicine USP - 2007
Accepted White Black Brown Indigenous Asian Total
Yes 7,515 885 135 20 676 9,231
81.41% 9.59% 1.46% 0.22% 7.32% 100%
No 151,576 70,234 17,671 1,326 6,646 247,453
61.25% 28.38% 7.14% 0.54% 2.69% 100%
Total 159,091 71,119 17,806 1,346 7,322 256,684
61.98% 27.71% 6.94% 0.52% 2.85% 100%
Table 5.18. Race vs. Acceptance in Natural Sciences USP - 2007
Accepted White Black Brown Indigenous Asian Total
Yes 118,416 40,947 9,685 649 5,619 175,316
67.54% 23.36% 5.52% 0.37% 3.21% 100%
No 40,675 30,172 8,121 697 1,703 81,368
49.99% 37.08% 9.98% 0.86% 2.09% 100%
Total 159,091 71,119 17,806 1,346 7,322 256,684
61.98% 27.71% 6.94% 0.52% 2.85% 100%
reason is that out of 9,231 students who would meet the threshold to pass in Medicine only
20 were indigenous, this is illustrated on Table 5.17.
Although the ENEM scores were much lower compared to other years, the results indicate
the same trends seen in the year 2008. Looking at the average score (pavg), the odds of
acceptance is 32.9 percent smaller for blacks, 48.1 percent smaller for browns and 50.5 percent
smaller for indigenous, holding everything else constant. On the other hand, being Asian
increases the odds of passing by 19.3 percent. Public school and prep course had a significant
effect as well. Studying in a public high school lowers the odds by 77.7 percent while taking
a preparatory course, the cursinho, increases the odds by 98.8 percent. It is also clear that
the higher the education of the mother, the higher the odds of passing in this category. Refer
to Table 5.19 for results.

68
Table 5.19. Logit: Percentage Change in Odds (2007 Passing Avg. Score - Full Model)
Odds of: yes vs noVariables (pavg) b z P > |z| % %Stdx SDofxBlack -0.39902 -26.665 0.000 -32.9 -16.4 0.4476Brown -0.65641 -21.779 0.000 -48.1 -15.4 0.2541Indigenous -0.70314 -6.589 0.000 -50.5 -5.0 0.0722Asian 0.17608 5.716 0.000 19.3 3.0 0.1665Victim 0.18271 9.017 0.000 20.0 6.0 0.3193Racist -0.03197 -0.857 0.391 -3.1 -0.5 0.1505Female -0.65562 -57.054 0.000 -48.1 -27.5 0.4914Age -0.19592 -37.668 0.000 -17.8 -30.5 1.8588Public school -1.49926 -107.628 0.000 -77.7 -47.1 0.4243Prep course 0.68711 41.001 0.000 98.8 23.0 0.3010Income 0.38490 66.211 0.000 46.9 58.8 1.2014Mother Education
High school graduate 0.33750 24.166 0.000 40.1 15.3 0.4229Some college 0.57948 24.172 0.000 78.5 12.7 0.2068College graduate 0.64695 39.769 0.000 91.0 25.1 0.3461Unknown -0.33702 -6.620 0.000 -28.6 -4.7 0.1433
N = 256684b = raw coefficient
z = z-score fore test of b = 0P > z = p-value for z-test
% = percentage change in odds for unit increase in X%StdX = percentage change in odds for SD increase in X
SDofX = standard deviation of X
The percentages are magnified for the most competitive major of Medicine. See Table
5.20. The odds of being accepted are 35.7 percent smaller for blacks, and 57 percent smaller
for brown, holding everything else constant. Asian students’ odds of being accepted is 39.4
percent larger. The odds of passing in Medicine are lowered by 57.1 percent for females than
males, and 11.9 percent for older students, holding everything else constant. Also, studying
in a public school lowers the odds by 80.8 percent on average, while taking a prep course
increases by 107.3 percent, holding everything else constant. Not surprisingly, an increase in
the income category, increases the odds of that student passing in Medicine by 52.3 percent.
Here again, the more educated the mother of a student is, the higher the odds of passing

69
Table 5.20. Logit: Percentage Change in Odds (2007 Passing Medicine - Full Model)
Odds of: yes vs noVariables (pmed) b z P > |z| % %Stdx SDofxBlack -0.44169 -11.466 0.000 -35.7 -17.9 0.4476Brown -0.84400 -9.205 0.000 -57.0 -19.3 0.2541Indigenous -0.05961 -0.256 0.798 -5.8 -0.4 0.0722Asian 0.33200 6.977 0.000 39.4 5.7 0.1665Victim 0.16741 3.994 0.000 18.2 5.5 0.3193Racist 0.09190 1.402 0.161 9.6 1.4 0.1505Female -0.84617 -36.326 0.000 -57.1 -34.0 0.4914Age -0.12630 -9.856 0.000 -11.9 -20.9 1.8588Public school -1.65028 -49.061 0.000 -80.8 -50.4 0.4243Prep course 0.72909 26.446 0.000 107.3 24.5 0.3010Income 0.42046 38.532 0.000 52.3 65.7 1.2014Mother Education
High school graduate 0.11605 3.493 0.000 12.3 5.0 0.4229Some college 0.27324 5.994 0.000 31.4 5.8 0.2068College graduate 0.48189 16.197 0.000 61.9 18.1 0.3461Unknown -0.67023 -4.756 0.000 -48.8 -9.2 0.1433
N = 256684b = raw coefficient
z = z-score fore test of b = 0P > z = p-value for z-test
% = percentage change in odds for unit increase in X%StdX = percentage change in odds for SD increase in X
SDofX = standard deviation of X
in Medicine. The odds of being accepted is 12.3 percent higher for students whose mother
had high school only, compared to 61.9 percent higher for students whose mother is a college
graduate. Not knowing mother’s education, which could indicate that the student was not
raised by his/her mother, lowers the odds of being accepted into Medicine by 48.8 percent,
holding everything else constant.
Looking at the major that had the lowest ENEM score, Natural Sciences, even though the
threshold was much lower for this major, minority groups are still at a great disadvantage.
Being black, brown and indigenous lowers the odds of being accepted in Natural Sciences
by 29.1 percent, 39.1 percent and 49.4 percent, holding everything else constant. Table

70
Table 5.21. Logit: Percentage Change in Odds (2007 Passing Natural Sciences - Full Model)
Odds of: yes vs noVariables (pnsci) b z P > |z| % %Stdx SDofxBlack -0.34322 -33.074 0.000 -29.1 -14.2 0.4476Brown -0.49610 -27.261 0.000 -39.1 -11.8 0.2541Indigenous -0.68156 -11.729 0.000 -49.4 -4.8 0.0722Asian -0.15162 -4.770 0.000 -14.1 -2.5 0.1665Victim 0.15005 10.006 0.000 16.2 4.9 0.3193Racist -0.23100 -7.432 0.000 -20.6 -3.4 0.1505Female -0.28679 -29.858 0.000 -24.9 -13.1 0.4914Age -0.07538 -31.884 0.000 -7.3 -13.1 1.8588Public school -1.62289 -78.733 0.000 -80.3 -49.8 0.4243Prep course 0.29309 16.974 0.000 34.1 9.2 0.3010Income 0.34161 64.566 0.000 40.7 50.7 1.2014Mother Education
High school graduate 0.35783 30.580 0.000 43.0 16.3 0.4229Some college 0.55134 19.172 0.000 73.6 12.1 0.2068College graduate 0.53902 26.160 0.000 71.4 20.5 0.3461Unknown -0.33874 -11.289 0.000 -28.7 -4.7 0.1433
N = 256684b = raw coefficient
z = z-score fore test of b = 0P > z = p-value for z-test
% = percentage change in odds for unit increase in X%StdX = percentage change in odds for SD increase in X
SDofX = standard deviation of X
5.18 shows the percentage of minorities who would have been accepted and there’s a great
disparity in comparison with the total population. Only whites and Asians have a percentage
of acceptance that is greater than their distribution in the total population. One interesting
finding is that Asian is negative for this particular major, whereas for majors that require
a higher ENEM score it is positive. The main reason is because a greater number of white
students were able to meet this threshold in comparison to other racial groups since the
threshold was much lower in comparison to other years. One of the most significant variables
is public school, the odds of being accepted are lowered by 80.3 percent for students who

71
studied at public high schools. The other variables were all significant and the results are
shown in Table 5.21.
2006. In the year of 2006, there are some disturbing findings. No brown or indigenous
student met the threshold for acceptance in Medicine. Again, there’s a significant disparity
among racial groups and acceptance at USP as indicated in the Tables 5.22 and 5.23 for
both Medicine and Natural Sciences, which again had the lowest ENEM scores of students
accepted at USP.
Table 5.22. Race vs. Acceptance in Medicine USP - 2006
Accepted White Black Brown Indigenous Asian Total
Yes 202 13 0 0 29 244
82.79% 5.33% 0% 0% 11.89% 100%
No 174,895 77,601 19,852 1,865 8,196 282,409
61.93% 27.48% 7.03% 0.66% 2.90% 100%
Total 175,097 77,614 19,852 1,865 8,225 282,653
61.95% 27.46% 7.02% 0.66% 2.91% 100%
Table 5.23. Race vs. Acceptance in Natural Sciences USP - 2006
Accepted White Black Brown Indigenous Asian Total
Yes 27,865 4,435 748 79 2,150 35,277
78.99% 12.57% 2.12% 0.22% 6.09% 100%
No 147,232 73,179 19,104 1,786 6,075 247,376
59.52% 29.58% 7.72% 0.72% 2.46% 100%
Total 175,097 77,614 19,852 1,865 8,225 282,653
61.95% 27.46% 7.02% 0.66% 2.91% 100%
Every student who made an ENEM score ≥ 34.84 was assigned a dummy variable, pnsci,
to indicate that s/he would have exceeded the threshold for acceptance in this particular
major. Because this was the major with the lowest ENEM score, this student would only

72
have passed at USP if s/he had chosen this major. The highest ENEM scores were found
in the Medicine major and the students who were accepted scored ≥ 56.44. A dummy
variable, pmed, was also created for students who would have exceeded the threshold grade
for Medicine. Looking at the average score of all students accepted into USP, a student
would have had to score ≥ 46.34 on average to be accepted in 2006. A dummy variable,
pavg, was created to indicate students who would have met this criteria. This is illustrated
in Figure 5.3.
Figure 5.3. ENEM Score Distribution by Race
The logit regression estimates can be found at Appendix D.14 and the percent change
in odds can be found in Tables 5.24, 5.25, and 5.26. Because no brown and indigenous
students passed in Medicine, these variables were omitted from the analysis. As shown in
the Tables 5.22 and 5.23, in this particular year, there is a significant disparity among racial
groups. It is appalling that out of 19,852 students who self classify as brown none would

73
have passed in this particular major. Notice that only 13 black students out of 77,601 would
have met the criteria for acceptance. Even when looking at the Natural Sciences major, the
percentage distribution of students who would have been accepted is not representative of
the population.
The logit results for Medicine in column (3), indicate that the variable black loses statis-
tical significance compared to the results for Natural Sciences (pnsci) in column (3) and for
the average score (pavg) columns, but is still significant at the 0.05 level (see Appendix D.14).
The main reason being the fact that only 13 black students would fit into this category, see
Table 5.22.
Table 5.24. Logit: Percentage Change in Odds (2006 Passing Medicine - Full Model)
Odds of: yes vs noVariables (pmed) b z P > |z| % %Stdx SDofxBlack -0.66511 -2.292 0.022 -48.6 -25.7 0.4463Asian 0.75732 3.568 0.000 113.3 13.6 0.1681Victim -0.06925 -0.306 0.759 -6.7 -2.2 0.3257Racist 0.21592 0.748 0.454 24.1 3.8 0.1724Female -1.38219 -9.187 0.000 -74.9 -49.2 0.4902Age -0.00417 -0.055 0.956 -0.4 -0.8 1.8605Public school -3.19871 -9.165 0.000 -95.9 -73.5 0.4157Prep course 0.34820 2.118 0.034 41.7 10.5 0.2871Income 0.46101 7.865 0.000 58.6 74.8 1.2115Mother Education
High school graduate -0.25660 -1.128 0.259 -22.6 -10.1 0.4140Some college 0.08190 0.298 0.766 8.5 1.6 0.1995College graduate 0.45110 2.726 0.006 57.0 16.5 0.3389Unknown -0.05037 -0.084 0.933 -4.9 -0.8 0.1558
N = 282653b = raw coefficient
z = z-score fore test of b = 0P > z = p-value for z-test
% = percentage change in odds for unit increase in X%StdX = percentage change in odds for SD increase in X
SDofX = standard deviation of X

74
Looking at the most competitive major, which is Medicine, mother’s education loses
statistical significance. The only category that is still significant at 0.01 and seems to matter
is mother with a college degree. Not knowing the mother’s education, or having a mother
with high school diploma or some college is not statistically significant. Age also loses
significance. See Table 5.24. The odds of being accepted is 48.6 percent smaller for blacks,
holding everything else constant. On the other hand, the odds of being accepted is increased
by 113.3 percent for Asian students. The odds of passing in Medicine are lowered by 74.9
percent for females than males, holding everything else constant. Also, studying in a public
school lowers the odds by 95.9 percent on average, while taking a prep course increases by
41.7 percent, holding everything else constant. Not surprisingly, an increase in the income
category increases the odds of passing in Medicine by 58.6 percent.
Looking at the average score (pavg), the odds of passing in this category is 34.7 percent
smaller for blacks, and 66.9 percent smaller for browns, holding everything else constant.
On the other hand, being Asian increases the odds of passing by 54.9 percent. Public school
and prep course had a significant effect as well. Studying in a public high school lowers the
odds by 87.7 percent while taking a preparatory course, the cursinho, increases the odds by
103 percent. It is also clear that the higher the education of the mother, the higher the odds
of passing in this category. Refer to Table 5.25 for results.
Looking at the major that had the lowest ENEM score, which is Natural Sciences, being
black, brown and indigenous lowers the odds of being accepted in Natural Sciences by 31.7
percent, 53.8 percent and 47.3 percent, holding everything else constant. Table 5.23 shows
the percentage of minorities who would have been accepted and there is a great disparity
in comparison with the total population. Only whites and Asians have a percentage of
acceptance that is greater than their distribution in the total population. The odds of passing
in Natural Sciences are increased by 34 percent for Asian students, holding everything else
constant. Female students are also at a disadvantage here. The odds of passing in this

75
Table 5.25. Logit: Percentage Change in Odds (2006 Passing Avg. Score - Full Model)
Odds of: yes vs noVariables (pavg) b z P > |z| % %Stdx SDofxBlack -0.42639 -9.116 0.000 -34.7 -17.3 0.4463Brown -1.10673 -8.483 0.000 -66.9 -24.6 0.2555Indigenous -0.93249 -2.563 0.010 -60.6 -7.3 0.0810Asian 0.43782 8.358 0.000 54.9 7.6 0.1681Victim 0.14816 3.129 0.002 16.0 4.9 0.3257Racist -0.00188 -0.028 0.978 -0.2 -0.0 0.1724Female -1.01219 -36.670 0.000 -63.7 -39.1 0.4902Age -0.07977 -5.410 0.000 -7.7 -13.8 1.8605Public school -2.09404 -47.585 0.000 -87.7 -58.1 0.4157Prep course 0.70793 21.166 0.000 103.0 22.5 0.2871Income 0.40447 32.475 0.000 49.9 63.2 1.2115Mother Education
High school graduate 0.05789 1.417 0.157 6.0 2.4 0.4140Some college 0.26683 4.894 0.000 30.6 5.5 0.1995College graduate 0.53616 15.439 0.000 70.9 19.9 0.3389Unknown -0.64181 -4.121 0.000 -47.4 -9.5 0.1558
N = 282653b = raw coefficient
z = z-score fore test of b = 0P > z = p-value for z-test
% = percentage change in odds for unit increase in X%StdX = percentage change in odds for SD increase in X
SDofX = standard deviation of X
category are lowered by 57.9 percent on average for females than males. One of the most
significant variables is public school, the odds of being accepted are lowered by 80.1 percent
for students who studied at public high schools. While taking a prep course increases the odds
by 104.5 percent. Income is also significant, one increase in the income category increases
the odds by 46.2 percent. Here, there is a clear relationship between mother’s education
and acceptance. The higher the mother’s education, the higher the odds of passing in this
particular major. It is important to emphasize again, that a student who scored 34.84 on
the ENEM would only be able to pass in this particular major of Natural Sciences whereas

76
Table 5.26. Logit: Percentage Change in Odds (2006 Passing Natural Sciences - Full Model)
Odds of: yes vs noVariables (pnsci) b z P > |z| % %Stdx SDofxBlack -0.38068 -19.810 0.000 -31.7 -15.6 0.4463Brown -0.77280 -18.392 0.000 -53.8 -17.9 0.2555Indigenous -0.64000 -5.131 0.000 -47.3 -5.0 0.0810Asian 0.29246 9.146 0.000 34.0 5.0 0.1681Victim 0.20224 8.531 0.000 22.4 6.8 0.3257Racist -0.02436 -0.659 0.510 -2.4 -0.4 0.1724Female -0.86407 -63.853 0.000 -57.9 -34.5 0.4902Age -0.18509 -27.198 0.000 -16.9 -29.1 1.8605Public school -1.61586 -96.230 0.000 -80.1 -48.9 0.4157Prep course 0.71536 37.168 0.000 104.5 22.8 0.2871Income 0.37946 58.196 0.000 46.2 58.4 1.2115Mother Education
High school graduate 0.31274 17.884 0.000 36.7 13.8 0.4140Some college 0.50750 18.572 0.000 66.1 10.7 0.1995College graduate 0.63502 35.231 0.000 88.7 24.0 0.3389Unknown -0.48163 -7.708 0.000 -38.2 -7.2 0.1558
N = 282653b = raw coefficient
z = z-score fore test of b = 0P > z = p-value for z-test
% = percentage change in odds for unit increase in X%StdX = percentage change in odds for SD increase in X
SDofX = standard deviation of X
a student who met the threshold for Medicine would have been able to pass in any major
offered at this particular year.
2005. For the year of 2005, the lowest ENEM score was in Audiology major at Santa
Casa campus. Thus, every student who made an ENEM score ≥ 24.29 was assigned a binary
variable, pfonosc, to indicate that s/he would have exceeded the threshold for acceptance in
this particular major. Because this was the major with the lowest ENEM score, this student
would only have passed at USP if s/he had chosen this major. The highest ENEM scores
were found in the Medicine major and the students who were accepted scored ≥ 57.73. A
binary variable, pmed, was also created for students who would have exceeded the threshold

77
grade for Medicine. Looking at the average score of all students accepted into USP, a student
would have had to score ≥ 48.66 on average to be accepted in 2005. A binary variable, pavg,
was created to indicate students who would have met this criteria. Refer to Figure 5.4.
Figure 5.4. ENEM Score Distribution by Race
The logit regression estimates can be found at Appendix D.15 and the percent change in
odds can be found in Tables 5.29, 5.30, and 5.31.
These results indicate that no brown student, out of 18,219 students in this category,
would have passed in Medicine. Also the results for indigenous and black students are pretty
alarming.
Out of 1,326 indigenous students only 1 would have passed, and out of 74,485 black
students only 29 would have passed. Thus a significant disparity among racial groups and
acceptance at USP is indicated in Tables 5.27 and 5.28. As a result, in my analysis brown
is not included for Medicine, and the variables blacks and indigenous are not statistically

78
Table 5.27. Race vs. Acceptance in Medicine USP - 2005
Accepted White Black Brown Indigenous Asian Total
Yes 237 29 0 1 28 295
80.34% 9.83% 0% 0.34% 9.49% 100%
No 166,266 74,485 18,219 1,563 7,466 267,999
62.04% 27.79% 6.80% 0.54% 2.79% 100%
Total 166,503 74,514 18,219 1,564 7,494 268,294
62.06% 27.77% 6.80% 0.58% 2.79% 100%
Table 5.28. Race vs. Acceptance in Audiology USP - 2005
Accepted White Black Brown Indigenous Asian Total
Yes 82,046 22,502 4,929 396 4,231 114,104
71.90% 19.72% 4.32% 0.35% 3.71% 100%
No 84,457 52,012 13,290 1,168 3,263 154,190
54.77% 33.73% 8.62% 0.76% 2.12% 100%
Total 166,503 74,514 18,219 1,564 7,494 268,294
62.06% 27.77% 6.79% 0.58% 2.79% 100%
significant. Even though the lowest category, pfonosc, had a much lower ENEM score
than in previous years, when looking at the Audiology major, the percentage distribution of
students who would have been accepted is still not representative of the population.
In addition, no students were admitted in Medicine who did not know their mother’s
education, thus this variable was also omitted from the model.
The results for students who would have passed the most competitive major, Medicine,
show that mother’s education loses statistical significance except for college graduates. Hav-
ing a mother with a high school diploma or some college is not statistically significant. Age
also loses significance. Refer to Table 5.29. The odds of being accepted is increased by
76.2 percent for Asian students. While, the odds of passing in Medicine are lowered by 69.2
percent for females than males, holding everything else constant. Also, studying in a public

79
Table 5.29. Logit: Percentage Change in Odds (2005 Passing Medicine - Full Model)
Odds of: yes vs noVariables (pmed) b z P > |z| % %Stdx SDofxBlack 0.05695 0.280 0.779 5.9 2.6 0.4479Indigenous 0.67528 0.668 0.504 96.5 5.3 0.0761Asian 0.56655 2.654 0.008 76.2 9.8 0.1648Victim 0.06113 0.308 0.758 6.3 2.0 0.3266Racist 0.18816 0.743 0.457 20.7 3.2 0.1658Female -1.17733 -8.980 0.000 -69.2 -43.8 0.4890Age -0.07312 -1.011 0.312 -7.1 -12.6 1.8448Public school -2.99110 -10.497 0.000 -95.0 -70.3 0.4059Prep course 0.62038 4.500 0.000 86.0 19.3 0.2840Income 0.49873 9.164 0.000 64.7 79.7 1.1748Mother Education
High school graduate -0.33910 -1.633 0.103 -28.8 -12.9 0.4078Some college 0.22452 0.965 0.334 25.2 4.5 0.1952College graduate 0.45065 2.949 0.003 56.9 15.9 0.3280
N = 268294b = raw coefficient
z = z-score fore test of b = 0P > z = p-value for z-test
% = percentage change in odds for unit increase in X%StdX = percentage change in odds for SD increase in X
SDofX = standard deviation of X
school lowers the odds by 95 percent on average, while taking a prep course increases the
odds by 86 percent, holding everything else constant. Not surprisingly, an increase in the
income category, increases the odds of passing in Medicine by 64.7 percent.
Looking at the average score (pavg), the odds of passing in this category is 36.6 percent
smaller for blacks, and 74.3 smaller for browns, holding everything else constant. On the
other hands, being Asian increases the odds of passing by 58.5 percent.
Studying in a public high school lowers the odds by 88.7 percent while taking a prepara-
tory course, the cursinho, increases the odds by 100.6 percent. It is also clear that the higher
the education of the mother, the higher the odds of passing in this category. While a mother

80
Table 5.30. Logit: Percentage Change in Odds (2005 Passing Avg. Score - Full Model)
Odds of: yes vs noVariables (pavg) b z P > |z| % %Stdx SDofxBlack -0.45600 -9.446 0.000 -36.6 -18.5 0.4479Brown -1.35679 -9.062 0.000 -74.3 -28.9 0.2516Indigenous -0.65417 -1.905 0.057 -48.0 -4.9 0.0761Asian 0.46081 8.733 0.000 58.5 7.9 0.1648Victim 0.22406 4.757 0.000 25.1 7.6 0.3266Racist 0.05811 0.897 0.370 6.0 1.0 0.1658Female -0.89207 -32.802 0.000 -59.0 -35.4 0.4890Age -0.10555 -6.839 0.000 -10.0 -17.7 1.8448Public school -2.18409 -49.491 0.000 -88.7 -58.8 0.4059Prep course 0.69638 20.854 0.000 100.6 21.9 0.2840Income 0.37789 29.389 0.000 45.9 55.9 1.1748Mother Education
High school graduate 0.20931 5.107 0.000 23.3 8.9 0.4078Some college 0.44251 8.274 0.000 55.7 9.0 0.1952College graduate 0.67351 18.484 0.000 96.1 24.7 0.3280Unknown -0.92724 -4.487 0.000 -60.4 -12.8 0.1472
N = 268294b = raw coefficient
z = z-score fore test of b = 0P > z = p-value for z-test
% = percentage change in odds for unit increase in X%StdX = percentage change in odds for SD increase in X
SDofX = standard deviation of X
with high school diploma increases the odds by 23.3 percent, having a mother with college
degree can increase the odds by 96.1 percent. Refer to Table 5.30 for results.

81
Table 5.31. Logit: Percentage Change in Odds (2005 Passing Audiology - Full Model)
Odds of: yes vs noVariables (pfonosc) b z P > |z| % %Stdx SDofxBlack -0.30944 -29.106 0.000 -26.6 -12.9 0.4479Brown -0.48862 -24.318 0.000 -38.7 -11.6 0.2516Indigenous -0.56813 -8.969 0.000 -43.3 -4.2 0.0761Asian -0.01225 -0.429 0.668 -1.2 -0.2 0.1648Victim 0.17136 11.458 0.000 18.7 5.8 0.3266Racist -0.10580 -3.779 0.000 -10.0 -1.7 0.1658Female -0.37961 -41.228 0.000 -31.6 -16.9 0.4890Age -0.14846 -49.914 0.000 -13.8 -24.0 1.8448Public school -1.53518 -105.754 0.000 -78.5 -46.4 0.4059Prep course 0.39387 24.796 0.000 48.3 11.8 0.2840Income 0.30242 60.865 0.000 35.3 42.7 1.1748Mother Education
High school graduate 0.39552 35.683 0.000 48.5 17.5 0.4078Some college 0.67724 27.931 0.000 96.8 14.1 0.1952College graduate 0.72267 42.750 0.000 106.0 26.7 0.3280Unknown -0.47436 -13.702 0.000 -37.8 -6.7 0.1472
N = 268294b = raw coefficient
z = z-score fore test of b = 0P > z = p-value for z-test
% = percentage change in odds for unit increase in X%StdX = percentage change in odds for SD increase in X
SDofX = standard deviation of X
Looking at the major that had the lowest ENEM score, which is Audiology, being black,
brown and indigenous lowers the odds of being accepted in Audiology by 26.6 percent, 38.7
percent and 43.3 percent, holding everything else constant. It is important to emphasize that
because the score of 24.29 is such a low threshold, many more white students would have
been admitted in comparison to other years. The variable Asian loses statistical significance.
Table 5.28 shows the percentage of minorities who would have been accepted and there’s a
great disparity in comparison with the total population. Again, only whites and Asians have
a percentage of acceptance that is greater than their distribution in the total population.

82
Female students remain at a disadvantage, since the odds of passing in this category is
lowered by 31.6 percent on average for females than males.
One of the most significant variables is public school, the odds of being accepted are
lowered by 78.5 percent for students who studied at public high schools. While taking a
prep course increases the odds by 48.3 percent. Income is also significant, one increase in
the income category increases the odds by 35.3 percent.
There is a clear relationship between mother’s education and acceptance in Audiology.
The higher the mother’s education, the higher the odds of passing in this particular major.
While having a mother with high school degree increases the odds by 48.5 percent, having a
mother with a college degree increases the odds by 106 on average, holding everything else
constant.
It is important to emphasize again, that a student who scored 24.29 on the ENEM would
only be able to pass in this particular major whereas a student who met the threshold for
Medicine would have been able to pass in any major offered in 2005.
2004. Before presenting the results of 2004, one important fact that needs to be ad-
dressed is that comparing 2004 with other years, the number of students taking the ENEM
exam nationwide doubled from 2004 to 2005. Refer to Table 2.1 in chapter 2. Even within the
state of Sao Paulo there are about 18,500 thousand students missing in 2004 compared with
2005 and other years. As a result, in 2004 there are many fewer black and brown students
in comparison with 2005 and later years. In 2005, there were 74,514 black students whereas
in 2004 there were only 1,204, and 18,219 brown students versus 1,028. Another problem
already discussed in previous chapters is that many people who self-classify as white are in
fact Afro-descendant and could have been included in the brown or black category. Because
race definition and identity is so complex in Brazil, one have to rely on self-classification,
regardless of outward appearances and one’s own perceptions of race. Thus, the results for

83
the year 2004 need to be analyzed with cautious since this bias in racial classification could
have affected the results. Figure 5.5 clearly indicates this bias.
Figure 5.5. ENEM Score Distribution by Race
The lowest ENEM score in 2004, was in Audiology major at Bauru campus. Thus,
every student who made an ENEM score ≥ 40.93 was assigned a binary variable, pfonob, to
indicate that s/he would have exceeded the threshold for acceptance in this particular major.
Because this was the major with the lowest ENEM score, this student would only have passed
at USP if s/he had chosen this major. The highest ENEM scores were found in the Medicine
major and the students who were accepted scored ≥ 56.89. A binary variable, pmed, was also
created for students who would have exceeded the threshold grade for Medicine. Looking at
the average score of all students accepted into USP, a student would have had to score ≥
49.59 on average to be accepted in 2004. A binary variable, pavg, was created to indicate
students who would have met this criteria.

84
The logit regression estimates can be found at Appendix D.16 and the percent change in
odds can be found in Tables 5.34, 5.35, and 5.36.
Table 5.32. Race vs. Acceptance in Medicine USP - 2004
Accepted White Black Brown Indigenous Asian Total
Yes 2,449 19 1 13 49 2,531
96.76% 0.75% 0.04% 0.51% 1.94% 100%
No 238,589 1,204 1,027 5,371 986 247,177
96.53% 0.49% 0.42% 2.17% 0.40% 100%
Total 241,038 1,223 1,028 5,384 1,035 249,708
96.53% 0.49% 0.41% 2.16% 0.41% 100%
Table 5.33. Race vs. Acceptance in Audiology USP - 2004
Accepted White Black Brown Indigenous Asian Total
Yes 37,656 193 26 195 429 38,499
97.81% 0.50% 0.07% 0.51% 1.11% 100%
No 203,382 1,030 1,002 5,189 606 211,209
96.29% 0.49% 0.47 % 2.46% 0.29% 100%
Total 241,038 1,223 1,028 5,384 1,035 249,708
96.53% 0.49% 0.41% 2.16% 0.41% 100%
Although there is an under reporting of blacks and browns in 2004, the results still
show great disparity among racial groups. Looking at the most competitive major, which
is Medicine, only one brown student would have been admitted out of 1,027 students and
only 19 black students out of 1,204 students. Indigenous students also are at a major
disadvantage: only 13 out of 5,284 (.51%) would have been admitted. As a result, on
my analysis for Medicine, the variables blacks, brown and indigenous are not statistically
significant. See Tables 5.32 and 5.33.
When looking at the average score, pavg, the most significant variables are public school,
prep course, female, Asian and mother education.

85
Table 5.34. Logit: Percentage Change in Odds (2004 Passing Avg. Score - Full Model)
Odds of: yes vs noVariables (pavg) b z P > |z| % %Stdx SDofxBlack 0.42351 3.223 0.001 52.7 3.0 0.0698Brown -0.32831 -0.920 0.357 -28.0 -2.1 0.0640Indigenous -0.25772 -1.905 0.057 -22.7 -3.7 0.1452Asian 1.30128 14.758 0.000 267.4 8.7 0.0642Victim 0.08731 2.593 0.010 9.1 2.8 0.3151Racist 0.00315 0.066 0.947 0.3 0.1 0.1857Female -0.98350 -48.112 0.000 -62.6 -38.3 0.4902Age -0.13380 -10.743 0.000 -12.5 -16.5 1.3513Public school -1.77689 -62.711 0.000 -83.1 -54.2 0.4399Prep course 0.75538 29.835 0.000 112.8 26.5 0.3109Income 0.35240 37.853 0.000 42.2 55.3 1.2498Mother Education
High school graduate 0.18322 6.270 0.000 20.1 7.7 0.4071Some college 0.43965 11.273 0.000 55.2 9.8 0.2125College graduate 0.64845 24.526 0.000 91.3 25.8 0.3539Unknown -0.61877 -5.578 0.000 -46.1 -9.0 0.1521
N = 249708b = raw coefficient
z = z-score fore test of b = 0P > z = p-value for z-test
% = percentage change in odds for unit increase in X%StdX = percentage change in odds for SD increase in X
SDofX = standard deviation of X

86
Looking at Asians in Table 5.33 out of 1,035 Asian students 429 would have passed,
about 42 percent. Thus, the odds of passing in Audiology increased by 195.3 percent for
Asian students, holding everything else constant.
Studying at a public school has the opposite effect. It lowers the odds by 79.1 percent,
while attending a prep course increases the odds by 96.4 percent.
Female students have the odds lowered by 55.3 percent on average compared to male
students.
As in the other analyses, mother’s education is very significant. The higher the mother’s
education, the higher the odds of being accepted.
Table 5.35. Logit: Percentage Change in Odds (2004 Passing Medicine - Full Model)
Odds of: yes vs noVariables (pmed) b z P > |z| % %Stdx SDofxBlack 0.43814 1.810 0.070 55.0 3.1 0.0698Brown -0.92404 -0.908 0.364 -60.3 -5.7 0.0640Indigenous -0.04842 -0.170 0.865 -4.7 -0.7 0.1452Asian 0.89362 5.673 0.000 144.4 5.9 0.0642Victim 0.12036 1.764 0.078 12.8 3.9 0.3151Racist 0.04882 0.527 0.598 5.0 0.9 0.1857Female -1.13865 -25.424 0.000 -68.0 -42.8 0.4902Age -0.05634 -2.193 0.028 -5.5 -7.3 1.3513Public school -2.09056 -29.523 0.000 -87.6 -60.1 0.4399Prep course 0.78224 16.190 0.000 118.6 27.5 0.3109Income 0.38548 20.334 0.000 47.0 61.9 1.2498Mother Education
High school graduate -0.00392 -0.059 0.953 -0.4 -0.2 0.4071Some college 0.46753 5.952 0.000 59.6 10.4 0.2125College graduate 0.56802 10.383 0.000 76.5 22.3 0.3539Unknown -0.90189 -3.187 0.001 -59.4 -12.8 0.1521
N = 249708b = raw coefficient
z = z-score fore test of b = 0P > z = p-value for z-test
% = percentage change in odds for unit increase in X%StdX = percentage change in odds for SD increase in X
SDofX = standard deviation of X

87
The results for students who would have passed in Medicine show that mother’s education
loses statistical significance for high school graduates. However, having a mother with some
college increases the odds by 59.6 percent and with a college degree increases the odds by
76.5 percent. The odds of being accepted are increased by 144.4 percent for Asian students
while, the odds of passing in Medicine are lowered by 68 percent for female students, holding
everything else constant. Studying in a public school lowers the odds by 87.6 percent on
average, while taking a prep course increases the odds by 118.6 percent, holding everything
else constant. An increase in the income category, increases the odds of passing in Medicine
by 47 percent.
Table 5.36. Logit: Percentage Change in Odds (2004 Passing Audiology - Full Model)
Odds of: yes vs noVariables (pfonob) b z P > |z| % %Stdx SDofxBlack 0.28876 2.999 0.003 33.5 2.0 0.0698Brown -0.61309 -2.858 0.004 -45.8 -3.8 0.0640Indigenous -0.50745 -6.474 0.000 -39.8 -7.1 0.1452Asian 1.08303 14.295 0.000 195.4 7.2 0.0642Victim 0.06215 2.875 0.004 6.4 2.0 0.3151Racist 0.00898 0.278 0.781 0.9 0.2 0.1857Female -0.80573 -62.128 0.000 -55.3 -32.6 0.4902Age -0.18054 -23.683 0.000 -16.5 -21.6 1.3513Public school -1.56365 -99.002 0.000 -79.1 -49.7 0.4399Prep course 0.67522 37.522 0.000 96.4 23.4 0.3109Income 0.33218 53.941 0.000 39.4 51.5 1.2498Mother Education
High school graduate 0.34218 20.240 0.000 40.8 14.9 0.4071Some college 0.56834 22.258 0.000 76.5 12.8 0.2125College graduate 0.71432 41.024 0.000 104.3 28.8 0.3539Unknown -0.42360 -7.255 0.000 -34.5 -6.2 0.1521
N = 249708b = raw coefficient
z = z-score fore test of b = 0P > z = p-value for z-test
% = percentage change in odds for unit increase in X%StdX = percentage change in odds for SD increase in X
SDofX = standard deviation of X

88
Because of the race reporting problem mentioned in the beginning of this section, when
analyzing the lowest category for Audiology, the variable black appears to be positive and
significant. The reason is that although only .50% of students accepted would have been
black, this percentage is higher than the total population of blacks .49%. The fact that
only 1,223 students claimed to be black adversely affected the results. Thus, one should be
cautious in drawing conclusions, since it is clear that there is still a big disparity among
races as illustrated by Table 5.33.
Nevertheless, one of the most significant variables in this analysis is public school. The
odds of being accepted are lowered by 79.1 percent for students who studied at public
high schools while taking a prep course increases the odds by 96.4 percent. Income is also
significant, one increase in the income category increases the odds by 39.4 percent.
There is a clear relationship between mother’s education and acceptance in Audiology.
The higher the mother’s education, the higher the odds of passing in this particular major.
While having a mother with high school degree increases the odds by 40.8 percent, having a
mother with college degree increases the odds by 104.3 percent on average, holding everything
else constant.
V ictim and Racist Variables
Examining the results of the tables in the previous sections, one surprising finding is that
being a victim of racial discrimination was a positive and significant predictor of passing at
the University of Sao Paulo for most years and categories. Only in 2006 and 2008 under pmed
the coefficient victim is negative, statistical insignificance. This is opposite to the expected
effect. In other words, students who were victimized were more likely to be accepted into
the University of Sao Paulo.
Multicollinearity was suspected and several tests were run to check whether or not this
was the case. I ran vif and collin tests for all years of the dataset, and the results were well

89
below the threshold that would indicate multicollinearity. See Appendix D.2 and D.4. The
only two variables that were slightly more correlated than others were income and mother’s
education. Thus, I re-ran the model using only one of those variables at a time to see if there
would be any change, but in both cases my variables did not change signs and only became
slightly more significant. Hence, I kept both variables in my full model.
No multicollinearity was detected and although intuition would make us expect that
victimization would have a negative and significant effect, we find the opposite result. This
apparently strangle result can be explained in several ways. It may be that although a student
was discriminated against because of his/her color, this motivated the student to study hard
to prove that they could accomplish something great in life, such as being admitted to USP, a
highly prestigious university. Such students became resilient and persevered despite suffering
discrimination. Or alternatively, the reason why the student was discriminated against could
have been because s/he was actually considered by peers to be intelligent (a nerd) making
him/her targets for different forms of discrimination. Likewise, as indicated in Figure 3.5 in
Chapter 3, the most wealthier students also reported being victims of racial discrimination.
Thus, the reason why a student is targeted maybe be more complex than anticipated.
The variable racist, was not statistically significant in any of the models in 2008, 2006
and 2004. In the year 2007, it was only significant under Natural Sciences. The result
indicated that being a racist lowers the odds of being accepted in Natural Sciences by 20.6
percent. Also in the year 2005, it was significant under Audiology, indicating that the odds of
being accepted in this category is lowered by 10 percent. However, since in most occurrences
it was not significant, this could be a random occurrence of significance when variable is in
fact not significant.

90
5.4 Summary
Based on the results above, I can reject the null hypothesis that there is no relationship
between type of high school and vestibular acceptance. For all years analyzed, being from
a public school had a significant negative impact on being admitted to the University of
Sao Paulo. Furthermore, I can also reject the null hypothesis that there is no relationship
between race and vestibular acceptance. For all years it was clear that there was a huge
disparity between acceptance and racial groups. Black, brown and indigenous students on
average scored much lower than whites and Asian students, thus reducing their odds of being
accepted to USP. Refer to Table 5.37 to see the percentage change in odds for all years and
variables.
Based on the results described in the previous sections, I also can conclude that among
the other socio-demographics that negatively influence acceptance at the University of Sao
Paulo are the age of the student and being a woman. The mother’s educational level and
income are also strong determinants of acceptance, due to the fact that they are correlated
with the level of resources available to be spent in education, including the ability to afford
private education or a prep course.
These differentials mean that compared with all students seeking university education
in Brazil, those accepted by the University of Sao Paulo are more likely to be white, to
come from high income families, to come from private high schools, to enroll in cursinho
(vestibular prep course) and to have a mother with high educational attainment.
These conclusions do have limitations. A proxy for acceptance was used. Whether or not
a student actually took the vestibular exam at USP and was admitted is hard to determine
for sure, since this data is not available at this time to draw direct inference. As a result,
even though a student might have taken the ENEM exam, s/he may not have taken the USP
vestibular and hence should not have been considered in the analysis. Also, the University

91
of Sao Paulo is the best university of Latin America, thus the characteristics of students
admitted at this university might be very different than students admitted at another public
university such as the Universidade Estadual Paulista (UNESP). With respect to women
the ENEM score analyzed corresponded to the objective part of the exam and many studies
have shown that women tend to perform worse than men on objective exams. Although the
ENEM exam has a essay part, because the grading is subjective to the person grading the
exam, this was not included in the analysis. Women comprise of 56 percent of undergraduate
students enrolled in Brazilian higher education institutions and the predominance of women
among students in higher education seems to be a lasting trend [Tomelin, 2002].
Although the analysis compares the score of students who took the ENEM exam with
those accepted at USP, based on data provided by FUVEST I find that my results are very
consistent with the fuller dataset. The racial differentials found in this study are similar to
the actual racial distribution of students who were admitted to the University of Sao Paulo
as indicated in Table 5.38 for all majors and on Table 5.39 where only the Medicine major
percentages are shown. Likewise, looking at type of school, the results found in this study
are similar to the actual distribution of type of school for students who were admitted to the
University of Sao Paulo as indicated in Table 5.40 for all majors and on Table 5.41 where
only the Medicine major percentages are shown.

92
Table 5.37. Logit: Percentage Change in Odds (2008-2004 Full Models)
Odds of: yes vs. no
Variables % 2008 % 2007 % 2006 % 2005 % 2004
Medicine Nat. Science Medicine Nat. Science Medicine Nat. Science Medicine Audiology Medicine Audiology
Black -35.8* -35.6*** -35.7*** -29.1*** -48.6* -31.7*** 5.9 -26.6*** 55.0 33.5**
Brown -89.9* -52.5*** -57.0*** -39.1*** -53.8*** -38.7*** -60.3 -45.8**
Indigenous 26.1 -59.6*** -5.8 -49.4*** -47.3*** 96.5 -43.3*** -4.7 -39.8***
Asian 85.7*** 38.9*** 39.4*** -14.1*** 113.3*** 34.0*** 76.2** -1.2 144.4*** 195.4***
Victim -2.6 21.8*** 18.2*** 16.2*** -6.7 22.4*** 6.3 18.7*** 12.8 6.4**
Racist -6.3 -3.6 9.6 -20.6*** 24.1 -2.4 20.7 -10.0*** 5.0 0.9
Female -63.2*** -46.4*** -57.1*** -24.9*** -74.9*** -57.9*** -69.2*** -31.6*** -68.0*** -55.3***
Age 23.5*** -3.5*** -11.9*** -7.3*** -0.4 -16.9*** -7.1 -13.8*** -5.5* -16.5***
Public school -85.6*** -74.2*** -80.8*** -80.3*** -95.9*** -80.1*** -95.0*** -78.5*** -87.6*** -79.1***
Prep course 79.2*** 134.1*** 107.3*** 34.1*** 41.7* 104.5*** 86.0*** 48.3*** 118.6*** 96.4***
Income 65.7*** 52.7*** 52.3*** 40.7*** 58.6*** 46.2*** 64.7*** 35.3*** 47.0*** 39.4***
Mother Education
High school graduate -35.1* 31.4*** 12.3*** 43.0*** -22.6 36.7*** -28.8 48.5*** -0.4 40.8***
Some college -13.1 68.3*** 31.4*** 73.6*** 8.5 66.1*** 25.2 96.8*** 59.6*** 76.5***
College graduate 34.7* 79.7*** 61.9*** 71.4*** 57.0** 88.7*** 56.9** 106.0*** 76.5*** 104.3***
Unknown -80.6 -27.6*** -48.8*** -28.7*** -4.9 -38.2*** -37.8*** -59.4** -34.5***
N= 300870 300870 256684 256684 282653 282653 268294 268294 249708 249708
% = percentage change in odds for unit increase in X∗p < 0.05, ∗ ∗ p < 0.01, ∗ ∗ ∗p < 0.001

93
Table 5.38. All Majors Acceptance by Race at USP 2008-2004
Race 2008 2007 2006 2005 2004
White 8,683 (77.7%) 8,743 (77.2%) 8,866 (77.4%) 8,565 (77.1%) 8,064 (79.8% )
Black 220 (2.0%) 217 (1.9%) 180 (1.6%) 175 (1.6%) 162 (1.6%)
Asian 1,024 (9.2%) 1,137 (10%) 1,209 (10.6%) 1,176 (10.6%) 993 (9.8%)
Brown 1,219 (10.9%) 1,193 (10.5%) 1,154 (10.1%) 1,162 (10.5%) 864 (8.5%)
Indigenous 26 (0.2%) 42 (0.4%) 40 (0.3%) 37 (0.3%) 27 (27%)
Total 11,172* 11,332* 11,449* 11,115* 10,110*
*The response rate for this question was 99.0% for all years.Source: [Fuvest, 2004-2008]
Table 5.39. Medicine Acceptance by Race at USP 2008-2004
Race 2008 2007 2006 2005 2004
White 276 (76.2%) 281 (78.3%) 289 (77.1%) 285 (75.8%) 292 (78.3%)
Black 1 (0.3%) 5 (1.4%) 1 (0.3%) 2 (0.5%) 0 (0.0%)
Asian 64 (17.7%) 49 (13.6%) 60 (16.0%) 61 (16.2%) 57 (15.3%)
Brown 19 (5.2%) 23 (6.4%) 23 (6.1%) 27 (7.2%) 24 (6.4%)
Indigenous 2 (0.6%) 1 (0.3%) 2 (0.5%) 1 (0.3%) 0 (0.0%)
Total 362* 359* 375* 376* 373*
*This represents roughly 99% of students accepted into this major.Source: [Fuvest, 2004-2008]

94
Table 5.40. All Majors Acceptance by Type of School at USP 2008-2004
Type of School 2008 2007 2006 2005 2004
Private 7,823 (69.7%) 8,029 (70.6%) 8,313 (72.2%) 7,878 (70.6%) 7,261 (71.6%)
Public 2,757 (24.6%) 2,806 (24.7%) 2,559 (22.2%) 2,687 (24.1%) 2,297 (22.6%)
Abroad 64 (0.6%) 23 (0.2%) 16 (0.1%) 18 (0.2%) 21 (0.2%)
Mostly Private 340 (3.0%) 291 (2.6%) 304 (2.6%) 276 (2.5%) 301 (3.0%)
Mostly Public 194 (1.7%) 172 (1.5%) 216 (1.9%) 201 (1.8%) 179 (1.8%)
Other 46 (0.4%) 56 (0.5%) 111 (1.0%) 100 (0.9%) 87 (0.9%)
Total 11,224* 11,377* 11,519* 11,160* 10,146*
*The response rate for this question was 99.0% for all years.Source: [Fuvest, 2004-2008]
Table 5.41. Medicine Acceptance by Type of School at USP 2008-2004
Type of School 2008 2007 2006 2005 2004
Private 325 (88.8%) 316 (86.8%) 340 (90.9%) 355 (93.9%) 346 (92.5%)
Public 22 (6.0%) 42 (11.5%) 18 (4.8%) 17 (4.5%) 18 (4.8%)
Abroad 1 (0.3%) 0 (0%) 1 (0.3%) 0 (0%) 0 (0%)
Mostly Private 15 (4.1%) 4 (1.1%) 11 (2.9%) 3 (0.8%) 7 (1.9%)
Mostly Public 3 (0.8%) 2 (0.5%) 4 (1.1%) 3 (0.8%) 2 (0.5%)
Other 0 (0%) 0 (0%) 0 (0%) 0 (0%) 1 (0.3%)
Total 366* 364* 374* 378 * 374**This represents roughly 99.5% of students accepted into this major.
Source: [Fuvest, 2004-2008]

CHAPTER 6
CONCLUSIONS
Affirmative actions are defined as public policies directed to fulfil the constitutionalprinciples of material equality and to neutralize the perversive effects of discriminationof race, gender, age, or origin. These measures aim to fight not only flagrant mani-festations of discrimination, but de facto discrimination, that is so absolutely rooted inour society, so well rooted, that [most] people do not perceive it.
–Joaquim Barbosa, Justice of the Brazilian Supreme Court[Barbosa, 2012]
The main argument against affirmative action in Brazil today is that it will divide Brazilian
society into racial groups and people will no longer be Brazilians, but whites, blacks, browns,
yellows (Asians), reds (indigenous) and so forth. Despite the rhetoric that Brazil is a racial
democracy, statistics show that these divisions exist and racial discrimination is alive and
well. This study analyzed not only students who claimed to have been discriminated because
of their race, but also looked at racial groups. It became clear that in both instances, non-
white students were at a much bigger disadvantage in comparison to white students. Racial
disparity exists in the Brazilian educational system and is a major contributor to persistent
inequality.
6.1 Main Conclusions
The principal conclusions drawn from these analyses are:
• Victims of racial discrimination are more likely to assign a lower score to the quality
of their education, and more likely to score in lower categories of the ENEM exam.
• Students who claimed to be racists had even lower scores on the ENEM exam and gave
an even lower score for quality of education than victims of racism. It should come as
95

96
no surprise, since someone who claims to be a racist probably did not receive a good
education to start with.
• Non-white students have a lower ENEM score than white students. There are some
disturbing racial disparities that became evident in the comparison case of the Univer-
sity of Sao Paulo. Black and brown students are not only at a disadvantage for being
victimized in school and experiencing a poor learning environment, but also were at
disadvantage when trying to go to a good public university such as USP.
• Although female students were more likely to give a higher ranking for the quality
of education they experienced, they tended to score in lower categories of the ENEM
exam compared to male students. To be fair, only the objective part of the exam was
used in this study. Further analysis looking at both the essay and objective part of the
ENEM exam is necessary, since females tend to do much better on essay exams than
male students and are the majority group in higher education in Brazil.
• Parents’ education plays a key role in the student’s performance, particularly that of
the mother. The more educated the student’s parents are, the more likely the student
is to rank quality of education in a higher category and to score higher in the ENEM
exam. Income has the same influence. The main reason is the fact that parents’
education and income are highly correlated, and this results in more resources being
available to the student for educational purposes. Hence, the student will experience
a better quality of education, will score higher on the ENEM exam and will greatly
increase his or her odds of passing the vestibular at a good public university like USP.
Based on these conclusions, it becomes clear that higher education in Brazil is synony-
mous with elitism and that the lack of accessibility to the general population is an impediment
to social mobility. Although, at a first glance the vestibular may seem like the main reason,

97
it is only part of the problem. The magnitude of the demand for higher education vis-a-vis
supply is not being met and creates an additional problem. As in the case of the University
of Sao Paulo, in November 2012, 159,000 people registered for the vestibular, only 10,982
students will be selected at the USP campus and an additional 100 students for the major of
Medicine at the Medical School at Santa Casa Sao Paulo [USP, 2012]. Thus, it is imperative
that the government also allocates more resources to public universities in order to help
them grow and build more institutions of higher education to meet the growing demand of
students, specially poor minorities.
The Brazilian Constitution of 1988 states that every Brazilian has the right to receive free
education of good quality. Unfortunately, the free education that is available in high schools
is of poor quality and does not met the rigorous requirements of public higher institutions.
Based on the results in Chapter 5, going to a public school reduces the odds of being accepted
in the most competitive degree of Medicine by a average of 88.98 percent at USP and in
one of the least competitive majors of Nature Sciences/Audiology by 78.44 percent. Thus,
policies to improve the quality and curriculum of public high schools are urgent since it will
ensure that poor family will have the incentive, condition and satisfactory welfare to send
their children to public school knowing that public college will be accessible in the future.
In addition, as the results suggest, affirmative action and quotas for students coming
from public high schools and for black, brown and indigenous groups should be implemented
to reduce the racial disparity observed and described above. The fact that no brown or
indigenous student would have been able to be accepted in Medicine in 2005 and 2006, for
example, is absurd. It is essential that the Brazilian government continue to address this
issue by creating more policies to promote access to higher education for under represented
racial groups and create new institutions of higher education.
Racial discrimination affects high school performance and college admission in Brazil.
It affects the overall quality of the high school learning environment, and there is evidence

98
that racial discrimination decreases scores achieved in the ENEM exam. Most importantly,
racial discrimination has an impact on college admission as shown by the disparities among
racial groups. Policies to improve awareness of racial bullying and to punish perpetrators of
racial discrimination at all levels of the educational system will be beneficial to create a safe
and fair learning environment, while educating the next generation of Brazilians important
concepts of equality and fairness. In order to become a true racial democracy, Brazilians have
to acknowledge that racism exists. Because racism is a detrimental factor to a multiracial
society as Brazil, it needs to be a priority that is addressed seriously.
These findings are robust, confirmed by using multiple specifications and sub-samples, and
most of the coefficients were significant at the .001 level.
6.2 Future Research
There seems to be great potential for future research on affirmative action and its effects
in Brazil. As this dissertation was being written, President Dilma Rousseff approved and
signed into law, on August 29, 2012, an affirmative action measure that reserves 50% of slots
in federal universities to students from public high schools [de S. Paulo, 2012]. The selection
of students within this quota system will be determined by their score on the ENEM exam.
Within this quota, half of the slots will be allocated to students whose family income is lower
or equal to 1.5 minimum wage per person in the household [de S. Paulo, 2012], and within
this quota, slots will be reserved for blacks, browns and indigenous people in proportion to
the percentage of these groups within the state where the university is located [de S. Paulo,
2012]. In the state of Sao Paulo, for example, approximately 30% of the population is black,
brown or indigenous, whereas in Bahia this number is close to 70%. According to this new
law, if the quota slots are not filled by the specified racial groups, then the available slots
should go to students who studied only in public high school.

99
This law will be in effect in 2013, although federal universities have four years to imple-
ment the necessary changes. The challenge is considerable. Only 25 federal universities had
a system in place before this law to give bonuses on their vestibular to black, brown and
indigenous students [da Globo, 2012] and currently, out of 59 federal universities, 27 have
not implemented this new affirmative action measure.
State universities, such as the University of Sao Paulo and private universities were not
affected and can choose whether or not to adopt a form of affirmative action. Although
USP, Unicamp and many public state universities have some sort of bonuses for students
coming from public schools, they have not implemented affirmative action. But, as this
dissertation is being written, USP has started to discuss for the first time the possibility of
adopting affirmative action. The results in Chapter 5 indicate that this will be an essential
and beneficial policy since non-white students have, on average, a very low probability of
being accepted into USP. In fact, a recent news article in the Folha newspaper, stated that
the University of Sao Paulo has more African students than Afro-Brazilian students and that
the only black professor in the whole university who also was African, has retired [Bergamim,
2012]. In a society as diverse as Brazil, this is disturbing news. Thus, if approved by USP,
the new policy will be a significant step towards equality and diversity. This could possibly
be the start of the enegrecimento (blackening) of the Brazilian race, as more and more Afro-
descendants who used to say that they were “whites” embrace their roots and become mixed
or black because it is less likely to be a barrier to university admission. As discussed before,
many Afro-Brazilians claim to be white because they accepted the ideal of whitening and
the myth of racial democracy, believing that a lighter complexion and more European facial
features were superior. [Skidmore and Smith, 1997]. Now, there could be a move reversing
these previous notions that will result in Afro-Brazilians being proud of their ancestry and
history.

100
6.3 Concluding Remarks
In a society as multiracial as Brazil, racial discrimination should be addressed with the goal of
creating a safe environment for all groups of students and bringing awareness of prejudice and
violence not only to the school campus, but to the Brazilian society as a whole. Affirmative
action needs to be discussed and taken seriously if Brazil is to become a racial democracy.
The key to social mobility is education. How can Brazilians claim that Brazil is a racial
democracy and race should not be discussed, while the majority of Afro-descendants are not
able to have access to higher education? The reality, unfortunately, is much farther from the
rhetoric than we would like to admit. Although Brazil is a growing economy, the inequality
gap has widened in recent years. The main reason is that blacks and browns people are
being left behind. In order to close this gap, higher education needs to be free and available
to all Brazilians without distinction of racial group or socio-economic status.
In light of these governmental changes, as this new affirmative action law is implemented,
there will be great opportunity for future research. What will be the effects of affirmative
action in Brazil? Will quota students be able to keep up their grades in comparison with
students who entered without quotas? Will Brazil go through an enegrecimento (blackening)
as more Afro-descendants start to identify as black in order to benefit from the quota system?
Will affirmative action level previous disparities observed among racial groups at USP?
As these questions indicate there are many more hypotheses to be tested. Thus, this
is an interesting field of study with many opportunities for research that can have a direct
impact in helping Brazil reach its goal of becoming a democracy with equal opportunity for
every citizen. Brazil seems to be making great strides with these recent changes, it remains
to be seen if one day all students will have a fair opportunity of attending the university of
their choice regardless of their socio-economic background and color.

APPENDIX A
BRAZILIAN STATES
Table A.1. Brazilian States
State Name State Abbreviation
Acre (AC)
Alagoas (AL)
Amapa (AP)
Amazonas (AM)
Bahia (BA)
Ceara (CE)
Distrito Federal (DF)
Espırito Santo (ES)
Goias (GO)
Maranhao (MA)
Mato Grosso (MT)
Mato Grosso do Sul (MS)
Minas Gerais (MG)
Para (PA)
Paraıba (PB)
Parana (PR)
Pernambuco (PE)
Piauı (PI)
Rio de Janeiro (RJ)
Rio Grande do Norte (RN)
Rio Grande do Sul (RS)
Rondonia (RO)
Roraima (RR)
Santa Catarina (SC)
Sao Paulo (SP)
Sergipe (SE)
Tocantins (TO)
101

APPENDIX B
BRAZILIAN MAP
Figure B.1. Brazil’ Five Macro-Regions
Figure extrated from http://commons.wikimedia.org/wiki/File:
States_and_Great_Regions_in_Brazil.png.
102

APPENDIX C
STUDENTS DISTRIBUTION BY BRAZILIAN STATES
Table C.1. Number of Students by Brazilian States
State Name State Abbreviation Freq. Percent Cum.
Acre (AC) 6,665 0.27 0.27
Alagoas (AL) 18,600 0.75 1.01
Amazonas (AM) 31,474 1.26 2.28
Amapa (AP) 8,943 0.36 2.64
Bahia (BA) 175,321 7.04 9.68
Ceara (CE) 79,665 3.20 12.88
Distrito Federal (DF) 23,277 0.94 13.82
Espırito Santo (ES) 52,020 2.09 15.91
Goias (GO) 79,638 3.20 19.10
Maranhao (MA) 30,616 1.23 20.33
Minas Gerais (MG) 270,374 10.86 31.19
Mato Grosso do Sul (MS) 40,156 1.61 32.81
Mato Grosso (MT) 49,097 1.97 34.78
Para (PA) 67,196 2.70 37.48
Paraıba (PB) 23,914 0.96 38.44
Pernambuco (PE) 89,354 3.59 42.03
Piauı (PI) 33,875 1.36 43.39
Parana (PR) 176,089 7.07 50.46
Rio de Janeiro (RJ) 183,811 7.38 57.85
Rio Grande do Norte (RN) 34,813 1.40 59.24
Rondonia (RO) 25,250 1.01 60.26
Roraima (RR) 6,556 0.26 60.52
Rio Grande do Sul (RS) 120,045 4.82 65.34
Santa Catarina (SC) 71,445 2.87 68.21
Sergipe (SE) 16,387 0.66 68.87
Sao Paulo (SP) 752,153 30.21 99.09
Tocantins (TO) 22,775 0.91 100.00
Total 2,489,509 100.00
103

APPENDIX D
COLLINEARITY AND LOGIT OUTPUTS
Table D.1. Collinearity Diagnostics for Model 1 and Model 2
Variables VIF SQRT VIF Tolerance R-Squared
victim 1.10 1.05 0.9068 0.0932
witness 1.09 1.04 0.9194 0.0806
racist 1.02 1.01 0.9822 0.0178
racistenv 1.08 1.04 0.9235 0.0765
non white 1.29 1.14 0.7724 0.2276
female 1.05 1.02 0.9530 0.0470
age 1.91 1.38 0.5240 0.4760
income 1.46 1.21 0.6854 0.3146
publicschool 1.33 1.15 0.7543 0.2457
prepcourse 1.03 1.01 0.9735 0.0265
father hsg 1.20 1.09 0.8353 0.1647
father coll 1.09 1.04 0.9178 0.0822
father bach 1.27 1.13 0.7894 0.2106
father miss 1.19 1.09 0.8431 0.1569
mother hsg 1.19 1.09 0.8383 0.1617
mother coll 1.08 1.04 0.9237 0.0763
mother bach 1.26 1.12 0.7914 0.2086
mother miss 1.16 1.08 0.8605 0.1395
married 1.72 1.31 0.5822 0.4178
children 2.06 1.44 0.4855 0.5145
work 1.06 1.03 0.9469 0.0531
southeast 1.06 1.03 0.9418 0.0582
urban 1.01 1.00 0.9907 0.0093
favela 1.04 1.02 0.9642 0.0358
y2004 1.65 1.29 0.6050 0.3950
y2005 1.56 1.25 0.6407 0.3593
y2006 1.52 1.23 0.6578 0.3422
y2007 1.52 1.23 0.6596 0.3404
Mean VIF 1.29
(obs=2489509)
104

105
Table D.2. Collinearity Diagnostics for Chapter 5 - Year 2008
Variables VIF SQRT VIF Tolerance R-Squaredblack 1.15 1.07 0.8693 0.1307brown 1.19 1.09 0.8437 0.1563indio 1.01 1.00 0.9917 0.0083asian 1.04 1.02 0.9614 0.0386victim 1.15 1.07 0.8697 0.1303racist 1.01 1.00 0.9947 0.0053female 1.02 1.01 0.9835 0.0165age 1.10 1.05 0.9115 0.0885publicschool 1.73 1.31 0.5786 0.4214prepcourse 1.03 1.01 0.9708 0.0292income 1.66 1.29 0.6014 0.3986mother hsg 1.16 1.08 0.8607 0.1393mother coll 1.10 1.05 0.9123 0.0877mother bach 1.45 1.21 0.6876 0.3124mother miss 1.02 1.01 0.9756 0.0244Mean VIF 1.19(obs=300870)
Table D.3. Collinearity Diagnostics for Chapter 5 - Year 2008
Eigenval Cond Index1 5.2717 1.00002 1.2417 2.06053 1.1645 2.12764 1.0150 2.27905 1.0001 2.29596 0.9933 2.30387 0.9639 2.33868 0.9420 2.36569 0.8422 2.501910 0.7761 2.606311 0.5805 3.013612 0.4538 3.408213 0.3586 3.834014 0.2008 5.124415 0.1717 5.541716 0.0241 14.7975
(obs=300870)Condition Number: 14.7975
Eigenvalues and Cond Index computed from scaled raw sscp (w/ intercept)Det(correlation matrix): 0.2839

106
Table D.4. Collinearity Diagnostics for Chapter 5 - Year 2007
Variables VIF SQRT VIF Tolerance R-Squaredblack 1.15 1.07 0.8702 0.1298brown 1.20 1.09 0.8365 0.1635indio 1.01 1.00 0.9915 0.0085asian 1.03 1.02 0.9665 0.0335victim 1.15 1.07 0.8710 0.1290racist 1.00 1.00 0.9957 0.0043female 1.02 1.01 0.9836 0.0164age 1.12 1.06 0.8954 0.1046publicschool 1.67 1.29 0.6000 0.4000prepcourse 1.02 1.01 0.9819 0.0181income 1.63 1.28 0.6149 0.3851mother hsg 1.15 1.07 0.8661 0.1339mother coll 1.09 1.05 0.9147 0.0853mother bach 1.43 1.19 0.7010 0.2990mother miss 1.02 1.01 0.9791 0.0209Mean VIF 1.18(obs=256684)
Table D.5. Collinearity Diagnostics for Chapter 5 - Year 2007
Eigenval Cond Index1 5.2488 1.00002 1.2147 2.07883 1.1504 2.13604 1.0170 2.27185 1.0006 2.29036 0.9936 2.29847 0.9658 2.33128 0.9493 2.35149 0.8686 2.458210 0.7866 2.583211 0.6065 2.941812 0.4548 3.397313 0.3558 3.841014 0.1887 5.273515 0.1755 5.469016 0.0233 15.0192
(obs=256684)Condition Number: 15.0192
Eigenvalues and Cond Index computed from scaled raw sscp (w/ intercept)Det(correlation matrix): 0.2979

107
Table D.6. Collinearity Diagnostics for Chapter 5 - Year 2006
Variables VIF SQRT VIF Tolerance R-Squaredblack 1.14 1.07 0.8754 0.1246brown 1.20 1.10 0.8337 0.1663indio 1.01 1.01 0.9899 0.0101asian 1.04 1.02 0.9662 0.0338victim 1.15 1.07 0.8687 0.1313racist 1.00 1.00 0.9960 0.0040female 1.02 1.01 0.9845 0.0155age 1.11 1.05 0.9009 0.0991publicschool 1.66 1.29 0.6023 0.3977prepcourse 1.01 1.01 0.9885 0.0115income 1.61 1.27 0.6207 0.3793mother hsg 1.14 1.07 0.8751 0.1249mother coll 1.08 1.04 0.9219 0.0781mother bach 1.42 1.19 0.7045 0.2955mother miss 1.02 1.01 0.9776 0.0224Mean VIF 1.17(obs=282653)
Table D.7. Collinearity Diagnostics for Chapter 5 - Year 2006
Eigenval Cond Index1 5.2391 1.00002 1.2084 2.08223 1.1434 2.14064 1.0120 2.27535 1.0008 2.28806 0.9967 2.29277 0.9593 2.33708 0.9504 2.34799 0.8816 2.437810 0.7925 2.571211 0.6149 2.919012 0.4571 3.385313 0.3519 3.858314 0.1924 5.218315 0.1760 5.455316 0.0236 14.8979
(obs=282653)Condition Number: 14.8979
Eigenvalues and Cond Index computed from scaled raw sscp (w/ intercept)Det(correlation matrix): 0.3064

108
Table D.8. Collinearity Diagnostics for Chapter 5 - Year 2005
Variables VIF SQRT VIF Tolerance R-Squaredblack 1.15 1.07 0.8711 0.1289brown 1.21 1.10 0.8245 0.1755indio 1.01 1.00 0.9908 0.0092asian 1.03 1.02 0.9686 0.0314victim 1.17 1.08 0.8577 0.1423racist 1.00 1.00 0.9953 0.0047female 1.01 1.01 0.9852 0.0148age 1.11 1.05 0.9005 0.0995publicschool 1.66 1.29 0.6036 0.3964prepcourse 1.01 1.01 0.9869 0.0131income 1.59 1.26 0.6294 0.3706mother hsg 1.14 1.07 0.8741 0.1259mother coll 1.09 1.04 0.9179 0.0821mother bach 1.43 1.20 0.6997 0.3003mother miss 1.02 1.01 0.9809 0.0191Mean VIF 1.18(obs=268294)
Table D.9. Collinearity Diagnostics for Chapter 5 - Year 2005
Eigenval Cond Index1 5.2479 1.00002 1.2177 2.07603 1.1468 2.13924 1.0122 2.27705 1.0005 2.29026 0.9954 2.29617 0.9596 2.33858 0.9561 2.34289 0.8816 2.439910 0.7986 2.563511 0.6200 2.909312 0.4494 3.417113 0.3447 3.902114 0.1864 5.305315 0.1608 5.713216 0.0222 15.3693
(obs=268294)Condition Number: 15.3693
Eigenvalues and Cond Index computed from scaled raw sscp (w/ intercept)Det(correlation matrix): 0.3032

109
Table D.10. Collinearity Diagnostics for Chapter 5 - Year 2004
Variables VIF SQRT VIF Tolerance R-Squaredblack 1.01 1.01 0.9895 0.0105brown 1.02 1.01 0.9828 0.0172indio 1.03 1.01 0.9726 0.0274asian 1.00 1.00 0.9956 0.0044victim 1.02 1.01 0.9852 0.0148racist 1.00 1.00 0.9959 0.0041female 1.02 1.01 0.9819 0.0181age 1.12 1.06 0.8890 0.1110publicschool 1.62 1.27 0.6160 0.3840prepcourse 1.01 1.00 0.9911 0.0089income 1.57 1.25 0.6350 0.3650mother hsg 1.15 1.07 0.8710 0.1290mother coll 1.10 1.05 0.9090 0.0910mother bach 1.44 1.20 0.6942 0.3058mother miss 1.02 1.01 0.9775 0.0225Mean VIF 1.14(obs=249708)
Table D.11. Collinearity Diagnostics for Chapter 5 - Year 2004
Eigenval Cond Index1 4.9393 1.00002 1.1249 2.09543 1.0330 2.18674 1.0059 2.21595 0.9995 2.22306 0.9952 2.22787 0.9900 2.23368 0.9620 2.26609 0.9224 2.314010 0.8580 2.399311 0.8509 2.409412 0.6238 2.813813 0.3529 3.741314 0.1776 5.272915 0.1420 5.898016 0.0224 14.8414
(obs=249708)Condition Number: 14.8414
Eigenvalues and Cond Index computed from scaled raw sscp (w/ intercept)Det(correlation matrix): 0.3843

110
Table D.12. Logit Regression 2008 - Chapter 5pavg pavg pavg pmed pmed pmed pnsci pnsci pnsci
(1) (2) (3) (1) (2) (3) (1) (2) (3)
Black -0.416*** -0.431*** -0.431*** -0.446* -0.442* -0.443* -0.419*** -0.440*** -0.440***(0.0375) (0.0378) (0.0378) (0.203) (0.204) (0.204) (0.0155) (0.0156) (0.0156)
Brown -1.028*** -1.087*** -1.087*** -2.302* -2.290* -2.290* -0.658*** -0.743*** -0.744***(0.0957) (0.0973) (0.0973) (1.004) (1.007) (1.007) (0.0308) (0.0321) (0.0321)
Indigenous -0.841** -0.876** -0.876** 0.223 0.231 0.232 -0.863*** -0.907*** -0.906***(0.310) (0.310) (0.310) (1.006) (1.008) (1.008) (0.120) (0.121) (0.121)
Asian 0.410*** 0.370*** 0.370*** 0.610*** 0.619*** 0.619*** 0.378*** 0.329*** 0.329***(0.0396) (0.0414) (0.0414) (0.162) (0.172) (0.172) (0.0257) (0.0263) (0.0263)
Female -0.766*** -0.764*** -0.764*** -0.998*** -0.998*** -0.999*** -0.626*** -0.624*** -0.624***(0.0214) (0.0214) (0.0214) (0.109) (0.109) (0.110) (0.0109) (0.0109) (0.0109)
Age 0.137*** 0.136*** 0.136*** 0.211*** 0.211*** 0.211*** -0.0341*** -0.0357*** -0.0357***(0.00823) (0.00823) (0.00823) (0.0386) (0.0386) (0.0386) (0.00425) (0.00426) (0.00426)
Public school -1.658*** -1.658*** -1.658*** -1.935*** -1.935*** -1.935*** -1.354*** -1.355*** -1.355***(0.0329) (0.0329) (0.0329) (0.193) (0.193) (0.193) (0.0133) (0.0133) (0.0133)
Prep course 0.815*** 0.813*** 0.813*** 0.583*** 0.583*** 0.584*** 0.854*** 0.850*** 0.851***(0.0232) (0.0232) (0.0232) (0.109) (0.109) (0.109) (0.0140) (0.0140) (0.0140)
Income 0.437*** 0.437*** 0.437*** 0.504*** 0.504*** 0.505*** 0.423*** 0.423*** 0.424***(0.00965) (0.00965) (0.00966) (0.0444) (0.0444) (0.0445) (0.00537) (0.00537) (0.00537)
Mother EducationHigh school graduate 0.0523 0.0531 0.0530 -0.433* -0.433* -0.433* 0.273*** 0.273*** 0.273***
(0.0323) (0.0323) (0.0323) (0.177) (0.177) (0.177) (0.0139) (0.0139) (0.0139)Some college 0.274*** 0.273*** 0.273*** -0.141 -0.141 -0.141 0.521*** 0.521*** 0.521***
(0.0429) (0.0429) (0.0429) (0.221) (0.221) (0.221) (0.0222) (0.0222) (0.0222)College graduate 0.518*** 0.518*** 0.518*** 0.298* 0.298* 0.298* 0.586*** 0.586*** 0.586***
(0.0271) (0.0271) (0.0271) (0.123) (0.123) (0.123) (0.0146) (0.0146) (0.0146)Unknown -0.522*** -0.522*** -0.522*** -1.642 -1.642 -1.642 -0.321*** -0.323*** -0.323***
(0.123) (0.123) (0.123) (1.006) (1.006) (1.006) (0.0495) (0.0495) (0.0495)Victim 0.132*** 0.133*** -0.0294 -0.0258 0.195*** 0.197***
(0.0383) (0.0384) (0.185) (0.186) (0.0196) (0.0196)Racist -0.0285 -0.0646 -0.0370
(0.0590) (0.275) (0.0330)cons -4.510*** -4.514*** -4.514*** -8.100*** -8.099*** -8.099*** -1.875*** -1.883*** -1.882***
(0.0575) (0.0575) (0.0575) (0.276) (0.276) (0.276) (0.0286) (0.0286) (0.0286)
N 300870 300870 300870 300870 300870 300870 300870 300870 300870
∗p < 0.05, ∗ ∗ p < 0.01, ∗ ∗ ∗p < 0.001

111
Table D.13. Logit Regression 2007 - Chapter 5pavg pavg pavg pmed pmed pmed pnsci pnsci pnsci
(1) (2) (3) (1) (2) (3) (1) (2) (3)
Black -0.381*** -0.399*** -0.399*** -0.423*** -0.442*** -0.442*** -0.329*** -0.343*** -0.343***(0.0148) (0.0150) (0.0150) (0.0382) (0.0385) (0.0385) (0.0103) (0.0104) (0.0104)
Brown -0.580*** -0.656*** -0.656*** -0.775*** -0.846*** -0.844*** -0.434*** -0.494*** -0.496***(0.0288) (0.0301) (0.0301) (0.0899) (0.0917) (0.0917) (0.0171) (0.0182) (0.0182)
Indigenous -0.670*** -0.703*** -0.703*** -0.0271 -0.0592 -0.0596 -0.654*** -0.682*** -0.682***(0.107) (0.107) (0.107) (0.233) (0.233) (0.233) (0.0580) (0.0581) (0.0581)
Asian 0.220*** 0.176*** 0.176*** 0.384*** 0.332*** 0.332*** -0.132*** -0.154*** -0.152***(0.0303) (0.0308) (0.0308) (0.0457) (0.0476) (0.0476) (0.0316) (0.0318) (0.0318)
Female -0.657*** -0.655*** -0.656*** -0.850*** -0.847*** -0.846*** -0.287*** -0.286*** -0.287***(0.0115) (0.0115) (0.0115) (0.0233) (0.0233) (0.0233) (0.00960) (0.00960) (0.00960)
Age -0.195*** -0.196*** -0.196*** -0.125*** -0.126*** -0.126*** -0.0744*** -0.0757*** -0.0754***(0.00520) (0.00520) (0.00520) (0.0128) (0.0128) (0.0128) (0.00236) (0.00236) (0.00236)
Public school -1.499*** -1.499*** -1.499*** -1.651*** -1.651*** -1.650*** -1.622*** -1.621*** -1.623***(0.0139) (0.0139) (0.0139) (0.0336) (0.0336) (0.0336) (0.0206) (0.0206) (0.0206)
Prep course 0.690*** 0.687*** 0.687*** 0.732*** 0.730*** 0.729*** 0.294*** 0.291*** 0.293***(0.0168) (0.0168) (0.0168) (0.0276) (0.0276) (0.0276) (0.0173) (0.0173) (0.0173)
Income 0.384*** 0.385*** 0.385*** 0.420*** 0.421*** 0.420*** 0.341*** 0.342*** 0.342***(0.00581) (0.00581) (0.00581) (0.0109) (0.0109) (0.0109) (0.00529) (0.00529) (0.00529)
Mother EducationHigh school graduate 0.337*** 0.338*** 0.337*** 0.115*** 0.116*** 0.116*** 0.358*** 0.358*** 0.358***
(0.0140) (0.0140) (0.0140) (0.0332) (0.0332) (0.0332) (0.0117) (0.0117) (0.0117)Some college 0.580*** 0.580*** 0.579*** 0.274*** 0.273*** 0.273*** 0.552*** 0.551*** 0.551***
(0.0240) (0.0240) (0.0240) (0.0456) (0.0456) (0.0456) (0.0287) (0.0288) (0.0288)College graduate 0.647*** 0.647*** 0.647*** 0.482*** 0.482*** 0.482*** 0.540*** 0.539*** 0.539***
(0.0163) (0.0163) (0.0163) (0.0298) (0.0298) (0.0298) (0.0206) (0.0206) (0.0206)Unknown -0.334*** -0.337*** -0.337*** -0.661*** -0.669*** -0.670*** -0.341*** -0.341*** -0.339***
(0.0508) (0.0509) (0.0509) (0.141) (0.141) (0.141) (0.0300) (0.0300) (0.0300)Victim 0.182*** 0.183*** 0.172*** 0.167*** 0.145*** 0.150***
(0.0202) (0.0203) (0.0418) (0.0419) (0.0150) (0.0150)Racist -0.0320 0.0919 -0.231***
(0.0373) (0.0656) (0.0311)cons -0.819*** -0.828*** -0.827*** -3.539*** -3.547*** -3.548*** 1.590*** 1.582*** 1.588***
(0.0308) (0.0309) (0.0309) (0.0649) (0.0650) (0.0650) (0.0296) (0.0296) (0.0296)
N 256684 256684 256684 256684 256684 256684 256684 256684 256684
∗p < 0.05, ∗ ∗ p < 0.01, ∗ ∗ ∗p < 0.001

112
Table D.14. Logit Regression 2006 - Chapter 5pavg pavg pavg pmed pmed pmed pnsci pnsci pnsci
(1) (2) (3) (1) (2) (3) (1) (2) (3)
Black -0.410*** -0.426*** -0.426*** -0.673* -0.668* -0.665* -0.360*** -0.381*** -0.381***(0.0464) (0.0468) (0.0468) (0.289) (0.290) (0.290) (0.0190) (0.0192) (0.0192)
Brown -1.039*** -1.107*** -1.107*** -0.683*** -0.772*** -0.773***(0.129) (0.130) (0.130) (0.0406) (0.0420) (0.0420)
Indigenous -0.898* -0.932* -0.932* -0.599*** -0.640*** -0.640***(0.364) (0.364) (0.364) (0.124) (0.125) (0.125)
Asian 0.486*** 0.438*** 0.438*** 0.738*** 0.755*** 0.757*** 0.350*** 0.292*** 0.292***(0.0499) (0.0524) (0.0524) (0.201) (0.212) (0.212) (0.0311) (0.0320) (0.0320)
Female -1.015*** -1.012*** -1.012*** -1.384*** -1.385*** -1.382*** -0.866*** -0.864*** -0.864***(0.0276) (0.0276) (0.0276) (0.150) (0.150) (0.150) (0.0135) (0.0135) (0.0135)
Age -0.0788*** -0.0798*** -0.0798*** -0.00460 -0.00412 -0.00417 -0.184*** -0.185*** -0.185***(0.0147) (0.0147) (0.0147) (0.0758) (0.0758) (0.0758) (0.00681) (0.00681) (0.00681)
Public school -2.096*** -2.094*** -2.094*** -3.199*** -3.199*** -3.199*** -1.617*** -1.616*** -1.616***(0.0440) (0.0440) (0.0440) (0.349) (0.349) (0.349) (0.0168) (0.0168) (0.0168)
Prep course 0.711*** 0.708*** 0.708*** 0.349* 0.350* 0.348* 0.719*** 0.715*** 0.715***(0.0334) (0.0334) (0.0334) (0.164) (0.164) (0.164) (0.0192) (0.0192) (0.0192)
Income 0.404*** 0.404*** 0.404*** 0.463*** 0.462*** 0.461*** 0.379*** 0.379*** 0.379***(0.0125) (0.0124) (0.0125) (0.0586) (0.0586) (0.0586) (0.00652) (0.00652) (0.00652)
Mother EducationHigh school graduate 0.0562 0.0579 0.0579 -0.257 -0.258 -0.257 0.312*** 0.313*** 0.313***
(0.0409) (0.0409) (0.0409) (0.228) (0.228) (0.228) (0.0175) (0.0175) (0.0175)Some college 0.266*** 0.267*** 0.267*** 0.0819 0.0814 0.0819 0.507*** 0.507*** 0.508***
(0.0545) (0.0545) (0.0545) (0.275) (0.275) (0.275) (0.0273) (0.0273) (0.0273)College graduate 0.535*** 0.536*** 0.536*** 0.451** 0.450** 0.451** 0.634*** 0.635*** 0.635***
(0.0347) (0.0347) (0.0347) (0.165) (0.165) (0.165) (0.0180) (0.0180) (0.0180)Unknown -0.642*** -0.642*** -0.642*** -0.0454 -0.0455 -0.0504 -0.482*** -0.482*** -0.482***
(0.156) (0.156) (0.156) (0.596) (0.596) (0.596) (0.0624) (0.0625) (0.0625)Victim 0.148** 0.148** -0.0537 -0.0693 0.201*** 0.202***
(0.0472) (0.0474) (0.225) (0.226) (0.0237) (0.0237)Racist -0.00188 0.216 -0.0244
(0.0682) (0.289) (0.0370)cons -3.864*** -3.872*** -3.872*** -7.408*** -7.404*** -7.407*** -1.608*** -1.619*** -1.619***
(0.0751) (0.0752) (0.0752) (0.372) (0.372) (0.372) (0.0363) (0.0363) (0.0363)
N 282653 282653 282653 282653 282653 282653 282653 282653 282653
∗p < 0.05, ∗ ∗ p < 0.01, ∗ ∗ ∗p < 0.001

113
Table D.15. Logit Regression 2005 - Chapter 5pavg pavg pavg pmed pmed pmed pfono pfono pfono
(1) (2) (3) (1) (2) (3) (1) (2) (3)
Black -0.428*** -0.457*** -0.456*** 0.0612 0.0531 0.0570 -0.292*** -0.309*** -0.309***(0.0478) (0.0483) (0.0483) (0.202) (0.203) (0.203) (0.0105) (0.0106) (0.0106)
Brown -1.245*** -1.359*** -1.357*** -0.409*** -0.487*** -0.489***(0.148) (0.150) (0.150) (0.0188) (0.0201) (0.0201)
Indigenous -0.585 -0.654 -0.654 0.699 0.676 0.675 -0.534*** -0.569*** -0.568***(0.342) (0.343) (0.343) (1.009) (1.011) (1.011) (0.0632) (0.0633) (0.0633)
Asian 0.538*** 0.461*** 0.461*** 0.592** 0.568** 0.567** 0.0173 -0.0130 -0.0122(0.0500) (0.0528) (0.0528) (0.202) (0.214) (0.214) (0.0283) (0.0286) (0.0286)
Female -0.897*** -0.893*** -0.892*** -1.182*** -1.180*** -1.177*** -0.381*** -0.379*** -0.380***(0.0272) (0.0272) (0.0272) (0.131) (0.131) (0.131) (0.00920) (0.00921) (0.00921)
Age -0.104*** -0.105*** -0.106*** -0.0721 -0.0725 -0.0731 -0.147*** -0.149*** -0.148***(0.0154) (0.0154) (0.0154) (0.0724) (0.0724) (0.0724) (0.00297) (0.00297) (0.00297)
Public school -2.187*** -2.184*** -2.184*** -2.991*** -2.992*** -2.991*** -1.536*** -1.534*** -1.535***(0.0441) (0.0441) (0.0441) (0.285) (0.285) (0.285) (0.0145) (0.0145) (0.0145)
Prep course 0.703*** 0.697*** 0.696*** 0.624*** 0.622*** 0.620*** 0.397*** 0.393*** 0.394***(0.0334) (0.0334) (0.0334) (0.138) (0.138) (0.138) (0.0159) (0.0159) (0.0159)
Income 0.378*** 0.378*** 0.378*** 0.500*** 0.500*** 0.499*** 0.301*** 0.302*** 0.302***(0.0129) (0.0129) (0.0129) (0.0544) (0.0544) (0.0544) (0.00496) (0.00497) (0.00497)
Mother EducationHigh school graduate 0.208*** 0.209*** 0.209*** -0.340 -0.339 -0.339 0.395*** 0.396*** 0.396***
(0.0410) (0.0410) (0.0410) (0.208) (0.208) (0.208) (0.0111) (0.0111) (0.0111)Some college 0.443*** 0.443*** 0.443*** 0.225 0.225 0.225 0.679*** 0.677*** 0.677***
(0.0535) (0.0535) (0.0535) (0.233) (0.233) (0.233) (0.0242) (0.0242) (0.0242)College graduate 0.672*** 0.673*** 0.674*** 0.449** 0.450** 0.451** 0.723*** 0.723*** 0.723***
(0.0364) (0.0364) (0.0364) (0.153) (0.153) (0.153) (0.0169) (0.0169) (0.0169)Unknown -0.920*** -0.926*** -0.927*** -0.475*** -0.476*** -0.474***
(0.207) (0.207) (0.207) (0.0346) (0.0346) (0.0346)Victim 0.227*** 0.224*** 0.0694 0.0611 0.169*** 0.171***
(0.0470) (0.0471) (0.198) (0.198) (0.0149) (0.0150)Racist 0.0581 0.188 -0.106***
(0.0648) (0.253) (0.0280)cons -3.700*** -3.713*** -3.714*** -7.309*** -7.315*** -7.316*** 0.576*** 0.565*** 0.567***
(0.0776) (0.0776) (0.0776) (0.346) (0.347) (0.346) (0.0260) (0.0260) (0.0260)
N 268294 268294 268294 268294 268294 268294 268294 268294 268294
∗p < 0.05, ∗ ∗ p < 0.01, ∗ ∗ ∗p < 0.001

114
Table D.16. Logit Regression 2004 - Chapter 5pavg pavg pavg pmed pmed pmed pfono pfono pfono
(1) (2) (3) (1) (2) (3) (1) (2) (3)
Black 0.425** 0.424** 0.424** 0.440 0.438 0.438 0.291** 0.289** 0.289**(0.131) (0.131) (0.131) (0.242) (0.242) (0.242) (0.0963) (0.0963) (0.0963)
Brown -0.318 -0.328 -0.328 -0.903 -0.924 -0.924 -0.607** -0.613** -0.613**(0.356) (0.357) (0.357) (1.017) (1.018) (1.018) (0.214) (0.215) (0.215)
Indigenous -0.253 -0.258 -0.258 -0.0413 -0.0486 -0.0484 -0.504*** -0.507*** -0.507***(0.135) (0.135) (0.135) (0.285) (0.285) (0.285) (0.0784) (0.0784) (0.0784)
Asian 1.302*** 1.301*** 1.301*** 0.894*** 0.892*** 0.894*** 1.084*** 1.083*** 1.083***(0.0882) (0.0882) (0.0882) (0.157) (0.158) (0.158) (0.0758) (0.0758) (0.0758)
Female -0.986*** -0.984*** -0.984*** -1.143*** -1.139*** -1.139*** -0.807*** -0.806*** -0.806***(0.0204) (0.0204) (0.0204) (0.0447) (0.0448) (0.0448) (0.0130) (0.0130) (0.0130)
Age -0.133*** -0.134*** -0.134*** -0.0554* -0.0564* -0.0563* -0.180*** -0.181*** -0.181***(0.0125) (0.0125) (0.0125) (0.0257) (0.0257) (0.0257) (0.00762) (0.00762) (0.00762)
Public school -1.776*** -1.777*** -1.777*** -2.090*** -2.091*** -2.091*** -1.563*** -1.564*** -1.564***(0.0283) (0.0283) (0.0283) (0.0708) (0.0708) (0.0708) (0.0158) (0.0158) (0.0158)
Prep course 0.758*** 0.755*** 0.755*** 0.785*** 0.783*** 0.782*** 0.677*** 0.675*** 0.675***(0.0253) (0.0253) (0.0253) (0.0483) (0.0483) (0.0483) (0.0180) (0.0180) (0.0180)
Income 0.352*** 0.352*** 0.352*** 0.385*** 0.386*** 0.385*** 0.332*** 0.332*** 0.332***(0.00930) (0.00931) (0.00931) (0.0189) (0.0190) (0.0190) (0.00615) (0.00616) (0.00616)
Mother EducationHigh school graduate 0.182*** 0.183*** 0.183*** -0.00602 -0.00409 -0.00392 0.341*** 0.342*** 0.342***
(0.0292) (0.0292) (0.0292) (0.0665) (0.0666) (0.0666) (0.0169) (0.0169) (0.0169)Some college 0.439*** 0.440*** 0.440*** 0.467*** 0.467*** 0.468*** 0.568*** 0.568*** 0.568***
(0.0390) (0.0390) (0.0390) (0.0786) (0.0786) (0.0786) (0.0255) (0.0255) (0.0255)College graduate 0.647*** 0.648*** 0.648*** 0.566*** 0.568*** 0.568*** 0.714*** 0.714*** 0.714***
(0.0264) (0.0264) (0.0264) (0.0547) (0.0547) (0.0547) (0.0174) (0.0174) (0.0174)Unknown -0.616*** -0.619*** -0.619*** -0.897** -0.901** -0.902** -0.422*** -0.424*** -0.424***
(0.111) (0.111) (0.111) (0.283) (0.283) (0.283) (0.0584) (0.0584) (0.0584)Victim 0.0875** 0.0873** 0.123 0.120 0.0625** 0.0621**
(0.0336) (0.0337) (0.0680) (0.0682) (0.0216) (0.0216)Racist 0.00315 0.0488 0.00898
(0.0474) (0.0927) (0.0323)cons -3.090*** -3.101*** -3.101*** -5.053*** -5.069*** -5.070*** -1.550*** -1.558*** -1.558***
(0.0580) (0.0582) (0.0582) (0.122) (0.123) (0.123) (0.0366) (0.0367) (0.0367)
N 249708 249708 249708 249708 249708 249708 249708 249708 249708
∗p < 0.05, ∗ ∗ p < 0.01, ∗ ∗ ∗p < 0.001

REFERENCES
A.J. Akkari. Desigualdades educativas estruturais no Brasil: entre estado, privatizacao edescentralizacao. Educacao e Sociedade, 22(74):163–189, 2001. 10
A.C. Almeida. Core Values, Education, and Democracy. Democratic Brazil Revisited, page233, 2008. 7
G.R. Andrews. Desigualdade racial no Brasil e nos Estados Unidos: uma comparacao es-tatıstica. Estudos Afro-Asiaticos, 22:47–83, 1992. 13
A. Asinelli-Luz and J. Cunha. Perceptions about the Homophobic Discrimination amongHigh School graduates in Brazil from 2004-2008. Educar em Revista, (39):87–102, 2011.2, 16
I. Ayres. Further evidence of discrimination in new car negotiations and estimates of itscause. Michigan Law Review, pages 109–147, 1995. 30
Joaquim Barbosa. Deliberation on Supreme Court Decision on Affirmative Action.http://g1.globo.com/educacao/noticia/2012/04/veja-frases-marcantes-do-julgamento-sobre-cotas-raciais-no-supremo.html, 2012. Acessed on January 5, 2013. 95
K.I. Beltrao and M.S. Novellino. Alfabetizacao por raca e sexo no Brasil: evolucao no perıodo1940-2000. Rio de Janeiro: Escola Nacional de Ciencias Estatısticas, 2002. 9
Giba Bergamim. Debate sobre adocao de cotas raciais na USP emperra naJustica. http://www1.folha.uol.com.br/educacao/1169794-debate-sobre-adocao-de-cotas-raciais-na-usp-emperra-na-justica.shtml, 2012. Accessed on 26 November 2012. 99
K. Berger. Update on bullying at school, Science forgotten? Development Review, 27:90–126,2007. 8
D.G. Blanchflower and A.J. Oswald. International happiness. Technical report, NationalBureau of Economic Research, 2011. 36
R.M. Blank. Measuring racial discrimination. National Academy Press, 2004. 28, 30, 45
D.M. Botelho. Aya mini (coragem). Educadores e Educadoras no enfrentamento de praticasracistas em espacos escolares. PhD thesis, 2000. 25
Brazilian Ministry of Education. Sistema de Selecao Unificada. http://sisu.mec.gov.br, 2011.acessed on 15 July 2012. 2, 14
115

116
M.A. Cabral. Identidade Etnico-Racial em contexto Ludico: um jogo de cartas marcadas?2007. 25
F.H. Cardoso. Discurso do Presidente da Republica, Fernando Henrique Cardoso, nacerimonia de entrega do premio nacional de direitos humanos por ocasiao da comemoracaodo dia internacional dos direitos humanos. December 19, 2001. 12
J.R. Carvalho and T. Magnac. College choice and entry exams. Work. Pap., CAEN, Uni-versidade Federal do Ceara, Fortaleza, Brazil and Toulouse Sch. Econ., Toulouse, France,2010. 51, 52
M. Castro. C. de. Ensino Privado ou publico: Eis a (falsa) questao. Ensaio, 5:17, 1997. 10
N. G. Castro and J. A. Guimaraes. Desigualdades Raciais no mercado e nos locais detrabalho. Estudos Afro-Asiaticos, 24:23–60, 1993. 49
T. Cavalcanti, J. Guimaraes, and B. Sampaio. Barriers to skill acquisition in Brazil: Pub-lic and private school students performance in a public university entrance exam. TheQuarterly Review of Economics and Finance, 50(4):395–407, 2010. 52
Eliane Cavalleiro. Discriminacion y pluralismo cultural em la escuela. UNESCO, 2005. 25,26
CEATS. Pesquisa: Bullying Escolar no Brasil. Centro de Empreenderismo Social e Ad-ministracao em Terceiro Sector, Fundacao Instituto de Administracao - Sao Paulo, 2010.42
Ricardo Correa Coelho. Discriminacao e Politıca de Cotas. Jornal de Brasılia, December2001. Newspaper article. 12
F. Crosby. The denial of personal discrimination. American Behavioral Scientist, 27(3):371–386, 1984. 27, 46
L. Cunha. Escola publica, escola particular e a democratizacao do ensino. pages 119–130,1985. 10
C.R. Cury. A Educacao e a Nova Ordem Constitucional. Revista da Associacao Nacionalde Educacao, (14):5–11, 1989. 10
Jornal da Globo. USP vai discutir se adota sistema de cotas no vestibular da Fu-vest. http://g1.globo.com/educacao/noticia/2012/09/usp-vai-discutir-se-adota-sistema-de-cotas-no-vestibular-da-fuvest.html, 2012. Accessed on 24 November 2012. 99
G.M. da Silva and E.P. Reis. Perceptions of racial discrimination among black professionalsin Rio de Janeiro. Latin American Research Review, 46(2):55–78, 2011. 20, 23, 26, 28

117
Jornal O Estado de S. Paulo. Dilma sanciona lei que reserva 50% das vagas nas federais paraalunos de escola publica. http://www.estadao.com.br/noticias/vidae,dilma-sanciona-lei-que-reserva-50-das-vagas-nas-federais-para-alunos-de-escola-publica,923235,0.htm, 2012.Accessed on 26 November 2012. 98
E. DeSouza and J. Ribeiro. Bullying and Sexual Harassment Among Brazilian High SchoolStudents. Journal of Interpersonal Violence, 20(9):1018–1038, 2005. 8
E. dos Santos Cavalleiro. Do Silencio Do Lar Ao Silencio Escolar. Editora Contexto, 2000.25
M. Eslea and K. Mukhtar. Bullying and racism among Asian schoolchildren in Britain.Educational Research, 42:207–217, 2000. 8
A. Ferrer-i Carbonell and P. Frijters. How Important is Methodology for the estimates ofthe determinants of Happiness?*. The Economic Journal, 114(497):641–659, 2004. 36
Gilberto Freyre. The Masters and the Slaves: A Study in the Development of BrazilianCivilization. Berkeley: University of California Press, 1933. 6
S. Fried and P. Fried. Bullies and Victims: Helping your child through the schoolyard bat-tlefield. New York: M. Evans, 1996. 42
Peter Fry. Politics, Nationality, and the Meanings of “Race” in Brazil. Daedalus, 129(2):83–118, 2000. 12
Fuvest. Questionario de Avaliacao Socioeconomica 2004-2008. http://www.fuvest.br/, 2004-2008. 93, 94
FUVEST. Fuvest 2010 Manual do Candidato. http://www.fuvest.br/vest2010/manual/manual_fuvest_2010.pdf, 2010. Accessed on 15 July 2012. 52
A.S.A. Guimaraes. Racism and anti-racism in Brazil: A postmodern perspective. Racismand anti-racism in world perspective, pages 208–226, 1995. 6, 13
A.S.A. Guimaraes. Racial insult in Brazil. Discourse & Society, 14(2):133–151, 2003. 13, 25
J. Guimaraes and B. Sampaio. Diferencas de eficiencia entre ensino publico e privado noBrasil. Economia Aplicada, 13(1):45–68, 2009. 10, 49
JF Guimaraes and B. Sampaio. The influence of family background and individual character-istics on entrance tests scores of Brazilian university students. Anais do XXXV EncontroNacional de Economia-ANPEC-Associacao Nacional dos Centros de Pos-Graduacao emEconomia, Recife, 2007. 10, 11, 33
C.A. Hasenbalg and P. Burglin. Discriminacao e desigualdades raciais no Brasil. Number 10.Graal Rio de Janeiro, 1979. 9, 13

118
M. Htun. From “racial democracy” to affirmative action: changing state policy on race inBrazil. Latin American Research Review, 39(1):60–89, 2004. 12
IBGE. Censo Demografico 2000: Educacao, Resultados da Amostra. 2000. 2
INEP. Sinopses Estatısticas da Educacao Superior. http://www.inep.gov.br/superior/
censosuperior/sinopse/, 2008. Accessed on 23 July 2012. 17, 20, 22, 51
INEP. Statistical Information Microdados - Censo da Educacao Superior 2002. InstitutoNacional de Estudos e Pesquisa, 2003. Accessed July 7, 2012. 1
INEP. Statistical Information Microdados - Censo da Educacao Superior 2003. InstitutoNacional de Estudos e Pesquisa, 2004. 1
Ollie Johnson. Afro-Brazilian Politics: White Supremacy, Black Struggle, and AffirmativeAction. In Democratic Brazil Revised by Peter Kingstone and Timothy Power. Universityof Pittsburgh Press, 2008. 6
R.C. Kessler, K.D. Mickelson, and D.R. Williams. The prevalence, distribution, and mentalhealth correlates of perceived discrimination in the United States. Journal of Health andSocial Behavior, pages 208–230, 1999. 29
R. Kochenderfer and G. W. Ladd. Peer Victimization: Cause and Consequence of schoolmaladjustment? Child Development, 67:1305–1317, 1996. 42
C. Leao and J. Carvalho. O Bullying no Contexto Escolar. EFDEPortes, 16(163), December2011. 42
I.C. Lima, J. Romao, and S.M. Silveira. Os negros, os conteudos escolares e a diversidadecultural II. Florianopolis: Nucleo de Estudos Negros (NEN), 1998. 25
G.C. Loury. The anatomy of racial inequality. Harvard University Press, 2002. 29
P. Lovell. Income and racial inequality in Brazil. Unpublished doctoral dissertation, Univer-sity of Florida, 1989. 13
Luiz Lux. Deliberation on Supreme Court Decision on Affirmative Action.http://g1.globo.com/educacao/noticia/2012/04/veja-frases-marcantes-do-julgamento-sobre-cotas-raciais-no-supremo.html, 2012. Acessed on January 5, 2013. 18
Y. Maggie. Racismo e anti-racismo: preconceito, discriminacao e os jovens estudantes nasescolas cariocas. Educacao e Sociedade, 27(96):739–751, 2006. 26
T. McCowan. Expansion without equity: An analysis of current policy on access to highereducation in Brazil. Higher Education, 53(5):579–598, 2007. 1

119
T.R. Nansel, M.D. Overpeck, R.S. Pilla, W.J. Ruan, B. Simons-Morton, and P. Scheidt. Bul-lying behavior among U.S. youth prevalence and association with psychosocial adjustment.Journal of American Medical Association, 285:2094–2100, 2001. 8
Abdias Nascimento. Brazil, Mixture or Massacre?: Essays in the Genocide of a Black People.Dover, MA: The Majority Press, 1989. 5, 6
Yasmin Poltronieri Neves. Negros e currıculo. Florianopolis: Atilende, 2nd edition, 2002. 25
L. Nguy and C. Hunt. Ethnicity and Bullying a study of Australian high school students.Educational Child Psychology, 21:78–94, 2004. 8
J.U. Ogbu. Low school performance as an adaptation: The case of Blacks in Stockton, Cali-fornia. Minority status and schooling: A comparative study of immigrant and involuntaryminorities, pages 249–285, 1991. 29
D. Olweus. Bullying among schoolchildren: Intervention and prevention. In Aggression andViolence throughout the Life Span by R.D. Meters, R.J. McMahon and V.L. Quinsey,pages 100–125. London: Sage, 1992. 42
R. Osorio. Is all Socioeconomic inequality among racial groups in Brazil caused by RacialDiscrimination? UNDP - International Poverty Centre, 43:1–43, 2008. 31, 32
D. Pager. The use of field experiments for studies of employment discrimination: Contribu-tions, critiques, and directions for the future. The Annals of the American Academy ofPolitical and Social Science, 609(1):104–133, 2007. 30
D. Pager and H. Shepherd. The sociology of discrimination: Racial discrimination in em-ployment, housing, credit, and consumer markets. Annual review of sociology, 34:181,2008. 20, 23, 29, 30
G. Pereira, D. Mendonca, C. Neto, L. Valente, and P. Smith. Bullying in Portuguese schools.School Psychology International, 25:241–254, 2004. 8, 27
B. Reiter and G.L. Mitchell. Brazil’s new racial politics. Lynne Rienner Publishers Boulder,CO, 2010. 5, 13
C.A.C. Ribeiro. Classe, raca e mobilidade social no Brasil. Dados, 49(4):833–873, 2006. 9,31
S.E. Ridley, J.A. Bayton, and J.H. Outtz. Taxi Service in the District of Columbia: Is itInfluenced by Patrons Race and Destination? Washington, DC Lawyers Committee forCivil Rights Under the Law, 1989. 30
A. Rodrıguez-Pose and K. Maslauskaite. Can policy make us happier? Individual char-acteristics, socio-economic factors and life satisfaction in Central and Eastern Europe.Cambridge Journal of Regions, Economy and Society, 5(1):77–96, 2012. 36

120
K.M. Ruggiero and B.N. Major. Group status and attributions to discrimination: Arelow-or high-status group members more likely to blame their failure on discrimination?Personality and Social Psychology Bulletin, 24(8):821–837, 1998. 27, 46
K.M. Ruggiero and D.M. Taylor. Why minority group members perceive or do not perceivethe discrimination that confronts them: The role of self-esteem and perceived control.Journal of Personality and Social Psychology, 72(2):373–389, 1997. 27, 46
D. Saviani. Pedagogia historico-crıtica: primeiras aproximacoes. 40, 2005. 10
K.A. Schulman, J.A. Berlin, W. Harless, J.F. Kerner, S. Sistrunk, B.J. Gersh, R. Dube,C.K. Taleghani, J.E. Burke, S. Williams, et al. The effect of race and sex on physicians’recommendations for cardiac catheterization. New England Journal of Medicine, 340(8):618–626, 1999. 30
H. et al Schuman. Racial attitudes in America: Trends and interpretations. Harvard Uni-versity Press, 1997. 29
L. Schwarcz. The Spectable of the races: Scientist, Institutions, and the Race Question inBrazil, 1870-1930. New York: Hill and Wang, 1999. 7
Ana Celia Silva. Desconstruindo a discriminacao do negro no livro didatico. Salvador:UFBA, 2001. 26
N. Silva. O preco da cor: Diferenciais raciais na distribuicao de renda no Brasil. Pesquisa ePlanejamento Economico, 10:21–44, 1980. 13
T. Skidmore and P. Smith. Modern Latin America. Oxford: University Press, 4th edition,1997. 5, 6, 7, 99
T.E. Skidmore. Black into white: race and nationality in Brazilian thought. Duke UniversityPress Books, 1993. 7
P.K. Smith. Violence in schools: The response in Europe. London: RoutledgeFalmer, 2002.8
C. Steele. A threat in the air: how stereotypes shape intellectual identity and performance.American Psychology, 52:613–29, 1997. 29
M. Stohl and G. Lopez. The State as Terrorist: The Dynamics of Governmental Violenceand Repression. Greenwood Press, Connecticut, 1984. 9
Anısio Teixeira. Desbarato dos Recursos Publico para a Educacao. O Jornal, 1958. 1
E. Telles. Residential segregation by skin color in Brazil. American Sociological Review, 57:186–197, 1992. 13

121
E.E. Telles. Race in another America: the significance of skin color in Brazil. PrincetonUniversity Press, 2004. 5, 6, 7, 11, 13, 33, 49
E.E. Telles and N. Lim. Does it matter who answers the race question? Racial classificationand income inequality in Brazil. Demography, 35(4):465–474, 1998. 31
Mario Teodoro. Consciencia Negra: o que comemorar? Revista Desafios do Desenvolvimento,4(38):15, 2007. 36
W.R. Tobler. A computer movie simulating urban growth in the Detroit region. Economicgeography, 46:234–240, 1970. 59
H.S.S. Tomelin. Access to Higher Education in Brazil. PhD thesis, Ohio University, 2002.49, 91
Guia Trabalhista Portal Tributario. Salario Mınimo, 2012. Available at http://www.
guiatrabalhista.com.br/. 34, 35
M.A. Turner. Mortgage lending discrimination: A review of existing evidence. 1999. 30
Vestibular UOL Notıcias. UFRJ adota ENEM como unica forma de ingresso a partir de2012. http://vestibular.uol.com.br/ultimas-noticias/2011/06/30/ufrj-adota-enem-como-unica-forma-de-ingresso-a-partir-de-2012.jhtm, 2011. Accessed on January 2, 2013. 2
USP. Mais de 140 mil realizam a primeira fase da Fuvest maior vestibular dopaıs. http://www5.usp.br/19722/mais-de-140-mil-candidatos-realizam-a-primeira-fase-da-fuvest-maior-vestibular-do-pais/, 2012. Accessed on 26 November 2012. 97
R. Veenstra, S. Lindenberg, A. Oldehinkel, A. De Winter, F. Verhulst, and J. Ormel. Bullyingand victimization in elementary schools a comparison of bullies, victims, bully/victim, anduninvolved preadolescents. Development Psychology, 41:672–682, 2005. 8
Rosa Weber. Deliberation on Supreme Court Decision on Affirmative Action.http://g1.globo.com/educacao/noticia/2012/04/veja-frases-marcantes-do-julgamento-sobre-cotas-raciais-no-supremo.html, 2012. Acessed on January 5, 2013. 49
D.R. Williams, H. Neighbors, et al. Racism, discrimination and hypertension: evidence andneeded research. Ethnicity & Disease, 11(4):800–816, 2001. 27, 46
D.A. Wissoker, W. Zimmermann, and G.C. Galster. Testing for discrimination in homeinsurance. Urban Institute, 1998. 30
J. Yinger. Closed doors, opportunities lost: The continuing costs of housing discrimination.Russell Sage Foundation Publications, 1997. 30

VITA
Rubia da Rocha Valente was born in Campinas, Sao Paulo, Brazil on February 25th, 1985.
Moving to the United States in 2000 she attended MacArthur High School in Irving, Texas.
In 2007, she received a Bachelor of Arts degree with a major in International Relations and
a minor in French from Southern Methodist University. She entered The University of Texas
at Dallas and graduated with a Master of Science degree with a major in International Po-
litical Economy with High Distinction in 2009. From 2011 to 2013, Rubia was employed as
a teaching assistant at The University of Texas at Dallas.
This dissertation was typed in LATEX2 by the author. 1
1LATEX is a document preparation system for the TEX typesetting program. It offers programmabledesktop publishing features and extensive facilities for automating most aspects of typesetting and desktoppublishing, including numbering and cross-referencing, tables and figures, page layout, bibliographies, andmuch more. LATEX was originally written in 1984 by Leslie Lamport and has become the dominant methodfor using TEX; few people write in plain TEX anymore. The current version is LATEX 2ε.