Embed Size (px)
Citation preview
Effects of Professional Development on Teachers' Instruction: Results from a Three-YearLongitudinal StudyAuthor(s): Laura M. Desimone, Andrew C. Porter, Michael S. Garet, Kwang Suk Yoon andBeatrice F. BirmanReviewed work(s):Source: Educational Evaluation and Policy Analysis, Vol. 24, No. 2 (Summer, 2002), pp. 81-112Published by: American Educational Research AssociationStable URL: http://www.jstor.org/stable/3594138 .
Accessed: 20/12/2012 12:57
Your use of the JSTOR archive indicates your acceptance of the Terms & Conditions of Use, available at .http://www.jstor.org/page/info/about/policies/terms.jsp
.JSTOR is a not-for-profit service that helps scholars, researchers, and students discover, use, and build upon a wide range ofcontent in a trusted digital archive. We use information technology and tools to increase productivity and facilitate new formsof scholarship. For more information about JSTOR, please contact [email protected].
.
American Educational Research Association is collaborating with JSTOR to digitize, preserve and extendaccess to Educational Evaluation and Policy Analysis.
http://www.jstor.org
This content downloaded on Thu, 20 Dec 2012 12:57:08 PMAll use subject to JSTOR Terms and Conditions
Educational Evaluation and Policy Analysis Summer 2002, Vol. 24, No. 2, pp. 81-112
Effects of Professional Development on Teachers' Instruction: Results from a Three-year Longitudinal Study
Laura M. Desimone Vanderbilt University
Andrew C. Porter University of Wisconsin, Madison
Michael S. Garet Kwang Suk Yoon
Beatrice F. Birman American Institutes for Research
This article examines the effects of professional development on teachers' instruction. Using a pur- posefully selected sample of about 207 teachers in 30 schools, in 10 districts infive states, we examine features of teachers' professional development and its effects on changing teaching practice in math- ematics and science from 1996-1999. We found that professional developmentfocused on specific instructional practices increases teachers' use of those practices in the classroom. Furthermore, we found that specificfeatures, such as active learning opportunities, increase the effect of the professional development on teacher's instruction.
Keywords: changing teaching practice, content, evaluation, longitudinal study, mathematics and science, professional development
What are the characteristics of professional de- velopment that affect teaching practice? This study adds to the knowledge base on effective profes- sional development. The success of standards- based reform depends on teachers' ability to foster both basic knowledge and advanced thinking and problem solving among their students (Loucks- Horsley, Hewson, Love, & Stiles, 1998; National Commission on Teaching & America's Future, 1996), and such effective practices require teach- ers to have a deep understanding of the content they teach (Ma, 1999). Professional development is considered an essential mechanism for deepen- ing teachers' content knowledge and developing their teaching practices. As a result, professional development could be a cornerstone of systemic reform efforts designed to increase teachers'
capacity to teach to high standards (Smith & O'Day, 1991).
The research reported here focuses on the ef- fects of professional development on changing classroom teaching practice.1 Using a purpose- fully selected sample of teachers in 30 schools, in 10 districts, in five states, we examine features of teachers' professional development and their effects on changing teaching practice in mathe- matics and science from 1996-1999.
Background: Professional Development and Teacher Change
Over the past decade, a large body of literature has emerged on in-service professional devel- opment, teacher learning, and teacher change.2 The research literature contains a mix of large-
81
This content downloaded on Thu, 20 Dec 2012 12:57:08 PMAll use subject to JSTOR Terms and Conditions
Desimone et al.
and small-scale studies, including intensive case studies of classroom teaching (e.g., Cohen, 1990), evaluations of programs designed to improve teaching and learning (e.g., U.S. Department of Education 1999a), and surveys of teachers about their preservice preparation and in-service pro- fessional development experiences (e.g., Carey & Frechtling, 1997). In addition, there is a con- siderable amount of literature describing "best practices" in professional development, draw- ing on expert experiences (e.g., Loucks-Horsley et al., 1998).
A professional consensus is emerging about particular characteristics of "high quality" pro- fessional development. These characteristics in- clude a focus on content and how students learn content; in-depth, active learning opportunities; links to high standards, opportunities for teach- ers to engage in leadership roles; extended dura- tion; and the collective participation of groups of teachers from the same school, grade, or depart- ment. Although lists of characteristics such as these commonly appear in the literature on ef- fective professional development, there is little direct evidence on the extent to which these characteristics are related to better teaching and increased student achievement. (See, in particu- lar, Garet, Porter, Desimone, Birman, & Yoon, 2001; Hiebert, 1999; Loucks-Horsley et al., 1998; U.S. Department of Education, 1999b).
Some studies conducted over the past decade suggest that professional development experi- ences that share all or most of these character- istics can have a substantial, positive influence on teachers' classroom practice and student achieve- ment (Birman, Desimone, Garet, & Porter, 2000; Garet et al., 2001; Wilson & Lowenberg, 1991). A few recent studies have begun to examine the relative importance of specific characteristics of professional development. Several studies have found that the intensity and duration of pro- fessional development is related to the degree of teacher change (Shields, Marsh, & Adelman, 1998; Weiss, Montgomery, Ridgway, & Bond 1998). In addition, there is some indication that compared to professional development focused on general pedagogy or management strategies, professional development that focuses on specific mathematics and science content and the ways students learn such content is especially helpful, particularly for instruction designed to improve students' conceptual understanding (Cohen &
82
Hill, 2002; Fennema et al., 1996; Kennedy, 1998; Ma, 1999; Stigler & Hiebert, 1999).
Given the size of investment in professional de- velopment and the dependence of education re- form on providing effective professional develop- ment, the knowledge base on what works must be strengthened. The longitudinal results reported here provide a replication of cross-sectional results on a nationally representative sample. Together, the earlier study and the one reported here clarify the extent to which findings from qualitative case study work generalize across teachers and districts.
Context for Our Longitudinal Study of Teachers: A National Evaluation
of Professional Development
Despite the amount of literature on in-service professional development, relatively little system- atic research has explicitly compared the effects of different forms of professional development on teaching and learning. Furthermore, most studies of professional development have not examined its effects in a quantitative and replicable manner. To address this research gap, we designed a series of studies that enabled us to examine the relation- ships between alternative features of professional development and change in teaching practice in a cross-sectional, national probability sample of teachers and a smaller, longitudinal sample of teachers.
All of the studies were done in the context of an evaluation of the Eisenhower Professional De- velopment Program-Title II of the Elementary and Secondary Education Act (ESEA)-which at the time of this study was the federal govern- ment's largest investment that was solely focused on developing the knowledge and skills of class- room teachers.34
We did not design the evaluation to directly examine the effects of the Eisenhower program, since the program is a funding stream, and the practices supported by the program vary. Instead, we attempted to determine more or less effective practices within the context of the program and its practices, and then, on a representative sam- ple of districts and teachers, determine the dis- tribution of effective and ineffective practices. We then could see whether program funding was going more toward effective or ineffective prac- tices, and make recommendations about guide- lines that could move funded work in a positive direction.
This content downloaded on Thu, 20 Dec 2012 12:57:08 PMAll use subject to JSTOR Terms and Conditions
Effects of Professional Development on Teachers' Instruction
Results from Our National Study The results from our national, cross-sectional
sample are described more fully in Garet et al. (1999) and Garet et al. (2001). We briefly sum- marize them here to serve as context to present the results of our longitudinal study.
Our national sample included 93% of all dis- tricts in the country, since at the time we drew the national probability sample of Eisenhower dis- tricts in 1997, approximately 93% of districts re- ceived funding from the Eisenhower program.5 The results for the national, cross-sectional stud- ies are based on mail surveys of a national prob- ability sample of 1,027 teachers.
We drew on research and best practice to iden- tify the key features of professional development to use in our study. We concluded that six key features of professional development could be hypothesized as effective in improving teaching practice. Three are "structural features," or char- acteristics of the structure of a professional de- velopment activity. These structural features in- clude the form or organization of the activity-that is, whether the activity is organized as a reform type, such as a study group, teacher network, mentoring relationship, committee or task force, internship, individual research project, or teacher research center, in contrast to a traditional work- shop, course, or conference; the duration of the activity, including the total number of contact hours that participants spend in the activity, as well as the span of time over which the activity takes place; and the degree to which the activity emphasizes the collective participation of groups of teachers from the same school, department, or grade level, as opposed to the participation of individual teachers from many schools.
The remaining three features are core features, or characteristics of the substance of the activity: the extent to which the activity offers opportuni- ties for active learning-that is, opportunities for teachers to become actively engaged in the meaningful analysis of teaching and learning, for example, by reviewing student work or obtaining feedback on their teaching; the degree to which the activity promotes coherence in teachers' profes- sional development, by incorporating experiences that are consistent with teachers' goals, aligned with state standards and assessments, and en- courage continuing professional communication among teachers; and the degree to which the activity has a content focus-that is, the degree
to which the activity is focused on improving and deepening teachers' content knowledge in math- ematics and science.
With our national teacher data, we found that these six key features of professional development were related to increases in teachers' self-reported knowledge and skills and changes in teaching practice. The core features worked through the structural features. That is, activities that were re- form type were more likely to have collective par- ticipation and longer duration; and activities with collective participation and longer duration were more likely to have active learning opportunities, coherence and a content focus, which in turn were related to how successful the experience was in in-
creasing teacher-reported growth in knowledge and skills and changes in teaching practice (see Garet et al., 2001).6
Our national data on prevalence indicated that most district-supported professional develop- ment activities do not have the six high-quality characteristics: an average of only 23% of teach- ers participating in Eisenhower-assisted profes- sional development were in reform types of pro- fessional development; the average time span of a professional development activity was less than a week; the average number of contact hours was 25 and the median was 15 hours; most activities did not have collective participation or a major emphasis on content; and most activities had lim- ited coherence and a small number of active learning opportunities (see Garet et al., 2001 for more details).
Building on National, Cross-Sectional Findings with Longitudinal Data:
The Purpose and Design of the Longitudinal Study of Teacher Change
Our longitudinal study of teacher change was designed to build on the findings from our national, cross-sectional data. For five of the six features and all of the teaching practice variables, we used the exact same measures in order to cross-validate with longitudinal data our national findings on the relationship between professional development and teacher outcomes. The sixth feature, content focus, was measured more precisely in our longi- tudinal sample (pages 86-7).
The longitudinal data enable us to document teaching practice in mathematics and science be- fore and after a professional development activity and to examine the extent to which changes in
83
This content downloaded on Thu, 20 Dec 2012 12:57:08 PMAll use subject to JSTOR Terms and Conditions
Desimone et al.
teaching practice are predicted by participation in that activity. Combining our national results with these longitudinal data enables us to provide complimentary sources of information to inform questions about professional development policy and implementation.
For our longitudinal study, we surveyed teach- ers at three points in time: the fall of 1997, the spring of 1998, and the spring of 1999. The three waves of the longitudinal survey provide data pertaining to the 1996-97, 1997-98, and 1998-99 school years. Although our study does not mea- sure the effects of professional development on student achievement directly, the measures of teaching practice that we use have been associated with gains in student achievement (see section on measures). In any event, the effects of professional development on gains in student achievement must surely be mediated by changes in teacher class- room practices.
Sample of Schools
We expected systematic differences in re- sults by school level, so we chose one elemen- tary school, one middle school, and one high school in each of the 10 districts. Furthermore, by design, the sample of 30 schools is dispro- portionately high poverty-57% of the sample schools (17 schools), are high poverty; nation- wide, 25% of schools are high poverty (defined as 50% or more students eligible for free lunch).7 We selected states, districts, and schools in the sample that had adopted diverse approaches to professional development in addition to tradi- tional workshops and conferences. If such pro- fessional development is more effective than tra- ditional approaches, then the teachers' instruction in the sample schools might be better than that of the average teacher.8
In sum, we selected the longitudinal sample to maximize the opportunity to investigate impor- tant differences in approaches to professional de- velopment. The sample is not meant to be taken as nationally representative, but neither is it ex- tremely unusual. It allows a focused, exploratory examination over several years of the character- istics of professional development that foster change in teachers' instructional practices.
Sample of Teachers
We surveyed all the teachers who taught math- ematics and science in each of the 30 schools
in the sample. In elementary schools, we ran- domly administered mathematics surveys to half the teachers and science surveys to the other half. Four hundred and thirty (430) teachers responded to the 1996-97 survey; 429 teachers responded to the 1997-98 survey; and 452 teachers re- sponded to the 1998-99 survey.9 The response rate for the first wave was 75%; for the second wave, it was 74%; and for the final wave in 1998, 75%.10 1' Given our analysis strategy of looking for change over time in the same teachers, the sample for the analysis is restricted to teachers who returned all three waves of the survey, who participated in professional development in 1997-98, and who continued to teach the same course over all three waves of the survey. The last restriction is necessary because changes in the course taught might introduce changes in teach- ing practice apart from the effects of professional development experiences. Finally, the sample is restricted to teachers who provided complete data on all of the necessary items. The number of teachers meeting these conditions was 207.
The sample is 74% female and 18% minority. Ninety-three percent of the sample are certified teachers. Twelve percent of mathematics teachers and 18% of science teachers in the sample are novice teachers, or teachers who have taught the surveyed subject for three or fewer years.12 (In our national sample, 84% of teachers were fe- male, and 100% were certified.) The longitudinal sample is also fairly representative of the general teaching population in 1998. Nationally in 1998, 73% of teachers were female, 14% were minori- ties and 10% had less then three years of teaching experience (Snyder, Hoffman, & Geddes, 1999).
The data in this report are unique in that they provide consistent information on teaching prac- tice and professional development over a three- year period for a sample of teachers of mathe- matics and science. These data enabled us to analyze relationships between teachers' profes- sional development experiences and classroom practice, while controlling for prior differences in their classroom practice.
Measures: Professional Development, Its Quality, and Teaching Practice
Identifying and describing a professional de- velopment activity is complex. Teachers experi- ence many different types of professional devel- opment throughout their careers, both preservice
84
This content downloaded on Thu, 20 Dec 2012 12:57:08 PMAll use subject to JSTOR Terms and Conditions
Effects of Professional Development on Teachers' Instruction
and in-service. Furthermore, the nature of these professional development experiences can be described on many dimensions.
Choosing a Professional Development Activity to Describe
In waves two and three of the survey (pertain- ing to the 1997-98 and 1998-99 school years), we asked teachers to describe the professional development activities in which they had partic- ipated during the prior 12 month period. For ex- ample, in the third wave, we asked teachers who received the mathematics form of the survey to "report all mathematics-related professional development you participated in over the pre- vious year, including the summer of 1998 and the 1998-99 school year." We described in the survey the activities that might be considered professional development, including mentoring, teacher networks, resource centers, research in- stitutes, in addition to the traditional workshops, conference and college courses. We then asked respondents to choose one of the activities to describe in the following manner:
If one of the organized professional develop- ment experiences you participated in was par- ticularly helpful to the class you reported [on earlier], please pick that activity. If not, pick any organized professional development activ- ity. You may choose an activity that began be- fore the summer of 1998, if you continued to participate in that activity during the summer of 1998 or the 1998-99 school year. In answering questions about the activity you have chosen, please include all components of the activity, even if they occurred at different times during the year. (For example, if you attended a sum- mer institute with follow-up activities during the school year, include both the summer institute and the follow-up activities in your answers.)13
The focus on a single activity was motivated by the desire to make respondent burden tolerable. We did not, however, ask teachers to choose an activity that was helpful for fostering change in the areas of instruction that we used in our analy- ses as a dependent variable. In addition, there was substantial variation in the extent of influence that the activities had.14
Measuring Features of Quality We use the six key features from our national
study to describe the quality of professional de-
velopment-reform versus traditional, duration (time span and contact hours), collective partici- pation, active learning, coherence, and content focus (Garet et al., 2001). Although there are other potentially important features of profes- sional development that we did not investigate, we wanted to use the same measures as in our national studies (which were derived from the lit- erature) to cross-validate our findings. We now describe how we measured and scaled each of the six dimensions of professional development."5
Reform vs. Traditional
On the longitudinal teacher survey, we asked teachers to describe the type of activity on which they were reporting, using eight categories. We classified three types of activities as traditional in form: (a) within-district workshops or confer- ences, (b) courses for college credit, and (c) out-of- district workshops or conferences. We classified the remaining five types of activities as reform ac- tivities: (d) teacher study groups, (e) teacher col- laboratives, networks, or committees, (f) mentor- ing, (g) internships, and (h) resource centers.'6 The variable was measured as a dichotomy, coded 1 if the activity was reform type, and 0 otherwise. For the 1998-99 data, 18.7% of the activities the teachers reported on were reform type.
Contact Hours
We asked teachers the total number of contact hours that they spent in the professional devel-
opment activity, including all components of the activity that were held during the one-year target period. The measure indicates the number of contact hours the teachers spent in the activity on which the teacher reported. In 1998-99, the mean was 18.2 hours with a standard deviation of 21.7 hours.
Time Span We asked about the span of the activity, or the
period of time in days, weeks, months, or years over which the activity was spread. The options were (a) less than a day, (b) one day, (c) two to four days, (d) a week, (e) a month, (f) two to five months, (g) six to nine months, (h) 10 to 12 months, and (i) more than a year. The com- posite for time span was coded on a 9-point scale, where 1 = less than a day and 9 = more than a year. The Year 3 mean was 3.81 with a 2.3 standard deviation.
85
This content downloaded on Thu, 20 Dec 2012 12:57:08 PMAll use subject to JSTOR Terms and Conditions
Desimone et al.
Collective Participation We asked each teacher in our longitudinal sam-
ple to indicate whether the activity in which the teacher participated was designed for all teachers in a school or set of schools or all teachers in the teacher's department or grade level.17 We com- bined responses to these two questions to create an index of the extent to which the activity pro- vided opportunities for collective participation. We coded the scale as 0= not collective, 1 = some- what collective, and 2 = collective. The mean in 1998-99 was .33 with a .5 standard deviation.
Active Learning To measure active learning, our survey included
four items to measure opportunities for observing and being observed teaching; five items that mea- sured planning for classroom implementation; four questions that focused on reviewing student work; and five items that asked questions about present- ing, leading, and writing.18 Since simply summing the 18 types of active learning opportunities would give more weight to planning and presenting- writing than to observing and reviewing student work, we weighted each of the four items pertain- ing to observation and the four items pertaining to student work by 1.25. This produced an index from 0 (no opportunities were provided for active learning) to 20 (all types of active learning were provided). In 1998-99, the mean was 3.43 with a 3.3 standard deviation.
Coherence
We measured three dimensions of coherence. First, we asked each teacher to report the extent to which the activity the teacher attended was con- sistent with the teacher' s goals for professional development, was based explicitly on what the teacher had learned in earlier professional devel- opment experiences, and was followed up with ac- tivities that built on what the teacher learned in the professional development activity. Second, we asked each teacher to indicate the extent to which the activity was aligned with state or district stan- dards and curriculum frameworks and with state and district assessments. Third, we asked teachers whether they had discussed what they learned with other teachers in their school or department who did not attend the activity; whether they had discussed or shared what they learned with ad- ministrators (e.g., the principal or the department
86
chair); and whether they had communicated, out- side of formal meetings held as part of the activ- ity, with participants in the activity who teach in other schools.19 Because there are three items for the first and third of these dimensions, and only two items for the second dimension, we weighted the items for the second dimension by 1.5. This produced a scale from 0 (the activity did not in- clude any of the types of coherence that we mea- sured) to 9 (the activity provided all of the forms of coherence that we measured). In 1998-99, the mean was 5.33 with a 1.9 standard deviation.
Content Focus
Content focus is measured in the longitudinal study with questions about the content of partic- ular teaching practices. We examined several specific teaching practices that were the focus of teachers' professional development to determine whether they could be linked to specific changes in teaching practice.
In the first and third years of the longitudinal survey, we asked teachers to report their use of specific teaching practices in their classrooms. In the second year of the survey, we asked exactly parallel questions about whether teachers' pro- fessional development activity focused on these specific practices. From this set of questions, we identified three areas of teaching practice and professional development for which we analyzed effects-technology use, instructional methods, and student assessments. We chose these be- cause certain practices in each of the three areas are considered to be desirable by researchers and school reformers and because we had exactly parallel measures of both professional develop- ment and teaching practice in these three areas. We now describe our measures for each of the areas of teaching practice. The appendix pro- vides data indicating the percent of teachers in our sample who participated in professional de- velopment that focused on each of these prac- tices, and the mean extent to which teachers used these practices in their classroom (4-point scale from 0 to 3).
Use of technology Much recent literature focuses on the potential
benefits of certain uses of technology on students' learning (Birman, Kirshstein, Levin, Matheson, & Stephens, 1997; Means, 1994; Means et al., 1993). Researchers have examined various uses
This content downloaded on Thu, 20 Dec 2012 12:57:08 PMAll use subject to JSTOR Terms and Conditions
Effects of Professional Development on Teachers' Instruction
of technology to support multidisciplinary tasks; to help students learn critical thinking; to provide opportunities for authentic learning experiences, such as collecting and analyzing real-world data; and to provide opportunities for access to experts, resources, and information beyond the classroom (Cognition and Technology Group at Vanderbilt University, 1994; Sivin-Kachala & Bialo, 1996; Means & Olsen, 1995). These types of technol- ogy use have been viewed as key features of enabling students to achieve at high levels of performance.
To measure the extent to which professional development activities focused on such uses of technology, we asked teachers whether the pro- fessional development activity in which they par- ticipated focused on improving their capacity to use (a) calculators or computers to develop mod- els or simulations; (b) calculators or computers for data collection and analysis; (c) computers to write reports; and (d) computers to access the Internet. Teachers responded yes or no. In Years 1 and 3, we asked teachers how often they used these practices as part of their mathematics or science instruction. The response scale was 0 = almost never, 1 = some lessons, 2 = most lessons, and 3 = every lesson.
Use of higher order instructional methods
Research has shown that students learn best when instruction includes opportunities for them to engage in active and inquiry-based learning (e.g., Raizen, 1998). Such "higher order" instruc- tional methods allow students to engage with ma- terial in a more in-depth way for longer periods of time, and to exhibit understanding, communi- cate about subject matter in nontraditional ways (e.g., writing about mathematics), explore alter- native methods of problem-solving and integrate work from different disciplines to approximate more real-world applications (Newman & Asso- ciates, 1996; NCTM, 1998; NRC, 1996).
To measure the extent to which professional de- velopment activities emphasized the use of higher order instructional methods, we asked teachers whether the professional development activity in which they participated focused on developing their capacity to use any of the following teaching practices: (a) work on independent, long-term (at least one week) projects; (b) work on problems for which there is no immediately obvious method or solution; (c) develop technical or mathematical
writing skills; (d) work on interdisciplinary lessons (e.g., writing journals in class); and (e) debate ideas or otherwise explain their reasoning. Teach- ers responded yes or no to these questions. In Years 1 and 3, we asked teachers how often they used these methods as part of their mathematics- science instruction. The response scale was 0 = almost never, 1 = some lessons, 2 = most lessons, and 3 = every lesson.
Use of alternative assessment practices Much recent literature has advocated the use
of different forms of assessment. The usual mul- tiple choice paper-and-pencil tests are viewed as perhaps adequate for assessing basic skills, but not for application, problem solving and com- munication skills. Alternative assessments such as essay tests, portfolio assessments, and project- based assessments are more appropriate for mea- suring students' ability to apply their knowledge (e.g., Koretz, Stecher, Klein, & McCaffrey, 1994; Mitchell, 1996).
To measure the extent to which professional de- velopment emphasized alternative student as- sessment methods, we asked teachers whether the professional development activity focused on de- veloping their capacity to use any of the following six forms of student assessments in their classroom teaching: (a) essay tests; (b) performance tasks or events; (c) systematic observation of students; (d) math-science reports; (e) math-science proj- ects; and (f) portfolios. Teachers responded yes or no to these questions. In Years 1 and 3, we asked teachers how important these assessment prac- tices were in determining students' grades in the mathematics-science course on which they were reporting. The response scale was 0 = not used, 1 = minor importance, 2 = moderate importance, and 3 = very important.
Other Variables
In addition to these data about each of the teaching practices, we also collected data about the teacher and the quality of the professional de- velopment activity the teacher attended in Year 2. In particular, we collected data on each teacher's subject area and school grade level, and we col- lected data on six features of the professional development activity the teacher attended in Year 2: the activity type (reform versus tradi- tional), time span, contact hours, collective partic- ipation, active learning, and coherence.
87
This content downloaded on Thu, 20 Dec 2012 12:57:08 PMAll use subject to JSTOR Terms and Conditions
Desimone et al.
Methodology We conducted analyses on the basis of data
from all three waves of the Longitudinal Teacher Survey. We sought to explain teaching practice in Year 3, on the basis of teachers' professional de- velopment experiences in Year 2, controlling for teachers' classroom teaching practices in Year 1.
A strength of this design is that our baseline, independent variable and dependent variable data each came from a separate survey, thus eliminat- ing any within-instrument and time colinearity in our data that might otherwise have contributed to spuriously high correlations. A weakness of the design is that while there are two years of professional development activities between our baseline and post measures of teaching practice, we examine only one year, to avoid collecting independent and dependent variable data in the same questionnaire and to ensure that the profes- sional development described preceded in time the instruction described. Again, our investiga- tion of the relationship between professional de- velopment and changes in instructional practices takes a conservative approach.
With the exception of content focus, we used measures that had been used and validated with our national data, and we used the exact same set of questions over the three years of the study.
With our data we conducted three parallel sets of analyses, each focusing on a different area of teaching practice. First, we examined the effects of professional development on teaching prac- tices involving the use of technology; then, we examined instructional methods; and finally, we examined assessment practices. To clarify the approach we used, we describe the data, mea- sures, and statistical model in detail in the next section.
Creating Measures: Mean Focus and Relative Focus of Professional Development
We used the data to address three main issues about the effects of professional development on teaching practice. First, we used the data to ex- amine whether teachers who participated in pro- fessional development that focused on a particu- lar teaching practice (e.g., the use of calculators or computers to develop models) increased their classroom use of that practice over the period from 1996-97 to 1998-99 more than did similar teachers who did not report participating in pro-
88
fessional development that focused on the strat- egy. Since only one professional development activity was described in each data collection, a respondent may have actually participated in other professional development (not described) that did focus on the strategy. Second, we used the data to examine whether teachers who par- ticipated in professional development that fo- cused on several related practices (e.g., the use of calculators or computers to develop models and to collect and analyze data), increased their use of calculators and computers to develop models more than teachers who focused only on that strategy during their professional development. Finally, we used the data to examine whether the benefits of participating in professional develop- ment that focused on a particular teaching prac- tice were strengthened if a teacher's professional development had features of high quality (i.e., re- form type, appropriate time span, sufficient con- tact hours, collective participation, active learn- ing, and coherence).
To estimate the effect of participating in pro- fessional development focused on a particular teaching practice within one of the three areas (i.e., technology, higher order instruction, and alternative assessments), we created two new variables: the meanfocus the activity gave to the set of practices within an area and the relative focus the activity gave to each of the specific prac- tices in an area.
Mean focus. To assess the extent to which the professional development activity that a teacher attended focused on multiple, related practices, we calculated the average or mean focus given to the teaching practices we measured. The mean focus for technology use is the average empha- sis placed on the four technology practices; mean focus for higher order instruction is the av- erage emphasis placed on the five higher order instructional practices; and for alternative as- sessments, mean focus is the average emphasis placed on the six alternative assessment strate- gies. Since each practice is coded 1 if it was given attention as part of the teacher's profes- sional development activity and 0 if it was not, the mean focus for each of the three areas ranges from 0, if no practices within a particu- lar area were covered in the activity, to 0.5 if half of the practices in an area were covered, to 1 if all of the practices in an area were cov- ered. The more practices the activity focused on, the higher the mean focus.
This content downloaded on Thu, 20 Dec 2012 12:57:08 PMAll use subject to JSTOR Terms and Conditions
Effects of Professional Development on Teachers' Instruction
Relative focus. To measure the effects of focus- ing on one practice rather than another within a professional development activity, we used a measure of relative focus. For example, if an activity focused on two of the four technology practices, including the use of calculators and computers to develop models, the relative focus for the use of calculators and computers to develop models would have a value of 0.5- calculated as the difference between the value of 1 for the use of calculators or computers to develop models and the mean focus of 0.5.
We used mean focus and relative focus to characterize professional development activities because the variables clearly distinguish between the benefits of focusing on one practice rather than another within a professional development activity (captured by the relative focus) and the benefits of professional development activities that focus on many or few practices (captured by the mean focus).20
Statistical Methods
Technically, our data have a two-level struc- ture, with a set of teaching practices in a particu- lar area (e.g., the set of five higher order teaching practices) nested within teachers. In the discus- sion that follows, we refer to the two levels at which we have data as the "strategy" and the "teacher-activity" levels. We use the term teacher- activity for the teacher level because our data at that level include both teacher characteristics (e.g., subject taught) and characteristics of the quality of the professional development activity the teacher attended in 1997-98 (Year 2).
Given the two-level (strategy-level and teacher-activity-level) structure of the data, we estimated the effects of professional development by using a hierarchical linear model (HLM). (See Figure 1 for the model equations.) HLM sepa- rately estimates coefficients for each level of the hierarchical nested system (i.e., professional de- velopment and instructional practices nested within teachers). This method reduces aggrega- tion bias inherent in ordinary least squares (OLS) regression models that use variables at different levels in the same equation (Bryk & Rauden- bush, 1988). The model for the effects of profes- sional development on the use of teaching prac- tices in each one of the three areas including the following teacher-activity level and teacher- strategy level variables:
Strategy-level variables. For each teaching prac- tice within a particular area, we included two variables in the model: the teacher's 1996-97 (Year 1) use of the practice and the relativefocus given to the practice during the professional development the teacher attended in 1997-98 (Year 2). We also included a set of indicator vari- ables specifying the particular practice. These variables represent the fact that on average, teachers may have increased their use of some practices more than others over the period under study.
Teacher-activity level variables. At the
teacher-activity level, we included the follow- ing variables in the model: the mean focus given to the set of practices in a particular area during the professional development activity the teacher attended in 1997-98 (Year 2), con- trols for the teacher's subject (mathematics or science) and grade level (elementary, middle, or high school), and the quality of the pro- fessional development (e.g., the time span or degree of collective participation).21
We assumed that two key parameters in the
strategy-level model would vary among teachers: the strategy-level intercept, which represents the average use of all of the teaching practices in a particular area, in 1998-99, controlling for their use in 1996-97 and for the teacher's 1997-98 par- ticipation in professional development; and the strategy-level slope, which represents the effects of focusing on one particular practice during pro- fessional development on classroom use of the
practice in 1998-99. Thus, we modeled these two
parameters as random effects. We modeled all other parameters as fixed effects. (See Figure 1 for the equations for the strategy level and teacher- activity level equations.) These assumptions re- flect the idea that teachers may differ in the degree to which they changed practice over the period from 1996-97 through 1998-99 and in their responsiveness to professional development. One key analysis question concerns the extent to which a teacher's strategy-level slope and intercept are affected by characteristics of the activities in which the teacher participated-in particular, the mean focus on a set of practices in a particular area and the features of the activity.
The effects of focusing on a set of practices in a professional development activity can be ex- amined by comparing the magnitude of the co- efficients for mean focus and relative focus. If the coefficient for mean focus is higher than the
89
This content downloaded on Thu, 20 Dec 2012 12:57:08 PMAll use subject to JSTOR Terms and Conditions
Desimone et al.
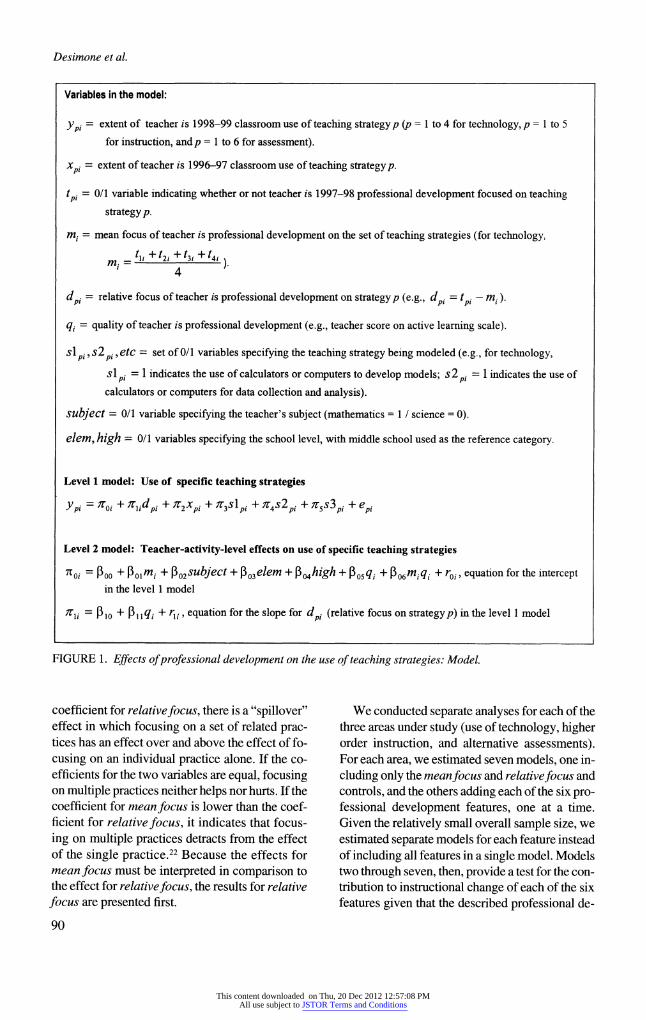
Variables in the model:
ypi = extent of teacher is 1998-99 classroom use of teaching strategy p (p = 1 to 4 for technology, p = 1 to 5 for instruction, andp = 1 to 6 for assessment).
xpi = extent of teacher is 1996-97 classroom use of teaching strategyp.
tpi = 0/1 variable indicating whether or not teacher is 1997-98 professional development focused on teaching
strategy p.
mi = mean focus of teacher is professional development on the set of teaching strategies (for technology,
m = tli + t2i + t3i + t4i 4
dpi = relative focus of teacher is professional development on strategyp (e.g., dpi = tpi - mi ).
qi = quality of teacher is professional development (e.g., teacher score on active learning scale).
s pi, s2 pi, etc = set of 0/1 variables specifying the teaching strategy being modeled (e.g., for technology,
slpi = 1 indicates the use of calculators or computers to develop models; s2pi = 1 indicates the use of calculators or computers for data collection and analysis).
subject = 0/1 variable specifying the teacher's subject (mathematics = 1 / science = 0).
elem, high = 0/1 variables specifying the school level, with middle school used as the reference category.
Level 1 model: Use of specific teaching strategies
Ypi = oi + idpi + r2x+pi ++ J3pi + + r4s2pi + 7r5s3pi + epi
Level 2 model: Teacher-activity-level effects on use of specific teaching strategies
Coi = Poo + Polmi + o02subject + 103elem + 304high + 30q,i + P3o6m,q + roi, equation for the intercept in the level 1 model
=I'li = PIo + PBlli + rli, equation for the slope for dpi (relative focus on strategyp) in the level 1 model
FIGURE 1. Effects of professional development on the use of teaching strategies: Model.
coefficient for relative focus, there is a "spillover" effect in which focusing on a set of related prac- tices has an effect over and above the effect of fo-
cusing on an individual practice alone. If the co- efficients for the two variables are equal, focusing on multiple practices neither helps nor hurts. If the coefficient for mean focus is lower than the coef- ficient for relative focus, it indicates that focus-
ing on multiple practices detracts from the effect of the single practice.22 Because the effects for mean focus must be interpreted in comparison to the effect for relative focus, the results for relative
focus are presented first.
90
We conducted separate analyses for each of the three areas under study (use of technology, higher order instruction, and alternative assessments). For each area, we estimated seven models, one in-
cluding only the mean focus and relative focus and controls, and the others adding each of the six pro- fessional development features, one at a time. Given the relatively small overall sample size, we estimated separate models for each feature instead of including all features in a single model. Models two through seven, then, provide a test for the con- tribution to instructional change of each of the six features given that the described professional de-
This content downloaded on Thu, 20 Dec 2012 12:57:08 PMAll use subject to JSTOR Terms and Conditions
Effects of Professional Development on Teachers' Instruction
velopment activity did focus on the same content as measured for degree of emphasis on instruction.
At the teacher level, the sample size for our analyses is about 125.23 Since, for each teacher, we have data on four technology-use practices, the sample size available to estimate the effects of pro- fessional development on classroom use is about 4 x 125 = 500. The sample of practices for the analysis of instruction is about 5 x 125 = 625; and the sample for assessment is about 6 x 125 = 750.
Results
Effects of Focused Professional Development on the Use of Specific Teaching Practices
in the Classroom
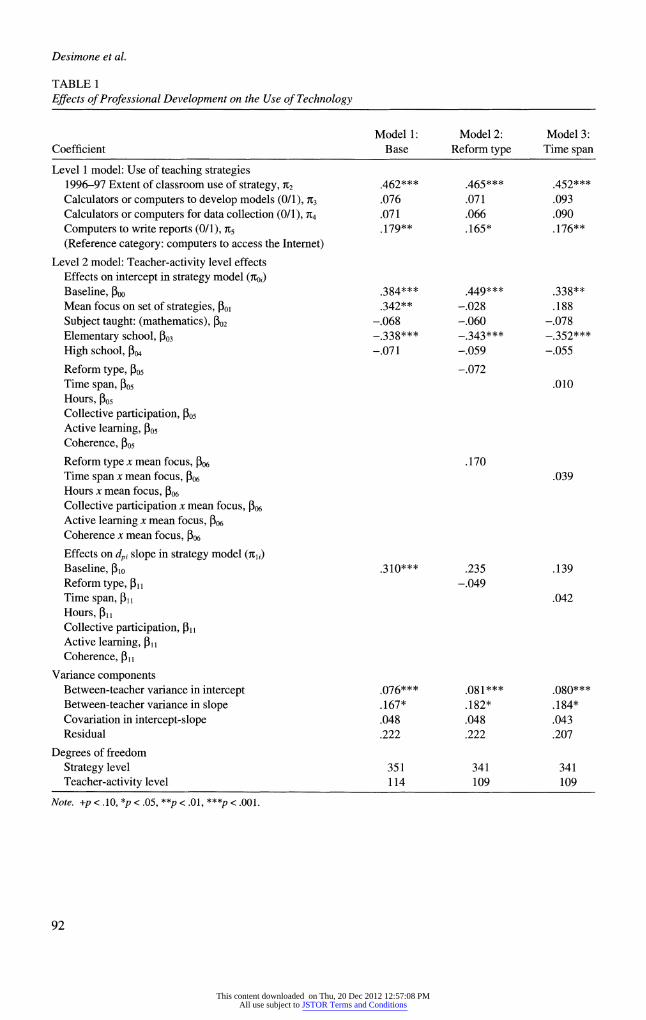
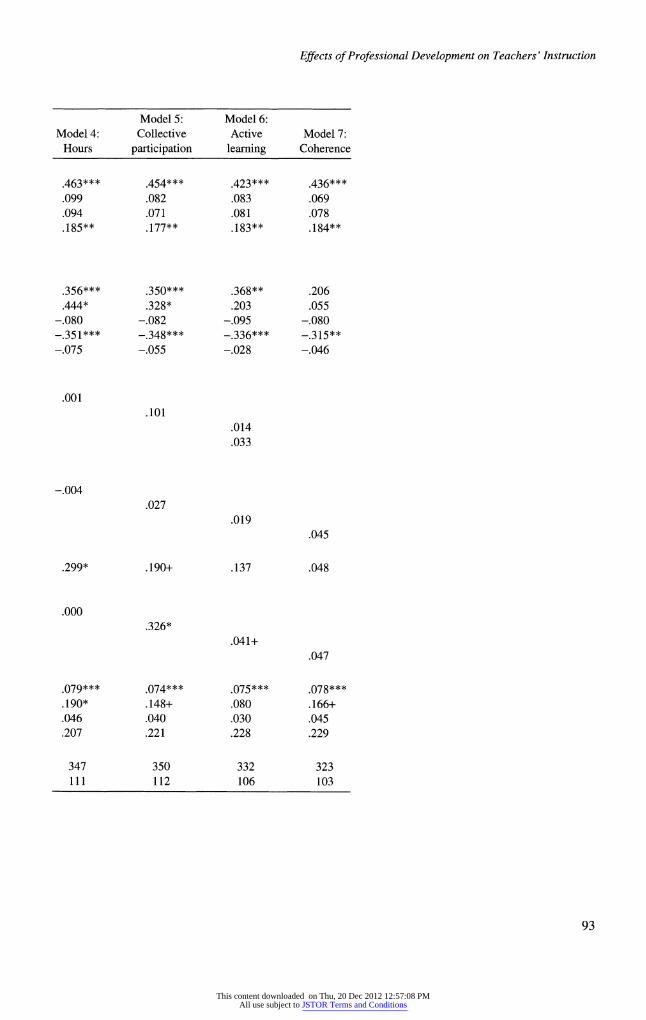
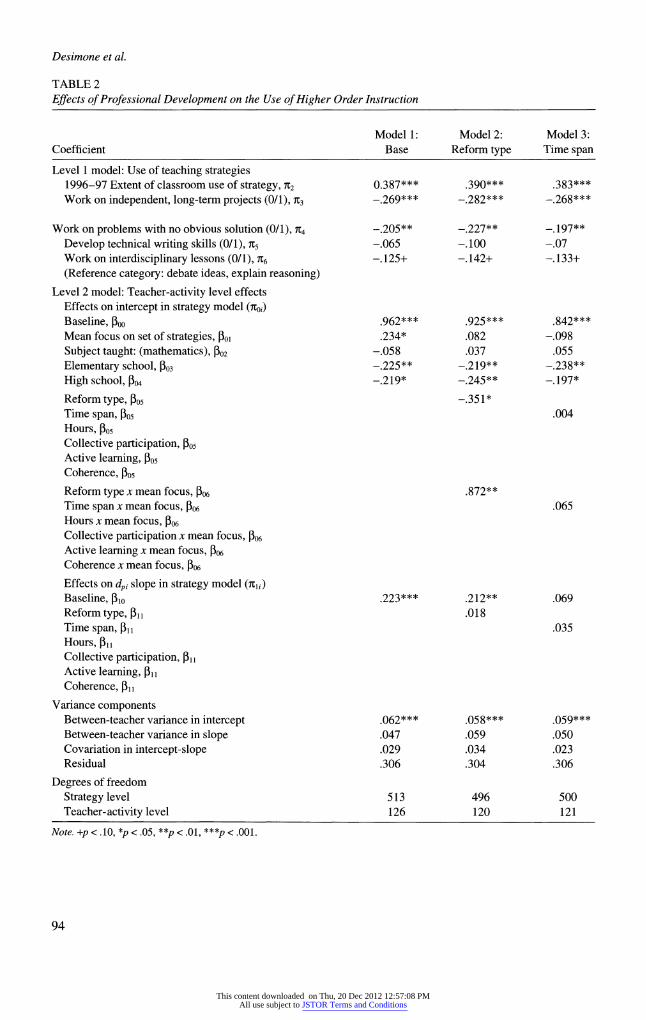
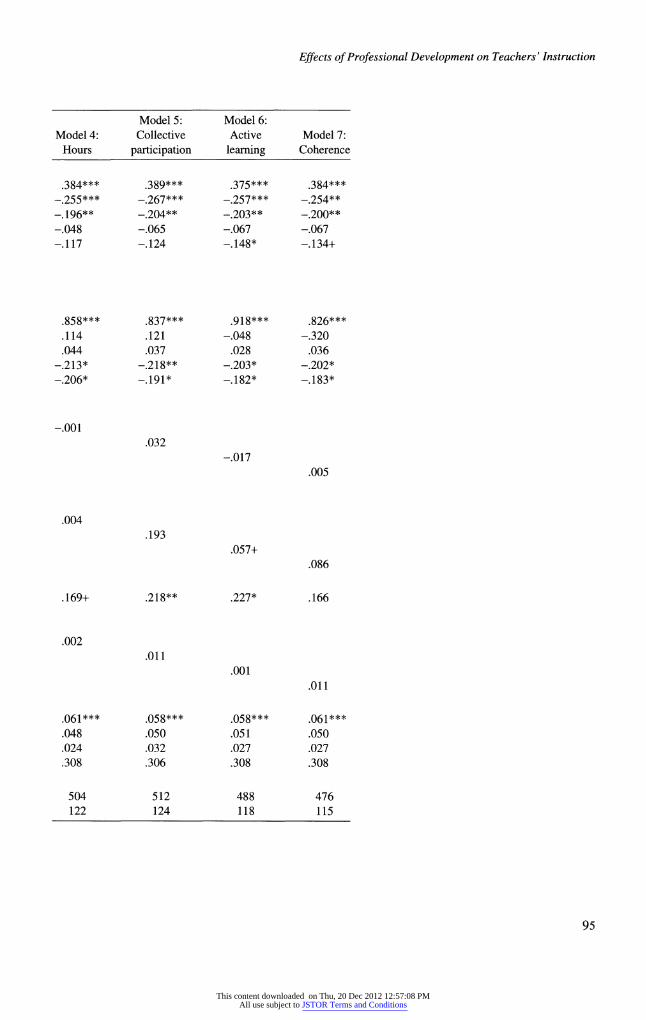
The results of our analysis for technology are presented in Table 1, for instruction in Table 2, and for assessment in Table 3. Each table con- tains the results for seven models. Model 1 exam- ines the effects of focusing on a practice during professional development in 1997-98 (Year 2) on use of the practice in 1998-99 (Year 3), but does not include the effects of the professional development features. Models 2 through 7 exam- ine each feature, one at a time (reform type, time span, hours, collective participation, active learn- ing, and coherence).
The parameter estimates for Model 1 (column one of Tables 1-3) are presented in two main groups. The first group of parameter estimates for Model 1 contain the parameters for the strategy- level parameters that do not vary among teachers (Level 1), that is, the parameter for the effects of 1996-97 (Year 1) use of each practice on 1998-99 (Year 3) use, and parameters representing the av- erage 1998-99 (Year 3) use for each specific prac- tice relative to the others, controlling for 1996-97 (Year 1) use. (The subscripted coefficients in paren- theses on each row of the table refer to the coeffi- cients in the equations in Figure 1.) The second group of parameters presented for Model 1 con- tains the parameters representing the effects of teacher-activity variables (Level 2) on each teacher's intercept and slope in the strategy- level model.
Teacher-Activity Effects
Effects of relative focus on teaching strategies For the teacher-activity level parameters
(Level 2), the first coefficient, P20, under "Effects on dpi slope in strategy model (7Cli)," represents the
effect of the relative focus on a particular technol-
ogy practice on the use of the practice in the class- room (i.e., the effect for a typical teacher).24 As Model 1 shows, the estimated coefficient is posi- tive and significant for technology (Table 1, plo = 0.310**), for higher order instructional practices (Table 2, 3plo = 0.223***) and for assessment prac- tices (Table 3, ilo = 0.297***).25 This indicates that professional development focused on a par- ticular technological, instructional or assessment practice (relative to other technology, instruc- tional or assessment practices) increased teachers' use of the practice in the classroom.
Effects of mean focus on teaching strategies The coefficient for mean focus, line 2 under
Level 2, estimates the effect of focusing on a par- ticular strategy (i.e., relative focus), plus the added effect of focusing on all four strategies. For all three teaching strategies, the effects of the mean focus are significant-on the set of four technology practices (0Po = 0.342**), the set of five higher order instructional strategies (3Po = 0.234*), and the set of six alternative assessments (3Po = 0.494**).
In all three cases, the mean focus is higher than the relative focus. This suggests a "spillover" ef- fect of focusing on a set of similar practices rather than just one specific practice alone. While in the expected direction, the spillover effects are not significant. The main conclusion is that profes- sional development intended to increase a spe- cific instructional practice must focus squarely on that specific practice. Transfer, if present at all, is not strong.
Effects of Previous Use, Subject and School Level on Teaching Strategies
The results showing the effects of previous use, subject and school level on teachers' use of strate- gies do not bear directly on our main research question, which addresses how professional de- velopment effects changes in instructional prac- tice. We briefly review them, here, however, to demonstrate their interpretation and to provide context for the main results.
The first strategy-level parameter shown in Table 1 (72 = 0.462***) indicates that as we would expect, 1996-97 use of each strategy has a positive, significant effect on 1998-99 use.
(text continues on page 98)
91
This content downloaded on Thu, 20 Dec 2012 12:57:08 PMAll use subject to JSTOR Terms and Conditions
Desimone et al.
TABLE 1 Effects of Professional Development on the Use of Technology
Model 1: Model 2: Model 3: Coefficient Base Reform type Time span
Level 1 model: Use of teaching strategies 1996-97 Extent of classroom use of strategy, 712 .462*** .465*** .452*** Calculators or computers to develop models (0/1), n3 .076 .071 .093 Calculators or computers for data collection (0/1), rt4 .071 .066 .090 Computers to write reports (0/1), 7t5 .179** .165* .176** (Reference category: computers to access the Internet)
Level 2 model: Teacher-activity level effects Effects on intercept in strategy model (TCoi) Baseline, Poo .384*** .449*** .338** Mean focus on set of strategies, 13o .342** -.028 .188 Subject taught: (mathematics), P02 -.068 -.060 -.078 Elementary school, P03 -.338*** -.343*** -.352*** High school, 304 -.071 -.059 -.055
Reform type, P05 -.072 Time span, o05 .010
Hours, P05 Collective participation, P05 Active learning, P05 Coherence, P05
Reform type x mean focus, P06 .170 Time span x mean focus, P06 .039 Hours x mean focus, P06 Collective participation x mean focus, P06 Active learning x mean focus, P06 Coherence x mean focus, o06 Effects on dpi slope in strategy model (ili) Baseline, 1lo .310*** .235 .139 Reform type, P -.049 Time span, ll .042 Hours, PI Collective participation, P1 Active learning, PI Coherence, P13
Variance components Between-teacher variance in intercept .076*** .081*** .080*** Between-teacher variance in slope .167* .182* .184* Covariation in intercept-slope .048 .048 .043 Residual .222 .222 .207
Degrees of freedom Strategy level 351 341 341 Teacher-activity level 114 109 109
Note. +p < .10, *p < .05, **p < .01, ***p < .001.
92
This content downloaded on Thu, 20 Dec 2012 12:57:08 PMAll use subject to JSTOR Terms and Conditions
Effects of Professional Development on Teachers' Instruction
Model 5: Model 6: Model 4: Collective Active Model 7:
Hours participation learning Coherence
.463***
.099
.094
.185**
.356***
.444* -.080 -.351*** -.075
.454***
.082
.071
.177**
.350***
.328* -.082 -.348*** -.055
.423***
.083
.081
.183**
.368**
.203 -.095 -.336*** -.028
.436***
.069
.078
.184**
.206
.055 -.080 -.315** -.046
.001 .101
.014
.033
-.004 .027
.299*
.000
.079***
.190*
.046
.207
347 111
.190+
.019
.137
.045
.048
.326* .041+
.047
.074***
.148+
.040
.221
350 112
.075***
.080
.030
.228
332 106
.078***
.166+
.045
.229
323 103
93
This content downloaded on Thu, 20 Dec 2012 12:57:08 PMAll use subject to JSTOR Terms and Conditions
Desimone et al.
TABLE 2 Effects of Professional Development on the Use of Higher Order Instruction
Model 1: Model 2: Model 3: Coefficient Base Reform type Time span
Level 1 model: Use of teaching strategies 1996-97 Extent of classroom use of strategy, 712 0.387*** .390*** .383*** Work on independent, long-term projects (0/1), n3 -.269*** -.282*** -.268***
Work on problems with no obvious solution (0/1), n4 -.205** -.227** -.197** Develop technical writing skills (0/1), 1t5 -.065 -.100 -.07 Work on interdisciplinary lessons (0/1), n6 -.125+ -.142+ -.133+ (Reference category: debate ideas, explain reasoning)
Level 2 model: Teacher-activity level effects Effects on intercept in strategy model (n0i) Baseline, Poo .962*** .925*** .842*** Mean focus on set of strategies, Poi .234* .082 -.098 Subject taught: (mathematics), P02 -.058 .037 .055 Elementary school, P03 -.225** -.219** -.238** High school, P04 -.219* -.245** -.197*
Reform type, P05 -.351 Time span, 505 .004 Hours, P05 Collective participation, o05 Active learning, P05 Coherence, p05 Reform type x mean focus, P06 .872** Time span x mean focus, P06 .065 Hours x mean focus, p06 Collective participation x mean focus, P06 Active learning x mean focus, P06 Coherence x mean focus, P06
Effects on dpi slope in strategy model (Ili) Baseline, P1o .223*** .212** .069 Reform type, P11 .018 Time span, P3I .035 Hours, P3 Collective participation, Pl Active learning, P31 Coherence, P1l
Variance components Between-teacher variance in intercept .062*** .058*** .059*** Between-teacher variance in slope .047 .059 .050 Covariation in intercept-slope .029 .034 .023 Residual .306 .304 .306
Degrees of freedom Strategy level 513 496 500 Teacher-activity level 126 120 121
Note. +p < .10, *p < .05, **p < .01, ***p < .001.
94
This content downloaded on Thu, 20 Dec 2012 12:57:08 PMAll use subject to JSTOR Terms and Conditions
Effects of Professional Development on Teachers' Instruction
Model 5: Model 6: Model 4: Collective Active Model 7:
Hours participation learning Coherence
.384*** -.255*** -.196** -.048 -.117
.858***
.114
.044 -.213* -.206*
-.001
.004
.389*** -.267*** -.204** -.065 -.124
.837***
.121
.037 -.218** -.191*
.375*** -.257*** -.203** -.067 -.148*
.918*** -.048
.028 -.203* -.182*
.384*** -.254** -.200** -.067 -.134+
.826*** -.320
.036 -.202* -.183*
.032 -.017
.005
.193 .057+
.086
.169+ .218** .227* .166
.002 .011
.061***
.048
.024
.308
504 122
.058***
.050
.032
.306
512 124
.001
.058***
.051
.027
.308
488 118
.011
.061***
.050
.027
.308
476 115
95
This content downloaded on Thu, 20 Dec 2012 12:57:08 PMAll use subject to JSTOR Terms and Conditions
Desimone et al.
TABLE 3 Effects of Professional Development on the Use of Alternative Assessments
Model 1: Model 2: Model 3: Coefficient
Level 1 model: Use of teaching strategies 1996-97 Extent of classroom use of strategy, 7i2
Essay tests (0/1), n3 Performance tasks (0/1), 7T4 Systematic observation of students (0/1), n5 Math-science reports (0/1), i6t Math-science project (0/1), n7 (Reference category: portfolios)
Level 2 model: Teacher-activity level effects Effects on intercept in strategy model (nloi) Baseline, Poo Mean focus on set of strategies, Poi Subject taught: (mathematics), P02
Elementary school, P03 High school, o04
Reform type, P05 Time span, P05
Hours, o05 Collective participation, 305 Active learning, P05 Coherence, P05 Reform type x mean focus, P06 Time span x mean focus, P06 Hours x mean focus, P06 Collective participation x mean focus, P06 Active learning x mean focus, 1306 Coherence x mean focus, P06 Effects on dpi slope in strategy model (tnli) Baseline, po1 Reform type, Pl Time span, P1, Hours, P3 Collective participation, P1 Active learning, P13 Coherence, 11
Variance components Between-teacher variance in intercept Between-teacher variance in slope Covariation in intercept-slope Residual
Degrees of freedom Strategy level Teacher-activity level
Base Reform type Time span
.445***
.130
.494***
.640***
.225**
.289***
.488***
.494** -.131 -.235* -.143
.440***
.137
.507***
.662***
.239**
.308***
.574***
.342* -.137+ -.259* -.184
-.411*
.932*
.297*** .331*** -.225
.442***
.152+
.518***
.648***
.252**
.319***
.591***
.108 -.128 -.257* -.144
-.031
.095
.355*
-.014
.125***
.057
.001
.438
616 120
.120***
.059
.010
.443
600 115
.128***
.068
.003
.440
600 115
Note. +p < .10, *p < .05, **p < .01, ***p < .001.
96
This content downloaded on Thu, 20 Dec 2012 12:57:08 PMAll use subject to JSTOR Terms and Conditions
Effects of Professional Development on Teachers' Instruction
Model 5: Model 6: Model 4: Collective Active Model 7:
Hours participation learning Coherence
443*** .138 .504*** .642*** .230** .299***
.582***
.340+ -.137+ -.258* -.133
-.005
.008
.441***
.137
.507***
.653***
.239***
.298**
.514***
.344+ -.143+ -.223* -.130
.434***
.087
.457***
.617***
.192*
.267**
.489***
.458* -.115 -.185+ -.085
.438***
.071
.472***
.643***
.188*
.255**
.572* -.252 -.122 -.178 -.078
-.076 -.025
-.029
.313 .042
.141+
.320** .376*** .409*** .012
-.001 -.183
-.023 .046
.125***
.064
.005
.438
610 117
.125***
.053
.009
615 118
.110***
.068 -.001
.431
585 112
.111***
.068 -.001
.431
570 109
97
This content downloaded on Thu, 20 Dec 2012 12:57:08 PMAll use subject to JSTOR Terms and Conditions
Desimone et al.
Clearly, it was important to have the longitudinal data with baseline as a control variable in our
analyses. The remaining strategy-level coefficients represent the average 1998-99 use for each prac- tice relative to using computers to access the internet. The results for these coefficients indi- cate that in 1998-99, teachers tended to use com- puters to write reports more than they used the other practices, controlling for their 1996-97 level of use (n5 = 0.179**). Apparently, between 1996-97 and 1998-99 there was a greater in- crease in teaching students to use computers to write reports than there was an increase in the other types of technology use. Recall that tech- nology use is measured on a scale from 0 to 3, where 0 = almost never, 1 = some lessons, 2 = most lessons, and 3 = every lesson.
As Tables 2 and 3 show, we also found dif- ferences in the 1998-99 use of specific prac- tices in the areas of instruction and assessment. For instruction (Table 2), teachers tended to have students debate ideas and explain their rea- soning more frequently than they had students work on independent long-term projects (713 =
-0.269***), work on problems with no obvious solution (n14 = -0.205**), or work on interdisci- plinary lessons (n6 = -0.125+), controlling for use of these practices in 1996-97. Differences between use of debate and technical writing skills were not significant (n5 = -0.065). In as- sessment (Table 3), teachers tended to place more importance on performance tasks (74 =
0.494***), systematic observation of students (n15 = 0.640***), math-science reports (7t6 =
0.225**), and projects (ni7 = 0.289***) than on portfolios controlling for the use of these prac- tices in 1996-97. Differences between use of portfolios and essay tests were not significant (73 = 0.130).
For the second group of parameters, the first coefficient shown in Table 1 (Poo = 0.384***) represents the baseline level of use for the typi- cal teacher in 1998-99, controlling for 1996-97 use. The coefficient indicates that a teacher who did not use a technology practice at all in 1996-97 would be expected to have a use of 0.384 in 1998-99.26 Results for the use of higher order in- structional practices and assessments are similar. Table 2 shows that a teacher who did not use any of the instructional practices in 1996-97 would be expected to have a use of 0.962*** in 1988-99;
98
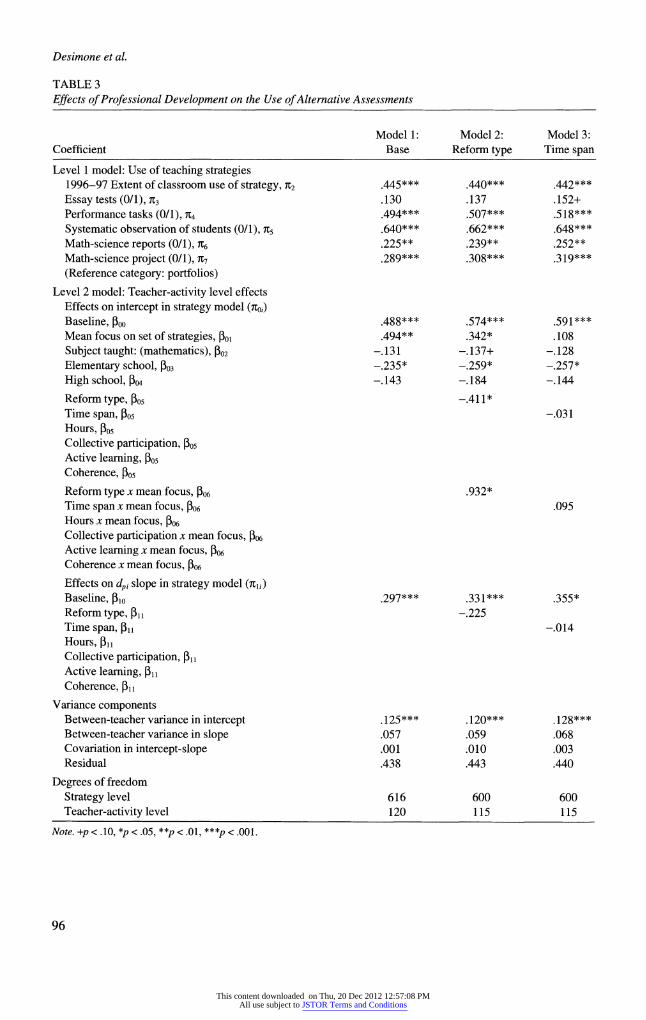
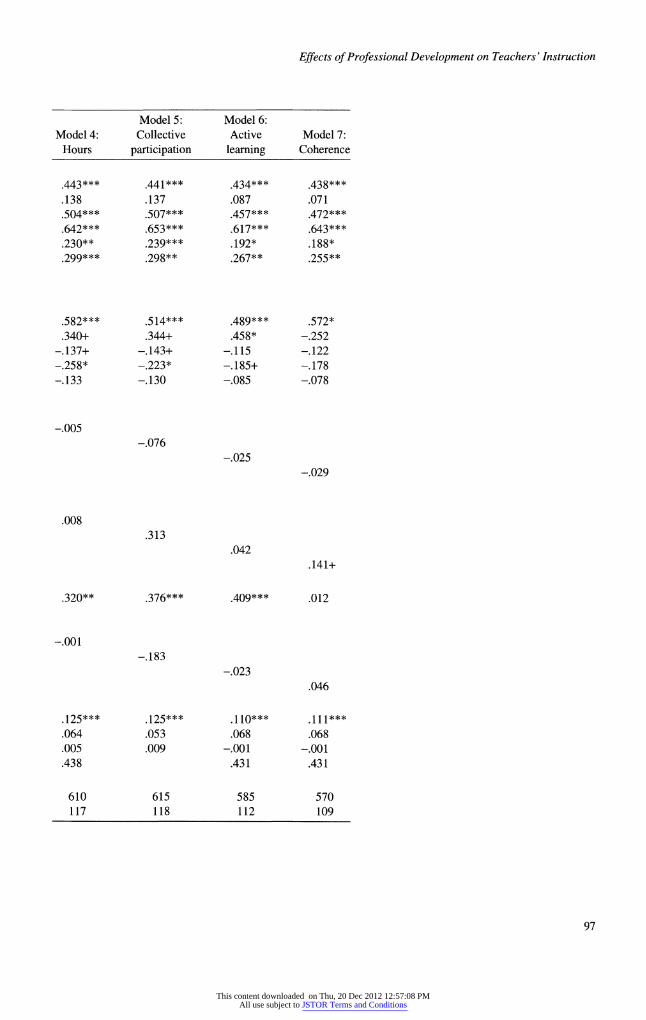
for assessment practices, Table 3 shows that the predicted use is 0.488***.
The three teacher-activity level coefficients that follow represent the effects of subject taught and school level. Among these coefficients, the only significant effect is for elementary school (P03 = -0.338***). This coefficient indicates that elementary teachers were less likely to use tech- nology practices in 1998-99 than were middle- and high-school teachers, controlling for prior use. Table 2 shows that elementary and high school teachers were significantly less likely to use higher order instructional practices than mid- dle school teachers in 1998-99 (03 = -0.225** and 04 = -0.219*, respectively), controlling for their 1996-97 use. Table 3 shows that elemen- tary teachers use alternative assessment practices significantly less than middle school teachers in 1998-99 (P03 = -0.235*), controlling for their 1996-97 use.
Variance Components The variance components shown near the bot-
tom of Table 1 indicate that there is significant between-teacher variation in the strategy-level intercept and slope (0.076*** and 0.167*), after controlling for the variables in the model.27 This indicates that teachers differ in their use of tech- nology practices in 1998-99, after controlling for the variables in the model; in addition, they differ in their responsiveness to professional develop- ment. Other characteristics, beyond those included in the model, may help explain this variation. For instructional practices and assessment, there is significant between-teacher variation in the strategy-level intercept (.062*** and .125***, respectively), but not in the slope.
Summary of Results
Tables 1, 2, and 3 illustrate that in each of the three areas examined in our analysis-technology use, higher order instructional methods, and alter- native student assessments-teacher participation in professional development that focuses on a par- ticular teaching practice predicts increased teach- ers' use of that practice in their classrooms. As de- scribed above, these effects are independent of teachers' prior use of these practices, the subjects they teach, and the school level. We did not ask teachers to chose an activity that was helpful in a particular area (e.g., technology use), but rather asked them to identify an activity that was the
This content downloaded on Thu, 20 Dec 2012 12:57:08 PMAll use subject to JSTOR Terms and Conditions
Effects of Professional Development on Teachers' Instruction
most helpful in general. Nor did we use data from the same survey to form baseline, independent and dependent variables. Thus, our findings that activ- ities focused on particular practices increase the use of those practices are not tautological. Further- more, there was variance in the degree of influ- ence among the selected activities, and the char- acteristics of those activities (e.g., mean or relative focus on technology use) explained that variance.
In addition to expecting effects of practice- focused professional development on teachers' use of a particular practice, we hypothesized that professional development that focuses on other specific practices within the same area of profes- sional development also would increase teach- ers' use of a specific practice within that area. In other words, we hypothesized a "spillover" in the effects of professional development on classroom uses of specific teaching practices. Our results in- dicate that the spillover is in the expected direc- tion, but results are not significant. Perhaps stud- ies with a larger number of teachers would yield results with stronger support for the spillover hypothesis. If the spillover hypothesis is correct, however, then it is likely not a strong effect.
Increased Impact of Professional Development Activities with Specific Features of High Quality
Having found that professional development focusing on specific teaching practices had ef- fects on the use of those practices in the class- room, we sought to examine the extent to which features of high quality increased the effective- ness of the professional development. Because our analyses controlled for prior use of the spe- cific teaching practices in 1996-97, and teachers' subject (mathematics or science) and grade level taught (elementary, middle, and secondary), we were able to see the effects of the quality of pro- fessional development on teaching practice inde- pendent of these other factors.
The Effects of Quality on Relative Focus
In Tables 1, 2 and 3, Models 2-7 differ from Model 1 in that each includes a variable repre- senting a specific feature of quality (e.g., the ex- tent to which active learning opportunities were provided as part of the activities in which teach- ers participated). Otherwise, the models are iden- tical to Model 1.
To provide an example of how to interpret the effects of a particular quality of professional de- velopment on the use of teaching practices in the classroom, we use the effect of active learning opportunities on the use of technology practices (Model 6 from Table 1).
The coefficient PIn indicates the effect of active learning. That is, PIn estimates the degree to which the effect of focusing on a particular technology- use strategy during professional development is strengthened if the activity provides opportuni- ties for active learning. The estimated coefficient (P31 = 0.041+) indicates that the effect is positive and significant (p < .10). The magnitude of the effect can be assessed by combining the baseline slope estimate (l0o = 0.137) and the coefficient for active learning (PI, = 0.041+). For a professional development activity that provided no opportuni- ties for active learning, the effects of relativefocus on a particular practice on the use of the prac- tice in the classroom would be 0.137 (Plo only). For an activity that provided 10 opportunities for active learning, the effects of relativefocus on a particular strategy would be 0.137 + 10 x 0.041 = 0.137 + 0.410 = 0.547, which is a substantial increase.
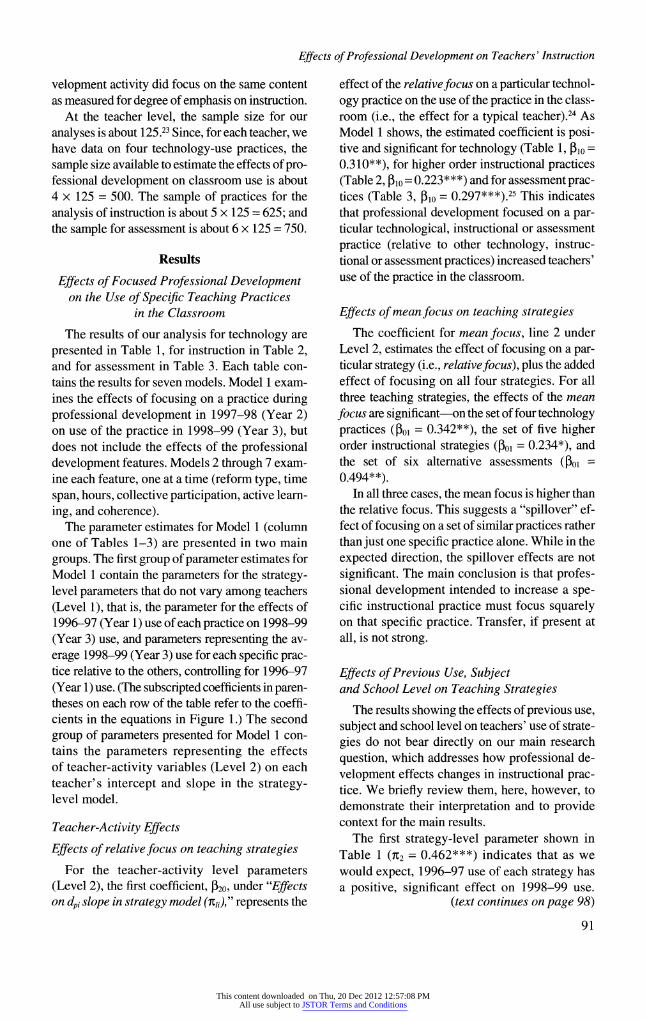
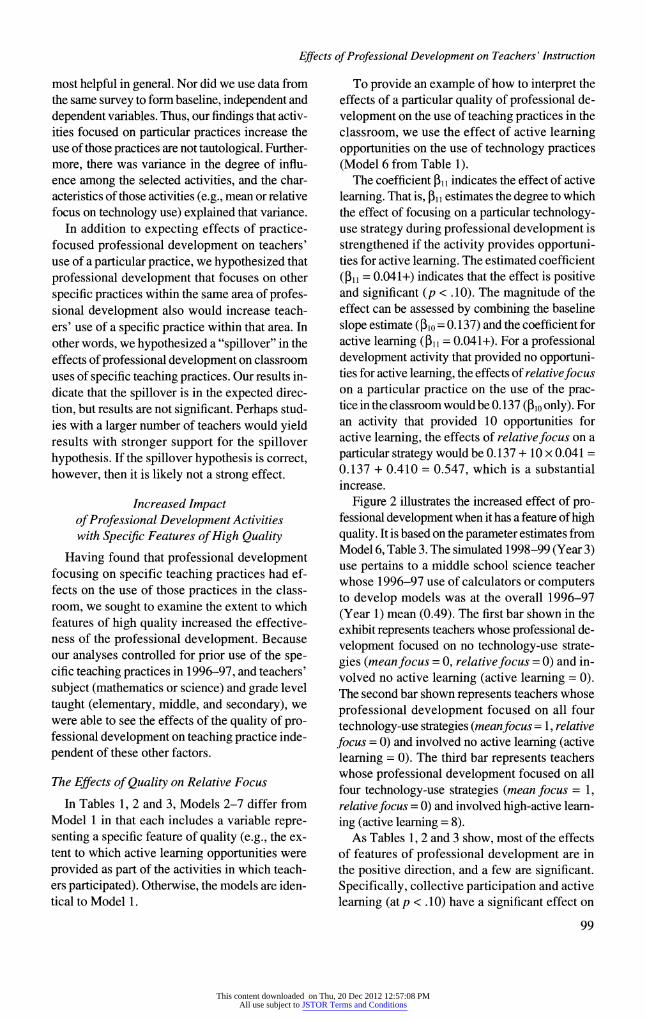
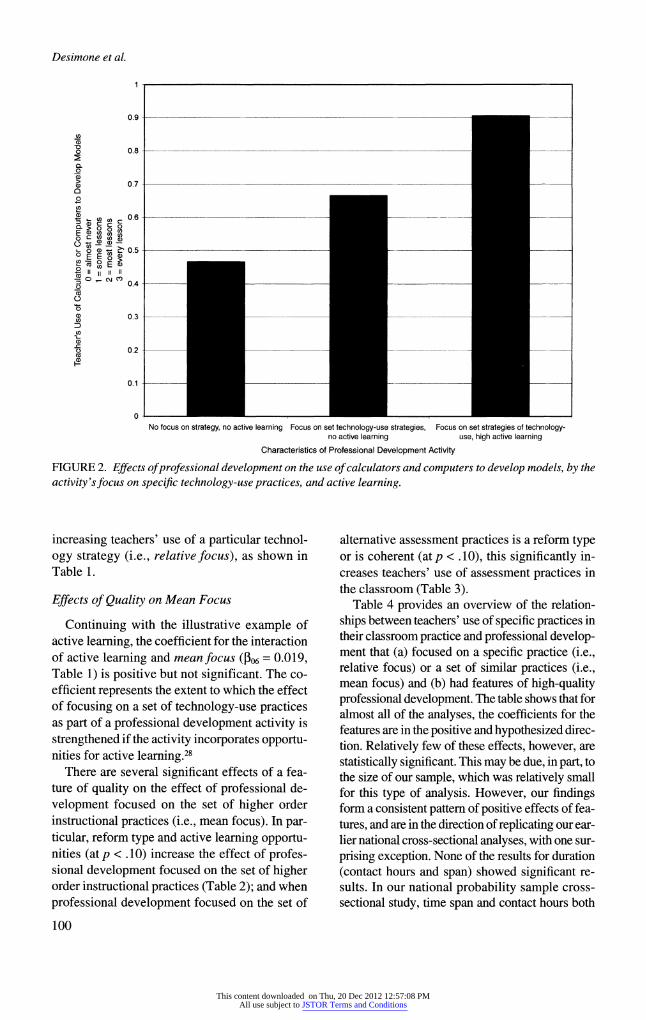
Figure 2 illustrates the increased effect of pro- fessional development when it has a feature of high quality. It is based on the parameter estimates from Model 6, Table 3. The simulated 1998-99 (Year 3) use pertains to a middle school science teacher whose 1996-97 use of calculators or computers to develop models was at the overall 1996-97 (Year 1) mean (0.49). The first bar shown in the exhibit represents teachers whose professional de- velopment focused on no technology-use strate- gies (mean focus = 0, relative focus = 0) and in- volved no active learning (active learning = 0). The second bar shown represents teachers whose professional development focused on all four technology-use strategies (meanfocus = 1, relative
focus = 0) and involved no active learning (active learning = 0). The third bar represents teachers whose professional development focused on all four technology-use strategies (mean focus = 1, relative focus = 0) and involved high-active learn- ing (active learning = 8).
As Tables 1, 2 and 3 show, most of the effects of features of professional development are in the positive direction, and a few are significant. Specifically, collective participation and active learning (at p < .10) have a significant effect on
99
This content downloaded on Thu, 20 Dec 2012 12:57:08 PMAll use subject to JSTOR Terms and Conditions
No focus on strategy, no active learning Focus on set technology-use strategies, Focus on set strategies of technology- no active learning use, high active learning
Characteristics of Professional Development Activity
FIGURE 2. Effects of professional development on the use of calculators and computers to develop models, by the activity 'sfocus on specific technology-use practices, and active learning.
increasing teachers' use of a particular technol- ogy strategy (i.e., relative focus), as shown in Table 1.
Effects of Quality on Mean Focus
Continuing with the illustrative example of active learning, the coefficient for the interaction of active learning and mean focus (Po6 = 0.019, Table 1) is positive but not significant. The co- efficient represents the extent to which the effect of focusing on a set of technology-use practices as part of a professional development activity is strengthened if the activity incorporates opportu- nities for active learning.28
There are several significant effects of a fea- ture of quality on the effect of professional de- velopment focused on the set of higher order instructional practices (i.e., mean focus). In par- ticular, reform type and active learning opportu- nities (at p < .10) increase the effect of profes- sional development focused on the set of higher order instructional practices (Table 2); and when professional development focused on the set of
100
alternative assessment practices is a reform type or is coherent (atp < .10), this significantly in- creases teachers' use of assessment practices in the classroom (Table 3).
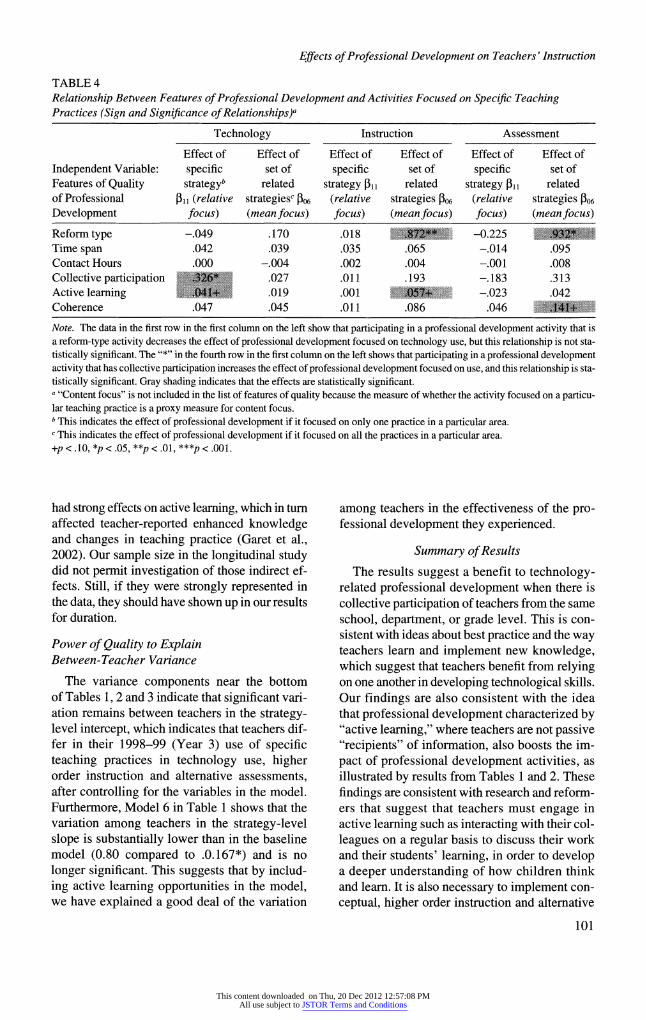
Table 4 provides an overview of the relation- ships between teachers' use of specific practices in their classroom practice and professional develop- ment that (a) focused on a specific practice (i.e., relative focus) or a set of similar practices (i.e., mean focus) and (b) had features of high-quality professional development. The table shows that for almost all of the analyses, the coefficients for the features are in the positive and hypothesized direc- tion. Relatively few of these effects, however, are statistically significant. This may be due, in part, to the size of our sample, which was relatively small for this type of analysis. However, our findings form a consistent pattern of positive effects of fea- tures, and are in the direction of replicating our ear- lier national cross-sectional analyses, with one sur- prising exception. None of the results for duration (contact hours and span) showed significant re- sults. In our national probability sample cross- sectional study, time span and contact hours both
Desimone et al.
0.9
-)
0 o
> 0 a
o
0
o
a E
o
a)
(D I II
0
I
0.8
0.7
0.6
0.5
0.4
0.3
0.2
0.1
0
1
This content downloaded on Thu, 20 Dec 2012 12:57:08 PMAll use subject to JSTOR Terms and Conditions
Effects of Professional Development on Teachers' Instruction
TABLE 4 Relationship Between Features of Professional Development and Activities Focused on Specific Teaching Practices (Sign and Significance of Relationships)a
Technology Instruction Assessment
Effect of Effect of Effect of Effect of Effect of Effect of Independent Variable: specific set of specific set of specific set of Features of Quality strategyb related strategy P1 related strategy 31l related of Professional P3l (relative strategiesc P6 (relative strategies 06 (relative strategies P06 Development focus) (mean focus) focus) (mean focus) focus) (mean focus)
Reform type -.049 .170 .018 -0.225 Time span .042 .039 .035 .065 -.014 .095 Contact Hours .000 -.004 .002 .004 -.001 .008 Collective participation .027 .011 .193 -.183 .313 Active learning .019 .001 -.023 .042 Coherence .047 .045 .011 .086 .046 !11 Note. The data in the first row in the first column on the left show that participating in a professional development activity that is a reform-type activity decreases the effect of professional development focused on technology use, but this relationship is not sta- tistically significant. The "*" in the fourth row in the first column on the left shows that participating in a professional development activity that has collective participation increases the effect of professional development focused on use, and this relationship is sta- tistically significant. Gray shading indicates that the effects are statistically significant. a "Content focus" is not included in the list of features of quality because the measure of whether the activity focused on a particu- lar teaching practice is a proxy measure for content focus. bThis indicates the effect of professional development if it focused on only one practice in a particular area. c This indicates the effect of professional development if it focused on all the practices in a particular area. +p < .10, *p < .05, **p < .01, ***p < .001.
had strong effects on active learning, which in turn affected teacher-reported enhanced knowledge and changes in teaching practice (Garet et al., 2002). Our sample size in the longitudinal study did not permit investigation of those indirect ef- fects. Still, if they were strongly represented in the data, they should have shown up in our results for duration.
Power of Quality to Explain Between-Teacher Variance
The variance components near the bottom of Tables 1, 2 and 3 indicate that significant vari- ation remains between teachers in the strategy- level intercept, which indicates that teachers dif- fer in their 1998-99 (Year 3) use of specific teaching practices in technology use, higher order instruction and alternative assessments, after controlling for the variables in the model. Furthermore, Model 6 in Table 1 shows that the variation among teachers in the strategy-level slope is substantially lower than in the baseline model (0.80 compared to .0.167*) and is no longer significant. This suggests that by includ- ing active learning opportunities in the model, we have explained a good deal of the variation
among teachers in the effectiveness of the pro- fessional development they experienced.
Summary of Results
The results suggest a benefit to technology- related professional development when there is collective participation of teachers from the same school, department, or grade level. This is con- sistent with ideas about best practice and the way teachers learn and implement new knowledge, which suggest that teachers benefit from relying on one another in developing technological skills. Our findings are also consistent with the idea that professional development characterized by "active learning," where teachers are not passive "recipients" of information, also boosts the im- pact of professional development activities, as illustrated by results from Tables 1 and 2. These findings are consistent with research and reform- ers that suggest that teachers must engage in active learning such as interacting with their col- leagues on a regular basis to discuss their work and their students' learning, in order to develop a deeper understanding of how children think and learn. It is also necessary to implement con- ceptual, higher order instruction and alternative
101
This content downloaded on Thu, 20 Dec 2012 12:57:08 PMAll use subject to JSTOR Terms and Conditions
Desimone et al.
"authentic" assessments (Little, 1993; Loucks- Horsley et al., 1998). Finally, the results in Tables 2 and 3 suggest a substantial benefit when teachers participate in reform types of professional development that focus on a set of higher order in- structional or alternative assessment methods. While either traditional or reform activities can provide constructive interaction, reform activities tend to have a longer duration, which allows them to offer more active learning opportunities for teachers (Garet et al., 2002). Darling-Hammond (1997b) also argues that these reform types of ac- tivities may be more responsive to teachers' needs and goals. No effects for duration were found.
Conclusions and Discussion: Effects of Professional Development
on Teaching Practice
Results from our longitudinal study replicate and extend cross-sectional, national findings by providing evidence of the link between focusing on specific teaching practices in professional de- velopment (content focus) and having teachers use those specific practices in the classroom. The results were also in the right direction to support our spillover hypothesis but were not statistically reliable. Specifically, in our longitudinal study, we found that professional development focused on specific teaching practices increased teachers' use of those practices in the classroom.
From prior research, we concluded that, in ad- dition to content focus, five key features of pro- fessional development are effective in improv- ing teaching practice: three structural features (characteristics of the structure of the activity)- reform type, duration, and collective participa- tion-and two core features (characteristics of the substance of the activity)-active learning and coherence (see Birman et al., 2000; Cohen & Hill, 2000; 2001; Garet et al., 1999; Garet et al., 2001; Kennedy, 1998). The findings re- ported here provide partial support for the im- portance of four of the additional five features of professional development identified in the na- tional study. Our longitudinal data indicate that professional development is more effective in changing teachers' classroom practice when it has collective participation of teachers from the same school, department, or grade; and active learning opportunities, such as reviewing stu- dent work or obtaining feedback on teaching; and coherence, for example, linking to other ac-
102
tivities or building on teachers' previous knowl- edge. Reform type professional development also had a positive effect. Surprisingly there were no effects for duration.
The basic design of our longitudinal study investigates the effects of Year 2 professional development features on Year 3 instructional prac- tices, controlling for Year 1 instructional practices. Obviously, we are interested in identifying fea- tures of professional development that, if put in
place, lead to desired changes in instructional practice. Hopefully, those changes in instruc- tional practice in turn lead to improved student achievement, though we offer no new evidence of such effects.
Strengths and Weaknesses of Our Design There are a number of strengths to our ap-
proach. First, we control for instructional practices prior to the professional development experiences. When we find that teachers who participate in pro- fessional development that focuses upon use of technology have relatively high uses of technol- ogy in Year 3, that finding is not explained by those teachers having been high users of technol- ogy prior to participation in the professional de- velopment. Second, our measures of professional development precede in time our measures of our dependent variables. In short, the professional development measures and Year 3 instructional practices measures are not overlapping in the time period described. Third, our findings are not due to such alternative explanations as changes in the courses teachers taught, nor are they likely due to changes in the students taught, since our design only included teachers teaching in the same school and teaching the same grade level or course. There could be a cohort effect of students, but the changes in student composition would have to be correlated with the features of professional devel- opment under investigation, which seems unlikely. Features of professional development were de- fined and described for the previous year, when the teacher was not working with the students that they were working with when we measured our dependent variables. Fourth, our baseline-control variables, professional-development indepen- dent variables, and instructional-practices de- pendent variables are each measured through a different survey, at a different point in time. There are no spurious correlations among these three sets of variables due to having been collected in the
This content downloaded on Thu, 20 Dec 2012 12:57:08 PMAll use subject to JSTOR Terms and Conditions
Effects of Professional Development on Teachers' Instruction
same instrument. All of these strengths were ab- sent from our earlier cross-sectional analyses on our national probability sample. To the extent that our findings from the earlier study are replicated in this longitudinal study, they are all the more convincing.
There are several weaknesses to our design strategy, as well. One concerns sample size. Given the number of variables and complexity of our models, it would have been better to have at least twice as many teachers. This sample size prob- lem had two implications. First, while we did replicate many of the findings from our earlier cross-sectional study, we did not replicate all of them. In general, however, the effects were in the hypothesized directions. This could be a problem of low statistical power due to small sample size. Second, it would have been preferable to put all six of the a priori identified dimensions of pro- fessional development in the same model. This would control for their potentially positive inter- correlations, and at the same time would allow us to look at how the dimensions work in combina- tion. Instead, we had to fit a separate model for each of the characteristics of professional devel- opment, due to insufficient sample size to sup- port the more inclusive model.
Another weakness of our design strategy was that, due to response burden considerations, teachers were asked to describe only a single pro- fessional development activity. We asked them to select the one that had been most influential- not in any specific way, but generally. Obviously, most teachers participate in more than one pro- fessional development activity during a single year. We would have greatly preferred to have a comprehensive and complete description of each respondent's entire professional development ex- periences as they relate to mathematics and sci- ence. Describing one professional development activity out of, say, three or four, is analogous to having only a few items on a student achievement test. Undoubtedly, the result is low reliability of our measures of experiences with professional development. In short, when a teacher reports that they participated in professional development that focused on uses of technology, the estimate of participation that we extract from the response may under- or overrepresent the teachers' actual participation in such professional development. If they participated in other professional develop- ment activities that also focused on technology,
then ours is an underestimate. If they participated in other professional development activities, none of which focused on the use of technology, then ours is an underestimate.
Our small sample size, our inability to put all of our independent variables into one model, and our less than complete measure of each teacher's professional development experiences all lead toward our not finding the effects of professional development on instructional practices that we
sought to find. Still, our results that content focus of professional development affects instructional practices tied to the content focus were clear and strong. And for the other five a priori identified
hypotheses about dimensions of quality profes- sional development, four were supported at least to some extent.
Nevertheless, our design is not an intervention study, where a well-established and implemented approach to professional development is given to one random half of teachers, while the other ran- dom half of teachers does not experience the inter- vention. Our study is based on natural variation, and so suffers the possible third-variable prob- lem (actually, seventh-variable, in this case). For example, we do not have a good measure of the extent to which the professional development activity described focused on knowledge of how students learn particular mathematics or science content. Yet we know from the literature that professional development that has a focus on how students learn specific content can be effective in changing teachers' instructional practices, which in turn can be effective in promoting gains in stu- dent achievement (Fennema et al., 1996). What if knowledge of student learning is a feature of professional development that also emphasizes active learning of participants? It could be that when we find effects of active learning, really what we're finding is effects of a seventh and un- known variable. We are certain that the six fea- tures that we investigated are not the only six important features of professional development; but we are not certain of all of the other impor- tant features of effective professional develop- ment, nor are we certain of their likely positive covariation with the six features investigated. This seventh variable problem adds some tentative- ness to our conclusions.
Admittedly, our longitudinal design and re- quirement of complete data did result in studying only approximately 207 teachers out of an origi-
103
This content downloaded on Thu, 20 Dec 2012 12:57:08 PMAll use subject to JSTOR Terms and Conditions
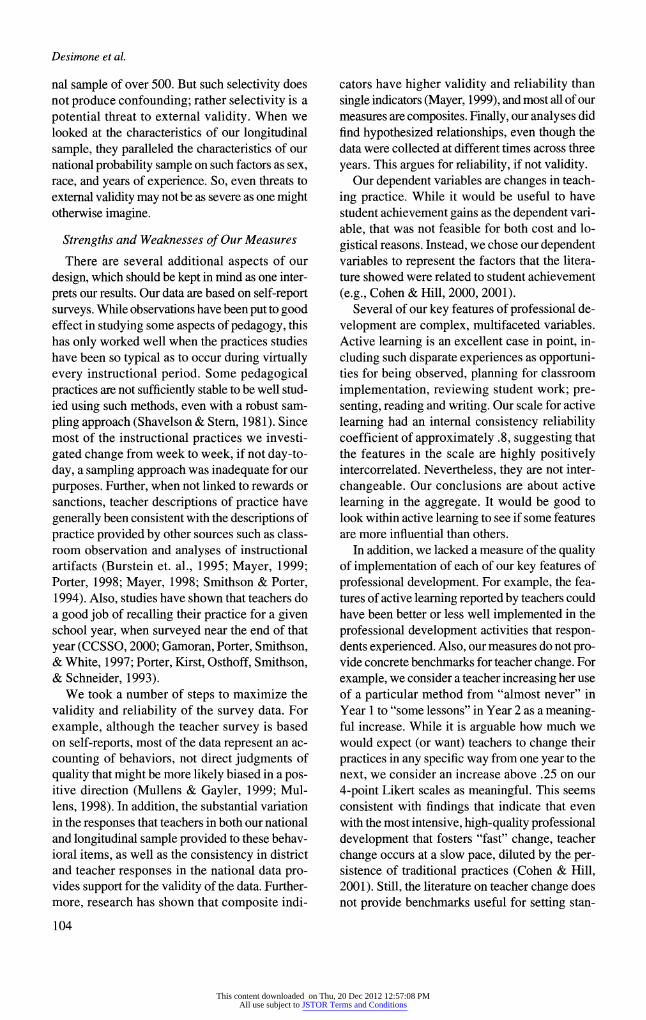
Desimone et al.
nal sample of over 500. But such selectivity does not produce confounding; rather selectivity is a
potential threat to external validity. When we looked at the characteristics of our longitudinal sample, they paralleled the characteristics of our national probability sample on such factors as sex, race, and years of experience. So, even threats to external validity may not be as severe as one might otherwise imagine.
Strengths and Weaknesses of Our Measures
There are several additional aspects of our design, which should be kept in mind as one inter- prets our results. Our data are based on self-report surveys. While observations have been put to good effect in studying some aspects of pedagogy, this has only worked well when the practices studies have been so typical as to occur during virtually every instructional period. Some pedagogical practices are not sufficiently stable to be well stud- ied using such methods, even with a robust sam- pling approach (Shavelson & Ster, 1981). Since most of the instructional practices we investi- gated change from week to week, if not day-to- day, a sampling approach was inadequate for our purposes. Further, when not linked to rewards or sanctions, teacher descriptions of practice have generally been consistent with the descriptions of practice provided by other sources such as class- room observation and analyses of instructional artifacts (Burstein et. al., 1995; Mayer, 1999; Porter, 1998; Mayer, 1998; Smithson & Porter, 1994). Also, studies have shown that teachers do a good job of recalling their practice for a given school year, when surveyed near the end of that year (CCSSO, 2000; Gamoran, Porter, Smithson, & White, 1997; Porter, Kirst, Osthoff, Smithson, & Schneider, 1993).
We took a number of steps to maximize the validity and reliability of the survey data. For example, although the teacher survey is based on self-reports, most of the data represent an ac- counting of behaviors, not direct judgments of quality that might be more likely biased in a pos- itive direction (Mullens & Gayler, 1999; Mul- lens, 1998). In addition, the substantial variation in the responses that teachers in both our national and longitudinal sample provided to these behav- ioral items, as well as the consistency in district and teacher responses in the national data pro- vides support for the validity of the data. Further- more, research has shown that composite indi-
104
cators have higher validity and reliability than single indicators (Mayer, 1999), and most all of our measures are composites. Finally, our analyses did find hypothesized relationships, even though the data were collected at different times across three years. This argues for reliability, if not validity.
Our dependent variables are changes in teach-
ing practice. While it would be useful to have student achievement gains as the dependent vari- able, that was not feasible for both cost and lo-
gistical reasons. Instead, we chose our dependent variables to represent the factors that the litera- ture showed were related to student achievement (e.g., Cohen & Hill, 2000, 2001).
Several of our key features of professional de-
velopment are complex, multifaceted variables. Active learning is an excellent case in point, in-
cluding such disparate experiences as opportuni- ties for being observed, planning for classroom implementation, reviewing student work; pre- senting, reading and writing. Our scale for active
learning had an internal consistency reliability coefficient of approximately .8, suggesting that the features in the scale are highly positively intercorrelated. Nevertheless, they are not inter-
changeable. Our conclusions are about active learning in the aggregate. It would be good to look within active learning to see if some features are more influential than others.
In addition, we lacked a measure of the quality of implementation of each of our key features of professional development. For example, the fea- tures of active learning reported by teachers could have been better or less well implemented in the professional development activities that respon- dents experienced. Also, our measures do not pro- vide concrete benchmarks for teacher change. For example, we consider a teacher increasing her use of a particular method from "almost never" in Year 1 to "some lessons" in Year 2 as a meaning- ful increase. While it is arguable how much we would expect (or want) teachers to change their practices in any specific way from one year to the next, we consider an increase above .25 on our 4-point Likert scales as meaningful. This seems consistent with findings that indicate that even with the most intensive, high-quality professional development that fosters "fast" change, teacher change occurs at a slow pace, diluted by the per- sistence of traditional practices (Cohen & Hill, 2001). Still, the literature on teacher change does not provide benchmarks useful for setting stan-
This content downloaded on Thu, 20 Dec 2012 12:57:08 PMAll use subject to JSTOR Terms and Conditions
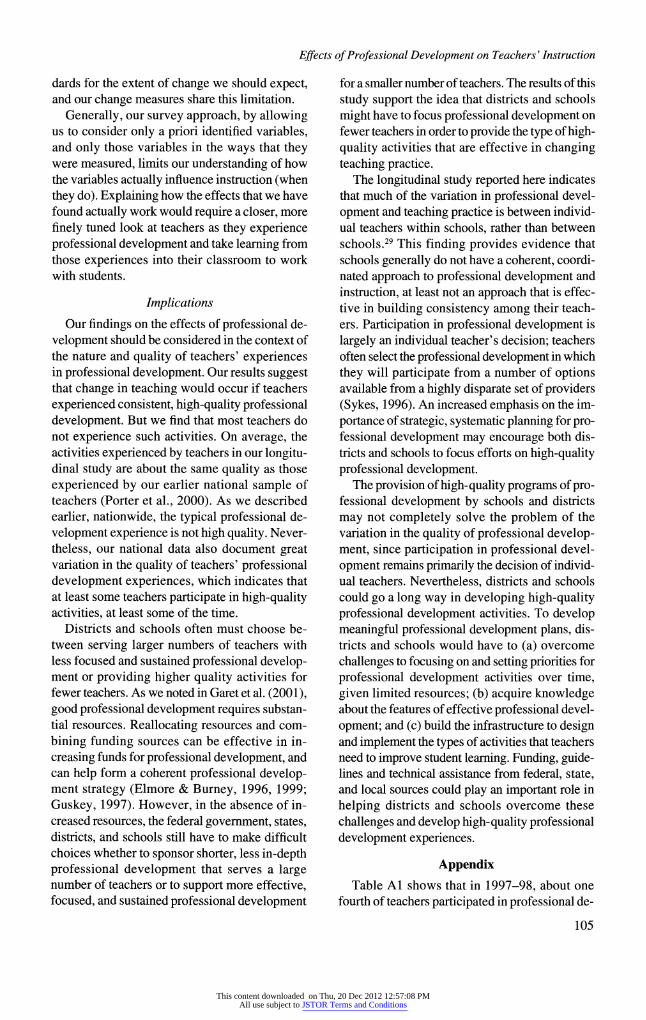
Effects of Professional Development on Teachers' Instruction
dards for the extent of change we should expect, and our change measures share this limitation.
Generally, our survey approach, by allowing us to consider only a priori identified variables, and only those variables in the ways that they were measured, limits our understanding of how the variables actually influence instruction (when they do). Explaining how the effects that we have found actually work would require a closer, more finely tuned look at teachers as they experience professional development and take learning from those experiences into their classroom to work with students.
Implications
Our findings on the effects of professional de- velopment should be considered in the context of the nature and quality of teachers' experiences in professional development. Our results suggest that change in teaching would occur if teachers experienced consistent, high-quality professional development. But we find that most teachers do not experience such activities. On average, the activities experienced by teachers in our longitu- dinal study are about the same quality as those experienced by our earlier national sample of teachers (Porter et al., 2000). As we described earlier, nationwide, the typical professional de- velopment experience is not high quality. Never- theless, our national data also document great variation in the quality of teachers' professional development experiences, which indicates that at least some teachers participate in high-quality activities, at least some of the time.
Districts and schools often must choose be- tween serving larger numbers of teachers with less focused and sustained professional develop- ment or providing higher quality activities for fewer teachers. As we noted in Garet et al. (2001), good professional development requires substan- tial resources. Reallocating resources and com- bining funding sources can be effective in in- creasing funds for professional development, and can help form a coherent professional develop- ment strategy (Elmore & Burney, 1996, 1999; Guskey, 1997). However, in the absence of in- creased resources, the federal government, states, districts, and schools still have to make difficult choices whether to sponsor shorter, less in-depth professional development that serves a large number of teachers or to support more effective, focused, and sustained professional development
for a smaller number of teachers. The results of this study support the idea that districts and schools might have to focus professional development on fewer teachers in order to provide the type of high- quality activities that are effective in changing teaching practice.
The longitudinal study reported here indicates that much of the variation in professional devel- opment and teaching practice is between individ- ual teachers within schools, rather than between schools.29 This finding provides evidence that schools generally do not have a coherent, coordi- nated approach to professional development and instruction, at least not an approach that is effec- tive in building consistency among their teach- ers. Participation in professional development is largely an individual teacher's decision; teachers often select the professional development in which they will participate from a number of options available from a highly disparate set of providers (Sykes, 1996). An increased emphasis on the im- portance of strategic, systematic planning for pro- fessional development may encourage both dis- tricts and schools to focus efforts on high-quality professional development.
The provision of high-quality programs of pro- fessional development by schools and districts may not completely solve the problem of the variation in the quality of professional develop- ment, since participation in professional devel- opment remains primarily the decision of individ- ual teachers. Nevertheless, districts and schools could go a long way in developing high-quality professional development activities. To develop meaningful professional development plans, dis- tricts and schools would have to (a) overcome challenges to focusing on and setting priorities for professional development activities over time, given limited resources; (b) acquire knowledge about the features of effective professional devel- opment; and (c) build the infrastructure to design and implement the types of activities that teachers need to improve student learning. Funding, guide- lines and technical assistance from federal, state, and local sources could play an important role in helping districts and schools overcome these challenges and develop high-quality professional development experiences.
Appendix Table Al shows that in 1997-98, about one
fourth of teachers participated in professional de-
105
This content downloaded on Thu, 20 Dec 2012 12:57:08 PMAll use subject to JSTOR Terms and Conditions
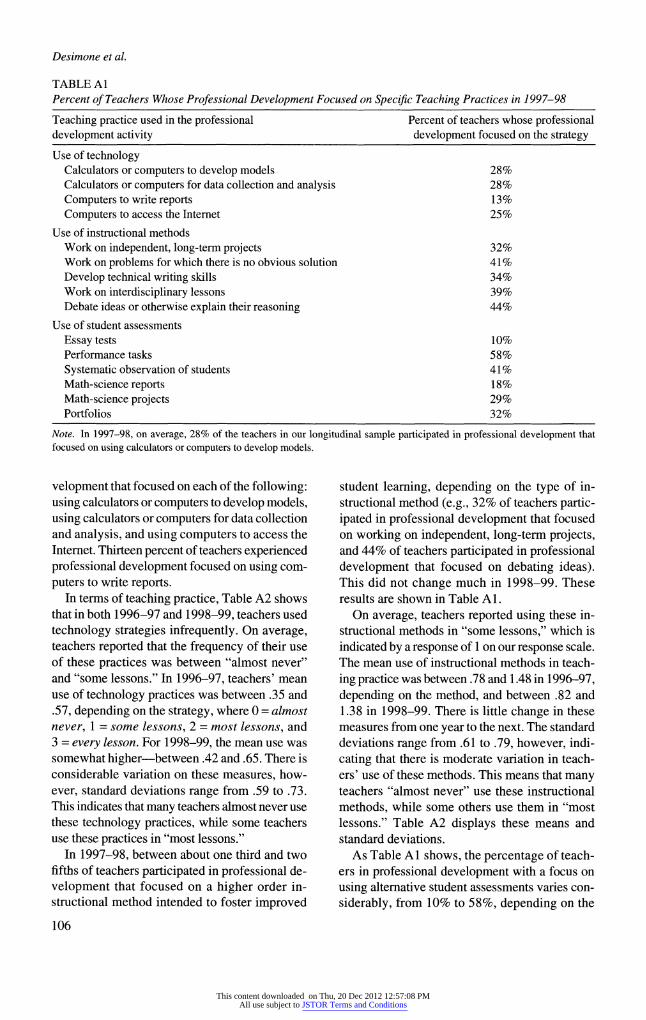
Desimone et al.
TABLE A1 Percent of Teachers Whose Professional Development Focused on Specific Teaching Practices in 1997-98
Teaching practice used in the professional development activity
Percent of teachers whose professional development focused on the strategy
Use of technology Calculators or computers to develop models Calculators or computers for data collection and analysis Computers to write reports Computers to access the Interet
Use of instructional methods Work on independent, long-term projects Work on problems for which there is no obvious solution Develop technical writing skills Work on interdisciplinary lessons Debate ideas or otherwise explain their reasoning
Use of student assessments Essay tests Performance tasks Systematic observation of students Math-science reports Math-science projects Portfolios
28% 28% 13% 25%
32% 41% 34% 39% 44%
10% 58% 41% 18% 29% 32%
Note. In 1997-98, on average, 28% of the teachers in our longitudinal sample participated in professional development that focused on using calculators or computers to develop models.
velopment that focused on each of the following: using calculators or computers to develop models, using calculators or computers for data collection and analysis, and using computers to access the Internet. Thirteen percent of teachers experienced professional development focused on using com- puters to write reports.
In terms of teaching practice, Table A2 shows that in both 1996-97 and 1998-99, teachers used technology strategies infrequently. On average, teachers reported that the frequency of their use of these practices was between "almost never" and "some lessons." In 1996-97, teachers' mean use of technology practices was between .35 and .57, depending on the strategy, where 0 = almost never, 1 = some lessons, 2 = most lessons, and 3 = every lesson. For 1998-99, the mean use was somewhat higher-between .42 and .65. There is considerable variation on these measures, how- ever, standard deviations range from .59 to .73. This indicates that many teachers almost never use these technology practices, while some teachers use these practices in "most lessons."
In 1997-98, between about one third and two fifths of teachers participated in professional de- velopment that focused on a higher order in- structional method intended to foster improved
106
student learning, depending on the type of in- structional method (e.g., 32% of teachers partic- ipated in professional development that focused on working on independent, long-term projects, and 44% of teachers participated in professional development that focused on debating ideas). This did not change much in 1998-99. These results are shown in Table Al.
On average, teachers reported using these in- structional methods in "some lessons," which is indicated by a response of 1 on our response scale. The mean use of instructional methods in teach- ing practice was between .78 and 1.48 in 1996-97, depending on the method, and between .82 and 1.38 in 1998-99. There is little change in these measures from one year to the next. The standard deviations range from .61 to .79, however, indi- cating that there is moderate variation in teach- ers' use of these methods. This means that many teachers "almost never" use these instructional methods, while some others use them in "most lessons." Table A2 displays these means and standard deviations.
As Table Al shows, the percentage of teach- ers in professional development with a focus on using alternative student assessments varies con- siderably, from 10% to 58%, depending on the
This content downloaded on Thu, 20 Dec 2012 12:57:08 PMAll use subject to JSTOR Terms and Conditions
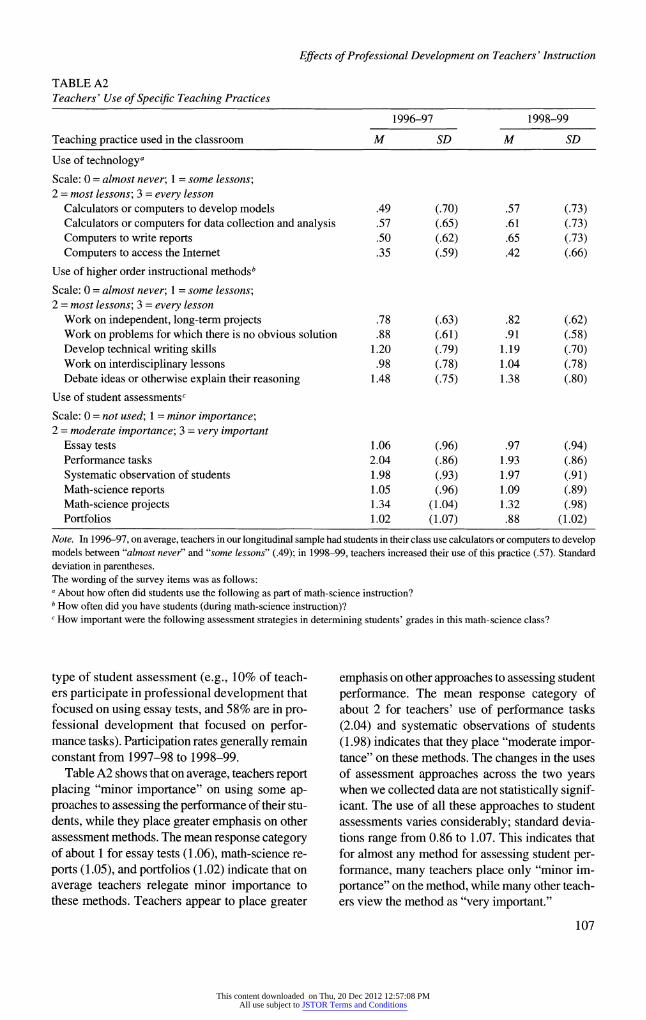
Effects of Professional Development on Teachers' Instruction
TABLE A2 Teachers' Use of Specific Teaching Practices
Teaching practice used in the classroom
Use of technologya Scale: 0 = almost never; 1 = some lessons; 2 = most lessons; 3 = every lesson
Calculators or computers to develop models Calculators or computers for data collection and analysis Computers to write reports Computers to access the Interet
Use of higher order instructional methodsb
Scale: 0 = almost never; 1 = some lessons; 2 = most lessons; 3 = every lesson
Work on independent, long-term projects Work on problems for which there is no obvious solution Develop technical writing skills Work on interdisciplinary lessons Debate ideas or otherwise explain their reasoning
Use of student assessmentsc
Scale: 0 = not used; 1 = minor importance; 2 = moderate importance; 3 = very important
Essay tests Performance tasks Systematic observation of students Math-science reports Math-science projects Portfolios
1996-97
M SD
.49
.57
.50
.35
.78
.88 1.20 .98
1.48
1.06 2.04 1.98 1.05 1.34 1.02
(.70) (.65) (.62) (.59)
(.63) (.61) (.79) (.78) (.75)
(.96) (.86) (.93) (.96)
(1.04) (1.07)
1998-99
M SD
.57
.61
.65
.42
.82
.91 1.19 1.04 1.38
.97 1.93 1.97 1.09 1.32 .88
(.73) (.73) (.73) (.66)
(.62) (.58) (.70) (.78) (.80)
(.94) (.86) (.91) (.89) (.98)
(1.02)
Note. In 1996-97, on average, teachers in our longitudinal sample had students in their class use calculators or computers to develop models between "almost never" and "some lessons" (.49); in 1998-99, teachers increased their use of this practice (.57). Standard deviation in parentheses. The wording of the survey items was as follows: a About how often did students use the following as part of math-science instruction? b How often did you have students (during math-science instruction)? c How important were the following assessment strategies in determining students' grades in this math-science class?
type of student assessment (e.g., 10% of teach- ers participate in professional development that focused on using essay tests, and 58% are in pro- fessional development that focused on perfor- mance tasks). Participation rates generally remain constant from 1997-98 to 1998-99.
Table A2 shows that on average, teachers report placing "minor importance" on using some ap- proaches to assessing the performance of their stu- dents, while they place greater emphasis on other assessment methods. The mean response category of about 1 for essay tests (1.06), math-science re- ports (1.05), and portfolios (1.02) indicate that on average teachers relegate minor importance to these methods. Teachers appear to place greater
emphasis on other approaches to assessing student performance. The mean response category of about 2 for teachers' use of performance tasks (2.04) and systematic observations of students (1.98) indicates that they place "moderate impor- tance" on these methods. The changes in the uses of assessment approaches across the two years when we collected data are not statistically signif- icant. The use of all these approaches to student assessments varies considerably; standard devia- tions range from 0.86 to 1.07. This indicates that for almost any method for assessing student per- formance, many teachers place only "minor im- portance" on the method, while many other teach- ers view the method as "very important."
107
This content downloaded on Thu, 20 Dec 2012 12:57:08 PMAll use subject to JSTOR Terms and Conditions
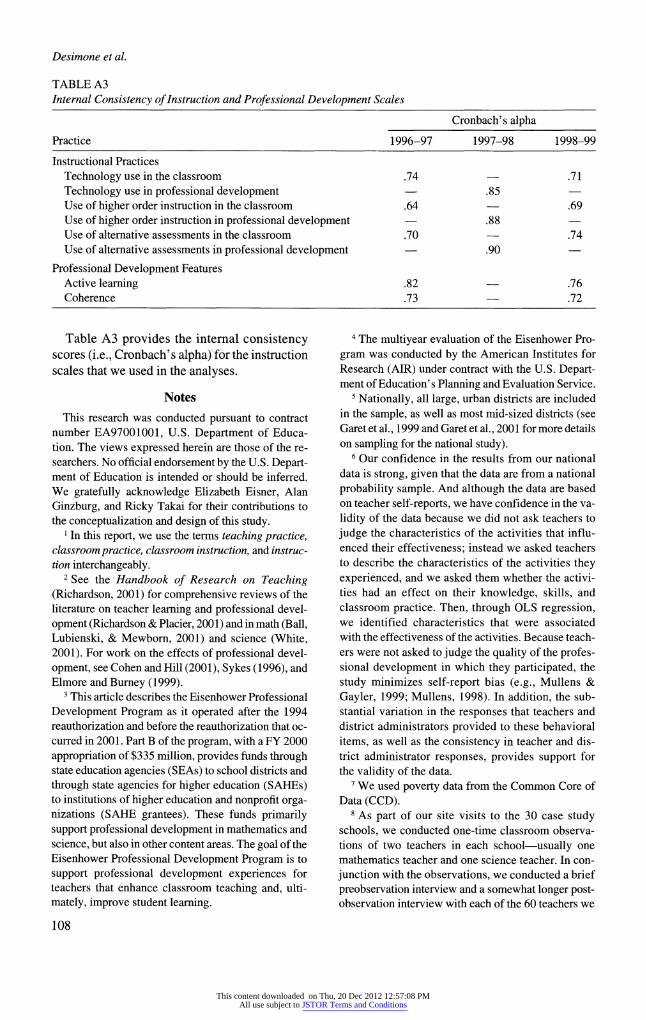
Desimone et al.
TABLE A3 Internal Consistency of Instruction and Professional Development Scales
Cronbach's alpha
Practice 1996-97 1997-98 1998-99
Instructional Practices Technology use in the classroom .74 - .71 Technology use in professional development - .85 Use of higher order instruction in the classroom .64 - .69 Use of higher order instruction in professional development - .88 Use of alternative assessments in the classroom .70 .74 Use of alternative assessments in professional development - .90
Professional Development Features Active learning .82 - .76 Coherence .73 .72
Table A3 provides the internal consistency scores (i.e., Cronbach's alpha) for the instruction scales that we used in the analyses.
Notes
This research was conducted pursuant to contract number EA97001001, U.S. Department of Educa- tion. The views expressed herein are those of the re- searchers. No official endorsement by the U.S. Depart- ment of Education is intended or should be inferred. We gratefully acknowledge Elizabeth Eisner, Alan Ginzburg, and Ricky Takai for their contributions to the conceptualization and design of this study.
1 In this report, we use the terms teaching practice, classroom practice, classroom instruction, and instruc- tion interchangeably.
2 See the Handbook of Research on Teaching (Richardson, 2001) for comprehensive reviews of the literature on teacher learning and professional devel- opment (Richardson & Placier, 2001) and in math (Ball, Lubienski, & Mewborn, 2001) and science (White, 2001). For work on the effects of professional devel- opment, see Cohen and Hill (2001), Sykes (1996), and Elmore and Burney (1999).
3 This article describes the Eisenhower Professional Development Program as it operated after the 1994 reauthorization and before the reauthorization that oc- curred in 2001. Part B of the program, with a FY 2000 appropriation of $335 million, provides funds through state education agencies (SEAs) to school districts and through state agencies for higher education (SAHEs) to institutions of higher education and nonprofit orga- nizations (SAHE grantees). These funds primarily support professional development in mathematics and science, but also in other content areas. The goal of the Eisenhower Professional Development Program is to support professional development experiences for teachers that enhance classroom teaching and, ulti- mately, improve student learning.
108
4 The multiyear evaluation of the Eisenhower Pro- gram was conducted by the American Institutes for Research (AIR) under contract with the U.S. Depart- ment of Education's Planning and Evaluation Service.
5 Nationally, all large, urban districts are included in the sample, as well as most mid-sized districts (see Garet et al., 1999 and Garet et al., 2001 for more details on sampling for the national study).
6 Our confidence in the results from our national data is strong, given that the data are from a national probability sample. And although the data are based on teacher self-reports, we have confidence in the va- lidity of the data because we did not ask teachers to judge the characteristics of the activities that influ- enced their effectiveness; instead we asked teachers to describe the characteristics of the activities they experienced, and we asked them whether the activi- ties had an effect on their knowledge, skills, and classroom practice. Then, through OLS regression, we identified characteristics that were associated with the effectiveness of the activities. Because teach- ers were not asked to judge the quality of the profes- sional development in which they participated, the study minimizes self-report bias (e.g., Mullens & Gayler, 1999; Mullens, 1998). In addition, the sub- stantial variation in the responses that teachers and district administrators provided to these behavioral items, as well as the consistency in teacher and dis- trict administrator responses, provides support for the validity of the data.
7 We used poverty data from the Common Core of Data (CCD).
8 As part of our site visits to the 30 case study schools, we conducted one-time classroom observa- tions of two teachers in each school-usually one mathematics teacher and one science teacher. In con- junction with the observations, we conducted a brief preobservation interview and a somewhat longer post- observation interview with each of the 60 teachers we
This content downloaded on Thu, 20 Dec 2012 12:57:08 PMAll use subject to JSTOR Terms and Conditions
Effects of Professional Development on Teachers' Instruction
observed. The results of these observations are dis- cussed in Garet et al., 1999.
9 The response rate of high school teachers was higher than those of elementary and middle school teachers, perhaps because principals and department chairs in high school were more involved in adminis- tering the survey.
10 We compared responses from teachers who re- sponded only to wave one and teachers who responded to all three waves and found no significant differences in gender, teaching experience, certification, poverty, and all of our measures of teaching practice. The one significant difference we found was that teachers who responded to wave one only were overrepresented in high-poverty schools, compared with those who par- ticipated in all three waves.
11 See Appendix B in Garet et al., 1999 for a more complete description of the sampling, response rates, design, and methodology.
12 We asked teachers about personal background in- formation, such as gender and years of experience, only in the baseline wave of the survey.
13 We did not ask teachers the total number of pro- fessional development activities in which they partic- ipated during the year; we did, however, ask them the number of types of professional development activities in which they participated, as well as the number of hours spent on each type.
14 For the 0 to 3 response scale, standard deviations for use of teaching strategies in the three areas ranged from .58 to 1.02.
15 These scales are identical to the scales used in the analysis of our national data.
16 The survey included a final category, "other orga- nized forms of professional development," and asked the teacher to describe the form. We reclassified all responses into one of the eight forms.
17 Teachers were also given the following options: teachers as individuals; teachers as representatives of their departments, grade level, or schools; and other configurations. Teachers could check all that applied.
18 The observation questions asked (1) whether the teacher received coaching or mentoring in the class- room as part of the Eisenhower-assisted activity; (2) whether the teacher's teaching was observed by the activity leader(s) and feedback was provided; (3) whether the teacher's teaching was observed by other participants and feedback was provided; and (4) whether the activity was evaluated in part on the basis of an observation of the teacher's classroom. The classroom implementation questions asked whether, as part of the activity in which the teacher participated, the teacher (1) practiced under simulated conditions, with feedback; (2) met formally with other activity participants to discuss classroom implementation; (3) communicated with the leader(s) of the activity con- cering classroom implementation; (4) met informally with other participants to discuss classroom imple-
mentation; and (5) developed curricula or lesson plans that other participants or the activity leader reviewed. The questions pertaining to reviewing student work were (1) whether the teacher reviewed student work or scored assessments as part of the activity; (2) whether work completed by students in the teacher's classroom was reviewed by other activity participants or (3) the activity leader; and (4) whether student outcomes were examined as part of an evaluation of the activity. The questions for presenting, leading, and writing were whether, as part of the activity, the teacher (1) gave a lecture or presentation; (2) conducted a demonstration of a lesson, unit, or skill; (3) led a whole-group dis- cussion; (4) led a small-group discussion; or (5) wrote a paper, report, or plan.
19 One of the eight indicators of coherence, whether teachers had discussed what they learned with other teachers in their school who did not attend the activ- ity, has a logical relationship with one part of one of the two indicators of collective participation, designed for all teachers in a school. The logical push toward a negative correlation was not realized in the data. Neither were these two variables ever used together in a single analysis.
20 The approach we followed is similar to the ap- proach used by Bryk and Raudenbush (1992) to dis- tinguish individual and contextual effects in models involving students nested within schools. In such mod- els, Bryk and Raudenbush propose centering measures of student background on the school mean and enter- ing both the centered student values and the school means in the analysis.
21 Mean focus is a teacher-activity level variable be- cause it characterizes the activity the teacher attended as a whole (the average emphasis the professional de- velopment activity placed on the four technology prac- tices); it does not characterize each strategy separately.
22 The conclusions can be derived from the vari- able definitions in Figure 2. If tpi is the focus given to strategy p by teacher i (coded 1/0), mi is the mean focus on the four technology practices for teacher i, dpi = (tpi - mi) is the relative focus on strategy p for teacher i, bm is the coefficient for mean focus, and br is the coefficient for relative focus, then the overall effect on the use of strategy p by teacher i can be written as follows:
bmmi + brdpt = bmmi + br(tpi - mi) = (b - br)mi + brtpi
Thus, mean focus (mi) has a positive effect if bm - br > 0; no effect if bm = br, and a negative effect if bm < br.
23 The exact sample size depends on the number of teachers with complete data on the variables included in the analysis.
24 As we indicated earlier, we assumed that the strategy-level intercept might vary among teachers. Thus, the baseline coefficient shown is the average or typical value among teachers in the sample; values for
109
This content downloaded on Thu, 20 Dec 2012 12:57:08 PMAll use subject to JSTOR Terms and Conditions
Desimone et al.
individual teachers vary around this average. The vari- ance components shown at the bottom of Table 3 in- dicate the extent of this variation.
25 The asterisks and "+" sign indicate the following: +p < .10, *p < .05, **p < .01, ***p < .001.
26 The expected use of 0.384 pertains to the use of
computers to access the Internet, by a science teacher at the middle school level. To determine the expected use of other practices, the specific strategy coefficients must be added (e.g., 0.179 for computers to write re-
ports). To determine the expected use for a mathemat- ics teacher or a teacher at the elementary or high school level, the appropriate coefficients must be added.
27 The other two variance components shown in the table include the covariation between the intercept and slope and the residual variance. The first of these indi- cates the extent to which teachers who have unusually high intercepts also have unusually high slopes; the second indicates the remaining variance in the use of each technology strategy in 1998-99, after all other measured variables and variance components are taken into account.
28 The coefficients for the main effects of quality on teaching practice are generally nonsignificant, except for the effects of reform type on instruction (P05 =
-0.351) and assessment (305 = -0.411). But their corresponding interactions (i.e., reform type x mean focus) are larger, positive and significant (506 = 0.872 for instruction and P06 = 0.932 for assessment). In a model where the interaction effects are significant, main effects should not be interpreted (e.g., Tabach- nick & Fidell, 1989), so in our discussion and inter- pretation, we focus on the interaction effects.
29Although the analyses are not reported here, our longitudinal data indicate that the quality of profes- sional development experiences varies considerably not only across teachers at a single point in time but also over time for the same teachers. Specifically, we find a substantial amount of year-to-year variation in the quality of the professional development of indi- vidual teachers. For example, 79% of the variation in the span and 62% of the variation in the content focus of a teacher's professional development experience are due to year-to-year variation. This finding indi- cates that the average teacher's professional develop- ment experiences (in our longitudinal sample) do not add up to a long-term, coherent, high-quality pro- gram-the type of program that has the most potential for fostering significant and lasting teacher change. In addition, we find some variation in participation in professional development between schools (e.g., 14% of the variation in collective participation and seven percent of the variation in active learning is due to between-school variation), but most of the variation in the quality of the professional development in which teachers participate lies within, not between, schools.
110
This finding supports the idea that professional devel- opment continues to be an individual teacher experi- ence. Both our national and our longitudinal data indi- cate that professional development is more effective when teachers participate with others from their school, grade, or department. Thus, the variation in teachers'
professional development experiences within the same school helps explain why professional development is not as effective as it could be. For more details on the variation in teachers' professional development experiences in our longitudinal sample, see Porter et al., 2000.
References
American Association for the Advancement of Science. (1989). Project 2061: Science for all Americans.
Washington, DC: Author. Ball, D. L., Lubienski, S. T., & Mewbor, D. S. (2001).
Mathematics. In V. Richardson (Ed.), Handbook of research on teaching (4th ed.) (pp. 433-456). Washington, DC: American Educational Research Association.
Birman, B., Desimone, Garet, M., & Porter, A. (2000). Designing professional development that works. Educational Leadership, 57(8), 28-33.
Birman, B. F., Reeve, A. L., & Sattler, C. L. (1998). The Eisenhower professional development program: Emerging themes from six districts. Washington, DC: U.S. Department of Education.
Birman, B. F., Kirshstein, R. J., Levin, D. A., Math- eson, N., & Stephens, M. (1997). The effectiveness of using technology in K-12 education: A preliminary framework and review. Paper prepared for the U.S. Department of Education, Office of Educational Research and Improvement.
Burstein, L., McDonnell, L. M., Van Winkle, J., Ormseth, T., Mirocha, J., & Guitton, G. (1995). Validating national curriculum indicators. Santa Monica, CA: RAND.
Bryk, A., & Raudenbush, S. W. (1988). Toward a more appropriate conceptualization of research on school effects: A three-level hierarchical linear model. American Journal of Education, 65-107.
Bryk, A. S., & Raudenbush, S. W. (1992). Hierarchi- cal linear models: Applications and data analysis methods. Newbury Park, CA: Sage.
Carey, N., & Frechtling, J. (1997). Best practice in ac- tion: Follow-up survey on teacher enhancement pro- grams. Arlington, VA: National Science Foundation.
Cohen, D. K. (1990). A revolution in one classroom: The case of Mrs. Oublier. Educational Evaluation and Policy Analysis, 12(3), 311-329.
Cohen, D. K., & Hill, H. C. (2000). Instructional policy and classroom performance: The mathematics re- form in California. Teachers College Record, 102(2), 294-343.
This content downloaded on Thu, 20 Dec 2012 12:57:08 PMAll use subject to JSTOR Terms and Conditions
Effects of Professional Development on Teachers' Instruction
Cohen, D. K., & Hill, H. C. (2001). Learning policy: When state education reform works. New Haven, CT: Yale University Press.
Cognition and Technology Group at Vanderbilt Uni- versity. (1994). Multimedia environments for devel-
oping literacy in at-risk students. In B. Means (Ed.), Technology and education reform (pp. 23-56). San Francisco, CA: Jossey-Bass.
Council of Chief State School Officers (2000). Using data on enacted curriculum in mathematics and sci- ence. Washington, DC: Author.
Darling-Hammond, L. (1997b). The right to learn: A blueprintfor creating schools that work. San Fran- cisco, CA: Jossey-Bass.
Elmore, R. F., & Burney, D. (1999). Investing in teacher learning: Staff development and instruc- tional improvement. In L. Darling-Hammond and G. Sykes (Eds.), Teaching as the learning profes- sion: Handbook of policy and practice. San Fran- cisco: Jossey Bass.
Elmore, R. F., & Burney, D. (1996, March). Staff de- velopment and instructional improvement: Commu- nity District 2, New York City. Philadelphia: Consor- tium for Policy Research in Education.
Fennema, E., Carpenter, T. P., Franke, M. L., Levi, L., Jacobs, V. R., & Empson, S. B. (1996). A longitu- dinal study of learning to use children's thinking in mathematics instruction. Journal for Research in Mathematics Education, 27(4), 403-434.
Gamoran, A., Porter, A. C., Smithson, J., & White, P. A. (1997). Upgrading high school mathematics instruction: Improving learning opportunities for low-achieving, low-income youth. Educational Eval- uation and Policy Analysis, 19(4), 325-338.
Garet, M., Porter, A., Desimone, L. Birman, B., & Yoon, K. (2001). What makes professional devel- opment effective? Analysis of a national sample of teachers. American Education Research Jour- nal, 38(4), 915-945.
Garet, M., Birman, B., Porter, A., Desimone, L., & Herman, R. with Yoon, K. S. (1999). Designing effective professional development: Lessons from the Eisenhower Program. Washington, DC: U.S. Department of Education.
Guskey, T. R. (1997). Research needs to link profes- sional development and student learning. Available: http://www.nsdc.org/library/jsd/jsdgusk.html.
Hiebert, J. (1999). Relationships between research and the NCTM standards. JournalforResearch in Math- ematics Education, 30(1), 3-19.
Kennedy, M. M. (1998). Form and substance in in- service teacher education (Research monograph no. 13). Arlington, VA: National Science Foundation.
Koretz, D., Stecher, B., Klein, S., & McCaffrey, D. (1994). The Vermont portfolio assessment pro- gram: Findings and implications. Issues and Prac- tice, 13(3), 5-16.
Little, J. W. (1993). Teachers' professional develop- ment in a climate of educational reform. Educational Evaluation and Policy Analysis, 15(2), 129-151.
Loucks-Horsley, S., Hewson, P. W., Love, N., & Stiles, K. E. (1998). Designing professional devel-
opment for teachers of science and mathematics. Thousand Oaks, CA: Corwin
Ma, L. (1999). Knowing and teaching elementary math- ematics: Teachers' understanding of fundamental mathematics in China and the United States. Mah- wah, NJ: Lawrence Erlbaum.
Mayer, D. P. (1999). Measuring instructional practice: Can policymakers trust survey data? Educational Evaluation and Policy Analysis, 21(1), 29-45.
Means, B. (Ed.). (1994). Technology and education
reform. San Francisco, CA: Jossey-Bass. Means, B., Blando, J., Olson, K., Middleton, T.,
Morocco, C. C., Remz, A. R., & Zorfas, J. (1993). Using technology to support education reform. Washington, DC: U.S. Department of Education, Office of Educational Research and Improvement.
Means, B., & Olson, K. (1995). Technology's role in education reform: Findingsfrom a national study of innovating schools. Washington, DC: U.S. Depart- ment of Education, Office of Educational Research and Improvement.
Mitchell, K. J. (1996). Reforming and conforming: NASDC principals discuss school accountability systems. Santa Monica, CA: RAND.
Mullens, J. (1998). Validating teacher responses on instructional practice self-report surveys: Findings from a recentfield-test. Prepared for the Association for Public Policy Analysis and Management Re- search Conference, New York.
Mullens, J. E., & Gayler, K. (1999). Measuring class- room instructional processes: Using surveys and case study field test results to improve item con- struction. Washington, D.C.: U.S. Department of Education, Office of Educational Research and
Improvement. National Commission on Excellence in Education.
(1983). A nation at risk. Washington, DC: Govern- ment Printing Office.
National Commission on Teaching & America's Future. (1996, September). What matters most: Teaching for America'sfuture. New York: Author.
National Council of Teachers of Mathematics. (1998). Principles and standards for school mathematics: Discussion draft. Reston, VA: Author.
National Research Council. (1996). National science education standards. Washington, DC: National Academy Press.
Newmann, F., & Associates. (1996). Authentic achieve- ment: Restructuring schools for intellectual quality. San Francisco, CA: Jossey-Bass.
Porter, A. C. (1998). Curriculum reform and measur- ing what is taught: Measuring the quality of educa-
111
This content downloaded on Thu, 20 Dec 2012 12:57:08 PMAll use subject to JSTOR Terms and Conditions
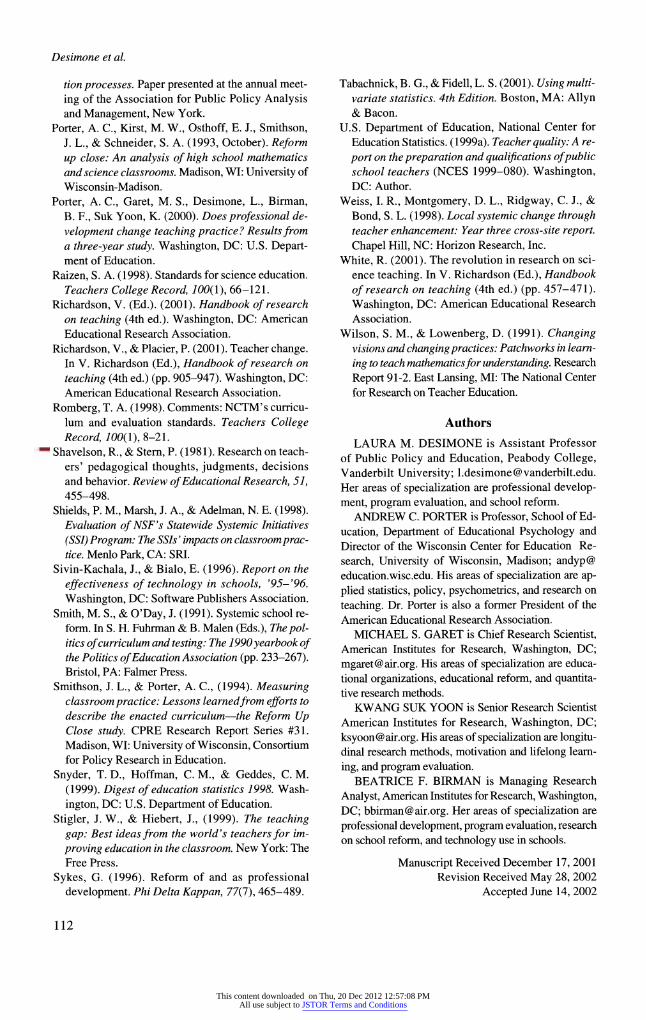
Desimone et al.
tion processes. Paper presented at the annual meet-
ing of the Association for Public Policy Analysis and Management, New York.
Porter, A. C., Kirst, M. W., Osthoff, E. J., Smithson, J. L., & Schneider, S. A. (1993, October). Reform up close: An analysis of high school mathematics and science classrooms. Madison, WI: University of Wisconsin-Madison.
Porter, A. C., Garet, M. S., Desimone, L., Birman, B. F., Suk Yoon, K. (2000). Does professional de-
velopment change teaching practice? Results from a three-year study. Washington, DC: U.S. Depart- ment of Education.
Raizen, S. A. (1998). Standards for science education. Teachers College Record, 100(1), 66-121.
Richardson, V. (Ed.). (2001). Handbook of research on teaching (4th ed.). Washington, DC: American Educational Research Association.
Richardson, V., & Placier, P. (2001). Teacher change. In V. Richardson (Ed.), Handbook of research on teaching (4th ed.) (pp. 905-947). Washington, DC: American Educational Research Association.
Romberg, T. A. (1998). Comments: NCTM's curricu- lum and evaluation standards. Teachers College Record, 100(1), 8-21.
Shavelson, R., & Stem, P. (1981). Research on teach- ers' pedagogical thoughts, judgments, decisions and behavior. Review of Educational Research, 51, 455-498.
Shields, P. M., Marsh, J. A., & Adelman, N. E. (1998). Evaluation of NSF's Statewide Systemic Initiatives (SSI) Program: The SSIs' impacts on classroom prac- tice. Menlo Park, CA: SRI.
Sivin-Kachala, J., & Bialo, E. (1996). Report on the effectiveness of technology in schools, '95-'96.
Washington, DC: Software Publishers Association. Smith, M. S., & O'Day, J. (1991). Systemic school re-
form. In S. H. Fuhrman & B. Malen (Eds.), The pol- itics of curriculum and testing: The 1990 yearbook of the Politics of Education Association (pp. 233-267). Bristol, PA: Falmer Press.
Smithson, J. L., & Porter, A. C., (1994). Measuring classroom practice: Lessons learnedfrom efforts to describe the enacted curriculum-the Reform Up Close study. CPRE Research Report Series #31. Madison, WI: University of Wisconsin, Consortium for Policy Research in Education.
Snyder, T. D., Hoffman, C. M., & Geddes, C. M. (1999). Digest of education statistics 1998. Wash-
ington, DC: U.S. Department of Education. Stigler, J. W., & Hiebert, J., (1999). The teaching
gap: Best ideas from the world's teachersfor im- proving education in the classroom. New York: The Free Press.
Sykes, G. (1996). Reform of and as professional development. Phi Delta Kappan, 77(7), 465-489.
Tabachnick, B. G., & Fidell, L. S. (2001). Using multi- variate statistics. 4th Edition. Boston, MA: Allyn & Bacon.
U.S. Department of Education, National Center for Education Statistics. (1999a). Teacher quality: A re-
port on the preparation and qualifications ofpublic school teachers (NCES 1999-080). Washington, DC: Author.
Weiss, I. R., Montgomery, D. L., Ridgway, C. J., & Bond, S. L. (1998). Local systemic change through teacher enhancement: Year three cross-site report. Chapel Hill, NC: Horizon Research, Inc.
White, R. (2001). The revolution in research on sci- ence teaching. In V. Richardson (Ed.), Handbook
of research on teaching (4th ed.) (pp. 457-471). Washington, DC: American Educational Research Association.
Wilson, S. M., & Lowenberg, D. (1991). Changing visions and changing practices: Patchworks in learn-
ing to teach mathematicsfor understanding. Research
Report 91-2. East Lansing, MI: The National Center for Research on Teacher Education.
Authors
LAURA M. DESIMONE is Assistant Professor of Public Policy and Education, Peabody College, Vanderbilt University; [email protected]. Her areas of specialization are professional develop- ment, program evaluation, and school reform.
ANDREW C. PORTER is Professor, School of Ed- ucation, Department of Educational Psychology and Director of the Wisconsin Center for Education Re- search, University of Wisconsin, Madison; andyp@ education.wisc.edu. His areas of specialization are ap- plied statistics, policy, psychometrics, and research on
teaching. Dr. Porter is also a former President of the American Educational Research Association.
MICHAEL S. GARET is Chief Research Scientist, American Institutes for Research, Washington, DC; [email protected]. His areas of specialization are educa- tional organizations, educational reform, and quantita- tive research methods.
KWANG SUK YOON is Senior Research Scientist American Institutes for Research, Washington, DC; [email protected]. His areas of specialization are longitu- dinal research methods, motivation and lifelong learn-
ing, and program evaluation. BEATRICE F. BIRMAN is Managing Research
Analyst, American Institutes for Research, Washington, DC; [email protected]. Her areas of specialization are
professional development, program evaluation, research on school reform, and technology use in schools.
Manuscript Received December 17, 2001 Revision Received May 28, 2002
Accepted June 14, 2002
112
This content downloaded on Thu, 20 Dec 2012 12:57:08 PMAll use subject to JSTOR Terms and Conditions