Embed Size (px)
Citation preview
Effects of Plastic Pre-Straining Level on the Creep Deformation,
Crack Initiation and Growth Behaviour of 316H Stainless Steel
Ali Mehmanparast a*, Catrin M. Davies
b, David W. Dean
c, Kamran Nikbin
b
aOffshore Renewable Energy Centre, Cranfield University, Cranfield, Bedfordshire MK43 0AL, UK
bDepartment of Mechanical Engineering, Imperial College London, South Kensington Campus, London, SW7 2AZ, UK
cEDF Energy, Barnett Way, Barnwood, Gloucester, GL4 3RS, UK
*Corresponding author email address: [email protected]
Abstract
The effects of the material pre-straining level, in the form of plastic pre-compression at room temperature, on the tensile,
creep deformation, creep crack initiation and growth behaviour of 316H stainless steel have been examined at 550 °C.
Experiments have been performed on the 4%, 8% and 12% pre-compressed specimens and the results are compared with
existing data on the pre-compressed material to investigate the change in mechanical response, creep failure, creep crack
initiation and growth behaviour of 316H over a range of plastic pre-straining levels. Comparisons are also made to short
term and long term test data on the as-received material. It has been found that creep ductility and rupture times decreased
with an increase in pre-strain levels considered. The test results obtained from different material states are discussed in
terms of the influence of material pre-straining level on the microstructural deformation, mechanical response, creep
deformation and crack growth behaviour of the material.
Keywords: Pre-straining level, Pre-compression, CCG, Creep ductility, Long term creep, 316H
Nomenclature
a Crack length
a0 Initial crack length
a (or da/dt) Creep crack growth rate
a Increment of crack growth
A Creep stress coefficient in minimum creep strain law
AA Creep stress coefficient in average creep strain law
B Specimen thickness
Bn Net specimen thickness between the side grooves
Br Coefficient of rupture law
C* Steady state creep fracture mechanics parameter
D Constant coefficient in creep crack growth correlation with C*
E Elastic (Young’s) modulus
E Effective Young’s modulus
2
K Stress intensity factor
n Creep stress exponent in minimum creep strain law
nA Creep stress exponent in average creep strain law
P Applied load
t0.2 Time for 0.2 mm crack extension
t0.5 Time for 0.5 mm crack extension
tf Creep crack growth test duration
ti Initiation time engredt Engineering redistribution time
tr Time to rupture in a uniaxial creep test
tT Transition time from small scale creep to widespread creep conditions
W Specimen width
η Geometry function in C* relation
εf Uniaxial creep strain at failure (creep ductility)
s Steady state creep strain rate
A Average creep strain rate
vr Creep rupture stress exponent
Exponent in correlation of creep crack growth rate with C*
Δ Load line displacement
Δc Creep load line displacement
Δe Elastic load line displacement
Load line displacement rate
c Component of displacement rate directly associated with the accumulation of creep strains
i Component of displacement rate directly associated with instantaneous (elastic and plastic)
strains
ie Component of displacement rate directly associated with instantaneous elastic strains
T Total load line displacement rate
σ Stress
σ0.2 0.2% proof stress
σref Reference stress
AR As-received material
CCG Creep crack growth
CCI Creep crack initiation
LLD Load line displacement
PC Pre-compressed material
3
SS Stainless steel
UTS Ultimate tensile strength
1. Introduction
The influence of plastic pre-strain on the deformation and creep behaviour of 316H stainless steel has been
the focus of many studies in recent years (see [1-5]). Understanding the effects of plastic pre-strain on the
behaviour of structural components is essential for structural integrity assessments as some degree of plastic
strain is introduced into components by most manufacturing processes including forging and welding (see e.g.
[1, 2]).
As discussed in [1] power plant components are often manufactured by forming (plastic pre-straining) of
stainless steel tubes which are subsequently welded into the required shapes. The extent of prior plastic strains
introduced into the material can significantly change the mechanical properties and consequently affect the
residual stresses after welding [1]. The material pre-straining effects on subsequent mechanical and fracture
behaviour of engineering alloys have previously been investigated by other researchers [3, 6-11]. A study of
the creep behaviour in polycrystalline copper samples pre-strained to different amounts at room temperature
and high temperature in [6] has shown that the creep ductility in this material had reduced due to pre-
straining; however, the creep strain rate and rupture life increased or decreased depending on the testing
conditions. A similar study on Nimonic 80A pre-tensioned to different plastic strain levels of up to 15% at
room temperature has shown that the creep ductility decreases by increasing the material pre-straining amount
[7]. It has been shown in [8] that small pre-straining of AISI 304 stainless steel at high temperature improves
the creep strength of the material. The creep tests on ex-service 316 material subjected to room temperature
pre-straining up to 39% in [9] showed that by increasing the percentage of pre-strain, the rupture life,
minimum creep strain rate and creep ductility reduce significantly. A review of the previous studies on
various engineering alloys show that the creep ductility of the examined materials always continuously
decreased by increasing the amount of plastic pre-straining at room temperature.
The material examined is this study is Type 316H stainless steel (SS) which is widely used in the
advanced gas cooled reactor (AGR) plant components which often operate at temperatures of around 550 °C.
It has been shown in [12] that material pre-strain on Type 316H may change the average grain size; however,
no change in grain size was observed in [13] where the material was uniformly pre-compressed (PC) to 8%
plastic strain at room temperature. Significant work has been done recently to investigate the mechanical and
creep deformation and crack growth behaviour of 316H SS material pre-compressed to 8% plastic strain at
room temperature [5]. It has been shown in [5] that material pre-compression to 8% plastic strain increases the
yield stress (thus the hardness) of 316H SS, reduces the creep ductility and rupture time in uniaxial creep
tests, and increases the creep crack growth (CCG) rates by around an order of magnitude when compared to
the results obtained from the as-received (AR) material. Preliminary results on both 4% and 8% PC 316H at
550 °C suggest that the creep ductility reduces as the level of plastic strain increases [5, 14, 15]; however, in
order to quantify this effect further tests were required at a range of plastic strain levels.
In this work additional tensile, uniaxial creep and CCG tests have been performed on specimens uniformly
pre-compressed to 4%, 8% and 12% plastic strain at room temperature. The new test results from specimens
with different extents of pre-strain are compared with the existing data on the PC material to investigate the
change in mechanical response, creep failure, creep crack initiation (CCI) and growth behaviour of 316H over
this range of plastic pre-straining levels.
4
2. Material Pre-Straining and Specimen Design
The material utilised in this study is ex-service Type 316H stainless steel extracted from a steam header
provided by EDF Energy. Blocks of material were uniformly pre-compressed to 4%, 8% and 12% plastic true
strain at room temperature and a number of uniaxial round bar specimens or a single compact tension, C(T),
sample were extracted from each pre-strained block. The round bar samples used for tensile and uniaxial
creep rupture tests had the same dimensions of 8 mm diameter and 36 mm gauge length. All C(T) specimens
had the same width of W = 50 mm and the total thickness of B = 25 mm. The starter crack in C(T) specimens
was introduced by an EDM (Electrical Discharge Machining) pre-crack of notch root radius 0.125 mm. All
specimens were extracted from the same header, denoted Header A. Previous tests, to which these results will
be compared, have however been extracted from three different headers of similar composition.
3. Creep Deformation, Crack Initiation and Growth Relations
3.1. Uniaxial Creep Deformation and Rupture
For power law, creeping materials under steady state conditions, the minimum creep strain rate, s , may
be correlated with the equivalent stress, , by the Norton creep law [16] using the relation n
s A (1)
where n and A are the power law creep stress exponent and coefficient, respectively. Similarly, at a given
temperature the rupture time may be described by the power law relationship
rvr rt B (2)
where Br and vr are the rupture life power law stress coefficient and exponent, respectively. In order to
account for the deformation in different creep regions, the average creep strain rate, A , is often employed
which is defined as
/fA rt (3)
where εf is the creep ductility and tr is the rupture time. Similar to Eqn (1), the stress dependency of the
average creep strain rate may be described by the power law relationship
AnA AA (4)
where AA and nA are the power law stress coefficient and exponent, respectively. Combining Eqns (2)–(4), the
stress dependency of the creep ductility (i.e. creep strain at failure) for a given temperature can be expressed
as
A rn vf A rA B (5)
It can be deduced from Eqn (5) that for a given temperature and stress range, the creep ductility is stress
independent when nA = vr.
3.2. Creep Crack Growth Relations
When a steady state of creep deformation and damage has developed ahead of a crack tip, the CCG rate,
a (or da/dt), may be described by the steady state creep fracture mechanics parameter C* using
*a DC (6)
5
where D and are material constants [17]. As explained in [17] under steady state creep conditions a vs. C*
data appear as a straight line on log-log axes. However, before the steady state conditions are achieved, data
points will appear as a ‘tail’ on the a vs. C* plot.
The C* fracture mechanics parameter in CCG tests may be evaluated experimentally using the load line
displacement (LLD) rate measurements, , by the relation [18]
*
-n
PC H
B W a
(7)
where P is the applied load, Bn is the net specimen thickness between the side grooves, a is the instantaneous
crack length and W is the specimen width. H and η in Eqn (7) are geometry dependent constants. For a
standard C(T) specimen with 0.45 ≤ a/W ≤ 0.7, H = 1n n and η = 2.2 [18]. The solutions of η factor for
C(T) specimens with 0.35 ≤ a/W < 0.45 are provided using finite element (FE) simulations and given in [5].
3.3. Load Line Displacement Measurements
The total LLD rate, T , in a CCG test can be partitioned into an instantaneous part, i , and a
time-dependent creep part, c , such that T c i (8)
The instantaneous displacement rate, i , can be further divided into an elastic and a plastic part, with the
elastic part of the instantaneous LLD rate, ie , calculated by
22i ne
aB K
P E
(9)
where K is the stress intensity factor and E is the effective elastic modulus (E/(1 - v2) for plane strain and E
for plane stress conditions). Relations for approximation of the instantaneous plastic displacement rate are
given in [19]. However, in the CCG data analysis of the pre-strained 316H SS the contribution of plasticity in
the LLD measurements may be considered negligible due to the large yield stress in materials pre-compressed
to different extents of plastic strain [5], thus this term is neglected in LLD calculations. Note that according to
the ASTM E1457 standard, the displacement rate used in the evaluation of the C* parameter (see Eqn (7)) is
often taken to be the total LLD rate T [19].
3.4. C* Validity Criteria
The validity criteria for the use of the C* fracture mechanics parameter in CCI and growth data analysis
are specified in [19]. These are that (i) the transition time, tT, from an elastic crack tip field to a C* controlled
creep crack tip field must be exceeded, where the transition time can be calculated using [19]
2
max1 *
T
Kt
E n C
(10)
(ii) data points obtained prior to a crack extension, Δa, of 0.2 mm must be excluded (iii) to exclude the data
points with the LLD, ΔLLD
, greater than 0.05W (iv) the creep LLD rate must constitute at least half of the total
LLD rate i.e. /c T ≥ 0.5. When the latter criterion is satisfied the material is referred to as “creep ductile”
and the CCG rate can be described using the C* fracture mechanics parameter.
Additional validity criteria are also proposed in the R5 procedure [20] and in [21] which suggest that the
non-dimensional crack velocity, , must be less than 0.5 and the engineering redistribution time, engredt , must be
6
exceeded in order to use C* as a valid parameter to characterise the CCG behaviour of a material. It has been
discussed in [21] that the engineering redistribution time, compared to the transition time estimated using Eqn
(10), is a more accurate criterion to check widespread creep conditions in CCG tests on 316H stainless steel.
The and engredt for these additional validity criteria can be calculated using
2( )
*
ref
exp
a
EC
(11)
( )0.208
( )
engc red
enge red
t
t
(12)
where σref is the reference stress (the solutions of which are given in [22] for a range of specimen geometries),
Δc is the creep LLD and Δe is the elastic LLD measurement.
3.5. Creep Crack Initiation Relation
The CCI time, ti, is often referred to the amount of time for creep strain/damage to build up ahead of the
crack tip prior to crack extension from a pre-existing defect. The initiation time in CCG tests is conventionally
reported for 0.2 or 0.5 mm of crack extension, Δa, and denoted as t0.2 and t0.5, respectively [19]. It has been
shown and discussed in [5] that in the CCG tests on PC 316H material, the calculated engineering
redistribution time is close to or shorter than the initiation time. Therefore, assuming that the CCI time in all
tests on PC material is greater than the redistribution time, an approximate value of CCI time may be obtained
using
*i
a at
a DC
(13)
4. Pre-compression Effects on Tensile Behaviour
Tensile tests have been performed on the AR, 4% PC, 8% PC and 12% PC materials at room temperature
and 550 °C and the results are shown in Figure 1(a) and (b), respectively. From here on, all test data obtained
from AR, 4%, 8% and 12% PC material are shown in red, purple, blue and green symbols, respectively. The
tensile properties obtained from the tests on different material states are summarised in Table 1. As seen in
Figure 1(a), (b) and Table 1, at both room temperature and 550 °C similar values of the Young’s modulus, E,
and the ultimate tensile strength (UTS) have been found for the AR specimen and the materials pre-
compressed to different extents of plastic strain. As shown in Table 1, the room temperature values of 0.2%
proof stress, σ0.2, increase with the percentage of pre-compression, though these values fall below that
obtained from the AR material. This is thought to be due to a significant contribution of kinematic hardening
and early yielding on reverse loading for this material which generally exhibits combined isotropic-kinematic
hardening behaviour. Also seen in Table 1, Figure 1(a) and (b), is that the values of 0.5% proof stress, σ0.5, at
room temperature and also σ0.2 and σ0.5 at 550 °C progressively increase with increasing the percentage of pre-
compression from 0% (AR material) to 12% plastic pre-strain, thus generally material hardening increases
with the level of pre-compression, as expected. There is a clear reduction in tensile ductility for the 12% PC
sample at both room temperature and 550 °C. Similar tensile ductilities are, however, found for the 4% PC,
8% PC and AR sample at room temperature. A general reduction in tensile ductility with an increase in the
percentage of pre-compression is seen at 550 °C.
7
5. Pre-compression Effects on Creep Deformation and Rupture Behaviour
Uniaxial creep rupture tests have been performed on six 12% PC specimens (denoted 12PC) and a 4% PC
sample (denoted 4PC). In addition, nine relatively high stress uniaxial creep tests have been performed on 8%
PC material (denoted 8PC). All tests were performed at 550 °C and a summary of the loading conditions and
test results are given in Table 2. As seen in this table, all the applied stresses on the 12% PC samples are
below the yield stress of this material state at 550 °C, thus zero or negligible plasticity was observed during
the loading of these tests. As a result, the calculated true stress, σtrue, values have been found close to the
nominal stresses σnom. The existing uniaxial creep data on the AR and 8% PC material taken from [5] and also
the limited data available on the 4% PC material taken from [14] are collated, presented next and compared
with results from the tests performed as part of this study .
5.1. The Influence of Pre-compression Level on Creep Rupture
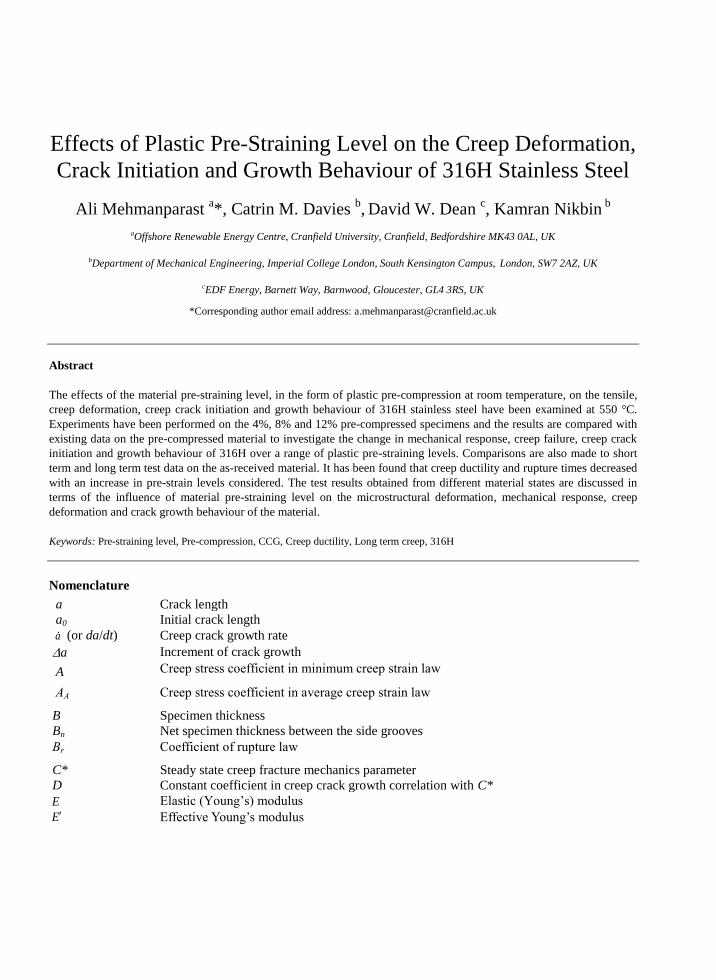
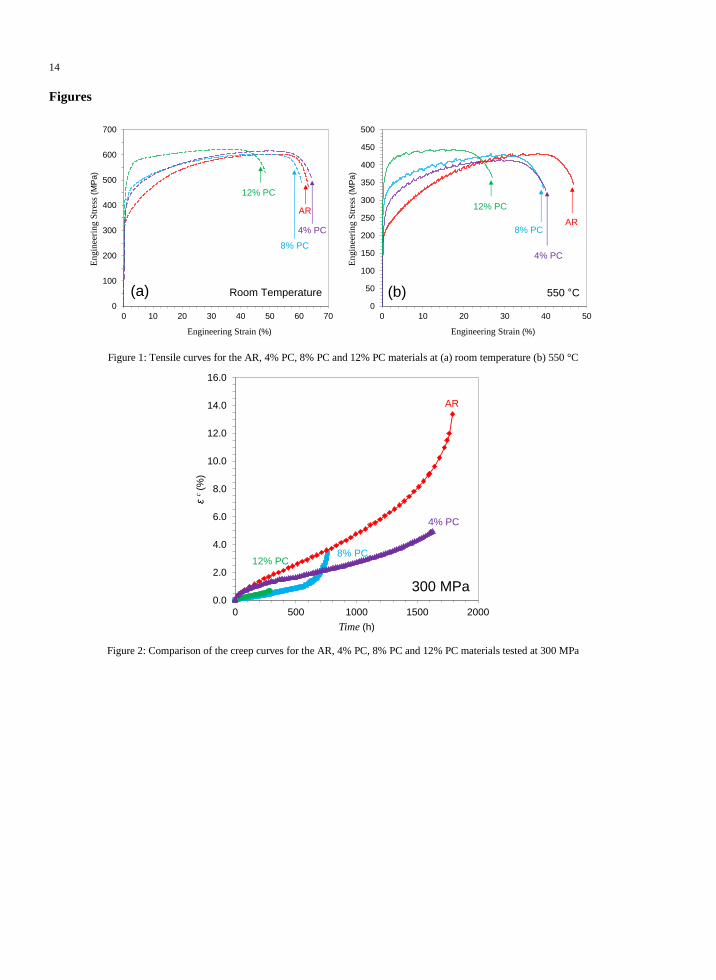
The creep curves for the AR, 4% PC, 8% PC and 12% PC materials tested under 300 MPa at 550 °C are
shown and compared in Figure 2. It can be seen in this figure that for a given applied stress, a continuous
reduction in the rupture time and creep ductility can be observed by increasing the extent of material pre-
straining. Note that significant plastic loading strains were developed at 300 MPa for the AR, 4% PC and 8%
PC materials at 550 °C (see Table 1). However, due to the larger yield stress in 12% PC material, a linear
elastic response was observed during the load up of this specimen. In order to examine the effect of pre-
compression on the creep deformation and rupture behaviour of the material at a given stress and temperature,
the creep ductility and rupture time data obtained from the tests performed on AR, 4% PC , 8% PC and 12%
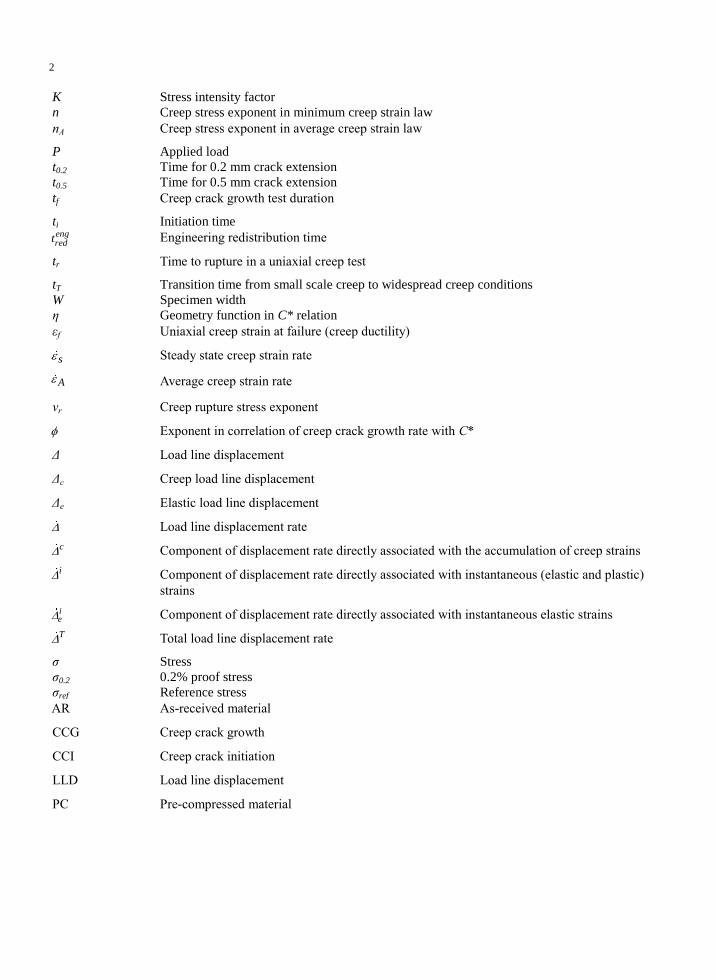
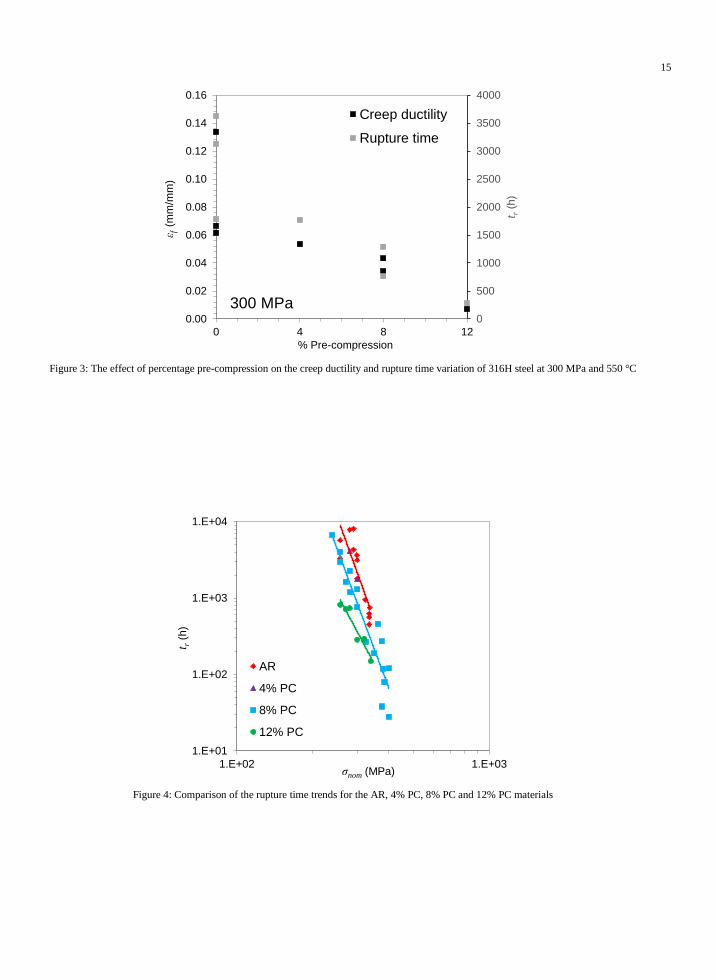
PC specimens at 300 MPa and 550 °C are plotted in Figure 3. As seen in this figure, for the given stress and
temperature, a gradual decrease in both rupture time and creep failure strain can be observed by increasing the
pre-compression level. These trends are consistent with those reported for pre-tensioned 316 in [9] where a
creep ductility plateau of around 1% was observed for specimens pre-strained to percentages beyond
approximately 20%.
The rupture time against applied stress is plotted in Figure 4 for the AR, 4% PC, 8% PC and 12% PC
materials. A power law fit has been made treating all data for a given level of PC as a single data set. The
power law constants determined are given in Table 3. Note that the data points for 4% PC generally fall
between the AR and 8% PC data; however, there are insufficient data points to fit a trend line to the 4% PC
data. As seen in Figure 4, a gradual reduction in rupture time for a given stress can be seen with an increase in
the pre-compression level. Figure 4 and Table 3 show that for a given value of applied stress, the rupture time
is on average around 2.5 and six times lower in the 8% PC and 12% PC materials, respectively, compared to
the AR material.
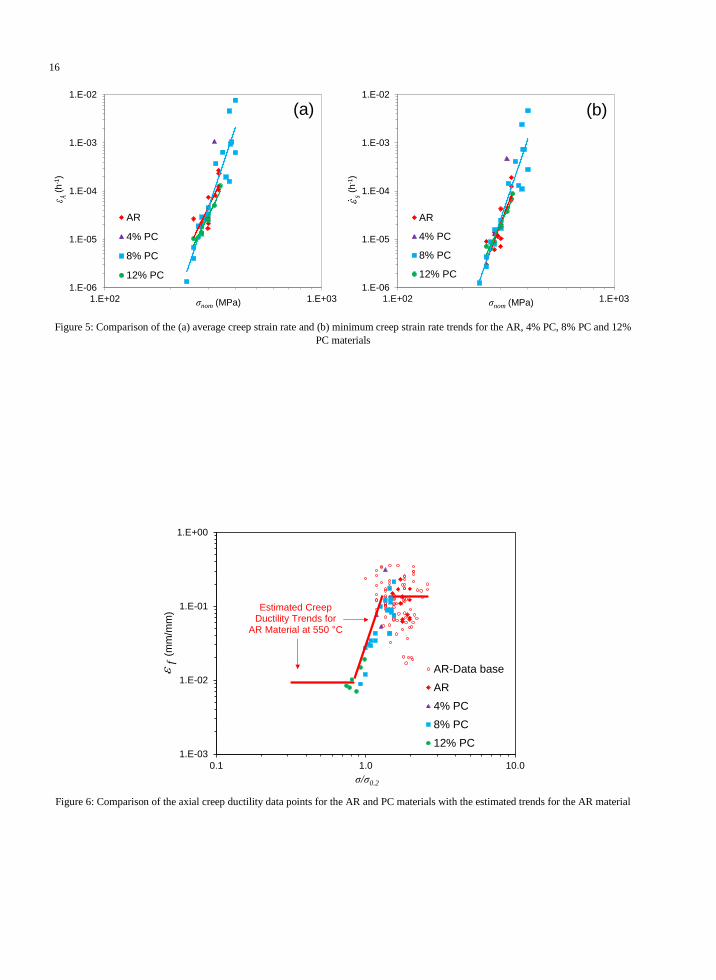
5.2. The Influence of Pre-compression Level on the Creep Strain Rate
The average and minimum creep strain rate data for the AR, 4% PC, 8% PC and 12% PC materials are
plotted against the nominal stress in Figure 5(a) and (b), respectively, and the power law constants are given
in Table 3. As seen in Figure 5 similar average and minimum creep strain rate trends can be generally
observed in the AR and PC materials. This implies that for the range of stresses examined, the average and
minimum creep strain rate trends are relatively insensitive to the material pre-straining level.
8
5.3. The Influence of Pre-compression Levels on Creep Ductility
In Figure 6 the creep ductility has been plotted against the applied stress normalised by the 0.2% proof
stress of the material (taken from Table 1), which signifies the extent of plastic strain generated in the sample
on loading [23]. Also included in this figure are the AR experimental data points from an existing large data
set, and the estimated creep ductility trends, over a wide range of stresses, for the AR material at 550 °C taken
from [23]. As explained in [23], three regions have been identified — the upper shelf and lower shelf creep
ductility regions observed at high and low stress regions, respectively, where the creep ductility is constant,
which are joined by a stress dependent transition region. It can be observed in Figure 6 that the PC creep
ductility data points generally follow the creep ductility trends estimated from the AR material. Note that the
stress dependency of the total inelastic strain at failure (i.e. the sum of the PC strain, plastic strain on loading
and creep strain at failure) was examined; however, no clear trends were generally found. The creep strain at
failure and plastic loading strains were negligible compared to the PC strain in the 12% PC samples thus the
inelastic strain was effectively constant and stress independent. An increase in inelastic strain with stress was
seen for the 8% PC material, but this was due to the increase in creep ductility with stress, as shown in Figure
6.
6. Pre-compression Effects on Creep Crack Initiation and Growth Behaviour
Creep crack growth tests were performed on standard C(T) specimens with the initial normalised crack
length of a0/W = 0.5 made of the 4%, 8% and 12% pre-compressed materials. For reasons explained in [5]
tests were also performed on 8% C(T) specimens with a0/W = 0.35, which have been demonstrated to be valid
through the use of appropriate geometric functions. Note that the geometric solutions given in ASTM E1457
[19] are valid for 0.45 ≤ a/W ≤ 0.7. A summary of specimen dimensions, loading conditions and the CCG test
results is shown in Table 4 in which W is the specimen width, B is the thickness, Bn is the net thickness
between the side grooves, a0 is the initial crack length, K(a0) is the stress intensity factor at initial loading, Δa
is the creep crack extension and tf is the test duration. As seen in Table 4, all specimens had the same width
and total thickness; however, the values of net thickness were different in various specimens.
The reference stress normalised by 0.2% proof stress of the material indicated the level of plasticity in the
sample [17]. A ratio of much less than unity, calculated using the equations given in [24] for a range of
specimen geometries, indicates limited plasticity whereas the ratio of much larger than unity implies
widespread plasticity in a fracture specimen. The normalised reference stress value on loading has been
reported in Table 4 for each of the tests examined. As seen in this table, the σref/σ0.2 ratio was much less than
unity on loading and throughout the test for all CCG tests performed on PC materials, indicating that the
plasticity effects on the CCG behaviour of these PC specimens were negligible. Not shown here for brevity,
linear responses were generally observed during the loading process in CCG tests on PC specimens, which
also confirms that the plasticity effects during load up were limited.
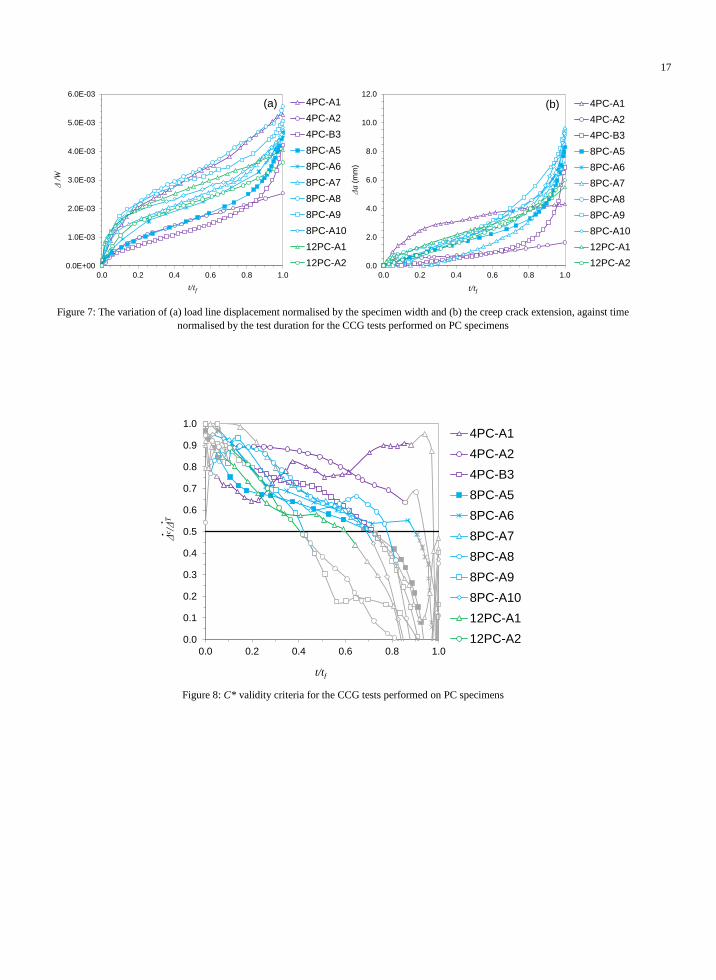
6.1. Crack Growth and Load Line Displacement Variation
The change in the LLD measurements subsequent to load up normalised by the specimen width, Δ/W, and
the CCG, Δa, behaviour of the PC specimens are plotted against time normalised by test duration, tf, and the
results are shown in Figure 7(a) and (b), respectively. Rapid increase in the LLD rate and crack extensions
have been measured towards the end of the majority of the tests examined. Note that the creep crack extension
and LLD trends during the tests are dependent on the point at which the test was stopped, prior to final failure
of the specimen. For this reason, the CCG and LLD rates in the relatively long term (i.e. low load) tests on
9
4PC-A1 and 4PC-A2 specimens, shown in Figure 7(b), are not as large as the other tests examined on PC
materials. Further seen in Figure 7(a) and (b) is that within the experimental data scatter similar LLD and
CCG trends can be observed in 8PC-A7, 8PC-A8, 8PC-A9 and 8PC-A10 specimens which were pre-
compressed to the same percentage of plastic strain (8%), had nominally identical dimensions and were
subjected to the same loading conditions (see Table 4).
6.2. C* Validity Criteria
The validity criteria for the use of the C* creep fracture mechanics parameter specified in Section 3.4 are
examined in Figure 8. In this figure the valid data points are shown in coloured symbols whereas the invalid
data points are shaded in grey. It can be seen in Figure 8 that the /c T ratio in 4% pre-compressed
specimens, 4PC-A1 and 4PC-A2, is greater than 0.5 for the majority of test duration, though /c T of larger
than 0.5 is only observed for almost 50% of the test duration in the 12PC-A1 and 12PC-A2 specimens. This
indicates that the elastic contribution to the LLD rate in the material with 12% plastic strain is more severe
than the 4% PC material. Also seen in Figure 8 is that, for a given value of the normalised time, the /c T
trend for the 8% PC specimens falls upon or in between those seen in 4% and 12% PC materials. These
/c T data are generally less than that for the AR 316H material at 550 °C, which is typically close to unity
[25]. This trend indicates that the elastic contribution in LLD rates generally increases with the percentage
pre-compression in the material.
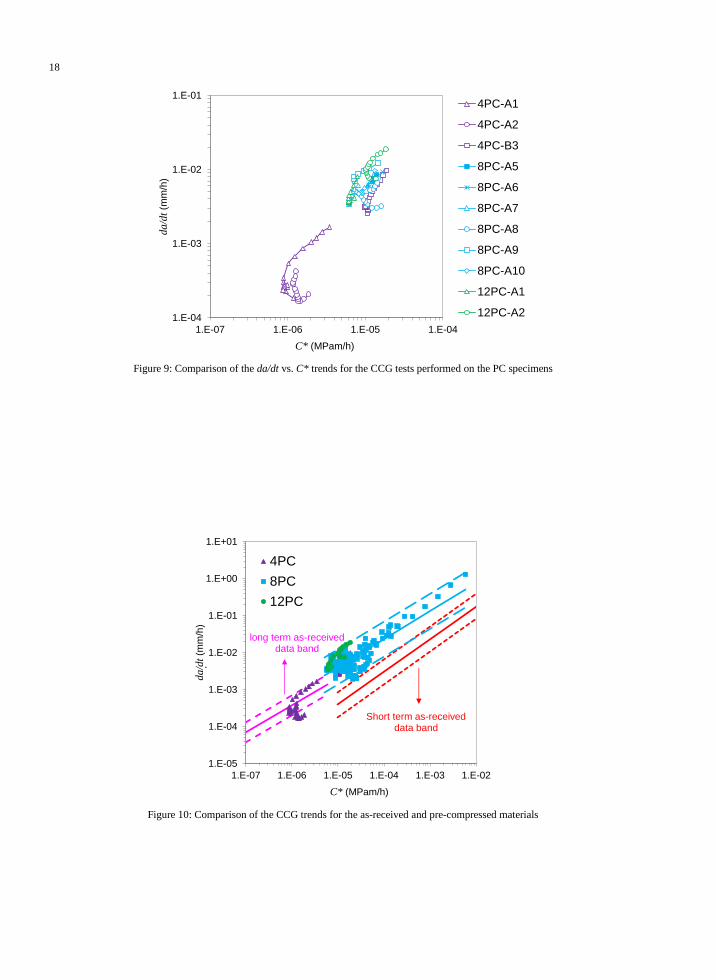
6.3. Correlation of the CCG Data with the C* Fracture Mechanics Parameter
The CCG rate data from the PC specimens are correlated with the C* parameter as shown in Figure 9.
Note that the CCG data previously presented in [15] have been re-analyzed here with updated creep strain rate
data and additional C* validity criteria (see Section 3.4). Although only the data points considered valid
according to the criteria specified in Section 3.4 have been included in Figure 9, some tails are still apparent
in the CCG data. As seen in Figure 9 the CCG results from relatively long term tests on 4% PC specimens,
4PC-A1 and 4PC-A2, fall in the low C* region; however, the CCG trend from these tests is consistent with
the shorter term test on 4PC-B3 specimen. Also seen in Figure 9 is that for the tests examined, the CCG trends
from 4% PC and 12% PC materials fall upon the lower and upper bound fits to the 8% CCG data band,
respectively. The 8% PC (8PC-A5) and 12% PC (12PC-A1 and 12PC-A2) specimens with nominally identical
dimensions and tested under similar loading conditions show that, for a given value of C*, the CCG rate in
12% PC material is around twice as high as that observed in the 8% PC material.
6.4. Comparison of the CCG Trends with the Existing Data on the As-received Material
All the available CCG data from the PC specimen tests are compared in Figure 10. Also included in Figure
10 are the mean (solid line) and upper bound (UB) / lower bound (LB) (dashed lines) trend lines fitted to the
short term (shown in red) and long term (shown in pink) AR data [21] . The mean and UB/LB fits to the 8%
PC data set are also included in this figure. The corresponding power law constants D and (see Eqn (6)) are
given in Table 5. Note that due to the extensive tail regions observed in the CCG data on 4% PC and 12% PC
data, the power law exponents found for these data sets were beyond unity, thus invalid according to the CCG
prediction models [26]; however, the values given in Table 5 have been found by ignoring the tail regions as
recommended in [17]. Due to the limited data available for the 4% PC and 12% PC materials, the UB/LB
factors are not quantified for these two data sets.
It can be seen in Figure 10 that ignoring the tail regions, the CCG data on 4% PC material follow the trend
of the mean fit to the 8% PC material and fall upon the UB fit to the long term tests on the AR material. Also
10
seen in this figure is that the 8% PC data sets are effectively coincident and, for a given value of C*, the CCG
rates are on average around seven times higher than those from short term AR data. Finally seen in Figure 10
is that the CCG data for 12% PC material fall upon or are close to the UB fit to the 8% PC data and the CCG
rate for this material is on average around three times higher than the mean fit to the 8% PC material, for a
given value of C*.
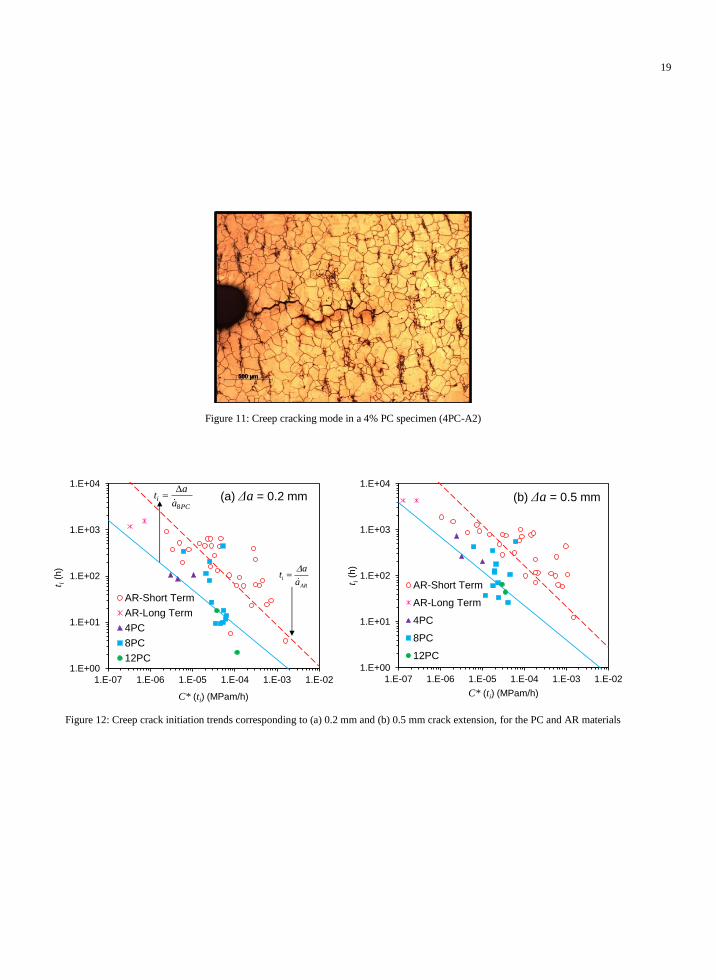
6.5. Creep Cracking Mode in Pre-compressed Specimens
As an example, the creep cracking mode at the mid thickness of a 4% PC C(T) specimen (4PC-A2) is
shown in Figure 11. It can be observed that the cracking mode in this test was, as termed in [21], ‘brittle
inter-granular’, i.e. where the CCI and growth occurs with no clear evidence of grain deformation. This
observation is consistent with the cracking mode seen in the 8% PC CCG test demonstrated in [5] and also the
long term tests on the AR material shown in [21]. Multiple, discontinuous inter-granular micro-cracks,
orientated normal to the loading axis, are observed in Figure 11. However, due to the three-dimensional
nature of the CCG process, the crack is thought to have been continuous along other planes through the
thickness of the specimen, as shown for an 8% PC C(T) sample in [5].
6.6. Comparison of the Creep Crack Initiation Trends in the As-received and Pre-compressed Materials
The validity criteria specified in Section 3.4 for correlating the initiation time with the C* parameter were
applied to the data and it was considered that C* is an appropriate parameter to correlate with the CCI times
corresponding to 0.2 mm (t0.2) and 0.5 mm (t0.5) crack extension. These correlations are shown in Figure 12(a)
for t0.2 and Figure 12(b) for t0.5. Also included in Figure 12 are the experimental CCI trends calculated by
employing the steady state CCG power law constants obtained from the line of best fits to the 8% PC and
short term AR data (see Eqn (13) and Table 5).
Most of the PC data points for all levels of PC shown in Figure 12(a) fall close to the experimental CCI
trend line for the 8% PC material, though a number of 8% PC points fall closer towards the AR trend line.
Similar observations are made in Figure 12(b) for t0.5. The scatter in the data may be attributed to a number of
factors including crack tip plasticity effects causing crack tip blunting and thus reducing crack tip triaxiality
and the general difficulty in measuring small crack extensions. The long term AR CCI data fall between the
short-term AR and 8% PC material trend lines thus the 8% PC material trend line provides a conservative
prediction for the long term CCI behaviour of the AR material.
7. Discussion
Work was performed in [9] where 316 material was pre-tensioned to a range of strains up to 39%. It was
found that for a given applied load the creep ductility initially reduced with percentage pre-strain, but
plateaued to a lower limit of about 1% creep ductility when the pre-strain attained levels of greater than
around 20%. Pre-compression effects are therefore similar to pre-tension for this material as for up to 12%
PC, as shown in Figure 3, the creep ductility reduces with the level of plastic pre-strain. The results in [9] may
also corroborate the inferred trends from [23] shown in Figure 6 since the 12% PC data at σ/σ0.2 < 1 are
around the estimated lower bound limit of 1% for this material; however, further tests are required to confirm
this.
It was shown in Figure 10 that the CCG trends for the 4%, 8% and 12% PC materials are around an order
of magnitude higher than that of short term tests on AR material, for a given value of C*. As discussed in [5],
this is partly due to the loss of crack tip constraint in the short-term AR test which has a relatively low yield
11
strength and thus high levels of crack tip plasticity. In addition, PC reduces the creep ductility of the material,
hence CCG rates are increased. The CCG rate is also influenced by the creep strain rate properties of the
material, but this effect may be considered small compared to the creep ductility and specimen constraint
effects.
Observed in Figure 6 and Figure 10 is that the lowest ductilities (for a given applied stress) and the highest
CCG rates were observed in the experiments performed on the 12% PC material. Also seen in Figure 10 is
that the CCG tests on 12% PC material provide CCG rates of around three times higher than the UB fit to the
long term data on the AR material, whereas the data from 4% and 8% PC specimens fall upon the UB fit to
the long term AR data. This suggests that a more conservative prediction of the CCG behaviour in long term
tests on AR material may be provided, in much shorter time scales, by performing tests on specimens
subjected to relatively large amounts of plastic pre-strain. It must be noted that the majority of the CCG tests
presented in this work lasted for around 1000 hours or less. Therefore, longer term tests under relatively lower
load levels need to be performed in future work to investigate the test duration effects on the longer term CCG
response of the PC material.
Increasing the percentage of pre-compression, to for instance 12% plastic pre-strain in an ex-service
material, may lead to an increase in intergranular cavity density and not necessarily cavity growth rate [7]. In
other words when the percentage pre-compression increases in a given polycrystalline material (and hence the
yield stress increases) the creep deformation within the grains becomes progressively less important and the
creep rupture behaviour strongly depends on the intergranular failure due to the increased number of cavities
along the grain boundaries [27]. The increase in intergranular cavity density with an increase in amount of
plastic pre-compression leads to lower uniaxial creep ductilities and thus higher CCG rates as observed in the
experimental data for the 12% PC material.
8. Conclusions
The effects of percentage plastic pre-strain on the tensile, uniaxial creep deformation, CCI and growth
behaviour of 316H stainless steel at 550 °C have been examined. The yield stress was found to increase by
increasing the amount of plastic pre-straining. Under a given applied load, the rupture time and creep ductility
were found to decrease by increasing the percentage of material pre-straining, though the average and
minimum creep strain rates were found to be relatively insensitive to material pre-compression. The creep
ductility of the 4%, 8% and 12% PC materials were found to follow the creep ductility against normalised
stress (applied stress normalised by the 0.2% proof stress) trend at 550 °C estimated in previous work from
AR data. Similar CCG behaviour was observed in the 4% PC and 8% PC materials and the data followed the
trend of the upper bound fit to the long term data on the AR material. 12% PC data provide a conservative
estimate of the long term CCG behaviour in the AR material, in much shorter time scales. Less conservative
predictions may be made by performing tests on 4% and 8% PC materials. The CCI data from the PC
materials fall close to the experimental trend calculated for the 8% PC material, when the data are correlated
with the C* fracture mechanics parameter, and provide a conservative prediction of the CCI behaviour in long
term tests on the AR material.
Tables
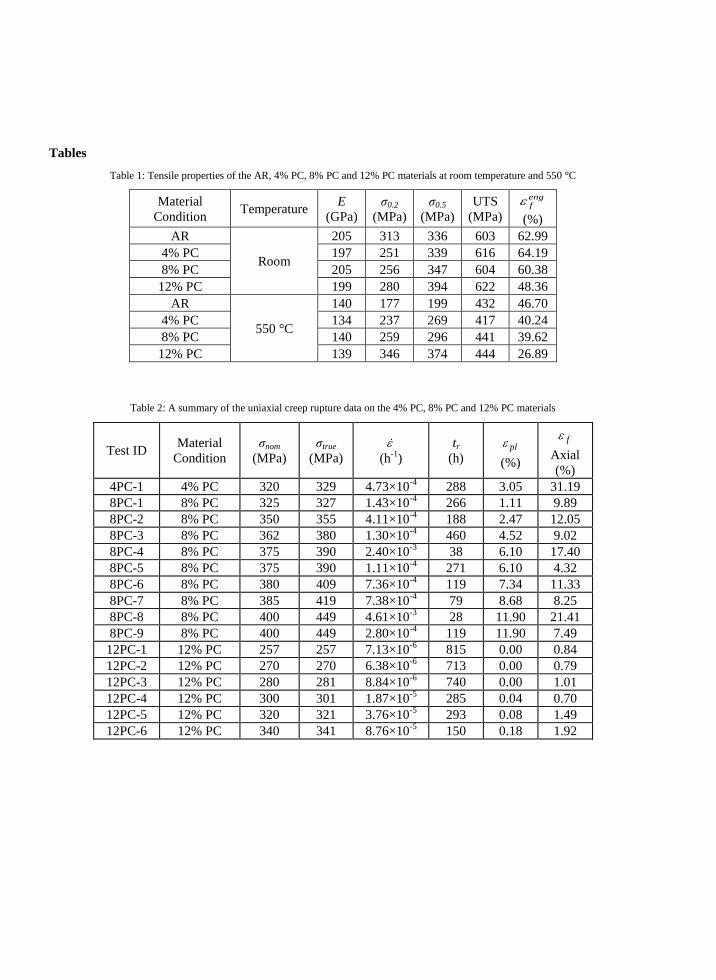
Table 1: Tensile properties of the AR, 4% PC, 8% PC and 12% PC materials at room temperature and 550 °C
Material
Condition Temperature
E
(GPa)
σ0.2
(MPa)
σ0.5
(MPa)
UTS
(MPa)
engf
(%)
AR
Room
205 313 336 603 62.99
4% PC 197 251 339 616 64.19
8% PC 205 256 347 604 60.38
12% PC 199 280 394 622 48.36
AR
550 °C
140 177 199 432 46.70
4% PC 134 237 269 417 40.24
8% PC 140 259 296 441 39.62
12% PC 139 346 374 444 26.89
Table 2: A summary of the uniaxial creep rupture data on the 4% PC, 8% PC and 12% PC materials
Test ID Material
Condition
σnom
(MPa)
σtrue
(MPa)
(h-1
)
tr
(h) pl
(%)
f
Axial
(%)
4PC-1 4% PC 320 329 4.73×10⁻⁴
288 3.05 31.19
8PC-1 8% PC 325 327 1.43×10⁻⁴
266 1.11 9.89
8PC-2 8% PC 350 355 4.11×10⁻⁴
188 2.47 12.05
8PC-3 8% PC 362 380 1.30×10⁻⁴
460 4.52 9.02
8PC-4 8% PC 375 390 2.40×10⁻³
38 6.10 17.40
8PC-5 8% PC 375 390 1.11×10⁻⁴
271 6.10 4.32
8PC-6 8% PC 380 409 7.36×10⁻⁴
119 7.34 11.33
8PC-7 8% PC 385 419 7.38×10⁻⁴
79 8.68 8.25
8PC-8 8% PC 400 449 4.61×10⁻³
28 11.90 21.41
8PC-9 8% PC 400 449 2.80×10⁻⁴
119 11.90 7.49
12PC-1 12% PC 257 257 7.13×10⁻⁶
815 0.00 0.84
12PC-2 12% PC 270 270 6.38×10⁻⁶
713 0.00 0.79
12PC-3 12% PC 280 281 8.84×10⁻⁶
740 0.00 1.01
12PC-4 12% PC 300 301 1.87×10⁻⁵
285 0.04 0.70
12PC-5 12% PC 320 321 3.76×10⁻⁵
293 0.08 1.49
12PC-6 12% PC 340 341 8.76×10⁻⁵
150 0.18 1.92
13
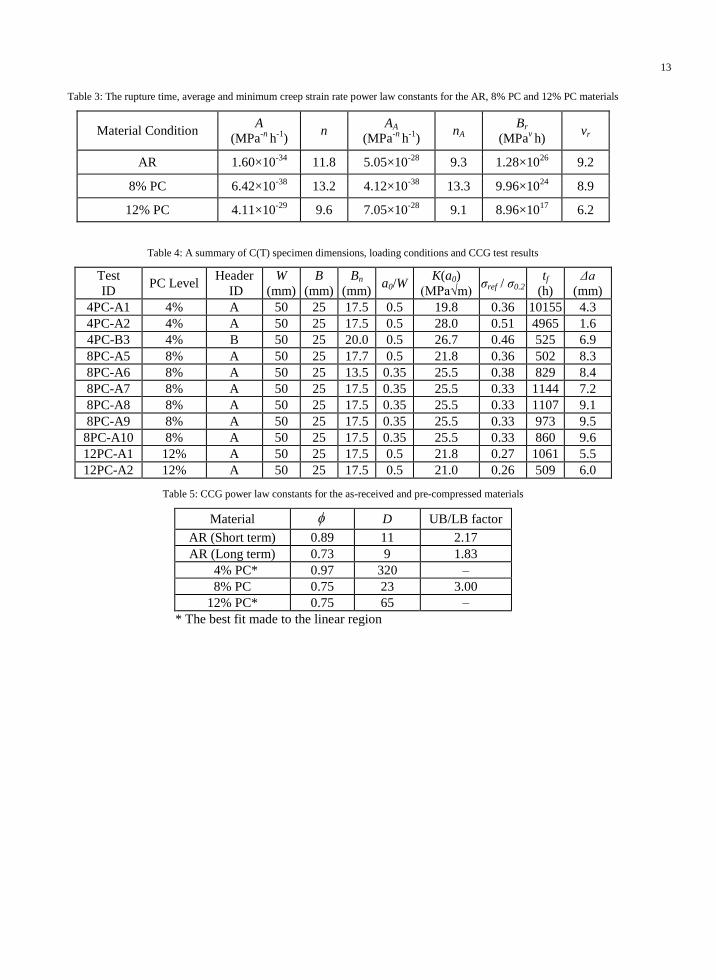
Table 3: The rupture time, average and minimum creep strain rate power law constants for the AR, 8% PC and 12% PC materials
Material Condition A
(MPa-n
h-1
) n
AA
(MPa-n
h-1
) nA
Br
(MPav h)
vr
AR 1.60×10⁻³⁴
11.8 5.05×10⁻²⁸
9.3 1.28×1026
9.2
8% PC 6.42×10-38
13.2 4.12×10-38
13.3 9.96×1024
8.9
12% PC 4.11×10⁻²⁹
9.6 7.05×10⁻²⁸
9.1 8.96×10¹⁷
6.2
Table 4: A summary of C(T) specimen dimensions, loading conditions and CCG test results
Test
ID PC Level
Header
ID
W
(mm)
B
(mm)
Bn
(mm) a0/W
K(a0)
(MPa√m) σref / σ0.2
tf
(h)
Δa
(mm)
4PC-A1 4% A 50 25 17.5 0.5 19.8 0.36 10155 4.3
4PC-A2 4% A 50 25 17.5 0.5 28.0 0.51 4965 1.6
4PC-B3 4% B 50 25 20.0 0.5 26.7 0.46 525 6.9
8PC-A5 8% A 50 25 17.7 0.5 21.8 0.36 502 8.3
8PC-A6 8% A 50 25 13.5 0.35 25.5 0.38 829 8.4
8PC-A7 8% A 50 25 17.5 0.35 25.5 0.33 1144 7.2
8PC-A8 8% A 50 25 17.5 0.35 25.5 0.33 1107 9.1
8PC-A9 8% A 50 25 17.5 0.35 25.5 0.33 973 9.5
8PC-A10 8% A 50 25 17.5 0.35 25.5 0.33 860 9.6
12PC-A1 12% A 50 25 17.5 0.5 21.8 0.27 1061 5.5
12PC-A2 12% A 50 25 17.5 0.5 21.0 0.26 509 6.0
Table 5: CCG power law constants for the as-received and pre-compressed materials
Material D UB/LB factor
AR (Short term) 0.89 11 2.17
AR (Long term) 0.73 9 1.83
4% PC* 0.97 320 –
8% PC 0.75 23 3.00
12% PC* 0.75 65 –
* The best fit made to the linear region
14
Figures
Figure 1: Tensile curves for the AR, 4% PC, 8% PC and 12% PC materials at (a) room temperature (b) 550 °C
Figure 2: Comparison of the creep curves for the AR, 4% PC, 8% PC and 12% PC materials tested at 300 MPa
0
100
200
300
400
500
600
700
0 10 20 30 40 50 60 70
Engin
eeri
ng S
tres
s (M
Pa
)
Engineering Strain (%)
12% PC
AR
8% PC
4% PC
Room Temperature(a)0
50
100
150
200
250
300
350
400
450
500
0 10 20 30 40 50
En
gin
eeri
ng S
tres
s (M
Pa
)
Engineering Strain (%)
AR
12% PC
8% PC
550 C
4% PC
(b)
8% PC
AR
12% PC
4% PC
0.0
2.0
4.0
6.0
8.0
10.0
12.0
14.0
16.0
0 500 1000 1500 2000
εc
(%)
Time (h)
300 MPa
15
Figure 3: The effect of percentage pre-compression on the creep ductility and rupture time variation of 316H steel at 300 MPa and 550 °C
Figure 4: Comparison of the rupture time trends for the AR, 4% PC, 8% PC and 12% PC materials
0
500
1000
1500
2000
2500
3000
3500
4000
0.00
0.02
0.04
0.06
0.08
0.10
0.12
0.14
0.16
0 4 8 12
t r(h
)
ε f(m
m/m
m)
% Pre-compression
Creep ductility
Rupture time
300 MPa
1.E+01
1.E+02
1.E+03
1.E+04
1.E+02 1.E+03
t r(h
)
σnom (MPa)
AR
4% PC
8% PC
12% PC
16
Figure 5: Comparison of the (a) average creep strain rate and (b) minimum creep strain rate trends for the AR, 4% PC, 8% PC and 12%
PC materials
Figure 6: Comparison of the axial creep ductility data points for the AR and PC materials with the estimated trends for the AR material
1.E-06
1.E-05
1.E-04
1.E-03
1.E-02
1.E+02 1.E+03
(h-1
)
σnom (MPa)
AR
4% PC
8% PC
12% PC
A
(a)
1.E-06
1.E-05
1.E-04
1.E-03
1.E-02
1.E+02 1.E+03
(h-1
)
σnom (MPa)
AR
4% PC
8% PC
12% PC
s
(b)
1.E-03
1.E-02
1.E-01
1.E+00
0.1 1.0 10.0
(mm
/mm
)
σ/σ0.2
AR-Data base
AR
4% PC
8% PC
12% PC
f
Estimated Creep Ductility Trends for
AR Material at 550 C
17
Figure 7: The variation of (a) load line displacement normalised by the specimen width and (b) the creep crack extension, against time
normalised by the test duration for the CCG tests performed on PC specimens
Figure 8: C* validity criteria for the CCG tests performed on PC specimens
0.0E+00
1.0E-03
2.0E-03
3.0E-03
4.0E-03
5.0E-03
6.0E-03
0.0 0.2 0.4 0.6 0.8 1.0
Δ/W
t/tf
4PC-A1
4PC-A2
4PC-B3
8PC-A5
8PC-A6
8PC-A7
8PC-A8
8PC-A9
8PC-A10
12PC-A1
12PC-A2
(a)
0.0
2.0
4.0
6.0
8.0
10.0
12.0
0.0 0.2 0.4 0.6 0.8 1.0
Δa
(m
m)
t/tf
4PC-A1
4PC-A2
4PC-B3
8PC-A5
8PC-A6
8PC-A7
8PC-A8
8PC-A9
8PC-A10
12PC-A1
12PC-A2
(b)
0.0
0.1
0.2
0.3
0.4
0.5
0.6
0.7
0.8
0.9
1.0
0.0 0.2 0.4 0.6 0.8 1.0
Δc /
ΔT
t/tf
4PC-A1
4PC-A2
4PC-B3
8PC-A5
8PC-A6
8PC-A7
8PC-A8
8PC-A9
8PC-A10
12PC-A1
12PC-A2
.
.
18
Figure 9: Comparison of the da/dt vs. C* trends for the CCG tests performed on the PC specimens
Figure 10: Comparison of the CCG trends for the as-received and pre-compressed materials
1.E-04
1.E-03
1.E-02
1.E-01
1.E-07 1.E-06 1.E-05 1.E-04
da
/dt
(mm
/h)
C* (MPam/h)
4PC-A1
4PC-A2
4PC-B3
8PC-A5
8PC-A6
8PC-A7
8PC-A8
8PC-A9
8PC-A10
12PC-A1
12PC-A2
1.E-05
1.E-04
1.E-03
1.E-02
1.E-01
1.E+00
1.E+01
1.E-07 1.E-06 1.E-05 1.E-04 1.E-03 1.E-02
da
/dt
(mm
/h)
C* (MPam/h)
4PC
8PC
12PC
.
Short term as-received data band
long term as-received data band
19
Figure 11: Creep cracking mode in a 4% PC specimen (4PC-A2)
Figure 12: Creep crack initiation trends corresponding to (a) 0.2 mm and (b) 0.5 mm crack extension, for the PC and AR materials
1.E+00
1.E+01
1.E+02
1.E+03
1.E+04
1.E-07 1.E-06 1.E-05 1.E-04 1.E-03 1.E-02
t i(h
)
C* (ti) (MPam/h)
AR-Short Term
AR-Long Term
4PC
8PC
12PC
(a) Δa = 0.2 mm
i
AR
at
a
8i
PC
at
a
1.E+00
1.E+01
1.E+02
1.E+03
1.E+04
1.E-07 1.E-06 1.E-05 1.E-04 1.E-03 1.E-02
t i(h
)
C* (ti) (MPam/h)
AR-Short Term
AR-Long Term
4PC
8PC
12PC
(b) Δa = 0.5 mm
20
References
[1] Acar MO, Gungor S, Bouchard PJ, Fitzpatrick ME. Effect of Prior Cold Work on the Mechanical
Properties of Weldments Experimental and Applied Mechanics, Volume 6.17:817-26.
[2] Auzoux Q, Allais L, Caës C, Monnet I, Gourgues AF, Pineau A. Effect of pre-strain on creep of three
AISI 316 austenitic stainless steels in relation to reheat cracking of weld-affected zones. Journal of Nuclear
Materials. 2010;400:127-37.
[3] Li DF, O'Dowd NP, Davies CM, Nikbin KM. A review of the effect of prior inelastic deformation on high
temperature mechanical response of engineering alloys. The International journal of pressure vessels and
piping. 2010;87:531-42.
[4] Mehmanparast A, Davies CM, Dean DW, Nikbin K. Material pre-conditioning effects on the creep
behaviour of 316H stainless steel. International journal of pressure vessels and piping. 2013;108-109:88-93.
[5] Mehmanparast A, Davies CM, Dean DW, Nikbin KM. The Influence of Pre-Compression on the Creep
Deformation and Failure Behaviour of Type 316H Stainless Steel. Engineering Fracture Mechanics.
2013;110:52–67.
[6] Parker JD, Wilshire B. The effects of prestrain on the creep and fracture behavior of polycrystalline
copper. Materials Science and Engineering. 1980;43:271-80.
[7] Dyson BF, Rodgers MJ. Prestrain, Cavitation, and Creep Ductility. Metal Science. 1974;8:261-6.
[8] Kikuchi S, Ilschner B. Effects of a small prestrain at high temperatures on the creep behaviour of AISI 304
stainless steel. Scripta Metallurgica. 1986;20:159-62.
[9] Willis M, McDonaugh-Smith A, Hales R. Prestrain effects on creep ductility of a 316 stainless steel light
forging. International journal of pressure vessels and piping. 1999;76:355-9.
[10] Davies PW, Wilshire B, Richards JD. Influence of cold work on creep and fracture behaviour of a dilute
nickel alloy. J Inst Met,. 1962;90:431–3.
[11] Vijayanand VD, Nandagopal M, Parameswaran P, Laha K, Mathew MD. Effect of Prior Cold Work on
Creep Rupture and Tensile Properties of 14Cr-15Ni-Ti Stainless Steel. Procedia Engineering. 2013;55:78-81.
[12] Mahalingam S. Effect of pre-strain on grain size distributions in 316H austenitic stainless steel. Journal
of materials science. 2012;47:960-8.
[13] Mehmanparast A, Davies CM, Ardakani M, Nikbin KM. A Microstructural Study of Compressive Plastic
Pre-Strain Effects on Creep Damage Behaviour of Type 316H Stainless Steel. ASME-PVP 17-21 July
Baltimore-US: proceedings of the International Conference on Pressure Vessels and Piping; 2011.
[14] Davies CM, Dean DW, Nikbin KM. The Influence of Compressive Plastic Pre-Strain on the Creep
Deformation and Damage Behaviour of 316H Stainless Steel. International Conference on Engineering
Structural Integrity Assessment 19th-20th May. Manchester, UK: EMAS Publishing; 2009.
[15] Davies CM, Dean DW, Mehmanparast A, Nikbin KM. Compressive Pre-Strain Effects on the Creep and
Crack Growth Behaviour of 316H Stainless Steel. ASME-PVP 18-23 July Seattle-US: proceedings of the
International Conference on Pressure Vessels and Piping; 2010.
[16] Norton FH. The Creep of Steel at High Temperatures: McGraw-Hill, New York, NY, USA; 1929.
[17] Webster GA, Ainsworth RA. High Temperature Component Life Assessment. 1st ed. London: Chapman
and Hall; 1994.
[18] Davies CM, Kourmpetis M, O'Dowd NP, Nikbin KM. Experimental Evaluation of the J or C* Parameter
for a Range of Cracked Geometries. Journal of ASTM International. 2006;3:1-20.
[19] ASTM. E1457-07: Measurement of Creep Crack Growth Rates in Metals. Annual Book of ASTM
Standards: ASTM International; 2007. p. 101235.
[20] EDF Energy. R5: Assessment Procedure for the High Temperature Response of Structures. 2012.
[21] Dean DW, Gladwin DN. Creep Crack Growth Behaviour of Type 316H Steels and Proposed
Modifications to Standard Testing and Analysis Methods. International Journal of Pressure Vessels and
Piping. 2007;84:37895.
21
[22] Anderson TL. Fracture Mechanics: Fundamentals and Application. Boston: CRC Press; 1991.
[23] Mehmanparast A, Davies CM, Webster GA, Nikbin KM. Creep Crack Growth Rate Predictions in 316H
Steel using Stress Dependent Creep Ductility. Materials at High Temperatures. 2014;31:84-94.
[24] Ainsworth RA. The Assessment of Defects in Structures of Strain Hardening Material. Engineering
Fracture Mechanic. 1984;19:63342.
[25] Davies CM, Mueller F, Nikbin KM, O'Dowd NP, Webster GA. Analysis of Creep Crack Initiation and
Growth in Different Geometries for 316H and Carbon Manganese Steels. Journal of ASTM International.
2006;3:1-20.
[26] Nikbin KM, Smith, D.J., Webster, G.A. Prediction of Creep Crack Growth from Uniaxial Creep Data.
Proceedings of the Royal Society. 1984;A 396:18397.
[27] Wilshire B, Battenbough AJ. Creep and creep fracture of polycrystalline copper. Materials science &
engineering A, Structural materials: properties, microstructure and processing. 2007;443:156-66.


![Creep Anisotropy in the Monocrystalline Nickel-Base ... · creep strength decreases in the order [OOl] - [Ol l] - [ill]. Under the present conditions plastic deformation in the primary](https://img.pdfslide.us/doc/110x75/5e5acac74ba6fd7a3875ed44/creep-anisotropy-in-the-monocrystalline-nickel-base-creep-strength-decreases.jpg)