Embed Size (px)
Citation preview
Western University Western University
Scholarship@Western Scholarship@Western
Electronic Thesis and Dissertation Repository
9-16-2020 3:30 PM
Effects of Oxidative Modifications on the Structure and Non-Effects of Oxidative Modifications on the Structure and Non-
Canonical Functions of Cytochrome c Studied by Mass Canonical Functions of Cytochrome c Studied by Mass
Spectrometry Spectrometry
Victor Yin, The University of Western Ontario
Supervisor: Konermann, Lars, The University of Western Ontario
A thesis submitted in partial fulfillment of the requirements for the Doctor of Philosophy degree
in Chemistry
© Victor Yin 2020
Follow this and additional works at: https://ir.lib.uwo.ca/etd
Part of the Analytical Chemistry Commons, and the Structural Biology Commons
Recommended Citation Recommended Citation Yin, Victor, "Effects of Oxidative Modifications on the Structure and Non-Canonical Functions of Cytochrome c Studied by Mass Spectrometry" (2020). Electronic Thesis and Dissertation Repository. 7332. https://ir.lib.uwo.ca/etd/7332
This Dissertation/Thesis is brought to you for free and open access by Scholarship@Western. It has been accepted for inclusion in Electronic Thesis and Dissertation Repository by an authorized administrator of Scholarship@Western. For more information, please contact [email protected].
ii
Abstract
The peroxidase activity of the mitochondrial protein cytochrome c (cyt c) plays a
critical role in triggering programmed cell death, or apoptosis. However, the native
structure of cyt c should render this activity impossible due to the lack of open iron
coordination sites at its heme cofactor. Despite its key biological importance, the molecular
mechanisms underlying this structure-function mismatch remain enigmatic. The work
detailed in this dissertation fills this knowledge gap by using mass spectrometry (MS) to
decipher the central role that protein oxidative modifications and their associated structural
changes play in activating the peroxidase function of cyt c.
Chapter 2 uses a suite of MS-based experiments to identify and characterize
oxidative modifications in cyt c caused by the oxidant and canonical peroxidase substrate,
H2O2. In doing so, we unravel the critical role that these in situ structural changes play in
triggering the peroxidase activity of the protein via alteration of the coordination
environment. Serendipitously, we also discover that certain functionally important
oxidative modifications, particularly on Lys, can elude detection when using conventional
bottom-up MS approaches. However, by applying top-down MS we could successfully
detect these modifications.
Chapter 3 re-examines a popular and purportedly well-characterized model system
for peroxidase-activated cyt c: cyt c treated with chloramine-T. By combining top-down
MS with sample fractionation techniques, we uncover that this model system is in fact
comprised of a broad ensemble of structurally and functionally distinct species. These
species can be differentiated by the extent of oxidation at key Lys residues, which
previously went undetected.
Chapter 4 expands on the previous chapters by probing the causal factors
underpinning the production of oxidative modification products at Lys and other residues.
We discover that Lys oxidation is catalyzed by the endogenous heme cofactor, while other
transformations (e.g. Met oxidation) proceed via direct interaction with the oxidant.
iii
Chapter 5 utilizes oxidized cyt c as a model system to test the compatibility of
protein stability measurements in the gas phase to their counterparts in solution. Unlike
many other protein systems, we discover that oxidized cyt c shows opposing stability trends
in solution and in the gas phase.
Keywords: mass spectrometry, cytochrome c, peroxidase, protein oxidation, oxidative
damage, ion mobility spectrometry.
iv
Summary for Lay Audience
Proteins are large molecules comprised of amino acids that play important roles in
many aspects of biology. Proteins adapt a variety of functions, depending on their structure.
Cytochrome c (cyt c) is a protein found in the mitochondria of cells that normally functions
as an electron transporter, which is possible because of the iron-containing heme group in
cyt c. Cyt c also has an alternative function (as a peroxidase), which plays a key role in
triggering programmed cell death, or apoptosis. Despite this importance, it is poorly
understood how cyt c can have peroxidase function despite structural features that should
render it inactive. In this dissertation, we use mass spectrometry (MS) to study how
oxidants can interact with cyt c, altering its structure and accommodating its peroxidase
function.
We first studied the effects of the oxidant hydrogen peroxide (H2O2) on the
structure and function of cyt c (Chapter 2). We uncovered that cyt c is extensively modified
by H2O2. Using MS, we determined that these oxidative modifications cause structural
changes near the heme that enable peroxidase function. A key finding was that oxidation
of one type of amino acid, lysine, was critical.
We next focused on another oxidant, chloramine-T (CT) (Chapter 3). CT-treated
cyt c has long been a popular model system for studying apoptosis and is thought to be
simple and well-characterized. Using a combination of MS and purification techniques, we
discovered that CT-treated cyt c is actually a mixture of structurally and functionally
distinct species. The main difference between these species was the presence of lysine
oxidation at key positions on the protein.
We then explored the processes underlying the formation of oxidative
modifications in cyt c (Chapter 4). We determined that the heme plays a key role in
producing lysine oxidation, while other amino acids (e.g. methionine) were oxidized
independently of the heme group.

v
Finally, we used oxidized cyt c to compare the differences in protein stability using
MS versus conventional spectroscopic techniques in solution (Chapter 5). Unlike many
other proteins, we found that oxidized cyt c showed opposing stability trends in these two
types of measurements.

vi
Co-Authorship Statement
The works described in chapters 2, 3, and 5 are published in the following respective
articles:
Yin, V.; Shaw, G. S.; Konermann, L. Cytochrome c as a Peroxidase: Activation
of the Precatalytic Native State by H2O2-Induced Covalent Modifications. J. Am.
Chem. Soc. 2017, 139 (44), 15701–15709. doi: 10.1021/jacs.7b07106.
Reproduced with permission. © 2017 American Chemical Society.
Yin, V.; Mian, S. H.; Konermann, L. Lysine Carbonylation Is a Previously
Unrecognized Contributor to Peroxidase Activation of Cytochrome c by
Chloramine-T. Chem. Sci. 2019, 10 (8), 2349–2359. doi: 10.1039/C8SC03624A.
Reproduced with permission from the Royal Society of Chemistry.
Yin, V.; Konermann, L. Probing the Effects of Heterogeneous Oxidative
Modifications on the Stability of Cytochrome c in Solution and in the Gas Phase.
J. Am. Soc. Mass Spectrom. 2020. In press. doi: 10.1021/jasms.0c00089.
Reproduced with permission. © 2020 American Chemical Society.
The work described in Chapter 4 is incorporated into the following article:
Yin, V.; Holzscherer, D; Konermann, L. Delineating Heme-Mediated versus
Direct Protein Oxidation in Peroxidase-Activated Cytochrome c by Top-Down
Mass Spectrometry. Submitted.
vii
The original drafts of each article were written by the author. Subsequent edits were
performed in collaboration between the author and Dr. Lars Konermann. The 1H-NMR
spectra described in Chapter 2 were collected by Dr. Gary Shaw. A portion of the
experimental work in Chapter 4 was performed in collaboration with Derek Holzscherer,
under direct supervision by the author. All other experimental work and data analysis were
performed by the author.
viii
Acknowledgements
As the cliché goes: “it takes a village to raise a child”. While I cannot possibly
hope to get through everyone who has supported me up until this point, I will attempt to do
this statement some justice.
First and foremost, I would like to thank my research supervisor, Prof. Lars
Konermann. It is needless to say that without his support, none of this work would have
been possible. As a fresh graduate student in Lars’s research group, while full of boundless
curiosity and enthusiasm, I was certainly lacking in any competency or know-how. I credit
Lars with not only providing me with the technical skills to conduct research, but also
instilling in me the mindset necessary to be an effective researcher.
I would also like to thank all the members of the Konermann Lab (and beyond)
with whom I’ve been fortunate to have the opportunity to work with. Since I joined, the
group has always fostered a positive environment – slow to judge, quick to help – and for
that I will always be grateful. I am also grateful to my friends and colleagues in the broader
research community for their support and camaraderie.
I will always be indebted to my parents, who left everything behind in the hopes of
a better life for them and their children in Canada. Without their sacrifices, I certainly
would not be here today. As the first person in my family to even have a chance to go to
college, let alone get a graduate degree, I hope that everything has been worthwhile.
Last, but certainly not least, I would like to thank my better half, Angel, for her
seemingly endless patience and love, and for making me want to be a better person and a
better scientist. Thank you.
ix
Table of Contents
Abstract .............................................................................................................................. ii
Summary for Lay Audience ............................................................................................ iv
Co-Authorship Statement ............................................................................................... vi
Acknowledgements ........................................................................................................ viii
Table of Contents ............................................................................................................. ix
List of Symbols and Abbreviations ............................................................................... xv
Chapter 1. Introduction .................................................................................................... 1
1.1. Protein Structure and Function .................................................................... 1
1.2. Cytochrome c .................................................................................................. 2
1.3. Protein Oxidation ........................................................................................... 6
1.4. Common Methods for Studying Protein Structure ..................................... 7
1.4.1. Optical Spectroscopy ................................................................................ 7
1.4.2. High-Resolution Structural Techniques .................................................... 8
1.5. Mass Spectrometry and Associated Techniques.......................................... 9
1.5.1. Electrospray Ionization Mass Spectrometry (ESI-MS) .......................... 10
1.5.2. Mass Spectrometers for Protein Analysis ............................................... 11
1.5.3. Ion Mobility Spectrometry...................................................................... 14
1.6. ESI-MS Experiments for Studying Protein Structure .............................. 16

x
1.6.1. Primary Structure: Sequencing ............................................................... 16
1.6.2. Higher Order Structure: Covalent Labeling Experiments ...................... 18
1.6.3. Higher Order Structure: Native Mass Spectrometry ............................... 19
1.7. Scope of Thesis .............................................................................................. 20
1.8. References ..................................................................................................... 22
Chapter 2. Elucidation of an H2O2-Induced, In Situ Activation Mechanism of the
Peroxidase Activity of Cytochrome c ................................................................ 34
2.1. Introduction .................................................................................................. 34
2.2. Materials and Methods ................................................................................ 37
2.2.1. Materials. ................................................................................................ 37
2.2.2. Optical Spectroscopy. ............................................................................. 37
2.2.3. Protein Samples. ..................................................................................... 37
2.2.4. NMR Spectroscopy. ................................................................................ 38
2.2.5. Mass Spectrometry. ................................................................................ 38
2.3. Results and Discussion ................................................................................. 39
2.3.1. Peroxidase Kinetics. ................................................................................ 39
2.3.2. Spectroscopic Evidence for H2O2-Induced Structural Changes. ............ 43
2.3.3. H2O2-Induced Modifications Probed by Mass Spectrometry. ................ 46
2.3.4. Peptide Mapping of Oxidation Patterns. ................................................. 47
2.3.5. Chemical Deconvolution. ....................................................................... 52

xi
2.3.6. Top-down MS. ........................................................................................ 57
2.3.7. Peroxidase Activation Mechanism of Cyt c. .......................................... 61
2.4. Conclusions ................................................................................................... 63
2.5. References ..................................................................................................... 64
Chapter 3. Lysine Carbonylation as a Previously Unrecognized Contributor to
Peroxidase Activation of Cytochrome c in Oxidants Other than H2O2 ......... 70
3.1. Introduction .................................................................................................. 70
3.2. Methods ......................................................................................................... 74
3.2.1. Materials. ................................................................................................ 74
3.2.2. Preparation of CT-cyt c. .......................................................................... 74
3.2.3. Optical Spectroscopy. ............................................................................. 74
3.2.4. Mass Spectrometry. ................................................................................ 75
3.3. Results and Discussion ................................................................................. 76
3.3.1. Chloramine-T-induced Met80 Oxidation. .............................................. 76
3.3.2. SCX Fractionation and Optical Characterization. .................................. 76
3.3.3. Peroxidase Activity of CT-cyt c Fractions. ............................................ 81
3.3.4. SCX Fractions Represent Specific Proteoforms. .................................... 82
3.3.5. Top-Down CID-IM-MS for Proteoform-Selective Analysis. ................. 86
3.3.6. Mapping of LysCHO Sites. .................................................................... 91
3.3.7. LC-MS/MS Peptide Mapping Revisited. ................................................ 94
xii
3.3.8. Mechanism of CT-induced Peroxidase Activation. ................................ 96
3.4. Conclusions ................................................................................................. 100
3.5. References ................................................................................................... 102
Chapter 4. Delineating Heme-Mediated versus Direct Protein Oxidation Pathways in
Peroxidase-Activated Cytochrome c ............................................................... 107
4.1. Introduction ................................................................................................ 107
4.2. Methods ....................................................................................................... 111
4.2.1. Materials. .............................................................................................. 111
4.2.2. Mass Spectrometry. .............................................................................. 111
4.2.3. Heme Removal: Preparation of apoSS-cyt c. ......................................... 111
4.2.4. CT-induced Oxidation and GRT Labeling. .......................................... 112
4.3. Results and Discussion ............................................................................... 115
4.3.1. Effects of CT-Induced Oxidation. ........................................................ 115
4.3.2. Oxidation Site Mapping. ....................................................................... 118
4.3.3. Confirming LysCHO Sites by GRT Labeling. ..................................... 121
4.3.4. Confirming Heme Catalysis Using MP11. ........................................... 125
4.4. Conclusions ................................................................................................. 128
4.5. References ................................................................................................... 130
xiii
Chapter 5. Probing the Effects of Heterogeneous Oxidative Modifications on the
Stability of Cytochrome c in Solution and in the Gas Phase ......................... 135
5.1. Introduction ................................................................................................ 135
5.2. Materials and Methods .............................................................................. 138
5.2.1. Materials. .............................................................................................. 138
5.2.2. Protein Oxidation. ................................................................................. 139
5.2.3. Thermal Unfolding. .............................................................................. 139
5.2.4. Mass Spectrometry. .............................................................................. 140
5.3. Results and Discussion ............................................................................... 141
5.3.1. Chromatographic Separation of Proteoforms. ...................................... 141
5.3.2. Stability of CT-cyt c in Solution. .......................................................... 143
5.3.3. ESI Charge States of CT-cyt c. ............................................................. 145
5.3.4. Native ESI Gas Phase Conformations of CT-cyt c. .............................. 147
5.3.5. Gas Phase Stability of CT-cyt c. ........................................................... 147
5.3.6. Proteoform-Resolved CIU Analysis. .................................................... 151
5.4. Conclusions ................................................................................................. 154
5.5. References ................................................................................................... 156
Chapter 6. Summary and Future Work ..................................................................... 161
6.1. Summary ..................................................................................................... 161
6.2. Future Work ............................................................................................... 162

xiv
6.2.1. Peroxidase Activation In Vivo .............................................................. 162
6.2.2. Cyt c / Cardiolipin Interactions ............................................................. 163
6.2.3. Oxidation Mapping in Other Systems .................................................. 163
6.3. References ................................................................................................... 165
Appendix I – Permissions ............................................................................................. 167
Curriculum Vitae .......................................................................................................... 170

xv
List of Symbols and Abbreviations
BIRD blackbody infrared dissociation
CD circular dichroism
CE collision energy
CEM chain ejection model
CID collision-induced dissociation
CIU collision-induced unfolding
CL cardiolipin
CRM charged residue model
cryo-EM cryo-electron microscopy
CT chloramine-T
cyt c cytochrome c
DC direct current
DNPH dinitrophenylhydrazine
DTT dithiothreitol
ESI electrospray ionization
fOX fraction oxidized
FPOP fast photochemical oxidation of proteins
GRT Girard's reagent T
HDX-MS hydrogen-deuterium exchange mass spectrometry
HOS higher order structure
HRP horseradish peroxidase
IM ion mobility
IMS ion mobility spectrometry
LC liquid chromatography
LC/MS liquid chromatography mass spectrometry
LysCHO carbonylated lysine, aminoadipic semialdehyde
m/z mass-to-charge ratio
MALDI matrix-assisted laser desorption/ionization
xvi
MetO methionine sulfoxide
MP11 microperoxidase-11
MS mass spectrometry
MS/MS tandem mass spectrometry
MW molecular weight
NMR nuclear magnetic resonance
NOESY Nuclear Overhauser Effect Spectroscopy
PDB Protein Data Bank
QqQ-MS triple quadrupole mass spectrometer
Q-TOF quadrupole time-of-flight
R6G rhodamine 6G
RF radio frequency
ROS reactive oxygen species
RR resonance Raman
SCX strong cation exchange chromatography
SID surface-induced dissocation
TM melting temperature
TWIG traveling wave ion guide
TWIMS traveling wave ion mobility spectrometry
UV-Vis ultraviolet-visible
XL-MS cross-linking mass spectrometry
XRD X-ray diffraction
z charge
Ω collision cross-section
Ω/z collision cross-section-to-charge ratio
1
Chapter 1. Introduction
1.1. Protein Structure and Function
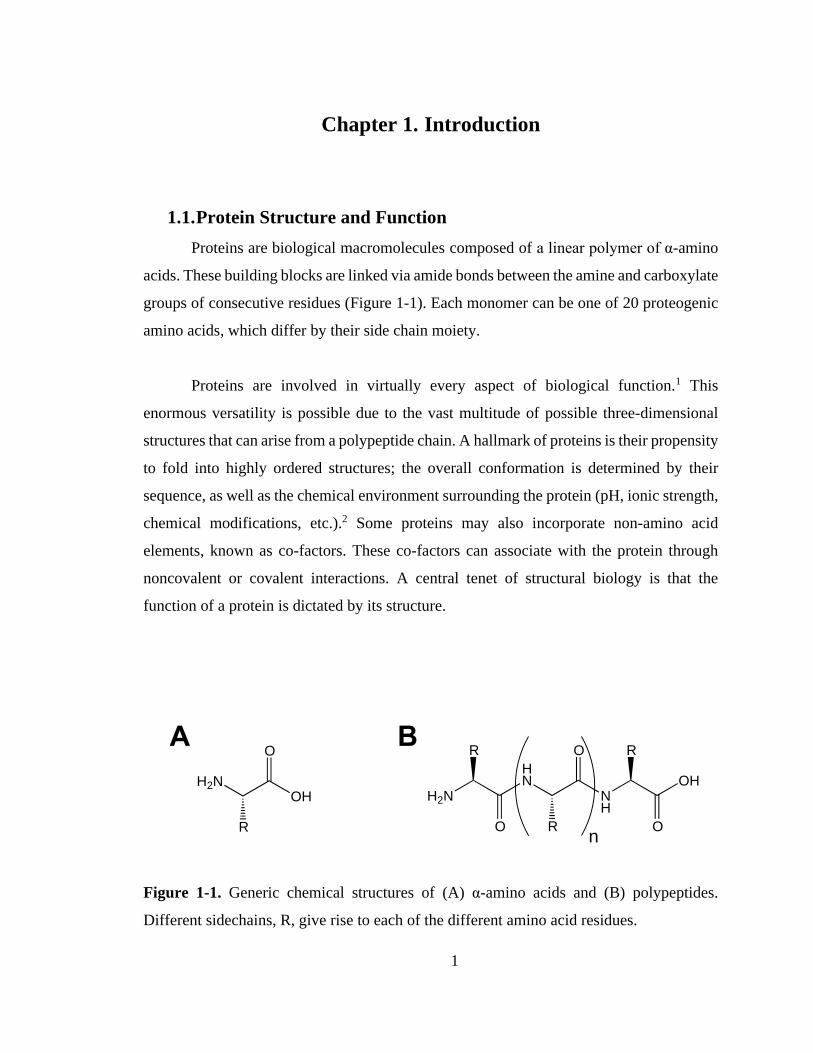
Proteins are biological macromolecules composed of a linear polymer of α-amino
acids. These building blocks are linked via amide bonds between the amine and carboxylate
groups of consecutive residues (Figure 1-1). Each monomer can be one of 20 proteogenic
amino acids, which differ by their side chain moiety.
Proteins are involved in virtually every aspect of biological function.1 This
enormous versatility is possible due to the vast multitude of possible three-dimensional
structures that can arise from a polypeptide chain. A hallmark of proteins is their propensity
to fold into highly ordered structures; the overall conformation is determined by their
sequence, as well as the chemical environment surrounding the protein (pH, ionic strength,
chemical modifications, etc.).2 Some proteins may also incorporate non-amino acid
elements, known as co-factors. These co-factors can associate with the protein through
noncovalent or covalent interactions. A central tenet of structural biology is that the
function of a protein is dictated by its structure.
Figure 1-1. Generic chemical structures of (A) α-amino acids and (B) polypeptides.
Different sidechains, R, give rise to each of the different amino acid residues.
H2N
O
OH
R
HN
O
NH
RO
H2N
R
O
OH
R
n
A B
2
One phenomenon that is of growing interest is the ability of some proteins to
perform multiple, sometimes radically different functions, often termed protein
“moonlighting”.3,4 Typically, such proteins are known for a primary, canonical function,
but have been found to also perform other, non-canonical functions. Some of this
moonlighting is possible without an accompanying change in structure (e.g. when different
functions are linked to different domains of the protein). Other cases require a change in
conformation that may be triggered by an altered chemical environment (e.g. cellular
location, pH, post-translational modifications, ligand-binding, etc.).
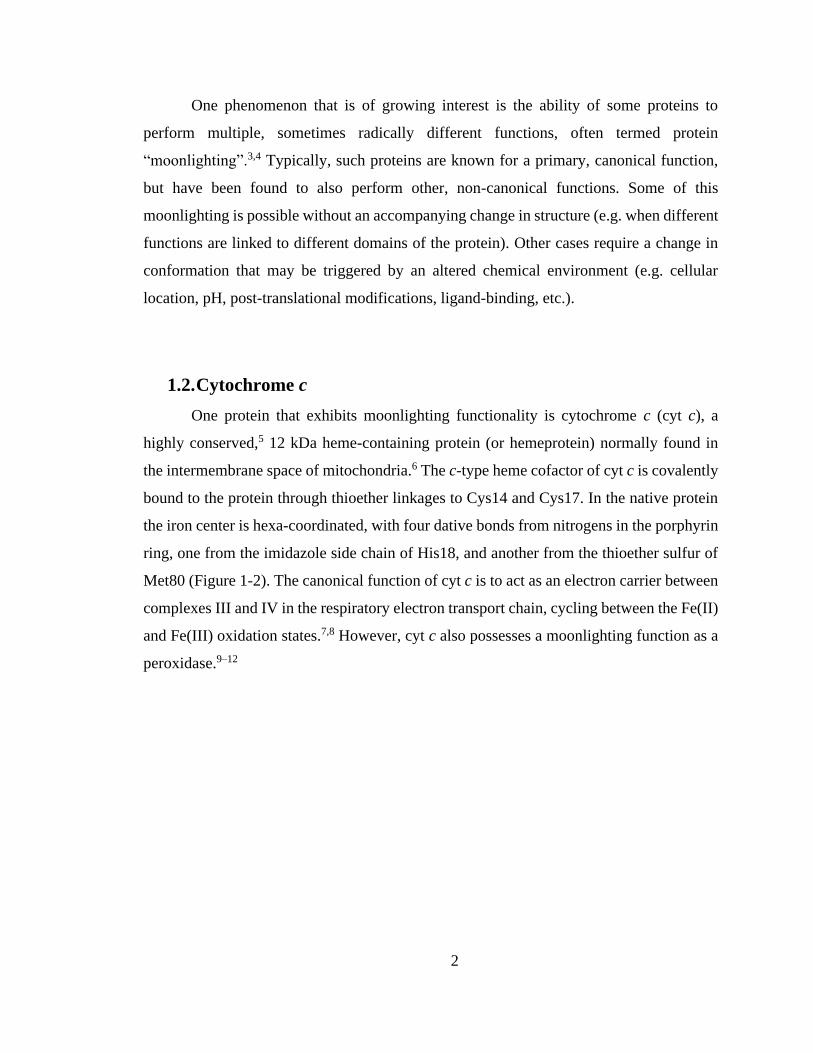
1.2. Cytochrome c
One protein that exhibits moonlighting functionality is cytochrome c (cyt c), a
highly conserved,5 12 kDa heme-containing protein (or hemeprotein) normally found in
the intermembrane space of mitochondria.6 The c-type heme cofactor of cyt c is covalently
bound to the protein through thioether linkages to Cys14 and Cys17. In the native protein
the iron center is hexa-coordinated, with four dative bonds from nitrogens in the porphyrin
ring, one from the imidazole side chain of His18, and another from the thioether sulfur of
Met80 (Figure 1-2). The canonical function of cyt c is to act as an electron carrier between
complexes III and IV in the respiratory electron transport chain, cycling between the Fe(II)
and Fe(III) oxidation states.7,8 However, cyt c also possesses a moonlighting function as a
peroxidase.9–12
3
Figure 1-2. (A): Crystal structure of cyt c (equine, PDB: 1HRC)13; (B): Magnified view of
the heme center; (C) Schematic representation of the heme center.
Peroxidases are a class of hemeproteins that catalyze the oxidation of substrates
using H2O2, with the most well-known example being horseradish peroxidase (HRP).14 In
this capacity, cyt c was found to play a crucial role in apoptosis (programmed cell death)
by catalyzing the peroxidation of membrane lipids (via formation of lipid radicals and
subsequent non-enzymatic reaction with molecular oxygen).15 This process increases the
permeability of the mitochondrial membrane and allows the passage of cyt c into the
cytoplasm, where interactions between cyt c and apoptotic factors initiate apoptosis.16–20
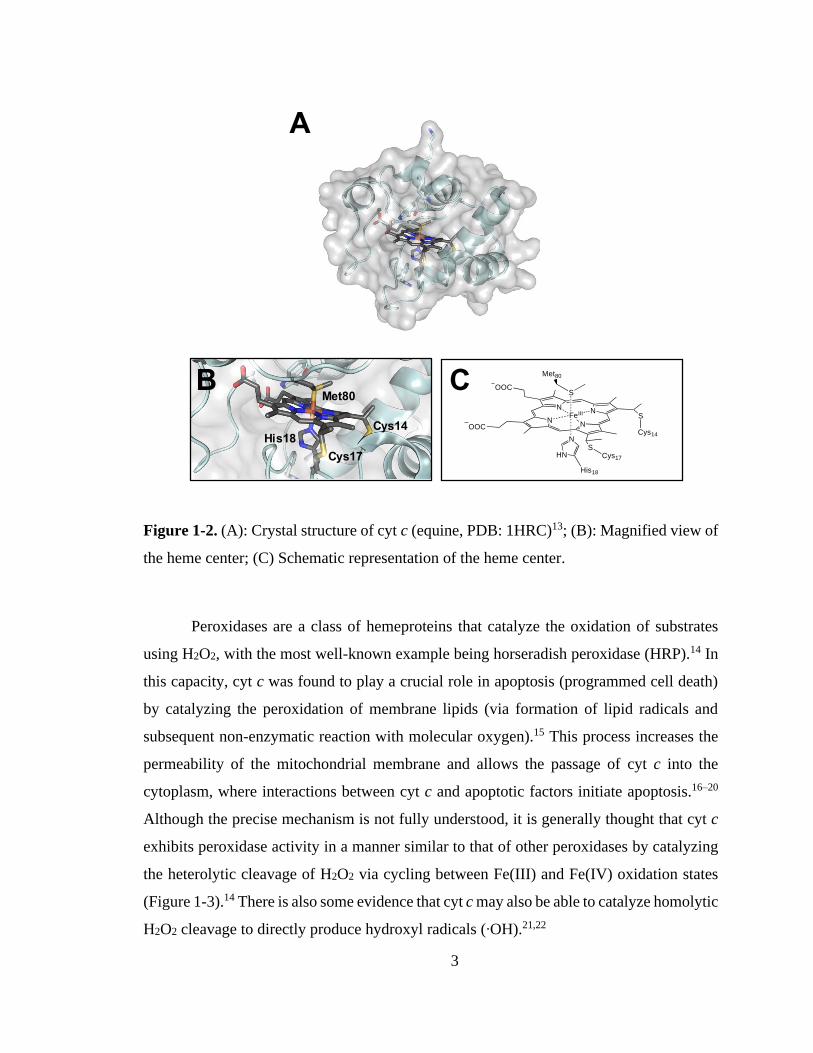
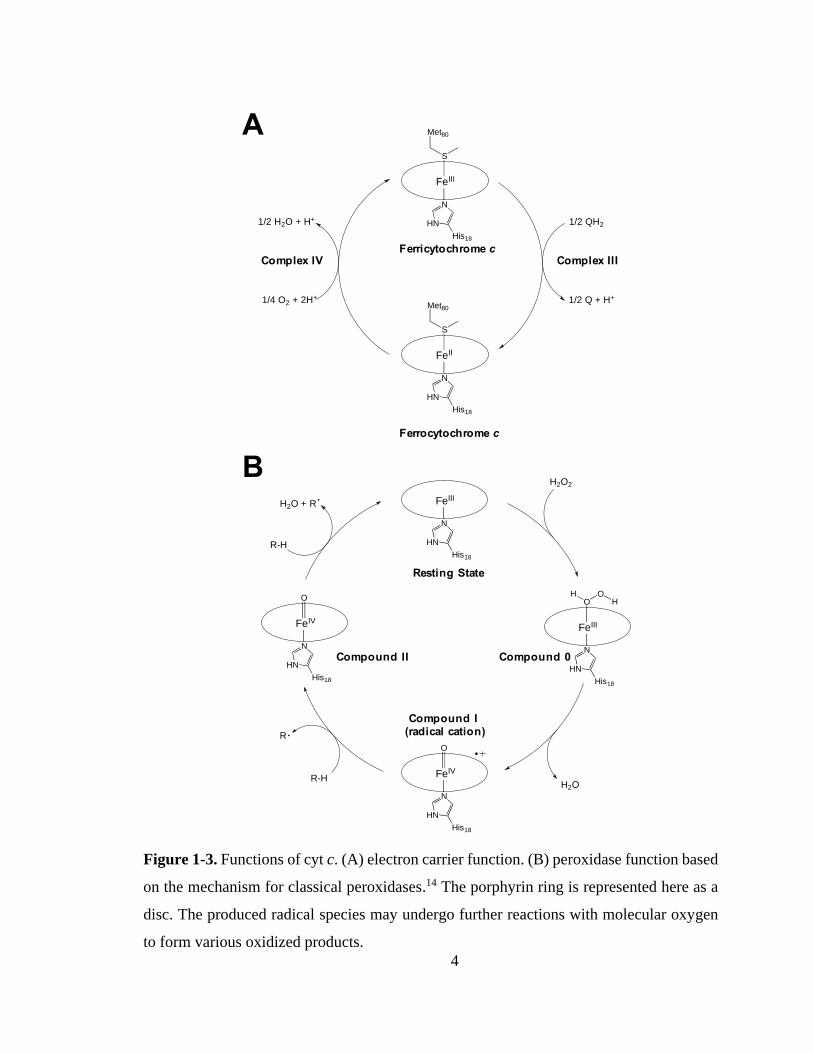
Although the precise mechanism is not fully understood, it is generally thought that cyt c
exhibits peroxidase activity in a manner similar to that of other peroxidases by catalyzing
the heterolytic cleavage of H2O2 via cycling between Fe(III) and Fe(IV) oxidation states
(Figure 1-3).14 There is also some evidence that cyt c may also be able to catalyze homolytic
H2O2 cleavage to directly produce hydroxyl radicals (∙OH).21,22
His18
Met80
Cys14
Cys17
NN
NN
S
OOC
FeIII
OOC
SCys17
Cys14N
HN
His18
S
Met80
A
B C
4
Figure 1-3. Functions of cyt c. (A) electron carrier function. (B) peroxidase function based
on the mechanism for classical peroxidases.14 The porphyrin ring is represented here as a
disc. The produced radical species may undergo further reactions with molecular oxygen
to form various oxidized products.
1/2 QH2
1/2 Q + H+1/4 O2 + 2H+
1/2 H2O + H+
FeIII
N
HN
His18
S
Met80
FeII
N
HN
His18
S
Met80
Ferricytochrome c
Ferrocytochrome c
Complex IIIComplex IV
H2O2
H2OR-H
R
R
R-H
H2O + FeIII
N
HN
His18
FeIII
N
HN
His18
O
FeIV
N
HN
His18
O
FeIV
N
HN
His18
O OHH
Resting State
Compound I(radical cation)
Compound II Compound 0
A
B
5
Regardless of the mechanistic details, all proposed explanations of cyt c peroxidase
activity require an Fe(III) species with an open distal coordinate site that can bind H2O2, in
line with HRP and other peroxidases.14 In the native conformation of cyt c, this distal site
is occupied by Met80 (Figure 1-2C). As such, numerous studies have explored how an
assortment of protein-ligand interactions, post-translational modifications, and/or
mutations can promote dissociation of the Met80-Fe bond, and how this may trigger the
functional switch from an electron carrier to a peroxidase.10–12,23–29 Studies in vivo have
shown that cyt c mutants lacking Met80 show increased peroxidase activity and promoted
release of cyt c into the cytoplasm from the mitochondria.30 Other studies have shown that
binding to anionic lipid molecules such as cardiolipin,31–33 as well as certain post-
translational modifications (e.g. Tyr74 nitration)34, result in changes of the coordination
environment that are correlated with increased peroxidase activity. One of the most-studied
alternate cyt c forms is the so-called “alkaline conformer”, where a lysine residue (likely
Lys72/73) is the 6th ligand in place of Met80.35–37 Unexpectantly, the alkaline conformer
exhibits enhanced peroxidase activity, despite also lacking an open coordination site to
bind H2O2.26,38
Despite decades of research studying the various effectors of the peroxidase activity
of cyt c, a long-standing enigma is that cyt c, in its native state hexacoordinate state, is
peroxidase-active.9 While there have been some attempts to address this paradox in both
the native state and the alkaline conformer (e.g. partial pentacoordinate occupancy via
conformational fluctuations)39,40, the phenomenon remains poorly understood.

6
1.3. Protein Oxidation
Exposure of proteins and other biomolecules to reactive oxygen species (ROS) such
as H2O2, ∙OH, and ∙O2- is an unavoidable consequence of aerobic cellular respiration.41,42
ROS can induce covalent (oxidative) modifications, many of which have pronounced
effects on protein structure and function. Accumulation of oxidized protein is correlated
with disease states related to aging43–45 and neurodegeneration.46–52 Proteins at high risk of
oxidation (e.g. redox-active metalloenzymes) are thought to have evolved protective
mechanisms to mitigate these deleterious effects (e.g. controlled electron hole hopping).53–
55 Aside from their negative consequences, protein oxidative modifications also play
important roles in cell signalling and in regulating the cellular response to oxidative
stress.56–58
A wide variety of protein oxidation products exist for almost every amino acid
residue.59–62 The most common oxidation targets are the sulfur-containing (Cys, Met) and
aromatic (Trp, Tyr, Phe) residues. Oxidation of these residues typically results in the
incorporation of one or more oxygen atoms, producing a series of +nO modifications.61,62
The residues Cys and Tyr can also oxidatively dimerize to form cystine63 and dityrosine64,65,
respectively. Mass spectrometry is commonly used to detect these oxidative modifications
due to their characteristic changes in mass.61,62
Another class of protein oxidative modifications are carbonylation products, in
which a reactive carbonyl (i.e. ketone or aldehyde) is produced.46,62 These types of
modifications are often studied by applying spectroscopic and/or antibody-based
quantitative assays that utilize the reactivity these moieties with 2,4-
dinitrophenylhydrazine (DNPH) or other hydrazines.66,67 Glu and Lys are the most
common targets of protein carbonylation,68 although carbonylation at other residues are
also known.62

7
1.4. Common Methods for Studying Protein Structure
1.4.1. Optical Spectroscopy
Optical spectroscopy utilizes the interactions between photons and chemical matter
to glean information on various physical and chemical properties of a system.69 In the
context of studying protein structure, two common optical techniques are circular
dichroism (CD) spectroscopy and fluorescence spectroscopy.
CD spectroscopy takes advantage of the chirality of proteins and their constituent
L-amino acids.70 When interacting with circularly polarized light (which can be either left-
or right-handed) chiral molecules will absorb each of these two components to a different
degree. The difference between these two absorbances produces the CD signal. For proteins,
far-UV photons (ca. 190 – 250 nm) are typically used, corresponding to π → π* and n →
π* electronic transitions of backbone amide groups.71 As the CD transitions are sensitive
to the three-dimensional arrangement of the polypeptide backbone,72 each type of
secondary structure (e.g. α-helix, β-sheet) gives rise to characteristic CD signals. The
secondary structure content of a protein can be estimated by fitting experimental CD
spectra to a linear combination of the “pure” basis spectra.73 Due to its convenience and
sensitivity to changes in secondary structure, CD spectroscopy is often used in protein
folding studies.74 Protein unfolding curves can be generated by plotting CD signals at a
given wavelength as a function of temperature or denaturant concentration.75 Various
thermodynamic parameters can be extracted from these experiments.76
Fluorescence spectroscopy utilizes the capacity for some chromophores to emit
light (fluoresce) following irradiation. Fluorescence spectroscopy offers the advantages of
high sensitivity and low background intensity, thereby providing very high S/N ratios.77
For protein studies, the fluorescence of intrinsic tryptophan residues is commonly
utilized.78,79 Upon irradiation at 280 nm, these residues fluoresce at ca. 350 nm. Both the
intensity and wavelength of the emission are a sensitive probe for the tryptophan
microenvironment.79 Polar environments (e.g. solvent exposure) induce a red shift in the
emission wavelength, whereas hydrophobic environments (e.g. the protein core) induce a
blue shift. Fluorescence quenching can also be used to provide proximity information.80
8
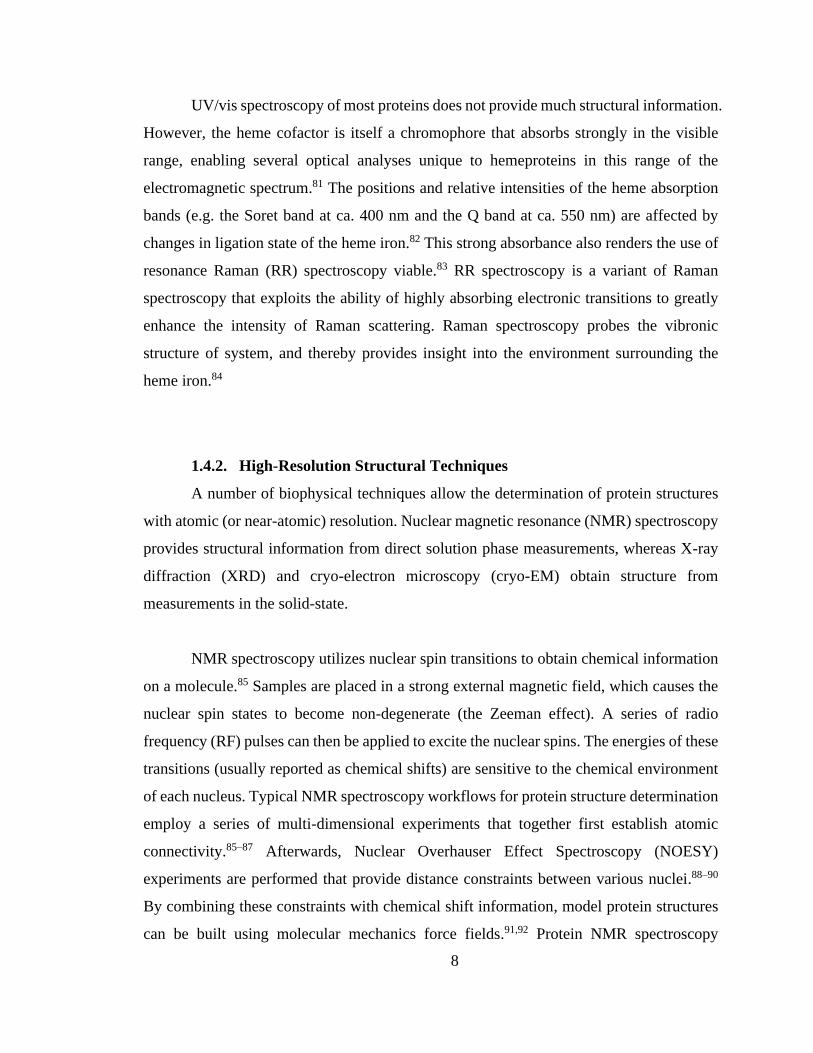
UV/vis spectroscopy of most proteins does not provide much structural information.
However, the heme cofactor is itself a chromophore that absorbs strongly in the visible
range, enabling several optical analyses unique to hemeproteins in this range of the
electromagnetic spectrum.81 The positions and relative intensities of the heme absorption
bands (e.g. the Soret band at ca. 400 nm and the Q band at ca. 550 nm) are affected by
changes in ligation state of the heme iron.82 This strong absorbance also renders the use of
resonance Raman (RR) spectroscopy viable.83 RR spectroscopy is a variant of Raman
spectroscopy that exploits the ability of highly absorbing electronic transitions to greatly
enhance the intensity of Raman scattering. Raman spectroscopy probes the vibronic
structure of system, and thereby provides insight into the environment surrounding the
heme iron.84
1.4.2. High-Resolution Structural Techniques
A number of biophysical techniques allow the determination of protein structures
with atomic (or near-atomic) resolution. Nuclear magnetic resonance (NMR) spectroscopy
provides structural information from direct solution phase measurements, whereas X-ray
diffraction (XRD) and cryo-electron microscopy (cryo-EM) obtain structure from
measurements in the solid-state.
NMR spectroscopy utilizes nuclear spin transitions to obtain chemical information
on a molecule.85 Samples are placed in a strong external magnetic field, which causes the
nuclear spin states to become non-degenerate (the Zeeman effect). A series of radio
frequency (RF) pulses can then be applied to excite the nuclear spins. The energies of these
transitions (usually reported as chemical shifts) are sensitive to the chemical environment
of each nucleus. Typical NMR spectroscopy workflows for protein structure determination
employ a series of multi-dimensional experiments that together first establish atomic
connectivity.85–87 Afterwards, Nuclear Overhauser Effect Spectroscopy (NOESY)
experiments are performed that provide distance constraints between various nuclei.88–90
By combining these constraints with chemical shift information, model protein structures
can be built using molecular mechanics force fields.91,92 Protein NMR spectroscopy
9
typically requires the use of isotopically enriched protein (e.g. 14N → 15N, 12C → 13C, 1H
→ 2H) and high protein concentrations to mitigate the inherently low sensitivity of the
technique.85
XRD utilizes the diffraction patterns of an ordered (crystalline) material to obtain
structural information.93 To perform XRD, a sample of interest must first be crystallized,
after which it is subjected to X-ray radiation. The scattering of these X-rays by the electrons
of each atom produce a characteristic diffraction pattern, from which the three-dimensional
electron density map can be determined. Both bonding and atomic coordinates can be
inferred from the electron density at a resolution ca. 1 Å (or even slightly lower).94 A major
limitation of XRD is the immense difficulty in growing protein crystals of sufficiently high-
quality.95
Cryo-EM is a high-resolution imaging technique that utilizes an electron beam to
elucidate protein structures.96,97 Samples are prepared by first spreading solubilized protein
across a grid. This is followed by flash-freezing to form a thin layer of vitreous ice
embedded with protein.98 The sample is then imaged by electron microscopy. By
combining images from many viewing angles and protein orientations, three-dimensional
protein structures can be reconstructed. Although sub-Å resolution is theoretically
obtainable via cryo-EM, a number of practical challenges (e.g. sample integrity, detector
efficiency) currently preclude this limit from being reached.98
1.5. Mass Spectrometry and Associated Techniques
Mass spectrometry (MS) is an analytical technique that measures the mass-to-
charge ratio (m/z) of analyte ions in the gas phase. The m/z provides information on the
chemical composition of a molecule. In comparison to other analytical techniques, MS has
the advantages of high sensitivity and low sample consumption. The basic design of a mass
spectrometer includes three primary components: 1) an ion source that converts analytes to
ions, 2) a mass analyzer that differentiates ions by m/z, and 3) a detector to record the ions.
10
Due to the plethora of options in these three components, an assortment of instrumental
designs are possible, with specific designs tailored to the types of analytes being studied.
1.5.1. Electrospray Ionization Mass Spectrometry (ESI-MS)
In the context of protein analysis, the most commonly used ionization technique is
electrospray ionization (ESI), although other techniques (e.g. matrix-assisted laser
desorption/ionization, MALDI) are also available.99 ESI is particularly well-suited for
proteins and other biological macromolecules.100–102 In ESI, an analyte solution is
introduced into a conductive capillary, and a high positive voltage (although negative
voltages are used for some applications) is applied. A Taylor cone is formed at the capillary
tip, from which charged, analyte-containing droplets are emitted.103–105 After a number of
fission and desolvation events, gaseous charged analytes are eventually produced, which
can then be introduced into the mass spectrometer.106,107 The ESI process generally
produces multiply charged, protonated species of the form [M+zH]z+, where M is the
molecular weight of the neutral analyte, and z corresponds to the number of excess protons,
i.e. the charge state.
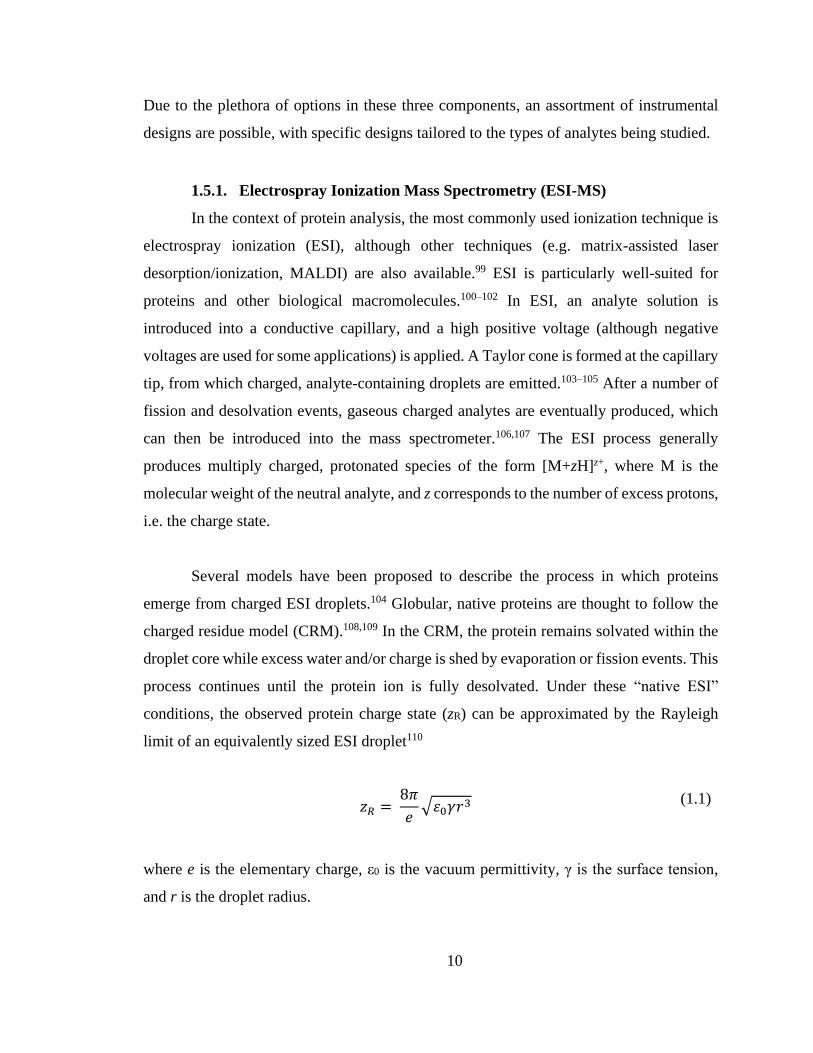
Several models have been proposed to describe the process in which proteins
emerge from charged ESI droplets.104 Globular, native proteins are thought to follow the
charged residue model (CRM).108,109 In the CRM, the protein remains solvated within the
droplet core while excess water and/or charge is shed by evaporation or fission events. This
process continues until the protein ion is fully desolvated. Under these “native ESI”
conditions, the observed protein charge state (zR) can be approximated by the Rayleigh
limit of an equivalently sized ESI droplet110
𝑧𝑅 = 8𝜋
𝑒√𝜀0𝛾𝑟3 (1.1)
where e is the elementary charge, ε0 is the vacuum permittivity, γ is the surface tension,
and r is the droplet radius.

11
In contrast to their native counterparts, unfolded proteins tend to exhibit much
higher charge states.111–113 The chain ejection model (CEM) has been proposed to explain
this behavior.114–116 In the CEM, the unfolded protein chain migrates to the surface of the
ESI droplet, where Coulombic repulsion promotes the gradual ejection of the protein chain
off of the droplet surface. Electrostatic forces promote the migration of H+ from the ESI
droplet to the nascent chain, until the highly charged protein is eventually fully ejected
from the ESI droplet.
ESI-MS offers several advantages for protein analysis. Firstly, ESI represents a
“soft” ionization technique, in that covalent bonds are not broken by the ionization process.
This is in contrast to “harsh” ionization techniques such as electron impact117 where
analytes often fragment. Under properly optimized conditions, even non-covalent
interactions can be retained during ESI, allowing ESI-MS to provide direct information on
protein-ligand118,119 and protein-protein120–123 interactions. Secondly, ESI-MS is amenable
to a very broad mass range (~102 – 106 Da); small molecular weight (MW) analytes are not
obscured by chemical noise as is the case with MALDI124, while large MW analytes
become multiply charged (z >> 1), lowering the observed m/z to levels tractable for
common mass analyzers. Thirdly, ESI can be easily coupled with liquid chromatography
(LC), facilitating the analysis of complex biological protein mixtures, e.g. for proteomic
applications.125–128
1.5.2. Mass Spectrometers for Protein Analysis
For the analysis of proteins and other biomolecules, tandem mass spectrometry
(MS/MS) experiments are often essential. In MS/MS, ions are fragmented in the gas phase,
and the mass spectrum of the fragment ions is monitored to obtain information on chemical
structure.129 The prototypical example of a tandem mass spectrometer for biomolecular
analysis is a triple quadrupole mass spectrometer (QqQ-MS).130 Quadrupoles are devices,
composed of two pairs of parallel conductive rods, that can act as ion mass filters.131,132
Depending on the RF and direct current (DC) voltages applied to the rods, only specific
12
m/z values successfully traverse the quadrupole, while other species are filtered out. These
voltages can be ramped, allowing a range of m/z values to be swept across to generate a
mass spectrum. Quadrupoles can also be operated as broadband (“RF-only”) ion guide,
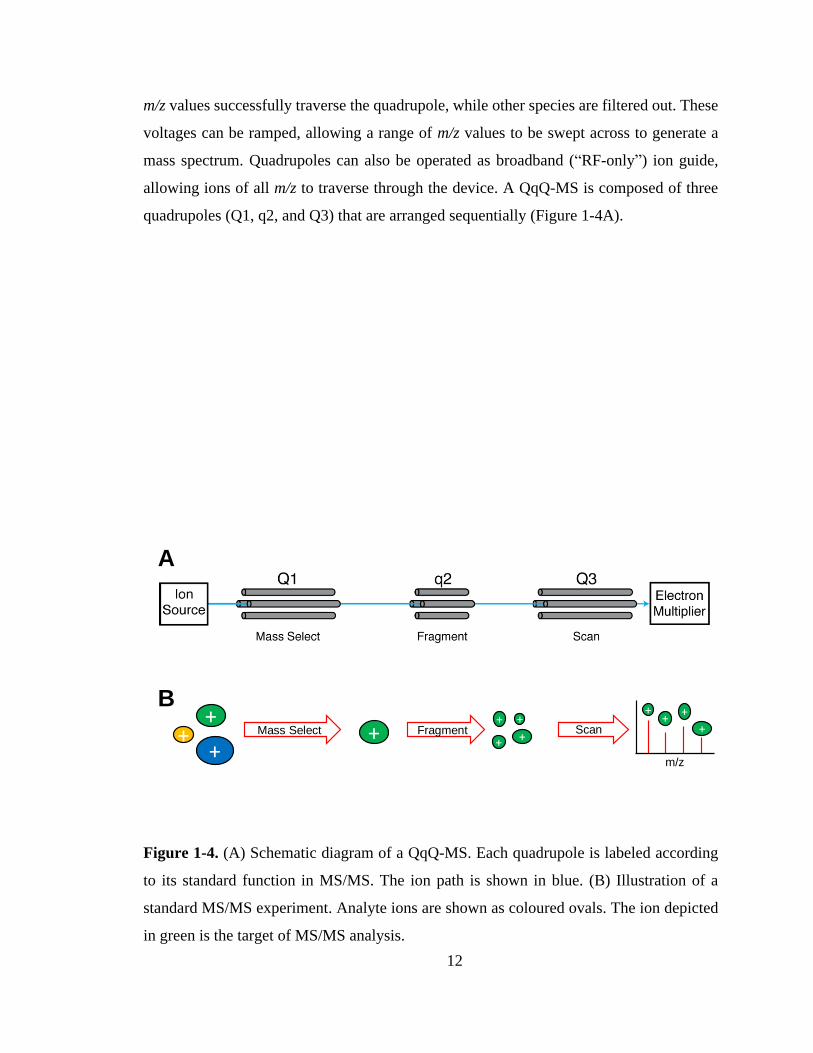
allowing ions of all m/z to traverse through the device. A QqQ-MS is composed of three
quadrupoles (Q1, q2, and Q3) that are arranged sequentially (Figure 1-4A).
Figure 1-4. (A) Schematic diagram of a QqQ-MS. Each quadrupole is labeled according
to its standard function in MS/MS. The ion path is shown in blue. (B) Illustration of a
standard MS/MS experiment. Analyte ions are shown as coloured ovals. The ion depicted
in green is the target of MS/MS analysis.
A
B
++
+Mass Select + Fragment
+
+ +
+Scan +
+++
m/z
13
A multitude of MS/MS experiments can be performed using a QqQ-MS.133 In the
archetypal MS/MS experiment (fragment ion scan, Figure 1-4B), Q1 is used as a mass filter
to select an ion of interest to be fragmented (called the “precursor ion”). Next, q2 is used
as a fragmentation cell to activate the ion. Collision-induced dissociation (CID) is the most
commonly used fragmentation technique, although other activation methods (e.g. electron-
or photon-based) have also been developed.134 For CID experiments, q2 is filled with an
inert gas such as Ar. A potential difference is then applied across q2, accelerating the
analyte ion through the collision gas. Repeated collisions between the analyte and
background gas results in vibrational heating of the analyte until fragmentation occurs. Q3
is then scanned across the m/z range to generate a mass spectrum of the produced fragment
ions. Finally, the ions are detected. An electron multiplier is typically used for this purpose,
which detects ions by converting ion impact events to electrical signals which are
subsequently amplified.135 The output of this experiment is a mass spectrum of all fragment
ions produced by a particular precursor ion (i.e. a tandem mass spectrum).
Many modern tandem mass spectrometers are derived from the basic QqQ-MS
design.133 Common alterations replace Q3 with a higher resolution mass analyzer. One
such configuration is a quadrupole time-of-flight (Q-TOF) mass spectrometer, where Q3
is replaced with a time-of-flight (TOF) mass analyzer.136,137 A TOF measures m/z by first
applying a high voltage pulse that accelerates the ions. The ions are then allowed to traverse
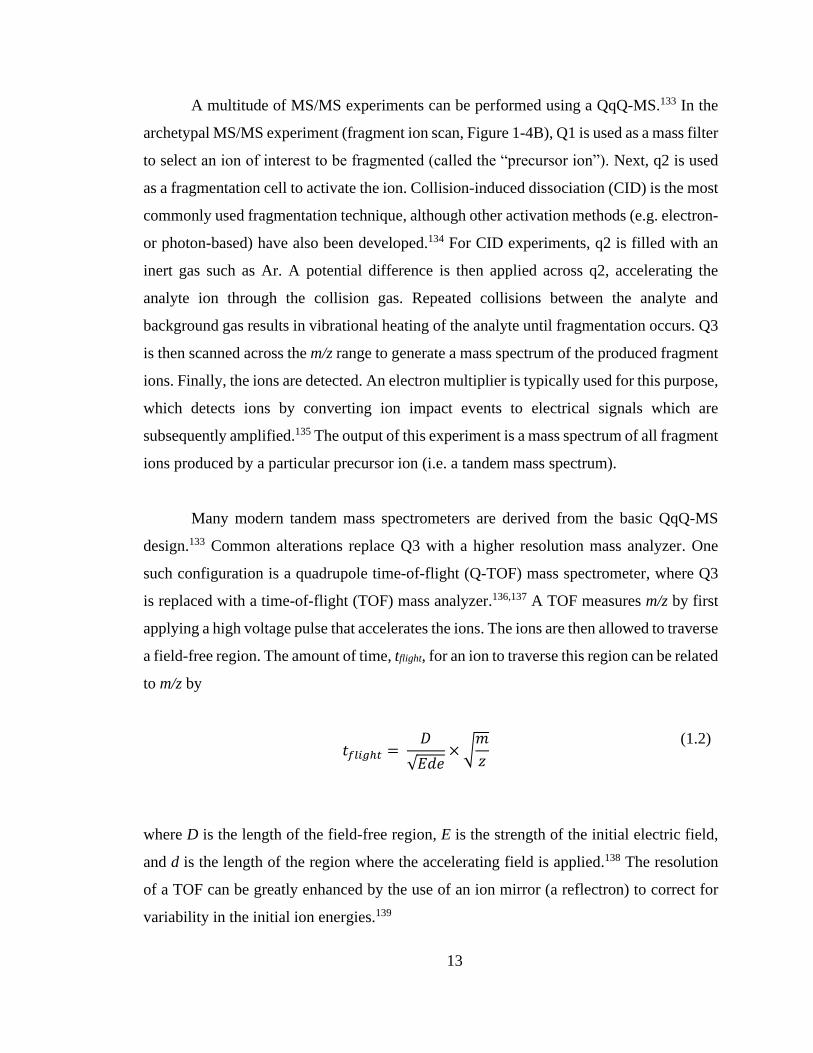
a field-free region. The amount of time, tflight, for an ion to traverse this region can be related
to m/z by
𝑡𝑓𝑙𝑖𝑔ℎ𝑡 =
𝐷
√𝐸𝑑𝑒× √
𝑚
𝑧
(1.2)
where D is the length of the field-free region, E is the strength of the initial electric field,
and d is the length of the region where the accelerating field is applied.138 The resolution
of a TOF can be greatly enhanced by the use of an ion mirror (a reflectron) to correct for
variability in the initial ion energies.139
14
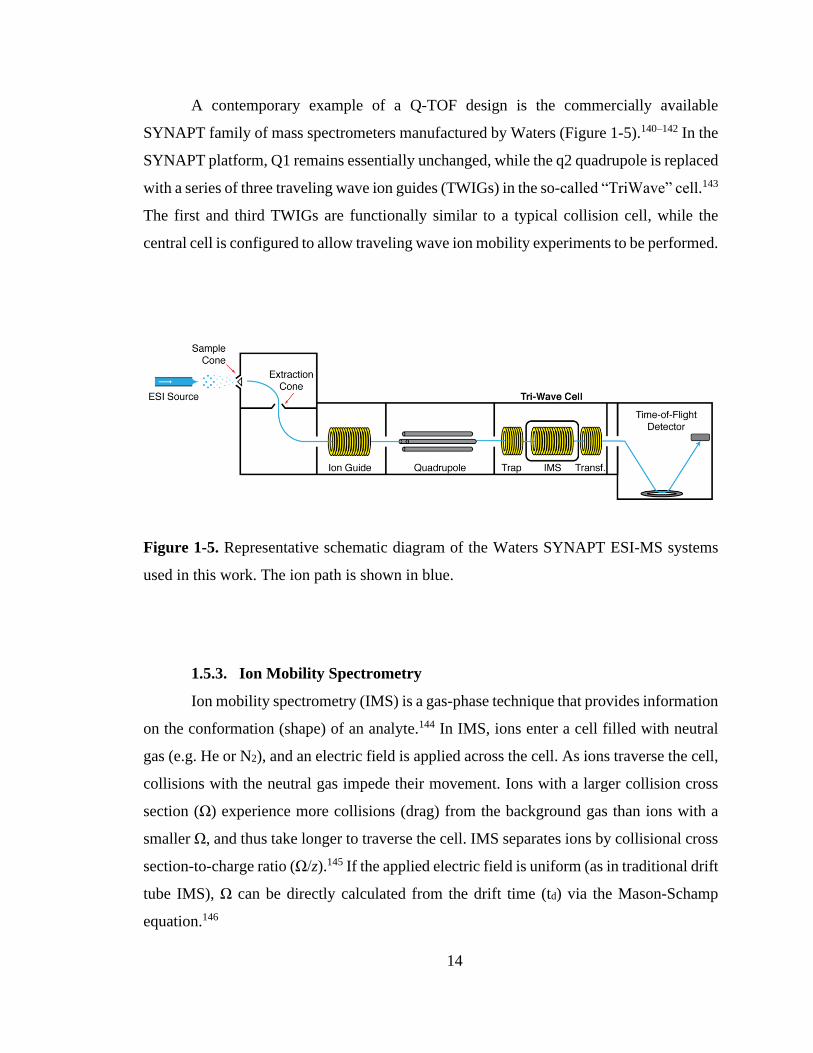
A contemporary example of a Q-TOF design is the commercially available
SYNAPT family of mass spectrometers manufactured by Waters (Figure 1-5).140–142 In the
SYNAPT platform, Q1 remains essentially unchanged, while the q2 quadrupole is replaced
with a series of three traveling wave ion guides (TWIGs) in the so-called “TriWave” cell.143
The first and third TWIGs are functionally similar to a typical collision cell, while the
central cell is configured to allow traveling wave ion mobility experiments to be performed.
Figure 1-5. Representative schematic diagram of the Waters SYNAPT ESI-MS systems
used in this work. The ion path is shown in blue.
1.5.3. Ion Mobility Spectrometry
Ion mobility spectrometry (IMS) is a gas-phase technique that provides information
on the conformation (shape) of an analyte.144 In IMS, ions enter a cell filled with neutral
gas (e.g. He or N2), and an electric field is applied across the cell. As ions traverse the cell,
collisions with the neutral gas impede their movement. Ions with a larger collision cross
section (Ω) experience more collisions (drag) from the background gas than ions with a
smaller Ω, and thus take longer to traverse the cell. IMS separates ions by collisional cross
section-to-charge ratio (Ω/z).145 If the applied electric field is uniform (as in traditional drift
tube IMS), Ω can be directly calculated from the drift time (td) via the Mason-Schamp
equation.146
15
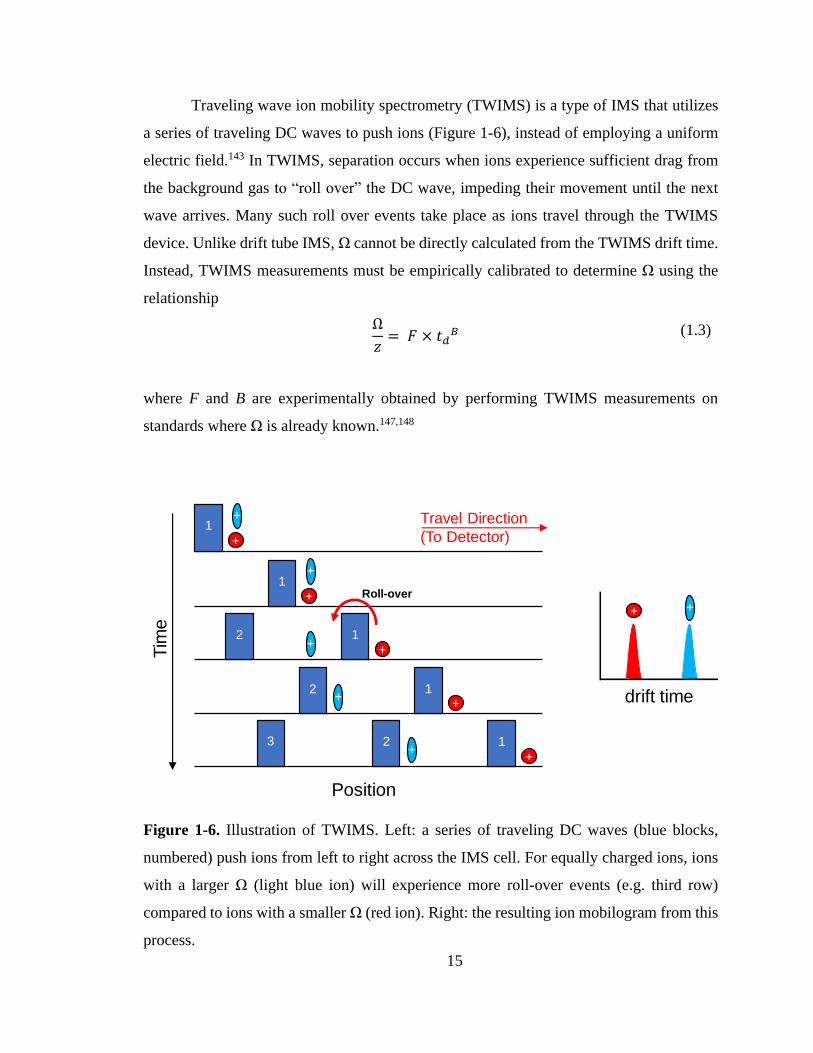
Traveling wave ion mobility spectrometry (TWIMS) is a type of IMS that utilizes
a series of traveling DC waves to push ions (Figure 1-6), instead of employing a uniform
electric field.143 In TWIMS, separation occurs when ions experience sufficient drag from
the background gas to “roll over” the DC wave, impeding their movement until the next
wave arrives. Many such roll over events take place as ions travel through the TWIMS
device. Unlike drift tube IMS, Ω cannot be directly calculated from the TWIMS drift time.
Instead, TWIMS measurements must be empirically calibrated to determine Ω using the
relationship
Ω
𝑧= 𝐹 × 𝑡𝑑
𝐵 (1.3)
where F and B are experimentally obtained by performing TWIMS measurements on
standards where Ω is already known.147,148
Figure 1-6. Illustration of TWIMS. Left: a series of traveling DC waves (blue blocks,
numbered) push ions from left to right across the IMS cell. For equally charged ions, ions
with a larger Ω (light blue ion) will experience more roll-over events (e.g. third row)
compared to ions with a smaller Ω (red ion). Right: the resulting ion mobilogram from this
process.
++
+
+
+
+
+
+
+
+
drift time
+
+
Tim
e
Position
1
1
1
1
1
Travel Direction
(To Detector)
2
2
23
Roll-over
16
1.6. ESI-MS Experiments for Studying Protein Structure
A versatile toolbox of MS-based techniques has been developed for studying
protein structure.102 These techniques can be loosely assigned to two categories: those that
probe primary structure (i.e. sequencing), and those that probe higher order structure (HOS).
Of the latter class, a distinction can be drawn on how higher order structural information is
encoded into the mass domain for MS detection, either by 1) covalent labeling of solution
phase structures, or 2) preserving HOS into the gas phase.
1.6.1. Primary Structure: Sequencing
The primary structure of a protein is given by its amino acid sequence.1 As every
amino acid (except Leu/Ile) has a unique mass, MS/MS offers a convenient method to
determine the sequence of a peptide or protein.149 These experiments rely on the fact that
MS/MS activation predominantly results in fragmentation along the polypeptide
backbone.150 The amino acid sequence can thus be determined from a tandem mass
spectrum by the mass differences between successive fragment ions. Similarly, protein
modifications (e.g. post-translational modifications, oxidative modifications) can be
localized in an MS/MS experiment by looking for mass differences that do not correspond
to those of the unmodified amino acids.151 The exact location of cleavage along the
backbone depends on the MS/MS activation method used.152 For CID, fragmentation
primarily occurs across backbone amide bonds153 to produce a series of fragment ions
denoted as b-ions if they contain the N-terminus, or y-ions if they contain the C-
terminus.154–156 Each fragment is numbered according by its proximity to their respective
terminus (Figure 1-7).

17
Figure 1-7. CID fragmentation of a polypeptide. Each position is labeled with its
corresponding b/y-ion notation. (A) Generic polypeptide structure overlaid with possible
CID fragmentation positions. (B) An alternative representation of MS/MS cleavage
patterns using the heptapeptide Pro-Glu-Pro-Thr-Ile-Asp-Glu.
As the fragmentation efficiency and other factors worsen with increasing
polypeptide length, proteins are often subjected to enzymatic proteolysis to produce
smaller peptides prior to MS/MS.157 This is termed the bottom-up MS approach.
Alternatively, it is also possible to perform MS/MS directly on intact proteins without
proteolysis, termed the top-down MS approach.158–160 Due to its high demands on
instrument performance and challenging data analysis, top-down MS is comparatively less
utilized. However, top-down MS experiments provide information not easily obtainable by
the bottom-up approach, such as combinatorial relationships between different PTMs. This
enables characterization of protein proteoforms, i.e. the specific molecular form of a
protein.161 In addition, top-down can probe individual proteoforms in a mixture (versus the
ensemble measurements inherent to the bottom-up approach).162–164
18
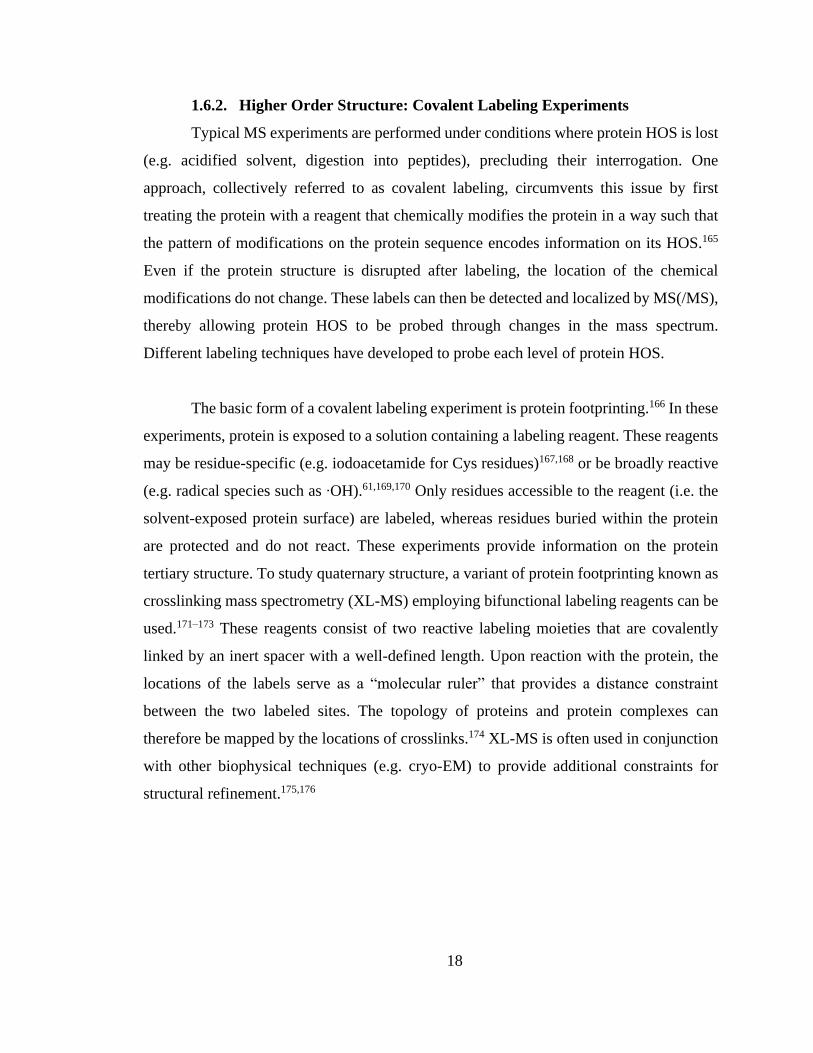
1.6.2. Higher Order Structure: Covalent Labeling Experiments
Typical MS experiments are performed under conditions where protein HOS is lost
(e.g. acidified solvent, digestion into peptides), precluding their interrogation. One
approach, collectively referred to as covalent labeling, circumvents this issue by first
treating the protein with a reagent that chemically modifies the protein in a way such that
the pattern of modifications on the protein sequence encodes information on its HOS.165
Even if the protein structure is disrupted after labeling, the location of the chemical
modifications do not change. These labels can then be detected and localized by MS(/MS),
thereby allowing protein HOS to be probed through changes in the mass spectrum.
Different labeling techniques have developed to probe each level of protein HOS.
The basic form of a covalent labeling experiment is protein footprinting.166 In these
experiments, protein is exposed to a solution containing a labeling reagent. These reagents
may be residue-specific (e.g. iodoacetamide for Cys residues)167,168 or be broadly reactive
(e.g. radical species such as ∙OH).61,169,170 Only residues accessible to the reagent (i.e. the
solvent-exposed protein surface) are labeled, whereas residues buried within the protein
are protected and do not react. These experiments provide information on the protein
tertiary structure. To study quaternary structure, a variant of protein footprinting known as
crosslinking mass spectrometry (XL-MS) employing bifunctional labeling reagents can be
used.171–173 These reagents consist of two reactive labeling moieties that are covalently
linked by an inert spacer with a well-defined length. Upon reaction with the protein, the
locations of the labels serve as a “molecular ruler” that provides a distance constraint
between the two labeled sites. The topology of proteins and protein complexes can
therefore be mapped by the locations of crosslinks.174 XL-MS is often used in conjunction
with other biophysical techniques (e.g. cryo-EM) to provide additional constraints for
structural refinement.175,176
19
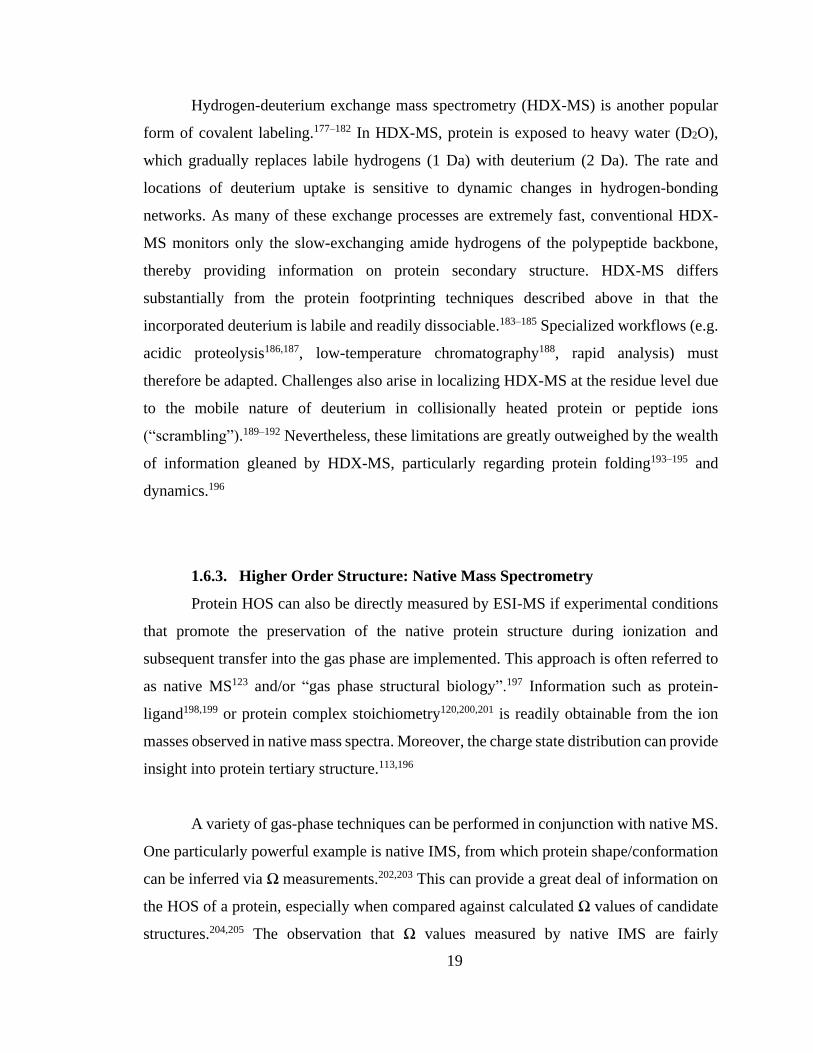
Hydrogen-deuterium exchange mass spectrometry (HDX-MS) is another popular
form of covalent labeling.177–182 In HDX-MS, protein is exposed to heavy water (D2O),
which gradually replaces labile hydrogens (1 Da) with deuterium (2 Da). The rate and
locations of deuterium uptake is sensitive to dynamic changes in hydrogen-bonding
networks. As many of these exchange processes are extremely fast, conventional HDX-
MS monitors only the slow-exchanging amide hydrogens of the polypeptide backbone,
thereby providing information on protein secondary structure. HDX-MS differs
substantially from the protein footprinting techniques described above in that the
incorporated deuterium is labile and readily dissociable.183–185 Specialized workflows (e.g.
acidic proteolysis186,187, low-temperature chromatography188, rapid analysis) must
therefore be adapted. Challenges also arise in localizing HDX-MS at the residue level due
to the mobile nature of deuterium in collisionally heated protein or peptide ions
(“scrambling”).189–192 Nevertheless, these limitations are greatly outweighed by the wealth
of information gleaned by HDX-MS, particularly regarding protein folding193–195 and
dynamics.196
1.6.3. Higher Order Structure: Native Mass Spectrometry
Protein HOS can also be directly measured by ESI-MS if experimental conditions
that promote the preservation of the native protein structure during ionization and
subsequent transfer into the gas phase are implemented. This approach is often referred to
as native MS123 and/or “gas phase structural biology”.197 Information such as protein-
ligand198,199 or protein complex stoichiometry120,200,201 is readily obtainable from the ion
masses observed in native mass spectra. Moreover, the charge state distribution can provide
insight into protein tertiary structure.113,196
A variety of gas-phase techniques can be performed in conjunction with native MS.
One particularly powerful example is native IMS, from which protein shape/conformation
can be inferred via Ω measurements.202,203 This can provide a great deal of information on
the HOS of a protein, especially when compared against calculated Ω values of candidate
structures.204,205 The observation that Ω values measured by native IMS are fairly
20
consistent with their condensed phase counterparts have bolstered the view that native-like
protein structures can be retained in the gas phase.206,207 Native IMS can also monitor
changes in Ω as a protein is unfolded in the gas phase, forming the basis of collision-
induced unfolding (CIU) experiments.208 In CIU, native protein ions are purposely
disrupted (e.g. by increasing energy in the collision cell). By plotting Ω as a function of
ion activation, these CIU profiles can be interpreted in an analogous manner to unfolding
curves in solution (e.g. monitored by CD spectroscopy), providing thermodynamic
information.
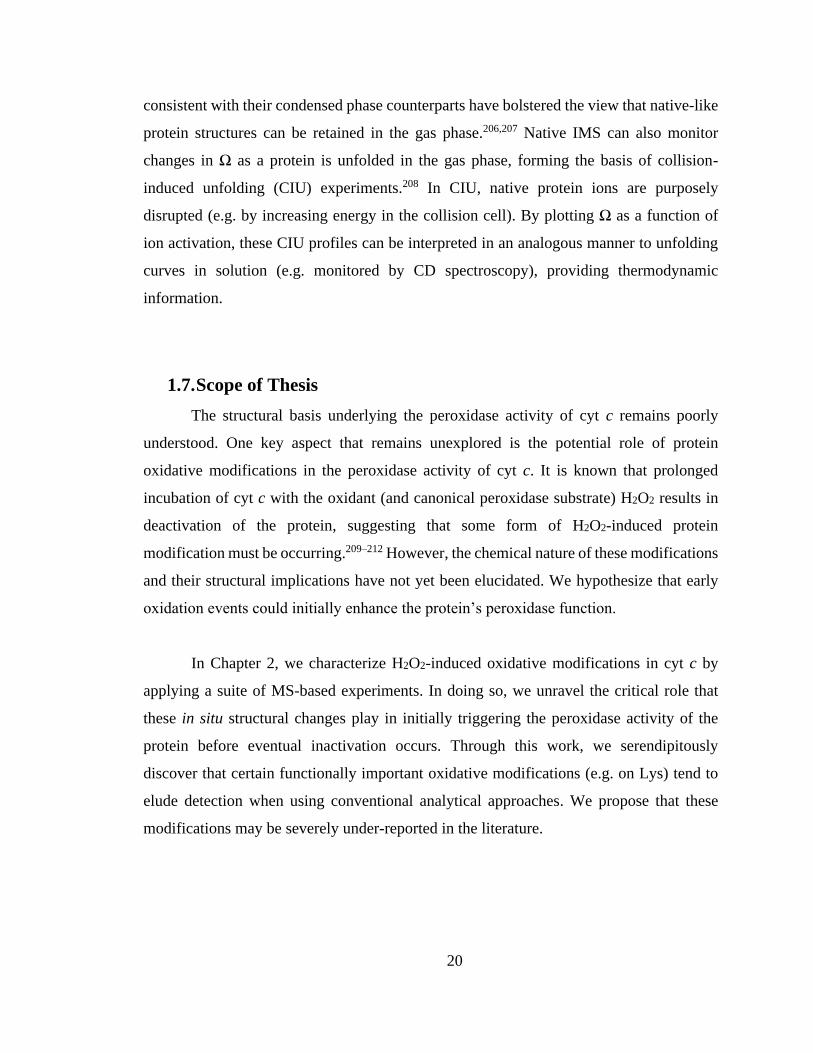
1.7. Scope of Thesis
The structural basis underlying the peroxidase activity of cyt c remains poorly
understood. One key aspect that remains unexplored is the potential role of protein
oxidative modifications in the peroxidase activity of cyt c. It is known that prolonged
incubation of cyt c with the oxidant (and canonical peroxidase substrate) H2O2 results in
deactivation of the protein, suggesting that some form of H2O2-induced protein
modification must be occurring.209–212 However, the chemical nature of these modifications
and their structural implications have not yet been elucidated. We hypothesize that early
oxidation events could initially enhance the protein’s peroxidase function.
In Chapter 2, we characterize H2O2-induced oxidative modifications in cyt c by
applying a suite of MS-based experiments. In doing so, we unravel the critical role that
these in situ structural changes play in initially triggering the peroxidase activity of the
protein before eventual inactivation occurs. Through this work, we serendipitously
discover that certain functionally important oxidative modifications (e.g. on Lys) tend to
elude detection when using conventional analytical approaches. We propose that these
modifications may be severely under-reported in the literature.
21
Chapter 3 explores this postulate by conducting studies on cyt c treated with
chloramine-T, a popular and purportedly well-characterized model system for peroxidase-
activated cyt c. We confirm that the previously unreported oxidation of Lys also occurs
here, and we uncover that this model system is actually a complex ensemble of structurally
(and functionally) distinct species that differ by the severity of oxidation.
Chapter 4 expands on the previous chapters by probing the causal factors
underpinning the production of specific oxidative modification products. We uncover the
role of heme-mediated catalysis in the formation of certain protein oxidative modifications
in cyt c, while other transformations proceed via direct interaction with the oxidant.
Chapter 5 utilizes oxidatively-modified cyt c to address the comparability of MS-
derived gas-phase stability measurements to their classical solution phase counterparts.
Unlike many other systems, we discover that oxidized cyt c shows divergent stability
behaviour, i.e. destabilization in solution vs. stabilization in the gas phase.
22
1.8. References
(1) Voet, D. V. 2nd ed.; John Wiley & Sons, 2004.
(2) Lesk, A. M. Oxford Press, 2001.
(3) Jeffery, C. J. Trends Genet. 2003, 19 (8), 415–417.
(4) Huberts, D. H. E. W.; van der Klei, I. J. Biochim. Biophys. Acta - Mol. Cell Res.
2010, 1803 (4), 520–525.
(5) Margoliash, E. Proc. Natl. Acad. Sci. 1963, 50 (4), 672.
(6) Neupert, W. Annu. Rev. Biochem. 1997, 66 (1), 863–917.
(7) Bertini, I.; Gray, H. B.; Stiefel, E. I.; Valentine, J. S. University Science Books,
2007.
(8) Alvarez-Paggi, D.; Hannibal, L.; Castro, M. A.; Oviedo-Rouco, S.; Demicheli, V.;
Tórtora, V.; Tomasina, F.; Radi, R.; Murgida, D. H. Chem. Rev. 2017, 117 (21),
13382–13460.
(9) Radi, R.; Thomson, L.; Rubbo, H.; Prodanov, E. Arch. Biochem. Biophys. 1991,
288 (1), 112–117.
(10) Kagan, V. E.; Bayır, H. A.; Belikova, N. A.; Kapralov, O.; Tyurina, Y. Y.; Tyurin,
V. A.; Jiang, J.; Stoyanovsky, D. A.; Wipf, P.; Kochanek, P. M.; Greenberger, J. S.;
Pitt, B.; Shvedova, A. A.; Borisenko, G. Free Radic. Biol. Med. 2009, 46 (11),
1439–1453.
(11) Hüttemann, M.; Pecina, P.; Rainbolt, M.; Sanderson, T. H.; Kagan, V. E.; Samavati,
L.; Doan, J. W.; Lee, I. Mitochondrion 2011, 11 (3), 369–381.
(12) Hannibal, L.; Tomasina, F.; Capdevila, D. A.; Demicheli, V.; Tórtora, V.; Alvarez-
Paggi, D.; Jemmerson, R.; Murgida, D. H.; Radi, R. Biochemistry 2016, 55 (3),
407–428.
(13) Bushnell, G. W.; Louie, G. V.; Brayer, G. D. J. Mol. Biol. 1990, 214 (2), 585–595.
(14) Dunford, H. B. 2nd ed.; John Wiley & Sons: Hoboken, N.J, 2010.
(15) Kagan, V. E.; Tyurin, V. A.; Jiang, J.; Tyurina, Y. Y.; Ritov, V. B.; Amoscato, A.
A.; Osipov, A. N.; Belikova, N. A.; Kapralov, A. A.; Kini, V.; Vlasova, I. I.; Zhao,
Q.; Zou, M.; Di, P.; Svistunenko, D. A.; Kurnikov, I. V.; Borisenko, G. G. Nat.
Chem. Biol. 2005, 1 (4), 223–232.
(16) Liu, X.; Kim, C. N.; Yang, J.; Jemmerson, R.; Wang, X. Cell 1996, 86 (1), 147–
157.
23
(17) Li, P.; Nijhawan, D.; Budihardjo, I.; Srinivasula, S. M.; Ahmad, M.; Alnemri, E. S.;
Wang, X. Cell 1997, 91 (4), 479–489.
(18) Yu, X.; Acehan, D.; Menetret, J. F.; Booth, C. R.; Ludtke, S. J.; Riedl, S. J.; Shi,
Y.; Wang, X.; Akey, C. W. Structure 2005, 13 (11), 1725–1735.
(19) Acehan, D.; Jiang, X.; Morgan, D. G.; Heuser, J. E.; Wang, X.; Akey, C. W. Mol.
Cell 2002, 9 (2), 423–432.
(20) Mendez, D. L.; Akey, I. V.; Akey, C. W.; Kranz, R. G. Biochemistry 2017, 56 (22),
2766–2769.
(21) Barr, D. P.; Mason, R. P. J. Biol. Chem. 1995, 270 (21), 12709–12716.
(22) Aguila, S.; Vidal-Limon, A. M.; Alderete, J. B.; Sosa-Torres, M.; Vazquez-Duhalt,
R. J. Mol. Catal. B-Enzym. 2013, 85–86, 187–192.
(23) Cassina, A. M.; Hodara, R.; Souza, J. M.; Thomson, L.; Castro, L.; Ischiropoulos,
H.; Freeman, B. A.; Radi, R. J. Biol. Chem. 2000, 275 (28), 21409–21415.
(24) Chen, Y.-R.; Deterding, L. J.; Sturgeon, B. E.; Tomer, K. B.; Mason, R. P. J. Biol.
Chem. 2002, 277 (33), 29781–29791.
(25) Ying, T.; Wang, Z.-H.; Lin, Y.-W.; Xie, J.; Tan, X.; Huang, Z.-X. Chem. Commun.
2009, No. 30, 4512–4514.
(26) Garcia-Heredia, J. M.; Diaz-Quintana, A.; Salzano, M.; Orzaez, M.; Perez-Paya, E.;
Teixeira, M.; De la Rosa, M. A.; Diaz-Moreno, I. J. Biol. Inorg. Chem. 2011, 16
(8), 1155–1168.
(27) Capdevila, D. A.; Alvarez-Paggi, D.; Castro, M. A.; Tortora, V.; Demicheli, V.;
Estrin, D. A.; Radi, R.; Murgida, D. H. Chem. Commun. 2014, 50 (20), 2592–2594.
(28) Paul, S. S.; Sil, P.; Haldar, S.; Mitra, S.; Chattopadhyay, K. J. Biol. Chem. 2015,
290 (23), 14476–14490.
(29) Paul, S. S.; Sil, P.; Chakraborty, R.; Haldar, S.; Chattopadhyay, K. Biochemistry
2016.
(30) Godoy, L. C.; Muñoz-Pinedo, C.; Castro, L.; Cardaci, S.; Schonhoff, C. M.; King,
M.; Tórtora, V.; Marín, M.; Miao, Q.; Jiang, J. F.; Kapralov, A.; Jemmerson, R.;
Silkstone, G. G.; Patel, J. N.; Evans, J. E.; Wilson, M. T.; Green, D. R.; Kagan, V.
E.; Radi, R.; Mannick, J. B. Proc. Natl. Acad. Sci. 2009, 106 (8), 2653–2658.
(31) Belikova, N. A.; Vladimirov, Y. A.; Osipov, A. N.; Kapralov, A. A.; Tyurin, V. A.;
Potapovich, M. V.; Basova, L. V.; Peterson, J.; Kurnikov, I. V.; Kagan, V. E.
Biochemistry 2006, 45 (15), 4998–5009.

24
(32) Hanske, J.; Toffey, J. R.; Morenz, A. M.; Bonilla, A. J.; Schiavoni, K. H.; Pletneva,
E. V. Proc. Natl. Acad. Sci. 2012, 109 (1), 125–130.
(33) Ascenzi, P.; Coletta, M.; Wilson, M. T.; Fiorucci, L.; Marino, M.; Polticelli, F.;
Sinibaldi, F.; Santucci, R. IUBMB Life 2015, 67 (2), 98–109.
(34) Abriata, L. A.; Cassina, A.; Tortora, V.; Marin, M.; Souza, J. M.; Castro, L.; Vila,
A. J.; Radi, R. J. Biol. Chem. 2009, 284 (1), 17–26.
(35) Rosell, F. I.; Ferrer, J. C.; Mauk, A. G. J. Am. Chem. Soc. 1998, 120 (44), 11234–
11245.
(36) Assfalg, M.; Bertini, I.; Dolfi, A.; Turano, P.; Mauk, A. G.; Rosell, F. I.; Gray, H.
B. J. Am. Chem. Soc. 2003, 125 (10), 2913–2922.
(37) Zaidi, S.; Hassan, M. I.; Islam, A.; Ahmad, F. Cell. Mol. Life Sci. 2014, 71 (2), 229–
255.
(38) Amacher, J. F.; Zhong, F. F.; Lisi, G. P.; Zhu, M. Q.; Alden, S. L.; Hoke, K. R.;
Madden, D. R.; Pletneva, E. V. J. Am. Chem. Soc. 2015, 137 (26), 8435–8449.
(39) Karsisiotis, A. I.; Deacon, O. M.; Wilson, M. T.; Macdonald, C.; Blumenschein, T.
M. A.; Moore, G. R.; Worrall, J. A. R. Sci. Rep. 2016, 6, 30447.
(40) Deacon, O. M.; Karsisiotis, A. I.; Moreno-Chicano, T.; Hough, M. A.; Macdonald,
C.; Blumenschein, T. M. A.; Wilson, M. T.; Moore, G. R.; Worrall, J. A. R.
Biochemistry 2017, 56 (46), 6111–6124.
(41) Turrens, J. F. J. Physiol. 2003, 552 (2), 335–344.
(42) Murphy, M. P. Biochem. J. 2008, 417 (1), 1–13.
(43) Berlett, B. S.; Stadtman, E. R. J. Biol. Chem. 1997, 272 (33), 20313–20316.
(44) Fan, X.; Zhang, J.; Theves, M.; Strauch, C.; Nemet, I.; Liu, X.; Qian, J.; Giblin, F.
J.; Monnier, V. M. J. Biol. Chem. 2009, 284 (50), 34618–34627.
(45) de Graff, A. M. R.; Hazoglou, M. J.; Dill, K. A. Structure 2016, 24 (2), 329–336.
(46) Dalle-Donne, I.; Giustarini, D.; Colombo, R.; Rossi, R.; Milzani, A. Trends Mol.
Med. 2003, 9 (4), 169–176.
(47) Dalle-Donne, I.; Scaloni, A.; Giustarini, D.; Cavarra, E.; Tell, G.; Lungarella, G.;
Colombo, R.; Rossi, R.; Milzani, A. Mass Spectrom. Rev. 2005, 24 (1), 55–99.
(48) Sultana, R.; Boyd-Kimball, D.; Poon, H. F.; Cai, J.; Pierce, W. M.; Klein, J. B.;
Markesbery, W. R.; Zhou, X. Z.; Lu, K. P.; Butterfield, D. A. Neurobiol. Aging
2006, 27 (7), 918–925.

25
(49) Sevcsik, E.; Trexler, A. J.; Dunn, J. M.; Rhoades, E. J. Am. Chem. Soc. 2011, 133
(18), 7152–7158.
(50) Martins, D.; English, A. M. Redox Biol. 2014, 2, 632–639.
(51) Pedersen, J. T.; Chen, S. W.; Borg, C. B.; Ness, S.; Bahl, J. M.; Heegaard, N. H.
H.; Dobson, C. M.; Hemmingsen, L.; Cremades, N.; Teilum, K. J. Am. Chem. Soc.
2016, 138 (12), 3966–3969.
(52) Radi, R. Proc. Natl. Acad. Sci. 2018, 115 (23), 5839.
(53) Gray, H. B.; Winkler, J. R. Proc. Natl. Acad. Sci. 2015, 112 (35), 10920–10925.
(54) Kathiresan, M.; English, A. M. Chem. Sci. 2017, 8 (2), 1152–1162.
(55) Kathiresan, M.; English, A. M. J. Am. Chem. Soc. 2018, 140 (38), 12033–12039.
(56) Thannickal, V. J.; Fanburg, B. L. Am. J. Physiol.-Lung Cell. Mol. Physiol. 2000,
279 (6), L1005–L1028.
(57) Lee, J.-W.; Helmann, J. D. Nature 2006, 440 (7082), 363–367.
(58) Giorgio, M.; Trinei, M.; Migliaccio, E.; Pelicci, P. G. Nat. Rev. Mol. Cell Biol. 2007,
8 (9), 722–728.
(59) E. R. Stadtman. Annu. Rev. Biochem. 1993, 62 (1), 797–821.
(60) Levine, R. L.; Stadtman, E. R. Mol. Aging 2001, 36 (9), 1495–1502.
(61) Xu, G.; Chance, M. R. Chem. Rev. 2007, 107 (8), 3514–3543.
(62) Møller, I. M.; Rogowska-Wrzesinska, A.; Rao, R. S. P. J. Proteomics 2011, 74 (11),
2228–2242.
(63) Go, Y.-M.; Jones, D. P. Free Radic. Biol. Med. 2011, 50 (4), 495–509.
(64) Giulivi, C.; Davies, K. J. A. In Methods in Enzymology; Academic Press, 1994; Vol.
233, pp 363–371.
(65) Giulivi, C.; Davies, K. J. A. J. Biol. Chem. 2001, 276 (26), 24129–24136.
(66) Luo, S.; Wehr, N. B. Redox Rep. 2009, 14 (4), 159–166.
(67) Yan, L.-J. Curr. Protoc. Protein Sci. 2009, 56 (1), 14.4.1-14.4.28.
(68) Requena, J. R.; Chao, C.-C.; Levine, R. L.; Stadtman, E. R. Proc. Natl. Acad. Sci.
U. S. A. 2001, 98 (1), 69–74.
(69) Parson, W. W. Springer Berlin Heidelberg, 2015; pp 1-29.
26
(70) Greenfield, N. J. Nat. Protoc. 2006, 1 (6), 2876–2890.
(71) Beychok, S. Science 1966, 154 (3754), 1288.
(72) Sreerama, N.; Woody, R. W. In Methods in Enzymology; Academic Press, 2004;
Vol. 383, pp 318–351.
(73) Sreerama, N.; Woody, R. W. Anal. Biochem. 2000, 287 (2), 252–260.
(74) Greenfield, N. J. Nat. Protoc. 2006, 1 (6), 2527–2535.
(75) Becktel, W. J.; Schellman, J. A. Biopolymers 1987, 26 (11), 1859–1877.
(76) Swint, L.; Robertson, A. D. Protein Sci. 1993, 2 (12), 2037–2049.
(77) Lakowicz, J. R. Springer US, 2006; pp 1-26.
(78) Chen, Y.; Barkley, M. D. Biochemistry 1998, 37 (28), 9976–9982.
(79) Ghisaidoobe, A. B. T.; Chung, S. J. Int. J. Mol. Sci. 2014, 15 (12), 22518–22538.
(80) Yuan, T.; Weljie, A. M.; Vogel, H. J. Biochemistry 1998, 37 (9), 3187–3195.
(81) Gouterman, M. J. Mol. Spectrosc. 1961, 6, 138–163.
(82) Dolphin, D. Elsevier Science, 2012.
(83) Spiro, T. G. In Advances in Protein Chemistry; Anfinsen, C. B., Edsall, J. T.,
Richards, F. M., Eds.; Academic Press, 1985; Vol. 37, pp 111–159.
(84) Smulevich, G.; Mauro, J. M.; Fishel, L. A.; English, A. M.; Kraut, J.; Spiro, T. G.
Biochemistry 1988, 27 (15), 5477–5485.
(85) Cavanagh, J.; Fairbrother, W. J.; Palmer III, A. G.; Skelton, N. J. Elsevier, 1995.
(86) Grzesiek, S.; Bax, A. J. Am. Chem. Soc. 1992, 114 (16), 6291–6293.
(87) Grzesiek, S.; Bax, A. J. Magn. Reson. 1969 1992, 99 (1), 201–207.
(88) Marion, D.; Driscoll, P. C.; Kay, L. E.; Wingfield, P. T.; Bax, A.; Gronenborn, A.
M.; Clore, G. M. Biochemistry 1989, 28 (15), 6150–6156.
(89) Marion, D.; Kay, L. E.; Sparks, S. W.; Torchia, D. A.; Bax, A. J. Am. Chem. Soc.
1989, 111 (4), 1515–1517.
(90) Zuiderweg, E. R. P.; Fesik, S. W. Biochemistry 1989, 28 (6), 2387–2391.
(91) Bax, A. Annu. Rev. Biochem. 1989, 58 (1), 223–256.
27
(92) Cornilescu, G.; Delaglio, F.; Bax, A. J. Biomol. NMR 1999, 13 (3), 289–302.
(93) Drenth, J. Springer Science & Business Media, 2007.
(94) Smyth, M. S.; Martin, J. H. J. Mol. Pathol. 2000, 53 (1), 8.
(95) Ilari, A.; Savino, C. In Bioinformatics; Springer, 2008; pp 63–87.
(96) Frank, J. Oxford University Press, 2006.
(97) Frank, J. Q. Rev. Biophys. 2009, 42 (3), 139–158.
(98) Milne, J. L. S.; Borgnia, M. J.; Bartesaghi, A.; Tran, E. E. H.; Earl, L. A.; Schauder,
D. M.; Lengyel, J.; Pierson, J.; Patwardhan, A.; Subramaniam, S. FEBS J. 2013,
280 (1), 28–45.
(99) Patel, R. Clin. Chem. 2013, 59 (2), 340–342.
(100) Fenn, J.; Mann, M.; Meng, C.; Wong, S.; Whitehouse, C. Science 1989, 246 (4926),
64.
(101) Kaltashov, I. A.; Eyles, S. J. In Mass Spectrometry in Structural Biology and
Biophysics; John Wiley & Sons, Inc., 2012; pp 52–88.
(102) Konermann, L.; Vahidi, S.; Sowole, M. A. Anal. Chem. 2014, 86 (1), 213–232.
(103) Kebarle, P.; Verkerk, U. H. Mass Spectrom. Rev. 2009, 28 (6), 898–917.
(104) Konermann, L.; Ahadi, E.; Rodriguez, A. D.; Vahidi, S. Anal. Chem. 2013, 85 (1),
2–9.
(105) Konermann, L.; Metwally, H.; Duez, Q.; Peters, I. Analyst 2019, 144 (21), 6157–
6171.
(106) Cech, N. B.; Enke, C. G. Mass Spectrom. Rev. 2001, 20 (6), 362–387.
(107) Nguyen, S.; Fenn, J. B. Proc. Natl. Acad. Sci. 2007, 104 (4), 1111.
(108) Dole, M.; Mack, L. L.; Hines, R. L.; Mobley, R. C.; Ferguson, L. D.; Alice, M. B.
J. Chem. Phys. 1968, 49 (5), 2240–2249.
(109) McAllister, R. G.; Metwally, H.; Sun, Y.; Konermann, L. J. Am. Chem. Soc. 2015,
137 (39), 12667–12676.
(110) Rayleigh, Lord. Lond. Edinb. Dublin Philos. Mag. J. Sci. 1882, 14 (87), 184–186.
(111) Mirza, U. A.; Cohen, S. L.; Chait, B. T. Anal. Chem. 1993, 65 (1), 1–6.

28
(112) Konermann, L.; Rosell, F. I.; Mauk, A. G.; Douglas, D. J. Biochemistry 1997, 36
(21), 6448–6454.
(113) Konermann, L.; Douglas, D. J. Biochemistry 1997, 36 (40), 12296–12302.
(114) Konermann, L.; Rodriguez, A. D.; Liu, J. Anal. Chem. 2012, 84 (15), 6798–6804.
(115) Ahadi, E.; Konermann, L. J. Phys. Chem. B 2012, 116 (1), 104–112.
(116) Metwally, H.; Duez, Q.; Konermann, L. Anal. Chem. 2018, 90 (16), 10069–10077.
(117) Märk, T. D.; Dunn, G. H. Springer Vienna, 2013.
(118) El-Hawiet, A.; Kitova, E. N.; Liu, L.; Klassen, J. S. J. Am. Soc. Mass Spectrom.
2010, 21 (11), 1893–1899.
(119) Ishii, K.; Noda, M.; Uchiyama, S. Biophys. Physicobiology 2016, 13, 87–95.
(120) Heck, A. J. R.; van den Heuvel, R. H. H. Mass Spectrom. Rev. 2004, 23 (5), 368–
389.
(121) Hernández, H.; Robinson, C. V. Nat. Protoc. 2007, 2 (3), 715–726.
(122) Heck, A. J. R. Nat. Methods 2008, 5 (11), 927–933.
(123) Leney, A. C.; Heck, A. J. R. J. Am. Soc. Mass Spectrom. 2017, 28 (1), 5–13.
(124) Krutchinsky, A. N.; Chait, B. T. J. Am. Soc. Mass Spectrom. 2002, 13 (2), 129–134.
(125) Aebersold, R.; Goodlett, D. R. Chem. Rev. 2001, 101 (2), 269–296.
(126) Aebersold, R.; Mann, M. Nature 2003, 422 (6928), 198–207.
(127) Han, X.; Aslanian, A.; Yates, J. R. Anal. Tech. 2008, 12 (5), 483–490.
(128) Nilsson, T.; Mann, M.; Aebersold, R.; Yates, J. R.; Bairoch, A.; Bergeron, J. J. M.
Nat. Methods 2010, 7 (9), 681–685.
(129) McLafferty, F. W. Science 1981, 214 (4518), 280–287.
(130) Yost, R. A.; Enke, C. G. Anal. Chem. 1979, 51 (12), 1251–1264.
(131) March, R. E. J. Mass Spectrom. 1997, 32 (4), 351–369.
(132) Dawson, P. H. Elsevier, 2013.
(133) Dass, C. John Wiley & Sons, 2007; Vol. 16.
(134) Sleno, L.; Volmer, D. A. J. Mass Spectrom. 2004, 39 (10), 1091–1112.
29
(135) Dubois, F.; Knochenmuss, R.; Zenobi, R.; Brunelle, A.; Deprun, C.; Le Beyec, Y.
Rapid Commun. Mass Spectrom. 1999, 13 (9), 786–791.
(136) Morris, H. R.; Paxton, T.; Dell, A.; Langhorne, J.; Berg, M.; Bordoli, R. S.; Hoyes,
J.; Bateman, R. H. Rapid Commun. Mass Spectrom. 1996, 10 (8), 889–896.
(137) Shevchenko, A.; Chernushevich, I.; Ens, W.; Standing, K. G.; Thomson, B.; Wilm,
M.; Mann, M. Rapid Commun. Mass Spectrom. 1997, 11 (9), 1015–1024.
(138) Guilhaus, M. In Encyclopedia of Analytical Science (Second Edition); Worsfold, P.,
Townshend, A., Poole, C., Eds.; Elsevier: Oxford, 2005; pp 412–423.
(139) Mamyrin, B. A. Int. J. Mass Spectrom. 2001, 206 (3), 251–266.
(140) Thalassinos, K.; Slade, S. E.; Jennings, K. R.; Scrivens, J. H.; Giles, K.; Wildgoose,
J.; Hoyes, J.; Bateman, R. H.; Bowers, M. T. Spec. Issue Honour Dudley H Williams
2004, 236 (1), 55–63.
(141) Pringle, S. D.; Giles, K.; Wildgoose, J. L.; Williams, J. P.; Slade, S. E.; Thalassinos,
K.; Bateman, R. H.; Bowers, M. T.; Scrivens, J. H. Int. J. Mass Spectrom. 2007,
261 (1), 1–12.
(142) Giles, K.; Williams, J. P.; Campuzano, I. Rapid Commun. Mass Spectrom. 2011,
25 (11), 1559–1566.
(143) Giles, K.; Pringle, S. D.; Worthington, K. R.; Little, D.; Wildgoose, J. L.; Bateman,
R. H. Rapid Commun. Mass Spectrom. 2004, 18 (20), 2401–2414.
(144) Eiceman, G. A.; Karpas, Z.; Hill Jr, H. H. CRC press, 2013; pp 1-36.
(145) Bohrer, B. C.; Merenbloom, S. I.; Koeniger, S. L.; Hilderbrand, A. E.; Clemmer, D.
E. Annu. Rev. Anal. Chem. 2008, 1 (1), 293–327.
(146) McDaniel, E. W.; Mason, E. A. Wiley, 1988.
(147) Sun, Y.; Vahidi, S.; Sowole, M. A.; Konermann, L. J. Am. Soc. Mass Spectrom.
2016, 27 (1), 31–40.
(148) Hinnenkamp, V.; Klein, J.; Meckelmann, S. W.; Balsaa, P.; Schmidt, T. C.; Schmitz,
O. J. Anal. Chem. 2018, 90 (20), 12042–12050.
(149) Mann, M.; Højrup, P.; Roepstorff, P. Biol. Mass Spectrom. 1993, 22 (6), 338–345.
(150) Coon, J. J.; Syka, J. E. P.; Shabanowitz, J.; Hunt, D. F. BioTechniques 2005, 38 (4),
519–523.
(151) Witze, E. S.; Old, W. M.; Resing, K. A.; Ahn, N. G. Nat. Methods 2007, 4 (10),
798–806.
30
(152) Syka, J. E. P.; Coon, J. J.; Schroeder, M. J.; Shabanowitz, J.; Hunt, D. F. Proc. Natl.
Acad. Sci. U. S. A. 2004, 101 (26), 9528.
(153) Mitchell Wells, J.; McLuckey, S. A. In Methods in Enzymology; Academic Press,
2005; Vol. 402, pp 148–185.
(154) Roepstorff, P.; Fohlman, J. Biomed. Mass Spectrom. 1984, 11 (11), 601.
(155) Biemann, K. Methods Enzymol. 1990, 193, 886–887.
(156) Chu, I. K.; Siu, C.-K.; Lau, J. K.-C.; Tang, W. K.; Mu, X.; Lai, C. K.; Guo, X.;
Wang, X.; Li, N.; Xia, Y.; Kong, X.; Oh, H. B.; Ryzhov, V.; Tureček, F.; Hopkinson,
A. C.; Siu, K. W. M. Spec. Issue Biol. Cation Radic. Ion-Electron Ion-Ion Interact.
2015, 390, 24–27.
(157) Chait, B. T. Science 2006, 314 (5796), 65.
(158) Han, X.; Jin, M.; Breuker, K.; McLafferty, F. W. Science 2006, 314 (5796), 109.
(159) Chen, B.; Brown, K. A.; Lin, Z.; Ge, Y. Anal. Chem. 2018, 90 (1), 110–127.
(160) Lermyte, F.; Tsybin, Y. O.; O’Connor, P. B.; Loo, J. A. J. Am. Soc. Mass Spectrom.
2019, 30 (7), 1149–1157.
(161) Smith, L. M.; Kelleher, N. L.; Linial, M.; Goodlett, D.; Langridge-Smith, P.; Ah
Goo, Y.; Safford, G.; Bonilla*, L.; Kruppa, G.; Zubarev, R.; Rontree, J.; Chamot-
Rooke, J.; Garavelli, J.; Heck, A.; Loo, J.; Penque, D.; Hornshaw, M.; Hendrickson,
C.; Pasa-Tolic, L.; Borchers, C.; Chan, D.; Young*, N.; Agar, J.; Masselon, C.;
Gross*, M.; McLafferty, F.; Tsybin, Y.; Ge, Y.; Sanders*, I.; Langridge, J.;
Whitelegge*, J.; Marshall, A.; The Consortium for Top Down Proteomics. Nat.
Methods 2013, 10 (3), 186–187.
(162) Toby, T. K.; Fornelli, L.; Kelleher, N. L. Annu. Rev. Anal. Chem. 2016, 9 (1), 499–
519.
(163) Patrie, S. M. In Modern Proteomics – Sample Preparation, Analysis and Practical
Applications; Mirzaei, H., Carrasco, M., Eds.; Springer International Publishing:
Cham, 2016; pp 171–200.
(164) Schaffer, L. V.; Millikin, R. J.; Miller, R. M.; Anderson, L. C.; Fellers, R. T.; Ge,
Y.; Kelleher, N. L.; LeDuc, R. D.; Liu, X.; Payne, S. H.; Sun, L.; Thomas, P. M.;
Tucholski, T.; Wang, Z.; Wu, S.; Wu, Z.; Yu, D.; Shortreed, M. R.; Smith, L. M.
PROTEOMICS 2019, 19 (10), 1800361.
(165) Fabris, D.; Yu, E. T. J. Mass Spectrom. 2010, 45 (8), 841–860.
(166) Liu, X. R.; Zhang, M. M.; Gross, M. L. Chem. Rev. 2020, 120 (10), 4355–4454.

31
(167) Smythe, C. V. J. Biol. Chem. 1936, 114 (3), 601–612.
(168) Anson, M. L. J. Gen. Physiol. 1940, 23 (3), 321–331.
(169) Hambly, D. M.; Gross, M. L. J. Am. Soc. Mass Spectrom. 2005, 16 (12), 2057–
2063.
(170) Hambly, D.; Gross, M. Int. J. Mass Spectrom. 2007, 259 (1–3), 124–129.
(171) Leitner, A.; Walzthoeni, T.; Kahraman, A.; Herzog, F.; Rinner, O.; Beck, M.;
Aebersold, R. Mol. Amp Cell. Proteomics 2010, 9 (8), 1634.
(172) Leitner, A.; Faini, M.; Stengel, F.; Aebersold, R. Trends Biochem. Sci. 2016, 41 (1),
20–32.
(173) O’Reilly, F. J.; Rappsilber, J. Nat. Struct. Mol. Biol. 2018, 25 (11), 1000–1008.
(174) Liu, F.; Rijkers, D. T. S.; Post, H.; Heck, A. J. R. Nat. Methods 2015, 12 (12), 1179–
1184.
(175) Rappsilber, J. J. Struct. Biol. 2011, 173 (3), 530–540.
(176) Schmidt, C.; Urlaub, H. Curr. Opin. Struct. Biol. 2017, 46, 157–168.
(177) Hamuro, Y.; Coales, S. J.; Southern, M. R.; Nemeth-Cawley, J. F.; Stranz, D. D.;
Griffin, P. R. J. Biomol. Tech. JBT 2003, 14 (3), 171–182.
(178) Maier, C. S.; Deinzer, M. L. In Methods in Enzymology; Academic Press, 2005;
Vol. 402, pp 312–360.
(179) Wales, T. E.; Engen, J. R. Mass Spectrom. Rev. 2006, 25 (1), 158–170.
(180) Marcsisin, S. R.; Engen, J. R. Anal. Bioanal. Chem. 2010, 397 (3), 967–972.
(181) Konermann, L.; Pan, J.; Liu, Y.-H. Chem. Soc. Rev. 2011, 40 (3), 1224–1234.
(182) Masson, G. R.; Jenkins, M. L.; Burke, J. E. Expert Opin. Drug Discov. 2017, 12
(10), 981–994.
(183) Resing, K. A.; Hoofnagle, A. N.; Ahn, N. G. J. Am. Soc. Mass Spectrom. 1999, 10
(8), 685–702.
(184) Hoofnagle, A. N.; Resing, K. A.; Ahn, N. G. In MAP Kinase Signaling Protocols;
Seger, R., Ed.; Humana Press: Totowa, NJ, 2004; pp 283–298.
(185) Zhang, Z.; Smith, D. L. Protein Sci. 1993, 2 (4), 522–531.
(186) Rosa, J. J.; Richards, F. M. J. Mol. Biol. 1979, 133 (3), 399–416.

32
(187) Englander, J. J.; Rogero, J. R.; Englander, S. W. Anal. Biochem. 1985, 147 (1),
234–244.
(188) Wu, Y.; Engen, J. R.; Hobbins, W. B. J. Am. Soc. Mass Spectrom. 2006, 17 (2),
163–167.
(189) Jørgensen, T. J. D.; Gårdsvoll, H.; Ploug, M.; Roepstorff, P. J. Am. Chem. Soc.
2005, 127 (8), 2785–2793.
(190) McLafferty, F. W.; Guan, Z.; Haupts, U.; Wood, T. D.; Kelleher, N. L. J. Am. Chem.
Soc. 1998, 120 (19), 4732–4740.
(191) Ferguson, P. L.; Pan, J.; Wilson, D. J.; Dempsey, B.; Lajoie, G.; Shilton, B.;
Konermann, L. Anal. Chem. 2007, 79 (1), 153–160.
(192) Ferguson, P. L.; Konermann, L. Anal. Chem. 2008, 80 (11), 4078–4086.
(193) Pan, J.; Han, J.; Borchers, C. H.; Konermann, L. Anal. Chem. 2010, 82 (20), 8591–
8597.
(194) Englander, S. W.; Mayne, L.; Kan, Z.-Y.; Hu, W. Annu. Rev. Biophys. 2016, 45 (1),
135–152.
(195) Yao, Z.; Tito, P.; Robinson, C. V. In Methods in Enzymology; Academic Press,
2005; Vol. 402, pp 389–402.
(196) Eyles, S. J.; Kaltashov, I. A. Methods 2004, 34 (1), 88–99.
(197) Marcoux, J.; Robinson, C. V. Structure 2013, 21 (9), 1541–1550.
(198) Ganem, B.; Li, Y. T.; Henion, J. D. J. Am. Chem. Soc. 1991, 113 (16), 6294–6296.
(199) Katta, V.; Chait, B. T. J. Am. Chem. Soc. 1991, 113 (22), 8534–8535.
(200) Loo, J. A. J. Mass Spectrom. 1995, 30 (1), 180–183.
(201) Loo, J. A. Mass Spectrom. Rev. 1997, 16 (1), 1–23.
(202) Ruotolo, B. T.; Benesch, J. L. P.; Sandercock, A. M.; Hyung, S.-J.; Robinson, C.
V. Nat. Protoc. 2008, 3 (7), 1139–1152.
(203) Uetrecht, C.; Rose, R. J.; van Duijn, E.; Lorenzen, K.; Heck, A. J. R. Chem. Soc.
Rev. 2010, 39 (5), 1633–1655.
(204) Mesleh, M. F.; Hunter, J. M.; Shvartsburg, A. A.; Schatz, G. C.; Jarrold, M. F. J.
Phys. Chem. 1996, 100 (40), 16082–16086.
33
(205) Ewing, S. A.; Donor, M. T.; Wilson, J. W.; Prell, J. S. J. Am. Soc. Mass Spectrom.
2017, 28 (4), 587–596.
(206) Jurneczko, E.; Barran, P. E. Analyst 2011, 136 (1), 20–28.
(207) Lanucara, F.; Holman, S. W.; Gray, C. J.; Eyers, C. E. Nat. Chem. 2014, 6 (4), 281–
294.
(208) Dixit, S. M.; Polasky, D. A.; Ruotolo, B. T. Curr. Opin. Chem. Biol. 2018, 42, 93–
100.
(209) Florence, T. M. J. Inorg. Biochem. 1985, 23 (2), 131–141.
(210) Villegas, J. A.; Mauk, A. G.; Vazquez-Duhalt, R. Chem. Biol. 2000, 7 (4), 237–244.
(211) Kim, N. H.; Jeong, M. S.; Choir, S. Y.; Kang, J. H. Mol. Cells 2006, 22 (2), 220–
227.
(212) Stocks, B. B.; Konermann, L. J. Mol. Biol. 2010, 398 (2), 362–373.

34
Chapter 2. Elucidation of an H2O2-Induced, In Situ Activation
Mechanism of the Peroxidase Activity of Cytochrome c
2.1. Introduction
Cytochrome c (cyt c) is a highly conserved 12 kDa heme protein that transfers
electrons in the respiratory chain. Cyt c can also catalyze the H2O2-induced oxidation of a
wide range of substrates.1-3 This peroxidase activity has attracted considerable attention
due to its role during apoptosis (programmed cell death).4-9 A key apoptotic pathway
involves the production of H2O2 in mitochondria.10,11 Cyt c utilizes this H2O2 to catalyze
the oxidation of cardiolipin in the mitochondrial membrane.4,5,12-14 The damaged
membrane allows the release of pre-apoptotic factors into the cytoplasm, ultimately
resulting in cell death.4,6,7,15 Like other peroxidases,16-18 cyt c follows a mechanism where
H2O2 reacts with the Fe(III) resting state to produce “Compound I”, with a Fe(IV)=O heme
and an adjacent radical. Subsequent H abstraction from organic substrates regenerates the
resting state.19 Reactions of the newly formed radicals with O2 then yield stable oxidation
products.20,21 This cycle usually consumes external substrates, but it also oxidizes the
protein and causes gradual deactivation.22-25
Classical peroxidases have a five-coordinate heme, where the sixth (distal) site is
vacant or occupied by loosely bound water.16,18,26 This five-coordinate structure allows for
Fe-H2O2 interactions which are required for initiating the catalytic cycle.6,8,13,14,26-28 Native
cyt c is six-coordinate, with Met80 as distal ligand (Figure 2-1A).29 It thus seems
paradoxical that cyt c would be peroxidase-active.14,30-33 A possible explanation invokes
transiently formed five-coordinate conformers.2,33-40 Rupture of the distal Met80-Fe bond
by unfolding,8,37 chemical,2,31,32,35,41,42 or mutational6,14,28,30,36,41,43-45 modifications
enhances peroxidase activity.

35
The proximal His18-Fe contact in cyt c is quite robust, while the 70-85 loop is
flexible39 and allows various distal ligation scenarios.2,46 Basic pH produces “alkaline”
conformers with Lys72, 73 or 79 as distal ligand (Figure 2-1B).33,40,42,47,48 This transition
can be pushed into the neutral range by various means2,35,42,46,49 that include Tyr67
modifications.44,46,50 Similarly, cardiolipin binding13,51,52 causes displacement of Met80 by
Lys or His.12,34,53,54
It is counterintuitive that the aforementioned non-native conformers show enhanced
peroxidase activity, considering their apparent lack of a vacant sixth coordination site.6,13,26-
28,35,42,49,55 Once again, catalysis may be facilitated by transiently populated five-coordinate
forms.2,33-40 However, alkaline iron ligation by Lys is more stable than the native Met80-
Fe bond.31,35,39,46 Alkaline conformers should thus have a lower peroxidase activity than
native cyt c, which is opposite to the observed behavior.15,35,42,49,55,56 Overall, it remains
unclear why native cyt c and other six-coordinate variants possess apparent peroxidase
activity.
Figure 2-1. Cyt c crystal structures. The 70-85 Ω-loop is depicted in magenta, key residues
are highlighted in cyan, iron is displayed in red. (A) Native equine wild-type with Met80-
Fe ligation (PDB 1HRC).29 (B) Alkaline conformer with Lys73-Fe ligation (yeast
K72A/T78C/K79G/C102S, PDB 4Q5P.)35 (C) Distally de-ligated form (yeast
K72A/C102S, PDB 4MU8).14
36
Some catalyzed reactions (unrelated to peroxidases) exhibit an initial lag phase.
Such behavior can have different mechanistic origins, but it often reflects the in situ
activation of a pre-catalyst.57-59 Intriguingly, a lag phase is also seen for cyt c-catalyzed
peroxidase reactions.14,40,60 The possible implications of this phenomenon have received
surprisingly little attention. Cyt c kinetic analyses usually discard lag phase data, while
focusing on the subsequent steady-state regime.14,44,54,61 Contrary to prevailing views, there
is a possibility that native cyt c does not exhibit substantial peroxidase activity, and that a
potent peroxidase is formed only after H2O2-induced modifications. Such activated cyt c
would likely be five-coordinate, as seen in certain peroxidase-enhanced mutants (Figure
2-1C).14 The occurrence of an H2O2-induced activation step would imply that
investigations conducted in the absence of H2O2 are unsuitable for deciphering the
properties of peroxidase-active cyt c.
Here we address the issues outlined above by performing time-resolved
experiments on the consequences of H2O2-cyt c interactions. We interrogate H2O2-induced
structural changes by coupling catalase quenching assays with spectroscopic techniques,
as well as mass spectrometry (MS)-based peptide mapping, covalent labeling, and top-
down assays. Our data suggest that unmodified cyt c exhibits minimal peroxidase activity.
H2O2 causes highly selective covalent modifications that produce five-coordinate
proteoforms with enhanced peroxidase activity. These findings resolve the apparent
structure-function mismatch by uncovering a previously unrecognized H2O2-induced
activation process.

37
2.2. Materials and Methods
2.2.1. Materials.
Horse heart ferri-cyt c, guaiacol (o-methoxyphenol)62, chloramine-T (N-chloro-4-
toluol-sulfonamide)63, and Girard’s reagent T (GRT, carboxymethyl-trimethylammonium-
hydrazide chloride)64 were from Sigma (St. Louis, MO). Unless specified otherwise,
solutions contained 10 μM cyt c in 65 mM aqueous potassium phosphate buffer at pH 7.4.
The H2O2 concentration employed here (500 M, unless noted otherwise) falls within the
range used for earlier assays14,40,60 and is physiologically relevant as the mitochondrial
H2O2 concentration can reach ~10-4 M at the onset of apoptosis.11 All experiments were
conducted at 22 2 C.
2.2.2. Optical Spectroscopy.
UV-Vis spectra were acquired on a Cary-100 instrument (Varian, Mississauga, ON).
For measurements at 695 nm the protein concentration was raised to 40 μM. Peroxidase
kinetics were measured by tracking the oxidation of 9 mM guaiacol in the presence of 1
μM cyt c. Reaction rates (μM guaiacol oxidized s-1) were determined62 with ε470 = 26.6
mM-1 cm-1 for the tetraguaiacol product. Circular dichroism (CD) spectra were recorded on
a J-810 spectropolarimeter (JASCO, Easton, MD). For probing H2O2-induced structural
changes, UV-Vis data were recorded on-line (20 s per spectrum). CD scans were slower
(~20 min per spectrum), requiring quenching of the samples with 0.1 μM catalase prior to
data acquisition.
2.2.3. Protein Samples.
For MS, 100 μL aliquots were removed from the reaction mixture at selected time
points, followed by catalase quenching. NMR samples were prepared identically, but in
D2O. In addition, NMR samples were concentrated to 100 μM using 10 kDa MWCO
centrifuge filters (Millipore, Etobicoke, ON). Carbonyl labeling was performed by
incubating 10 μM cyt c in buffer with 80 mM GRT65 for 3 hours at room temperature. The
reaction was halted by exchange into GRT-free buffer using 10 kDa MWCO filters.
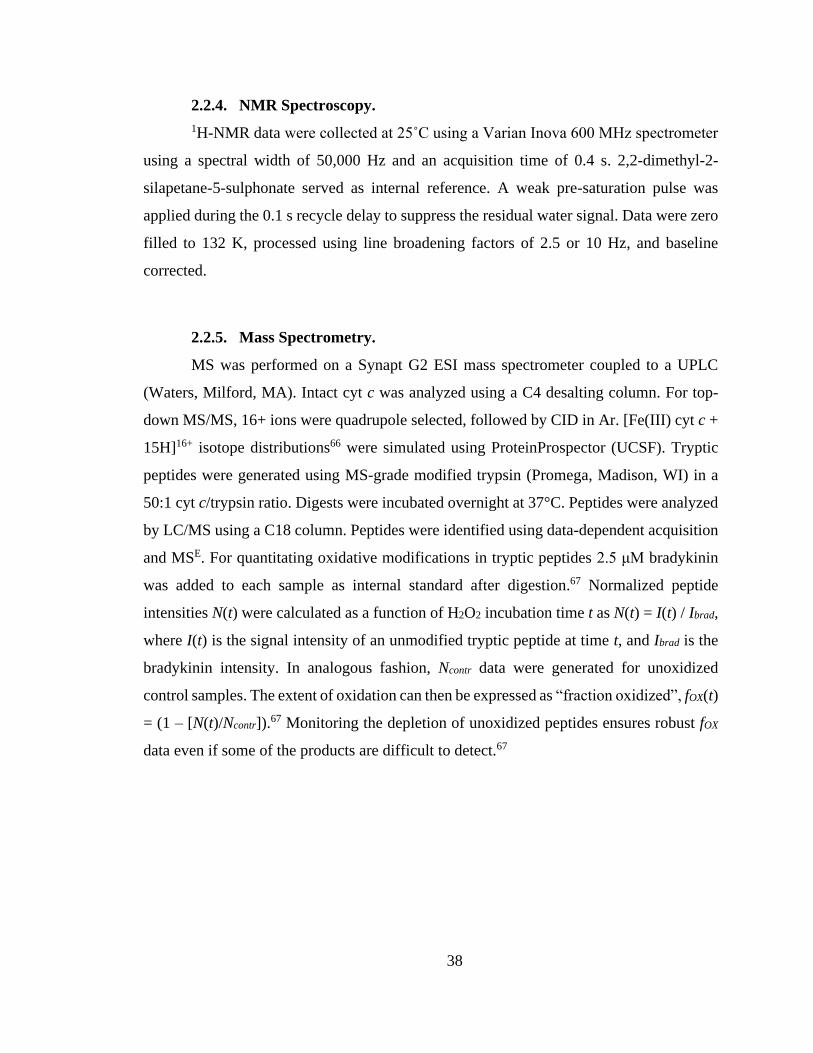
38
2.2.4. NMR Spectroscopy.
1H-NMR data were collected at 25˚C using a Varian Inova 600 MHz spectrometer
using a spectral width of 50,000 Hz and an acquisition time of 0.4 s. 2,2-dimethyl-2-
silapetane-5-sulphonate served as internal reference. A weak pre-saturation pulse was
applied during the 0.1 s recycle delay to suppress the residual water signal. Data were zero
filled to 132 K, processed using line broadening factors of 2.5 or 10 Hz, and baseline
corrected.
2.2.5. Mass Spectrometry.
MS was performed on a Synapt G2 ESI mass spectrometer coupled to a UPLC
(Waters, Milford, MA). Intact cyt c was analyzed using a C4 desalting column. For top-
down MS/MS, 16+ ions were quadrupole selected, followed by CID in Ar. [Fe(III) cyt c +
15H]16+ isotope distributions66 were simulated using ProteinProspector (UCSF). Tryptic
peptides were generated using MS-grade modified trypsin (Promega, Madison, WI) in a
50:1 cyt c/trypsin ratio. Digests were incubated overnight at 37°C. Peptides were analyzed
by LC/MS using a C18 column. Peptides were identified using data-dependent acquisition
and MSE. For quantitating oxidative modifications in tryptic peptides 2.5 μM bradykinin
was added to each sample as internal standard after digestion.67 Normalized peptide
intensities N(t) were calculated as a function of H2O2 incubation time t as N(t) = I(t) / Ibrad,
where I(t) is the signal intensity of an unmodified tryptic peptide at time t, and Ibrad is the
bradykinin intensity. In analogous fashion, Ncontr data were generated for unoxidized
control samples. The extent of oxidation can then be expressed as “fraction oxidized”, fOX(t)
= (1 – [N(t)/Ncontr]).67 Monitoring the depletion of unoxidized peptides ensures robust fOX
data even if some of the products are difficult to detect.67
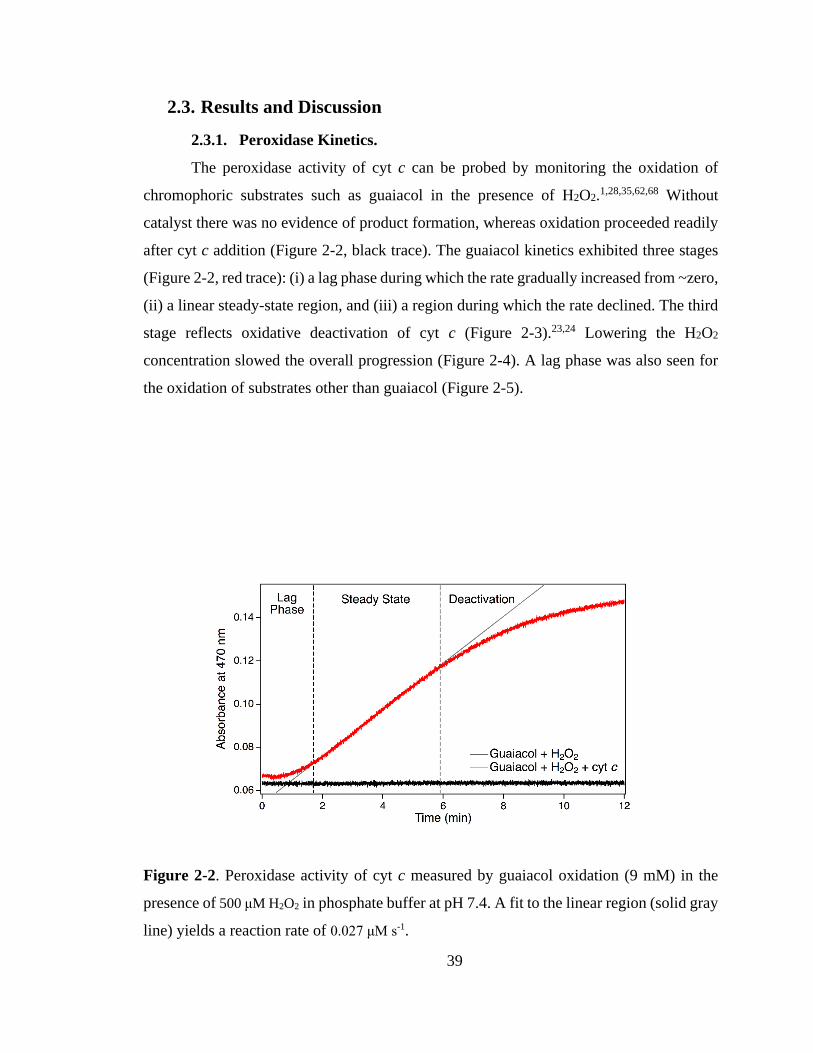
39
2.3. Results and Discussion
2.3.1. Peroxidase Kinetics.
The peroxidase activity of cyt c can be probed by monitoring the oxidation of
chromophoric substrates such as guaiacol in the presence of H2O2.1,28,35,62,68 Without
catalyst there was no evidence of product formation, whereas oxidation proceeded readily
after cyt c addition (Figure 2-2, black trace). The guaiacol kinetics exhibited three stages
(Figure 2-2, red trace): (i) a lag phase during which the rate gradually increased from ~zero,
(ii) a linear steady-state region, and (iii) a region during which the rate declined. The third
stage reflects oxidative deactivation of cyt c (Figure 2-3).23,24 Lowering the H2O2
concentration slowed the overall progression (Figure 2-4). A lag phase was also seen for
the oxidation of substrates other than guaiacol (Figure 2-5).
Figure 2-2. Peroxidase activity of cyt c measured by guaiacol oxidation (9 mM) in the
presence of 500 μM H2O2 in phosphate buffer at pH 7.4. A fit to the linear region (solid gray
line) yields a reaction rate of 0.027 μM s-1.
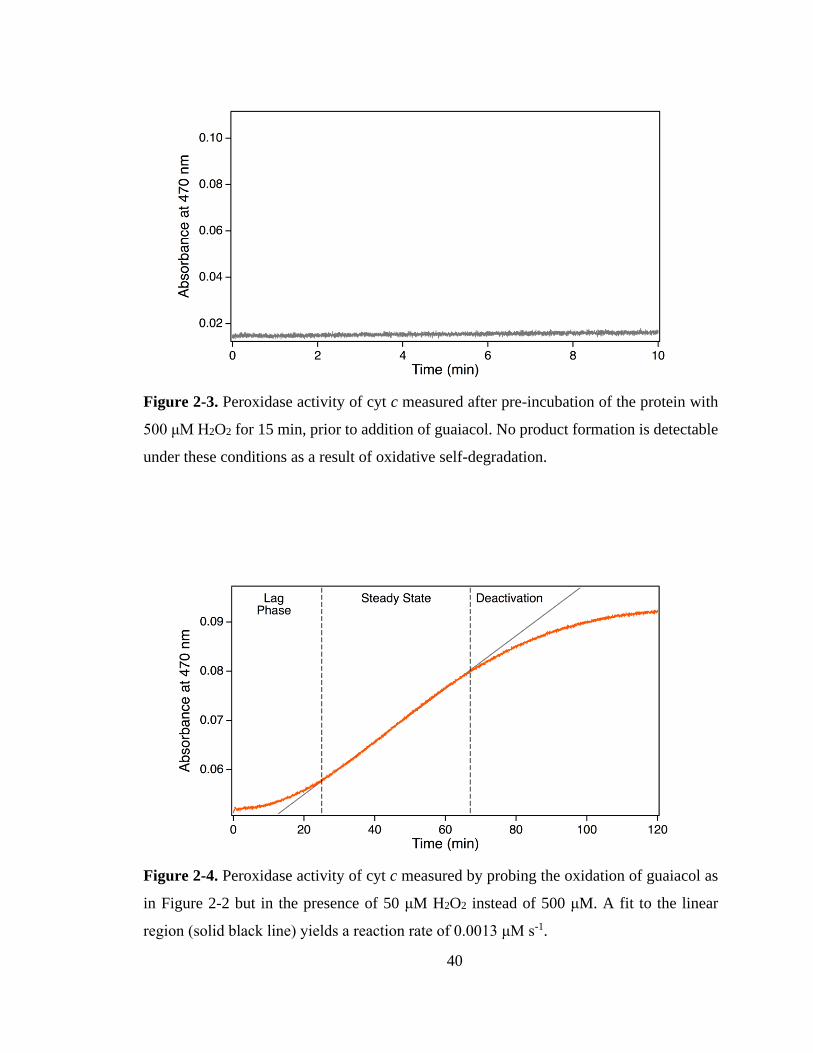
40
Figure 2-3. Peroxidase activity of cyt c measured after pre-incubation of the protein with
500 μM H2O2 for 15 min, prior to addition of guaiacol. No product formation is detectable
under these conditions as a result of oxidative self-degradation.
Figure 2-4. Peroxidase activity of cyt c measured by probing the oxidation of guaiacol as
in Figure 2-2 but in the presence of 50 μM H2O2 instead of 500 μM. A fit to the linear
region (solid black line) yields a reaction rate of 0.0013 μM s-1.

41
Figure 2-5. Peroxidase activity of cyt c probed by fluorescence bleaching of 10 M
rhodamine 6G (R6G) in the presence of 500 μM H2O2. A three-stage kinetic progression
similar to that of guaiacol is observed (see Figure 2-2). Fluorescence experiments were
performed on a Fluorolog-3 fluorimeter (Horiba Jobin Yvon; Edison, NJ), using an
excitation wavelength of 526 nm, and an emission wavelength of 555 nm.
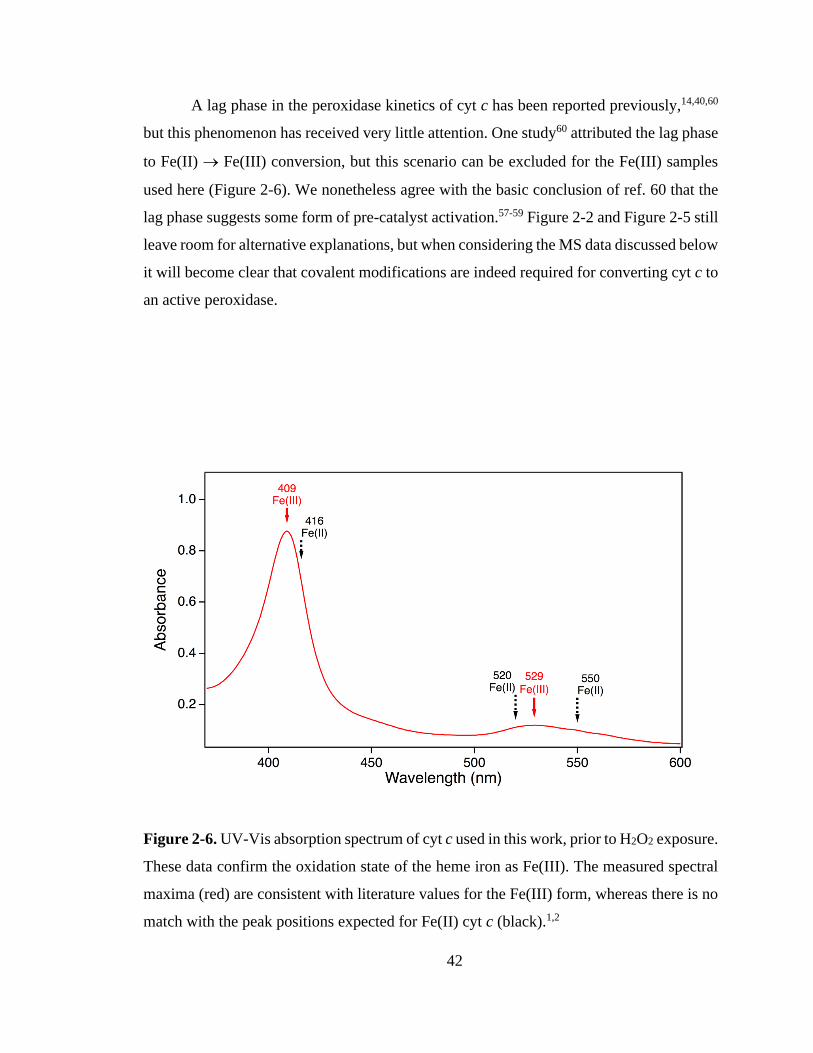
42
A lag phase in the peroxidase kinetics of cyt c has been reported previously,14,40,60
but this phenomenon has received very little attention. One study60 attributed the lag phase
to Fe(II) → Fe(III) conversion, but this scenario can be excluded for the Fe(III) samples
used here (Figure 2-6). We nonetheless agree with the basic conclusion of ref. 60 that the
lag phase suggests some form of pre-catalyst activation.57-59 Figure 2-2 and Figure 2-5 still
leave room for alternative explanations, but when considering the MS data discussed below
it will become clear that covalent modifications are indeed required for converting cyt c to
an active peroxidase.
Figure 2-6. UV-Vis absorption spectrum of cyt c used in this work, prior to H2O2 exposure.
These data confirm the oxidation state of the heme iron as Fe(III). The measured spectral
maxima (red) are consistent with literature values for the Fe(III) form, whereas there is no
match with the peak positions expected for Fe(II) cyt c (black).1,2

43
2.3.2. Spectroscopic Evidence for H2O2-Induced Structural Changes.
Upon exposing cyt c to H2O2 the CD amplitude at 222 nm decreased by ~30%
within 20 min, implying a loss in -helicity (Figure 2-7A).69 A Soret shift from 409 nm to
406 nm indicated alterations in the heme environment, while a declining Soret intensity
was caused by heme degradation (Figure 2-7B).23,24,70,71 Disappearance of the 695 nm band
(A695)72 revealed rupture of the Met80-Fe bond (Figure 2-7C). A695 declined more
rapidly than the Soret peak, implying that the loss of Met80 ligation is triggered by events
other than heme degradation.
An important question is whether the loss of Met80 ligation is followed by the
formation of alternative distal contacts. 1H-NMR allows fingerprinting the Fe environment
due to paramagnetic proton shifts.40,42,46,73,74 After 5 min in H2O2 several 1H signals
associated with native cyt c had significantly dropped in intensity, including those of Met80
(Figure 2-8). This matches the UV-Vis-detected loss of Met80-Fe ligation (Figure 2-7C).
The NMR spectra provided no evidence for alternative Fe ligation scenarios, e.g. distal Lys
contacts would cause conspicuous peaks in the 12-25 ppm range.46,74 No such signals were
apparent in our NMR data, nor was there evidence that other ligands replace Met80. It is
concluded that H2O2 triggers the formation of conformers with a vacant sixth coordination
site. Considering that peroxidases require a five-coordinate heme,6,8,13,14,26-28 our
spectroscopic data strongly suggest that the peroxidase activity of cyt c arises from five-
coordinate species produced in the presence of H2O2.
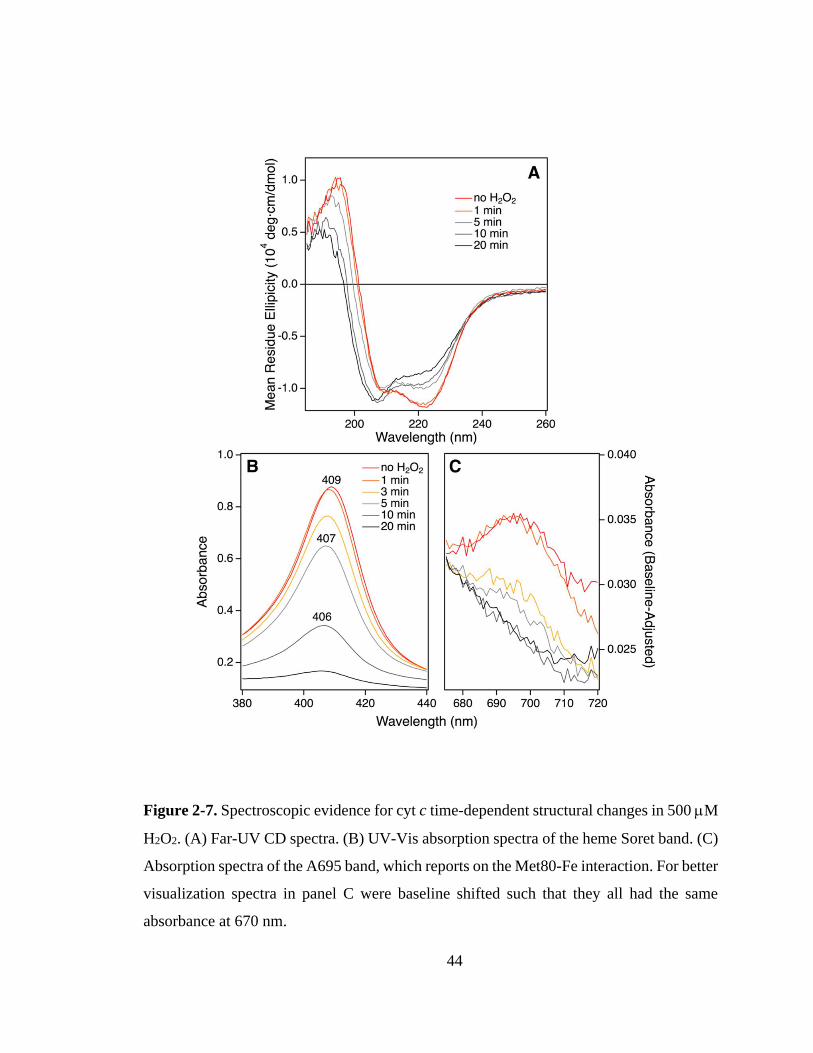
44
Figure 2-7. Spectroscopic evidence for cyt c time-dependent structural changes in 500 M
H2O2. (A) Far-UV CD spectra. (B) UV-Vis absorption spectra of the heme Soret band. (C)
Absorption spectra of the A695 band, which reports on the Met80-Fe interaction. For better
visualization spectra in panel C were baseline shifted such that they all had the same
absorbance at 670 nm.
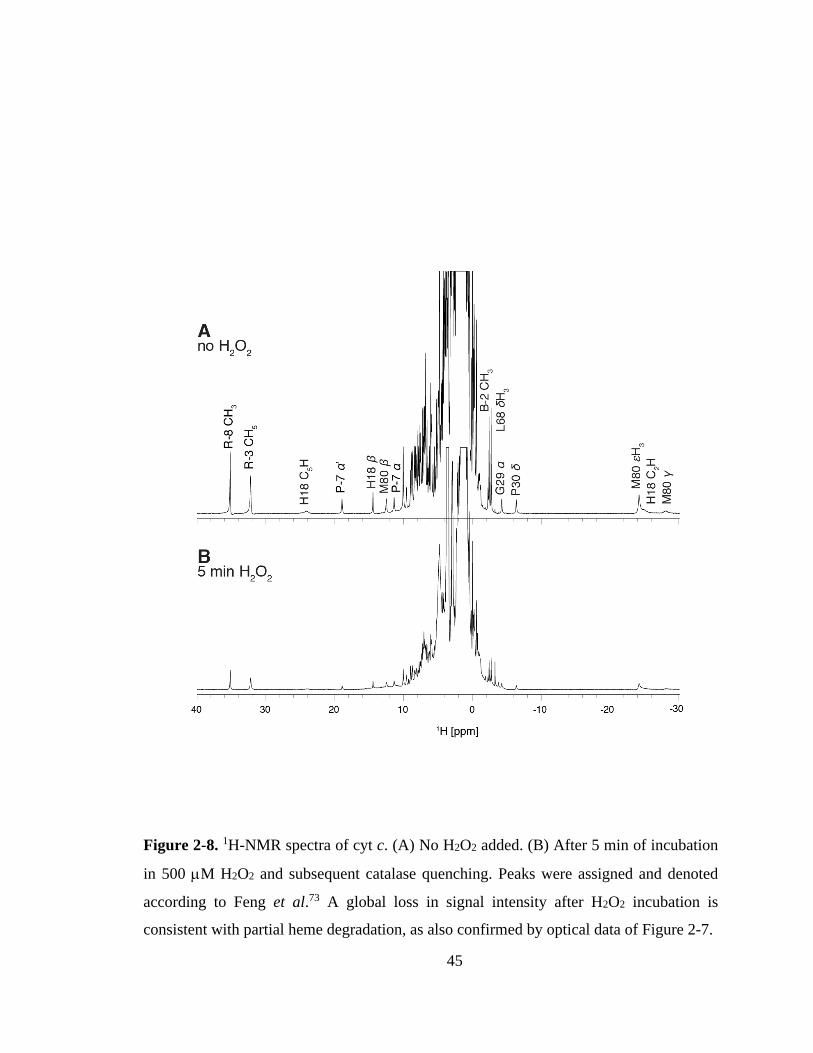
45
Figure 2-8. 1H-NMR spectra of cyt c. (A) No H2O2 added. (B) After 5 min of incubation
in 500 M H2O2 and subsequent catalase quenching. Peaks were assigned and denoted
according to Feng et al.73 A global loss in signal intensity after H2O2 incubation is
consistent with partial heme degradation, as also confirmed by optical data of Figure 2-7.

46
2.3.3. H2O2-Induced Modifications Probed by Mass Spectrometry.
Intact protein mass spectra acquired during H2O2 incubation revealed a gradually
declining signal amplitude (Figure 2-9A-D), concomitant with dramatic peak broadening
(Figure 2-9E-H). The t = 0 spectrum displayed a single major isotope distribution
corresponding to unmodified cyt c, denoted as “M0” in Figure 2-9E. After 10 min the mass
distribution was split into numerous signals, arising from covalent oxidative modifications
(M1, M2, M3, ..., Figure 2-9F-H). The spacing between successive Mi species
corresponded to mass differences of 14 - 16 Da. Similar patterns have previously been
reported for other proteins after exposure to different types of oxidants.22,32,75,76
Figure 2-9. (A-D): Cyt c mass spectra acquired after varying H2O2 incubation times. (E-
H): 16+ charge state region. M0 denotes unmodified protein. M1, M2, .... refers to
oxidatively modified forms. Protein (10 μM) and H2O2 (500 M) were incubated in
phosphate buffer at pH 7.4.

47
2.3.4. Peptide Mapping of Oxidation Patterns.
LC-MS was applied to monitor H2O2-induced modifications via analyses of tryptic
peptides. The resulting fOX data (Figure 2-10) were visualized as color maps (Figure 2-11).
T13-T15 (residues 61-79) consistently stood out as the most heavily oxidized region. This
region covers the distal side of the heme, i.e. the catalytically active region. Considering
the critical role of the Met80-Fe bond for catalytic activity,8,32,41,56,77 it might have been
expected that the Met-80 containing T16 would be most strongly oxidized. However, T16
generally showed lower fOX than T13-T15 (Figure 2-11).
H2O2-induced modifications were further characterized by subjecting tryptic
peptides to tandem MS (Figure 2-12). Detected oxidation sites included Tyr48 (+16),
Trp58 (+16,+32), Met80 (+16,+32) and a +32 Da shift within residues 33-35 (His-Gly-
Leu). T5 could not be probed due to the heterogeneity of heme degradation
products.23,24,70,71 Surprisingly, we were unable to detect T13-T15 oxidation products after
cyt c incubation in H2O2. Chymotrypsin and GluC were tested as alternative proteases, but
the results were inconclusive (data not shown). Oxidized T13-T15 peptides were readily
observable after alternative treatments were performed as controls (Figure 2-13). This
implies that H2O2 causes specific T13-T15 modifications that interfere with MS detection.
The nature of these modifications will be discussed below.
The H2O2-induced oxidation patterns of Figure 2-11 are very different from those
observed after exposing cyt c to free OH in bulk solution.78 In the latter case, oxidation
primarily affects solvent-accessible residues.20 In contrast, modifications formed under the
conditions of the current work are heme-catalyzed,19 such that buried sites adjacent to the
porphyrin are particularly prone to oxidation.22-25 Free OH is not involved in these
peroxidase processes.19
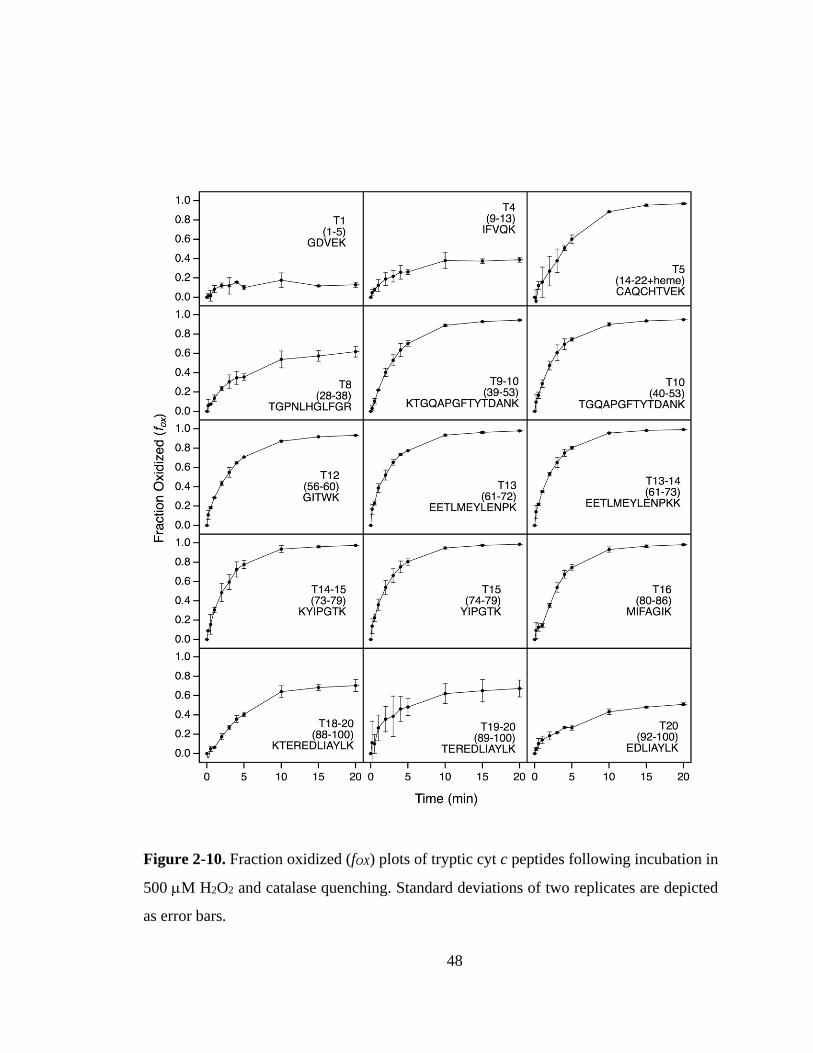
48
Figure 2-10. Fraction oxidized (fOX) plots of tryptic cyt c peptides following incubation in
500 M H2O2 and catalase quenching. Standard deviations of two replicates are depicted
as error bars.
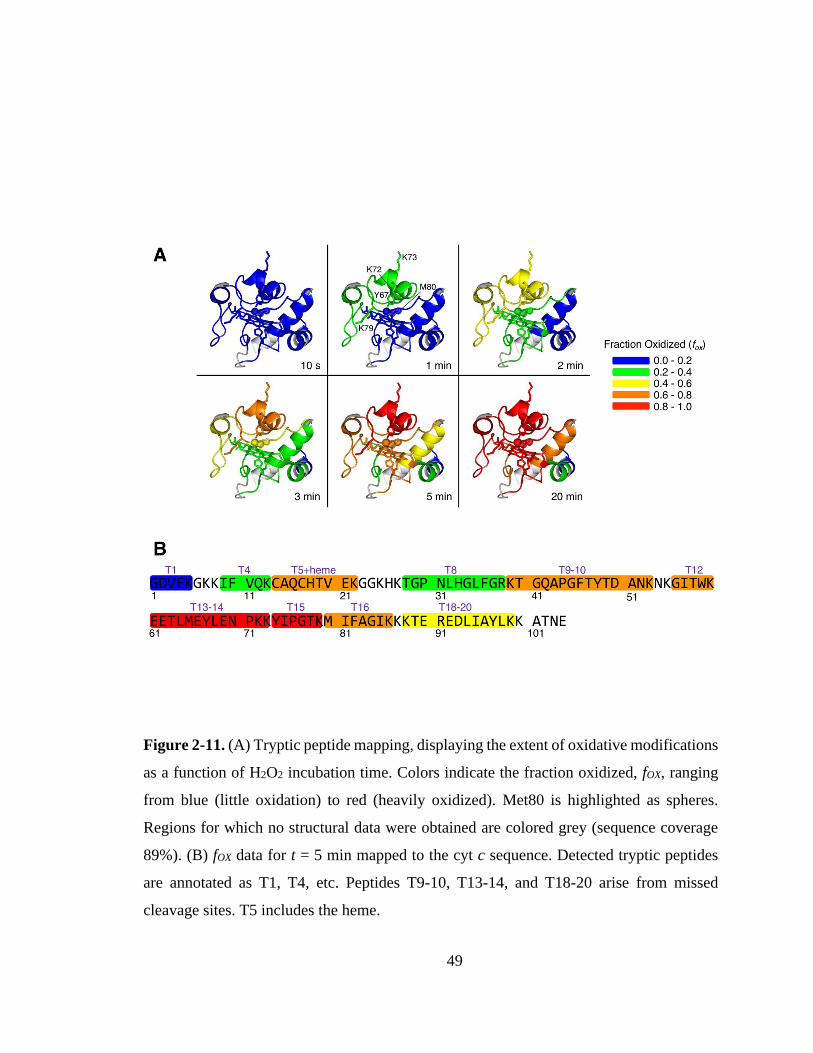
49
Figure 2-11. (A) Tryptic peptide mapping, displaying the extent of oxidative modifications
as a function of H2O2 incubation time. Colors indicate the fraction oxidized, fOX, ranging
from blue (little oxidation) to red (heavily oxidized). Met80 is highlighted as spheres.
Regions for which no structural data were obtained are colored grey (sequence coverage
89%). (B) fOX data for t = 5 min mapped to the cyt c sequence. Detected tryptic peptides
are annotated as T1, T4, etc. Peptides T9-10, T13-14, and T18-20 arise from missed
cleavage sites. T5 includes the heme.

50
Figure 2-12. Representative tandem mass spectra of tryptic peptides, illustrating the
identification of oxidation sites. MS/MS data of oxidized peptides were obtained after 30
min of cyt c incubation in 500 M H2O2, followed by tryptic digestion. (A) Unmodified
T15. (B) T15 oxidized at Met80 (MetO formation, +16 Da, bold/underlined). (C)
Unmodified T9-10. (D) T9-10 oxidized at Tyr48 (+16 Da, bold/underlined).
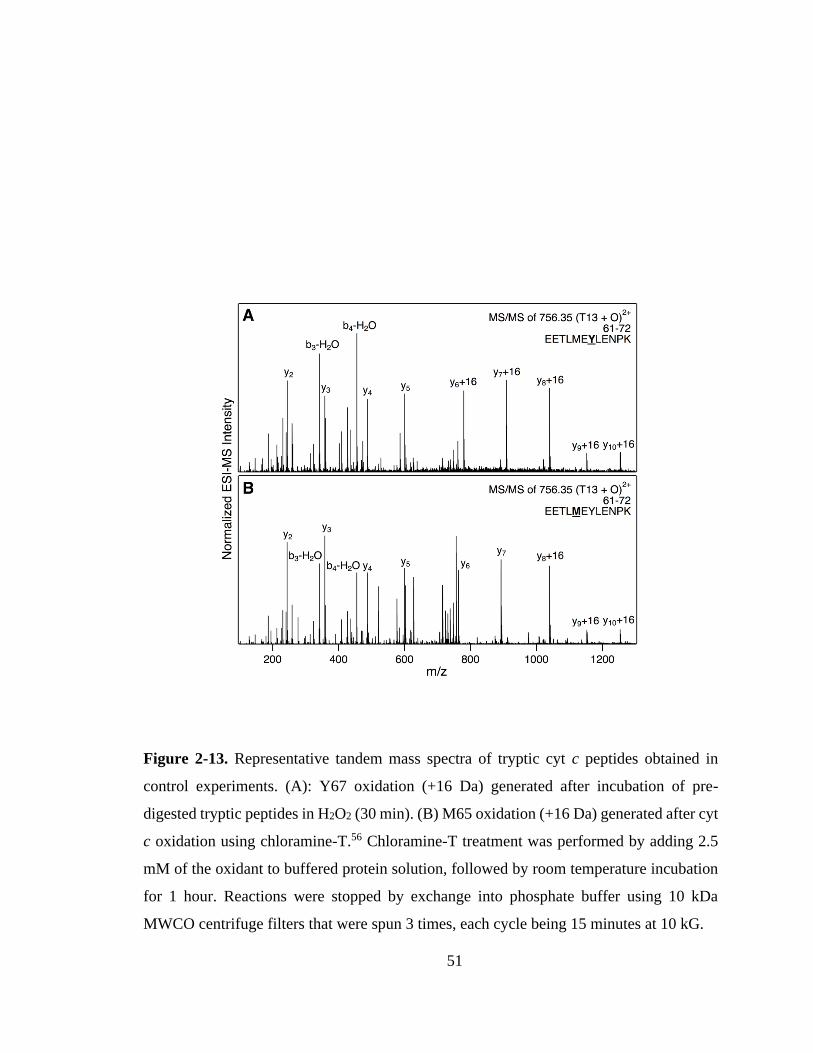
51
Figure 2-13. Representative tandem mass spectra of tryptic cyt c peptides obtained in
control experiments. (A): Y67 oxidation (+16 Da) generated after incubation of pre-
digested tryptic peptides in H2O2 (30 min). (B) M65 oxidation (+16 Da) generated after cyt
c oxidation using chloramine-T.56 Chloramine-T treatment was performed by adding 2.5
mM of the oxidant to buffered protein solution, followed by room temperature incubation
for 1 hour. Reactions were stopped by exchange into phosphate buffer using 10 kDa
MWCO centrifuge filters that were spun 3 times, each cycle being 15 minutes at 10 kG.
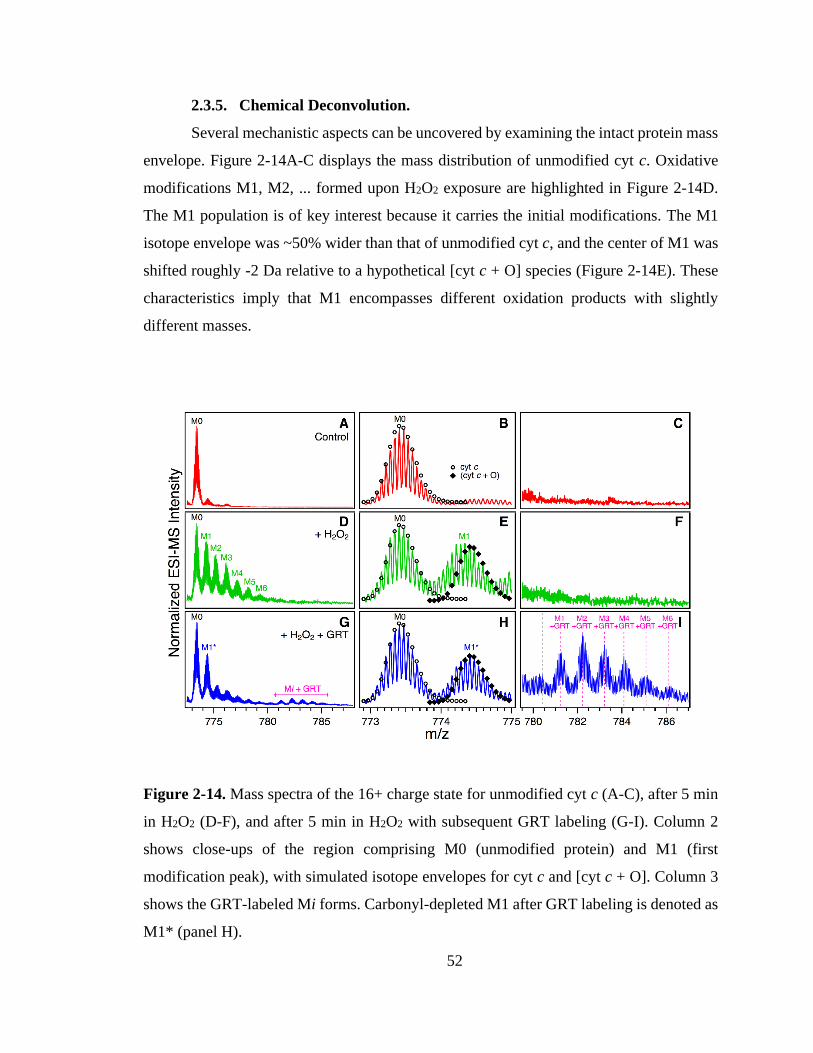
52
2.3.5. Chemical Deconvolution.
Several mechanistic aspects can be uncovered by examining the intact protein mass
envelope. Figure 2-14A-C displays the mass distribution of unmodified cyt c. Oxidative
modifications M1, M2, ... formed upon H2O2 exposure are highlighted in Figure 2-14D.
The M1 population is of key interest because it carries the initial modifications. The M1
isotope envelope was ~50% wider than that of unmodified cyt c, and the center of M1 was
shifted roughly -2 Da relative to a hypothetical [cyt c + O] species (Figure 2-14E). These
characteristics imply that M1 encompasses different oxidation products with slightly
different masses.
Figure 2-14. Mass spectra of the 16+ charge state for unmodified cyt c (A-C), after 5 min
in H2O2 (D-F), and after 5 min in H2O2 with subsequent GRT labeling (G-I). Column 2
shows close-ups of the region comprising M0 (unmodified protein) and M1 (first
modification peak), with simulated isotope envelopes for cyt c and [cyt c + O]. Column 3
shows the GRT-labeled Mi forms. Carbonyl-depleted M1 after GRT labeling is denoted as
M1* (panel H).
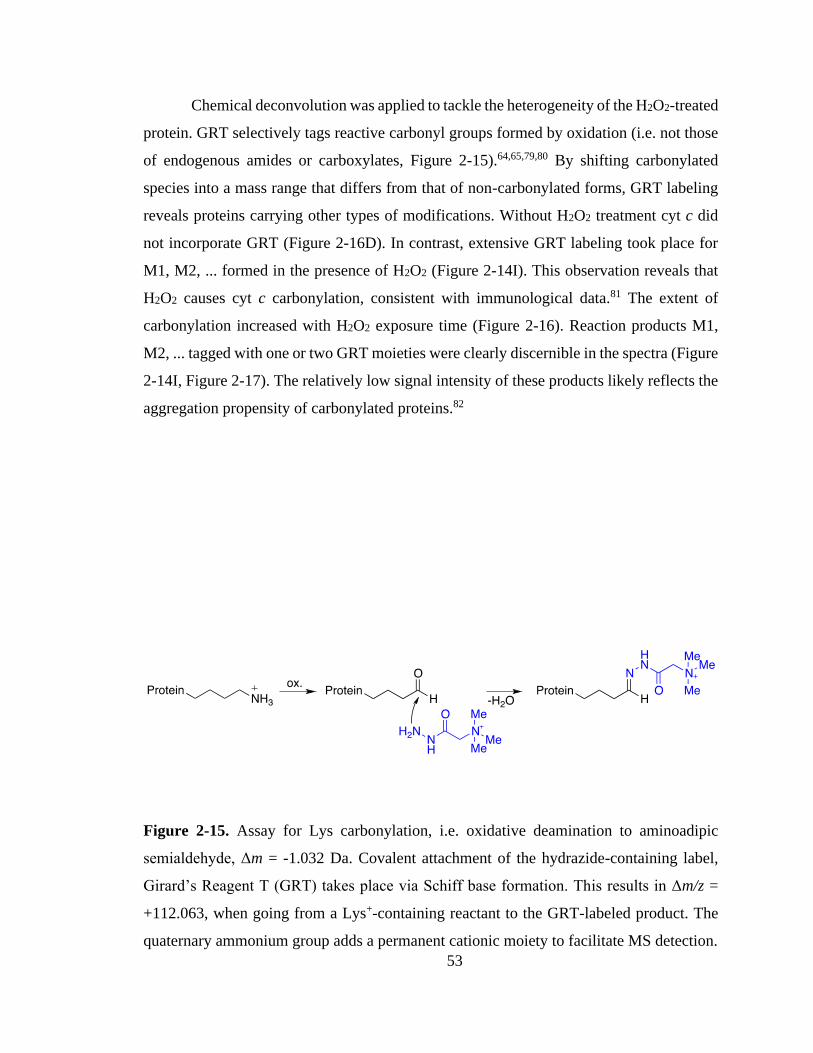
53
Chemical deconvolution was applied to tackle the heterogeneity of the H2O2-treated
protein. GRT selectively tags reactive carbonyl groups formed by oxidation (i.e. not those
of endogenous amides or carboxylates, Figure 2-15).64,65,79,80 By shifting carbonylated
species into a mass range that differs from that of non-carbonylated forms, GRT labeling
reveals proteins carrying other types of modifications. Without H2O2 treatment cyt c did
not incorporate GRT (Figure 2-16D). In contrast, extensive GRT labeling took place for
M1, M2, ... formed in the presence of H2O2 (Figure 2-14I). This observation reveals that
H2O2 causes cyt c carbonylation, consistent with immunological data.81 The extent of
carbonylation increased with H2O2 exposure time (Figure 2-16). Reaction products M1,
M2, ... tagged with one or two GRT moieties were clearly discernible in the spectra (Figure
2-14I, Figure 2-17). The relatively low signal intensity of these products likely reflects the
aggregation propensity of carbonylated proteins.82
Figure 2-15. Assay for Lys carbonylation, i.e. oxidative deamination to aminoadipic
semialdehyde, Δm = -1.032 Da. Covalent attachment of the hydrazide-containing label,
Girard’s Reagent T (GRT) takes place via Schiff base formation. This results in Δm/z =
+112.063, when going from a Lys+-containing reactant to the GRT-labeled product. The
quaternary ammonium group adds a permanent cationic moiety to facilitate MS detection.

54
Figure 2-16. Intact protein mass spectra of cyt c (16+) following H2O2 incubation and
subsequent labeling with GRT. (A) unmodified cyt c. (B, C) After increasing lengths of
H2O2 incubation. (D) – (F) show spectra of the corresponding samples after GRT labeling.
Note that GRT labeling is detectable only after H2O2 exposure, reflecting the formation of
reactive carbonyl groups.
Figure 2-17. Mass spectral data for cyt c following 10 min incubation in 500 M H2O2 and
subsequent GRT labeling. The populations of singly and doubly-adducted GRT are
highlighted in magenta and orange, respectively. (A) Overview of the 16+ range. (B)
Expanded view of the m/z range corresponding to GRT addition.

55
In addition to unmodified cyt c (M0), carbonyl-depleted cyt c showed “M1” as the
only major signal (Figure 2-14G). The centroid of this carbonyl-depleted M1 (Figure
2-14H) was shifted by roughly +2 Da relative to the original M1 (Figure 2-14E). We will
refer to this sub-population as M1*. Comparison with a simulated isotope envelope reveals
that M1* primarily consists of proteins with the composition [cyt c + O] (Figure 2-14H).
The aforementioned findings demonstrate that M1 (Figure 2-14E) comprises [cyt c
+ O], along with carbonylated species that are 1 to 2 Da lower in mass. Lys conversion to
aminoadipic semialdehyde (R-CH2-NH2 → R-CHO) is the only documented carbonylation
pathway with a mass shift of -1 Da.20,79 Thus, we propose that M1 contains [cyt c + O]
where 0, 1, or 2 of the 19 Lys side chains have undergone carbonylation. Tyr dimerization
(-2 Da)83 and other crosslinking modifications20,79 in M1 can be excluded, because they
would not convey GRT reactivity. Thus, the various oxidative modifications detected by
peptide mapping (at Tyr48, Trp58, Met80 etc., see above) must reside in the more highly
oxidized species Mi, with i > 1. Likely, these highly oxidized species are also subject to
Tyr dimerization, as suggested in previous work.81,83
Figure 2-14 also provides information regarding the temporal sequence of oxidation
events. [cyt c + O] is susceptible to carbonylation, seen from disappearance of -1 and -2
Da mass shifts by GRT labeling, and from the formation of [M1+GRT] and [M1+2GRT]
(Figure 2-14I, Figure 2-16). In contrast, M0 is effectively inert against carbonylation,
evident from the fact that neither H2O2 nor GRT treatment affect the M0 mass distribution
(Figure 2-14E, H), and from the lack of a discernible [M0 + GRT] signal in Figure 2-14I.
Hence, carbonylation occurs after an initial +O modification.
The carbonyl-depleted and the carbonylated sub-populations show major
differences in their degree of self-oxidation, which serves as a proxy for the level of
peroxidase activity (Figure 2-18). The carbonyl-depleted sub-population is dominated by
M1* (incorporation of a single oxygen, Figure 2-18A). In contrast, carbonylated cyt c has
its maximum at [M2+GRT] with major contributions from [M3+GRT] and beyond (with
2, 3, ... incorporated oxygens, Figure 2-18B). The fact that carbonylated cyt c exhibits more
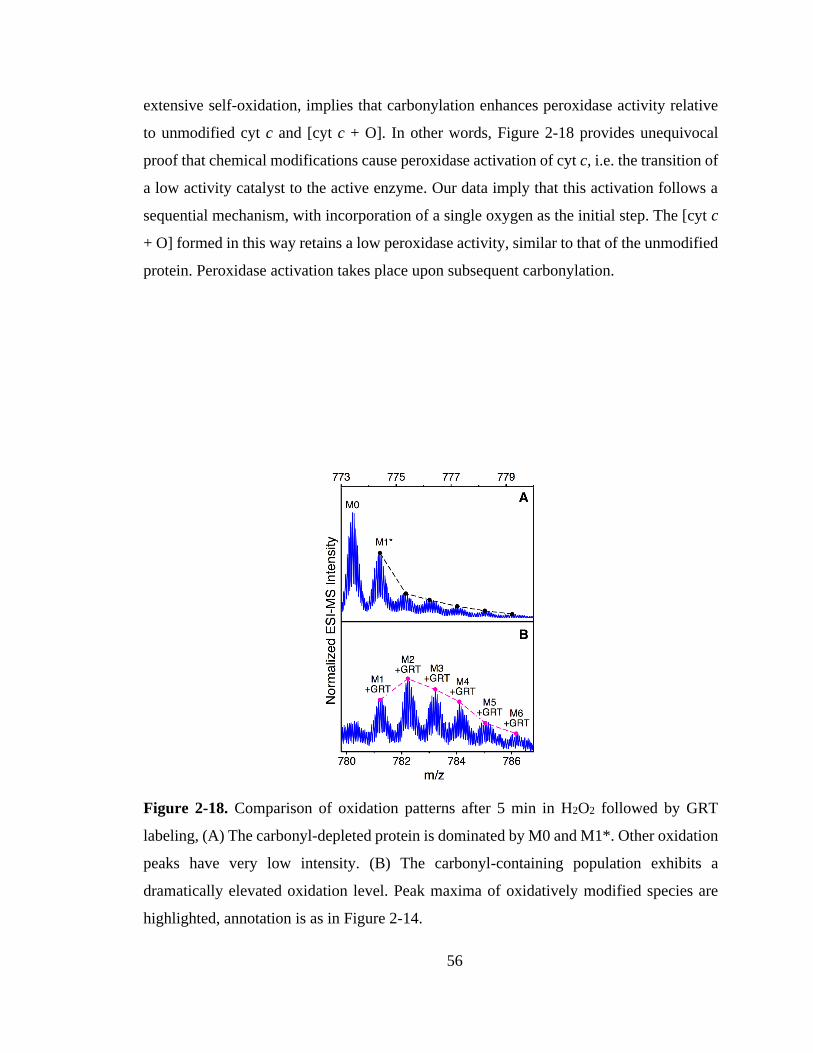
56
extensive self-oxidation, implies that carbonylation enhances peroxidase activity relative
to unmodified cyt c and [cyt c + O]. In other words, Figure 2-18 provides unequivocal
proof that chemical modifications cause peroxidase activation of cyt c, i.e. the transition of
a low activity catalyst to the active enzyme. Our data imply that this activation follows a
sequential mechanism, with incorporation of a single oxygen as the initial step. The [cyt c
+ O] formed in this way retains a low peroxidase activity, similar to that of the unmodified
protein. Peroxidase activation takes place upon subsequent carbonylation.
Figure 2-18. Comparison of oxidation patterns after 5 min in H2O2 followed by GRT
labeling, (A) The carbonyl-depleted protein is dominated by M0 and M1*. Other oxidation
peaks have very low intensity. (B) The carbonyl-containing population exhibits a
dramatically elevated oxidation level. Peak maxima of oxidatively modified species are
highlighted, annotation is as in Figure 2-14.
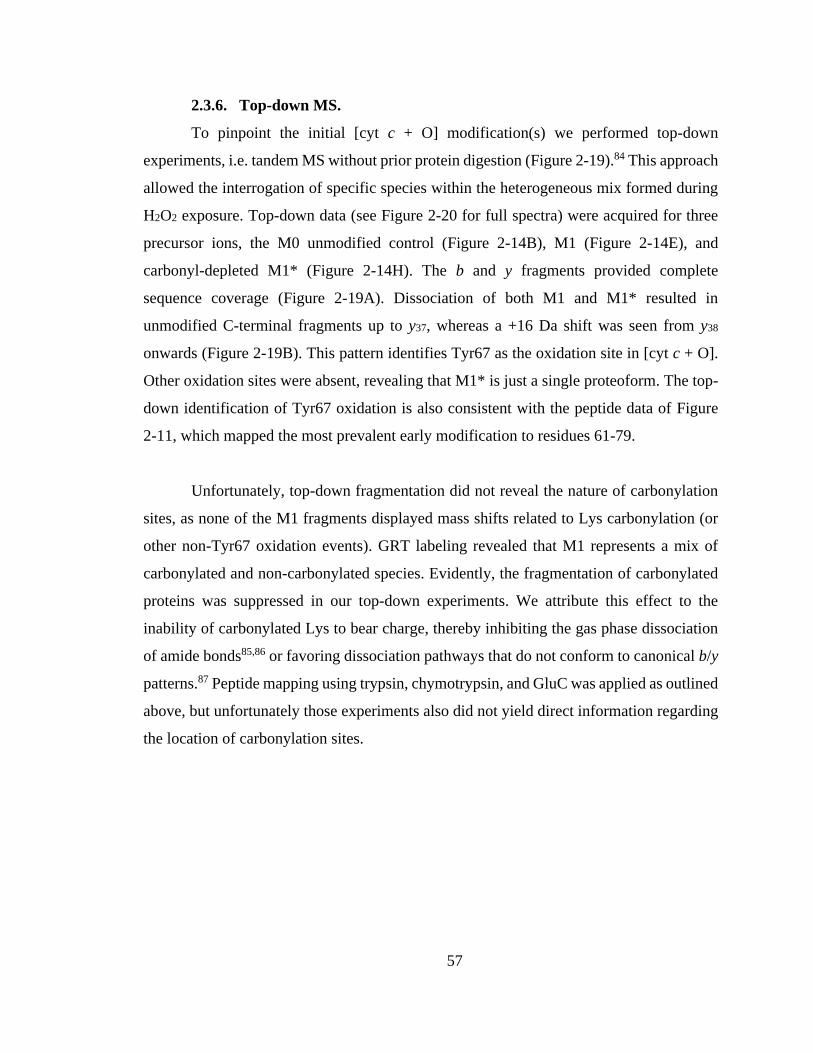
57
2.3.6. Top-down MS.
To pinpoint the initial [cyt c + O] modification(s) we performed top-down
experiments, i.e. tandem MS without prior protein digestion (Figure 2-19).84 This approach
allowed the interrogation of specific species within the heterogeneous mix formed during
H2O2 exposure. Top-down data (see Figure 2-20 for full spectra) were acquired for three
precursor ions, the M0 unmodified control (Figure 2-14B), M1 (Figure 2-14E), and
carbonyl-depleted M1* (Figure 2-14H). The b and y fragments provided complete
sequence coverage (Figure 2-19A). Dissociation of both M1 and M1* resulted in
unmodified C-terminal fragments up to y37, whereas a +16 Da shift was seen from y38
onwards (Figure 2-19B). This pattern identifies Tyr67 as the oxidation site in [cyt c + O].
Other oxidation sites were absent, revealing that M1* is just a single proteoform. The top-
down identification of Tyr67 oxidation is also consistent with the peptide data of Figure
2-11, which mapped the most prevalent early modification to residues 61-79.
Unfortunately, top-down fragmentation did not reveal the nature of carbonylation
sites, as none of the M1 fragments displayed mass shifts related to Lys carbonylation (or
other non-Tyr67 oxidation events). GRT labeling revealed that M1 represents a mix of
carbonylated and non-carbonylated species. Evidently, the fragmentation of carbonylated
proteins was suppressed in our top-down experiments. We attribute this effect to the
inability of carbonylated Lys to bear charge, thereby inhibiting the gas phase dissociation
of amide bonds85,86 or favoring dissociation pathways that do not conform to canonical b/y
patterns.87 Peptide mapping using trypsin, chymotrypsin, and GluC was applied as outlined
above, but unfortunately those experiments also did not yield direct information regarding
the location of carbonylation sites.
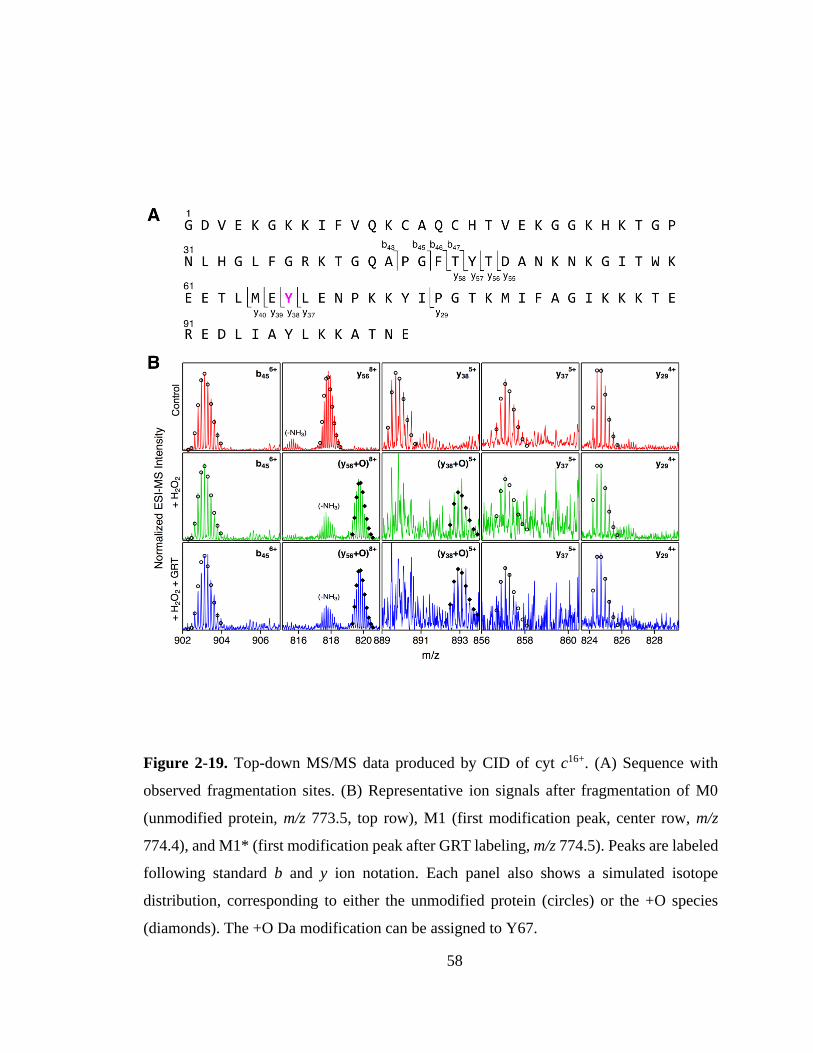
58
Figure 2-19. Top-down MS/MS data produced by CID of cyt c16+. (A) Sequence with
observed fragmentation sites. (B) Representative ion signals after fragmentation of M0
(unmodified protein, m/z 773.5, top row), M1 (first modification peak, center row, m/z
774.4), and M1* (first modification peak after GRT labeling, m/z 774.5). Peaks are labeled
following standard b and y ion notation. Each panel also shows a simulated isotope
distribution, corresponding to either the unmodified protein (circles) or the +O species
(diamonds). The +O Da modification can be assigned to Y67.

59
Figure 2-20. Complete top-down tandem mass spectra produced by CID of cyt c16+. The
data of Figure 2-19 are a subset of the spectra shown here. (A) Spectrum obtained after
fragmentation of (A) M0, (B) M1, and (C) M1* at a collision voltage of 23 V. Panels (D)
– (F) show spectra obtained for the same precursor ions, but at a slightly elevated collision
voltage of 26 V.
60
Despite our inability to directly identify the nature of carbonylation sites in M1,
there is evidence to suggest that Lys72/73 are primarily affected. Carbonylation of these
residues explains the lack of detectable oxidized peptides in the T13-T15 region.
Specifically, the high fOX of T15 at early times (Figure 2-11) likely reflects a missed tryptic
cleavage due to Lys73 carbonylation. Also, Lys72/Lys73 are known to adopt positions
close to the heme in “alkaline” cyt c,2,40,42,44,46-50 particularly after Tyr67 modifications.35
The proximity to the reactive iron makes Lys72/Lys73 prime candidates for oxidative
modifications. Consistent with this view, the spectroscopic properties of H2O2-activated
cyt c (at t 5 min, Figure 2-7) are close to those of “alkaline” Tyr67Arg cyt c.46 Similarities
include a Soret maximum at 406 nm, the shape of the CD spectrum with a minimum at
~206 nm, and loss of A695. The 406 nm Soret signal is compatible with distal ligation by
OH-/H2O (after H2O2-activation) or by Lys (for Tyr67Arg).35
It is instructive to consider the viability of alternative scenarios, where M1
represents a mix of two independently formed products, i.e. [cyt c + O] (Tyr67 oxidized,
+16 Da) and [cyt c + O - 2H] (aliphatic ketone, +14 Da). In such a case Figure 2-18 would
imply that the +14 Da species is highly prone to self-oxidation, whereas Tyr67 oxidation
protects the protein against additional modifications. It is difficult to envision such a
scenario because (i) Tyr67 modifications generally enhance (rather than inhibit) peroxidase
activity.35,44,46,50 (ii) If Tyr67 were to inhibit self-oxidation M1* should accumulate after
extended H2O2 exposure, in contradiction with the spectra of Figure 2-9. (iii) +14 Da
products are generally disfavored relative to other modifications,20,79 while Lys
carbonylation is highly prevalent during metal-catalyzed oxidation.88 (iv) The top-down
detection of +14 Da modifications should be straightforward; our data did not provide any
evidence of such species. All these points argue against the presence of +14 Da
modifications in M1, reinforcing the view that Tyr67 oxidation leads to an on-pathway
intermediate (M1*) that undergoes subsequent Lys carbonylation to form M1.

61
2.3.7. Peroxidase Activation Mechanism of Cyt c.
From the data presented above we can propose a model for the H2O2-induced
peroxidase activation of cyt c (Figure 2-21). The native state M0 has low peroxidase
activity because the distal coordination site is occupied by Met80, restricting interactions
of the iron center with H2O2. The initial modification en route towards the active state is
Tyr67 oxidation (to 3,4- or 2,4-dihydroxyphenylalanine20). This reaction likely takes place
in a heme-catalyzed fashion,89 facilitated by transient opening events of the 70-85 loop
(Figure 1) which represents the most dynamic cyt c region.39 A Tyr67 radical formed in
the presence of H2O289,90 may be an intermediate of this oxidation step. Tyr67
modifications are known to destabilize the Met80-Fe bond due to involvement of the Tyr
side chain in packing interactions and H-bonding. These conditions favor distal heme
ligation by Lys72/73.44,46,50 Our data suggest that an analogous ligand displacement takes
place after Tyr67 oxidation, producing M1* where Lys72/73 compete with Met80 for iron
ligation. M1* transiently accumulates to no more than ~10% of the total protein population
(Figure 2-18). The lack of discernible Lys-specific 1H-NMR signals (Figure 2-8) indicates
that iron contacts with Lys72/73 in the M1* state remain fluctional, while the proximity of
Lys72/73 to the redox-active heme triggers carbonylation. Carbonylated Lys is no longer
capable of iron ligation, leaving behind a vacant distal coordination site. The five-
coordinate M1 produced in this way represents the nascent peroxidase-active state of cyt c.
Peroxidase activity is likely retained while additional oxidation events affect Met80, Tyr48,
Trp58 and other residues (corresponding to M2, M3, ...). Activity is gradually lost as more
and more of the protein is affected by oxidation.
The modification steps of Figure 2-21 require access of H2O2 and O2 to the protein
interior. We envision that this access is provided by conformational fluctuations, as noted
above.39 Such fluctuations will be particularly important for facilitating the initial steps, i.e.
M0 → M1* → M1. Previous studies already noted the importance of dynamics for the
peroxidase activity of cyt c,2,33-38,40 but the role ascribed to these fluctuations here is
different from that envisioned earlier. Other studies implied that native state fluctuations
per se might produce a five-coordinate population that is entirely responsible for the
“native state” peroxidase activity. Our observations demonstrate that the peroxidase
62
activity of unmodified native cyt c is low, and that significant substrate turnover takes place
only after carbonylation.
Figure 2-21. Proposed model for the H2O2-induced peroxidase activation of cyt c. MS-
detected proteoforms are denoted along the top. Dotted lines in M0 and M1* indicate
occasional opening of distal contacts due to protein conformational fluctuations, allowing
for Fe-H2O2 interactions that are required for activation (oxygen incorporation into Tyr67,
carbonylation of Lysx). M1, M2, ... represent peroxidase-active species where Fe-H2O2
contacts are greatly facilitated because the distal coordination site is vacant. The nature of
“Lysx” could not be determined with absolute certainty in this study, but our data indicate
that it corresponds to Lys72 and/or Lys73.
Met80
His18
Fe
+H2O2degraded
heme/protein
M0
Tyr67 Lysx
His18
Fe
M1*
Tyr67ox
Lysx
Met80
His18
Fe
M1
Tyr67ox
Lysxox
Met80
+H2O2
His18
Fe
M2, M3, ...
Tyr67ox
Lysxox
Met80ox
+H2O2
ox
+H2O2
high peroxidase activity inactivelow peroxidase activity
63
2.4. Conclusions
Previous studies did not comprehensively answer the question why native cyt c,
with its six-coordinate iron, possesses apparent peroxidase activity. The present work
resolves this conundrum by attributing much of the peroxidase activity to five-coordinate
species formed in the presence of H2O2. The conversion from a pre-catalyst to peroxidase-
active cyt c is consistent with the observation of a lag phase during substrate
oxidation.14,40,60
Various reasons may have contributed to the fact that the H2O2-induced activation
of cyt c has been overlooked in the past. Many earlier studies characterized wild type and
mutant proteins ex situ, without considering the possibility of H2O2-induced, functionally
relevant alterations. Also, H2O2 produces a mix of transient proteoforms that are difficult
to characterize by most techniques. Here we approached the problem from a new angle by
interrogating catalase-quenched samples in a time-resolved fashion using optical
techniques and MS.
It is tempting to speculate on the implications of our findings for the role of cyt c
during apoptosis. Our in vitro data suggest that cyt c within mitochondria might also adopt
its peroxidase-active state only after oxidative modifications. Specifically, cardiolipin-
bound cyt c with Lys or His ligation12,34,53,54 likely does not represent a form that is highly
peroxidase-active. Instead, these hexa-coordinate species may be analogous to M1*
(Figure 8), requiring oxidative modifications to free up the distal coordination site prior to
becoming an active catalyst. Similarly, engineered six-coordinate constructs might enter
the sequence of Figure 2-21 at the M1* stage, skipping the initial oxidation event, and
thereby providing an explanation for their enhanced apparent peroxidase activity.6,13,26-
28,35,42,49,55
64
2.5. References
(1) Vazquez-Duhalt, R., J. Mol. Catal. B 1999, 7, 241-249.
(2) Hannibal, L.; Tomasina, F.; Capdevila, D. A.; Demicheli, V.; Tórtora, V.; Alvarez-
Paggi, D.; Jemmerson, R.; Murgida, D. H.; Radi, R., Biochemistry 2016, 55 (3),
407-428.
(3) Dunford, H. B., Peroxidases and Catalases: Biochemistry, Biophysics,
Biotechnology, and Physiology. 2nd ed. ed.; John Wiley & Sons: Hoboken, N.J,
2010.
(4) Kagan, V. E.; Tyurin, V. A.; Jiang, J.; Tyurina, Y. Y.; Ritov, V. B.; Amoscato, A.
A.; Osipov, A. N.; Belikova, N. A.; Kapralov, A. A.; Kini, V.; Vlasova, I. I.; Zhao,
Q.; Zou, M.; Di, P.; Svistunenko, D. A.; Kurnikov, I. V.; Borisenko, G. G., Nat.
Chem. Biol. 2005, 1 (4), 223-232.
(5) Jiang, X.; Wang, X., Annu. Rev. Biochem. 2004, 73 (1), 87-106.
(6) Godoy, L. C.; Muñoz-Pinedo, C.; Castro, L.; Cardaci, S.; Schonhoff, C. M.; King,
M.; Tórtora, V.; Marín, M.; Miao, Q.; Jiang, J. F.; Kapralov, A. A.; Jemmerson, R.;
Silkstone, G. G.; Patel, J. N.; Evans, J. E.; Wilson, M. l. T.; Green, D. R.; Kagan,
V. E.; Radi, R.; Mannick, J. B., Proc. Natl. Acad. Sci. U.S.A. 2009, 106 (8), 2653-
2658.
(7) Yu, X.; Acehan, D.; Menetret, J. F.; Booth, C. R.; Ludtke, S. J.; Riedl, S. J.; Shi,
Y.; Wang, X.; Akey, C. W., Structure 2005, 13 (11), 1725-35.
(8) Bren, K. L.; Raven, E. L., Science 2017, 356 (6344), 1236-1236.
(9) Mara, M. W.; Hadt, R. G.; Reinhard, M. E.; Kroll, T.; Lim, H.; Hartsock, R. W.;
Alonso-Mori, R.; Chollet, M.; Glownia, J. M.; Nelson, S.; Sokaras, D.; Kunnus, K.;
Hodgson, K. O.; Hedman, B.; Bergmann, U.; Gaffney, K. J.; Solomon, E. I.,
Science 2017, 356 (6344), 1276-1280.
(10) Lee, S.; Tak, E.; Lee, J.; Rashid, M. A.; Murphy, M. P.; Ha, J.; Kim, S. S., Cell Res.
2011, 21 (5), 817-834.
(11) Giorgio, M.; Trinei, M.; Migliaccio, E.; Pelicci, P. G., Nat. Rev. Mol. Cell Biol.
2007, 8 (9), 722A-728.
(12) Bradley, J. M.; Silkstone, G.; Wilson, M. T.; Cheesman, M. R.; Butt, J. N., J. Am.
Chem. Soc. 2011, 133 (49), 19676-19679.
(13) Abe, M.; Niibayashi, R.; Koubori, S.; Moriyama, I.; Miyoshi, H., Biochemistry
2011, 50 (39), 8383-8391.
65
(14) McClelland, L. J.; Mou, T.-C.; Jeakins-Cooley, M. E.; Sprang, S. R.; Bowler, B. E.,
Proc. Natl. Acad. Sci. U.S.A. 2014, 111 (18), 6648-6653.
(15) Kitt, J. P.; Bryce, D. A.; Minteer, S. D.; Harris, J. M., J. Am. Chem. Soc. 2017.
(16) Veitch, N. C., Phytochem. 2004, 65, 249-259.
(17) Rodriguez Maranon, M. J.; Mercier, D.; van Huystee, R. B.; Stillman, M. J.,
Biochem. J. 1994, 301 ( Pt 2), 335-341.
(18) Volkov, A. N.; Nicholls, P.; Worrall, J. A. R., Biochim. Biophys. Acta. 2011, 1807
(11), 1482-1503.
(19) Lawrence, A.; Jones, C. M.; Wardman, P.; Burkitt, M. J., J. Biol. Chem. 2003, 278
(32), 29410-29419.
(20) Xu, G.; Chance, M. R., Chem. Rev. 2007, 107, 3514-3543.
(21) Von Sonntag, C.; Schuchmann, H. P., Angew. Chem.-Int. Edit. Engl. 1991, 30 (10),
1229-1253.
(22) Kathiresan, M.; English, A. M., Chem. Sci. 2017, 8 (2), 1152-1162.
(23) Florence, T. M., J. Inorg. Biochem. 1985, 23, 131-141.
(24) Villegas, J. A.; Mauk, A. G.; Vazquez-Duhalt, R., Chem. Biol. 2000, 7 (4), 237-
244.
(25) Gray, H. B.; Winkler, J. R., Proc. Natl. Acad. Sci. U. S. A. 2015, 112 (35), 10920-
10925.
(26) Hersleth, H.-P.; Ryde, U.; Rydberg, P.; Görbitz, C. H.; Andersson, K. K., J. Inorg.
Biochem. 2006, 100 (4), 460-476.
(27) Diederix, R. E. M.; Ubbink, M.; Canters, G. W., ChemBioChem 2002, 3, 110-112.
(28) Wang, Z.-H.; Lin, Y.-W.; Rosell, F. I.; Ni, F.-Y.; Lu, H.-J.; Yang, P.-Y.; Tan, X.-
S.; Li, X.-Y.; Huang, Z.-X.; Mauk, A. G., ChemBioChem 2007, 8 (6), 607-609.
(29) Bushnell, G. W.; Louie, G. V.; Brayer, G. D., J. Mol. Biol. 1990, 214, 585-595.
(30) Moreno-Beltran, B.; Guerra-Castellano, A.; Diaz-Quintana, A.; Del Conte, R.;
Garcia-Maurino, S. M.; Diaz-Moreno, S.; Gonzalez-Arzola, K.; Santos-Ocana, C.;
Velazquez-Campoy, A.; De la Rosa, M. A.; Turano, P.; Diaz-Moreno, I., Proc. Natl.
Acad. Sci. U. S. A. 2017, 114 (15), E3041-E3050.
(31) Capdevila, D. A.; Oviedo Rouco, S.; Tomasina, F.; Tortora, V.; Demicheli, V.; Radi,
R.; Murgida, D. H., Biochemistry 2015, 54, 7491−7504.

66
(32) Chen, Y.-R.; Deterding, L. J.; Sturgeon, B. E.; Tomer, K. B.; Mason, R. P., J. Biol.
Chem. 2002, 277 (33), 29781-29791.
(33) Nold, S. M.; Lei, H.; Mou, T.-C.; Bowler, B. E., Biochemistry 2017, 56, 3358–3368.
(34) Milazzo, L.; Tognaccini, L.; Howes, B. D.; Sinibaldi, F.; Piro, M. C.; Fittipaldi, M.;
Baratto, M. C.; Pogni, R.; Santucci, R.; Smulevich, G., Biochemistry 2017, 56 (13),
1887-1898.
(35) Amacher, J. F.; Zhong, F. F.; Lisi, G. P.; Zhu, M. Q.; Alden, S. L.; Hoke, K. R.;
Madden, D. R.; Pletneva, E. V., J. Am. Chem. Soc. 2015, 137 (26), 8435-8449.
(36) Karsisiotis, A. I.; Deacon, O. M.; Wilson, M. T.; Macdonald, C.; Blumenschein, T.
M. A.; Moore, G. R.; Worrall, J. A. R., Sci Rep 2016, 6, 30447.
(37) Diederix, R. E. M.; Ubbink, M.; Canters, G. W., Biochemistry 2002, 41, 13067-
13077.
(38) Sutin, N.; Yandell, J. K., J. Biol. Chem. 1972, 247 (21), 6932-6936.
(39) Xu, Y.; Mayne, L.; Englander, S. W., Nat. Struct. Biol. 1998, 5, 774-778.
(40) García-Heredia, J. M.; Díaz-Moreno, I.; Nieto, P. M.; Orzáez, M.; Kocanis, S.;
Teixeira, M.; Pérez-Payá, E.; Díaz-Quintana, A.; De la Rosa, M. A., Biochim.
Biophys. Acta 2010, 1797 (6–7), 981-993.
(41) Wang, Z.; Ando, Y.; Nugraheni, A. D.; Ren, C.; Nagao, S.; Hirota, S., Mol. Biosyst.
2014, 10 (12), 3130-3137.
(42) Abriata, L. A.; Cassina, A.; Tortora, V.; Marin, M.; Souza, J. M.; Castro, L.; Vila,
A. J.; Radi, R., J. Biol. Chem. 2009, 284 (1), 17-26.
(43) Josephs, Tracy M.; Morison, Ian M.; Day, Catherine L.; Wilbanks, Sigurd M.;
Ledgerwood, Elizabeth C., Biochem. J. 2014, 458 (2), 259-265.
(44) Tognaccini, L.; Ciaccio, C.; D'Oria, V.; Cervelli, M.; Howes, B. D.; Coletta, M.;
Mariottini, P.; Smulevich, G.; Fiorucci, L., J. Inorg. Biochem. 2016, 155, 56-66.
(45) Ciaccio, C.; Tognaccini, L.; Battista, T.; Cervelli, M.; Howes, B. D.; Santucci, R.;
Coletta, M.; Mariottini, P.; Smulevich, G.; Fiorucci, L., J. Inorg. Biochem. 2017,
169, 86-96.
(46) Gu, J.; Shin, D.-W.; Pletneva, E. V., Biochemistry 2017, 56, 2950−2966.
(47) Assfalg, M.; Bertini, I.; Dolfi, A.; Turano, P.; Mauk, A. G.; Rosell, F. I.; Gray, H.
B., J. Am. Chem. Soc. 2003, 125, 2913-2922.

67
(48) Döpner, S.; Hildebrandt, P.; Rosell, F. I.; Mauk, A. G., J. Am. Chem. Soc. 1998,
120, 11246-11255.
(49) Garcia-Heredia, J. M.; Diaz-Quintana, A.; Salzano, M.; Orzaez, M.; Perez-Paya, E.;
Teixeira, M.; De la Rosa, M. A.; Diaz-Moreno, I., J. Biol. Inorg. Chem. 2011, 16
(8), 1155-68.
(50) Ying, T.; Wang, Z.-H.; Lin, Y.-W.; Xie, J.; Tan, X.; Huang, Z.-X., Chem. Commun.
2009, (30), 4512-4514.
(51) Kagan, V. E.; Bayır, H. A.; Belikova, N. A.; Kapralov, O.; Tyurina, Y. Y.; Tyurin,
V. A.; Jiang, J.; Stoyanovsky, D. A.; Wipf, P.; Kochanek, P. M.; Greenberger, J. S.;
Pitt, B.; Shvedova, A. A.; Borisenko, G. G., Free Radic. Biol. Med. 2009, 46 (11),
1439-1453.
(52) Serpas, L.; Milorey, B.; Pandiscia, L. A.; Addison, A. W.; Schweitzer-Stenner, R.,
J. Phys. Chem. B 2016, 120, 12219−12231.
(53) Ranieri, A.; Millo, D.; Di Rocco, G.; Battistuzzi, G.; Bortolotti, C. A.; Borsari, M.;
Sola, M., J. Biol. Inorg. Chem. 2015, 20 (3), 531-540.
(54) Yanamala, N.; Kapralov, A. A.; Djukic, M.; Peterson, J.; Mao, G. W.; Klein-
Seetharaman, J.; Stoyanovsky, D. A.; Stursa, J.; Neuzil, J.; Kagan, V. E., J. Biol.
Chem. 2014, 289 (47).
(55) Belikova, N. A.; Vladimirov, Y. A.; Osipov, A. N.; Kapralov, A. A.; Tyurin, V. A.;
Potapovich, M. V.; Basova, L. V.; Peterson, J.; Kurnikov, I. V.; Kagan, V. E.,
Biochemistry 2006, 45 (15), 4998-5009.
(56) Capdevila, D. A.; Marmisolle, W. A.; Tomasina, F.; Demicheli, V.; Portela, M.;
Radi, R.; Murgida, D. H., Chem. Sci. 2015, 6 (1), 705-713.
(57) Widegren, J. A.; Finke, R. G., J. Mol. Catal. A 2003, 198 (1–2), 317-341.
(58) Haw, J. F.; Song, W. G.; Marcus, D. M.; Nicholas, J. B., Acc. Chem. Res. 2003, 36
(5), 317-326.
(59) Wunder, S.; Lu, Y.; Albrecht, M.; Ballauff, M., Acs Catalysis 2011, 1 (8), 908-916.
(60) Radi, R.; Thomson, L. M.; Rubbo, H.; Prodanov, E., Arch. Biochem. Biophys. 1991,
288 (1), 112-117.
(61) Capdevila, D. A.; Alvarez-Paggi, D.; Castro, M. A.; Tortora, V.; Demicheli, V.;
Estrin, D. A.; Radi, R.; Murgida, D. H., Chem. Commun. 2014, 50 (20), 2592-2594.
(62) Baldwin, D. A.; Marques, H. M.; Pratt, J. M., J. Inorg. Biochem. 1987, 30, 203-217.

68
(63) Pande, J.; Kinnally, K.; Thallum, K. K.; Verma, B. C.; Myer, Y. P.; Rechsteiner,
L.; Bosshard, H. R., J. Protein Chem. 1987, 6 (4), 295-319.
(64) Yang, Y.; Stella, C.; Wang, W. R.; Schoneich, C.; Gennaro, L., Anal. Chem. 2014,
86 (10), 4799-4806.
(65) Mirzaei, H.; Regnier, F., J. Chromatogr. A 2006, 1134 (1-2), 122-133.
(66) He, F.; Hendricksen, C. L.; Marshall, A. G., J. Am. Soc. Mass Spectrom. 2000, 11,
120-126.
(67) Stocks, B. B.; Konermann, L., Anal. Chem. 2009, 81, 20-27.
(68) Matsui, T.; Ozaki, S.-i.; Watanabe, Y., J. Am. Chem. Soc. 1999, 121 (43), 9952-
9957.
(69) Chen, Y.; Yang, J. T.; Martinez, H. M., Biochemistry 1972, 22, 4120-4131.
(70) Lan, W.; Wang, Z.; Yang, Z.; Ying, T.; Zhang, X.; Tan, X.; Liu, M.; Cao, C.; Huang,
Z.-X., PLoS ONE 2014, 9 (9), e107305.
(71) Nagababu, E.; Rifkind, J. M., Antioxid. Redox Signaling 2004, 6 (6), 967-978.
(72) Kaminsky, L. S.; Miller, V. J.; Davison, A. J., Biochemistry 1973, 12, 2215-2221.
(73) Feng, Y. Q.; Roder, H.; Englander, S. W., Biophys. J. 1990, 57 (1), 15-22.
(74) Russell, B. S.; Melenkivitz, R.; Bren, K. L., Proc. Natl. Acad. Sci. U. S. A. 2000,
97 (15), 8312-8317.
(75) Lim, J.; Vachet, R. W., Anal. Chem. 2004, 76, 3498-3504.
(76) Gau, B. C.; Sharp, J. S.; Rempel, D. L.; Gross, M. L., Anal. Chem. 2009, 81, 6563–
6571.
(77) Birk, A. V.; Chao, W. M.; Liu, S. Y.; Soong, Y.; Szeto, H. H., Biochim. Biophys.
Acta 2015, 1847 (10), 1075-1084.
(78) Stocks, B. B.; Konermann, L., J. Mol. Biol. 2010, 398, 362-373.
(79) Møller, I. M.; Rogowska-Wrzesinska, A.; Rao, R. S. P., J. Proteomics 2011, 74
(11), 2228-2242.
(80) Artemenko, K.; Mi, J.; Bergquist, J., Free Radical Res. 2015, 49 (5), 477-493.
(81) Kim, N. H.; Jeong, M. S.; Choir, S. Y.; Kang, J. H., Mol. Cells 2006, 22 (2), 220-
227.
(82) de Graff, A. M. R.; Hazoglou, M. J.; Dill, K. A., Structure 2016, 24 (2), 329-336.
69
(83) Tew, D.; Demontellano, P. R. O., J. Biol. Chem. 1988, 263 (33), 17880-17886.
(84) Siuti, N.; Kelleher, N. L., Nat. Methods 2007, 4, 817-821.
(85) Dongré, A. R.; Jones, J. L.; Somogyi, Á.; Wysocki, V. H., J. Am. Chem. Soc. 1996,
118, 8365-8374.
(86) Greer, S. M.; Holden, D. D.; Fellers, R.; Kelleher, N. L.; Brodbelt, J. S., J. Am. Soc.
Mass Spectrom. 2017, 28, 1587-1599.
(87) Paizs, B.; Suhai, S., Mass Spectrom. Rev. 2005, 24, 508-548.
(88) Temple, A.; Yen, T.-Y.; Gronert, S., J. Am. Soc. Mass Spectrom. 2006, 17, 1172-
1180.
(89) Kapralov, A. A.; Yanamala, N.; Tyurina, Y. Y.; Castro, L.; Samhan-Arias, A.;
Vladimirov, Y. A.; Maeda, A.; Weitz, A. A.; Peterson, J.; Mylnikov, D.; Demicheli,
V.; Tortora, V.; Klein-Seetharaman, J.; Radi, R.; Kagan, V. E., Biochim. Biophys.
Acta 2011, 1808 (9), 2147-2155.
(90) Qian, S. Y.; Chen, Y.-R.; Deterding, L. J.; Fann, Y. C.; Chignell, C. F.; Tomer, K.
B.; Mason, R. P., Biochem. J. 2002, 363 (Pt 2), 281-288.
70
Chapter 3. Lysine Carbonylation as a Previously Unrecognized
Contributor to Peroxidase Activation of Cytochrome c in
Oxidants Other than H2O2
3.1. Introduction
Cytochrome c (cyt c) is a 12 kDa mitochondrial heme protein whose primary role
is to serve as an electron shuttle in the respiratory chain.1 Cyt c also possesses a second
biologically relevant function as a peroxidase.2-8 Peroxidases catalyze the oxidation (H
abstraction) of substrates in the presence of H2O2. Catalytic turnover involves heme cycling
between the Fe(III) and Fe(IV)=O states.9 The peroxidase activity of cyt c is critical for
triggering apoptosis (programed cell death) via oxidation of the mitochondrial membrane
lipid cardiolipin.7,10-12 Apoptosis is an essential process, e.g. for suppressing tumor
growth.13
Peroxidases require a pentacoordinated heme with a vacant distal coordination site
where H2O2 can bind, and where the Fe(IV)=O oxygen can be accommodated.14 The heme
in native cyt c is hexacoordinated, as the distal site is occupied by the Met80 sulfur (Figure
3-1).15 Dissociation of this Met80-Fe contact is a mandatory prerequisite for converting cyt
c into a peroxidase.14,16-17 There are different ways to achieve displacement of the distal
Met80, such as unfolding14, 16 chemical5, 17-20 or mutational modifications,4,7,18,21-26 as well
as cardiolipin binding.3,27-29 Exposure to basic pH induces the formation of “alkaline”
conformations where Lys72, 73 or 79 serve as distal ligands instead of Met80.20,30-34
Chemical or mutational modifications can shift this alkaline transition into the neutral
range.5,19-20,35-40
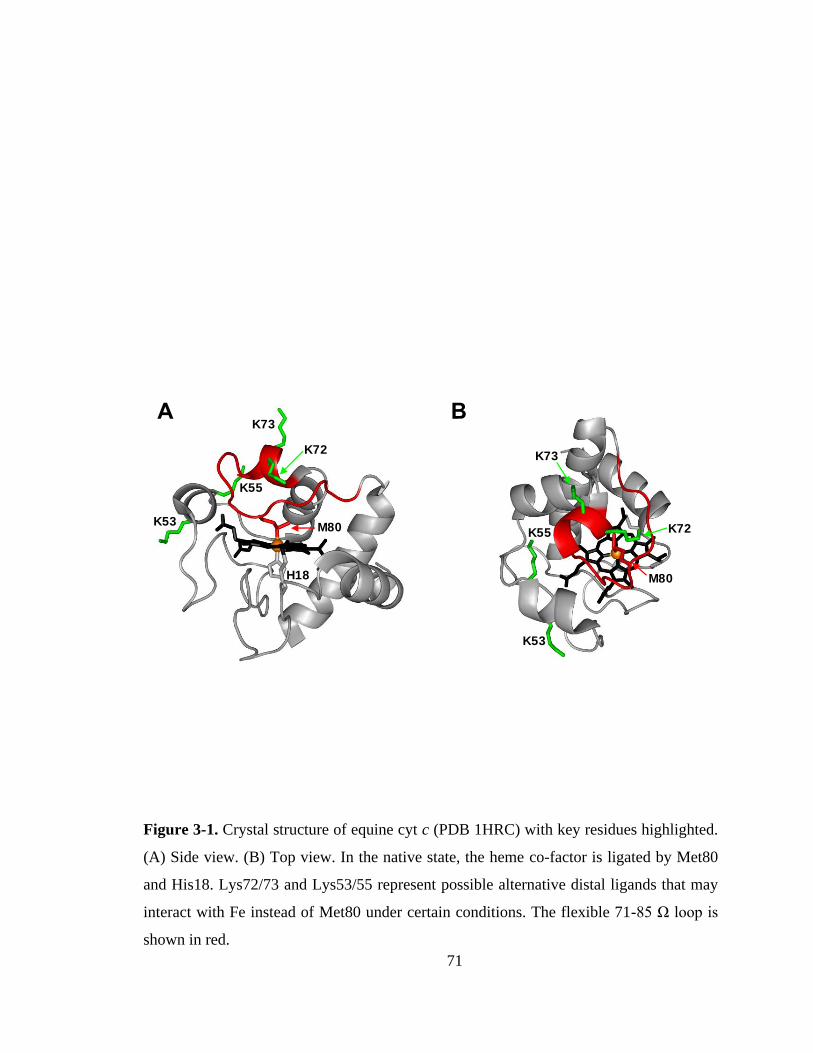
71
Figure 3-1. Crystal structure of equine cyt c (PDB 1HRC) with key residues highlighted.
(A) Side view. (B) Top view. In the native state, the heme co-factor is ligated by Met80
and His18. Lys72/73 and Lys53/55 represent possible alternative distal ligands that may
interact with Fe instead of Met80 under certain conditions. The flexible 71-85 Ω loop is
shown in red.
A B
K72
K73
K55
K53
K72
K73
K55
K53 M80
H18 M80

72
We recently demonstrated41 that H2O2 converts native cyt c into an active
peroxidase via a reaction sequence that starts with Tyr67 oxidation, followed by
dissociation of the Met80-Fe contact. Subsequently, Lys72 or 73 occupy the distal
coordination site. Carbonylation then abrogates the capability of Lys72/73 to serve as Fe
ligands, thereby generating the free distal site that is required for an active peroxidase.41
Lys carbonylation corresponds to the oxidation of the -amino group to an aldehyde
(LysCHO, aminoadipic semialdehyde, M = -1 Da).42-43
The most straightforward method to rupture the Met80-Fe bond is via Met
oxidation to methionine sulfoxide (MetO). It is widely believed that this oxidative
modification is sufficient for generating the open distal site that is required for peroxidase
activation of cyt c in vitro and in vivo.17-18,37-38,44-47 In other words, this Met80-centric view
envisions a simple causal relationship between MetO formation and peroxidase activity.17-
18,37-38,45-47
A key pillar of the Met80-centric view comes from work on chloramine-T (CT)
oxidized cyt c (CT-cyt c). CT is a mild oxidizing agent48 that transforms into other reactive
species in aqueous solution.49 Among these, OCl- appears to be mainly responsible for cyt
c oxidation, evident from the fact that cyt c exposure to CT and to OCl- causes similar
effects.17 CT-cyt c is a potent peroxidase.17,37 Several studies have shown that CT-cyt c
carries a sulfoxide at both Met80 and Met65, while claiming that no other chemical
modifications are present.17,48,50 These claims go back to amino acid analyses conducted in
the 1970s, which concluded that CT specifically oxidizes Met, while leaving all other
residues unmodified (except for -SH groups, which are absent in cyt c).51 Those early
studies17,48,50-51 cemented the widely held belief that Met80 oxidation, without any other
covalent changes, generates an active peroxidase.17-18,37,45-47 As a result, CT-cyt c has
become a widely used model for peroxidase-activated cyt c.17,37-38,47
73
Considering the far-reaching implications of work in this area (including the role
of cyt c in apoptosis and tumorigenesis),13 it is imperative to fully understand the properties
of CT-cyt c. Is it true that Met80 oxidation is sufficient for peroxidase activation? Is it true
that MetO formation is the only CT-induced oxidative modification? Several lines of
evidence hint at the involvement of additional factors. (1) Disruption of the Met80-Fe bond
tends to produce “alkaline” ligation scenarios, where even at near-neutral pH the distal site
becomes occupied by side chains such as Lys72/73.19,35-36,38 These alternative ligation
scenarios are promoted by the flexible nature of the 71-85 Ω loop (Figure 3-1).52-53 Hence,
it is not obvious why Met80 oxidation in itself would produce a vacant distal site that is
required for peroxidase activity. (2) The purported strict selectivity of CT for Met is
somewhat suspicious, considering that other oxidants can induce various modifications at
different types of residues.54-58 (3) Typical CT-cyt c literature protocols utilize strong cation
exchange (SCX) chromatography, which separates proteins according to their positive
surface charge. Surprisingly, CT-cyt c undergoes SCX fractionation into several distinct
bands.37-38,47-48 MetO formation does not directly affect charge. The fact that CT-cyt c
produces several SCX fractions thus suggests that the protein might contain additional,
hitherto unidentified modifications. The possible existence of such modifications and their
implications for peroxidase activation have been ignored thus far in the literature.
In this work we critically examined the structure and function of CT-cyt c. Various
mass spectrometry (MS) techniques were applied to characterize CT-induced covalent
modifications in unprecedented detail. We were able to pinpoint previously unidentified
features of the peroxidase activation process. Met80 oxidation alone was found to result in
low peroxidase activity, because the distal site remained impeded by alkaline-like Lys
ligation. Only after opening of the distal site by CT-induced LysCHO formation did the
protein show higher levels of activity. Previous studies on CT-cyt c that assumed a “clean”
MetO protein have - in all likelihood - inadvertently characterized samples that contained
both MetO and LysCHO sites. Our findings argue against the prevailing notion that Met80
oxidation alone is sufficient for peroxidase activation. Instead, Lys carbonylation is a key
peroxidase co-activator.
74
3.2. Methods
3.2.1. Materials.
Horse heart ferricyt c, H2O2, guaiacol (o-methoxyphenol), ammonium acetate, and
chloramine-T (N-chloro-4-toluol-sulfonamide), were from Sigma Aldrich (St. Louis, MO).
Solvents were from Fisher Scientific (Nepean, ON). Potassium phosphate was supplied by
Caledon Laboratories (Georgetown, ON), and MS-grade modified trypsin was from
Promega (Madison, WI). All experiments were conducted at 22 2 C.
3.2.2. Preparation of CT-cyt c.
Treatment of cyt c with CT was performed as described,37 with minor alterations.
Briefly, a 5 mM aqueous solution of CT was added to 1 mM cyt c of (both in 50 mM Tris
buffer, pH 8.4) in a 1:1 volume ratio and reacted at room temperature for 3 hours. The
reaction was then halted by dialysis against 10 mM potassium phosphate (pH 7.4) using 10
kDa MWCO filters (EMD Millipore, Etobicoke, ON). The CT-cyt c produced in this way
was either used directly or subjected to SCX chromatography using a 5 mL HiTrap
sulfopropyl (SP) cartridge (GE Healthcare) on an ÄKTApurifier FPLC. The HiTrap SP
column was conditioned as per manufacturer instructions, and proteins were loaded at 0.25
mL min-1. The column was then washed with H2O until the absorbance (280 nm) reached
the pre-loading baseline. SCX elution was performed using a linear gradient of 500 mM
ammonium acetate (pH 9) over 5 column volumes while collecting the eluent in 1 mL
fractions.
3.2.3. Optical Spectroscopy.
UV-Vis spectra were acquired on a Cary-100 spectrophotometer (Varian,
Mississauga, ON). Soret measurement were performed on 10 μM protein solutions in 50
mM potassium phosphate buffer (pH 7.4). Absorbance measurements at 695 nm were
performed at 40 μM protein. Peroxidase activity was measured as described59 by tracking
the oxidation of 9 mM guaiacol in the presence of 100 M H2O2. Additional experiments
were also conducted using 500 M H2O2. This H2O2 concentration range is in line with
previous work,7, 32 and it is comparable to physiological H2O2 levels at the onset of
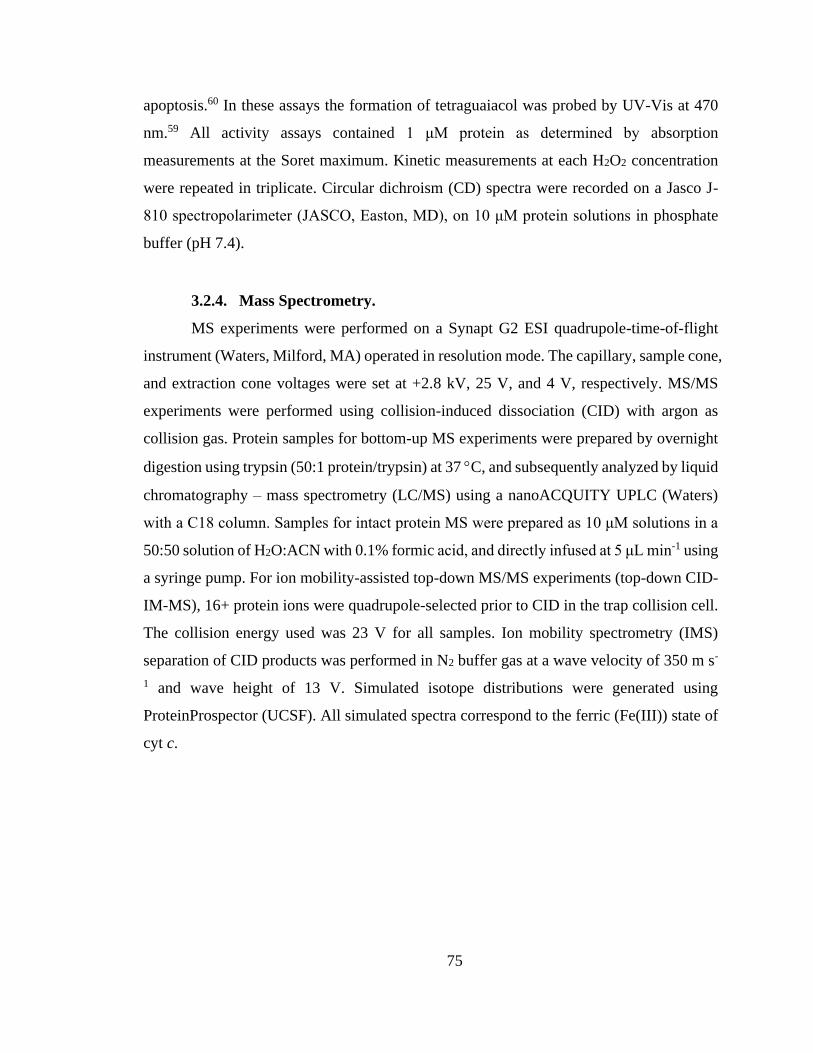
75
apoptosis.60 In these assays the formation of tetraguaiacol was probed by UV-Vis at 470
nm.59 All activity assays contained 1 μM protein as determined by absorption
measurements at the Soret maximum. Kinetic measurements at each H2O2 concentration
were repeated in triplicate. Circular dichroism (CD) spectra were recorded on a Jasco J-
810 spectropolarimeter (JASCO, Easton, MD), on 10 μM protein solutions in phosphate
buffer (pH 7.4).
3.2.4. Mass Spectrometry.
MS experiments were performed on a Synapt G2 ESI quadrupole-time-of-flight
instrument (Waters, Milford, MA) operated in resolution mode. The capillary, sample cone,
and extraction cone voltages were set at +2.8 kV, 25 V, and 4 V, respectively. MS/MS
experiments were performed using collision-induced dissociation (CID) with argon as
collision gas. Protein samples for bottom-up MS experiments were prepared by overnight
digestion using trypsin (50:1 protein/trypsin) at 37 C, and subsequently analyzed by liquid
chromatography – mass spectrometry (LC/MS) using a nanoACQUITY UPLC (Waters)
with a C18 column. Samples for intact protein MS were prepared as 10 μM solutions in a
50:50 solution of H2O:ACN with 0.1% formic acid, and directly infused at 5 μL min-1 using
a syringe pump. For ion mobility-assisted top-down MS/MS experiments (top-down CID-
IM-MS), 16+ protein ions were quadrupole-selected prior to CID in the trap collision cell.
The collision energy used was 23 V for all samples. Ion mobility spectrometry (IMS)
separation of CID products was performed in N2 buffer gas at a wave velocity of 350 m s-
1 and wave height of 13 V. Simulated isotope distributions were generated using
ProteinProspector (UCSF). All simulated spectra correspond to the ferric (Fe(III)) state of
cyt c.

76
3.3. Results and Discussion
3.3.1. Chloramine-T-induced Met80 Oxidation.
The CT-cyt c used in this study was prepared using established procedures.37-38,47
An initial characterization was conducted by subjecting unfractionated samples to a
standard tryptic digestion/LC-MS/MS workflow. As expected, these assays revealed MetO
formation (+16 Da) at Met80 and Met65, in line with earlier reports (Figure 3-2).17,37,46-47
No other +16 Da modifications were detected. These observations appear to support the
widely held belief that CT selectively oxidizes Met.17,48,50-51 However, from the data
discussed below it will be seen that standard mapping experiments (such as those of Figure
3-2) provide an incomplete view of the CT-induced oxidation events.
3.3.2. SCX Fractionation and Optical Characterization.
SCX elution profiles of CT-cyt c exhibited three major peaks (Figure 3-3A),
consistent with previous observations.37-38,47-48 Close examination of the highest intensity
region revealed the presence of two partially overlapping signals (around 23 mL,
equivalent to “peak B” in ref. 37). In total, therefore, SCX revealed the existence of four
chromatographically distinguishable CT-cyt c forms. We will refer to these fractions as I,
II, III, and IV in the order of decreasing retention. Fraction I had the largest retention
volume, i.e. it interacted most strongly with the stationary phase, implying the most highly
cationic character. The SCX behavior of fraction I was indistinguishable from that of
unmodified cyt c. Conversely, fraction IV showed the weakest interaction with the
stationary phase, i.e. proteins in this fraction carried the least amount of positive charge.
From the A280 values in the SCX chromatograms, the relative abundance of fractions IV,
III, II, and I can be estimated to be roughly 10%, 35%, 35%, and 20%, respectively. For
subsequent experiments we isolated thin slices out of the chromatograms for targeted
experiments on each fraction (Figure 3-3A).
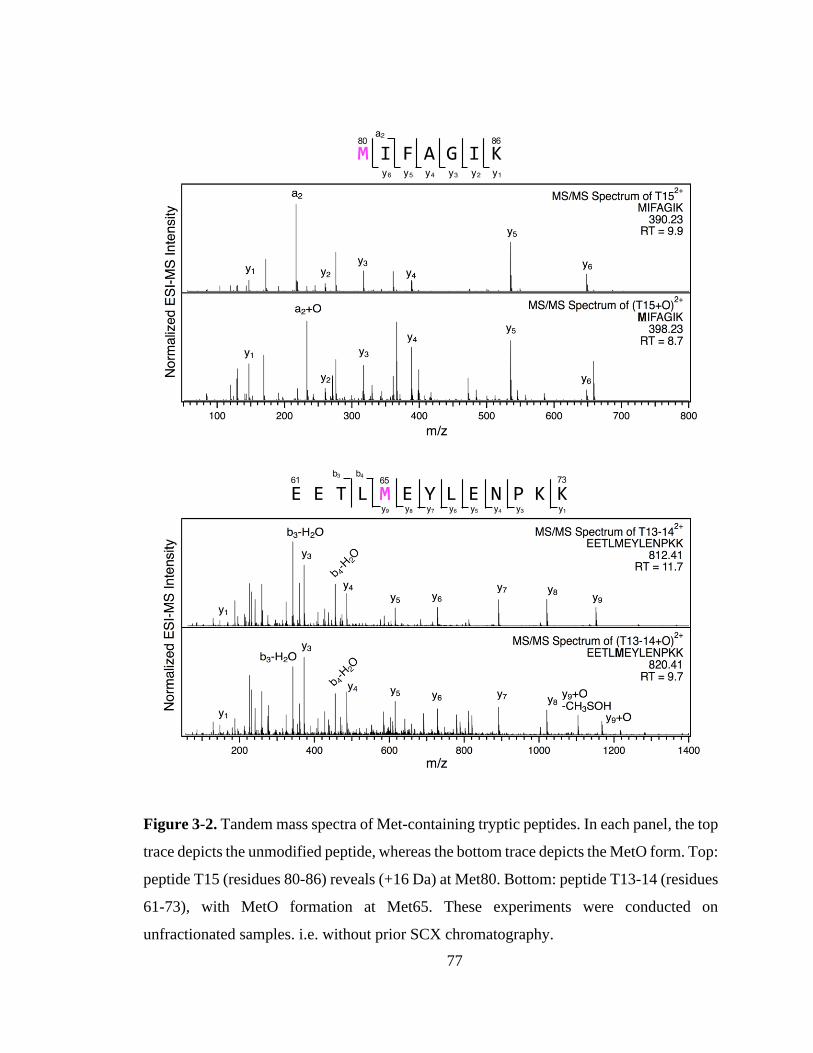
77
Figure 3-2. Tandem mass spectra of Met-containing tryptic peptides. In each panel, the top
trace depicts the unmodified peptide, whereas the bottom trace depicts the MetO form. Top:
peptide T15 (residues 80-86) reveals (+16 Da) at Met80. Bottom: peptide T13-14 (residues
61-73), with MetO formation at Met65. These experiments were conducted on
unfractionated samples. i.e. without prior SCX chromatography.
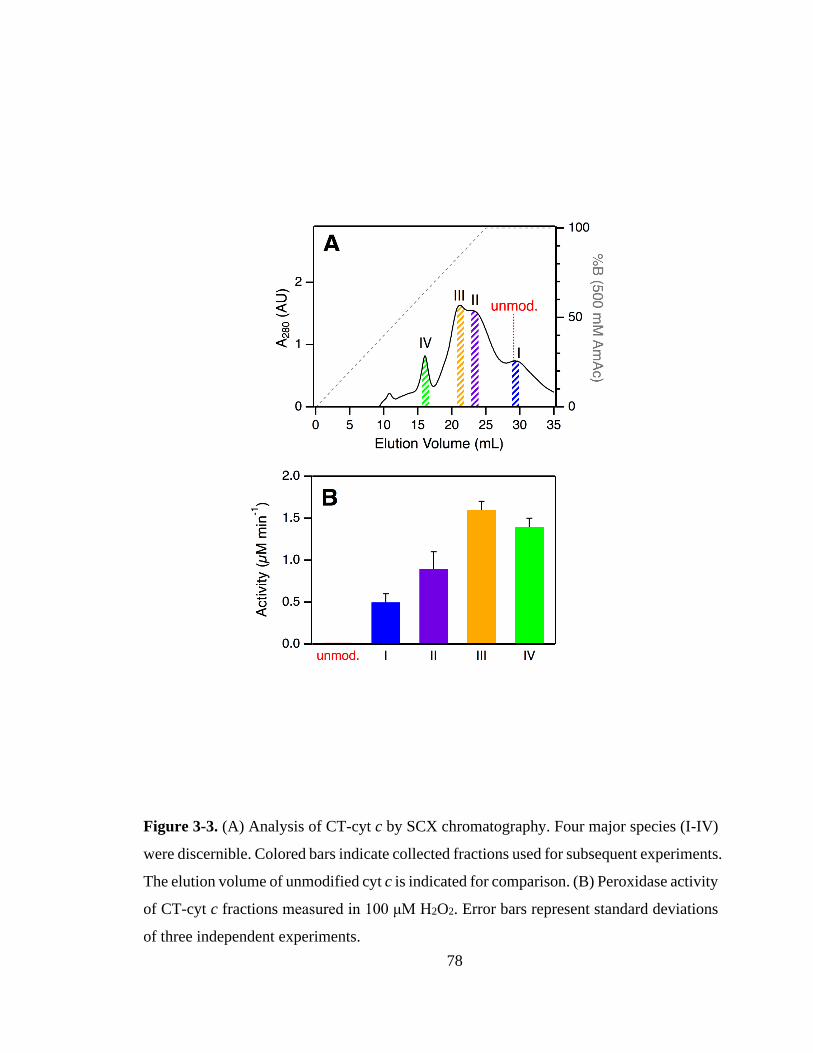
78
Figure 3-3. (A) Analysis of CT-cyt c by SCX chromatography. Four major species (I-IV)
were discernible. Colored bars indicate collected fractions used for subsequent experiments.
The elution volume of unmodified cyt c is indicated for comparison. (B) Peroxidase activity
of CT-cyt c fractions measured in 100 μM H2O2. Error bars represent standard deviations
of three independent experiments.
79
Optical spectra of the four CT-cyt c fractions were very similar to one another, but
markedly different from those of unmodified cyt c (Figure 3-4). CT-cyt c showed a ~30%
CD intensity loss at 222 nm, revealing some decrease of α-helicity upon oxidation.61 There
was no concomitant increase in the random coil region (~200 nm), suggesting that CT-
induced modifications did not cause unfolding, but transitions to alternative folded
structures.61 A blue shift of the UV-vis Soret band from 409 nm to ~405 nm indicated
alterations in the heme environment. In addition, all CT-cyt c fractions exhibited loss of
the 695 nm absorption band, signaling disruption of the Met80-Fe bond.62
In summary, the spectroscopic data of Figure 3-4 indicate the formation of non-
native, structured conformers in the CT-treated samples. The CD spectra were similar to
those of Lys-ligated alkaline cyt c.19,35-36 The blue-shifted Soret band is reminiscent of
alkaline cyt c as well.34,38 Resonance Raman (RR) data in the literature showed Fraction I
to be Lys-ligated, whereas the remaining fractions were reported to have an open (OH-
/H2O coordinated) distal site.37 All these observations support the view that CT-cyt c shares
structural features with previously characterized alkaline cyt c conformers.19,34,36 Recent
NMR and EPR work by Zhong et al. arrived at an analogous conclusion.38
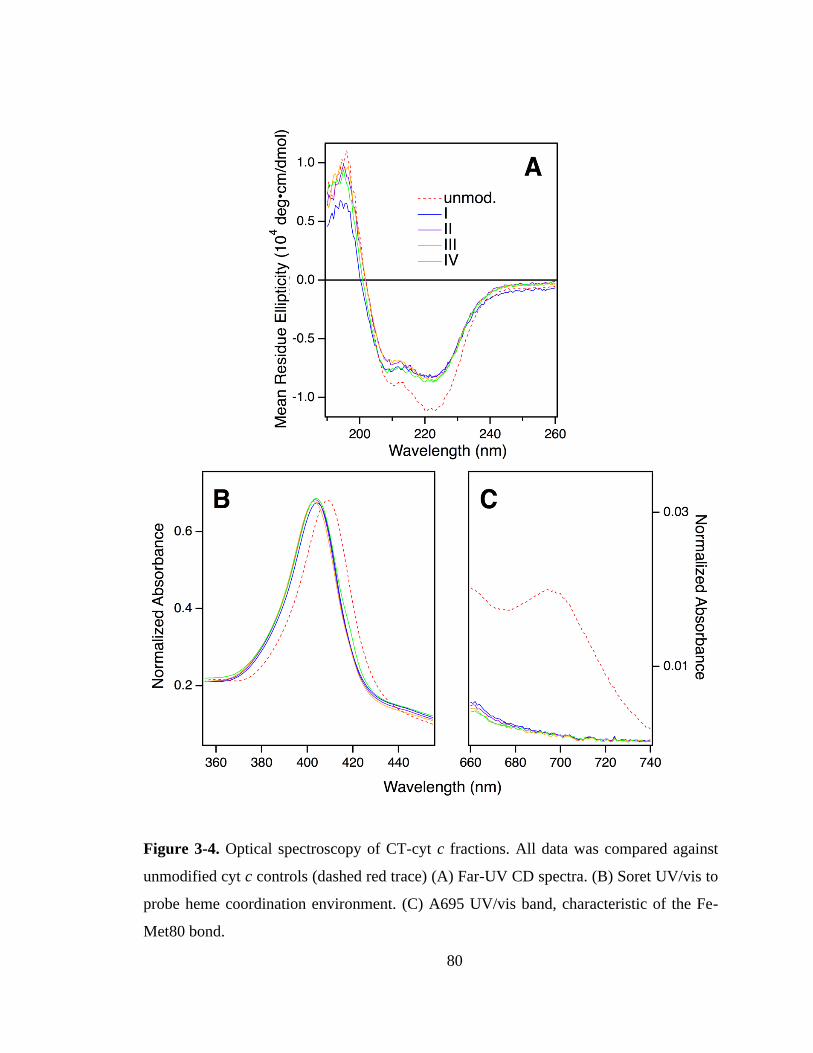
80
Figure 3-4. Optical spectroscopy of CT-cyt c fractions. All data was compared against
unmodified cyt c controls (dashed red trace) (A) Far-UV CD spectra. (B) Soret UV/vis to
probe heme coordination environment. (C) A695 UV/vis band, characteristic of the Fe-
Met80 bond.
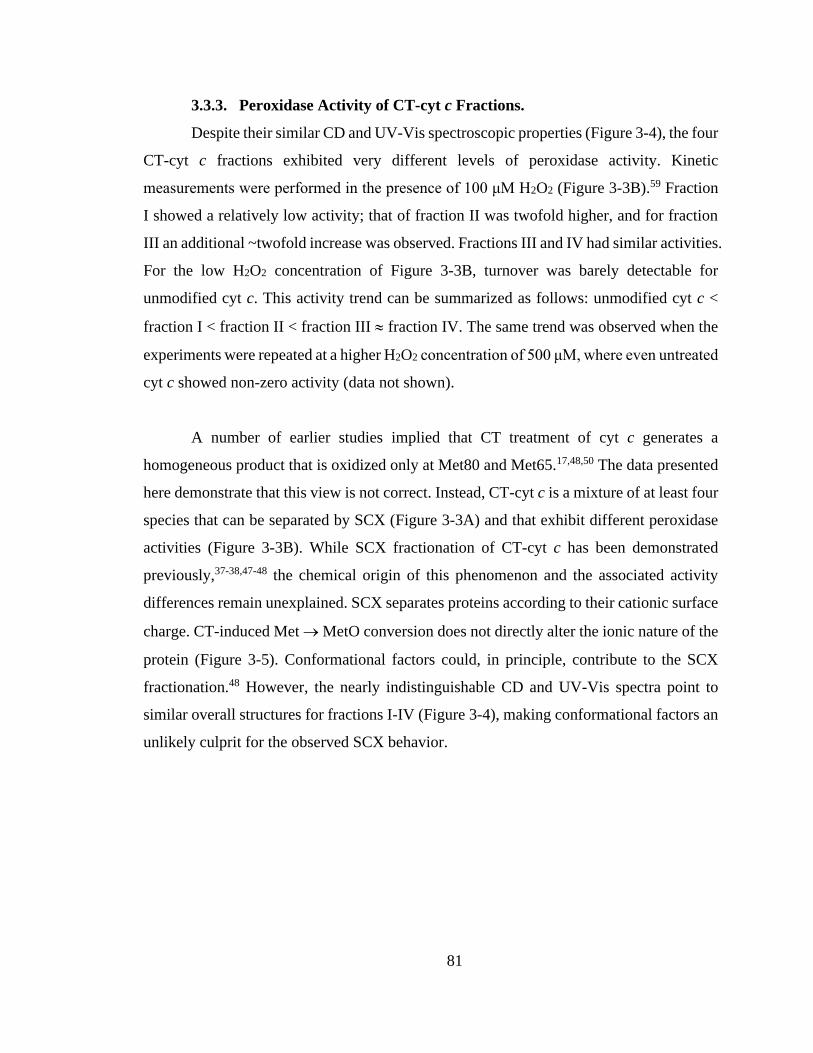
81
3.3.3. Peroxidase Activity of CT-cyt c Fractions.
Despite their similar CD and UV-Vis spectroscopic properties (Figure 3-4), the four
CT-cyt c fractions exhibited very different levels of peroxidase activity. Kinetic
measurements were performed in the presence of 100 μM H2O2 (Figure 3-3B).59 Fraction
I showed a relatively low activity; that of fraction II was twofold higher, and for fraction
III an additional ~twofold increase was observed. Fractions III and IV had similar activities.
For the low H2O2 concentration of Figure 3-3B, turnover was barely detectable for
unmodified cyt c. This activity trend can be summarized as follows: unmodified cyt c <
fraction I < fraction II < fraction III fraction IV. The same trend was observed when the
experiments were repeated at a higher H2O2 concentration of 500 μM, where even untreated
cyt c showed non-zero activity (data not shown).
A number of earlier studies implied that CT treatment of cyt c generates a
homogeneous product that is oxidized only at Met80 and Met65.17,48,50 The data presented
here demonstrate that this view is not correct. Instead, CT-cyt c is a mixture of at least four
species that can be separated by SCX (Figure 3-3A) and that exhibit different peroxidase
activities (Figure 3-3B). While SCX fractionation of CT-cyt c has been demonstrated
previously,37-38,47-48 the chemical origin of this phenomenon and the associated activity
differences remain unexplained. SCX separates proteins according to their cationic surface
charge. CT-induced Met → MetO conversion does not directly alter the ionic nature of the
protein (Figure 3-5). Conformational factors could, in principle, contribute to the SCX
fractionation.48 However, the nearly indistinguishable CD and UV-Vis spectra point to
similar overall structures for fractions I-IV (Figure 3-4), making conformational factors an
unlikely culprit for the observed SCX behavior.

82
Figure 3-5. Structures of oxidation products of methionine (MetO, methionine sulfoxide)
and lysine (LysCHO, aminoadipic semialdehyde).
3.3.4. SCX Fractions Represent Specific Proteoforms.
For uncovering the origin of the SCX properties and activity differences of fractions
I-IV we applied a range of MS methods. As an initial step, intact protein mass spectra were
acquired (Figure 3-6). At first glance, the mass distributions of the four fractions appear to
be almost identical, reminiscent of the optical data in Figure 3-4. Each spectrum in Figure
3-6 is dominated by two signals that are spaced +16 Da apart, as expected for MetO
formation at Met80 and/or Met65. In addition, each fraction showed a low intensity signal
close to the mass of unmodified cyt c. In Figure 3-6 these signals were annotated according
to the number (0, 1, 2) of MetO formation events. This interpretation reflects the existing
literature, which assumes that CT specifically targets Met80 and Met65 while leaving other
residues unmodified.17,37-38,47-48,50-51
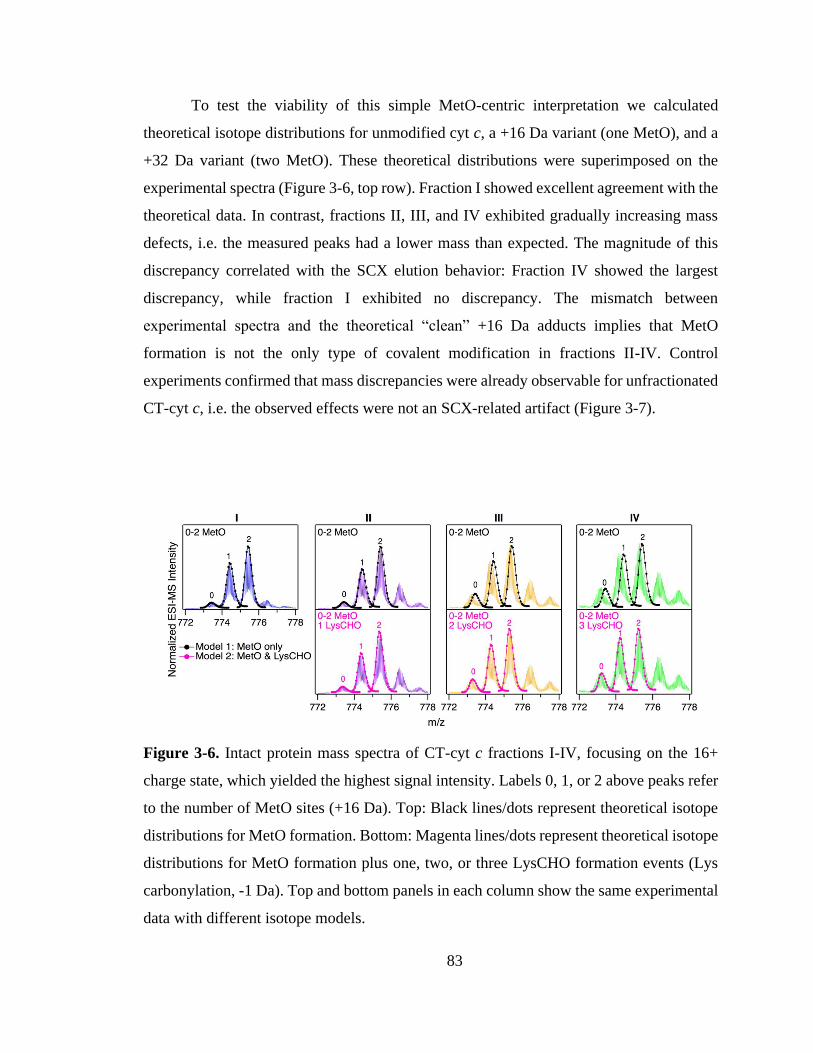
83
To test the viability of this simple MetO-centric interpretation we calculated
theoretical isotope distributions for unmodified cyt c, a +16 Da variant (one MetO), and a
+32 Da variant (two MetO). These theoretical distributions were superimposed on the
experimental spectra (Figure 3-6, top row). Fraction I showed excellent agreement with the
theoretical data. In contrast, fractions II, III, and IV exhibited gradually increasing mass
defects, i.e. the measured peaks had a lower mass than expected. The magnitude of this
discrepancy correlated with the SCX elution behavior: Fraction IV showed the largest
discrepancy, while fraction I exhibited no discrepancy. The mismatch between
experimental spectra and the theoretical “clean” +16 Da adducts implies that MetO
formation is not the only type of covalent modification in fractions II-IV. Control
experiments confirmed that mass discrepancies were already observable for unfractionated
CT-cyt c, i.e. the observed effects were not an SCX-related artifact (Figure 3-7).
Figure 3-6. Intact protein mass spectra of CT-cyt c fractions I-IV, focusing on the 16+
charge state, which yielded the highest signal intensity. Labels 0, 1, or 2 above peaks refer
to the number of MetO sites (+16 Da). Top: Black lines/dots represent theoretical isotope
distributions for MetO formation. Bottom: Magenta lines/dots represent theoretical isotope
distributions for MetO formation plus one, two, or three LysCHO formation events (Lys
carbonylation, -1 Da). Top and bottom panels in each column show the same experimental
data with different isotope models.

84
The missing piece of the puzzle that explains the properties of CT-cyt c is Lys
carbonylation (Figure 3-5). This reaction is known to be facilitated by metal centers (i.e.
heme in cyt c).43 It involves a radical intermediate63 that gets converted to -hydroxylysine.
Elimination of ammonia then produces LysCHO.64 Each LysCHO formation event is
accompanied by a -1 Da shift.41,64 Compilations of known oxidative protein modifications
reveals LysCHO formation to be the only process associated with a -1 Da shift.42-43 The
direct MS-based detection of LysCHO sites will be discussed below.
Figure 3-7. Intact protein ESI mass spectra of cyt c before (red) and after (magenta) CT
treatment, but prior to SCX fractionation. Panels A and C depict the total charge state
envelope, where panels B and D show a magnified view of the 16+ charge state. The data
for unmodified cyt c are overlaid with a simulated isotopic distribution. The CT-cyt c mass
spectrum is overlaid with simulated isotopic distributions for Met oxidation (+16 and +32
Da, respectively). Major discrepancies are observable between simulated and experimental
isotopic envelopes for CT-cyt c. These discrepancies are caused by the presence of
LysCHO sites under the conditions of C/D.

85
Returning to Figure 3-6, revised modeling of the mass spectra to account for a
combination of MetO (+16 Da) and LysCHO formation (-1 Da) resulted in excellent
agreement between experimental and simulated spectra for all fractions (Figure 3-6, bottom
row). The isotope models suggest that fractions I, II, III, and IV carry 0, 1, 2, and 3 LysCHO
groups, respectively. These modifications are in addition to MetO formation at Met80 and
Met65.17,37-38,47-48,50-51
The different numbers of LysCHO groups provide an explanation for the SCX
behavior of the four fractions. The SCX strategy used here separates proteins on the basis
of their overall cationic charge; each LysCHO site reduces this charge by one unit.41-42,64
In fraction I, the lack of Lys modifications causes the most positive surface charge, similar
to that of unmodified cyt c (pI 9.6).65 Hence, fraction I (and unmodified cyt c) interact most
tightly with the SCX column, resulting in the largest elution volume (Figure 3-3A). On the
other extreme, fraction IV with its three LysCHO has lost three positive charges, causing
those proteins to interact most weakly with the column. The behavior of fractions II and III
falls in-between these two extremes.
In summary, LysCHO formation accounts for the previously unexplained
observation37-38,47-48 that CT-cyt c can be fractionated by SCX. LysCHO has been shown
to play a role in the peroxidase activation of cyt c by H2O2.41 However, LysCHO formation
in cyt c has not been reported for oxidizing agents other than H2O2. The number of LysCHO
sites is the only detectable difference in the covalent structures of fractions I-IV, implying
that LysCHO formation must be responsible for their different activities. Combining the
information of Figure 3-3B and Figure 3-6, the peroxidase activity can be ranked according
to the number of LysCHO: fraction I (0 LysCHO) < fraction II (1 LysCHO) < fraction III
(2 LysCHO) fraction IV (3 LysCHO).
86
3.3.5. Top-Down CID-IM-MS for Proteoform-Selective Analysis.
Mapping of LysCHO sites poses significant analytical challenges.66 Typical
bottom-up MS assays struggle with this task due to LysCHO-induced interference with
tryptic cleavage and losses of ionization/fragmentation efficiency.42,67-68 Thus, it is not
surprising that previous MS investigations failed to detect LysCHO in CT-cyt c.17-18,37-38,45-
48,50-51 To address these challenges we applied top-down MS/MS, i.e. gas phase
fragmentation of undigested proteins.69 Initial attempts were unsuccessful due to the
complexity of the fragment ion spectra. This problem was solved by incorporating ion
mobility (IM) spectrometry to provide an additional separation dimension, thereby
implementing a “top-down CID-IM-MS” workflow (Figure 3-8). Similar experiments have
previously been applied to simple model systems,70-72 but this work marks the first time
that such an approach was used for tracking unknown biologically relevant modifications.
For validation, top-down CID-IM-MS was initially applied to peak 1 of fraction I
(which is devoid of LysCHO) to examine the initial MetO formation event (Figure 3-9).
All C-terminal fragments starting at y25 showed a +16 Da shift relative to unmodified cyt
c. The y25 to y24 transition allowed the oxidation site to be identified as Met80 with single-
residue resolution. The presence of other oxidation sites in peak 1 (including Met65) could
be ruled out. Measurements on peak 2 (+32 Da) verified Met80 and Met65 as the only two
oxidation sites in fraction I (Figure 3-10). Taken together, these data imply that CT-induced
MetO formation is a sequential process, with Met80 as the initial oxidation target whereas
Met65 is affected at a later stage.
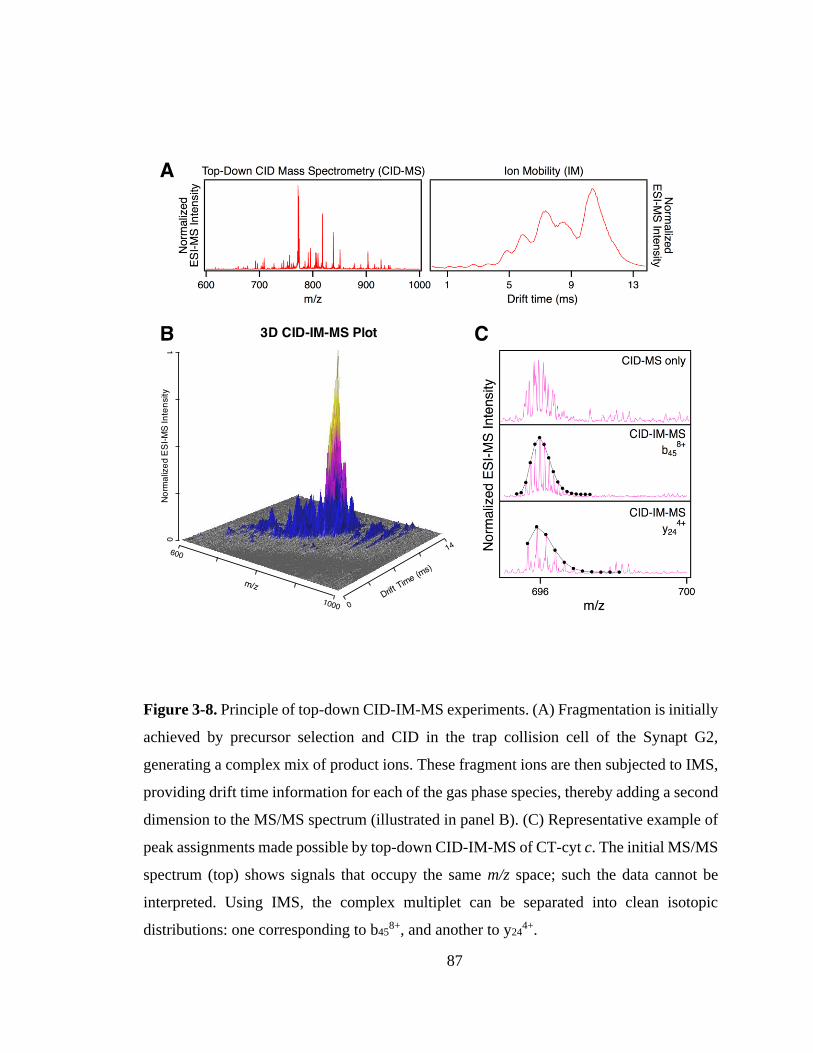
87
Figure 3-8. Principle of top-down CID-IM-MS experiments. (A) Fragmentation is initially
achieved by precursor selection and CID in the trap collision cell of the Synapt G2,
generating a complex mix of product ions. These fragment ions are then subjected to IMS,
providing drift time information for each of the gas phase species, thereby adding a second
dimension to the MS/MS spectrum (illustrated in panel B). (C) Representative example of
peak assignments made possible by top-down CID-IM-MS of CT-cyt c. The initial MS/MS
spectrum (top) shows signals that occupy the same m/z space; such the data cannot be
interpreted. Using IMS, the complex multiplet can be separated into clean isotopic
distributions: one corresponding to b458+, and another to y24
4+.

88
Figure 3-9. Top-down CID-IM-MS data that pinpoint MetO formation in fraction I. The
sequence is shown along the top, with key fragments indicated. Bottom: Selected fragment
ions from an unmodified control (red), and from peak 1 of fraction I (blue, see Figure 3-6).
Lines/dots represent theoretical isotope distributions calculated for unmodified fragments
(“no ox.”), or for MetO containing fragments. Met80 is the only covalent modification in
peak 1 of fraction I.
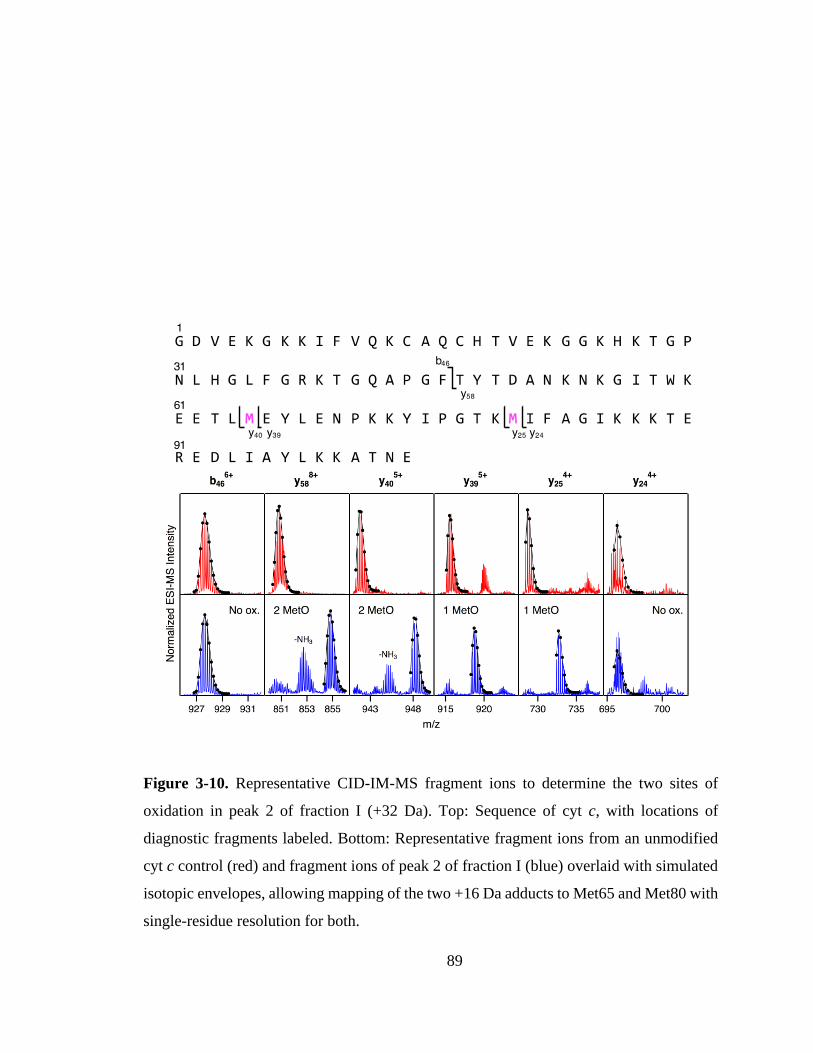
89
Figure 3-10. Representative CID-IM-MS fragment ions to determine the two sites of
oxidation in peak 2 of fraction I (+32 Da). Top: Sequence of cyt c, with locations of
diagnostic fragments labeled. Bottom: Representative fragment ions from an unmodified
cyt c control (red) and fragment ions of peak 2 of fraction I (blue) overlaid with simulated
isotopic envelopes, allowing mapping of the two +16 Da adducts to Met65 and Met80 with
single-residue resolution for both.
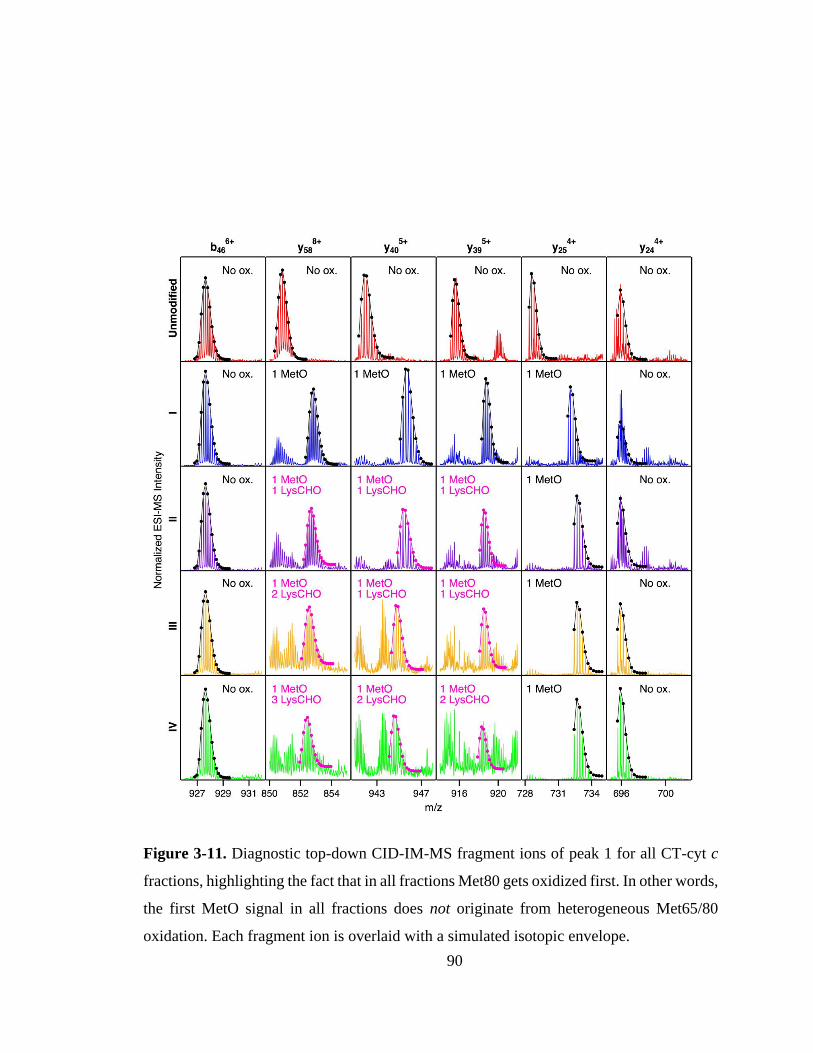
90
Figure 3-11. Diagnostic top-down CID-IM-MS fragment ions of peak 1 for all CT-cyt c
fractions, highlighting the fact that in all fractions Met80 gets oxidized first. In other words,
the first MetO signal in all fractions does not originate from heterogeneous Met65/80
oxidation. Each fragment ion is overlaid with a simulated isotopic envelope.
91
3.3.6. Mapping of LysCHO Sites.
We next sought to identify the locations of LysCHO groups in fractions II, III, and
IV by top-down CID-IM-MS. According to Figure 3-6, these fractions possess 1, 2, and 3
carbonylation sites, respectively. LysCHO sites can be identified from -1 Da mass shifts of
fragment ions. The experiments were facilitated by the fact that, fortuitously, peak 1 in all
fractions corresponded exclusively to MetO formation at Met80 (Figure 3-11). Thus,
LysCHO sites in the various fractions could be mapped via comparisons with fraction I
fragments. By using this internal reference, we could unequivocally rule out calibration
errors as an explanation for the observed -1 Da shifts. Our assignments were further
verified by simulated isotope distributions that were overlaid onto the experimental spectra.
Figure 3-12 reveals that for all fractions, N-terminal fragments up to b46, as well as
C-terminal fragments up to y29 were indistinguishable from those of fraction I. This finding
confines all LysCHO sites to residues 47-75 which comprise five out of the total 19 Lys
residues. In fraction II, y-ions from y38 to y58 showed a -1 Da shift. The y38 to y29 transition
narrowed down the location of this modification to 67YLENPKKYI75. Hence, the single
LysCHO site in Fraction II is located on Lys72 or Lys73 (Figure 3-12, second row).
Fraction III also showed a y38 to y29 -1 Da transition, implying one LysCHO
modification on Lys72/73. An additional transition took place between y40 and y58,
localizing the second LysCHO site to the region 49TDANKNKGITWKEETLM65. Thus,
the second modification site in Fraction III is located on Lys53, Lys55, or Lys60 (Figure
3-12, third row).
Pinpointing the three LysCHO sites in Fraction IV was complicated by diminished
fragmentation efficiencies that translated into low S/N ratios. This phenomenon likely
reflects the loss of protonation sites after LysCHO formation, keeping in mind that the
proximity to H+ sites favors b/y ion formation.73-75 y58 exhibited a mass shift of -3 Da
(Figure 3-12, bottom row), confirming the presence of three LysCHO sites, as inferred
from Figure 3-6. From the fragment ion mass shifts in Figure 3-12 (bottom row), the
predominant modification pattern of fraction IV appears to be a single LysCHO in the

92
Lys53/55/60 range, plus two LysCHO at Lys72/73. However, we cannot rule out that the
final LysCHO formation event also affects Lys53/55/60 to some extent. The similar
peroxidase activities of fractions III and IV suggest that this third LysCHO is of minor
functional importance. Experiments analogous to those of Figure 3-12 were conducted on
peak 2 of each fraction, yielding LysCHO patterns similar to those of peak 1 (Figure 3-13).
Figure 3-12. Selected top-down CID-IM-MS ions generated by fragmentation of peak 1
from fractions I (blue), II (violet), III (orange), and IV (green). Each fragment ion is
overlaid with its simulated isotopic envelope (lines/dots). Vertical dashed lines were
included as visual aid to highlight LysCHO-related -1 Da mass shifts.
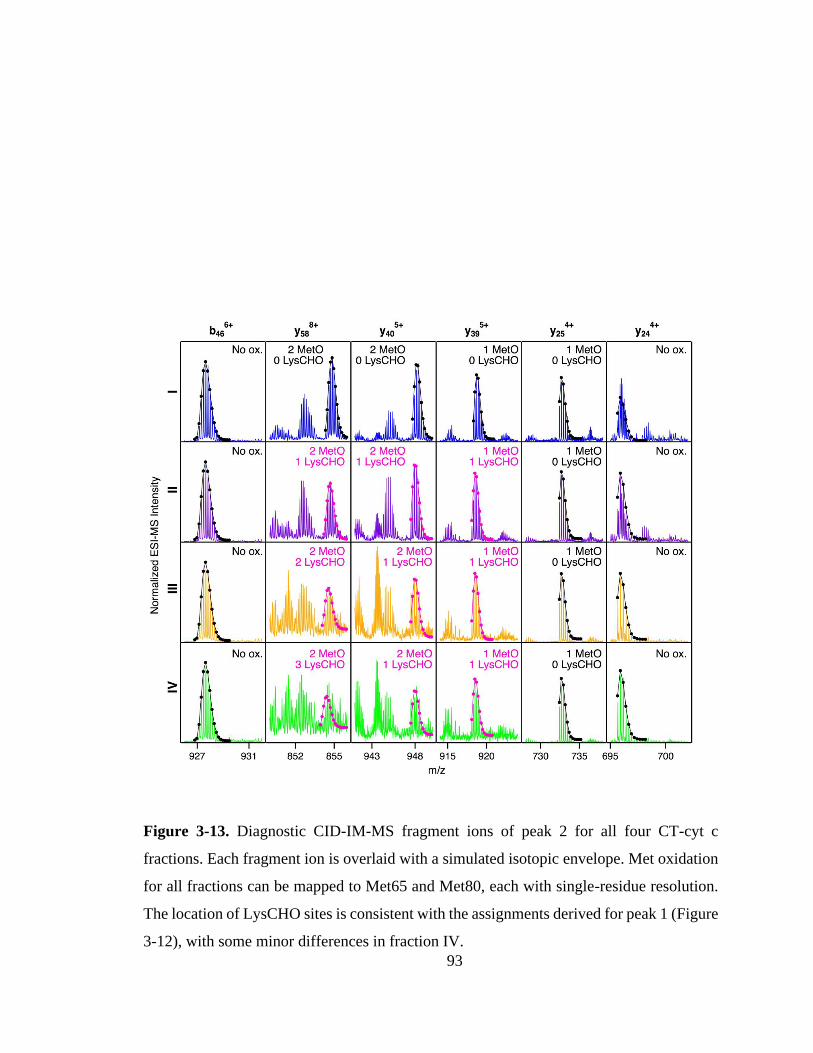
93
Figure 3-13. Diagnostic CID-IM-MS fragment ions of peak 2 for all four CT-cyt c
fractions. Each fragment ion is overlaid with a simulated isotopic envelope. Met oxidation
for all fractions can be mapped to Met65 and Met80, each with single-residue resolution.
The location of LysCHO sites is consistent with the assignments derived for peak 1 (Figure
3-12), with some minor differences in fraction IV.

94
Figure 3-12 implies that CT-mediated LysCHO formation is a well-ordered process.
Starting from LysCHO-free protein (fraction I), carbonylation initially affects Lys72/73
(fraction II). The next carbonylation event takes place in the Lys53/55/60 region,
generating fraction III. The final LysCHO site may affect Lys72/73 or Lys53/55/60. As
noted above, MetO formation is also a sequential process, initially affecting Met80 and
subsequently Met65.
3.3.7. LC-MS/MS Peptide Mapping Revisited.
The detection of LysCHO sites by top-down CID-IM-MS may seem at odds with
previous studies on CT-cyt c that only found MetO formation.17,37-38,47 In intact protein MS
data the small (-1 Da) mass shifts associated with LysCHO formation are easily overlooked,
unless the spectra are carefully scrutinized via isotope modeling (Figure 3-6). Similarly,
LysCHO detection by traditional tryptic digestion LC-MS/MS (e.g. Figure 3-2) is difficult
due to reduced fragmentation resulting from charge site loss, and suppression of tryptic
cleavage.42,73-75 These issues are exacerbated for the situation encountered here, where up
to three LysCHO sites are confined to a fairly narrow sequence range (Lys53/55/60/72/73).
Armed with the information from top-down CID-IM-MS, we revisited the tryptic
digestion LC-MS/MS workflow with careful optimization of experimental parameters.
Gratifyingly, we were able to confirm carbonylation of Lys72 in the missed-cleavage
peptide T13-14 (residues 61-73, Figure 3-14). Consistent with the data reported above, this
LysCHO peptide was found in fractions II-IV, but not in fraction I. No other LysCHO sites
were detected by LC-MS/MS. Thus, the top-down CID-IM-MS workflow is superior for
this type of application, as it allowed the detection of all three carbonylation sites (Figure
3-12).

95
Figure 3-14. LC-MS/MS analysis of tryptic peptide T13-14 (61EETLMEYLENPKK73) in
unfractionated CT-cyt c. Three LC separated variants were interrogated: unmodified (red),
with Met65 oxidation (blue), and with both Met65 oxidation and Lys72 carbonylation
(black). Top: fragment ion spectra. Bottom: Magnified views of representative fragment
ions, highlighting +16 Da (MetO) and -1 Da (LysCHO) mass shifts. Ions denoted with an
asterisk contain the LysCHO site. Simulated isotopic envelopes are shown as circles. Much
lower collision energies (CE) were required for adequate fragmentation of the carbonylated
peptide.
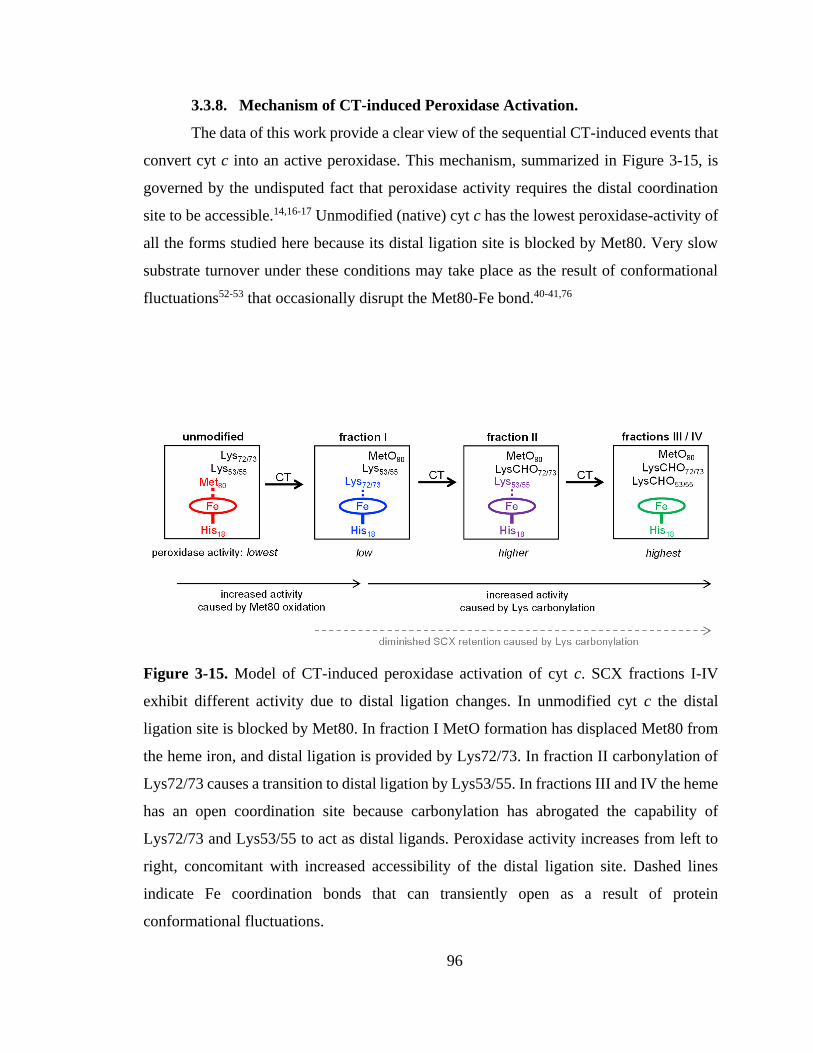
96
3.3.8. Mechanism of CT-induced Peroxidase Activation.
The data of this work provide a clear view of the sequential CT-induced events that
convert cyt c into an active peroxidase. This mechanism, summarized in Figure 3-15, is
governed by the undisputed fact that peroxidase activity requires the distal coordination
site to be accessible.14,16-17 Unmodified (native) cyt c has the lowest peroxidase-activity of
all the forms studied here because its distal ligation site is blocked by Met80. Very slow
substrate turnover under these conditions may take place as the result of conformational
fluctuations52-53 that occasionally disrupt the Met80-Fe bond.40-41,76
Figure 3-15. Model of CT-induced peroxidase activation of cyt c. SCX fractions I-IV
exhibit different activity due to distal ligation changes. In unmodified cyt c the distal
ligation site is blocked by Met80. In fraction I MetO formation has displaced Met80 from
the heme iron, and distal ligation is provided by Lys72/73. In fraction II carbonylation of
Lys72/73 causes a transition to distal ligation by Lys53/55. In fractions III and IV the heme
has an open coordination site because carbonylation has abrogated the capability of
Lys72/73 and Lys53/55 to act as distal ligands. Peroxidase activity increases from left to
right, concomitant with increased accessibility of the distal ligation site. Dashed lines
indicate Fe coordination bonds that can transiently open as a result of protein
conformational fluctuations.

97
CT-induced oxidation of Met80 generates fraction I, an “alkaline” conformer where
Lys72 or Lys73 has moved into the ligation site previously occupied by Met80. This
ligation switch is supported by RR data37 as well as NMR and EPR experiments.38 While
the enhanced peroxidase activity of alkaline Lys-Fe conformers is well documented,38 the
origin of this effect is somewhat unclear because transient opening of the Lys-Fe contact
takes place more slowly than for Met-Fe.34,77 Likely, the enhanced activity of fraction I is
not caused by hexacoordinated Lys-Fe species per se, but by pentacoordinated structures
that are part of the fraction I ensemble.14,38 RR spectra are consistent with this interpretation,
suggesting the presence of ~15% pentacoordinated protein in the predominantly Lys-Fe
coordinated fraction I (“peak A” in Figure S13 of ref. 37). Other factors may contribute to
the peroxidase activity of Lys-ligated cyt c as well,41 one of these is the increased heme
pocket volume which facilitates substrate access.19,77
As the next step in Figure 3-15, carbonylation abrogates the iron ligating capability
of Lys72/73, thereby generating fraction II. Fraction II still does not represent a genuine
pentacoordinated conformer, evident from the fact that subsequent Lys53/55 carbonylation
further enhances peroxidase activity (our MS data suggested the possible participation of
Lys60, but we exclude this residue for reasons outlined below). Our data are thus consistent
with a scenario where Lys53/55 participate in iron ligation in fraction II. However, these
Lys53/55-Fe contacts must be quite labile, evident from the fact that fraction II has a higher
activity than both fraction I and unmodified cyt c (Figure 3-3B). Carbonylation of Lys53/55
subsequently produces fraction III which possesses a permanently open distal site and
shows the highest peroxidase activity. RR data confirm that fraction III is pentacoordinated,
as expected for a functional peroxidase.37 A final carbonylation event produces fraction IV
which retains both an open distal site and peroxidase activity.
The essential point in the activation cascade of Figure 3-15 is that CT-induced
Met80 oxidation only results in a moderate level of peroxidase activity, because the distal
site remains congested by Lys ligation. Subsequent CT-induced LysCHO formation frees
up the distal site, thereby producing a genuine pentacoordinated heme. Previous work
attributed the peroxidase activity of CT-cyt c exclusively to MetO formation,17-18,37-38,44-47
98
failing to recognize the occurrence and mechanistic significance of Lys carbonylation. Our
data reveal that MetO formation only represents an initial step en route toward peroxidase-
activated CT-cyt c. Lys carbonylation represents a co-activator that boosts the activity by
a factor of ~4 (fractions III/IV) relative to the MetO-only form (fraction I, see Figure 3-3).
The model of Figure 3-15 provides a simple explanation for the correlation between
the activity of the CT-cyt c fractions and their SCX behavior: both factors are directly tied
to the number of LysCHO sites. When accounting for the SCX fractionation behavior, one
has to remember that while the protein interacts with the anionic stationary phase, it may
adopt structures and ligation scenarios that differ from the bulk solution conformations of
Figure 3-15.78
The ability of cyt c to adopt various distal ligation scenarios is consistent with the
foldon model that dissects the protein into regions of different stability (Figure 3-16).52 The
gray and red foldons (40-57 and 71-85 Ω loops, respectively) show the highest flexibility.52
Not surprisingly, the alternative Fe ligands identified above are located in these two flexible
regions, i.e. Lys72/73 (red) and Lys53/55 (gray). Opening of gray79 and red53 has
previously been linked to alkaline conformers. The flexibility of gray and red also governs
the CT-induced transitions outlined in Figure 3-15. In native cyt c the red foldon is
anchored by the Met80-Fe linkage.52-53,79 Our data suggest that MetO formation sterically
perturbs this (already labile)52 region, thereby triggering rearrangements that allow
Lys72/73 to move into the distal site.53 The foldon hierarchy dictates that red can only open
up when gray is already unfolded.52-53,79 Hence, after carbonylation of Lys72/73, the
plasticity of the unfolded gray foldon will allow Lys53/55 to move into the vacated distal
site. Our MS data suggest that Lys60 could also participate in Fe ligation, but its placement
in the relatively rigid yellow foldon renders such a scenario less likely (Figure 3-16).
Our data do not provide evidence for carbonylation of Lys79. In principle, this
residue represents another possible ligand that might block access to the iron after Met80
oxidation.38 However, evidence for such Lys79-Fe contacts comes primarily from work on
K72A yeast iso-1 cyt c which has coordination propensities that are different from those of

99
the horse wild type studied here.38 Our findings suggest that Lys79-Fe contacts do not play
a major role in Met80-oxidized horse cyt c, such that peroxidase activation is attainable
without Lys79 carbonylation.
Figure 3-16. Foldon structure of cyt c. Colors indicate the propensity to undergo transient
unfolding: gray (least stable) > red > yellow > green > blue (most stable). Also shown are
Lys side chains (magenta) that can act as distal Fe ligands during CT-induced peroxidase
activation. Lys72/73 are in the “red” foldon (second-least stable, 71-85 loop). Lys53/55
are in the “gray” foldon (least stable, 40-57 loop). On the basis of our MS results the
participation of Lys60 (not shown) in heme ligation cannot be ruled out, but the positioning
of Lys60 in the relatively rigid “yellow” foldon renders such a scenario less likely. N.B.:
Various terms have been used for the gray foldon; these include “N”, “nested yellow”, “N-
yellow”, “infrared”, and “black”.52,53,79
Lys73
Lys72
Lys55
Lys53
Met80 Fe
100
3.4. Conclusions
Our discovery of multiple, previously unreported carbonylation events in CT-cyt c
calls into question the prevailing Met80-centric view of peroxidase activation, according
to which oxidation of Met80 alone is sufficient for turning cyt c into a pentacoordinated
peroxidase.17-18,37-38,44-45,47-48 The conclusions from a number of those reports have relied
on the alleged fidelity of CT for specific Met oxidation. Several studies pooled the highest
intensity region in the SCX chromatogram, assuming that samples obtained in this way
represent the expected “clean” MetO species.37-38,47-48 Our data strongly suggest that such
samples correspond to fractions II/III, with oxidation at Met80, Met65, and with LysCHO
sites in the Lys72/73 and Lys53/55 range. Carbonylation of these samples enhances their
peroxidase activity almost fourfold relative to fraction I, which represents the true MetO-
only species (Figure 3-3, Figure 3-6). It appears that past studies inadvertently studied
carbonylated CT-cyt c proteoforms, misattributing some of the carbonylation-induced
effects to MetO formation.
Previous studies on CT-cyt c yielded conflicting results, according to whether the
distal site is open,37 or occupied by Lys.38 The present work helps resolve these
discrepancies. CT-cyt c comprises multiple species with different coordination patterns
(Figure 3-15). Thus, any results will depend on the precise experimental conditions used
for isolating protein from the CT-cyt c reaction mixture.
Only four out of the 19 Lys residues in cyt c were identified as possible
carbonylation sites. In native cyt c these four residues are relatively close to the distal face
of the heme, which represents the site of peroxidase catalysis (Figure 3-1). Considering
that all 19 Lys residues are solvent-exposed (Figure 3-17), the spatial selectivity of
LysCHO formation rules out diffusion-mediated oxidation events, where modifications are
governed by solvent accessibility.55 It instead appears that LysCHO formation is heme-
dependent.43,58 This line of thought bolsters our conclusions, as carbonylation of
Lys53/55/72/73 confirms the capability of these residues to come in direct contact with the
heme by serving as alternative Fe ligands (Figure 3-15).
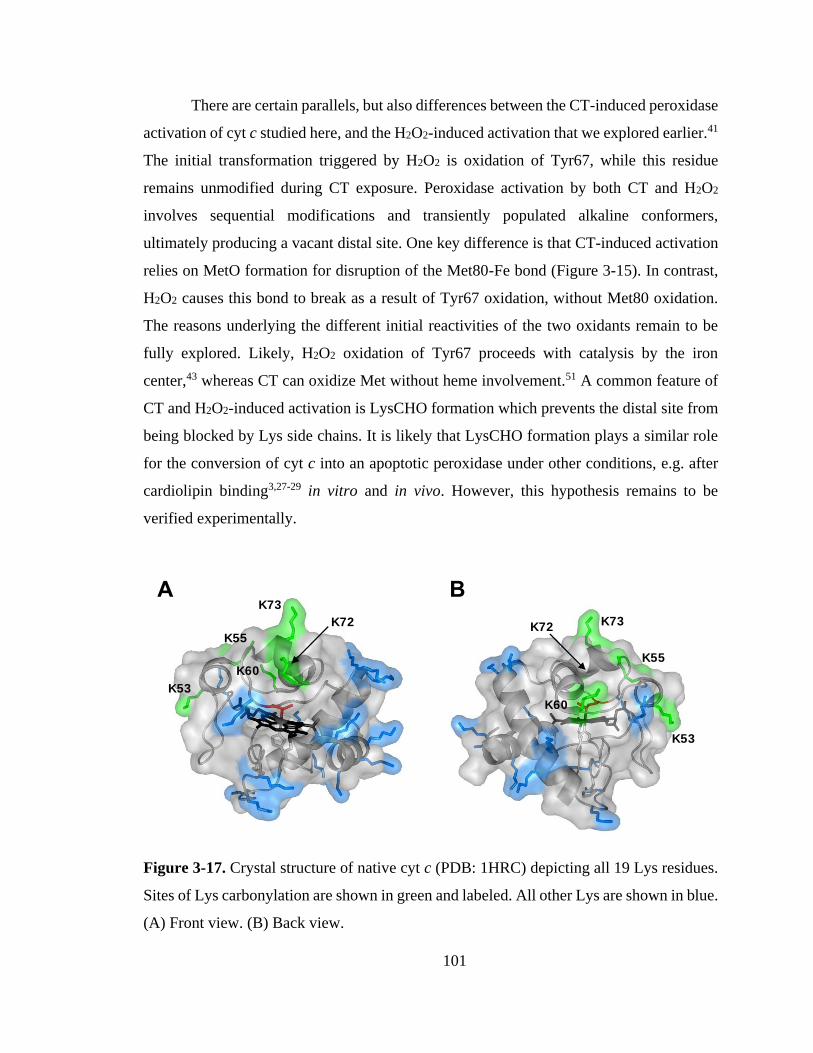
101
There are certain parallels, but also differences between the CT-induced peroxidase
activation of cyt c studied here, and the H2O2-induced activation that we explored earlier.41
The initial transformation triggered by H2O2 is oxidation of Tyr67, while this residue
remains unmodified during CT exposure. Peroxidase activation by both CT and H2O2
involves sequential modifications and transiently populated alkaline conformers,
ultimately producing a vacant distal site. One key difference is that CT-induced activation
relies on MetO formation for disruption of the Met80-Fe bond (Figure 3-15). In contrast,
H2O2 causes this bond to break as a result of Tyr67 oxidation, without Met80 oxidation.
The reasons underlying the different initial reactivities of the two oxidants remain to be
fully explored. Likely, H2O2 oxidation of Tyr67 proceeds with catalysis by the iron
center,43 whereas CT can oxidize Met without heme involvement.51 A common feature of
CT and H2O2-induced activation is LysCHO formation which prevents the distal site from
being blocked by Lys side chains. It is likely that LysCHO formation plays a similar role
for the conversion of cyt c into an apoptotic peroxidase under other conditions, e.g. after
cardiolipin binding3,27-29 in vitro and in vivo. However, this hypothesis remains to be
verified experimentally.
Figure 3-17. Crystal structure of native cyt c (PDB: 1HRC) depicting all 19 Lys residues.
Sites of Lys carbonylation are shown in green and labeled. All other Lys are shown in blue.
(A) Front view. (B) Back view.
A B
K72
K73
K60
K55
K53
K72 K73
K60
K55
K53
102
3.5. References
(1) Alvarez-Paggi, D.; Hannibal, L.; Castro, M. A.; Oviedo-Rouco, S.; Demicheli, V.;
Tórtora, V.; Tomasina, F.; Radi, R.; Murgida, D. H., Chem. Rev. 2017, 117 (21),
13382-13460.
(2) Radi, R.; Thomson, L. M.; Rubbo, H.; Prodanov, E., Arch. Biochem. Biophys. 1991,
288 (1), 112-117.
(3) Kagan, V. E.; Bayır, H. A.; Belikova, N. A.; Kapralov, O.; Tyurina, Y. Y.; Tyurin,
V. A.; Jiang, J.; Stoyanovsky, D. A.; Wipf, P.; Kochanek, P. M.; Greenberger, J. S.;
Pitt, B.; Shvedova, A. A.; Borisenko, G. G., Free Rad. Biol. Med. 2009, 46 (11),
1439-1453.
(4) Godoy, L. C.; Muñoz-Pinedo, C.; Castro, L.; Cardaci, S.; Schonhoff, C. M.; King,
M.; Tórtora, V.; Marín, M.; Miao, Q.; Jiang, J. F.; Kapralov, A. A.; Jemmerson, R.;
Silkstone, G. G.; Patel, J. N.; Evans, J. E.; Wilson, M. l. T.; Green, D. R.; Kagan,
V. E.; Radi, R.; Mannick, J. B., Proc. Natl. Acad. Sci. U.S.A. 2009, 106 (8), 2653-
2658.
(5) Hannibal, L.; Tomasina, F.; Capdevila, D. A.; Demicheli, V.; Tórtora, V.; Alvarez-
Paggi, D.; Jemmerson, R.; Murgida, D. H.; Radi, R., Biochemistry 2016, 55 (3),
407-428.
(6) Liptak, M. D.; Fagerlund, R. D.; Ledgerwood, E. C.; Wilbanks, S. M.; Bren, K. L.,
J. Am. Chem. Soc. 2011, 133 (5), 1153-1155.
(7) McClelland, L. J.; Mou, T.-C.; Jeakins-Cooley, M. E.; Sprang, S. R.; Bowler, B. E.,
Proc. Natl. Acad. Sci. U.S.A. 2014, 111 (18), 6648-6653.
(8) Jenkins, C. M.; Yang, K.; Liu, G.; Moon, S. H.; Dilthey, B. G.; Gross, R. W., J.
Biol. Chem. 2018, 293 (22), 8693-8709.
(9) Veitch, N. C., Phytochem. 2004, 65, 249-259.
(10) Kitt, J. P.; Bryce, D. A.; Minteer, S. D.; Harris, J. M., J. Am. Chem. Soc. 2017.
(11) Oemer, G.; Lackner, K.; Muigg, K.; Krumschnabel, G.; Watschinger, K.; Sailer, S.;
Lindner, H.; Gnaiger, E.; Wortmann, S. B.; Werner, E. R.; Zschocke, J.; Keller, M.
A., Proc. Natl. Acad. Sci. U.S.A. 2018, 115 (16), 4158-4163.
(12) Belikova, N. A.; Vladimirov, Y. A.; Osipov, A. N.; Kapralov, A. A.; Tyurin, V. A.;
Potapovich, M. V.; Basova, L. V.; Peterson, J.; Kurnikov, I. V.; Kagan, V. E.,
Biochemistry 2006, 45 (15), 4998-5009.
(13) Wong, R. S. Y., J. Exp. Clin. Cancer Res. 2011, 30.
103
(14) Diederix, R. E. M.; Ubbink, M.; Canters, G. W., Biochemistry 2002, 41, 13067-
13077.
(15) Bushnell, G. W.; Louie, G. V.; Brayer, G. D., J. Mol. Biol. 1990, 214, 585-595.
(16) Bren, K. L.; Raven, E. L., Science 2017, 356 (6344), 1236-1236.
(17) Chen, Y.-R.; Deterding, L. J.; Sturgeon, B. E.; Tomer, K. B.; Mason, R. P., J. Biol.
Chem. 2002, 277 (33), 29781-29791.
(18) Wang, Z.; Ando, Y.; Nugraheni, A. D.; Ren, C.; Nagao, S.; Hirota, S., Mol. Biosyst.
2014, 10 (12), 3130-3137.
(19) Amacher, J. F.; Zhong, F. F.; Lisi, G. P.; Zhu, M. Q.; Alden, S. L.; Hoke, K. R.;
Madden, D. R.; Pletneva, E. V., J. Am. Chem. Soc. 2015, 137 (26), 8435-8449.
(20) Abriata, L. A.; Cassina, A.; Tortora, V.; Marin, M.; Souza, J. M.; Castro, L.; Vila,
A. J.; Radi, R., J. Biol. Chem. 2009, 284 (1), 17-26.
(21) Josephs, Tracy M.; Morison, Ian M.; Day, Catherine L.; Wilbanks, Sigurd M.;
Ledgerwood, Elizabeth C., Biochem. J. 2014, 458 (2), 259-265.
(22) Karsisiotis, A. I.; Deacon, O. M.; Wilson, M. T.; Macdonald, C.; Blumenschein, T.
M. A.; Moore, G. R.; Worrall, J. A. R., Sci Rep 2016, 6, 30447.
(23) Moreno-Beltran, B.; Guerra-Castellano, A.; Diaz-Quintana, A.; Del Conte, R.;
Garcia-Maurino, S. M.; Diaz-Moreno, S.; Gonzalez-Arzola, K.; Santos-Ocana, C.;
Velazquez-Campoy, A.; De la Rosa, M. A.; Turano, P.; Diaz-Moreno, I., Proc. Natl.
Acad. Sci. U.S.A. 2017, 114 (15), E3041-E3050.
(24) Tognaccini, L.; Ciaccio, C.; D'Oria, V.; Cervelli, M.; Howes, B. D.; Coletta, M.;
Mariottini, P.; Smulevich, G.; Fiorucci, L., J. Inorg. Biochem. 2016, 155, 56-66.
(25) Ciaccio, C.; Tognaccini, L.; Battista, T.; Cervelli, M.; Howes, B. D.; Santucci, R.;
Coletta, M.; Mariottini, P.; Smulevich, G.; Fiorucci, L., J. Inorg. Biochem. 2017,
169, 86-96.
(26) Wang, Z.-H.; Lin, Y.-W.; Rosell, F. I.; Ni, F.-Y.; Lu, H.-J.; Yang, P.-Y.; Tan, X.-
S.; Li, X.-Y.; Huang, Z.-X.; Mauk, A. G., ChemBioChem 2007, 8 (6), 607-609.
(27) Abe, M.; Niibayashi, R.; Koubori, S.; Moriyama, I.; Miyoshi, H., Biochemistry
2011, 50 (39), 8383-8391.
(28) Serpas, L.; Milorey, B.; Pandiscia, L. A.; Addison, A. W.; Schweitzer-Stenner, R.,
J. Phys. Chem. B 2016, 120, 12219−12231.
(29) Bradley, J. M.; Silkstone, G.; Wilson, M. T.; Cheesman, M. R.; Butt, J. N., J. Am.
Chem. Soc. 2011, 133 (49), 19676-19679.

104
(30) Assfalg, M.; Bertini, I.; Dolfi, A.; Turano, P.; Mauk, A. G.; Rosell, F. I.; Gray, H.
B., J. Am. Chem. Soc. 2003, 125, 2913-2922.
(31) Nold, S. M.; Lei, H.; Mou, T.-C.; Bowler, B. E., Biochemistry 2017, 56, 3358–3368.
(32) García-Heredia, J. M.; Díaz-Moreno, I.; Nieto, P. M.; Orzáez, M.; Kocanis, S.;
Teixeira, M.; Pérez-Payá, E.; Díaz-Quintana, A.; De la Rosa, M. A., Biochim.
Biophys. Acta 2010, 1797 (6–7), 981-993.
(33) Döpner, S.; Hildebrandt, P.; Rosell, F. I.; Mauk, A. G., J. Am. Chem. Soc. 1998,
120, 11246-11255.
(34) Rosell, F. I.; Ferrer, J. C.; Mauk, A. G., J. Am. Chem. Soc. 1998, 120 (44), 11234-
11245.
(35) Gu, J.; Shin, D.-W.; Pletneva, E. V., Biochemistry 2017, 56, 2950−2966.
(36) Garcia-Heredia, J. M.; Diaz-Quintana, A.; Salzano, M.; Orzaez, M.; Perez-Paya, E.;
Teixeira, M.; De la Rosa, M. A.; Diaz-Moreno, I., J. Biol. Inorg. Chem. 2011, 16
(8), 1155-68.
(37) Capdevila, D. A.; Marmisolle, W. A.; Tomasina, F.; Demicheli, V.; Portela, M.;
Radi, R.; Murgida, D. H., Chem. Sci. 2015, 6 (1), 705-713.
(38) Zhong, F.; Pletneva, E. V., Inorg. Chem. 2018, 57 (10), 5754-5766.
(39) Capdevila, D. A.; Alvarez-Paggi, D.; Castro, M. A.; Tortora, V.; Demicheli, V.;
Estrin, D. A.; Radi, R.; Murgida, D. H., Chem. Commun. 2014, 50 (20), 2592-2594.
(40) Deacon, O. M.; Svistunenko, D. A.; Moore, G. R.; Wilson, M. T.; Worrall, J. A. R.,
Biochemistry 2018, 57 (29), 4276-4288.
(41) Yin, V.; Shaw, G. S.; Konermann, L., J. Am. Chem. Soc. 2017, 139, 15701–15709.
(42) Bachi, A.; Dalle-Donne, I.; Scaloni, A., Chem. Rev. 2013, 113 (1), 596-698.
(43) Møller, I. M.; Rogowska-Wrzesinska, A.; Rao, R. S. P., J. Proteomics 2011, 74
(11), 2228-2242.
(44) Lushington, G. H.; Cowley, A. B.; Silchenko, S.; Lukat-Rodgers, G. S.; Rodgers,
K. R.; Benson, D. R., Inorg. Chem. 2003, 42 (23), 7550-7559.
(45) Birk, A. V.; Chao, W. M.; Liu, S. Y.; Soong, Y.; Szeto, H. H., Biochim. Biophys.
Acta 2015, 1847 (10), 1075-1084.
(46) Nugraheni, A. D.; Ren, C. G.; Matsumoto, Y.; Nagao, S.; Yamanaka, M.; Hirota,
S., J. Inorg. Biochem. 2018, 182, 200-207.

105
(47) Parakra, R. D.; Kleffmann, G. N. L.; Jameson, T.; Ledgerwood, E. C., Dalton Trans.
2018, 47, 9128-9135.
(48) Pande, J.; Kinnally, K.; Thallum, K. K.; Verma, B. C.; Myer, Y. P.; Rechsteiner,
L.; Bosshard, H. R., J. Protein Chem. 1987, 6 (4), 295-319.
(49) Mushran, S. P.; Agrawal, M. C.; Prasad, B., J. Chem. Soc. B 1971, 0 (8), 1712-1714.
(50) Michel, B.; Proudfoot, A. E. I.; Wallace, C. J. A.; Bosshard, H. R., Biochemistry
1989, 28 (2), 456-462.
(51) Shechter, Y.; Burstein, Y.; Patchornik, A., Biochemistry 1975, 14 (20), 4497-4503.
(52) Hu, W. B.; Kan, Z. Y.; Mayne, L.; Englander, S. W., Proc. Natl. Acad. Sci. U.S.A.
2016, 113 (14), 3809-3814.
(53) Maity, H.; Rumbley, J. N.; Englander, S. W., Proteins 2006, 63 (2), 349-355.
(54) Jones, L. M.; Sperry, J. B.; Carroll, J. A.; Gross, M. L., Anal. Chem. 2011, 83, 7657-
7661.
(55) Xu, G.; Chance, M. R., Chem. Rev. 2007, 107, 3514-3543.
(56) Kathiresan, M.; English, A. M., Chem. Sci. 2017, 8 (2), 1152-1162.
(57) Sharp, J. S.; Becker, J. M.; Hettich, R. L., Anal. Chem. 2004, 76, 672-683.
(58) Bridgewater, J. D.; Lim, J.; Vachet, R. W., Anal. Chem. 2006, 78, 2432-2438.
(59) Baldwin, D. A.; Marques, H. M.; Pratt, J. M., J. Inorg. Biochem. 1987, 30, 203-217.
(60) Giorgio, M.; Trinei, M.; Migliaccio, E.; Pelicci, P. G., Nat. Rev. Mol. Cell Biol.
2007, 8 (9), 722A-728.
(61) Kelly, S. W.; Jess, T. J.; Price, N. C., Biochim. Biophys. Acta 2005, 1751, 119-139.
(62) Kaminsky, L. S.; Miller, V. J.; Davison, A. J., Biochemistry 1973, 12, 2215-2221.
(63) Chen, Y. R.; Chen, C. L.; Liu, X. P.; Li, H. T.; Zweier, J. L.; Mason, R. P., Free
Radic. Biol. Med. 2004, 37 (10), 1591-1603.
(64) Requena, J. R.; Chao, C.-C.; Levine, R. L.; Stadtman, E. R., Proc. Natl. Acad. Sci.
U.S.A. 2001, 98 (1), 69-74.
(65) Graf, M.; Garcia, R. G.; Watzig, H., Electrophoresis 2005, 26 (12), 2409-2417.
(66) Chung, W. G.; Miranda, C. L.; Maier, C. S., Electrophoresis 2008, 29 (6), 1317-
1324.

106
(67) Temple, A.; Yen, T.-Y.; Gronert, S., J. Am. Soc. Mass Spectrom. 2006, 17, 1172-
1180.
(68) Artemenko, K.; Mi, J.; Bergquist, J., Free Radical Res. 2015, 49 (5), 477-493.
(69) Siuti, N.; Kelleher, N. L., Nat. Methods 2007, 4, 817-821.
(70) Zinnel, N. F.; Pai, P.-J.; Russell, D. H., Anal. Chem. 2012, 84 (7), 3390-3397.
(71) Polasky, D. A.; Lermyte, F.; Nshanian, M.; Sobott, F.; Andrews, P. C.; Loo, J. A.;
Ruotolo, B. T., Anal. Chem. 2018, 90 (4), 2756-2764.
(72) Halgand, F.; Habchi, J.; Cravello, L.; Martinho, M.; Guigliarelli, B.; Longhi, S.,
Anal. Chem. 2011, 83, 7306-7315.
(73) Dongré, A. R.; Jones, J. L.; Somogyi, Á.; Wysocki, V. H., J. Am. Chem. Soc. 1996,
118, 8365-8374.
(74) Paizs, B.; Suhai, S., Mass Spectrom. Rev. 2005, 24, 508-548.
(75) Greer, S. M.; Holden, D. D.; Fellers, R.; Kelleher, N. L.; Brodbelt, J. S., J. Am. Soc.
Mass Spectrom. 2017, 28, 1587-1599.
(76) Tomášková, N.; Varhač, R.; Lysáková, V.; Musatov, A.; Sedlák, E., Biochim.
Biophys. Acta 2018, 1866, 1073–1083.
(77) Deng, Y.; Zhong, F.; Alden, S. L.; Hoke, K. R.; Pletneva, E. V., Biochemistry 2018,
57, 5827-5840.
(78) Guo, J.; Carta, G., J. Chromatogr. A 2015, 1388, 184-194.
(79) Krishna, M. M. G.; Lin, Y.; Rumbley, J. N.; Englander, S. W., J. Mol. Biol. 2003,
331, 29-36.

107
Chapter 4. Delineating Heme-Mediated versus Direct Protein
Oxidation Pathways in Peroxidase-Activated Cytochrome c
4.1. Introduction
Covalent protein modifications by reactive oxygen species (ROS) impact numerous
biological functions.1-6 The presence of ROS is an unavoidable consequence of aerobic
cellular respiration.7 Protein oxidative modifications have been implicated in numerous
aging and neurodegenerative pathologies.6,8-10 Protein oxidation is also involved in sensing
and signaling,11-13 and it plays a major role for the efficacy and storage stability of protein
therapeutics.14-16 Most protein oxidation events culminate in oxygen incorporation into side
chains, e.g. Met → MetO (sulfoxide, +16 Da), Tyr → Tyr-OH (+16 Da), Lys-CH2-NH2 →
Lys-CHO (carbonylation, -1 Da). Numerous additional oxidation pathways exist, and many
residues can form various products (e.g., -2, +4, +16, +32, or +48 Da for Trp).17-21 In
addition to oxidative modifications that occur within living cells, ROS can induce protein
oxidation in vitro. Experimental strategies have been developed that use this approach for
monitoring the solvent accessibility of individual side chains.20-26 In vitro oxidative
modifications also provide the opportunity to investigate oxidation-induced changes in
protein structure, dynamics, and function.5,13,25,27-30
Regardless of context (i.e. in living cells or in the test tube), many aspects of protein
oxidation are complex and incompletely understood. For example, side chain oxidation by
∙OH can be a relatively simple process that starts with addition to a double bond or
hydrogen abstraction, followed by quenching of the protein radical by an oxygen-
containing species.22 However, ∙OH can also act via mechanisms that are more convoluted,
by producing secondary oxidants which then attack the protein.3,5,31-32
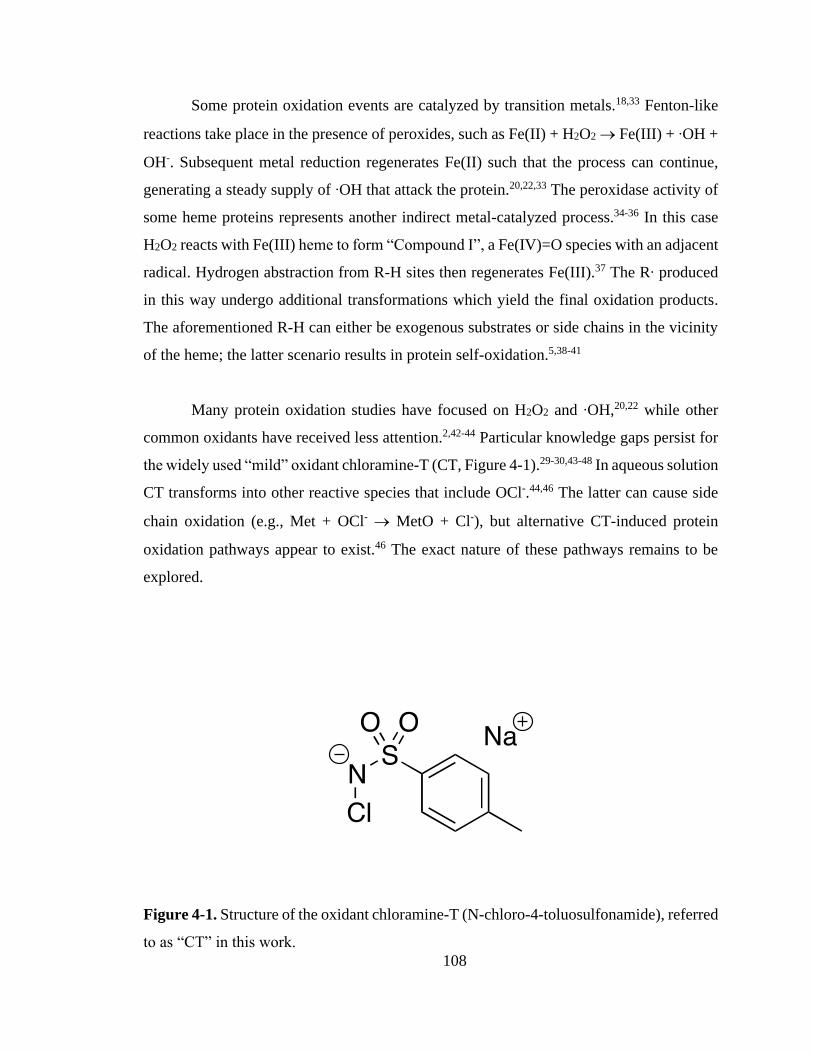
108
Some protein oxidation events are catalyzed by transition metals.18,33 Fenton-like
reactions take place in the presence of peroxides, such as Fe(II) + H2O2 → Fe(III) + ∙OH +
OH-. Subsequent metal reduction regenerates Fe(II) such that the process can continue,
generating a steady supply of ∙OH that attack the protein.20,22,33 The peroxidase activity of
some heme proteins represents another indirect metal-catalyzed process.34-36 In this case
H2O2 reacts with Fe(III) heme to form “Compound I”, a Fe(IV)=O species with an adjacent
radical. Hydrogen abstraction from R-H sites then regenerates Fe(III).37 The R∙ produced
in this way undergo additional transformations which yield the final oxidation products.
The aforementioned R-H can either be exogenous substrates or side chains in the vicinity
of the heme; the latter scenario results in protein self-oxidation.5,38-41
Many protein oxidation studies have focused on H2O2 and ∙OH,20,22 while other
common oxidants have received less attention.2,42-44 Particular knowledge gaps persist for
the widely used “mild” oxidant chloramine-T (CT, Figure 4-1).29-30,43-48 In aqueous solution
CT transforms into other reactive species that include OCl-.44,46 The latter can cause side
chain oxidation (e.g., Met + OCl- → MetO + Cl-), but alternative CT-induced protein
oxidation pathways appear to exist.46 The exact nature of these pathways remains to be
explored.
Figure 4-1. Structure of the oxidant chloramine-T (N-chloro-4-toluosulfonamide), referred
to as “CT” in this work.

109
Oxidative modifications of cytochrome c (cyt c, Figure 4-2) have attracted major
attention over the past few years.25,29-30,41,44,47,49-53 Cyt c acts as an electron transporter in
the respiratory chain by cycling between its Fe(II)/(III) heme oxidation states.54 In addition,
cyt c can act as a peroxidase that catalyzes the oxidation of cardiolipin in mitochondria, a
key step during apoptosis.53,55-58 Interestingly, the peroxidase activity of native cyt c is very
low because the heme iron is fenced in by a 6-coordinate environment, being ligated by
four pyrrole nitrogens, His18, and Met80. To become an active peroxidase cyt c must
undergo a structural transition that severs the Fe-Met80 bond and generates 5-coordinate
heme with an open distal site. This 5-coordinate form is catalytically active because it
allows for Fe-peroxide interactions with subsequent formation of reactive Fe(IV)=O
species.34,36,59 This peroxidase activation can be achieved by oxidative modifications of cyt
c.27,29,44,47,52 The most common in vitro activation method is cyt c exposure to CT. The
“CT-holo-cyt c” generated in this way represents an important model system for apoptosis
research.29-30,44,47
Figure 4-2. Crystal structure of equine holo-cyt c (PDB 1HRC).60 Met residues are
depicted in orange. Sites of LysCHO formation are depicted in green. All remaining Lys
are depicted in blue. The heme cofactor is depicted in black, and the heme iron is shown in
red.
K73
K72
K55
K53
M65
M80
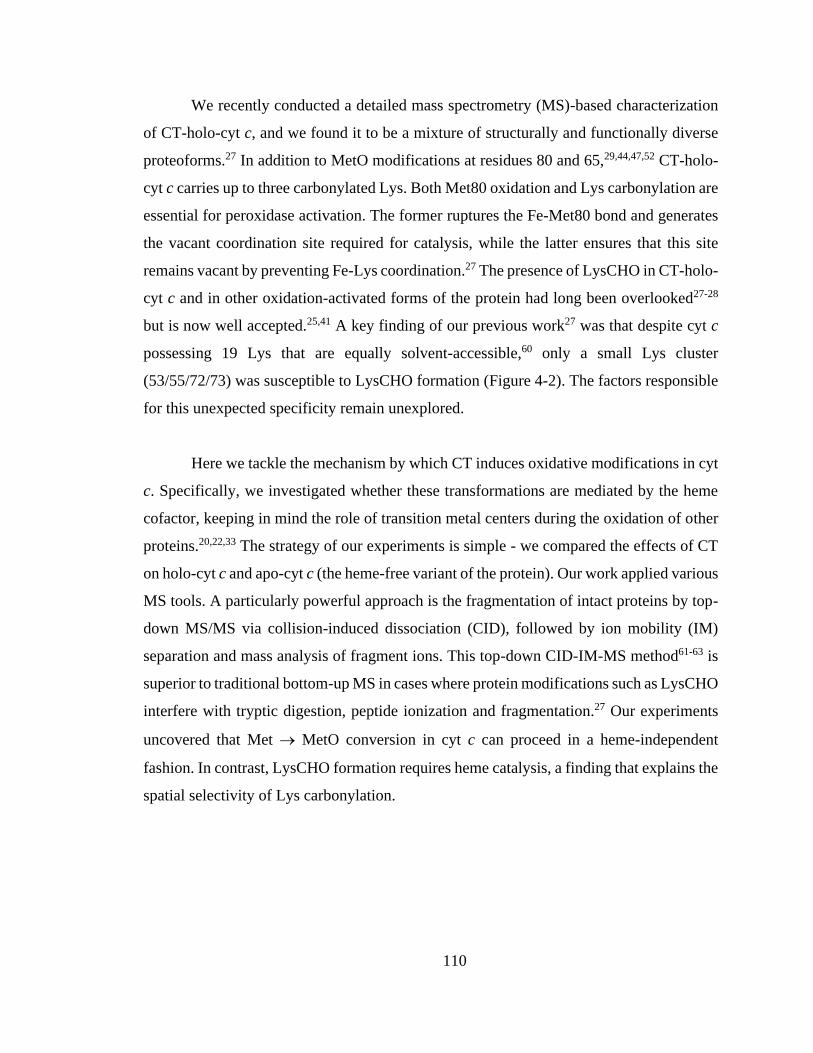
110
We recently conducted a detailed mass spectrometry (MS)-based characterization
of CT-holo-cyt c, and we found it to be a mixture of structurally and functionally diverse
proteoforms.27 In addition to MetO modifications at residues 80 and 65,29,44,47,52 CT-holo-
cyt c carries up to three carbonylated Lys. Both Met80 oxidation and Lys carbonylation are
essential for peroxidase activation. The former ruptures the Fe-Met80 bond and generates
the vacant coordination site required for catalysis, while the latter ensures that this site
remains vacant by preventing Fe-Lys coordination.27 The presence of LysCHO in CT-holo-
cyt c and in other oxidation-activated forms of the protein had long been overlooked27-28
but is now well accepted.25,41 A key finding of our previous work27 was that despite cyt c
possessing 19 Lys that are equally solvent-accessible,60 only a small Lys cluster
(53/55/72/73) was susceptible to LysCHO formation (Figure 4-2). The factors responsible
for this unexpected specificity remain unexplored.
Here we tackle the mechanism by which CT induces oxidative modifications in cyt
c. Specifically, we investigated whether these transformations are mediated by the heme
cofactor, keeping in mind the role of transition metal centers during the oxidation of other
proteins.20,22,33 The strategy of our experiments is simple - we compared the effects of CT
on holo-cyt c and apo-cyt c (the heme-free variant of the protein). Our work applied various
MS tools. A particularly powerful approach is the fragmentation of intact proteins by top-
down MS/MS via collision-induced dissociation (CID), followed by ion mobility (IM)
separation and mass analysis of fragment ions. This top-down CID-IM-MS method61-63 is
superior to traditional bottom-up MS in cases where protein modifications such as LysCHO
interfere with tryptic digestion, peptide ionization and fragmentation.27 Our experiments
uncovered that Met → MetO conversion in cyt c can proceed in a heme-independent
fashion. In contrast, LysCHO formation requires heme catalysis, a finding that explains the
spatial selectivity of Lys carbonylation.
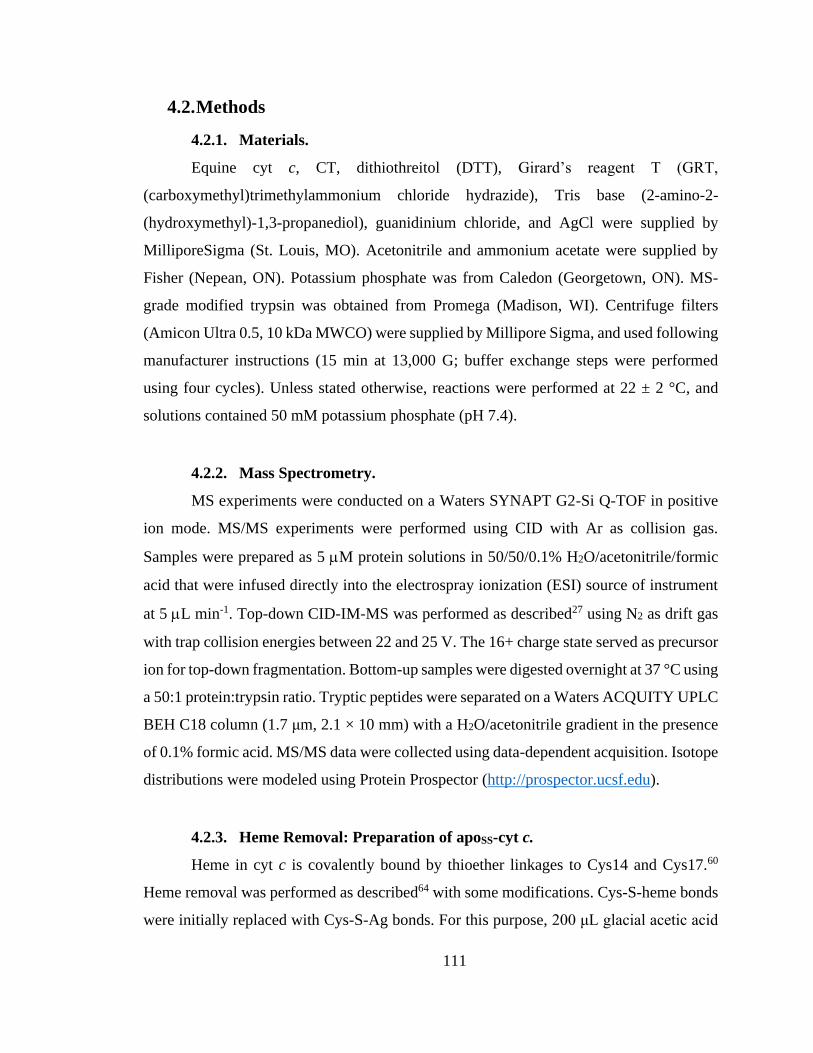
111
4.2. Methods
4.2.1. Materials.
Equine cyt c, CT, dithiothreitol (DTT), Girard’s reagent T (GRT,
(carboxymethyl)trimethylammonium chloride hydrazide), Tris base (2-amino-2-
(hydroxymethyl)-1,3-propanediol), guanidinium chloride, and AgCl were supplied by
MilliporeSigma (St. Louis, MO). Acetonitrile and ammonium acetate were supplied by
Fisher (Nepean, ON). Potassium phosphate was from Caledon (Georgetown, ON). MS-
grade modified trypsin was obtained from Promega (Madison, WI). Centrifuge filters
(Amicon Ultra 0.5, 10 kDa MWCO) were supplied by Millipore Sigma, and used following
manufacturer instructions (15 min at 13,000 G; buffer exchange steps were performed
using four cycles). Unless stated otherwise, reactions were performed at 22 ± 2 °C, and
solutions contained 50 mM potassium phosphate (pH 7.4).
4.2.2. Mass Spectrometry.
MS experiments were conducted on a Waters SYNAPT G2-Si Q-TOF in positive
ion mode. MS/MS experiments were performed using CID with Ar as collision gas.
Samples were prepared as 5 M protein solutions in 50/50/0.1% H2O/acetonitrile/formic
acid that were infused directly into the electrospray ionization (ESI) source of instrument
at 5 L min-1. Top-down CID-IM-MS was performed as described27 using N2 as drift gas
with trap collision energies between 22 and 25 V. The 16+ charge state served as precursor
ion for top-down fragmentation. Bottom-up samples were digested overnight at 37 °C using
a 50:1 protein:trypsin ratio. Tryptic peptides were separated on a Waters ACQUITY UPLC
BEH C18 column (1.7 μm, 2.1 × 10 mm) with a H2O/acetonitrile gradient in the presence
of 0.1% formic acid. MS/MS data were collected using data-dependent acquisition. Isotope
distributions were modeled using Protein Prospector (http://prospector.ucsf.edu).
4.2.3. Heme Removal: Preparation of apoSS-cyt c.
Heme in cyt c is covalently bound by thioether linkages to Cys14 and Cys17.60
Heme removal was performed as described64 with some modifications. Cys-S-heme bonds
were initially replaced with Cys-S-Ag bonds. For this purpose, 200 μL glacial acetic acid
112
were added to 1.8 mL of an aqueous solution of 400 μM cyt c and 25 mM AgCl, followed
by incubation at 40 °C in the dark for 4 h and centrifugation at 13,000 G for 5 minutes. The
supernatant was buffer exchanged into 100 mM acetic acid, yielding apo-cyt c carrying up
to three silver ions (Ag-apo-cyt c, Figure 4-3B). For Ag removal, 100 μL Ag-apo-cyt c was
added to 900 μL of 50 mM pH 5 ammonium acetate containing 6 M guanidinium chloride
and 1 M DTT, followed by incubation for 3 h. Samples were then buffer exchanged into
50 mM pH 5 ammonium acetate, yielding apo-cyt c (ε280 = 10.9 mM-1 cm-1)65 with both
Cys14 and Cys17 in the thiol form. The absence of heme was confirmed by MS (Figure
4-3C) and UV-Vis (Figure 4-4). The apo-cyt c generated in this way underwent a mass
shift of -2 Da during storage (Figure 4-5A) that was reversible upon addition of DTT
(Figure 4-6). This behavior indicates -SS- bond formation between Cys14 and Cys17. To
obtain homogeneous stable heme-free samples we deliberately promoted formation of this
-SS- bond by storing 10 μM apo-cyt c for 24 h at 22 C, followed by overnight incubation
at 4 °C. The disulfide-containing protein generated in this way is referred to apoSS-cyt c.
Top-down CID-IM-MS confirmed the presence of a disulfide between Cys14 and Cys17
in apoSS-cyt c, while simultaneously verifying the absence of other covalent modifications
(Figure 4-5B, C).
4.2.4. CT-induced Oxidation and GRT Labeling.
50 μM apoSS-cyt c or holo-cyt c were incubated in 2.5 mM CT/50 mM pH 8.4 Tris
buffer for 3 h.66-67 The reaction was halted by buffer exchange into 50 mM pH 5 ammonium
acetate, yielding CT-apoSS-cyt c and CT-holo cyt c. We also prepared apoSS-cyt c samples
that were less oxidized by using 0.5 mM instead of 2.5 mM CT (CTlow-apoSS-cyt c).
Oxidation experiments in the presence of microperoxidase 11 (MP11) were performed
using the same procedures, except that 50 μM MP11 was added to the CT/protein reaction
mixture. Covalent tagging of reactive carbonyl groups was performed using GRT15 by
incubating 10 μM protein (CT-treated or unoxidized controls) with 80 mM GRT in 50 mM
pH 5 ammonium acetate for 3 h. Excess GRT was removed by buffer exchange into 50
mM pH 5 ammonium acetate.

113
Figure 4-3. Left: Intact protein ESI mass spectra of different cyt c forms. (A) Holo-cyt c
(unmodified control), (B) Ag-cyt c, (C) apo-cyt c. Far right: Cartoon representation of each
form.
Figure 4-4. UV/Vis absorption spectra of cyt c before and after heme removal: holo-cyt c
(red), apo-cyt c (blue).
H18
C17
C14
M80
Fe
C17
C14HS
HS
C17
C14
114
Figure 4-5. (A) Mass spectra of apo-cyt c highlighting a disulfide-induced mass shift after
storage. (B) ApoSS-cyt c sequence; selected top-down fragmentation sites are indicated. (C)
Representative top-down CID-IM-MS fragment ions from apo-cyt c (top) and apoSS-cyt c
(bottom). All spectra are overlaid with their modeled isotope distributions (black dots and
lines).
Figure 4-6. Mass spectrum (charge state 16+) of apoSS-cyt c (A) before DTT treatment and
(B) following DTT treatment. The vertical dashed line is included as a visual aid. Following
DTT treatment, the -2 Da mass shift is lost, and the original (free -SH) mass is recovered.
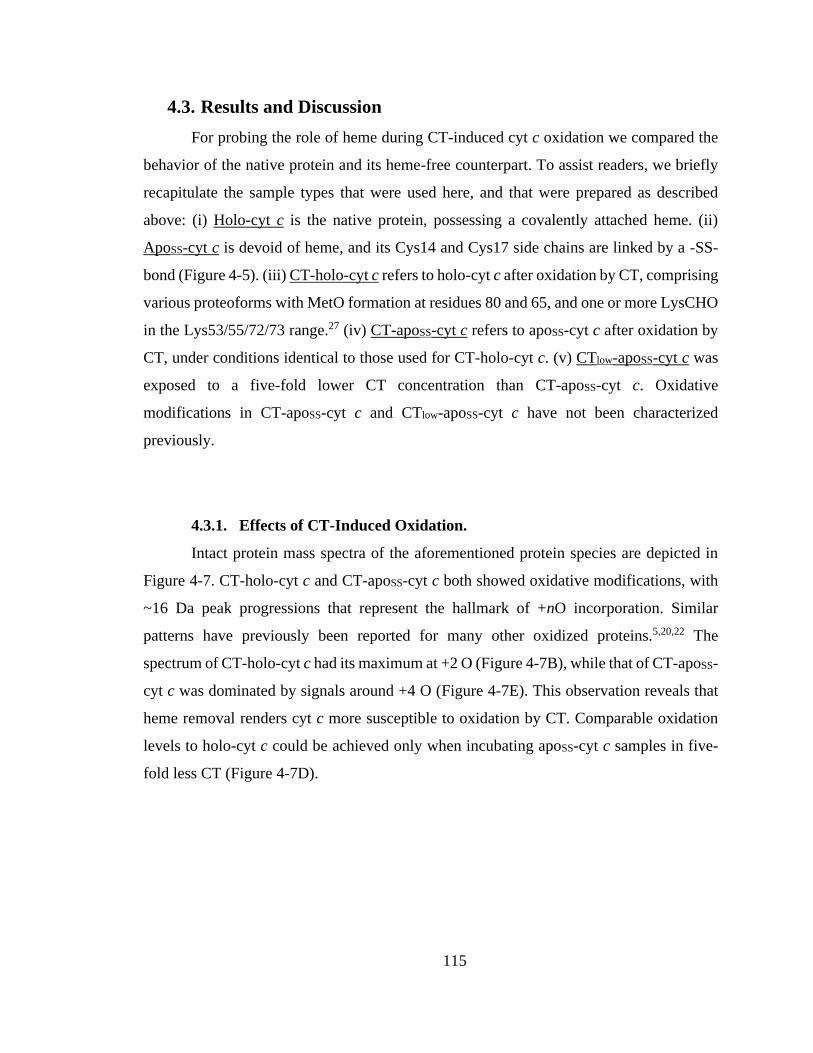
115
4.3. Results and Discussion
For probing the role of heme during CT-induced cyt c oxidation we compared the
behavior of the native protein and its heme-free counterpart. To assist readers, we briefly
recapitulate the sample types that were used here, and that were prepared as described
above: (i) Holo-cyt c is the native protein, possessing a covalently attached heme. (ii)
ApoSS-cyt c is devoid of heme, and its Cys14 and Cys17 side chains are linked by a -SS-
bond (Figure 4-5). (iii) CT-holo-cyt c refers to holo-cyt c after oxidation by CT, comprising
various proteoforms with MetO formation at residues 80 and 65, and one or more LysCHO
in the Lys53/55/72/73 range.27 (iv) CT-apoSS-cyt c refers to apoSS-cyt c after oxidation by
CT, under conditions identical to those used for CT-holo-cyt c. (v) CTlow-apoSS-cyt c was
exposed to a five-fold lower CT concentration than CT-apoSS-cyt c. Oxidative
modifications in CT-apoSS-cyt c and CTlow-apoSS-cyt c have not been characterized
previously.
4.3.1. Effects of CT-Induced Oxidation.
Intact protein mass spectra of the aforementioned protein species are depicted in
Figure 4-7. CT-holo-cyt c and CT-apoSS-cyt c both showed oxidative modifications, with
~16 Da peak progressions that represent the hallmark of +nO incorporation. Similar
patterns have previously been reported for many other oxidized proteins.5,20,22 The
spectrum of CT-holo-cyt c had its maximum at +2 O (Figure 4-7B), while that of CT-apoSS-
cyt c was dominated by signals around +4 O (Figure 4-7E). This observation reveals that
heme removal renders cyt c more susceptible to oxidation by CT. Comparable oxidation
levels to holo-cyt c could be achieved only when incubating apoSS-cyt c samples in five-
fold less CT (Figure 4-7D).
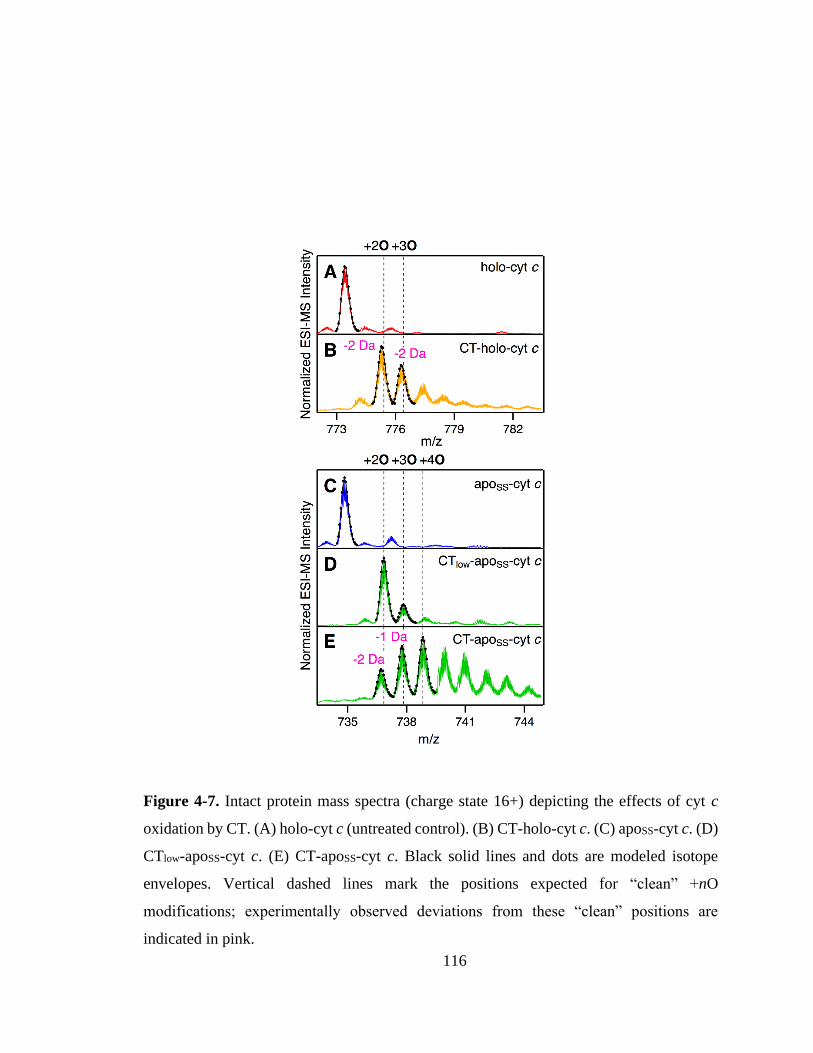
116
Figure 4-7. Intact protein mass spectra (charge state 16+) depicting the effects of cyt c
oxidation by CT. (A) holo-cyt c (untreated control). (B) CT-holo-cyt c. (C) apoSS-cyt c. (D)
CTlow-apoSS-cyt c. (E) CT-apoSS-cyt c. Black solid lines and dots are modeled isotope
envelopes. Vertical dashed lines mark the positions expected for “clean” +nO
modifications; experimentally observed deviations from these “clean” positions are
indicated in pink.

117
Close inspection of Figure 4-7 reveals deviations from “clean” +nO behavior. In
CT-holo-cyt c, the signals were shifted by -2 Da due to LysCHO formation (Figure 4-7B).27
CT-apoSS-cyt c showed a similar negative shift (Figure 4-7E). This -2 Da shift was absent
for CTlow-apoSS-cyt c (Figure 4-7D). While the -2 Da shift in Figure 4-7E seems to suggest
the presence of LysCHO in CT-apoSS-cyt c, the data discussed below reveal that it has a
different origin.
It may seem counterintuitive that heme removal enhances the oxidation
susceptibility of cyt c, considering the capability of metal centers to catalyze
oxidation.20,22,33-36 However, metal catalysis is not the only factor that is relevant in this
context. CD spectroscopy revealed that heme removal causes cyt c unfolding (Figure 4-8),
confirming earlier reports that the protein structural integrity is contingent on heme.64 The
enhanced oxidation susceptibility of apoSS-cyt c is attributable to the fact that unfolding
renders previously buried side chains sterically accessible to CT. This interpretation is in
line with studies on other proteins where unfolding was found to enhance modifications by
water-soluble labeling agents.20,22,68-69
Figure 4-8. Far-UV CD spectra of holo-cyt c (red) and apoSS-cyt c (blue). The minimum
close to 200 nm for apoSS-cyt c reveals that heme removal causes the protein to adopt an
extensively unfolded conformation.
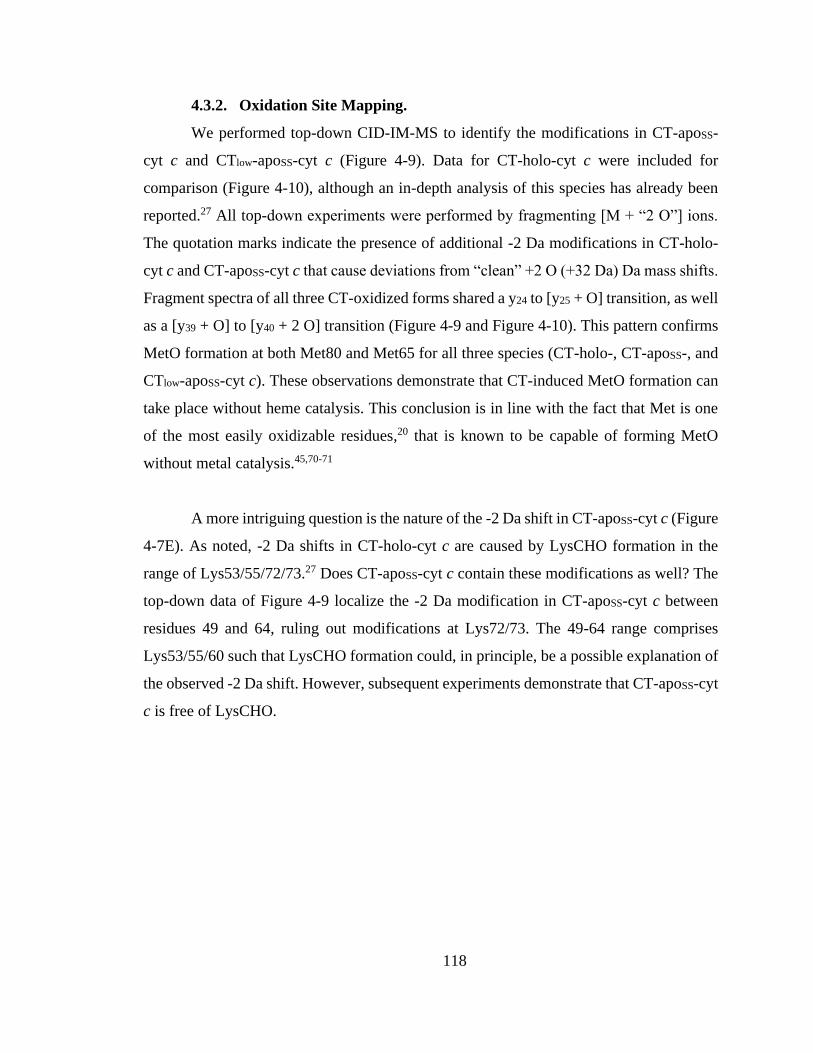
118
4.3.2. Oxidation Site Mapping.
We performed top-down CID-IM-MS to identify the modifications in CT-apoSS-
cyt c and CTlow-apoSS-cyt c (Figure 4-9). Data for CT-holo-cyt c were included for
comparison (Figure 4-10), although an in-depth analysis of this species has already been
reported.27 All top-down experiments were performed by fragmenting [M + “2 O”] ions.
The quotation marks indicate the presence of additional -2 Da modifications in CT-holo-
cyt c and CT-apoSS-cyt c that cause deviations from “clean” +2 O (+32 Da) Da mass shifts.
Fragment spectra of all three CT-oxidized forms shared a y24 to [y25 + O] transition, as well
as a [y39 + O] to [y40 + 2 O] transition (Figure 4-9 and Figure 4-10). This pattern confirms
MetO formation at both Met80 and Met65 for all three species (CT-holo-, CT-apoSS-, and
CTlow-apoSS-cyt c). These observations demonstrate that CT-induced MetO formation can
take place without heme catalysis. This conclusion is in line with the fact that Met is one
of the most easily oxidizable residues,20 that is known to be capable of forming MetO
without metal catalysis.45,70-71
A more intriguing question is the nature of the -2 Da shift in CT-apoSS-cyt c (Figure
4-7E). As noted, -2 Da shifts in CT-holo-cyt c are caused by LysCHO formation in the
range of Lys53/55/72/73.27 Does CT-apoSS-cyt c contain these modifications as well? The
top-down data of Figure 4-9 localize the -2 Da modification in CT-apoSS-cyt c between
residues 49 and 64, ruling out modifications at Lys72/73. The 49-64 range comprises
Lys53/55/60 such that LysCHO formation could, in principle, be a possible explanation of
the observed -2 Da shift. However, subsequent experiments demonstrate that CT-apoSS-cyt
c is free of LysCHO.

119
Figure 4-9. Top-down CID-IM-MS analysis of CT-apoSS-cyt c. (A) protein sequence with
selected fragmentation sites. The remaining three panels show partial fragment spectra.
The two modified Met residues are highlighted in color, along with the sequence range that
harbors an additional -2 Da modification. (B) Top: apoSS-cyt c (untreated control). Center:
CTlow-apoSS-cyt c. Bottom: CT-apoSS-cyt c. Each spectrum is overlaid with its theoretical
isotopic envelope.
G D V E K G K K I F V Q K C A Q C H T V E K G G K H K T G P
N L H G L F G R K T G Q A P G F T Y T D A N K N K G I T W K
E E T L M E Y L E N P K K Y I P G T K M I F A G I K K K T E
R E D L I A Y L K K A T N E
y39
b47
1
31
61
91
y25 y24y40
y56
SSA
B
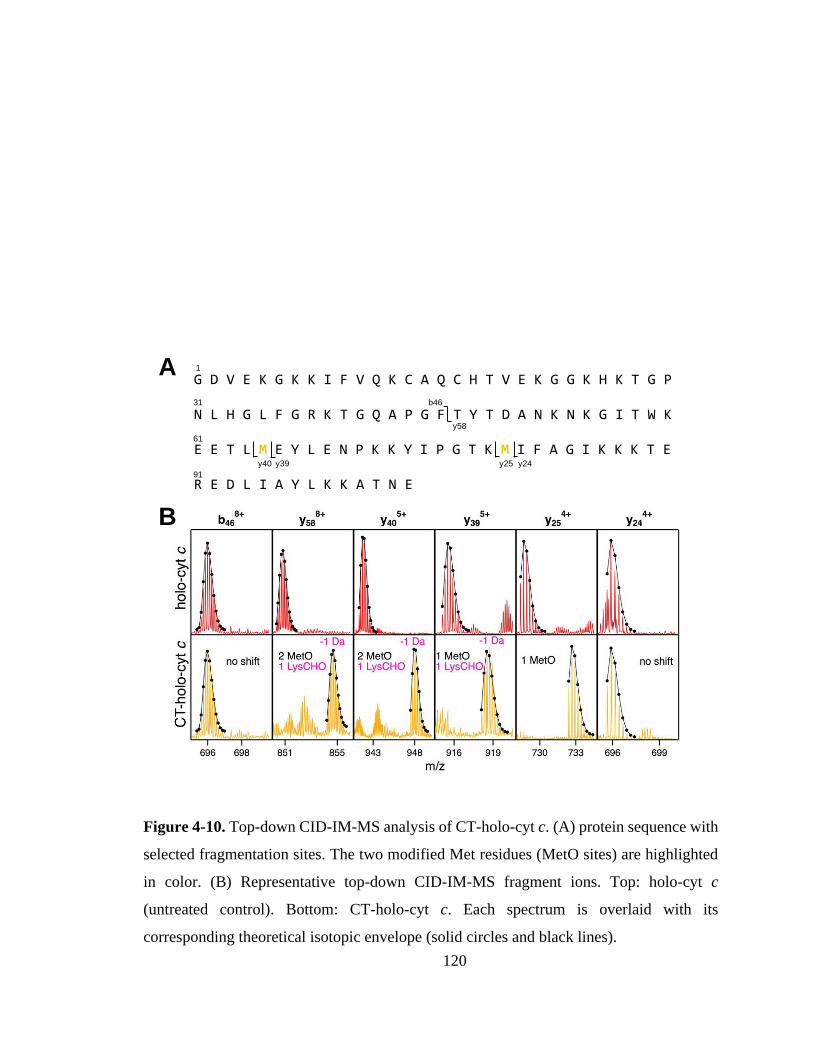
120
Figure 4-10. Top-down CID-IM-MS analysis of CT-holo-cyt c. (A) protein sequence with
selected fragmentation sites. The two modified Met residues (MetO sites) are highlighted
in color. (B) Representative top-down CID-IM-MS fragment ions. Top: holo-cyt c
(untreated control). Bottom: CT-holo-cyt c. Each spectrum is overlaid with its
corresponding theoretical isotopic envelope (solid circles and black lines).
G D V E K G K K I F V Q K C A Q C H T V E K G G K H K T G P
N L H G L F G R K T G Q A P G F T Y T D A N K N K G I T W K
E E T L M E Y L E N P K K Y I P G T K M I F A G I K K K T E
R E D L I A Y L K K A T N E
y39
y58
b46
1
31
61
91
y25 y24y40
A
B
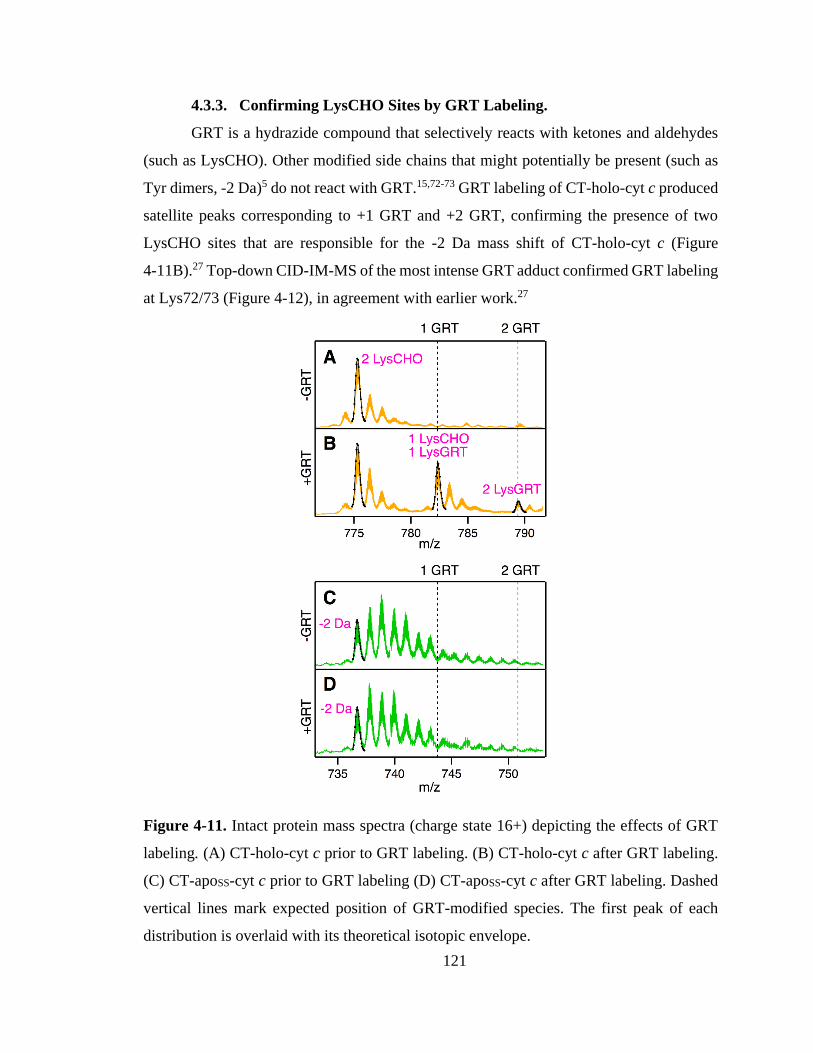
121
4.3.3. Confirming LysCHO Sites by GRT Labeling.
GRT is a hydrazide compound that selectively reacts with ketones and aldehydes
(such as LysCHO). Other modified side chains that might potentially be present (such as
Tyr dimers, -2 Da)5 do not react with GRT.15,72-73 GRT labeling of CT-holo-cyt c produced
satellite peaks corresponding to +1 GRT and +2 GRT, confirming the presence of two
LysCHO sites that are responsible for the -2 Da mass shift of CT-holo-cyt c (Figure
4-11B).27 Top-down CID-IM-MS of the most intense GRT adduct confirmed GRT labeling
at Lys72/73 (Figure 4-12), in agreement with earlier work.27
Figure 4-11. Intact protein mass spectra (charge state 16+) depicting the effects of GRT
labeling. (A) CT-holo-cyt c prior to GRT labeling. (B) CT-holo-cyt c after GRT labeling.
(C) CT-apoSS-cyt c prior to GRT labeling (D) CT-apoSS-cyt c after GRT labeling. Dashed
vertical lines mark expected position of GRT-modified species. The first peak of each
distribution is overlaid with its theoretical isotopic envelope.

122
Figure 4-12. Top-down CID-IM-MS analysis of GRT-labeled CT-holo-cyt c. (A) protein
sequence with selected fragmentation sites. The two modified Lys residues are highlighted
in colour. (B) Representative top-down CID-IM-MS fragment ions. Top: CT-holo-cyt c
(no GRT control). Bottom: GRT-labeled CT-holo-cyt c, using the [M + 2 O + 1 LysCHO
+ 1 GRT] peak as precursor. Each spectrum is overlaid with its corresponding theoretical
isotopic envelope (solid circles and black lines).
G D V E K G K K I F V Q K C A Q C H T V E K G G K H K T G P
N L H G L F G R K T G Q A P G F T Y T D A N K N K G I T W K
E E T L M E Y L E N P K K Y I P G T K M I F A G I K K K T E
R E D L I A Y L K K A T N E
b46
1
31
61
91
y29y40
y56
A
B
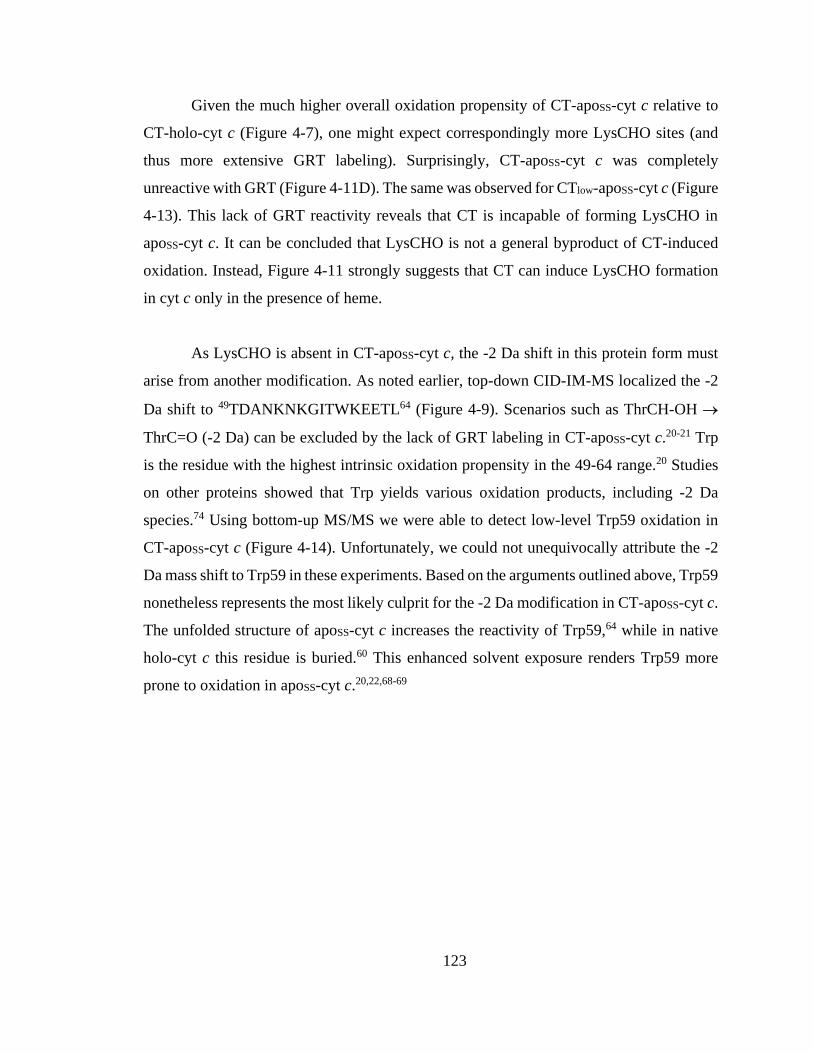
123
Given the much higher overall oxidation propensity of CT-apoSS-cyt c relative to
CT-holo-cyt c (Figure 4-7), one might expect correspondingly more LysCHO sites (and
thus more extensive GRT labeling). Surprisingly, CT-apoSS-cyt c was completely
unreactive with GRT (Figure 4-11D). The same was observed for CTlow-apoSS-cyt c (Figure
4-13). This lack of GRT reactivity reveals that CT is incapable of forming LysCHO in
apoSS-cyt c. It can be concluded that LysCHO is not a general byproduct of CT-induced
oxidation. Instead, Figure 4-11 strongly suggests that CT can induce LysCHO formation
in cyt c only in the presence of heme.
As LysCHO is absent in CT-apoSS-cyt c, the -2 Da shift in this protein form must
arise from another modification. As noted earlier, top-down CID-IM-MS localized the -2
Da shift to 49TDANKNKGITWKEETL64 (Figure 4-9). Scenarios such as ThrCH-OH →
ThrC=O (-2 Da) can be excluded by the lack of GRT labeling in CT-apoSS-cyt c.20-21 Trp
is the residue with the highest intrinsic oxidation propensity in the 49-64 range.20 Studies
on other proteins showed that Trp yields various oxidation products, including -2 Da
species.74 Using bottom-up MS/MS we were able to detect low-level Trp59 oxidation in
CT-apoSS-cyt c (Figure 4-14). Unfortunately, we could not unequivocally attribute the -2
Da mass shift to Trp59 in these experiments. Based on the arguments outlined above, Trp59
nonetheless represents the most likely culprit for the -2 Da modification in CT-apoSS-cyt c.
The unfolded structure of apoSS-cyt c increases the reactivity of Trp59,64 while in native
holo-cyt c this residue is buried.60 This enhanced solvent exposure renders Trp59 more
prone to oxidation in apoSS-cyt c.20,22,68-69
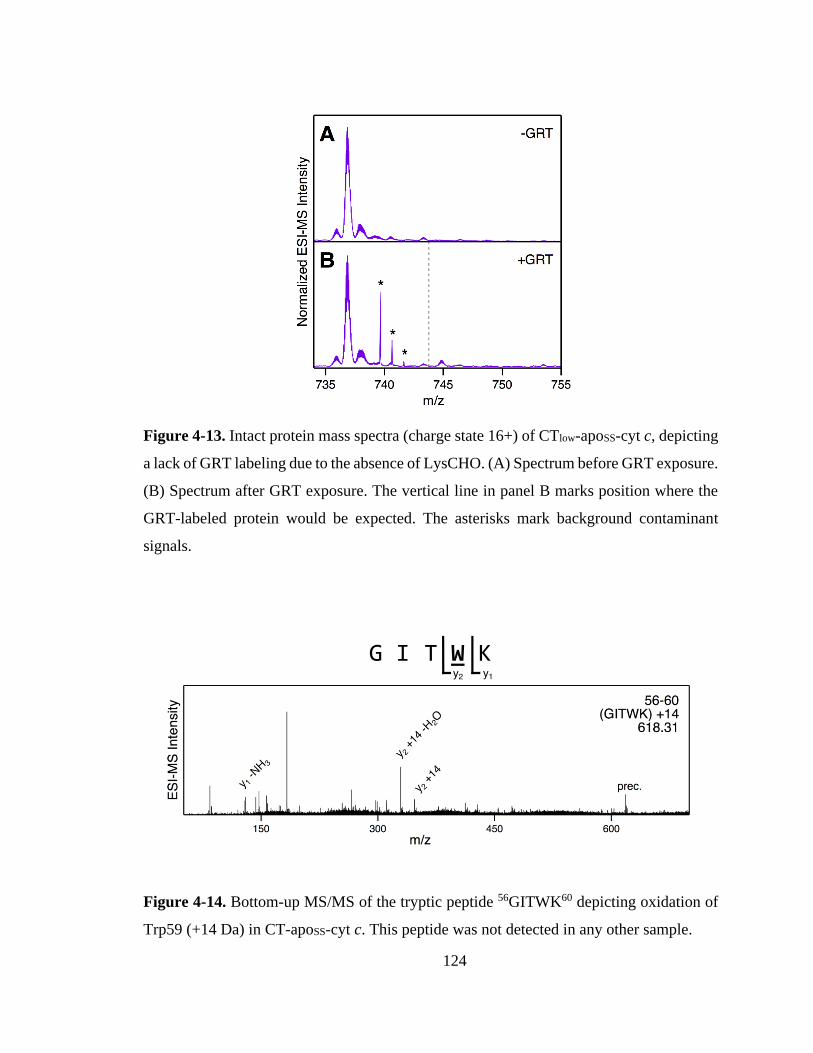
124
Figure 4-13. Intact protein mass spectra (charge state 16+) of CTlow-apoSS-cyt c, depicting
a lack of GRT labeling due to the absence of LysCHO. (A) Spectrum before GRT exposure.
(B) Spectrum after GRT exposure. The vertical line in panel B marks position where the
GRT-labeled protein would be expected. The asterisks mark background contaminant
signals.
Figure 4-14. Bottom-up MS/MS of the tryptic peptide 56GITWK60 depicting oxidation of
Trp59 (+14 Da) in CT-apoSS-cyt c. This peptide was not detected in any other sample.

125
4.3.4. Confirming Heme Catalysis Using MP11.
The absence of LysCHO in CT-apoSS-cyt c strongly suggests that this type of
modification can form only with heme catalysis. However, skeptics might point out that
other differences between holo-cyt c and apoSS-cyt c could play a role as well. For example,
it could be possible that the absence of LysCHO in CT-apoSS-cyt c is somehow related to
the unfolded structure of this protein form (Figure 4-8). To conclusively test the role of
heme, we produced CT-apoSS-cyt c in the presence of exogenous heme in the form of
MP11. MP11 is a heme-containing cyt c fragment (residues 11-21). The Fe(III) in MP11
is coordinated by His18 while the distal site remains open, allowing MP11 to catalyze a
range of oxidation reactions.75-76 The covalent thioether linkages in MP11 preclude
reconstitution of native holo-cyt c upon mixing with apoSS-cyt c, allowing us to delineate
the effects of protein conformation vs. heme involvement on the protein oxidation
behavior.
The presence of MP11 during CT-apoSS-cyt c formation profoundly impacted the
mass spectra (Figure 4-15). The most obvious effect was a dramatic shift toward lower
charge states (i.e. from maxima around 16+/17+ down to 11+/12+) which indicates the loss
of numerous charge-bearing sites (i.e., Lys-CH2-NH3+ → LysCHO).77 Abundant LysCHO
formation is also apparent from the mass distribution (Figure 4-15F) which shifted by ca.
-10 Da, corresponding to ca. 10 LysCHO. We attempted to use GRT labeling of MP11/CT-
apoSS-cyt c for confirming the presence of LysCHO; however, those experiments yielded
spectra with low S/N that were difficult to analyze (not shown). Keeping in mind that apoSS-
cyt c is normally unreactive with GRT due to the absence of LysCHO (Figure 4-11F, Figure
4-13B), it is likely that this low S/N arises from over-labeling of MP11/CT-apoSS-cyt c by
GRT. To nonetheless obtain direct confirmation of LysCHO, we performed MP11
experiments under the milder oxidation conditions of CTlow-apoSS-cyt c. These experiments
yielded the expected GRT-labeled products, confirming the ability of MP11 to induce the
conversion of Lys to LysCHO (Figure 4-16B,C).
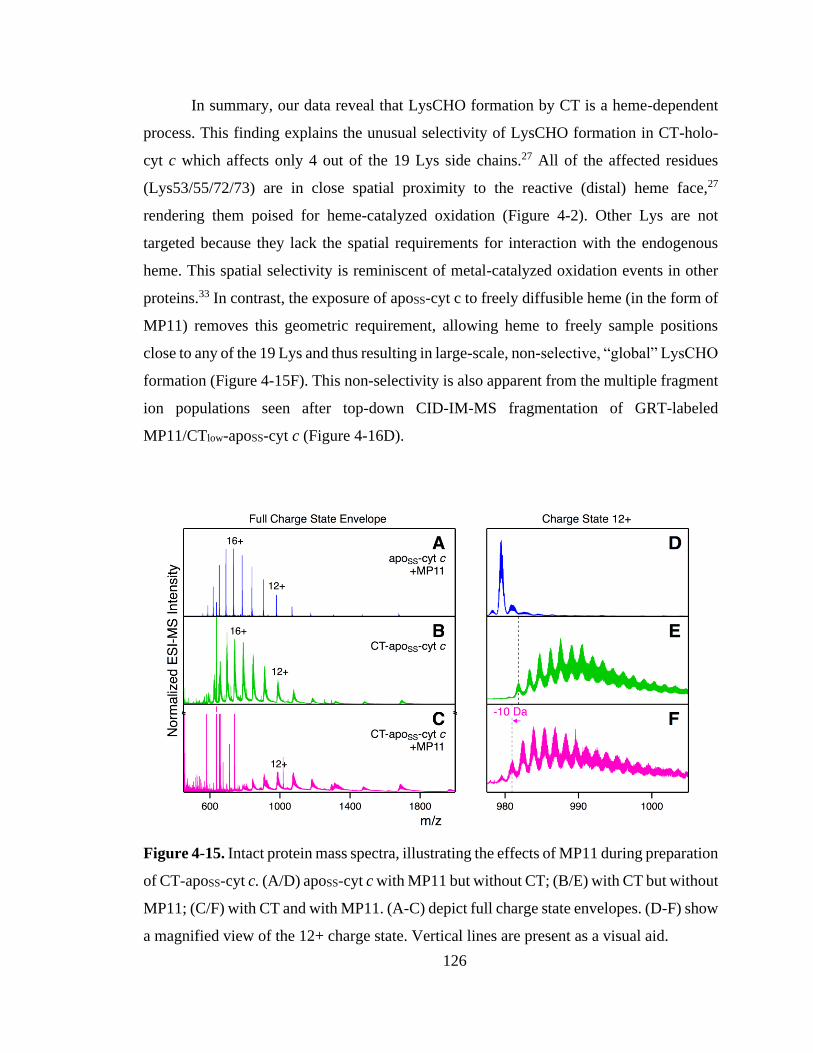
126
In summary, our data reveal that LysCHO formation by CT is a heme-dependent
process. This finding explains the unusual selectivity of LysCHO formation in CT-holo-
cyt c which affects only 4 out of the 19 Lys side chains.27 All of the affected residues
(Lys53/55/72/73) are in close spatial proximity to the reactive (distal) heme face,27
rendering them poised for heme-catalyzed oxidation (Figure 4-2). Other Lys are not
targeted because they lack the spatial requirements for interaction with the endogenous
heme. This spatial selectivity is reminiscent of metal-catalyzed oxidation events in other
proteins.33 In contrast, the exposure of apoSS-cyt c to freely diffusible heme (in the form of
MP11) removes this geometric requirement, allowing heme to freely sample positions
close to any of the 19 Lys and thus resulting in large-scale, non-selective, “global” LysCHO
formation (Figure 4-15F). This non-selectivity is also apparent from the multiple fragment
ion populations seen after top-down CID-IM-MS fragmentation of GRT-labeled
MP11/CTlow-apoSS-cyt c (Figure 4-16D).
Figure 4-15. Intact protein mass spectra, illustrating the effects of MP11 during preparation
of CT-apoSS-cyt c. (A/D) apoSS-cyt c with MP11 but without CT; (B/E) with CT but without
MP11; (C/F) with CT and with MP11. (A-C) depict full charge state envelopes. (D-F) show
a magnified view of the 12+ charge state. Vertical lines are present as a visual aid.

127
Figure 4-16. Mass spectra depicting GRT labeling experiments of MP11/CTlow-apoSS-cyt
c. Intact protein mass spectra (charge state 16+) are depicted in panels A-C. (A)
MP11/CTlow-apoSS-cyt c without GRT, and (B) with GRT. (C) Magnified view of (B)
highlighting the GRT-labeled protein, overlaid with its simulated isotope distribution. (D)
Representative top-down CID-IM-MS fragment ions, highlighting the presence of multiple
ion populations in GRT-labeled MP11/CTlow-apoSS-cyt c. Top: CTlow-apossCyt c (no GRT
treatment). Bottom: GRT-labeled MP11/CTlow-apossCyt c. The b46 and y57/56 ions shown in
panel D cover mutually exclusive regions of the protein. If the precursor ion were
homogeneously modified at a single site, then only one of these complementary fragment
ions could contain the modification. The observation of a GRT-containing peak in both
fragment ions demonstrates that there is more than one GRT site.

128
4.4. Conclusions
CT-holo-cyt c represents an important model system that mimics the state produced
in vivo when cells embark on their path towards apoptosis.27,29-30,44,47 CT-induced oxidation
of cyt c produces a 5-coordinate Fe(III) that is required for peroxidase activity. These
modifications were identified as MetO at residue 80, as well as LysCHO formation in the
Lys53/55/72/73 range.27 The current work provides new insights into the chemistry
underlying these transformations. In agreement with previous studies45,70-71 we found that
MetO-formation in cyt c can proceed without heme. The key finding of this study is that
CT-induced LysCHO formation is heme-catalyzed, and that it only takes place in the direct
vicinity of heme. The heme can be endogenous as in the case of holo-cyt c, or it can be
exogenous as in our MP11 experiments.
The role of metal catalysis during CT-induced oxidation of small organic substrates
has been examined previously, e.g. for Os(VIII) oxide and In(III) triflate.46,78 However,
there seems to be no prior work related to the reactivity of CT in the presence of Fe or
heme. We consider it most likely that the heme-catalyzed Lys oxidation seen here involves
OCl-. It is known that CT produces OCl-,44,46 and it is also known that OCl- interacts with
heme to generate Compound I and related Fe(IV)=O species.79-81 The formation of such
species in our MP11 experiments is favored by the fact that the distal heme face in MP11
is freely accessible.75-76 In the case of holo-cyt c, OCl--Fe interactions require opening of
the heme crevice. Such opening events are facilitated by the high flexibility of the 71-85 Ω
loop that covers the distal heme face in native cyt c.82-83 Disruption of the Fe-Met80 contact
via MetO formation further enhances the tendency of this Ω loop to sample oxidant-
accessible conformation.28,84-85
129
It is tempting to speculate on the broader implications of heme-catalyzed LysCHO
formation, relative to other oxidation pathways. Compound I-dependent oxidation involves
the abstraction of H atoms by radical oxygen species.34 Analogous H abstraction takes
place during other oxidation methods, e.g. Fenton chemistry33 or direct exposure to ∙OH.20
Likely, all of these methods generate similar (if not identical) types of oxidation products.
It is therefore surprising that LysCHO formation has been observed after Fenton reactions86
and other metal-catalyzed processes,18 but not after direct ∙OH exposure.20-21 One possible
explanation is that LysCHO tends to go undetected in conventional bottom-up LC-MS/MS
workflows because LysCHO sites interfere with tryptic digestion and collision-induced
dissociation of peptides.27 However, further studies are necessary to explore this
possibility.
From a bioanalytical perspective, this work demonstrates that top-down MS is
highly suitable for interrogating heterogeneous oxidative modifications, including
LysCHO sites which are difficult to track when using traditional bottom-up workflows.27
Future top-down investigations will be aided by continuing advancements in
instrumentation that enable high-resolution analyses of proteins with ever-increasing size
and complexity.87-89 It is hoped that this work will stimulate further top-down MS studies
in the exciting field of protein oxidation.

130
4.5. References
(1) Berlett, B. S.; Stadtman, E. R., J. Biol. Chem. 1997, 272, 20313-20316.
(2) Radi, R., Proc. Natl. Acad. Sci. U. S. A. 2018, 115 (23), 5839-5848.
(3) Winkler, J. R.; Gray, H. B., Q. Rev. Biophys. 2015, 48 (4), 411-420.
(4) Nimse, S. B.; Pal, D., RSC Adv. 2015, 5 (35), 27986-28006.
(5) Kathiresan, M.; English, A. M., Chem. Sci. 2017, 8 (2), 1152-1162.
(6) Dalle-Donne, I.; Rossi, R.; Giustarini, D.; Milzani, A.; Colombo, R., Clin. Chim.
Acta 2003, 329, 23-38.
(7) Gray, H. B.; Winkler, J. R., Accounts Chem. Res. 2018, 51 (8), 1850-1857.
(8) de Graff, A. M. R.; Hazoglou, M. J.; Dill, K. A., Structure 2016, 24 (2), 329-336.
(9) Pedersen, J. T.; Chen, S. W.; Borg, C. B.; Ness, S.; Bahl, J. M.; Heegaard, N. H.
H.; Dobson, C. M.; Hemmingsen, L.; Cremades, N.; Teilum, K., J. Am. Chem. Soc.
2016, 138 (12), 3966-3969.
(10) Sultana, R.; Boyd-Kimball, D.; Poon, H. F.; Cai, J.; Pierce, W. M.; Klein, J. B.;
Markesbery, W. R.; Zhou, X. Z.; Lu, K. P.; Butterfield, D. A., Neurobiol. Aging
2006, 27 (7), 918-925.
(11) Giorgio, M.; Trinei, M.; Migliaccio, E.; Pelicci, P. G., Nat. Rev. Mol. Cell Biol.
2007, 8 (9), 722A-728.
(12) Lee, J. W.; Helmann, J. D., Nature 2006, 440 (7082), 363-367.
(13) Heppner, D. E.; Dustin, C. M.; Liao, C. Y.; Hristova, M.; Veith, C.; Little, A. C.;
Ahlers, B. A.; White, S. L.; Deng, B.; Lam, Y. W.; Li, J. N.; van der Vliet, A., Nat.
Commun. 2018, 9, 1-11.
(14) Beck, A.; Wagner-Rousset, E.; Ayoub, D.; Van Dorsselaer, A.; Sanglier-Cianferani,
S., Anal. Chem. 2013, 85 (2), 715-736.
(15) Yang, Y.; Stella, C.; Wang, W. R.; Schoneich, C.; Gennaro, L., Anal. Chem. 2014,
86 (10), 4799-4806.
(16) Bobst, C. E.; Thomas, J. J.; Salinas, P. A.; Savickas, P.; Kaltashov, I. A., Protein
Sci. 2010, 19 (12), 2366-2378.
(17) Madian, A. G.; Regnier, F. E., J. Proteome Res. 2010, 9 (8), 3766-3780.
(18) Møller, I. M.; Rogowska-Wrzesinska, A.; Rao, R. S. P., J. Proteomics 2011, 74
(11), 2228-2242.
131
(19) Yang, J.; Wang, S.; Liu, J.; Raghani, A., J. Chromatogr. A 2007, 1156 (1-2), 174-
182.
(20) Xu, G.; Chance, M. R., Chem. Rev. 2007, 107, 3514-3543.
(21) Johnson, D. T.; Di Stefano, L. H.; Jones, L. M., J. Biol. Chem. 2019, 294 (32),
11969-11979.
(22) Liu, X. R.; Zhang, M. M.; Gross, M. L., Chem. Rev. 2020, 120, 4355−4454.
(23) Li, X. Y.; Grant, O. C.; Ito, K.; Wallace, A.; Wang, S. X.; Zhao, P.; Wells, L.; Lu,
S.; Woods, R. J.; Sharp, J. S., Biochemistry 2017, 56 (7), 957-970.
(24) Fitzgerald, M. C.; West, G. M., J. Am. Soc. Mass Spectrom. 2009, 20, 1193-1206.
(25) Chea, E. E.; Deredge, D. J.; Jones, L. M., Biophys. J. 2020, 118 (1), 128-137.
(26) Sharp, J. S.; Becker, J. M.; Hettich, R. L., Anal. Chem. 2004, 76, 672-683.
(27) Yin, V.; Mian, S. H.; Konermann, L., Chem. Sci. 2019, 10, 2349-2359.
(28) Yin, V.; Shaw, G. S.; Konermann, L., J. Am. Chem. Soc. 2017, 139, 15701–15709.
(29) Capdevila, D. A.; Marmisolle, W. A.; Tomasina, F.; Demicheli, V.; Portela, M.;
Radi, R.; Murgida, D. H., Chem. Sci. 2015, 6 (1), 705-713.
(30) Zhong, F.; Pletneva, E. V., Inorg. Chem. 2018, 57 (10), 5754-5766.
(31) Vahidi, S.; Konermann, L., J. Am. Soc. Mass Spectrom. 2016, 27, 1156-1164.
(32) Saladino, J.; Liu, M.; Live, D.; Sharp, J. S., J. Am. Soc. Mass Spectrom. 2009, 20,
1123-1126.
(33) Bridgewater, J. D.; Lim, J.; Vachet, R. W., J. Am. Soc. Mass Spectrom. 2006, 17,
1552-1559.
(34) Veitch, N. C., Phytochem. 2004, 65, 249-259.
(35) Rodriguez Maranon, M. J.; Mercier, D.; van Huystee, R. B.; Stillman, M. J.,
Biochem. J. 1994, 301 ( Pt 2), 335-341.
(36) Volkov, A. N.; Nicholls, P.; Worrall, J. A. R., Biochim. Biophys. Acta. 2011, 1807
(11), 1482-1503.
(37) Lawrence, A.; Jones, C. M.; Wardman, P.; Burkitt, M. J., J. Biol. Chem. 2003, 278
(32), 29410-29419.
(38) Florence, T. M., J. Inorg. Biochem. 1985, 23, 131-141.
132
(39) Villegas, J. A.; Mauk, A. G.; Vazquez-Duhalt, R., Chem. Biol. 2000, 7 (4), 237-
244.
(40) Gray, H. B.; Winkler, J. R., Proc. Natl. Acad. Sci. U.S.A. 2015, 112 (35), 10920-
10925.
(41) Barayeu, U.; Lange, M.; Mendez, L.; Arnhold, J.; Shadyro, O. I.; Fedorova, M.;
Flemmig, J., J. Biol. Chem. 2019, 294 (6), 1816-1830.
(42) Keck, R. G., Anal. Biochem. 1996, 236 (1), 56-62.
(43) Shechter, Y.; Burstein, Y.; Patchornik, A., Biochemistry 1975, 14 (20), 4497-4503.
(44) Chen, Y.-R.; Deterding, L. J.; Sturgeon, B. E.; Tomer, K. B.; Mason, R. P., J. Biol.
Chem. 2002, 277 (33), 29781-29791.
(45) Pande, J.; Kinnally, K.; Thallum, K. K.; Verma, B. C.; Myer, Y. P.; Rechsteiner,
L.; Bosshard, H. R., J. Protein Chem. 1987, 6 (4), 295-319.
(46) Mushran, S. P.; Agrawal, M. C.; Prasad, B., J. Chem. Soc. B 1971, 0 (8), 1712-1714.
(47) Parakra, R. D.; Kleffmann, G. N. L.; Jameson, T.; Ledgerwood, E. C., Dalton Trans.
2018, 47, 9128-9135.
(48) Campbell, M. M.; Johnson, G., Chem. Rev. 1978, 78 (1), 65-79.
(49) Lushington, G. H.; Cowley, A. B.; Silchenko, S.; Lukat-Rodgers, G. S.; Rodgers,
K. R.; Benson, D. R., Inorg. Chem. 2003, 42 (23), 7550-7559.
(50) Wang, Z.; Ando, Y.; Nugraheni, A. D.; Ren, C.; Nagao, S.; Hirota, S., Mol. Biosyst.
2014, 10 (12), 3130-3137.
(51) Birk, A. V.; Chao, W. M.; Liu, S. Y.; Soong, Y.; Szeto, H. H., Biochim. Biophys.
Acta 2015, 1847 (10), 1075-1084.
(52) Nugraheni, A. D.; Ren, C. G.; Matsumoto, Y.; Nagao, S.; Yamanaka, M.; Hirota,
S., J. Inorg. Biochem. 2018, 182, 200-207.
(53) Diaz-Quintana, A.; Perez-Mejias, G.; Guerra-Castellano, A.; De la Rosa, M. A.;
Diaz-Moreno, I., Oxidative Med. Cell. Longev. 2020, 2020, 1-20.
(54) Alvarez-Paggi, D.; Hannibal, L.; Castro, M. A.; Oviedo-Rouco, S.; Demicheli, V.;
Tórtora, V.; Tomasina, F.; Radi, R.; Murgida, D. H., Chem. Rev. 2017, 117 (21),
13382-13460.
(55) McClelland, L. J.; Mou, T.-C.; Jeakins-Cooley, M. E.; Sprang, S. R.; Bowler, B. E.,
Proc. Natl. Acad. Sci. U.S.A. 2014, 111 (18), 6648-6653.

133
(56) Kitt, J. P.; Bryce, D. A.; Minteer, S. D.; Harris, J. M., J. Am. Chem. Soc. 2017.
(57) Oemer, G.; Lackner, K.; Muigg, K.; Krumschnabel, G.; Watschinger, K.; Sailer, S.;
Lindner, H.; Gnaiger, E.; Wortmann, S. B.; Werner, E. R.; Zschocke, J.; Keller, M.
A., Proc. Natl. Acad. Sci. U.S.A. 2018, 115 (16), 4158-4163.
(58) Belikova, N. A.; Vladimirov, Y. A.; Osipov, A. N.; Kapralov, A. A.; Tyurin, V. A.;
Potapovich, M. V.; Basova, L. V.; Peterson, J.; Kurnikov, I. V.; Kagan, V. E.,
Biochemistry 2006, 45 (15), 4998-5009.
(59) Hersleth, H.-P.; Ryde, U.; Rydberg, P.; Görbitz, C. H.; Andersson, K. K., J. Inorg.
Biochem. 2006, 100 (4), 460-476.
(60) Bushnell, G. W.; Louie, G. V.; Brayer, G. D., J. Mol. Biol. 1990, 214, 585-595.
(61) Zinnel, N. F.; Pai, P.-J.; Russell, D. H., Anal. Chem. 2012, 84 (7), 3390-3397.
(62) Polasky, D. A.; Lermyte, F.; Nshanian, M.; Sobott, F.; Andrews, P. C.; Loo, J. A.;
Ruotolo, B. T., Anal. Chem. 2018, 90 (4), 2756-2764.
(63) Halgand, F.; Habchi, J.; Cravello, L.; Martinho, M.; Guigliarelli, B.; Longhi, S.,
Anal. Chem. 2011, 83, 7306-7315.
(64) Fisher, W. R.; Taniuchi, H.; Anfinsen, C. B., J. Biol. Chem. 1973, 248 (9), 3188-
3195.
(65) Daltrop, O.; Ferguson, S. J., J. Biol. Chem. 2003, 278 (7), 4404-4409.
(66) Capdevila, D. A.; Marmisolle, W. A.; Tomasina, F.; Demicheli, V.; Portela, M.;
Radi, R.; Murgida, D. H., Chem. Sci. 2015, 6 (1), 705-713.
(67) Yin, V.; Mian, S. H.; Konermann, L., Chem. Sci. 2019, 10 (8), 2349-2359.
(68) Mendoza, V. L.; Vachet, R. W., Mass Spectrom. Rev. 2009, 28, 785-815.
(69) Jumper, C. C.; Schriemer, D. C., Anal. Chem. 2011, 83 (8), 2913–2920.
(70) Shechter, Y.; Burstein, Y.; Patchornik, A., Biochemistry 1975, 14 (20), 4497-4503.
(71) Michel, B.; Proudfoot, A. E. I.; Wallace, C. J. A.; Bosshard, H. R., Biochemistry
1989, 28 (2), 456-462.
(72) Mirzaei, H.; Regnier, F., J. Chromatogr. A 2006, 1134 (1-2), 122-133.
(73) Santa, T., Biomed. Chromatogr. 2011, 25 (1-2), 1-10.
(74) Li, Y. M.; Polozova, A.; Gruia, F.; Feng, J. H., Anal. Chem. 2014, 86 (14), 6850-
6857.
134
(75) Osman, A. M.; Koerts, J.; Boersma, M. G.; Boeren, S.; Veeger, C.; Rietjens, I., Eur.
J. Biochem. 1996, 240 (1), 232-238.
(76) Spector, A.; Zhou, W.; Ma, W. C.; Chignell, C. F.; Reszka, K. J., Exp. Eye Res.
2000, 71 (2), 183-194.
(77) Konermann, L.; Metwally, H.; Duez, Q.; Peters, I., Analyst 2019, 144, 6157-6171.
(78) Nakahara, K.; Kitazawa, C.; Mineno, T., Chem. Pharm. Bull. 2017, 65 (8), 801-
804.
(79) Schaffner, I.; Hofbauer, S.; Krutzler, M.; Pirker, K. a. F.; Furtmüller, P. G.; Obinger,
C., Arch. Biochem. Biophys. 2015, 574, 18-26.
(80) Mashino, T.; Fridovich, I., Biochim. Biophys. Acta 1988, 956 (1), 63-69.
(81) Maitra, D.; Byun, J.; Andreana, P. R.; Abdulhamid, I.; Diamond, M. P.; Saed, G.
M.; Pennathur, S.; Abu-Soud, H. M., Free Radical Biol. Med. 2011, 51 (2), 374-
386.
(82) Hu, W. B.; Kan, Z. Y.; Mayne, L.; Englander, S. W., Proc. Natl. Acad. Sci. U.S.A.
2016, 113 (14), 3809-3814.
(83) Maity, H.; Rumbley, J. N.; Englander, S. W., Proteins 2006, 63 (2), 349-355.
(84) Deacon, O. M.; Svistunenko, D. A.; Moore, G. R.; Wilson, M. T.; Worrall, J. A. R.,
Biochemistry 2018, 57 (29), 4276-4288.
(85) Tomášková, N.; Varhač, R.; Lysáková, V.; Musatov, A.; Sedlák, E., Biochim.
Biophys. Acta 2018, 1866, 1073–1083.
(86) Requena, J. R.; Chao, C.-C.; Levine, R. L.; Stadtman, E. R., Proc. Natl. Acad. Sci.
U.S.A. 2001, 98 (1), 69-74.
(87) Chen, B. F.; Brown, K. A.; Lin, Z. Q.; Ge, Y., Analytical Chemistry 2018, 90 (1),
110-127.
(88) Crittenden, C. M.; Novelli, E. T.; Mehaffey, M. R.; Xu, G. N.; Giles, D. H.; Fies,
W. A.; Dalby, K. N.; Webb, L. J.; Brodbelt, J. S., J. Am. Soc. Mass Spectrom. 2020,
31 (5), 1140-1150.
(89) Gomes, F. P.; Diedrich, J. K.; Saviola, A. J.; Memili, E.; Moura, A. A.; Yates, J. R.,
Anal. Chem. 2020, 92 (4), 2979-2987.

135
Chapter 5. Probing the Effects of Heterogeneous Oxidative
Modifications on the Stability of Cytochrome c in Solution and
in the Gas Phase
5.1. Introduction
Atomically resolved structural data for proteins in solution or in the solid state can
be obtained by X-ray crystallography, NMR spectroscopy and cryo-electron microscopy.
Mass spectrometry (MS) and ion mobility spectrometry (IMS) offer complementary
avenues. Prerequisite for the application of these vacuum techniques is the capability to
generate intact gaseous protein ions.1 Electrospray ionization (ESI)2 and matrix-assisted
laser desorption/ionization (MALDI)3 represent key techniques for this purpose, but new
ionization methods continue to emerge.4-8 Particularly interesting is recent work by
Trimpin et al.8 which demonstrated that gaseous protein ions can be generated without the
aid of lasers, heat, or voltages.
The amino acids in natively folded proteins are closely packed and engaged in H-
bonds, salt bridges, van der Waals interactions, and hydrophobic contacts.9 Covalent
modifications can upset this interaction network, destabilize the native state, and render
proteins non-functional.10 One avenue to introduce such modifications involves reactive
oxygen species, such as O2−, HO2∙, H2O2, and ∙OH.11-14 Methionine conversion to sulfoxide
(MetO) is particularly common,15-18 but oxidation can also affect many other residues.19-20
The accumulation of oxidized proteins plays a key role for aging-related pathologies21 such
as Alzheimer’s and other neurodegenerative diseases.22-23 In addition, oxidation
compromises the efficacy of protein therapeutics.16,18,24 Understanding oxidation-related
effects on protein structure and stability, therefore, is an important goal with far-reaching
repercussions.

136
Oxidation-induced stability changes in solution can be studied using thermal15,18,25-
26 or chemical27-28 unfolding experiments. These studies involve protein exposure to heat
or chemical denaturants. Optical tools can then be used to probe unfolding profiles, e.g.
circular dichroism (CD) spectroscopy at 222 nm which reports on -helicity.29 The melting
temperature TM marks the unfolding midpoint and is a measure of protein stability.9,30-31
Oxidative modifications usually destabilize proteins in solution, inducing shifts to lower
TM.15,18,25-28
In addition to the aforementioned solution studies, there is considerable interest in
examining proteins in a solvent-free environment. “Native” ESI can generate gaseous
biomolecular ions that retain solution-like structures and interactions.7,32-36 Somewhat
analogous to thermal unfolding in solution,15,18,25-26,30 these gaseous protein ions can be
subjected to collisional heating, causing them to undergo collision-induced unfolding
(CIU). The structural changes triggered in this way are detectable by IMS.37-38
It is an interesting question whether gas phase stabilities correlate with the protein
behavior in solution.39-40 A number of studies indicate that this indeed appears to be the
case. For example, enzyme-inhibitor binding stabilities in solution were consistent with
trends seen in collision-induced dissociation (CID) studies,41 ligand-induced stabilization
effects were mirrored in the gas phase,42 and CIU energetics were shown to be correlated
with solution structures.38 Correlation between solution and gas phase behavior was also
demonstrated in surface-induced dissociation (SID) experiments on multi-protein
assemblies,36 and blackbody infrared dissociation (BIRD) studies on protein-lipid
complexes.43 On the other hand, the absence of solvent can have profound effects on inter-
and intramolecular contacts.44 Hydrophobic interactions are weakened,45 while
electrostatic contacts are strengthened in the absence of water.46 These factors can lead to
disparities between solution and gas phase stabilities.46 Overall, much remains to be learned
about the relationship between protein stability in vitro and in vacuo. Particular knowledge
gaps persist when it comes to the question how oxidative modifications affect the stability
of gaseous proteins.

137
Oxidative modifications of the heme protein cytochrome c (cyt c) have attracted a
lot of attention in recent years.47-56 The canonical function of cyt c is to shuttle electrons in
the respiratory chain.57 In addition, cyt c acts as a peroxidase, i.e. an enzyme that catalyzes
the oxidation of organic substrates by H2O2.58 Cyt c-catalyzed oxidation of cardiolipin in
mitochondria plays a key role during apoptosis.59-62 The peroxidase activity of native cyt c
is low. It is only after specific oxidation events that the protein becomes fully active.47-54,63-
64 This gain of function contrasts the aforementioned scenarios where oxidation events
interfere with protein activity.
The most common method for producing peroxidase-active cyt c in vitro is by
exposure to chloramine-T (CT),47,51,53-54 a mild oxidant that releases OCl-.65 We recently
conducted a detailed MS characterization of CT-treated cyt c (CT-cyt c).63 The protein was
found to be highly heterogeneous, with MetO formation at zero, one, or two methionines
(Met80 and Met65). In addition, CT-cyt c showed Lys carbonylation in the range of
Lys72/73 and Lys53/55 (Figure 5-1).63 Lys carbonylation to aminoadipic semialdehyde is
associated with M = -1 Da (LysCH2-NH2 → LysCHO).66-67 This type of modification is
easily missed because of its small mass shift, loss of a charged site, and abrogation of
tryptic cleavage. In particular, the presence of LysCHO in CT-cyt c had been overlooked
until recently.63 Both MetO and LysCHO are well-known markers for oxidative damage in
environmentally stressed proteins and protein therapeutics.67-68 Therefore, CT-cyt c
represents as a convenient model system for probing the effects of these modifications on
protein structure and stability.
Here we characterize the effects of oxidative modifications in CT-cyt c on the
stability of the protein in solution and in the gas phase. We find that although the solution
stability of the protein is reduced after oxidation, gas phase data show an increase in
stability. We conclude that the solution properties of oxidatively modified proteins are not
necessarily reflected in their CIU behavior.

138
Figure 5-1. Crystal structure of horse cyt c (PDB 1HRC). (A) Front view with highlighted
side chains that are oxidized after CT exposure: Met (red), and Lys (green). The heme iron
is shown in orange. (B) Side view with highlighted Met residues and selected aromatic side
chains.
5.2. Materials and Methods
5.2.1. Materials.
Cyt c (equine heart), CT (N-chloro-4-toluosulfonamide), and Tris base (2-amino-
2-(hydroxymethyl)-1,3-propanediol) were supplied by MilliporeSigma (St. Louis, MO).
All other chemicals were supplied by Fisher Scientific (Nepean, ON) or Caledon
Laboratories (Georgetown, ON). Centrifuge filters (Amicon Ultra 0.5, 10 kDa MWCO)
were supplied by Millipore Sigma, and used according to manufacturer instructions (15
min at 13,000 G).
A
M80
M65
K73
K72K55
K53
B
M65
M80F82
Y67W59

139
5.2.2. Protein Oxidation.
CT-cyt c was prepared as described63, with minor modifications. 500 μM cyt c was
incubated with 2.5 mM CT in 50 mM Tris (pH 8.4) for 60 min at 22 C. Oxidation was
quenched by five serial exchanges into 10 mM ammonium acetate using Amicon filters.
The resulting proteoform mixture was fractionated using a 5 mL SCX HiTrap SP cartridge
(GE Healthcare). Samples were eluted using a zero to 500 mM ammonium acetate gradient
(pH 9).
5.2.3. Thermal Unfolding.
Solution phase unfolding was monitored by CD spectroscopy at 222 nm using a J-
810 spectropolarimeter (JASCO, Easton, MD). Samples were prepared as 10 μM protein
in 50 mM potassium phosphate buffer (pH 7.4). Heating was performed from 20 to 100 °C
at a rate of 1 °C min-1. The melting temperature (TM) and enthalpy of unfolding (ΔH) were
extracted by fitting the CD222 profiles using30
𝐶𝐷222 =(𝑦𝑁 + 𝑚𝑁𝑇) + (𝑦𝑈 + 𝑚𝑈𝑇)exp (−∆𝐺/𝑅𝑇)
1 + exp (−∆𝐺/𝑅𝑇)
(5.1)
where T is the temperature in Kelvin and G = H(1 – T/TM), while (yN + mNT) and (yU +
mUT) represent the pre- and post-transition baselines, respectively. The fraction of unfolded
protein in solution (Fu_sol) was calculated as69
𝐹𝑢_𝑠𝑜𝑙 =exp (−∆𝐺/𝑅𝑇)
1 + exp (−∆𝐺/𝑅𝑇)
(5.2)
There was no evidence of aggregation, as seen from the absence of precipitated protein in
the heated samples.
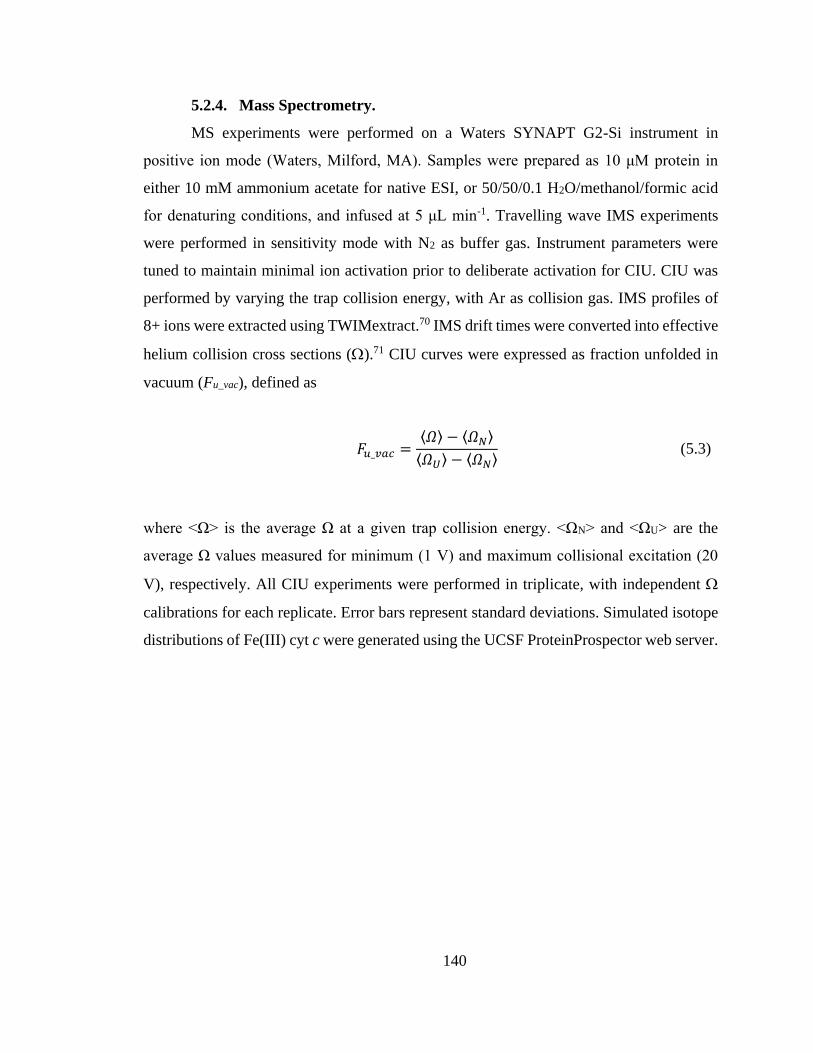
140
5.2.4. Mass Spectrometry.
MS experiments were performed on a Waters SYNAPT G2-Si instrument in
positive ion mode (Waters, Milford, MA). Samples were prepared as 10 μM protein in
either 10 mM ammonium acetate for native ESI, or 50/50/0.1 H2O/methanol/formic acid
for denaturing conditions, and infused at 5 μL min-1. Travelling wave IMS experiments
were performed in sensitivity mode with N2 as buffer gas. Instrument parameters were
tuned to maintain minimal ion activation prior to deliberate activation for CIU. CIU was
performed by varying the trap collision energy, with Ar as collision gas. IMS profiles of
8+ ions were extracted using TWIMextract.70 IMS drift times were converted into effective
helium collision cross sections ().71 CIU curves were expressed as fraction unfolded in
vacuum (Fu_vac), defined as
𝐹𝑢_𝑣𝑎𝑐 =⟨𝛺⟩ − ⟨𝛺𝑁⟩
⟨𝛺𝑈⟩ − ⟨𝛺𝑁⟩
(5.3)
where <Ω> is the average Ω at a given trap collision energy. <ΩN> and <ΩU> are the
average Ω values measured for minimum (1 V) and maximum collisional excitation (20
V), respectively. All CIU experiments were performed in triplicate, with independent
calibrations for each replicate. Error bars represent standard deviations. Simulated isotope
distributions of Fe(III) cyt c were generated using the UCSF ProteinProspector web server.
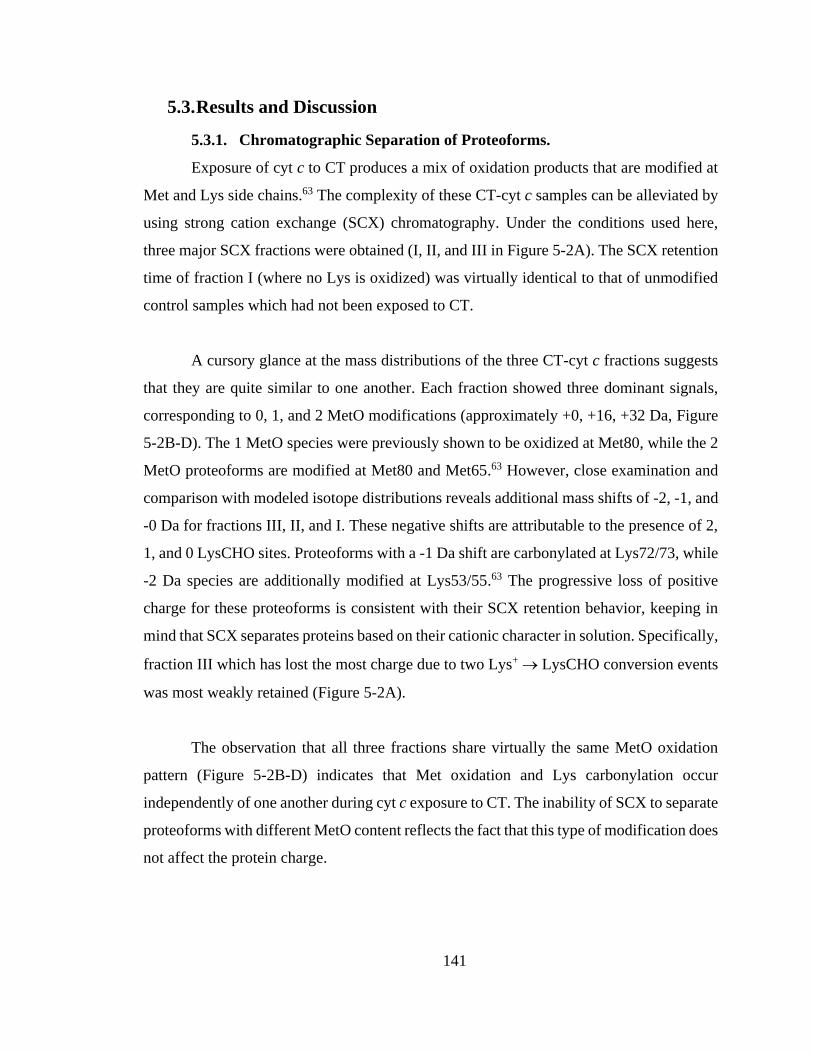
141
5.3. Results and Discussion
5.3.1. Chromatographic Separation of Proteoforms.
Exposure of cyt c to CT produces a mix of oxidation products that are modified at
Met and Lys side chains.63 The complexity of these CT-cyt c samples can be alleviated by
using strong cation exchange (SCX) chromatography. Under the conditions used here,
three major SCX fractions were obtained (I, II, and III in Figure 5-2A). The SCX retention
time of fraction I (where no Lys is oxidized) was virtually identical to that of unmodified
control samples which had not been exposed to CT.
A cursory glance at the mass distributions of the three CT-cyt c fractions suggests
that they are quite similar to one another. Each fraction showed three dominant signals,
corresponding to 0, 1, and 2 MetO modifications (approximately +0, +16, +32 Da, Figure
5-2B-D). The 1 MetO species were previously shown to be oxidized at Met80, while the 2
MetO proteoforms are modified at Met80 and Met65.63 However, close examination and
comparison with modeled isotope distributions reveals additional mass shifts of -2, -1, and
-0 Da for fractions III, II, and I. These negative shifts are attributable to the presence of 2,
1, and 0 LysCHO sites. Proteoforms with a -1 Da shift are carbonylated at Lys72/73, while
-2 Da species are additionally modified at Lys53/55.63 The progressive loss of positive
charge for these proteoforms is consistent with their SCX retention behavior, keeping in
mind that SCX separates proteins based on their cationic character in solution. Specifically,
fraction III which has lost the most charge due to two Lys+ → LysCHO conversion events
was most weakly retained (Figure 5-2A).
The observation that all three fractions share virtually the same MetO oxidation
pattern (Figure 5-2B-D) indicates that Met oxidation and Lys carbonylation occur
independently of one another during cyt c exposure to CT. The inability of SCX to separate
proteoforms with different MetO content reflects the fact that this type of modification does
not affect the protein charge.
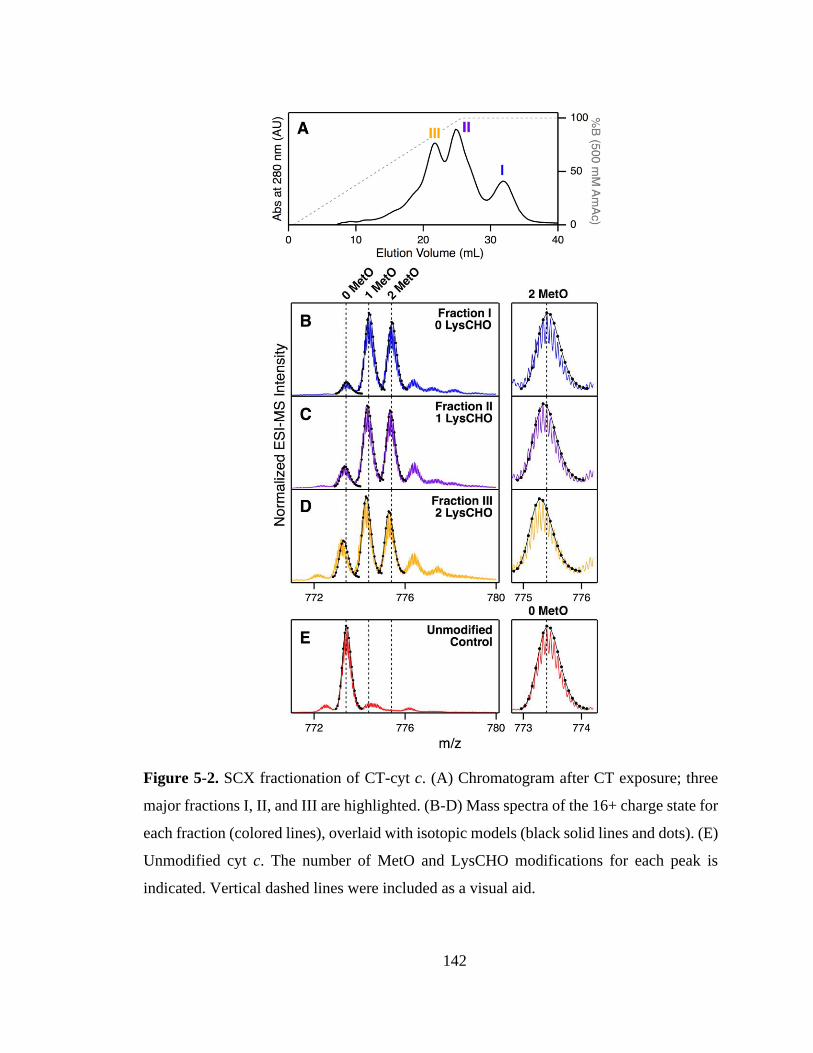
142
Figure 5-2. SCX fractionation of CT-cyt c. (A) Chromatogram after CT exposure; three
major fractions I, II, and III are highlighted. (B-D) Mass spectra of the 16+ charge state for
each fraction (colored lines), overlaid with isotopic models (black solid lines and dots). (E)
Unmodified cyt c. The number of MetO and LysCHO modifications for each peak is
indicated. Vertical dashed lines were included as a visual aid.

143
In summary, the CT-cyt c preparations examined here represent a mix of
proteoforms that contain 0, 1, or 2 MetO sites, as well as 0, 1, or 2 LysCHO modifications.
SCX allows separation into three fractions that are pure with respect to LysCHO content,
but heterogeneous in the number of MetO sites. The separation of CT-cyt c into three
fractions facilitates the subsequent experiments, compared to investigations on unseparated
samples.
5.3.2. Stability of CT-cyt c in Solution.
Unfolding experiments were performed to establish how CT-induced oxidative
modifications affect the stability of cyt c in solution (Figure 5-3). Instead of using chemical
denaturation27-28 we chose thermal unfolding assays15,18,25-26 to allow a direct comparison
with gas phase CIU experiments (discussed below), keeping in mind that both techniques
probe the protein response to heat. The thermodynamic parameters measured for
unmodified cyt c were TM = 86.8 ± 0.2 °C and ΔH = 493 ± 20 kJ mol-1. The former agrees
with literature data within 1 °C.72 Previous work reported a somewhat lower ΔH (400 kJ
mol-1)73 but that earlier study used acidic solutions, while our experiments were performed
at pH 7.4. Compared to the unmodified controls, all three CT-cyt c fractions showed a
substantial decrease in both TM (ca. 5 °C) and ΔH (ca. 50%), revealing that CT-induced
oxidative modifications reduce the stability of the protein in solution (Table 5-1). The
stability reduction seen here for CT-cyt c is reminiscent of data reported previously for
other oxidatively modified proteins.15,18,25-28
Interestingly, stability differences between the individual oxidized fractions I, II,
and III were small, evident from their almost superimposable unfolding profiles (Figure
5-3). As discussed above, the three fractions only differ in the number of modified Lys
residues (0, 1, 2 LysCHO for fractions I, II, III), while they share very similar MetO
compositions. From this, one can conclude that LysCHO formation does not significantly
affect the protein stability in solution, consistent with the location of these modifications
on side chains that protrude into the solvent (Figure 5-1A).
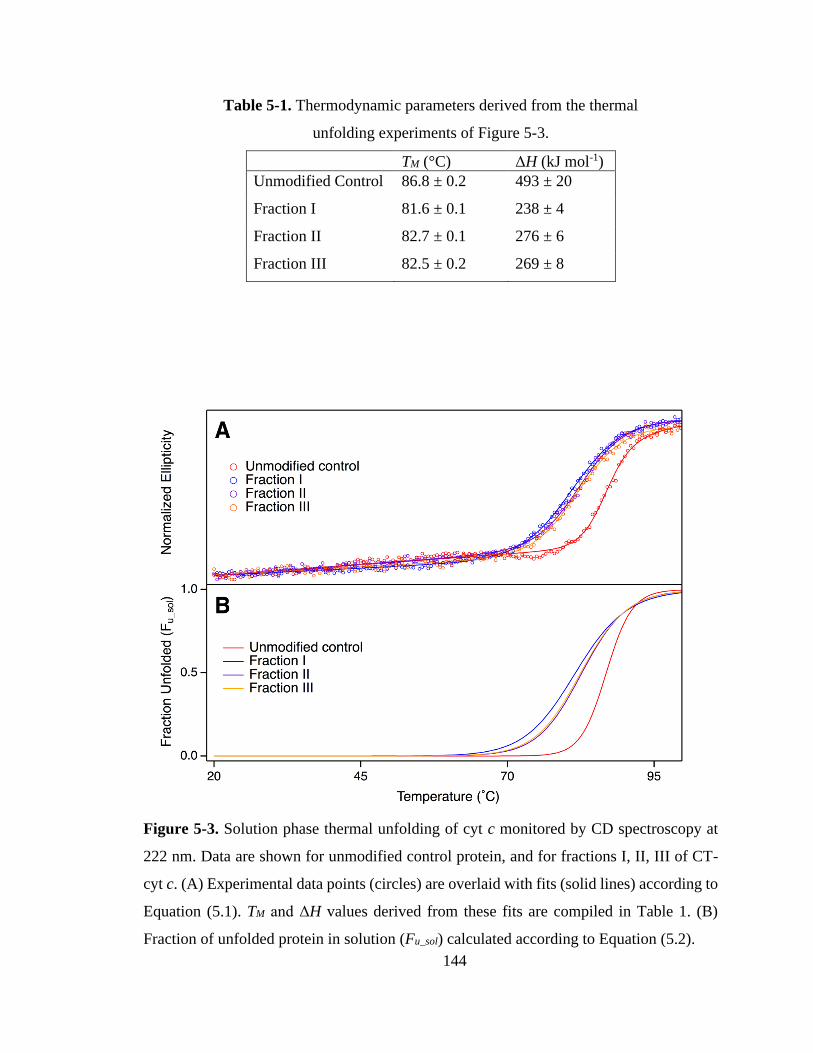
144
Table 5-1. Thermodynamic parameters derived from the thermal
unfolding experiments of Figure 5-3.
TM (°C) ΔH (kJ mol-1)
Unmodified Control 86.8 ± 0.2 493 ± 20
Fraction I 81.6 ± 0.1 238 ± 4
Fraction II 82.7 ± 0.1 276 ± 6
Fraction III 82.5 ± 0.2 269 ± 8
Figure 5-3. Solution phase thermal unfolding of cyt c monitored by CD spectroscopy at
222 nm. Data are shown for unmodified control protein, and for fractions I, II, III of CT-
cyt c. (A) Experimental data points (circles) are overlaid with fits (solid lines) according to
Equation (5.1). TM and ΔH values derived from these fits are compiled in Table 1. (B)
Fraction of unfolded protein in solution (Fu_sol) calculated according to Equation (5.2).
145
Instead, the major stability difference between unmodified cyt c and CT-cyt c are
attributable to MetO formation. Oxidation of the deeply buried Met80 is expected to be
particularly disruptive because it ruptures the distal Fe-sulfur bond and interferes with side
chain packing in the protein core.74 Met65 modifications likely affect the protein stability
to a lesser extent, because this residue is located close to the protein surface without any
critical side chain contacts (Figure 5-1A).
5.3.3. ESI Charge States of CT-cyt c.
Because the formation of each LysCHO is concomitant with the loss of a basic
(protonatable) site, one might expect that the ESI charge state distribution of [M + zH]z+
ions could be affected by LysCHO formation. However, native ESI mass spectra of
unmodified controls and fractions I-III were very similar to one another, with charge state
distributions dominated by 8+/7+ ions. In contrast, spectra acquired under denaturing
conditions exhibited slight shifts to lower charge states, from maxima of 17+/16+ for
unmodified cyt c and fraction I, down to 16+/15+ for fraction III (Figure 5-4).
Native ESI proceeds according to the charged residue model (CRM), where protein
ions are released upon droplet evaporation to dryness. Charge states generated under these
conditions are close to those of protein-sized water droplets at the Rayleigh limit (zR 7.9
for cyt c).75-77 Thus, CRM charge states of globular proteins are governed by their surface
area, rather than the number of basic sites.78 The fact that native ESI generates very similar
charge state distributions for unmodified and CT-cyt c indicates that the covalent
modifications encountered here do not dramatically alter the overall compactness of the
protein. This view is consistent with native ESI values which are very similar for all
proteoforms (see below).
The situation is different under denaturing ESI conditions, where protein ions likely
form according to the chain ejection mechanism (CEM).77 The CEM proceeds with gradual
ejection of extended protein chains from the droplet surface, in concert with the
equilibration of mobile H+ between the droplet and its protein appendage. Any factor that
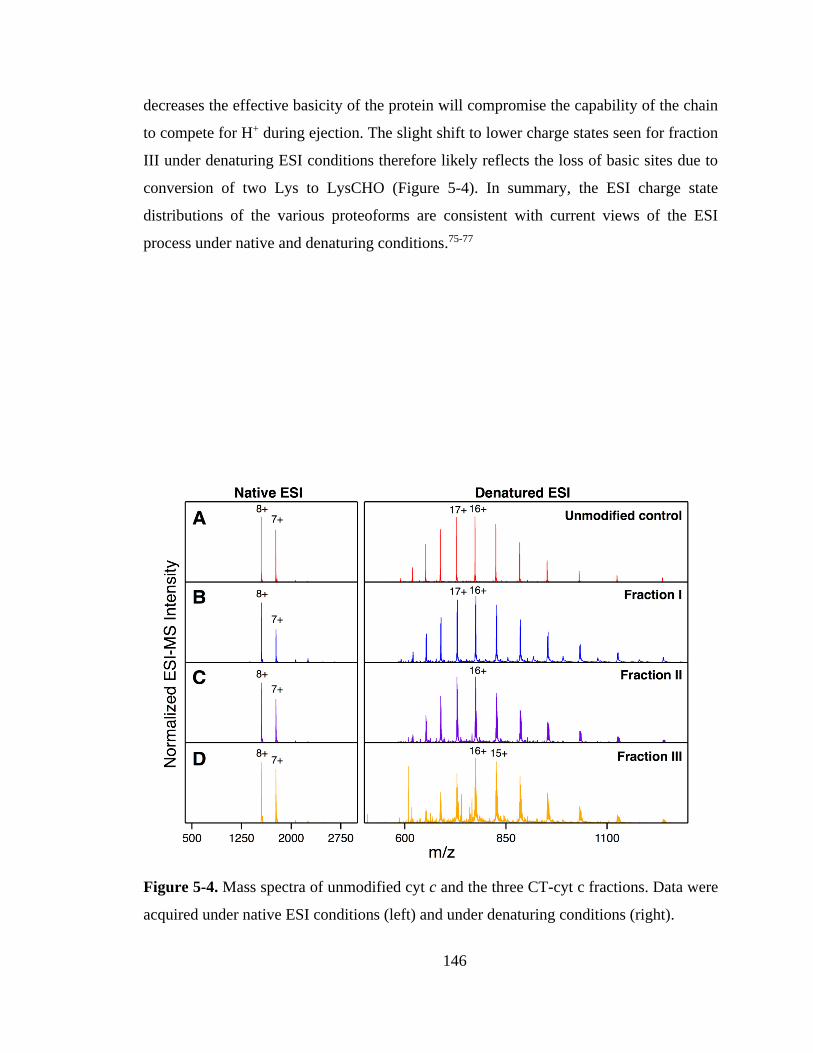
146
decreases the effective basicity of the protein will compromise the capability of the chain
to compete for H+ during ejection. The slight shift to lower charge states seen for fraction
III under denaturing ESI conditions therefore likely reflects the loss of basic sites due to
conversion of two Lys to LysCHO (Figure 5-4). In summary, the ESI charge state
distributions of the various proteoforms are consistent with current views of the ESI
process under native and denaturing conditions.75-77
Figure 5-4. Mass spectra of unmodified cyt c and the three CT-cyt c fractions. Data were
acquired under native ESI conditions (left) and under denaturing conditions (right).
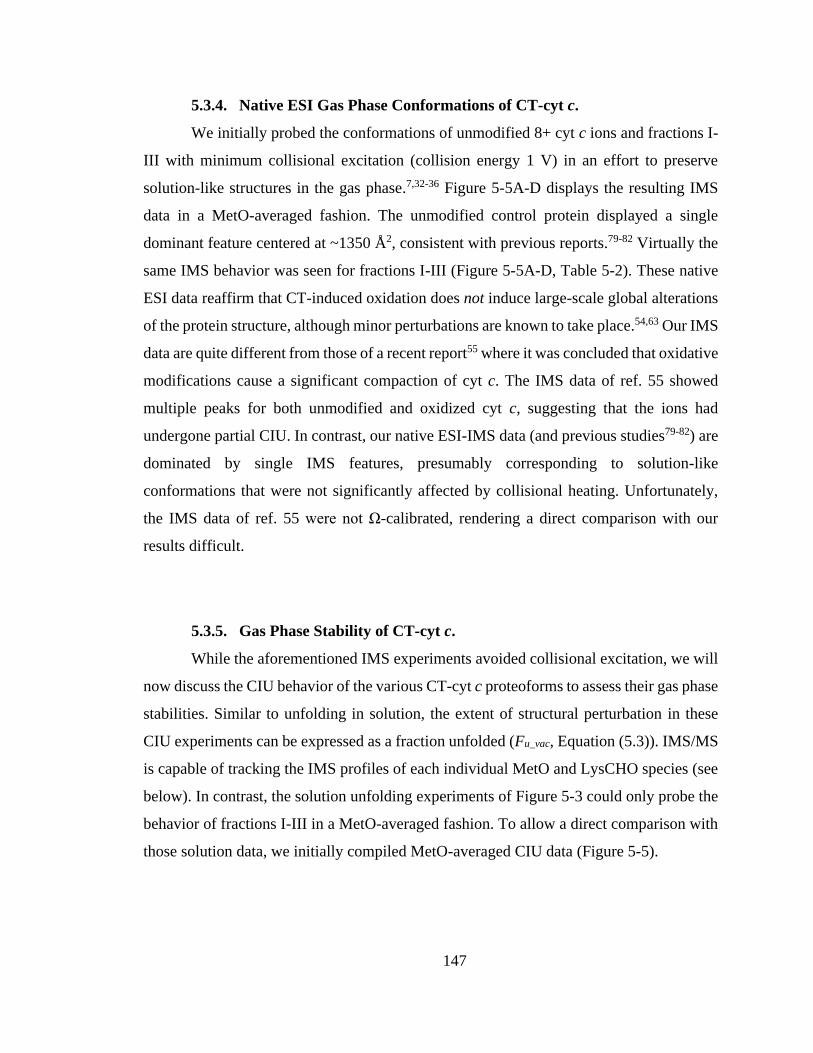
147
5.3.4. Native ESI Gas Phase Conformations of CT-cyt c.
We initially probed the conformations of unmodified 8+ cyt c ions and fractions I-
III with minimum collisional excitation (collision energy 1 V) in an effort to preserve
solution-like structures in the gas phase.7,32-36 Figure 5-5A-D displays the resulting IMS
data in a MetO-averaged fashion. The unmodified control protein displayed a single
dominant feature centered at ~1350 Å2, consistent with previous reports.79-82 Virtually the
same IMS behavior was seen for fractions I-III (Figure 5-5A-D, Table 5-2). These native
ESI data reaffirm that CT-induced oxidation does not induce large-scale global alterations
of the protein structure, although minor perturbations are known to take place.54,63 Our IMS
data are quite different from those of a recent report55 where it was concluded that oxidative
modifications cause a significant compaction of cyt c. The IMS data of ref. 55 showed
multiple peaks for both unmodified and oxidized cyt c, suggesting that the ions had
undergone partial CIU. In contrast, our native ESI-IMS data (and previous studies79-82) are
dominated by single IMS features, presumably corresponding to solution-like
conformations that were not significantly affected by collisional heating. Unfortunately,
the IMS data of ref. 55 were not Ω-calibrated, rendering a direct comparison with our
results difficult.
5.3.5. Gas Phase Stability of CT-cyt c.
While the aforementioned IMS experiments avoided collisional excitation, we will
now discuss the CIU behavior of the various CT-cyt c proteoforms to assess their gas phase
stabilities. Similar to unfolding in solution, the extent of structural perturbation in these
CIU experiments can be expressed as a fraction unfolded (Fu_vac, Equation (5.3)). IMS/MS
is capable of tracking the IMS profiles of each individual MetO and LysCHO species (see
below). In contrast, the solution unfolding experiments of Figure 5-3 could only probe the
behavior of fractions I-III in a MetO-averaged fashion. To allow a direct comparison with
those solution data, we initially compiled MetO-averaged CIU data (Figure 5-5).
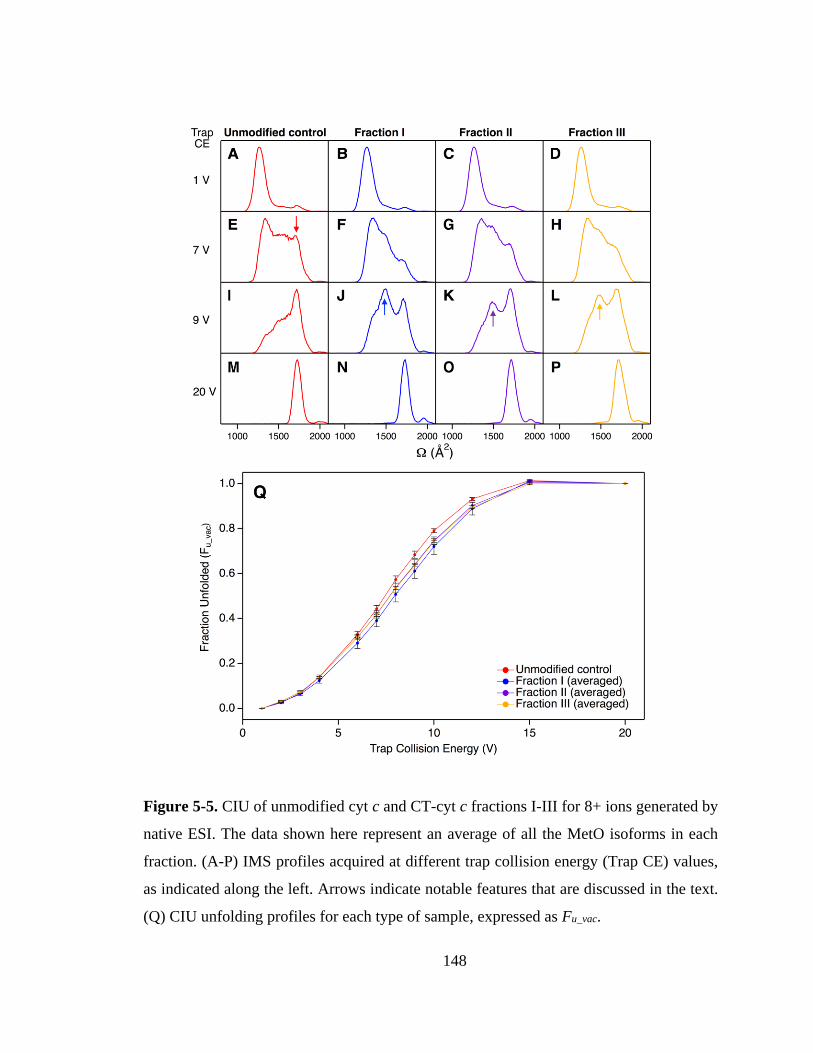
148
Figure 5-5. CIU of unmodified cyt c and CT-cyt c fractions I-III for 8+ ions generated by
native ESI. The data shown here represent an average of all the MetO isoforms in each
fraction. (A-P) IMS profiles acquired at different trap collision energy (Trap CE) values,
as indicated along the left. Arrows indicate notable features that are discussed in the text.
(Q) CIU unfolding profiles for each type of sample, expressed as Fu_vac.
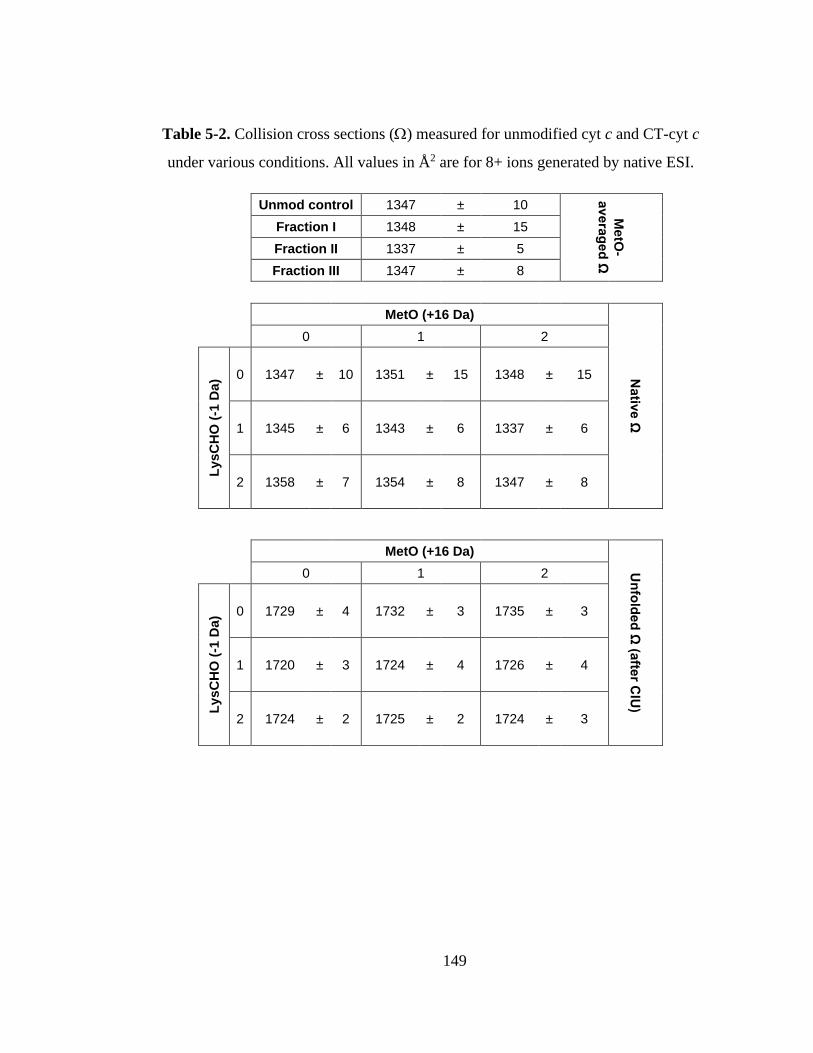
149
Table 5-2. Collision cross sections () measured for unmodified cyt c and CT-cyt c
under various conditions. All values in Å2 are for 8+ ions generated by native ESI.
Unmod control 1347 ± 10 M
etO
-
av
era
ge
d Ω
Fraction I 1348 ± 15
Fraction II 1337 ± 5
Fraction III 1347 ± 8
MetO (+16 Da)
Na
tive
Ω
0 1 2
Ly
sC
HO
(-1
Da
) 0 1347 ± 10 1351 ± 15 1348 ± 15
1 1345 ± 6 1343 ± 6 1337 ± 6
2 1358 ± 7 1354 ± 8 1347 ± 8
MetO (+16 Da)
Un
fold
ed
Ω (a
fter C
IU)
0 1 2
Ly
sC
HO
(-1
Da
) 0 1729 ± 4 1732 ± 3 1735 ± 3
1 1720 ± 3 1724 ± 4 1726 ± 4
2 1724 ± 2 1725 ± 2 1724 ± 3
150
Raising the collision energy from 1 V to 20 V resulted in significant gas phase
unfolding for all 8+ species, transforming the “native” (~1350 Å2) IMS distributions into
unimodal profiles centered at ~1730 Å2 (Figure 5-5, Table 5-2). Although the <Ω> values
of CT-cyt c at the lowest and highest collision energies were very similar to the unmodified
protein, there were clear differences in the intermediate energy regime. At 7 V all of the
IMS profiles had maxima around 1400 Å2. In addition, the unmodified control exhibited a
major feature at ~1700 Å2, which is close to the fully unfolded protein (marked by the red
arrow in Figure 5-5E). This unfolded feature was also seen for fractions I-III, but at much
lower intensities (Figure 5-5F-H). Upon raising the collision energy to 9V the IMS
distribution of the unmodified control was completely dominated by this ~1700 Å2 feature
(Figure 5-5I), while more compact conformers (around 1500 Å2) persisted for fractions I-
III (see arrows in Figure 5-5J-L). No major differences are seen when comparing the CIU
data for fractions I-III among each other.
Overall, our data reveal that the unmodified control protein is more susceptible to
CIU than fractions I-III. This effect is also apparent from the Fu_vac profiles (Figure 5-5Q)
which have a midpoint at 0.5 V – 1 V lower collision energies for unmodified cyt c than
for fraction I-III. Based on these Fu_vac profiles alone it might be difficult to discern the
differences between unmodified cyt c and fractions I-III; however, the dissimilarities seen
in the IMS distribution for intermediate collision energies are striking (Figure 5-5E-L). The
observed oxidation-induced stabilization of cyt c in the gas phase (Figure 5-5) contrasts
the destabilization observed in solution (Figure 5-3).
151
5.3.6. Proteoform-Resolved CIU Analysis.
More detailed insights into the role of each modification can be obtained by
extracting IMS profiles of individual proteoforms. The three MetO variants are separable
by their mass differences (+0, +16, +32 Da), while the LysCHO variants (0, -1, -2 Da) can
be resolved using SCX fractionation. To facilitate the following discussion, we will identify
proteoforms as KmMn, where m and n are the number of LysCHO and MetO, respectively.
For example, K0M0 represents unmodified cyt c, while K2M1 refers to the proteoform
containing 2 LysCHO and 1 MetO.
To investigate the effects of MetO in the absence of LysCHO modifications we
probed the K0Mn series (n = 0, 1, 2, Figure 5-6). At intermediate collision energies, both
K0M1 and K0M2 had structures that were significantly more compact than for K0M0,
evident from the features highlighted with arrows in Figure 5-6D-I. Also, the midpoints of
the K0M1 and K0M2 CIU profiles are ~1 V higher than that of K0M0, while the former
two are virtually superimposable (Figure 5-6M). From these data it can be concluded that
oxidation of Met80 (in K0M1) enhances the gas phase stability of the protein, while the
additional oxidation of Met65 (in K0M2) has no discernible effect.
A similar analysis was conducted to investigate the effects of LysCHO
modifications by focusing on the KmM1 series (m = 0, 1, 2, Figure 5-7). The IMS
distributions (Figure 5-7A-L) and CIU profiles (Figure 5-7M) for these three species were
very similar across all collision energies, suggesting that LysCHO formation only has
minor effects on the gas phase stability of cyt c. The last aspect is consistent with the
behavior in solution (Figure 5-3), where the number of LysCHO also has a negligible effect
on stability. This is in stark contrast to MetO formation at residue 80 which greatly affects
the properties of cyt c, giving rise to opposing stability trends in solution and in the gas
phase.
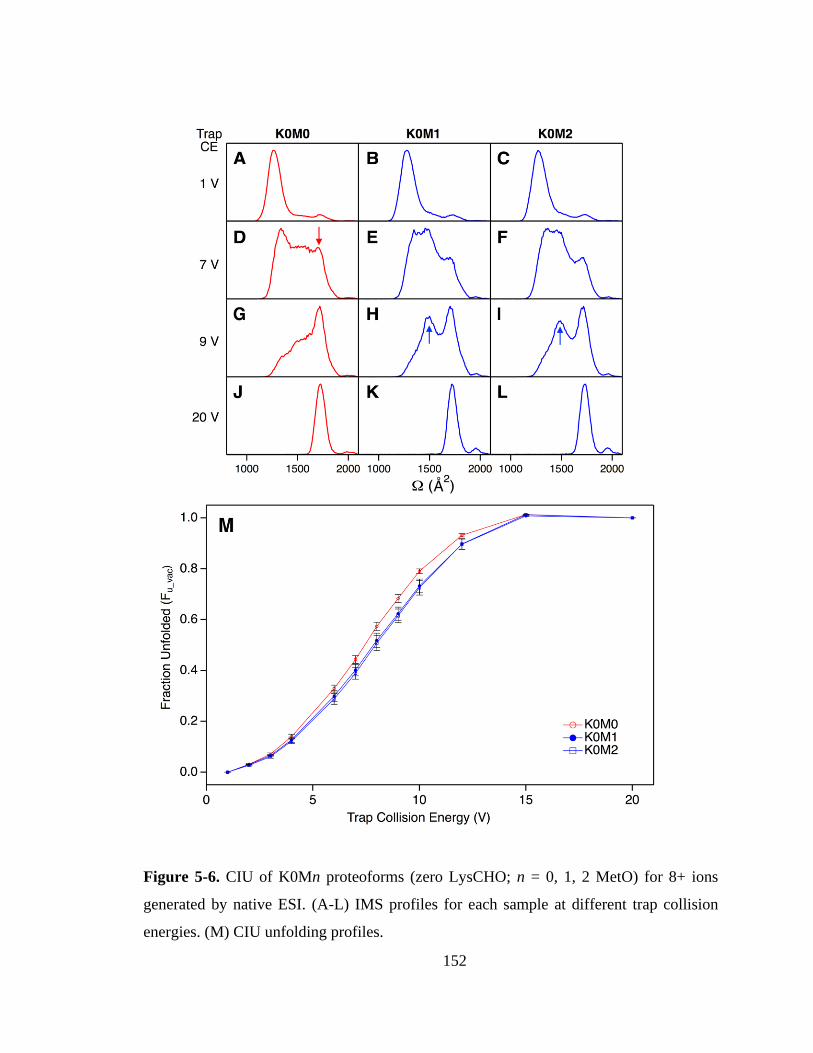
152
Figure 5-6. CIU of K0Mn proteoforms (zero LysCHO; n = 0, 1, 2 MetO) for 8+ ions
generated by native ESI. (A-L) IMS profiles for each sample at different trap collision
energies. (M) CIU unfolding profiles.
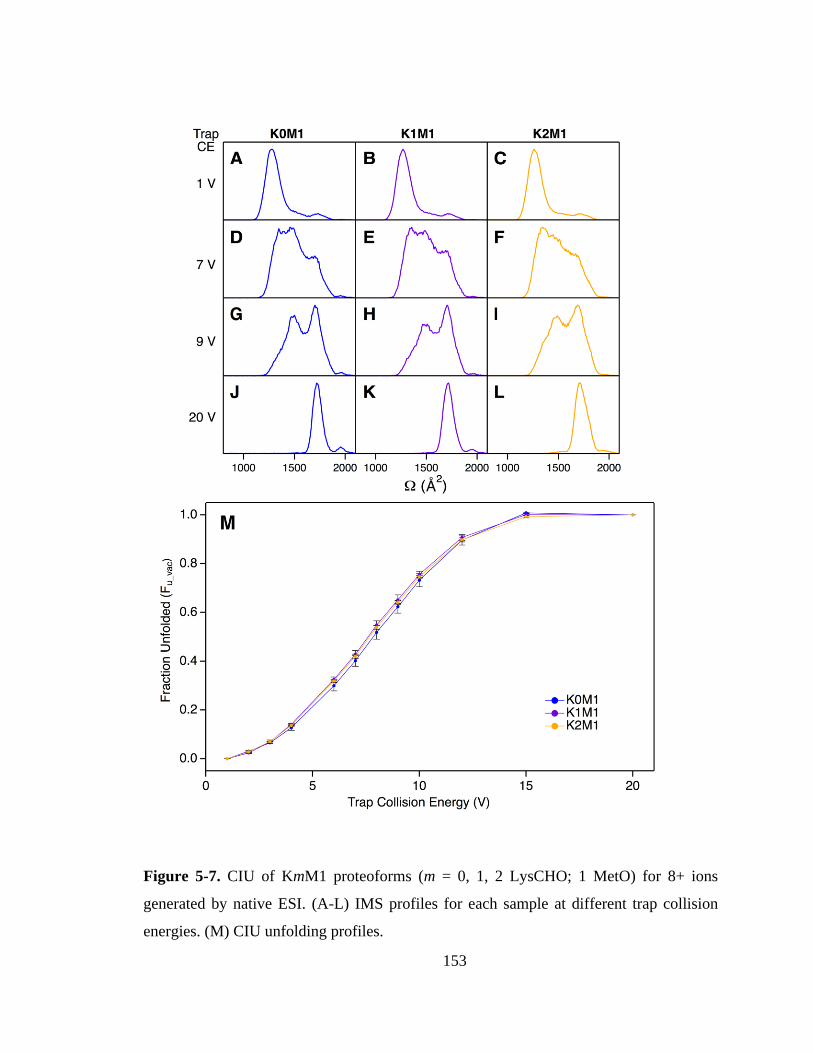
153
Figure 5-7. CIU of KmM1 proteoforms (m = 0, 1, 2 LysCHO; 1 MetO) for 8+ ions
generated by native ESI. (A-L) IMS profiles for each sample at different trap collision
energies. (M) CIU unfolding profiles.
154
5.4. Conclusions
Our results reveal that CT-induced oxidation affects the cyt c stability in solution
and in the gas phase quite differently. In solution, CT-cyt c has a melting point that is ~5
C lower than that of unmodified cyt c, implying large-scale destabilization. In the gas
phase, oxidative modifications cause a small but distinct stabilization, evident from a ~1 V
shift to higher CIU voltages. Our results indicate that both of these effects can be attributed
largely to MetO formation of Met80, a residue that is deeply buried and represents the
distal heme ligand in the native state.74 The effects of other CT-induced oxidative
modifications on protein stability are less pronounced (MetO formation at Met65, and
LysCHO formation at Lys72/73 and Lys53/55). The lack of major changes following
modification of these other sites is consistent with their solvent-exposed locations which
allow covalent modifications to be accommodated without disrupting the side chain
packing in the core (Figure 5-1A).
The observation that Met80 oxidation reduces the protein stability in solution is
consistent with a wide range of observations on other oxidatively modified proteins,
reflecting the fact that oxidation events usually perturb steric interactions, polarity,
hydrophobicity, etc.15,18,25-28 In cyt c the conversion of Met80 to MetO additionally ruptures
the distal Met-Fe bond.47,51,53-54 It seems surprising, therefore, that this modification would
render the protein more resilient to CIU in the gas phase. One possible explanation is the
formation of new bonds after conversion of Met80 to MetO. Recent work has shown that
the partially positive sulfur atom in MetO can noncovalently bind to the partially negative
electron clouds of aromatic rings.83 Several aromatic residues are relatively close to
Met80 (Trp59, Tyr67, Phe82, Figure 5-1B), and thus it seems conceivable that the
enhanced gas phase stability could be rooted in newly formed contacts of MetO with one
of these sites. Interestingly, computer simulations predict that such MetO-aromatic
contacts will be disfavored in water.84 This could explain our observation of MetO-induced
destabilization in solution vs. stabilization in the gas phase.
155
It is also somewhat surprising that Lys carbonylation does not have a destabilizing
effect in the gas phase, keeping in mind the role of strengthened electrostatic contacts in
vacuo and the likely involvement of Lys+ in salt bridges at the protein surface.46 It is
possible that the loss of basic sites due to LysCHO formation is compensated by other
factors, such as dipole interactions of -CHO sites with positively charged moieties on the
protein surface.
Overall, the results of this work highlight the fact that protein stability trends
observed in solution are not always mirrored by the corresponding gaseous ions, consistent
with the findings of several previous studies.44-46 Investigating the origin of these different
trends offers exciting opportunities to better understand the complex interplay of
electrostatic and other noncovalent contacts in native and covalently modified proteins. It
is hoped that future comparative solution/gas phase investigations will provide further
insights into the molecular foundation of oxidation-induced alterations on protein function
and stability.

156
5.5. References
(1) Covey, T. R.; Thomson, B. A.; Schneider, B. B., Mass Spectrom. Rev. 2009, 28,
870-897.
(2) Fenn, J. B., Angew. Chem. Int. Ed. 2003, 42, 3871-3894.
(3) Karas, M.; Hillenkamp, F., Anal. Chem. 1988, 60, 2299-2301.
(4) Frey, B. L.; Damon, D. E.; Badu-Tawiah, A. K., Mass Spectrom. Rev. 2020, in
press.
(5) Brown, H. M.; Pirro, V.; Cooks, R. G., Clin. Chem. 2018, 64 (4), 628-630.
(6) Susa, A. C.; Lippens, J. L.; Xia, Z.; Loo, J. A.; Campuzano, I. D. G.; Williams, E.
R., J. Am. Soc. Mass Spectrom. 2018, 29 (203-206).
(7) Chorev, D. S.; Baker, L. A.; Wu, D.; Beilsten-Edmands, V.; Rouse, S. L.; Zeev-
Ben-Mordehai, T.; Jiko, C.; Samsudin, F.; Gerle, C.; Khalid, S.; Stewart, A. G.;
Matthews, S. J.; Gruenewald, K.; Robinson, C. V., Science 2018, 362 (6416), 829-
834.
(8) Peacock, P. M.; Zhang, W. J.; Trimpin, S., Anal. Chem. 2017, 89 (1), 372-388.
(9) Fersht, A. R., Structure and Mechanism in Protein Science. W. H. Freeman & Co.:
New York, 1999.
(10) Balchin, D.; Hayer-Hartl, M.; Hartl, F. U., Science 2016, 353 (6294), 42.
(11) Winkler, J. R.; Gray, H. B., Q. Rev. Biophys. 2015, 48 (4), 411-420.
(12) Nimse, S. B.; Pal, D., RSC Adv. 2015, 5 (35), 27986-28006.
(13) Kathiresan, M.; English, A. M., Chem. Sci. 2017, 8 (2), 1152-1162.
(14) Dalle-Donne, I.; Rossi, R.; Giustarini, D.; Milzani, A.; Colombo, R., Clin. Chim.
Acta 2003, 329, 23-38.
(15) Sigalov, A. B.; Stern, L. J., Chem. Phys. Lipids 2001, 113 (1-2), 133-146.
(16) Mo, J. J.; Yan, Q. R.; So, C. K.; Soden, T.; Lewis, M. J.; Hu, P., Anal. Chem. 2016,
88 (19), 9495-9502.
(17) Strickland, E. C.; Geer, M. A.; Tran, D. T.; Adhikari, J.; West, G. M.; Dearmond,
P. D.; Xu, Y.; Fitzgerald, M. C., Nat. Protocols 2012, 8 (1), 148-61.
(18) Buecheler, J. W.; Winzer, M.; Weber, C.; Gieseler, H., J. Pharm. Sci. 2019, 108
(3), 1236-1245.
157
(19) Xu, G.; Chance, M. R., Chem. Rev. 2007, 107, 3514-3543.
(20) Saladino, J.; Liu, M.; Live, D.; Sharp, J. S., J. Am. Soc. Mass Spectrom. 2009, 20,
1123-1126.
(21) de Graff, A. M. R.; Hazoglou, M. J.; Dill, K. A., Structure 2016, 24 (2), 329-336.
(22) Pedersen, J. T.; Chen, S. W.; Borg, C. B.; Ness, S.; Bahl, J. M.; Heegaard, N. H.
H.; Dobson, C. M.; Hemmingsen, L.; Cremades, N.; Teilum, K., J. Am. Chem. Soc.
2016, 138 (12), 3966-3969.
(23) Sultana, R.; Boyd-Kimball, D.; Poon, H. F.; Cai, J.; Pierce, W. M.; Klein, J. B.;
Markesbery, W. R.; Zhou, X. Z.; Lu, K. P.; Butterfield, D. A., Neurobiol. Aging
2006, 27 (7), 918-925.
(24) Bonnington, L.; Lindner, I.; Gilles, U.; Kailich, T.; Reusch, D.; Bulau, P., Anal.
Chem. 2017, 89 (16), 8233-8237.
(25) Mulinacci, F.; Capelle, M. A. H.; Gurny, R.; Drake, A. F.; Arvinte, T., J. Pharm.
Sci. 2011, 100 (2), 451-463.
(26) Jayaraman, S.; Gantz, D. L.; Gursky, O., Biochemistry 2008, 47 (12), 3875-3882.
(27) Walker, E. J.; Bettinger, J. Q.; Welle, K. A.; Hryhorenko, J. R.; Ghaemmaghami,
S., Proc. Natl. Acad. Sci. U. S. A. 2019, 116 (13), 6081-6090.
(28) Kim, Y. H.; Berry, A. H.; Spencer, D. S.; Stites, W. E., Protein Eng. 2001, 14 (5),
343-347.
(29) Greenfield, N. J., Anal. Biochem. 1996, 235, 1 - 10.
(30) Swint, L.; Robertson, A. D., Protein Sci. 1993, 2 (12), 2037-2049.
(31) Geer, M. A.; Fitzgerald, M. C., J. Am. Soc. Mass Spectrom. 2016, 27, 233-243.
(32) Leney, A. C.; Heck, A. J. R., J. Am. Soc. Mass Spectrom. 2017, 28, 5-13.
(33) Osterlund, N.; Moons, R.; Ilag, L. L.; Sobott, F.; Graslund, A., J. Am. Chem. Soc.
2019, 141 (26), 10440-10450.
(34) Kaddis, C. S.; Loo, J. A., Anal. Chem. 2007, 79, 1779-1784.
(35) Ashcroft, A. E., J. Am. Soc. Mass Spectrom. 2010, 21, 1087-1096.
(36) Harvey, S. R.; Seffernick, J. T.; Quintyn, R. S.; Song, Y.; Ju, Y.; Yan, J.;
Sahasrabuddhe, A. N.; Norris, A.; Zhou, M. W.; Behrman, E. J.; Lindert, S.;
Wysocki, V. H., Proc. Natl. Acad. Sci. U. S. A. 2019, 116 (17), 8143-8148.
158
(37) Clemmer, D. E.; Jarrold, M. F., J. Mass Spectrom. 1997, 32, 577-592.
(38) Zhong, Y.; Han, L.; Ruotolo, B. T., Angew. Chem. 2014, 53 (35), 9209-12.
(39) Nouchikian, L.; Lento, C.; Donovan, K. A.; Dobson, R. C.; Wilson, D. J., Journal
of the American Society for Mass Spectrometry 2020, 31 (3), 685-692.
(40) Donor, M. T.; Shepherd, S. O.; Prell, J. S., J. Am. Soc. Mass Spectrom. 2020, 31
(3), 602-610.
(41) Tesic, M.; Wicki, J.; Poon, D., K. Y.; Withers, S. G.; Douglas, D. J., J. Am. Soc.
Mass Spectrom. 2007, 18, 64-73.
(42) Hopper, J. T. S.; Oldham, N. J., J. Am. Soc. Mass Spectrom. 2009, 20, 1851-1858.
(43) Liu, L.; Michelsen, K.; Kitova, E. N.; Schnier, P. D.; Klassen, J. S., J. Am. Chem.
Soc. 2012, 134 (6), 3054-3060.
(44) Wolynes, P. G., Proc. Natl. Acad. Sci. U.S.A. 1995, 92, 2426-2427.
(45) Peschke, M.; Verkerk, U. H.; Kebarle, P., J. Am. Soc. Mass Spectrom. 2004, 15,
1424-1434.
(46) Yin, S.; Xie, Y.; Loo, J. A., J. Am. Soc. Mass Spectrom. 2008, 19, 1199-1208.
(47) Chen, Y.-R.; Deterding, L. J.; Sturgeon, B. E.; Tomer, K. B.; Mason, R. P., J. Biol.
Chem. 2002, 277 (33), 29781-29791.
(48) Lushington, G. H.; Cowley, A. B.; Silchenko, S.; Lukat-Rodgers, G. S.; Rodgers,
K. R.; Benson, D. R., Inorg. Chem. 2003, 42 (23), 7550-7559.
(49) Wang, Z.; Ando, Y.; Nugraheni, A. D.; Ren, C.; Nagao, S.; Hirota, S., Mol. Biosyst.
2014, 10 (12), 3130-3137.
(50) Birk, A. V.; Chao, W. M.; Liu, S. Y.; Soong, Y.; Szeto, H. H., Biochim. Biophys.
Acta 2015, 1847 (10), 1075-1084.
(51) Capdevila, D. A.; Marmisolle, W. A.; Tomasina, F.; Demicheli, V.; Portela, M.;
Radi, R.; Murgida, D. H., Chem. Sci. 2015, 6 (1), 705-713.
(52) Nugraheni, A. D.; Ren, C. G.; Matsumoto, Y.; Nagao, S.; Yamanaka, M.; Hirota,
S., J. Inorg. Biochem. 2018, 182, 200-207.
(53) Parakra, R. D.; Kleffmann, G. N. L.; Jameson, T.; Ledgerwood, E. C., Dalton Trans.
2018, 47, 9128-9135.
(54) Zhong, F.; Pletneva, E. V., Inorg. Chem. 2018, 57 (10), 5754-5766.
159
(55) Chea, E. E.; Deredge, D. J.; Jones, L. M., Biophys. J. 2020, 118 (1), 128-137.
(56) Barayeu, U.; Lange, M.; Mendez, L.; Arnhold, J.; Shadyro, O. I.; Fedorova, M.;
Flemmig, J., J. Biol. Chem. 2019, 294 (6), 1816-1830.
(57) Alvarez-Paggi, D.; Hannibal, L.; Castro, M. A.; Oviedo-Rouco, S.; Demicheli, V.;
Tórtora, V.; Tomasina, F.; Radi, R.; Murgida, D. H., Chem. Rev. 2017, 117 (21),
13382-13460.
(58) Veitch, N. C., Phytochem. 2004, 65, 249-259.
(59) McClelland, L. J.; Mou, T.-C.; Jeakins-Cooley, M. E.; Sprang, S. R.; Bowler, B. E.,
Proc. Natl. Acad. Sci. U.S.A. 2014, 111 (18), 6648-6653.
(60) Kitt, J. P.; Bryce, D. A.; Minteer, S. D.; Harris, J. M., J. Am. Chem. Soc. 2017.
(61) Oemer, G.; Lackner, K.; Muigg, K.; Krumschnabel, G.; Watschinger, K.; Sailer, S.;
Lindner, H.; Gnaiger, E.; Wortmann, S. B.; Werner, E. R.; Zschocke, J.; Keller, M.
A., Proc. Natl. Acad. Sci. U.S.A. 2018, 115 (16), 4158-4163.
(62) Belikova, N. A.; Vladimirov, Y. A.; Osipov, A. N.; Kapralov, A. A.; Tyurin, V. A.;
Potapovich, M. V.; Basova, L. V.; Peterson, J.; Kurnikov, I. V.; Kagan, V. E.,
Biochemistry 2006, 45 (15), 4998-5009.
(63) Yin, V.; Mian, S. H.; Konermann, L., Chem. Sci. 2019, 10, 2349-2359.
(64) Yin, V.; Shaw, G. S.; Konermann, L., J. Am. Chem. Soc. 2017, 139, 15701–15709.
(65) Mushran, S. P.; Agrawal, M. C.; Prasad, B., J. Chem. Soc. B 1971, 0 (8), 1712-1714.
(66) Bachi, A.; Dalle-Donne, I.; Scaloni, A., Chem. Rev. 2013, 113 (1), 596-698.
(67) Møller, I. M.; Rogowska-Wrzesinska, A.; Rao, R. S. P., J. Proteomics 2011, 74
(11), 2228-2242.
(68) Yang, Y.; Stella, C.; Wang, W. R.; Schoneich, C.; Gennaro, L., Anal. Chem. 2014,
86 (10), 4799-4806.
(69) Konermann, L., Protein Unfolding and Denaturants. In Encyclopedia of Life
Sciences (eLS), John Wiley & Sons, Ltd: Chichester, 2012.
(70) Haynes, S. E.; Polasky, D. A.; Dixit, S. M.; Majmudar, J. D.; Neeson, K.; Ruotolo,
B. T.; Martin, B. R., Anal. Chem. 2017, 89 (11), 5669-5672.
(71) Sun, Y.; Vahidi, S.; Sowole, M. A.; Konermann, L., J. Am. Soc. Mass Spectrom.
2016, 27, 31-40.
160
(72) Bagel'ova, J.; Antalik, M.; Tomori, Z., Biochem. Mol. Biol. Int. 1997, 43 (4), 891-
900.
(73) Kuroda, Y.; Kidokoro, S.; Wada, A., J. Mol. Biol. 1992, 223, 1139-1153.
(74) Bushnell, G. W.; Louie, G. V.; Brayer, G. D., J. Mol. Biol. 1990, 214, 585-595.
(75) de la Mora, F. J., Anal. Chim. Acta 2000, 406, 93-104.
(76) Kebarle, P.; Verkerk, U. H., Mass Spectrom. Rev. 2009, 28, 898-917.
(77) Konermann, L.; Metwally, H.; Duez, Q.; Peters, I., Analyst 2019, 144, 6157-6171.
(78) Kaltashov, I. A.; Mohimen, A., Anal. Chem. 2005, 77, 5370-5379.
(79) Mao, Y.; Woenckhaus, J.; Kolafa, J.; Ratner, M. A.; Jarrold, M. F., J. Am. Chem.
Soc. 1999, 121 (12), 2712-2721.
(80) Allen, S. J.; Schwartz, A. M.; Bush, M. F., Anal. Chem. 2013, 85, 12055−12061.
(81) Theisen, A.; Black, R.; Corinti, D.; Brown, J. M.; Bellina, B.; Barran, P. E., J. Am.
Soc. Mass Spectrom. 2019, 30 (1), 24-33.
(82) Zhao, Q.; Schieffer, G. M.; Soyk, M. W.; Anderson, T. J.; Houk, R. S.; Badman, E.
R., J. Am. Soc. Mass Spectrom. 2010, 21 (7), 1208-1217.
(83) Lewis, A. K.; Dunleavy, K. M.; Senkow, T. L.; Her, C.; Horn, B. T.; Jersett, M. A.;
Mahling, R.; McCarthy, M. R.; Perell, G. T.; Valley, C. r. C.; Karim, C. B.; Gao,
J.; Pomerantz, W. C. K.; Thomas, D. D.; Cembran, A.; Hinderliter, A.; Sachs, J. N.,
Nat. Chem. Biol. 2016, 12 (10), 860-866.
(84) Orabi, E. A.; English, A. M., Phys. Chem. Chem. Phys. 2018, 20 (35), 23132-23141.
161
Chapter 6. Summary and Future Work
6.1. Summary
The peroxidase activity of cyt c plays a critical role in triggering programmed cell
death (apoptosis). However, the hexacoordinated heme cofactor present in native cyt c
should render this activity impossible. Despite the central biological importance of this
peroxidase function, the molecular mechanisms underlying this structural paradox are
poorly understood. The work detailed in this dissertation fills this knowledge gap by
deciphering the central role of protein oxidative modifications and their associated
structural changes in activating the peroxidase function of cyt c.
In Chapter 2, the critical role of in situ structural changes in triggering the
peroxidase activity of cyt c was uncovered. These changes were triggered by multiple
oxidative modifications induced by H2O2. Using top-down MS, we established that the
initial oxidative modifications occur sequentially, yielding a stepwise model to peroxidase
activation. A key modification in this capacity was the oxidation of Lys into its
corresponding aldehyde (LysCHO).
In Chapter 3, we extensively characterized the oxidized cyt c proteoforms produced
by treatment with CT. We discovered that this purportedly well-characterized model
system represents a mixture of structurally and functionally distinct proteoforms that differ
primarily by the extent of LysCHO formation at key sites.
In Chapter 4, we established the causal factors underlying the observed specificity
in the formation of LysCHO and other oxidative modifications by comparing the oxidation
behaviour of cyt c with its heme-free counterpart (apo-cyt c). These experiments revealed
that LysCHO is formed by heme-mediated catalysis, while other modifications (e.g. MetO)
proceed via direct interaction with the oxidant.
162
In Chapter 5, we utilized CT-treated cyt c as a model system to test the compatibility
of protein stability measurements in the gas phase to their counterparts in solution. Unlike
many other reported systems, for which good qualitative agreement was observed, we
discovered that oxidized cyt c shows opposite stability trends in the gas phase and in
solution.
6.2. Future Work
6.2.1. Peroxidase Activation In Vivo
The work described in Chapter 2 and Chapter 3 constitutes in vitro approaches to
studying the peroxidase activation of cyt c that were designed to emulate oxidative
conditions present in vivo, such as those at the onset of apoptosis and other biological
states.1,2 While some previous studies have attempted to directly map how cyt c may be
modified by ROS in vivo, such reports remain scarce, and structural details remain lacking.3
To the best of our knowledge, there does not yet exist any systematic reports detailing the
types of oxidized proteoforms cyt c may form in vivo.
It is interesting to note that studies of cyt c and apoptosis in a cellular context
commonly employ protein immunoblotting (i.e. Western blotting) using anti-cyt c
antibodies.4–6 It is unclear whether these antibodies possess sufficient specificity to
differentiate unmodified cyt c from its oxidized variants. The presence of oxidized cyt c
proteoforms in vivo may explain some unusual observations in the literature. For example,
Ott and coworkers reported that cyt c in mitochondria exists in two “pools”, which differ
by the strength of their interaction to the inner mitochondrial membrane.7 The first pool
could be dislodged by increasing ionic strength, while the second pool required both
increasing ionic strength and addition of an oxidizing agent. While the authors attributed
this behaviour to the existence of two distinct cyt c conformers, it seems plausible that the
first “pool” may instead correspond to oxidatively modified cyt c. The MS-based
experiments described in this dissertation would be amenable to analyze these potential
protein variants.

163
6.2.2. Cyt c / Cardiolipin Interactions
Interactions between cyt c and the membrane lipid cardiolipin (CL) play a key role
in the apoptosis-triggering function of cyt c.8–11 CL is thought to be the primary target of
the peroxidase activity of cyt c that initiates apoptosis. Although a large body of work has
attempted to uncover how cyt c interacts with CL,12–18 the precise nature of 1) how cyt c
binds to CL, and 2) how (and if) the structure of cyt c changes in response to CL binding
remains contentious. A major hurdle to the structural elucidation of the cyt c / CL complex
is that the “complex” is likely a mixture of multiple conformations and/or binding modes,
rendering spectroscopic characterization difficult.13 MS-based experiments, particularly
HDX-MS, may be an alternative technique to study these conformational ensembles.19 The
multiple protein conformations may be discernable via HDX-MS by the appearance of
multiple isotopic envelopes following deuterium labeling. Moreover, as ligand-binding
commonly manifests itself as a decrease in the rate of exchange, HDX-MS could also
elucidate the locations of the CL binding site(s).
Given our elucidation of an H2O2-induced pathway of peroxidase activation1
(Chapter 2), an alternative question could be: how does CL binding affect the oxidative
modifications induced by H2O2? Recent work by Barayeu and coworkers using bottom-up
MS found that cyt c is extensively oxidatively modified by H2O2 in the presence of CL.20
However, the direct link between these reported modifications and their effects on
peroxidase activity currently remains unknown. Top-down MS of the cyt c/CL/H2O2
system would provide insight on the interplay between these factors.
6.2.3. Oxidation Mapping in Other Systems
The work described in Chapter 4 describes the causal factors behind the origin of
specific oxidative modification products such as LysCHO. Due to the difficulty of
detecting LysCHO by the standard bottom-up MS approach, it seems possible that
LysCHO is a general, underreported protein oxidative modification that is also produced
by other oxidation sources (e.g. direct ∙OH attack). However, this remains to be verified
experimentally. Experiments described in this dissertation (e.g. GRT labeling) would aid

164
in the detection of such species. The verification of LysCHO formation is of particular
importance for techniques that require accurate quantitation of all oxidative modification
products, such as hydroxyl radical-based protein footprinting.21,22
Bottom-up MS is currently the de facto standard for identifying protein oxidative
modifications.21–23 However, the current dissertation demonstrates the feasibility of top-
down MS approaches for this task, even for complex mixtures of oxidized proteoforms.
The primary advantage of top-down MS is the ability to detect modifications at the
proteoform level, allowing any correlations between the various modifications to be
directly observed. We anticipate that this will be particularly impactful for studying
oxidative damage pathways in proteins.24–28 Top-down MS would allow these pathways to
be directly mapped via the observed distributions of oxidized proteoforms. Moreover,
information such as the temporal relationships between the pathways (or even of specific
modifications along each pathway) can in theory be readily obtained.
Another application of top-down MS that we envision is for time-resolved
hydroxyl-radical based protein footprinting. Techniques such as Fast Photochemical
Oxidation of Proteins (FPOP) rely on rapid labeling (ideally in the µs regime) to footprint
rapid kinetic processes such as protein folding.29–31 Two prominent challenges in these
experiments are 1) controlling the labeling timescales such that only the transient species
of interest is being footprinted, and 2) ensuring the protein is only labeled once to minimize
label-induced structural perturbations (“single-shot” labeling). While much work has been
invested at addressing these challenges (e.g. radical scavengers, rapid-mixing, single-pulse
lasers), their success has been controversial.32 Top-down MS has the capacity to resolve
proteoforms with different extents of oxidative labeling by their different masses. Using
top-down MS, single-shot conditions could in theory be guaranteed, irrespective of labeling
kinetics, by selecting only the singly-labeled proteoforms for analysis. The top-down MS
work described in this dissertation set the stage for such proteoform-resolved oxidation
experiments.
165
6.3. References
(1) Yin, V.; Shaw, G. S.; Konermann, L. J. Am. Chem. Soc. 2017, 139 (44), 15701–
15709.
(2) Yin, V.; Mian, S. H.; Konermann, L. Chem. Sci. 2019, 10 (8), 2349–2359.
(3) Birk, A. V.; Chao, W. M.; Liu, S. Y.; Soong, Y.; Szeto, H. H. Biochim. Biophys.
Acta-Bioenerg. 2015, 1847 (10), 1075–1084.
(4) Liu, X.; Kim, C. N.; Yang, J.; Jemmerson, R.; Wang, X. Cell 1996, 86 (1), 147–
157.
(5) Goshorn, S. C.; Retzel, E.; Jemmerson, R. J. Biol. Chem. 1991, 266 (4), 2134–2142.
(6) Godoy, L. C.; Muñoz-Pinedo, C.; Castro, L.; Cardaci, S.; Schonhoff, C. M.; King,
M.; Tórtora, V.; Marín, M.; Miao, Q.; Jiang, J. F.; Kapralov, A.; Jemmerson, R.;
Silkstone, G. G.; Patel, J. N.; Evans, J. E.; Wilson, M. T.; Green, D. R.; Kagan, V.
E.; Radi, R.; Mannick, J. B. Proc. Natl. Acad. Sci. 2009, 106 (8), 2653–2658.
(7) Ott, M.; Robertson, J. D.; Gogvadze, V.; Zhivotovsky, B.; Orrenius, S. Proc. Natl.
Acad. Sci. 2002, 99 (3), 1259–1263.
(8) Kagan, V. E.; Tyurin, V. A.; Jiang, J.; Tyurina, Y. Y.; Ritov, V. B.; Amoscato, A.
A.; Osipov, A. N.; Belikova, N. A.; Kapralov, A. A.; Kini, V.; Vlasova, I. I.; Zhao,
Q.; Zou, M.; Di, P.; Svistunenko, D. A.; Kurnikov, I. V.; Borisenko, G. G. Nat.
Chem. Biol. 2005, 1 (4), 223–232.
(9) Kagan, V. E.; Bayır, H. A.; Belikova, N. A.; Kapralov, O.; Tyurina, Y. Y.; Tyurin,
V. A.; Jiang, J.; Stoyanovsky, D. A.; Wipf, P.; Kochanek, P. M.; Greenberger, J. S.;
Pitt, B.; Shvedova, A. A.; Borisenko, G. Free Radic. Biol. Med. 2009, 46 (11),
1439–1453.
(10) Santucci, R.; Sinibaldi, F.; Cozza, P.; Polticelli, F.; Fiorucci, L. Int. J. Biol.
Macromol. 2019, 136, 1237–1246.
(11) Díaz-Quintana, A.; Pérez-Mejías, G.; Guerra-Castellano, A.; De la Rosa, M. A.;
Díaz-Moreno, I. Oxid. Med. Cell. Longev. 2020, 2020, 6813405.
(12) Alvarez-Paggi, D.; Hannibal, L.; Castro, M. A.; Oviedo-Rouco, S.; Demicheli, V.;
Tórtora, V.; Tomasina, F.; Radi, R.; Murgida, D. H. Chem. Rev. 2017, 117 (21),
13382–13460.
(13) Hanske, J.; Toffey, J. R.; Morenz, A. M.; Bonilla, A. J.; Schiavoni, K. H.; Pletneva,
E. V. Proc. Natl. Acad. Sci. 2012, 109 (1), 125–130.
(14) Oellerich, S.; Lecomte, S.; Paternostre, M.; Heimburg, T.; Hildebrandt, P. J. Phys.
Chem. B 2004, 108 (12), 3871–3878.

166
(15) Sinibaldi, F.; Howes, B. D.; Piro, M. C.; Polticelli, F.; Bombelli, C.; Ferri, T.;
Coletta, M.; Smulevich, G.; Santucci, R. JBIC J. Biol. Inorg. Chem. 2010, 15 (5),
689–700.
(16) Milazzo, L.; Tognaccini, L.; Howes, B. D.; Sinibaldi, F.; Piro, M. C.; Fittipaldi, M.;
Baratto, M. C.; Pogni, R.; Santucci, R.; Smulevich, G. Biochemistry 2017, 56 (13),
1887–1898.
(17) Simon, M.; Metzinger-Le Meuth, V.; Chevance, S.; Delalande, O.; Bondon, A. J.
Biol. Inorg. Chem. 2013, 18 (1), 27–38.
(18) O’Brien, E. S.; Nucci, N. V.; Fuglestad, B.; Tommos, C.; Wand, A. J. J. Biol. Chem.
2015, 290 (52), 30879–30887.
(19) Konermann, L.; Pan, J.; Liu, Y.-H. Chem. Soc. Rev. 2011, 40 (3), 1224–1234.
(20) Barayeu, U.; Lange, M.; Méndez, L.; Arnhold, J.; Shadyro, O. I.; Fedorova, M.;
Flemmig, J. J. Biol. Chem. 2019, 294 (6), 1816–1830.
(21) Johnson, D. T.; Di Stefano, L. H.; Jones, L. M. J. Biol. Chem. 2019, 294 (32),
11969–11979.
(22) Xu, G.; Chance, M. R. Chem. Rev. 2007, 107 (8), 3514–3543.
(23) Møller, I. M.; Rogowska-Wrzesinska, A.; Rao, R. S. P. J. Proteomics 2011, 74 (11),
2228–2242.
(24) Winkler, J. R.; Gray, H. B. Q. Rev. Biophys. 2015, 48 (04), 411–420.
(25) Gray, H. B.; Winkler, J. R. Proc. Natl. Acad. Sci. 2015, 112 (35), 10920–10925.
(26) Weisz, D. A.; Gross, M. L.; Pakrasi, H. B. Sci. Adv. 2017, 3 (11), eaao3013.
(27) Kathiresan, M.; English, A. M. Chem. Sci. 2017, 8 (2), 1152–1162.
(28) Kathiresan, M.; English, A. M. J. Am. Chem. Soc. 2018, 140 (38), 12033–12039.
(29) Hambly, D. M.; Gross, M. L. J. Am. Soc. Mass Spectrom. 2005, 16 (12), 2057–
2063.
(30) Hambly, D.; Gross, M. Int. J. Mass Spectrom. 2007, 259 (1–3), 124–129.
(31) Vahidi, S.; Stocks, B. B.; Liaghati-Mobarhan, Y.; Konermann, L. Anal. Chem. 2013,
85 (18), 8618–8625.
(32) Vahidi, S.; Konermann, L. J. Am. Soc. Mass Spectrom. 2016, 27 (7), 1156–1164.

167
Appendix I – Permissions
168
Lysine carbonylation is a previously unrecognized contributor to peroxidase activation of cytochrome c by chloramine-T
V. Yin, S. H. Mian and L. Konermann, Chem. Sci., 2019, 10, 2349
DOI: 10.1039/C8SC03624A
This article is licensed under a Creative Commons Attribution-NonCommercial 3.0
Unported Licence. Material from this article can be used in other publications
provided that the correct acknowledgement is given with the reproduced material and
it is not used for commercial purposes.
Reproduced material should be attributed as follows:
• For reproduction of material from NJC:
[Original citation] - Published by The Royal Society of Chemistry (RSC) on
behalf of the Centre National de la Recherche Scientifique (CNRS) and the RSC.
• For reproduction of material from PCCP:
[Original citation] - Published by the PCCP Owner Societies.
• For reproduction of material from PPS:
[Original citation] - Published by The Royal Society of Chemistry (RSC) on
behalf of the European Society for Photobiology, the European Photochemistry
Association, and RSC.
• For reproduction of material from all other RSC journals:
[Original citation] - Published by The Royal Society of Chemistry.
Information about reproducing material from RSC articles with different licences is
available on our Permission Requests page.

169

170
Curriculum Vitae
1. NAME: Victor Yin 2. EDUCATION:
Degree University Department Year Ph. D. University of Western Ontario Chemistry Current B. Sc. Hon. University of British Columbia Chemistry 2015
3. TA and OTHER RESEARCH or TEACHING RELATED EMPLOYMENT HISTORY:
Date Position Course Supervisor Department and Institution 2017 TA CHEM3370B K. Baines Chemistry, UWO 2017 TA CHEM1302A J. Mathers Chemistry, UWO 2016 TA CHEM3370B K. Baines Chemistry, UWO 2016 TA CHEM1302A J. Mathers Chemistry, UWO 2015 TA CHEM3391B M. Suchy Chemistry, UWO 2015 TA CHEM1302A J. Mathers Chemistry, UWO
4. HONORS AND AWARDS:
CSC 2004 UWO Student Travel Award, 2018 - $900 CSMS Student Travel Award to ASMS, 2018 - $2000 Lefevre Medal and Prize in Honours Chemistry (UBC), 2015 - $500 Undergraduate Summer Research Award (UBC), 2014 - $5740
5. SCHOLARSHIPS RECEIVED:
Scholarship type and Organization Years awarded Amount awarded Alexander Graham Bell CGS-D (NSERC) 2 $35000/yr Queen Elizabeth II GSST 2019 1 $15000 (Declined) Queen Elizabeth II GSST 2018 1 $15000 Ontario Graduate Scholarship 2016,2017 2 $15000/yr
6. COURSES TAKEN: Date Course Number and Title Instructor Grade
2018 CHEM9494B (Biophysical Chemistry) L. Konermann 99 2016 CHEM9544A (Mass Spectrometry) L. Konermann 97 2015 CHEM9522A (Analytical Separations) K. Yeung 90
171
7. PUBLICATIONS: Sever, A.; Yin, V.; Konermann, L. Interrogating the Quaternary Structure of Noncanonical Hemoglobin Complexes by Electrospray Mass Spectrometry and Collision-Induced Dissociation. Submitted. Yin, V.; Holzscherer, D.; Konermann, L. Delineating Heme-Mediated versus Direct Protein Oxidation in Peroxidase-Activated Cytochrome c by Top-Down Mass Spectrometry. Submitted. Yin, V.; Konermann, L. (2020) Probing the Effects of Heterogeneous Oxidative Modifications on the Stability of Cytochrome c in Solution and in the Gas Phase. J. Am. Soc. Mass Spectrom., In Press. doi: 10.1021/jasms.0c00089. Yin, V.; Mian, S. H.; Konermann, L., Lysine Carbonylation is a Previously Unrecognized Contributor to Peroxidase Activation of Cytochrome c by Chloramine-T. Chem. Sci., 2019, 10, 2349-2359. Yin, V.; Shaw, G. S.; Konermann, L., Cytochrome c as a Peroxidase: Activation of the Pre-Catalytic Native State by H2O2-Induced Covalent Modifications. J. Am. Chem. Soc., 2017, 139, 15701-15709. McGregor, N.; Yin, V.; Tung, C.-C.; Van Petegem, F.; Brumer, H., Crystallographic insight into the evolutionary origins of xyloglucan endo-transglycosylases and endo-hydrolases. Plant J., 2017, 89, 651-670. Featured Article. McGregor, N.; Morar, M.; Fenger, T. H.; Stogios, P.; Lenfant, N.; Yin, V.; Xu, X.; Evdokimova, E.; Cui, H.; Henrissat, B.; Savchenko, A.; Brumer, H., Structure-function analysis of a mixed-linkage Beta-glucanase/xyloglucanase from key ruminal Bacteroidetes Prevotella bryantii B14. J. Biol. Chem., 2015, 291, 1175-1197.
8. SELECTED PRESENTATIONS: Yin, V*, Holzscherer, D., and Konermann, L. (2019) Delineating Heme-Mediated vs. Direct Protein Oxidation Pathways: Cytochrome c as a Model System. 32nd Annual Lake Louise Tandem Mass Spectrometry Workshop. International Conference, Poster Presentation. Yin, V* and Konermann, L. (2019) Cytochrome c / Cardiolipin Interactions in Apoptosis: The Roles of Protein Auto-Oxidation and In Situ Covalent Modifications. 67th Annual conference of the American Society of Mass Spectrometry. International Conference, Poster Presentation. Yin, V* and Konermann, L. (2018) Top-down CID-IM-MS Reveals Lysine Carbonylation as a Hidden Activator in the Apoptotic Peroxidase Activity of Met-Oxidized Cytochrome c. 31st Annual Lake Louise Tandem Mass Spectrometry Workshop. International Conference, Poster Presentation. Yin, V* and Konermann, L. (2017) Relationship Between Oxidative Modifications and Peroxidase Activity of Cytochrome c: A Combined Bottom-up and Top-down Investigation. 30th Annual Lake Louise Tandem Mass Spectrometry Workshop. International Conference, Poster Presentation.
172
Yin, V*, Shaw, G., Konermann, L. (2017) Cytochrome c As A Peroxidase: Covalent Labeling and Oxidation Site Mapping Uncovers the Mechanism of Catalytic Activation by H2O2. 65th Annual Conference of the American Society of Mass Spectrometry. International Conference, Poster Presentation. Yin, V* and Konermann, L. (2016) Investigating the Effects of In situ Oxidation on the Structure and Non-Canonical Functions of Cytochrome c using Electrospray Mass Spectrometry. 29th Annual Lake Louise Tandem Mass Spectrometry Workshop. International Conference, Poster Presentation. Yin, V* and Konermann, L. (2016) Exploring the Peroxidase Activation and Deactivation of Cytochrome c by Heme-catalyzed Oxidative Labeling and ESI-MS. 64th Annual Conference of the American Society of Mass Spectrometry. International Conference, Poster Presentation. Yin, V*., McGregor, N., and Brumer, H. (2015) Inhibition of a plant glycoside hydrolase using xyloglucan-derived affinity labels. 29th Annual Western Canadian Undergraduate Chemistry Conference. National Conference, Oral Presentation (Undergraduate Work)