Embed Size (px)
Citation preview

EFFECTS OF OPERATING PARAMETERS ON LATERAL TAPE MOTION FOR MAGNETIC TAPE IN AN ADVANCED LINEAR TAPE
DRIVE
A Thesis
Presented in Partial Fulfillment of the Requirements for
the Degree Master of Science in the
Graduate School of The Ohio State University
By
Andrew Eric Wright, B.S.
*****
The Ohio State University 2006
Master’s Examination Committee: Approved by Professor Bharat Bhushan, Adviser Professor Rajendra Singh _______________________________ Advisor Graduate Program in Mechanical Engineering

ii
ABSTRACT
The drive for increased storage capacity in today’s magnetic tape cartridges has
created a continuing need to improve the understanding of the tribological performance
of magnetic tape. One important area of ongoing tribological research is lateral tape
motion (LTM). Excessive LTM can cause problems with track misregistration where
written data cannot be read back accurately. Tape and drive manufacturers are
increasingly challenging the tolerances of LTM in their quest for increased data storage.
While the importance of studying LTM is known, many of the sources and reasons for
increases in LTM are unknown. This provides the motivation for the work presented.
Several studies are completed to identify sources and contributions to increases in
LTM. The first such study is a baseline look at different types of tape under nominal
conditions. Six different types of tape are used throughout the studies. These include
commercially available metal particulate (MP) tape, an experimental thin MP tape, and
four advanced metal evaporated (AME) tapes. A multitude of different operating
parameters were identified for analysis in hopes of learning more about their role in LTM
generation. Some of these parameters include operating tension and speed, as well as
head and bearing setup. Additionally, tape quality metrics such as edge quality and tapes
from staggered packs were studied to determine their contributions to LTM.
The results show that all of the tapes with the exception of a negatively cupped
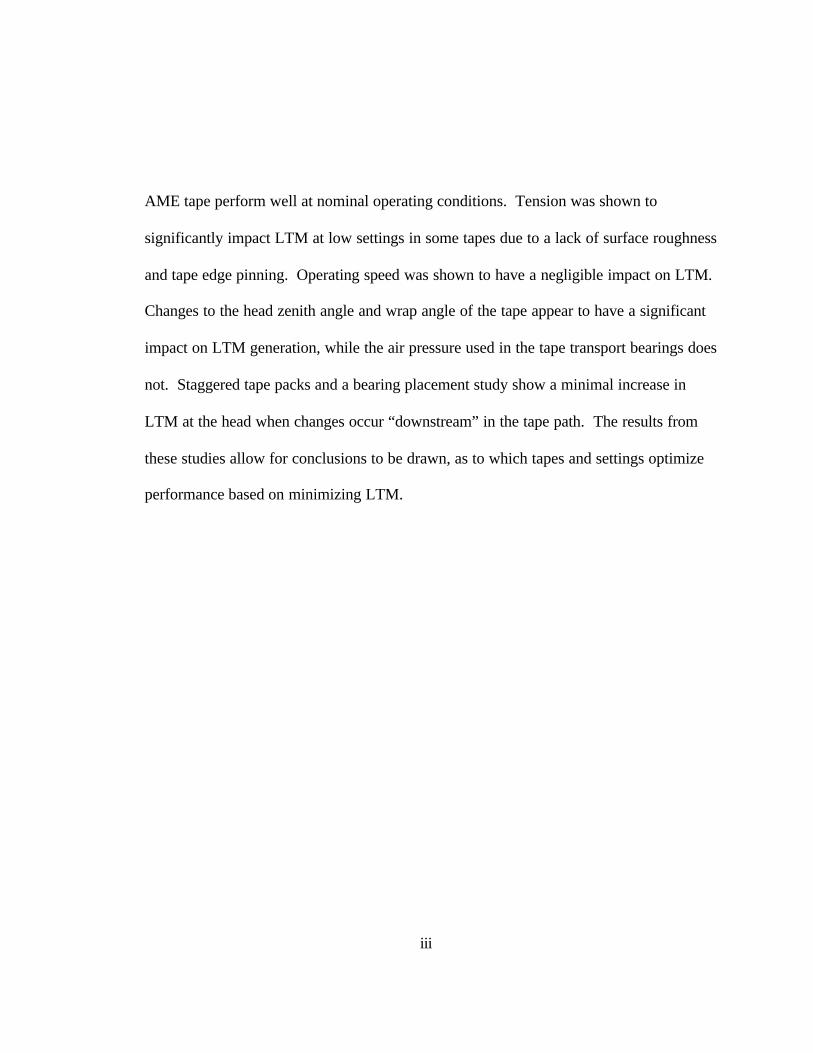
iii
AME tape perform well at nominal operating conditions. Tension was shown to
significantly impact LTM at low settings in some tapes due to a lack of surface roughness
and tape edge pinning. Operating speed was shown to have a negligible impact on LTM.
Changes to the head zenith angle and wrap angle of the tape appear to have a significant
impact on LTM generation, while the air pressure used in the tape transport bearings does
not. Staggered tape packs and a bearing placement study show a minimal increase in
LTM at the head when changes occur “downstream” in the tape path. The results from
these studies allow for conclusions to be drawn, as to which tapes and settings optimize
performance based on minimizing LTM.

iv
Dedicated to my family and friends

v
ACKNOWLEDGMENTS
I wish to thank my advisor, Dr. Bharat Bhushan, for his assistance in the
completion of the research presented in this thesis. His guidance has improved my
capabilities as a researcher and allowed for successful completion of this study.
Financial support for this study was provided in part by the membership of the
Nanotribology Laboratory for Information Storage and MEMS/NEMS and Imation Corp.-
Advanced Technology Program (Program Manager, Ted Schwarz, Peregrine Recording
Technology, St. Paul, MN), National Institute of Science and Technology, as part of
Cooperative Agreement 70NANB2H3040. Steve Gavit (deceased) and Chris Goldsmith of
Segway Systems, LLC (Littleton, CO) provided the tape drive with single-flanged guides and
porous air bearings. I would like to thank Richard E. Jewett and Todd L. Ethen, both of
Imation Corp. (Oakdale, MN), for providing Seagate LTO heads, Dr. Hideki Yoshida of
Matsushita Electric Industrial (MEI) Co. (Kadoma, Japan), and Dr. S. Onodera of Sony
Sendai Research Center (Japan) for providing AME tapes. Special thanks to Richard E.
Jewett, Todd L. Ethen, and Todd W. Abrahamson of Imation Corp. for technical support with
the tape drive and for helpful discussion throughout the study.
I would also like to thank my colleagues at NLIM. Tony Alfano provided valuable
insights regarding project results, as well as significant contributions in helping me get up
and running with the equipment. Thomas Hayes helped with many of the electromechanical

vi
complications that arose during the study. Several other members of NLIM assisted me
throughout my time in the lab and I am grateful for their assistance.
Finally, I would like to thank my family and friends for always being there and their
patience, as I completed my research.

vii
VITA
September 19, 1979 ……………………………..... Born – Akron, Ohio, USA 2002……………………………………………….. B.S. Manufacturing Engineering,
Miami University
2002-2004………………………………………… Manufacturing/Project Engineer, Transwheel Corporation, Huntington, Indiana 2004-present………………………………………. Graduate Research Associate, The Ohio State University
PUBLICATIONS Research Publication 1. Wright, A.E. and Bhushan, B. (2006), “Effects of different magnetic tapes and
operating parameters on lateral tape motion in a linear tape drive,” Tribol. Trans. 49.
FIELDS OF STUDY
Major field: Mechanical Engineering

viii
TABLE OF CONTENTS
Page
Abstract…………………………………………………………………….. ii
Dedication………………………………………………………………….. iv
Acknowledgments…………………………………………………………..v
Vita………………………………………………………………………….vii
List of Tables ……………………………………………………………… xi
List of Figures……………………………………………………………… xii
Abbreviations………………………………………………………………. xv
Chapters:
1. Introduction………………………………………………………… 1
2. Effects of different magnetic tapes and operating parameters on
lateral tape motion in a linear tape drive………………………….. 3
2.1. Motivation………………………………………………….. 3
2.2. Experimental Details………………………………………..6
2.2.1. Tape transport and test procedure………………….. 6
2.2.2. Tape and head samples………………………………8
2.2.3. Measurement techniques……………………………10
2.2.4. Individual test plans………………………………... 13

ix
2.2.4.1. Baseline test comparison of tapes………... 13
2.2.4.2. Quality of slit edge study………………… 15
2.2.4.3. Staggered pack study…………………...... 15
2.2.4.4. Tension and speed studies………………...18
2.2.4.5 Head zenith angle and air pressure study…19
2.2.4.6 Bearing placement study………………….. 20
2.2.4.7 Wrap angle study…………………………. 22
2.3. Results and discussion……………………………............... 22
2.3.1. Baseline test comparison of tapes………………….. 23
2.3.2. Quality of slit edge study…………………………... 28
2.3.3. Staggered pack study………………………………. 30
2.3.4. Tension and speed studies…………………………..32
2.3.5. Head zenith angle and air pressure study…………...36
2.3.6. Bearing placement study…………………………… 39
2.3.7. Wrap angle study…………………………………... 42
2.4. Conclusions………………………………………………… 44
3. Effects of varying operating tension and speed on lateral tape
motion in MP and AME tapes using the magnetic signal and
optical probe methods………………………………………………47
3.1. Motivation………………………………………………….. 47

x
3.2. Experimental details………………………………………...50
3.2.1. Tape transport and test procedure………………….. 50
3.2.2. Tape and head samples…………………………….. 52
3.2.3. Measurement techniques……………………………56
3.2.4. Test plan……………………………………………. 65
3.3. Results and discussion……………………………………... 66
3.3.1. Tension and speed results………………………….. 66
3.3.1.1. Coefficient of friction…………………... 67
3.3.1.2. Peak-to-peak LTM……………………… 69
3.3.1.3. Non-repeatable LTM…………………… 74
3.3.2 Effect of tape position on LTM……………………. 79
3.4. Conclusions………………………………………………… 82
4. Summary…………………………………………………………… 85
References………………………………………………………………. 88

xi
LIST OF TABLES
Table Page
1 Tension and speed test matrix for operating parameter
Study……………………………………………….............. 19
2 Calibration factors used in magnetic method of
Measuring LTM……………………………………………. 64
3 Tension and speed test matrix for second study…………… 66
4 Summary of peak-to-peak LTM results for tension
and speed study……………………………………….. 80

xii
LIST OF FIGURES
Figure Page
2.1 (a) Schematic diagram of the Segway Systems/Mountain
Engineering MTS linear tape transport with porous air bearings
and single-flanged tapered guides (b) Cross-section schematic
showing the structure of MP, Thin MP, and generic AME tapes...... 7
2.2 (a) Sample optical micrographs of tape samples (b) Optical
micrographs of poor quality MP tape (c) Measured cupping
profiles of the five tape samples…………………………………… 14
2.3 Images of the three staggered pack samples with individual
bands of popped strands identified………………………………… 16
2.4 (a) Bearing and gap numbering convention for the MTS tape
transport (b) Schematic of the different wrap angles studies……….21
2.5 (a) Coefficient of friction and LTMP results for the five tapes at
nominal conditions (b) Relative edge contour length results for
the five samples……………………………………………………..24
(c) PSD plots and coherency estimates of the five tape samples…... 25
2.6 (a) Coefficient of friction and LTMP results for the tape edge
quality study (b) Relative edge contour length results contrasting

xiii
the good quality sample to the poor quality sample……………….. 29
2.7 LTMP results for the three staggered pack samples……………….. 31
2.8 Summary of the coefficient of friction and LTMP results for the
tension and speed studies on all five tape samples………………… 34
2.9 (a) Results for head zenith angle and PABS air pressure study
(b) Schematic displaying the head zenith settings and reasons for
LTMP variations…………………………………………………… 38
2.10 (a) Results for the bearing placement study measured at the head
(b) LTMP results from the bearing placement companion study
measured in the gaps and at the reels………………………………. 41
2.11 LTMP results at the different wrap angles studied………………… 43
3.1 (a) Schematic diagram of the Segway Systems/Mountain
Engineering MTS linear tape transport with porous air bearings
and single-flanged tapered guides (b) Cross-section schematic
showing the structure of MP, Thin MP, and generic AME tapes…. 51
3.2 Schematic drawing of one half of the Seagate LTO head
(symmetric about glue line) with detailed schematic view and
optical micrograph of the thin-film region………………………….55
3.3 Measured cupping profiles of the six tape samples………………... 57
3.4 Schematic illustrating the different components of LTM and
xiv
their contribution to total LTM peak-to-peak amplitude…………... 59
3.5 (a) Schematic indicating the LTMM read element placement
(b) Example calibration curve for the Seagate MR reader………… 62
3.6 Summary of the coefficient of friction, peak-to-peak LTMP,
peak-to-peak LTMM, LTMP quality factor, and LTMM quality
factor for the tension and speed combinations used on all
six tape samples……………………………………………………. 68
3.7 Schematic illustrating the effects of tape cupping and edge
pinning……………………………………………………………... 72
3.8 Example of a time window plot with illustration of LTM quality
factor measurement………………………………………………... 75
3.9 Example non-repeatable LTM plots with three scenarios
Depicting the variability of tape motion from cycle to cycle……… 78
3.10 (a) Summary of peak-to-peak LTMM measurements on top
and bottom edges (b) Summary of the LTMM quality factor
measurements on the top and bottom edges……………………….. 80

xv
ABBREVIATIONS
List of most commonly used abbreviations in this thesis.
LTM Lateral tape motion
LTMP Lateral tape motion physical
LTMM Lateral tape motion magnetic
PSD Power spectrum density
MP Magnetic-particle
AME Advanced metal evaporated
DLC Diamond-like carbon
HCA Head cleaning agent
PABs Porous air bearings

- 1 -
CHAPTER 1
INTRODUCTION
Magnetic storage is needed for a wide variety of applications including data-
processing, audio, and video. The devices used to create this magnetic storage take a
wide variety of forms that vary from floppy disks, rigid disk drives, cds, and magnetic
tape. In all of these devices magnetic recording and readback occurs through the relative
motion between a read-write magnetic head and a magnetic medium. The reading and
writing of data utilizes binary coding and the detection of flux direction that represents
data in bits of zeros and ones.
The research presented in this thesis focuses on the storage medium of magnetic
tape. Magnetic tape has played a critical role in the data storage industry and is
particularly valuable for backing up the digital information of companies. Tape provides
a high recording density at cost effective prices, while maintaining a reliable
performance. However, in order for magnetic tape to remain a viable solution for
meeting industry’s growing need for data storage capacity, improvements must be made
in recording density and data access rates. These improvements will require the use of
thinner tapes, narrower data tracks, and faster speeds in tape drives. The implementation
of these improvements will present several engineering challenges to tape and tape drive
manufacturers.

- 2 -
One of these engineering challenges, which presents the motivation for the work
contained in this thesis, is lateral tape motion (LTM). LTM is the up and down motion of
the magnetic tape, as it moves linearly through the tape drive. Significant LTM can
cause problems with accurately reading back written data tracks, as the excessive motion
may move the tape far enough so the written signal cannot be read. This problem is only
magnified with the necessary improvements, such as narrower data tracks, needed to
increase storage capacity.
Chapter two of this thesis looks at the effects certain operating parameters and
types of tape have on LTM generation. Some of the operating parameters examined
include operating tension and speed, head zenith angle, wrap angle, the position of guides
and tape quality. The study documented in chapter three utilizes a new LTM measuring
technique and focuses in on the impact tension and speed have on LTM in different types
of tapes. Chapter four provides a summary of the results.
- 3 -
CHAPTER 2
EFFECTS OF DIFFERENT MAGNETIC TAPES AND OPERATING PARAMETERS ON LATERAL TAPE MOTION IN A LINEAR TAPE DRIVE
2.1. Motivation
The most advanced magnetic tapes currently available in the linear tape-open
(LTO) format are generation three tapes, which offer data storage capacities of 400 GB
and 800 GB compressed (see www.imation.com and www.quantum.com). To achieve
multi- terabyte storage capacity without increasing cartridge size, future-generation linear
tape systems will require the use of thinner magnetic tapes with smaller track width and
pitch (distance between adjacent tracks) and higher tape speed to achieve acceptable data
rates (Bhushan, 1996, 2000). Also, new magnetic tapes are being developed for high-
density magnetic recording applications (Mee and Daniel., 1996, Luitjens et al., 1996).
The future tapes must be smoother to provide lower head-tape spacing required to
maintain good signal-to-noise ratio and resolution at higher track densities (Bhushan,
1996). For high recording density close proximity between the head and the tape is
required (Luitjens et al., 1996) These requirements present engineering challenges, as
thinner, smoother tapes will have reduced dimensional stability and experience increased
friction in linear tape drives (Bhushan, 2000). Lower tape tension is desirable to
counteract these effects by reducing frictional forces and stresses within the tape.

- 4 -
However, lower tape tension and higher tape speed can lead to increased hydrodynamic
effects as the tape passes over bearings and the head (Elrod and Eshel, 1965), potentially
creating a less stable tape path and increased lateral (cross-track) tape motion. Excessive
lateral tape motion (LTM) can cause the data tracks on the tape to move relative to the
read/write modules of the head, leading to so-called track misregistration (TMR) error in
writing and reading data tracks. Modern commercial tape drives incorporate servo track
following systems that move the head to compensate for LTM, but these systems have
limited bandwidth and TMR occurs when LTM events are of sufficient frequency and
magnitude. Smaller track width reduces tolerance for LTM by decreasing the magnitude
of LTM necessary to cause TMR.
In a previous study Hansen and Bhushan (2004) varied operating tension and
speed using commercial metal particulate (MP) tape on a tape transport using stationary
guides. The results of their study showed that the coefficient of friction for MP tape was
affected by tension at speed due to hydrodynamic effects at lower tensions and higher
speeds. The study was unable to draw any strong conclusions on the effects of tension
and speed on LTM. In light of this and the introduction of the porous air bearings on the
MTS tape deck, a second study on the effects of tension and speed was initiated.
Additionally, with a strong focus on future generations of tape and alternate media the
tension and speed study has been expanded to include not only MP tape, but also an
experimental Thin MP tape and three advanced metal evaporated (AME) tapes.
- 5 -
In addition to the concerns that future tape requirements present in LTM
generation, the origins of LTM within the operation of the tape drive system are not well
known. Furthermore, the effects of tape quality can potentially be a concern when
discussing LTM generation. Goldade and Bhushan (2003) suggested that tape guiding,
which helps to govern LTM can be dependent on many factors including quality of the
virgin tape edge and type of guiding (stationary/rotary, active/passive) for MP tape.
Additionally, using an Advanced Research Corporation model 20 transport Hansen and
Bhusan (2004) found that guide type and placement relative to the head had a significant
impact on LTM. None of these studies have been completed on an MTS tape drive with
porous air bearings. For this reason it is important to study the contributions operating
parameters related to head and bearing placement have on LTM in the MTS tape drive.
Also, the effects of tape and tape pack quality metrics like edge quality and staggered
pack levels on LTM will be studied for the first time on the MTS tape drive.
The current study will first investigate LTM and coefficient of friction in five
different types of tape. These tapes represent both current technology and potential tapes
for future commercial use. After completing a baseline study in regards to the five tapes,
the study will investigate effects caused by varying tension and speed in the five tape
samples. Additionally, this study will investigate the quality of slit tape edge in terms of
contribution to LTM. Tests will look at staggered tape packs, which contain a series of
raised strands to determine if the introduction of raised strands constitutes a serious LTM

- 6 -
event. Finally, this study will look at operating parameters on the tape deck in order to
further understand any contribution towards a change in LTM creation. The operating
parameters under investigation include head zenith angle, air pressure used in the porous
air bearings (PABs), bearing placement, and wrap angle.
2.2. Experimental details
2.2.1. Tape transport and test procedure
Drive tests were conducted in a class 10,000 laboratory environment (22 ± 1 °C;
relative humidity 45 ± 5 percent) using the Segway Systems / Mountain Engineering II
MTS linear tape transport with horizontal tape path, shown schematically in Fig. 2.1 (a).
Tape bearings are single-flanged and tapered at an angle of 0.6 degrees to force the lower
edge of the tape to ride along the flange. The head mount is designed such that the head
zenith angle is the same as the bearing taper angle. Penetration of the head into the tape
path was set the same for each test (aside from studies involving wrap angle). Each
bearing consists of a housing, porous ceramic bearing material, lower flange, and
outriggers. The housing and the bearing member form a plenum connected to an air pump
such that airflow through the porous material creates an air cushion that supports the tape.
The outriggers at each side of the guide provide cleaning action to the tape (Gavit, 1998).
Tape tension is monitored on both sides of the head by measuring air pressure in
the gap between the tape and the bearing member by means of pressure transducers that
are mounted in the two guides bracketing the head. The drive controller monitors the

- 7 -
Fig 2.1 (a) Schematic diagram of the Segway Systems/Mountain Engineering MTS linear
tape transport with porous air bearings and single-flanged tapered guides (b) Cross-
section schematic showing the structure of MP, Thin MP, and generic AME tapes

- 8 -
pressure transducer signals and angular velocities of the tape reels and maintains constant
tension and linear tape speed during a pass. The controller is connected to a PC that
allows the operator to program certain drive parameters. Up to 600 m of 9 µm-thick tape
can be loaded onto the tape reel, and the drive can be programmed to run for a specific
number of cycles, with practically any pass length, at tape speeds between 2 and 8 m/s
and tensions between 0.5 and 1.2 N. At the beginning of each test a new piece of tape
was loaded into the transport and a clean head was mounted. Pass length was set at 30 m
with one forward and one reverse pass equal to one 60-m cycle.
2.2.2. Tape and head samples
Figure 2.1 (b) is a schematic of the cross-sections of MP, Thin MP, and a generic AME
tape. The MP tape used in this study is commercial, 12.7 mm-wide Ultrium 1 tape. It is a
dual- layer metal particle tape with magnetic layer and backcoat thicknesses of 0.25 µm
and 0.5 µm, respectively, a substrate thickness of about 6.5 µm, and an overall thickness
of 9 µm. The magnetic layer contains needle-shaped, passivated iron magnetic particles
and head cleaning agents (HCAs) dispersed in a polymer formulation of binder and fatty
acid ester lubricants. The magnetic particles are typically 0.1-0.2 µm or smaller in length
and have an aspect ratio of five to ten. The HCAs are generally 0.2-0.3 µm-diameter
Al2O3 particles and conductive carbon particles, added to improve friction wear
properties and electrical conductivity. The Thin MP tape used in this study is an
experimental tape with properties similar to the commercial MP tape described above.
- 9 -
The main difference between the two tapes is that the substrate thickness has been
decreased to approximately 4.5 µm in the Thin MP tape, reducing the total thickness to 7
µm.
Three AME tapes were used in this study. AME tape is 12.7 mm wide. The
overall tape thickness of AME tape is about 8.6 µm. All three of the AME samples are
experimental formulations with different cupping (natural curl of the tape edges away or
towards the head) orientations. One of the AME samples is negatively cupped (edges
curl away from the head) and henceforth, will be referred to as AME-NC tape. The
remaining two AME samples are positively cupped (edges curl towards the head), but
one sample is much more aggressively cupped. The shallower of the two positively
cupped samples will be referred to as AME-PC tape and the more aggressively cupped
tape will be known as AME-PC+ tape. The frontcoat of all three AME tapes consists of
the dual magnetic layer (180 nm thick) of evaporated Co-O, over which is a 12 nm thick
DLC coating, over which is a 5 nm-thick liquid lubricant layer. DLC is a hard coating
used to protect the magnetic coating aga inst corrosion and wear. The lubricant enhances
the durability of the DLC and magnetic coatings by reducing friction at the head-tape
interface. The lubricant commonly used consists of an overcoat of fatty acid esters on a
perfluoropolyether (PFPE) coating.
A commercial Seagate LTO (Generation 1) head is used in this study. It is an
inductive write/magnetoresistive (MR) read head with Al2O3-TiC substrate, 80/20 Ni-Fe

- 10 -
MR stripe, CZT shields and poles, and Al2O3 overcoat, undercoat, and gap material. The
MR stripe, shields and poles, and overcoat, undercoat, and gap material are sputter
deposited on the substrate.
2.2.3. Measurement techniques
During the study, the coefficient of friction is calculated from the drive tension
signals using the belt equation and captured by the data acquisition software (NI-6023E,
National Instruments, Austin, TX) with a sampling rate of 150 Hz. The data acquisition
was controlled by Snap-Master V3.5 data acquisition software (HEM Data Corp.,
Southfield, MI).
LTM was measured using the MTI 2000 Fotonic sensor, equipped with Edge
Probe (MTI Instruments Inc., Latham, NY, probe 2062E with sensitivity of 17.853 µm/V
and a noise level of 20 mVp-p). The edge probe is positioned over the tape edge. Light
from the light source is reflected by a 90-degree prism to another 90-degree prism and
finally reaches a photodiode (light receiver). The Fotonic sensor converts the photodiode
signal, which is proportional to the light intensity, into the output units (volts or microns).
If the light path is not obstructed by the tape edge the output of the fotonic sensor is 100
percent. The output decreases as the tape moves upward into the gap between the prisms
and vanishes to zero when no light reaches the photodiode (Goldade and Bhushan, 2003).
The reported LTM values are in the form of average LTM peak-to-peak amplitude (LTM
P-P amplitude). This is found by parsing the LTM data into one-second increments and

- 11 -
averaging the difference between the highest and lowest tape position in each one-second
block over the forward or reverse pass. Additionally, LTM data can be presented in the
form of a power spectrum density (PSD). PSD is calculated using Matlab version 6.5
(The Mathworks Inc., Natick, MA) using a program described by Hansen and Bhushan
(2004).
Optical measurements of LTM, such as with the edge probe used in this study,
may convolve tape motion measurement with the measurement of the tape edge profile.
As was discussed by Hansen and Bhushan (2004), two probes used simultaneously to
measure LTM on the top and bottom edges are needed to determine the amount of
measured LTM that corresponds to actual tape motion. For this reason a majority of the
tests completed in this study employed a second MTI Fotonic sensor with Edge Probe
(sensitivity 14.723 µm/V and noise level of 20 m Vp-p). The coherence of the LTM
signals from both the top and bottom edges was calculated to give an idea of how closely
the two signals are related. The coherence estimate Cxy(f) = 0 if the two signals are
completely incoherent (unrelated) at the frequency f and Cxy(f) = 1 if the two signals are
fully coherent (closely related) (Beauchamp and Yuen, 1979). The assumption is that the
upper and lower tape edge profiles are different, but move together when the tape moves
laterally. Therefore, if the two edge probe signals are coherent at certain frequencies, they
are measuring actual tape motion at those frequencies and not the tape edge profile.
Even with the dual Fotonic probes used in this study the LTM measurements will

- 12 -
involve both true LTM and the physical contour of the tape edge. The contour of the tape
edge is not a straight line, but instead it can be rough and jagged. The Fotonic probes
may convolve the unevenness of the tape edge as tape motion. The convolution of the
tape edge cannot effectively be removed from the measurement of true motion. Thus, the
values obtained with the Fotonic probes provide only an estimate of true LTM. The
reported values of LTM correspond to the physical location of the tape due to both tape
motion and edge contour. In light of this LTM measurements made in this study will
henceforth be termed lateral tape motion physical (LTMP).
In preparation for edge quality measurements, samples were cut into 30 mm strips
and mounted on glass microscope slides with double-sided adhesive tape. Optical images
were obtained with an optical microscope (OPTIPHOT-2, Nikon Corporation, Tokyo,
Japan) in the brightfield mode with a white light source. Gray-scale images (640 × 480
pixels) were captured with a CCD camera at a resolution of 0.175 µm per pixel and saved
on a PC. Relative edge contour length (RECL) is used as the measure of edge quality.
Measurements needed to find the RECL of the samples were performed using the
methodology developed by Topoleski and Bhushan (2000) and Goldade and Bhushan
(2003, 2004).
Tape cupping is the natural tendency of the tape to curl about an axis parallel to
the direction of travel along the tape width (Bhushan, 2000, Scott and Bhushan, 2003).
Positively cupped tapes curl so the edges are towards the head, while negatively cupped

- 13 -
tape edges are curled away from the head. Cupping measurements of the five tape
samples in this study were made using an optical microscope following the technique
developed by Scott and Bhushan (2003).
2.2.4. Individual test plans
2.2.4.1. Baseline test comparison of tapes
The first portion of this study looks into the performance of five different tapes.
As mentioned previously, the five tapes under consideration are a commercially available
MP tape, an experimental Thin MP tape, and three different AME tapes. Figure 2.2 (a)
displays representative optical micrographs and edge profiles of different tape samples.
Specific results will be presented in section 3 of this paper, but one can see visually that
AME, both negatively and positively cupped, tapes have significantly more ragged edges
compared to MP and Thin MP tapes.
The unworn MP tape used in this study has negative cupping equal to about 1 mm
at its greatest. Thin MP and AME-NC tapes displayed a negative cupping slightly greater
than 1 mm at its greatest point. The AME-PC sample used in this study has shallow
positive cupping equal to about 0.1 mm at its greatest. The other positively cupped AME
sample, AME-PC+, has a more aggressive positive cupping equal to about 0.6 mm at its
greatest. A tape cupping plot of the five samples is shown in Fig. 2.2 (c).
The goal for this part of the study is to identify the behaviors of the five tapes in
regards to coefficient of friction and LTMP at a tension of 1 N and speed of 6 m/s. .

- 14 -
Fig. 2.2 (a) Sample optical micrographs of tape samples (b) Optical micrographs of poor
quality MP tape (c) Measured cupping profiles of the five tape samples

- 15 -
Henceforth, the tension and speed combination of 1N and 6 m/s will be referred to as
nominal conditions. In order to characterize the behaviors of the tapes 1000-cycle tests
were run, while monitoring coefficient of friction and LTMP
2.2.4.2. Quality of slit edge study
The purpose of this study is to compare LTMP in two MP tape samples of
differing edge quality. One tape sample was selected that had unworn edges comparable
to the majority of commercial MP tape samples. This tape will be termed good edge
quality sample and a representative example can be seen in the topmost portion of Fig.
2.2 (a). Roughly a dozen MP tape samples were analyzed before a tape sample with a
discernable difference in unworn edge quality was located. This sample appeared to have
significantly more edge damage compared to typical MP tape and could be characterized
by severe cracking and a general raggedness of the tape edge. This sample will be
termed poor edge quality sample. A representative image of this tape is shown in Fig. 2.2
(b). This study used 1000-cycle tests.
2.4.3. Staggered pack study
Staggered tape packs deal with packs that have raised strands creating an uneven
profile on the top surface of the pack. This is different from a tape pack of normal
quality that has a nominally even surface on the top of the pack. Three samples of MP
tape with a varying amount of popped strands were used in completion of this study.
Figure 2.3 shows images of the three samples used in this trial. Each individual band of

- 16 -
Fig. 2.3 Images of the three staggered pack samples with individual bands of popped
strands identified

- 17 -
popped strands is labeled in the images. Also, it should be noted that the pass length for
samples 2 and 3 were extended to incorporate a larger amount of popped strands.
In order to complete this portion of the study the staggered tape pack samples
needed to be characterized. Optical microscopy provided means for measuring the width
of the bands of popped strands for each of the three samples. The width of individual
bands of popped strands was measured by taking photographs of the pack samples after
they were loaded onto the tape deck and completing an analysis using Adobe Photoshop
(Adobe Corp., San Jose, CA). This analysis included relating the measurements taken in
Photoshop to macro-scale measurements of tape pack diameter made with calipers.
Using this relationship, band widths and approximate locations were identified. An
estimated length of each band of raised strands was calculated using equations (1) and
(2). The tape thickness for the samples in this study was 9 µm and the hub radius was
27.9 mm.
(1) No. of wraps = (current tape radius-hub radius)/tape thickness
(2) Tape length (m) = 2 x π x ((hub radius x no. of wraps) + (0.5 x tape thickness x
no. of wraps x (no. of wraps + 1)))
Another aspect of this portion of the study that needs mentioning is that the
typical average LTMP P-P amplitude measurements generally reported for LTMP analysis

- 18 -
are not useful in this case. This is because the typical method of analysis could average
out the potential LTMP peak-peak data caused by different bands of popped strands.
Instead of averaging the one-second blocks of LTMP data over the forward and reverse
pass of each cycle, the average value of each individual one-second block is calculated
over the total number of cycles in the test. With the knowledge of the approximate length
and location of each band of popped strands and that the tests were completed at 6 m/s an
estimate can be completed on when the individual bands of raised strands would pass
through the tape drive. This will allow for a comparison of the LTMP (Note: not LTMP
peak-peak, but rather average position of the tape) in each one-second block based on
knowing if popped strands, nominally even tape, or both are passing through the drive in
each respective time period. For this study 1000 cycles were used to test each sample at
nominal tension and speed.
2.2.4.4. Tension and speed studies
Combinations of the extreme allowable operating tension and speed were used in
this study. Tension was varied from 0.5 to 1.2 N and speed was varied from 4 to 8 m/s.
Table 1 illustrates the test plan used to study the effects of tension and speed on each tape
sample. Two runs of 100 cycles at each of the extreme combinations of tension and
speed were completed. Data from the baseline studies at nominal tension and speed was
used for comparison. Additionally, the same pieces of tape were used throughout the

- 19 -
tension and speed study and the baseline comparison study in an effort to remove any
potential effects of tape edge quality on LTMP.
Table 1 Tension and speed test matrix
2.2.4.5. Head zenith angle and air pressure study
In addition to the effects tension and speed have on LTMP it is important to study
sources of LTMP that arise from the tape transport itself. This study looks into this
subject and deals with both the head zenith angle and air pressure used in the porous air
bearings (PABs). Head zenith angle refers to the vertical degree of tilt of the head.
Under normal operating conditions the head zenith angle is set to approximate the angle
of the PABs, 0.6 degrees. In this test the head zenith angle will be changed, so that it is
vertically straight up and down in one setting and in another the head will be positioned
so that it is tilted past the bearing angle.
The air pressure used in the PABs is normally set to 34 kPa. The lowest
operating air pressure the PABs run at is 14 kPa and the maximum allowable air pressure
is 41 kPa. This study, thus varies air pressure settings between 14 and 41 kPa.
Tension and speed test matrix
0.5 N 1.0 N 1.2 N 4 m/s X X 6 m/s X 8 m/s X X

- 20 -
A 1000 cycle test was completed at the normal settings of the head zenith angle
approximating the angle of the PABs and 34 kPa air pressure going to the PABs. This
initial 1000 cycle test will be used for comparison to the data collected in subsequent
runs. A total of eight 100 cycle runs (two at each combination of settings) were used in
this study. The same piece of commercially available MP tape is used for each run.
2.2.4.6. Bearing placement study
Limited by the contours and construction of each of the PABs, the goal of the
bearing placement study is to alter the tape path away from the head and determine if
LTMP increases at the head with any changes. Figure 2.4 (a) displays a schematic of the
normal setup of the tape transport along with a numbering convention for all of the PABs
and gaps between the PABs. An initial 1000 cycle test was completed using the normal
setup of the tape transport. Subsequent 100 cycle runs were completed while using
settings that altered the tape path away from the head. Two runs were completed at each
of the settings that included removing bearings 3 and 4, removing bearings 5 and 6, and
moving the take-up and supply reels away from bearings 9 and 10 approximately 80 mm,
respectively. The same piece of commercial MP tape was used throughout this study.
Also, a companion study measuring LTMP in the gaps between bearings and at the reels
was completed both during normal settings and with the PABS and reels moved in an
effort to show the effects of altering the tape path away from the head.

- 21 -
Fig. 2.4 (a) Bearing and gap numbering convention for the MTS tape transport (b)
Schematic of the different wrap angles studied
- 22 -
2.2.4.7. Wrap angle study
The final parametric study involves wrap angle. Wrap angle is the angle the tape
makes as it wraps around the head. Four different wrap angles were used in this study.
The angles used include 0 (no head), 14.5, 23, and 40.5 degrees. Figure 2.4 (b) shows a
sketch of the four different wrap angles. Of note in this figure is the fact that as the wrap
angle increases, so too does the amount of tape that is lifted off of the front two bearings.
Normally set at 23 degrees, the wrap angle can be changed by moving the head further in
or out of the tape path. This first portion of this study involves a 1000 cycle test using the
standard 23 degree wrap angle. After this test 100-cycle tests at the remaining wrap
angles were completed. The same piece of MP tape was used throughout the study.
Also, note that the coefficient of friction was not monitored in this study because the
varying amount of tape on the front bearings causes errors with the pressure transducers
used in its measurement.
2.3. Results and discussion
Lateral tape motion has long been a concern of the data storage industry, as it
causes problems with track misregistration. For this reason several studies were
completed to investigate LTMP in different tapes and how the tapes perform under
different operating conditions. Coefficient of friction and LTMP were monitored for all
tests where applicable and edge quality was monitored for the baseline study involving
the five different tapes. Before discussing the results note that in the tests involving 100

- 23 -
cycle runs, two trials at each of the pertinent combinations were completed, but since the
data was highly repeatable and in the interest of brevity only one data set from each
combination is presented. Also, the data presented as the nominal conditions for
comparison to the different combinations of settings in each test is the data from the last
100 cycles of a 1000 cycle test.
2.3.1. Baseline test comparison of tapes
The coefficient of friction and LTMP results for all five tapes studied are
presented in Fig. 2.5 (a). All three of the AME tapes exhibit coefficient of friction values
lower than MP tape. Alfano and Bhushan (2006a) noted the same trend and determined
this was a result of the lubricants used in AME tapes. Thin MP tape exhibited the highest
coefficient of friction of the tapes studied. Possible explanations for this include Thin
MP having a lower surface roughness compared to the commercially available MP tape
sample leading to a higher real area of contact, or that it may be more compliant as it runs
through the tape transport because of its reduced thickness.
The LTMP results for the five tapes show that the AME-NC tape produces
significantly higher LTMP than the other four tapes. MP, Thin MP, AME-PC and AME-
PC+ all generate similar amounts of LTMP, but AME-PC and Thin MP have slightly
lower values of LTMP when compared to MP and AME-PC+ tapes. Alfano and Bhushan
(2006a) studied the effects of tape cupping on LTMP and found that the reason AME-NC
shows an increase in LTMP is dual natured in that it suffers from the combination of

- 24 -
Continued
Fig. 2.5 (a) Coefficient of friction and LTMP results for the five tapes at nominal
conditions (b) Relative edge contour length results for the five samples (c) PSD plots and
coherency estimates of the five tape samples studied

- 25 -
Figure 2.5 continued

- 26 -
being negatively cupped and it has a smooth surface. When compared to its fellow AME
tapes AME-NC shows higher LTMP because of a lack of tape edge pinning. With
negative cupping the edges of the tape are cupped out away from the head, reducing the
contact area between the head and tape. This can be contrasted to the positively cupped
AME tapes in which the tape edges are cupped toward the head and bearings. In the
positively cupped case the edges of the tape are in contact with the head and bearings
creating a pinning effect, as the tape moves from bearing to head. The lack of tape edge
pinning in AME-NC, thus contributes to the higher LTMP generation. Now compare
AME-NC tape to the other negatively cupped tapes, MP and Thin MP, and again one will
see that AME-NC generates significantly higher LTMP. This is due to the surface
roughness of the tapes in question. MP tapes have been to shown to have rougher
surfaces compared to AME tapes. The increase in real area of contact (surface asperities)
that the increase in surface roughness of MP tapes provides adequately allows for MP
tapes to grip the surface of the head and bearings, reducing LTMP. Combine the lack of
surface roughness of AME-NC with the fact that it is negatively cupped and it is easy to
see why it generates significantly higher LTMP.
Edge quality can directly impact LTMP measurements. For this reason tape
optical micrographs of the five tape samples were taken and analyzed. The results of the
analysis in the form of relative edge contour length (RECL) are shown in Fig. 2.5 (b).

- 27 -
From the chart one can see that AME tapes exhibit significantly higher values of RECL
than MP and Thin MP tape with the lone exception of the upper edge of the magnetic
side of Thin MP tape. Goldade and Bhushan (2005) reported that when the initial web of
tape is slit a significant amount of stretching of the substrate occurs. This can lead to the
generation and propagation of cracks. AME tape is particularly impacted by this
stretching because the magnetic layer of AME tape is very brittle, resulting in higher
RECL values.
Because edge quality and variation may impact LTMP measurements the dual
edge probe method was employed. This was completed by placing both edge probes in
the vicinity of the head. One of the probes measured the top edge, while the other
measured the bottom edge of the tape. PSD plots for both the top and bottom edge on all
of the tape samples were created. Figure 2.5 (c) presents the PSD plots for only the
bottom edge of each tape sample, as the top and bottom edge PSD plots were very
similar. Note that the scale for the AME-NC PSD plot is different than the other four
tapes. This increase in the scale and likewise power verifies that AME-NC tape has
much higher LTMP than the other tapes.
Also included in Fig. 2.5 (c) are coherence estimates for the top and bottom edge
LTMP measurements. A high coherence estimate indicates that the LTMP measured on
the top and bottom edges are highly relatable. This suggests that the LTMP reported
corresponds to actual tape motion and the contributions of tape edge contour to the

- 28 -
measurement of LTMP are minimized. As the coherence estimate decreases, the
relationship between top and bottom edge LTMP measurements decreases. Looking at
the frequencies where the LTMP signal was measured in the PSD plots, approximately
20-30 Hz, one can see the coherence estimates are fairly high. This is particularly true
for MP and Thin MP tape indicating that the LTMP measurements taken reflect a
reasonably true measurement of LTMP. The coherence estimates for some of the AME
tapes are slightly lower than the MP tapes, suggesting that the edge probe measurements
may be convolving tape edge profile as tape motion in AME tapes. This may result in an
increase in reported LTMP values for the AME tapes. Please note that the PSD plots and
coherence estimates were repeatable between different studies. For this reason their
discussion has been excluded in future sections of this report.
2.3.2. Quality of slit edge study
In this study two separate tapes were run for 1000 cycles each. One tape was
deemed to have good edge quality while the other was found to have comparatively poor
edge quality. Figure 2.6 (a) shows the coefficient of friction and LTMP results for both
tape samples. The RECL results for the two tapes are displayed in Fig. 2.6 (b).
Especially on the magnetic side, the poor edge quality sample shows a much worse edge
quality compared to the good quality edge sample. This result is verified if one recalls
Figs. 2.2 (a) and (b) that visually show the poor edge sample having a much more ragged
edge profile.

- 29 -
Fig 2.6 (a) Coefficient of friction and LTMP results for the tape edge quality study (b)
Relative edge contour length results contrasting the good quality sample to the poor edge
quality sample

- 30 -
The results show that the poor edge quality tape has a lower coefficient of friction and
higher value of LTMP. It is difficult to know whether the differences in the LTMP results
are due to the edge quality level, or just the fact that they are two different tape samples.
However, that being said MP tape is negatively cupped, so theoretically the edges would
never come in contact with the bearings or head. This suggests that the LTMP increase in
the poor edge quality sample could be due to the edge probe convolving the tape edge
profile as lateral motion. Methods being investigated by Alfano and Bhushan (2006b) in
which lateral motion of the tape is measured by reading back a written magnetic signal
may be able to determine whether or not the increase in LTMP for the poor quality
sample is due to the edge probes convolving the edge profiles of the tape samples.
2.3.3. Staggered pack study
The methodology discussed in section 2.2.4.3 approximated the location, length of
each band of popped strands, and the estimated time frame that each band passes through
the tape drive. Figure 2.7 shows the LTMP averaged over each one-second block for all
three samples tested. Referencing Fig. 2.3, the individual bands of popped strands that
pass through the drive are noted above the LTMP data for each one-second block.
Intervals that are free of popped strands do not have any notations above the LTMP data.
The important things to compare in this study are the one-second blocks where there are
- 31 -
Fig. 2.7 LTMP results for the three staggered pack samples
- 32 -
no popped strands, or blocks where a raised strand takes up the entire interval to the one-
second blocks that have a series of nominally even tape and bands of popped strands
traveling through them. Note that in addition to the intervals that are entirely free of
popped strands, block 1 in sample 3 was entirely composed of one band and would
therefore see one height of tape during that particular one-second interval.
The hypothesis before the study was conducted was that the blocks free of popped
strands or composed entirely of a popped strand would show a lower level of LTMP
because the tape passing through that particular time interval would not vary in height. In
looking at the results in Fig. 2.7 sample 1 appears to support this hypothesis, as block 1
and 2 have on average lower LTMP than block 3 or 4. However, samples 2 and 3 cast
doubt on the theory. The one-second intervals that were expected to be higher in LTMP
were in general higher compared to the blocks without popped strands, but there are a
few intervals where this does not hold true. This suggests that LTMP measured at the
head is only minimally, if at all, affected by the bands of popped strands found in
staggered packs. This also suggests that the PABs employed by the MTS tape transport
do a sufficient job constraining lateral motion of the tape by guiding tape motion and
dampening vibrations, as the tape approaches the head.
2.3.4. Tension and speed studies
The importance of studying different types of tape has been noted previously in
this paper. In addition to studying the types of tape it is important to study the operating

- 33 -
parameters the tapes will be under while in use. Tension and speed are two such
operating parameters. Tape drive manufacturers may be forced to lower tension and
increase speed in future drives in order to counteract decreased dimensional stability with
thinner tapes and increase data access times, increasing the importance of studying these
parameters.
Figure 2.8 summarizes the tension and speed results for all five of the tapes
studied. In looking at the coefficient of friction results it is clear that all of the tapes see
an effect from varying tension and speed. This is shown with a reduced coefficient of
friction at the low tension high speed run in all tapes. It is also interesting to note that
both AME-NC and AME-PC tape experience a decrease in coefficient of friction for the
low tension low speed run and the other tapes do not. A decrease in the coefficient of
friction at the low tension high speed combination indicates that hydrodynamic effects
are present for all tapes. Elrod and Eshel (1965) put forth a model of the head-tape
interface that explains the hydrodynamic effects. A hydrodynamic air film develops, as
the tape moves over the head that lifts the tape off of the head. The head-tape spacing is
proportional to (V/T)2/3, where V is tape speed and T is tension. Using this model, one
can see that decreasing tension and increasing speed would increase head-tape spacing
leading to a decrease in the real area of contact between the head and tape surfaces. The
decrease in real area of contact between the head and tape results in a reduction in
coefficient of friction.
- 34 -
Fig. 2.8 Summary of the coefficient of friction and LTMP results for the tension and
speed studies on all five tape samples

- 35 -
The LTMP results from the five tapes show that AME-NC and AME-PC are
influenced by changing tension and to some degree speed, while MP, Thin MP, and
AME-PC+ are not. Reasons for the differences between the tapes that see a significant
effect as a result of varying tension and speed and those that do not are a continuation of
the discussion from the baseline comparison study. AME-NC tape is both negatively
cupped and very smooth. This leads to higher LTMP compared to the other tapes because
of a combination of lack of tape edge pinning and a reduced real area of contact.
Previously, Fig. 2.5 (a) and now Fig. 2.8 demonstrates this, as on average the results for
each tension and speed combination used for AME-NC tape are higher than all of the
other tapes. The runs at low tension compound the problem of reduced real area of
contact and lack of edge pinning resulting in even higher values of LTMP. This occurs
because at the runs using low tension, particularly the combination of low tension and
high speed, the head-tape spacing increases due to hydrodynamic effects further reducing
the real area of contact between the tape and head, increasing freedom of motion. Thus,
AME-NC tape at lower tensions has increased LTMP.
AME-PC tape has been shown in the previously discussed baseline comparison
study and again in this study to have adequate edge pinning when higher operating
tensions are used. However, when the tension is dropped to 0.5 N the LTMP values for
AME-PC tape are increased significantly. This suggests that at low levels of tension the
cupping for AME-PC is not enough to provide adequate edge pinning. Recall that the

- 36 -
cupping for AME-PC is very shallow, 0.1 mm at its greatest, and realize that this tape is
almost flat. At low tension contact between the AME-PC tape and the head is more
between the smooth surface of the tape than the edges. As AME-PC tape is very smooth,
it then lacks both the surface roughness and edge pinning at low tension to remain at a
low level of LTMP. Furthermore, the hydrodynamic effects of increasing head-tape
spacing at low tension magnify the lack of edge pinning and surface roughness in the
AME-PC tape. Comparing the results from AME-NC and AME-PC tape, it is clear that
the cupping in AME-PC+ tape is aggressive enough to provide tape edge pinning even at
low tensions. Additionally, the results show that the negatively cupped MP and Thin MP
tape have sufficient surface roughness to grip the head at low tension.
2.3.5. Head zenith angle and air pressure study
In addition to the effects varying tension and speed may cause it is important to
look for other variables present on the tape drive that may affect LTMP. Two such
parameters analyzed in this study are the head zenith angle and the air pressure used in
the PABs. The head zenith angle and air pressure were varied between the settings
described in section 2.2.4.5.
Results for this test are shown in Fig. 2.9 (a). In regards to head zenith angle the
coeffic ient of friction results do not establish a pattern. Thus, it appears that head zenith
angle does not affect coefficient of friction. However, the results show lower coefficient
of friction when the lower air pressure of 14 kPa is used signifying that air pressure in the

- 37 -
PABs can have a direct impact on coefficient of friction.
Looking at the LTMP results in Fig. 2.9 (a) in terms of air pressure the results are
grouped closely together suggesting that the PABs air pressure does not affect LTMP.
This is seen when comparing the results at the same head zenith setting, but different air
pressure. When looking at the results in terms of head zenith angle however, one does
see a significant difference in LTMP between runs with the head set vertically straight
and the runs where the zenith angle is set equal to or exceeds the angle of the PABs. This
result can be explained by discussing the schematic of the head zenith angle effect shown
in Fig. 2.9 (b). The left most portion of this figure represents the head-tape interface
under normal conditions when the head zenith angle approximates that of the PABs. The
0.6 degree angle of the PABs creates a tension gradient across the width of the tape that
increases in magnitude moving from the bottom edge to the top of the tape. Under
normal settings this tension gradient is applied at the head, so that it is evenly distributed
over tape that is in contact with the head. Since the tape is in contact with the head where
the tension gradient is applied, the tape is not free to move resulting in LTMP values that
are low. Compare this to the setting when the head is vertical. In this case the negative
cupping of the tape and the rotated head enables the top portion of the tape to be free of
contact with the head. The greatest portion of the tension gradient from the PABS is
applied to the part of the tape that is largely out of contact with the head. This creates a
- 38 -
Fig. 2.9 (a) Results for head zenith angle and PABS air pressure study (b) Schematic
displaying the head zenith settings and reasons for LTMP variation

- 39 -
moment about the bottom edge of the tape that is in contact with the head leading to an
unstable tape at the head-tape interface. The unstable tape creates freedom for the tape to
move significantly increasing LTMP under the vertical head setting. Finally, looking at
the third scenario where the head is tilted past the PABs angle the LTMP results are low
and very comparable to the standard setting. The right most portion of Fig. 2.9 (b) shows
what happens in this case. As the head is rotated, the tape-head contact occurs on the top
portion of the tape, while the bottom portion of the tape is free from head contact. The
greatest portion of the tension gradient is applied where the tape is in contact with the
head creating a pinning effect and reducing the ability of the tape to move laterally,
effectively keeping LTMP under control.
2.3.6. Bearing placement study
Another parameter that was studied is the placement of the bearings and reels on
the MTS tape deck. Using the settings described in section 2.2.4.6, the goal of this study
was to determine if alterations to the tape path “downstream” of the head-tape interface
had an impact on LTMP measured at the head. The results for this study are displayed in
Fig. 2.10 (a).
The coefficient of friction data for all four of the runs shows a consistent value
typically associated with MP tape. This result makes sense as the same piece of MP tape
was used throughout the study and each run was conducted under nominal operating
tension and speed. Results for the runs when bearings were removed or the reels were

- 40 -
moved show a slight increase in LTMP compared to the run using the normal setup. It is
also interesting to note that the results for the runs where the tape path is altered are
virtually identical regardless of which group of bearings was removed or if the reels were
moved away from the rest of the transport.
For a more accurate understanding of the LTMP results at the head it is important
to also look at LTMP measured between bearings and at the reels. Figure 2.10 (b)
presents such information. Referencing Fig. 2.4 (a), this figure presents LTMP data under
normal setup and altered conditions in bearing gaps and at the reels. While the
magnitude of the LTMP data presented for normal setup is not of interest because it is
expected to be higher in gaps compared to the head, it is very important to note that
LTMP significantly increases in the gaps and at the reel when the tape path is adjusted.
For instance removing bearings 3 and 4 nearly doubles the LTMP measured in gap 2, or
the LTMP measured in between the reels and bearings 9 and 10 raises approximately 15
µm when the reels are moved out. Compare this to the results shown in Fig. 2.10 (a) and
results from the bearing placement companion study measured in the gaps and at the reels
it is clear to see that the effects of removing bearings or changing the position of the reels
have only a minimal effect at the head. This is evidence that bearings 1 and 2, those
closest to the head, minimize any effects of increased LTMP “downstream” of the head.
Additionally, this study further supports the conclusions of the staggered pack study. As
a section of popped strands is about to enter the tape transport, the guiding created by the

- 41 -
Fig 2.10 (a) Results for the bearing placement study measured at the head (b) LTMP
results from the bearing placement companion study measured in the gaps and at the reels

- 42 -
bearings pull the tape down creating a dramatic LTMP event, but only minimal evidence
of an increase in LTMP is measured at the head.
2.3.7. Wrap angle study
The final parameter studied was wrap angle. A series of different wrap angles
including 0 (no head), 14.5, 23, and 40.5 degrees was used for this study. Results are
shown in Fig. 2.11.
The results for this study show that an increase in wrap angle leads to an increase
in LTMP. As the wrap angle is increased, a greater amount of tape is pulled off of the
bearing. This effectively increases the distance between the front two bearings and the
head. As a result, the tape receives less guiding from the bearings before the head at
higher wrap angles, increasing LTMP. One can definitively say that on the tape transport
used in this study wrap angle effects LTMP. However, the bearings are contoured and
positioned such that an increase in wrap angle automatically increases the unguided
distance between the bearings and the head. Therefore, it is not certain if the increase in
LTMP is actually due to the wrap angle itself, or simply due to increasing the distance of
unsupported tape before the head. Finally, note that the results for the wrap angles of 0
and 14.5 degrees are virtually identical. Intuitively, one might expect to see an increase
in LTMP without a head, but this did not happen. One possible explanation is that
without the head the tape runs along the entire width of the front bearings and the tape
path is stable as it moves in a straight line from bearing to bearing.

- 43 -
Fig. 2.11 LTMP results at the different wrap angles studied

- 44 -
2.4. Conclusions
The purpose of this study was to investigate LTMP in different tapes and the
sources of LTMP due to different operating parameters. This was done in hopes of
providing information to tape and tape drive manufacturers on LTMP, as they work
towards increasing data storage capacity. Results show that some tapes perform better
than others at nominal operating tension and speed and varying tension and speed can
have an impact on some tapes, but not others. Additionally, certain adjustable parameters
on the MTS tape deck were identified as having an impact on LTMP generation. Detailed
conclusions follow.
• Thin MP tape was shown to have the highest coefficient of friction, while the
AME tapes show slightly lower values of coefficient of friction compared to MP tape.
• AME-NC tape has the highest LTMP at nominal conditions compared to the other
four samples studied. This occurs because AME-NC tape is negatively cupped and is
also very smooth.
• Poor edge quality tape was shown to have a higher value of LTMP compared to a
tape sample with good quality edges. The prevailing reason for this result is that the edge
probes used in this study may convolve tape edge profile as lateral motion. Methods
being developed that measure lateral motion of the tape through the read back of a
magnetic signal should be utilized in an effort to truly determine the effects tape edge
quality have on LTMP.

- 45 -
• LTMP at the head-tape interface may be minimally affected by staggered tape
packs. The minimal effect on LTMP from staggered packs is an indication that the
bearings closest to the head control LTMP due to sources “downstream” of the head.
• Coefficient of friction in all five tapes studied was affected to some degree by
varying tension and speed. Hydrodynamic effects that reduce the real area of contact
between the tape and head allow for a decrease in coefficient of friction when tension is
decreased. This is magnified further with increasing speed.
• Varying tension can have a significant impact on LTMP in certain types of
magnetic tape. LTMP significantly rose in AME-NC and AME-PC when the tension was
lowered to 0.5 N. A combination of a lack of edge pinning and smooth surface roughness
causes the increase in LTMP at low tension in AME-NC and AME-PC tape.
• The effect of speed on LTMP seems to be predicated on the effect of tension.
Speed shows no impact on LTMP on the tapes where tension does not affect LTMP, or
AME-NC and AME-PC tapes at high tensions. However, speed does have an affect for
AME-NC and AME-PC tape at low tension, as higher speeds in this case increase LTMP.
• Head zenith angle can affect LTMP depending on the setting of the angle. If the
head is set vertically, as opposed to the standard 0.6 degree angle matching the bearings,
LTMP significantly increases due to an absence of tape pinning, or an even distribution of
the tension gradient across tape in contact with the head. However, a change in LTMP is
not seen if the head zenith angle is set so that it exceeds the standard angle.

- 46 -
• Air pressure used in the PABS does not appear to have an effect on LTMP.
• The bearing placement study shows that increasing LTMP “downstream”
minimally affects LTMP at the head. This again shows tha t the front two bearings by the
head minimize increases in LTMP from sources “downstream.”
• Increasing wrap angle on the current MTS tape drive increases LTMP. This result
is due to an increase in unguided distance between the bearings and head, as the wrap
angle is increased.

- 47 -
CHAPTER 3
EFFECTS OF VARYING OPERATIONG TENSION AND SPEED ON LATERAL TAPE MOTION IN MP AND AME TAPES USING THE MAGNETIC SIGNAL
AND OPTICAL PROBE METHODS
3.1. Motivation Demand for greater data storage capacity continually forces the data storage
industry to improve its products. Currently, the most advanced commercially available
magnetic tape cartridges offer storage capacities of 500 GB native and 1.3 TB
compressed. In order to improve the data storage capacities to multi-terabyte levels
without increasing cartridge size future magnetic tapes will need to be thinner, smoother,
have a smaller track width and pitch (distance between adjacent tracks) and increase
linear recording density. Additionally, future generation tape drive systems will employ
higher tape speed to achieve acceptable data acquisition rates. These improvements will
allow for more data storage capacity within the same size cartridge, faster data retrieval
rate, and lower head-tape spacing required to maintain a good signal- to noise ratio in high
density recording (Bhushan 1996, 2000, Mee and Daniel, 1996, Luitjens et al., 1996).
However, all of these improvements will not come without issues as thinner,
smoother tapes will lead to a reduced dimensiona l stability and an increase in friction
(Bhushan, 2000). Lower tape tension can be used in an attempt to counteract the reduced
dimensional stability and increase in friction, but the use of lower tension and increased

- 48 -
speed for higher data acquisition rates can lead to increased hydrodynamic effects as tape
passes over the head in a tape drive (Elrod and Eshel, 1965). The increased
hydrodynamic effects may lead to an unstable tape path and an increase in lateral (cross-
track) tape motion. Excessive lateral tape motion (LTM) causes the data tracks on the
tape to move relative to the read/write modules of the head in a tape drive leading to
potential errors in reading and writing data tracks. While modern commercial tape drives
employ servo track following systems to combat LTM, they are of limited bandwidth and
problems may still occur if the LTM is of sufficient magnitude. The potential problem
LTM may cause will be magnified in the future, as narrower data tracks used for
increased storage capacity will reduce the allowable tolerance for LTM.
Given the impact tension and speed may have on the future use of magnetic tape
it is apparent that further consideration needs to be given to developing a strong
understanding of the effects tension and speed have on LTM generation. Hansen and
Bhushan (2004) completed a study that varied the tension and speed on commercial metal
particulate (MP) tape on a tape transport with stationary guides. The results of their work
showed that the coefficient of friction was affected by tension and speed, but they were
unable to draw strong conclusions in regard to LTM. A second study on the effects of
varying tension and speed was completed by Wright and Bhushan (2006) that used an
MTS tape transport with porous air bearings. In addition to commercially available MP
tape this study looked at the effects tension and speed had on an experimental Thin MP

- 49 -
tape and three advanced metal evaporated (AME) Tapes. The conclusions from this
study show that varying tension can have a significant impact on LTM generation in
certain types of tape. Due to a lack of edge pinning and a smooth surface two of the
AME tapes were shown to have significantly higher LTM at low tensions.
A potential limitation of the previous studies is that all of the LTM measurements
were made using an optical probe. While the measurements taken with the optical probes
would capture true LTM, they may also convolve the physical edge profile of the tape
samples as tape motion, which could alter the LTM measurements. Alfano and Bhushan
(2006a) worked on a LTM measuring technique based on reading back a halfway detuned
magnetic signal written on the tape. This technique allows one to measure LTM between
the edges of the tape, ostensibly leading to a truer measurement of LTM. With the advent
of this new LTM measurement technique and the knowledge that probe measurements
previously found that tension and speed can have an impact on LTM it is important to
further refine our understanding on the impact tension and speed may have on true LTM
between the edges of the tape.
As such, the current study will investigate the effects of varying tension and speed
have on six different tape samples using the magnetic signal method of LTM
measurement. The new technique will allow for conclusions to be drawn on the true
impact varying tension and speed has on tapes ranging from current technology to tapes
with potential for future commercial use. Additionally, as the magnetic signal technique

- 50 -
is not dependent on stationary optical probes, this study will look to not only determine
the impact of varying tension and speed on different types of tape, but also seek to
determine if the physical location of the written signal in terms of relative position to
middle of the tape or close to the top and bottom edges has an effect on LTM. Finally, as
the magnetic signal technique for measuring LTM is relatively new, this study will look
to compare the results generated with this technique to those taken with the optical probe
used in previous studies.
3.2. Experimental details
3.2.1. Tape transport and test procedure
Drive tests were conducted in a class 10,000 laboratory environment (22 ± 1
°C; relative humidity 45 ± 5 percent) using the Segway Systems / Mountain Engineering
II MTS linear tape transport with horizontal tape path, shown schematically in Fig. 3.1
(a). Tape bearings are single-flanged and tapered at an angle of 0.6 degrees to force the
lower edge of the tape to ride along the flange. The head mount is designed such tha t the
head zenith angle is the same as the bearing taper angle. Penetration of the head into the
tape path was set the same for each test. Each bearing consists of a housing, porous
ceramic bearing material, lower flange, and outriggers. The housing and the bearing
member form a plenum connected to an air pump such that airflow through the porous
material creates an air cushion that supports the tape. The outriggers at each side of the
guide provide cleaning action for the tape (Gavit, 1998).

- 51 -
Fig. 3.1 (a) Schematic diagram of the Segway Systems/Mountain Engineering MTS
linear tape transport with porous air bearings and single-flanged tapered guides (b) Cross-
section schematic showing the structure of MP, Thin MP, and generic AME tapes

- 52 -
Tape tension is monitored on both sides of the head by measuring air pressure in
the gap between the tape and the bearing member by means of pressure transducers that
are mounted in the two guides bracketing the head. The drive controller monitors the
pressure transducer signals and angular velocities of the tape reels and maintains constant
tension and linear tape speed during a pass. The controller is connected to a PC that
allows the operator to program certain drive parameters. Up to 600 m of 9 µm-thick tape
can be loaded onto the tape reel, and the drive can be programmed to run for a specific
number of cycles, with practically any pass length, at tape speeds between 2 and 8 m/s
and tensions between 0.5 and 1.2 N. Pass length was set at 30 m with one forward and
one reverse pass equal to one 60-m cycle.
3.2.2. Tape and head samples
Figure 3.1 (b) is a schematic of the cross-sections of MP, Thin MP, and a generic
AME tape. The MP tape used in this study is commercial, 12.7 mm-wide Ultrium 1 tape.
It is a dual- layer metal particle tape with magnetic layer and backcoat thicknesses of 0.25
µm and 0.5 µm, respectively, a substrate thickness of about 6.5 µm, and an overall
thickness of 9 µm. The magnetic layer contains needle-shaped, passivated iron magnetic
particles and head cleaning agents (HCAs) dispersed in a polymer formulation of binder
and fatty acid ester lubricants. The magnetic particles are typically 0.1-0.2 µm or smaller
in length and have an aspect ratio of five to ten. The HCAs are generally 0.2-0.3 µm-

- 53 -
diameter Al2O3 particles and conductive carbon particles, added to improve friction,
wear, and electrical conductivity. The Thin MP tape used in this study is an experimental
tape with properties similar to the commercial MP tape described above. The main
difference between the two tapes is that the substrate thickness has been decreased to
approximately 4.5 µm in the Thin MP tape, reducing the total thickness to 7 µm.
Four AME tapes were used in this study. AME tape is 12.7 mm wide. The
overall tape thickness of AME tape is about 8.6 µm. Three of the AME samples are
experimental formulations with different cupping (natural curl of the tape edges away or
towards the head) orientations. These samples will henceforth be referred to as Tape A
samples. One of these AME samples is negatively cupped (edges curl away from the
head) and henceforth, will be referred to as AME-NC Tape A. The remaining of two
Tape A samples are positively cupped (edges curl towards the head), but one sample is
much more aggressively cupped. The shallower of the two positively cupped samples
will be referred to as AME-PC Tape A and the more aggressively cupped tape will be
known as AME-PC+ Tape A. The frontcoat of all three AME Tape A samples consists
of the dual magnetic layer (180 nm thick) of evaporated Co-O, over which is a 12 nm
thick diamond-like carbon (DLC) coating, over which is a 5 nm-thick liquid lubricant
layer. DLC is a hard coating used to protect the magnetic coating against corrosion and
wear. The lubricant enhances the durability of the DLC and magnetic coatings by
reducing friction at the head-tape interface. The lubricant commonly used consists of an

- 54 -
overcoat of fatty acid esters on a perfluoropolyether (PFPE) coating. The fourth AME
sample is an experimental positive ly cupped sample, which will be referred to as AME-
PC+ Tape B. This sample also has layers of DLC and lubricant of unknown thicknesses.
Figure 3.2 is a schematic of the commercial Seagate LTO (Generation 1) head
used in this study. It is an inductive write/magnetoresistive (MR) read head with Al2O3-
TiC substrate, 80/20 Ni-Fe MR stripe, Co-Zr-Ta (CZT) shields and poles, and Al2O3
overcoat, undercoat, and gap material. The MR stripe, shields and poles, and overcoat,
undercoat, and gap material are sputter deposited on the substrate. The head is vertically
symmetric about the glue line, so only half of the head is shown in Fig. 3.2. The
crosshatched areas in the head schematic (not including the blow-up of the thin-film
region) are raised surfaces and areas without crosshatching are transverse slots. The
outermost raised surfaces are outriggers, designed to remove loose debris from the tape
before passing over the poles. The slots are designed to allow air to bleed away from the
interface and also serve to capture some loose debris that passes through the interface.
The head has eight read/write channels, numbered zero through seven, two servo
channels above the read/write channels, and two servo channels below the read/write
channels. For each read/write channel there are two thin-film regions (one on either side
of the head), giving the head read-while-write capability. The write elements were 27 µm
in height and the read elements 12 µm. A Faulhaber 1524E012SR coreless DC stepper
motor along with a Faulhaber MVP 2001 motor controller actuated the head.

- 55 -
Fig. 3.2 Schematic drawing of one half of the Seagate LTO head (symmetric about glue
line) with detailed schematic view and optical micrograph of the thin film region

- 56 -
3.2.3. Measurement techniques
Tape cupping is the natural tendency of the tape to curl about an axis parallel to
the direction of travel along the tape width (Bhushan, 2000, Scott and Bhushan, 2003).
Positively cupped tapes curl so the edges are towards the head, while negatively cupped
tape edges are curled away from the head. Cupping measurements of the six tape
samples in this study were made using an optical microscope (OPTIPHOT-2, Nikon
Corporation, Tokyo, Japan) following the technique developed by Scott and Bhushan
(2003). The MP tape used in this study has negative cupping equal to about 1 mm at its
greatest. Thin MP and AME-NC Tape A samples displayed a negative cupping slightly
greater than 1 mm at its greatest point. The AME-PC Tape A sample used in this study
has shallow positive cupping equal to about 0.1 mm at its greatest. The other positively
cupped Tape A sample, AME-PC+ Tape A, has a more aggressive positive cupping equal
to about 0.6 mm at its greatest. The AME Tape B sample, AME-PC+ Tape B, was
shown to have an aggressive positive cupping of approximately 0.7 mm at its greatest
point. A tape cupping plot of the six samples is shown in Fig. 3.3.
During the study, the coefficient of friction is calculated from the drive tension
signals using the belt equation and captured by the data acquisition software (NI-6023E,
National Instruments, Austin, TX) with a sampling rate of 700 Hz. The data acquisition
was controlled by Snap-Master V3.5 data acquisition software (HEM Data Corp.,
Southfield, MI).

- 57 -
Fig. 3.3 Measured cupping profiles of the six tape samples
- 58 -
LTM was measured using two methods. The first method utilized the MTI 2000
Fotonic sensor, equipped with Edge Probe (MTI Instruments Inc., Latham, NY, probe
2062E with sensitivity of 17.853 µm/V and a noise level of 20 mVp-p). In this method,
which has been the predominant LTM measuring technique in the past, the edge probe is
positioned over the tape edge. Light from the light source is reflected by a 90-degree
prism to another 90-degree prism and finally reaches a photodiode (light receiver). The
Fotonic sensor converts the photodiode signal, which is proportional to the light intensity,
into the output units (volts or microns). If the light path is not obstructed by the tape
edge the output of the Fotonic sensor is 100 percent. The output decreases as the tape
moves upward into the gap between the prisms and vanishes to zero when no light
reaches the photodiode (Goldade and Bhushan, 2003).
Optical measurements of LTM, such as with the edge probe used in this study,
may convolve tape motion measurement with the measurement of the tape edge profile.
The contour of the tape edge is not a straight line, but instead it can be rough and jagged.
The Fotonic probe may convolve the unevenness of the tape edge as tape motion. The
convolution of the tape edge cannot effectively be removed from the measurement of true
motion. Thus, the values obtained with the Fotonic probe provide only an estimate of
true LTM. Figure 3.4 provides an illustration of the effect tape edge profile may have on
the LTM measurements derived from use of the Fotonic probe.

- 59 -
Fig. 3.4 Schematic illustrating the different components of LTM and their contribution to
total LTM peak-to-peak amplitude

- 60 -
The second LTM measuring system employed in this study is based on the
readback of a magnetic signal described by Alfano and Bhushan (2006a). The use of this
technique was designed to eliminate any convolution of tape edge profile as tape motion
in LTM measurements. In this method 200 kbpi sine waves were written at 4, 6 and 8
m/s (individually depending on which speed was being used for an individual test)
resulting in 5.5, 8.0, and 10.5 MHz signals, respectively, being written to the tape using
only read/write channel six. The read signal was then amplified internally with a 47 dB
gain factor and filtered using a band pass series RLC circuit tuned to the appropriate
frequency to eliminate noise. This AC signal was then converted to a DC RMS voltage
using a HP 400EL voltmeter and was recorded by the data acquisition software at 700
samples per second.
During the experiments, once the signal had been written to the tape, the head
location was optimized using the stepper motor until the read element produced a
maximum value. This optimization is necessary to counteract any head misalignment
issues. When amplified, this resulted in a signal output that ranged from approximately
0.17 volts at 8 m/s, 0.30 volts at 6 m/s, and 0.42 volts at 4 m/s. These voltages coincide
with the 12 µm read element being completely inside the 27 µm written track. The head
was then adjusted so the read channel read approximately 0 V. This coincided with the
12 µm read element being completely outside the 27 µm written track. The head was

- 61 -
once again adjusted so the read element gave an output of approximately half of the
reported values for signal output with the read element completely inside the written
signal. This position lies in the linear region of the MR read element calibration curve
and indicates that the read head was placed halfway on the written track and halfway off
of the track. This left 6 µm of read element on and off the written track. A schematic of
this MR reader placement is shown in Fig 3.5 (a). In order to report the output voltage as
displacement in microns, a conversion factor was necessary. This conversion factor can
be readily obtained if the plot of output voltage versus displacement is linear.
To determine if the MR read elements would respond linearly to displacement,
calibrations were conducted. To be consistent with experimental procedure, the head was
placed initially so the read element produced a maximum value. From this position, the
head was displaced in 0.1 µm increments and the average voltage output per forward pass
from each position was recorded. In order to determine that the output voltage
corresponded to the reading of the written track a HP 8568B Spectrum Analyzer was
used. Before each data point was recorded, it was determined that the signal was still
greater than the current noise floor. Once the signal was below the noise floor, no further
data was taken.
Calibrations were completed at all three of the speeds on all six of the tape
samples. Plotting the voltage per displacement data for each speed and tape combination
produced a calibration curve. An example of one of these curves is shown in Fig. 3.5 (b).

- 62 -
Fig. 3.5 (a) Schematic indicating the LTMM read element placement (b) Example
calibration curve for the Seagate MR reader

- 63 -
Evident from this curve is that a linear region exists between voltages that correspond to
the full signal amplitude and the noise floor. Table 2 displays the calibration factors used
for each tape and speed combination. Note that Alfano and Bhushan (2006a) found that
in completing multiple trials of these calibration curves the results proved to be
repeatable. The calibration factor can then be used to convert differences in voltage into
LTM measurements.
Since this study will be using two different methods to measure LTM data it will
be important to distinguish between the two. The reported LTM values from Fotonic
edge probes correspond to the physical location of the tape due to both tape motion and
edge contour. In light of this LTM measurements made with the Fotonic edge probe will
henceforth be termed lateral tape motion physical (LTMP). The LTM data taken with the
magnetic signal readback method equates to LTM that would be seen by the MR reader
during drive operation and would be a measure of LTM that occurs between the edges of
the tape. Since this method involves the readback of a magnetic signal all LTM
measurements made with this technique will henceforth be referred to as lateral tape
motion magnetic (LTMM). LTMM data is considered a more accurate reflection of actual
LTM, as it is measured in between the tape edges and is the LTM seen by the MR reader.

- 64 -
Calibration factors for magnetic signal technique Tape/Speed 4 m/s 6 m/s 8 m/s
MP 78.7 76.1 74.5 Thin MP 40.9 39.8 69.3
AME-NC Tape A 40.3 86.2 100.0 AME-PC Tape A 41.4 52.2 94.6
AME-PC+ Tape A 22.4 29.4 29.4 AME-PC+ Tape B 29.6 55.0 79.0
Table 2 Calibration factors used in magnetic method of measuring LTM
One final distinction needs to be made in terms of LTM measurements that are
reported in both terms of LTMP and LTMM. The first value reported is average LTM
peak-to-peak amplitude (LTM P-P amplitude). This is a measure of tape motion within
the same cycle and is found by parsing the LTM data into one-second increments and
averaging the difference between the highest and lowest tape position in each one-second
block over the forward pass. The second type of LTM data reported will be non-
repeatable LTM. Non-repeatable LTM measures tape motion from one cycle to another
and can be presented in several ways. The most prevalent term used in this study when
discussing non-repeatable LTM will be LTM quality factor. LTM quality factor is found
by taking the maximum and minimum measurements of tape position at a specific point
in time within each pass +/- a 0.05 second window (example second 3 +/- 0.05, 2.95-

- 65 -
3.05). The minimum value of the minimum measurement from all of the cycles in a test
is then subtracted from the maximum of all of the maximum points resulting in the
measurement termed LTM Quality Factor. An increase in LTM Quality Factor would
equate to an increase in variability from cycle to cycle.
3.2.4. Test plan
Combinations of the extreme allowable operating tension and speed were used in
this study. Tension was varied from 0.5 to 1.2 N and speed was varied from 4 to 8 m/s.
Table 3 illustrates the test plan used to study the effects of tension and speed on each tape
sample. Note that the 1 N, 6 m/s combination is considered to be the nominal operating
conditions in terms of tension and speed and should serve as a relative midpoint in the
variation of tension and speed. Two runs of 100 cycles at each of the tension and speed
combinations were completed for each of the six tape samples. These runs were
completed with the magnetic signal written in the middle portion of the tape while under
the corresponding tension and speed combination.
In addition to measuring LTMM in the middle of the tape to determine the effects
of varying tension and speed this study also includes a look into any effects the position
of the magnetic signal may have on LTMM. Rather the study will attempt to determine if
there is a difference in LTMM depending on the portion of the magnetic tape the signal
was written on and if varying the tension or speed impacts any possible difference. In
order to complete this portion of the study magnetic signals were written at each tension
- 66 -
and speed combination on portions of the tape that are close to both the top and bottom
edges. 100 cycle tests were completed at each tension and speed combination on both the
top and bottom edges.
Tension and speed test matrix
0.5 N 1.0 N 1.2 N 4 m/s X X 6 m/s X 8 m/s X X
Table 3 Tension and speed test matrix
3.3. Results and discussion
3.3.1. Tension and speed results
Coefficient of friction, peak-to-peak LTM and non-repeatable LTM were
monitored throughout a series of tests that varied the tension and speed in six different
tape samples with the magnetic signal located in the middle portion of the tape. The
results for these tests will be presented in the following sub-sections. It should be noted
that the values presented for the work done with the magnetic signal in the middle of the
tape correspond to the average of two runs taken at each tension and speed combination
with each tape sample.
- 67 -
3.3.1.1. Coefficient of friction
The top most graph in Figure 3.6 displays the coefficient of friction results for all
of the tapes studied at every combination of tension and speed. While it is far more
evident in the AME tape samples, one can see evidence that varying tension and speed
affect the coefficient of friction values in all tapes. This is shown with a reduced
coefficient of friction value in the low tension high speed runs. The reduction in
coefficient of friction for the low tension high speed run is fairly dramatic for all of the
AME tapes. Also note that the coefficient of friction is substantially reduced in most of
the AME tapes for the low tension high speed combination compared to the runs at
higher tensions. A reduction in the coefficient of friction at low tension runs indicates
that hydrodynamic effects are present when running the tapes through the tape drive.
A model of the head-tape interface developed by Elrod and Eshel (1965) explains
the hydrodynamic effect. The tape lifts off of the head, as the tape is moving due to the
development of a hydrodynamic air film. Head-tape spacing is directly proportional to
(V/T)2/3, where V is tape velocity and T is tension. Using this model one can see that
decreasing tension would increase head-tape spacing. Increasing speed would further
increase the head-tape spacing. An increase in head-tape spacing would reduce the real
area of contact between the head and tape surfaces and, conversely this leads to a
reduction in coefficient of friction.

- 68 -
Fig. 3.6 Summary of the coefficient of friction, peak-to-peak LTMP, peak-to-peak LTMM,
LTMP quality factor, and LTMM quality factor for the tension and speed combinations

- 69 -
used on all six tape samples
It should be noted that the MP and Thin MP tapes do not display the same level of
hydrodynamic effects as the AME tapes. While the low tension high speed runs for the
MP and Thin MP tapes are among the lower coefficient values for these tapes they do not
show the dramatic reduction that is present in the AME tapes. One possible reason for
this is that the surface roughness of MP tapes is considerably higher compared to AME
tapes and because of this the real area of contact would not change significantly with the
increased hydrodynamic effects present with low tension in MP tapes.
3.3.1.2. Peak-to-peak LTM
As discussed previously, peak-to-peak LTM is a measure of tape motion within
an individual cycle. The middle graphs in Fig. 3.6 display the peak-to-peak LTM results.
The left hand side shows the LTMP results, while the right hand side displays the LTMM
results. Before discussing specific results note that the amplitudes for LTMP and LTMM
are significantly different. This may be exp lained by the inclusion of the tape edge
profile, out of plane motion, and breathing (changing) of the cupping during cycling in
LTMP measurements.
When looking at the MP and Thin MP data for LTMP one can see that there is
little difference between the different tension and speed combinations. Shifting to the
LTMM results one does not see a lack of variation when looking at the different tension
and speed combinations. However, examining the results closely one can see that there is

- 70 -
not a discernable trend in this data. For example looking at the Thin MP data the low
tension low speed combination is higher than the high tension low speed data, but the low
tension high speed data is lower than the high tension high speed LTMM. This lack of
trend in the LTMM data illustrates what the LTMP data shows in that there is not an effect
on MP or Thin MP tape when varying the operating tension and speed. This was
previously found to be the case by Wright and Bhushan (2006) who explained that the
surface roughness of the MP tapes is sufficient enough to grip the head at all tension and
speed combinations.
One of the first things that can be noticed when looking at the LTMP data for
AME-NC Tape A is that the values are in general higher than the other tapes. Alfano and
Bhushan (2006b) hypothesized that the reason AME-NC Tape A shows an increase in
LTMP is two-fold in that it has a smooth surface and it suffers from a lack of edge
pinning due to its negatively cupped profile. Note that a general increase in LTMM
magnitude for AME-NC Tape A when compared to all other tapes is not as apparent as
the LTMP results, but for instance the LTMM data at nominal conditions is higher for
AME-NC Tape A than all other tapes. In addition to the general increase in LTM it is
clear that both LTMP and LTMM increase in AME-NC Tape A at low tension. The
prevailing reason for the increase in LTMP and LTMM is a continuation of the reasoning
for the general increase in these values. The use of low tension compounds the problem
of a lack of edge pinning and reduces the real area of contact leading to higher LTMP and

- 71 -
LTMM.
When one looks at the LTMP results for the positively cupped AME tapes one
sees first that the values at high tension and nominal conditions are sufficiently lower
than the AME-NC Tape A results. This can be seen in some moderation with the LTMM
results, as well. This suggests that at higher tensions the positively cupped AME tapes
have sufficient edge pinning. Next one can note that the LTMP results at low tension for
the positively cupped AME tapes all show an increase when compared to the results at
higher tension. However, it is easy to see that the increase in LTMP is greater for AME-
PC Tape A compared to AME-PC+ Tapes A or B. The reasoning behind this is that
AME-PC Tape A is basically flat and at low tension the tape would be in contact more
with its smooth surface instead of its edges. AME-PC+ Tape A and B have more
aggressive cupping which help to mitigate any increase in LTMP when operating under
low tension because of an increase in edge pinning. The LTMM results again confirm
that there is an increase for the positively cupped AME tapes. However, the increase in
LTMM at low tension is just as significant if not greater for AME-PC+ Tapes A and B
when compared to AME-PC Tape A. This suggests that the tape motion in the middle of
tape is increased at low tension regardless of the aggressiveness of the cupping. One
explanation for this may be that with the AME-PC+ Tape A and B samples a flexing of
the tape may occur around one of the pinned tape edges. This was first discussed by
Alfano and Bhushan (2006c). An illustration of this pivoting effect is shown in the left
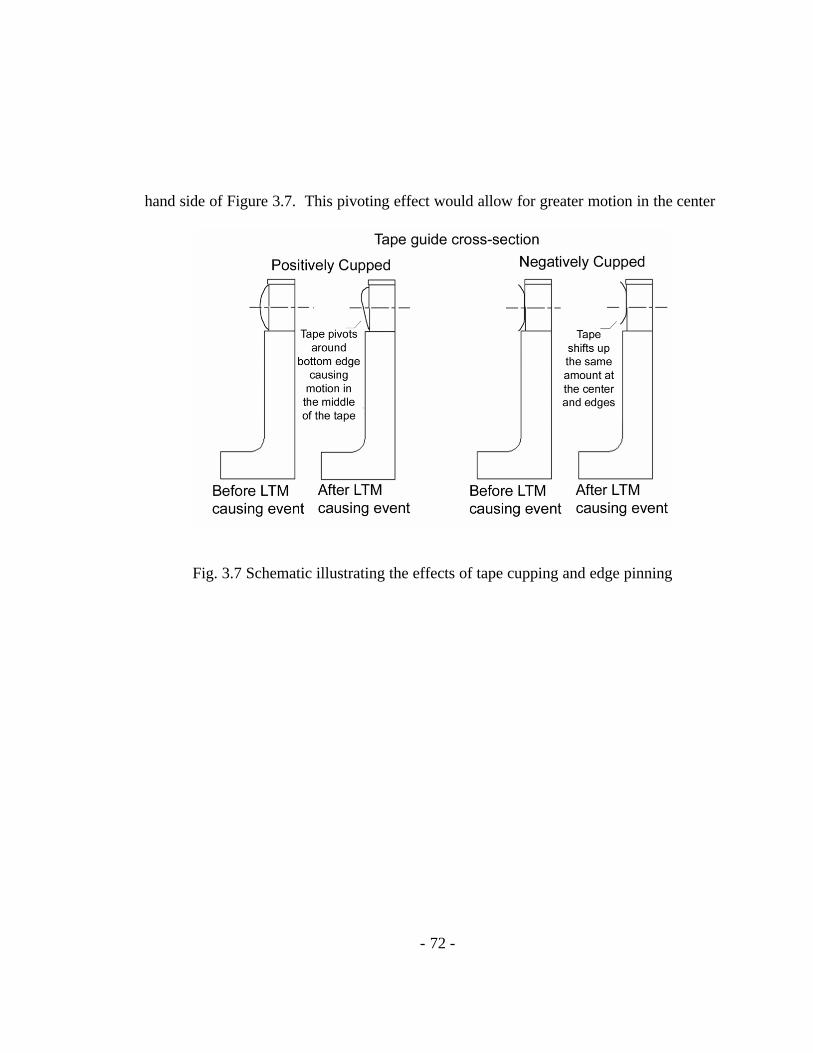
- 72 -
hand side of Figure 3.7. This pivoting effect would allow for greater motion in the center
Fig. 3.7 Schematic illustrating the effects of tape cupping and edge pinning

- 73 -
of the tape and would not necessarily be monitored as much in the LTMP measurements,
as the probe would be monitoring the bottom edge that remains in a similar position. As
the AME-PC Tape A sample is flat and lacks the edge pinning at low tensions the tape
would not pivot around a pinned edge. Instead the tape would move up and down
together similar to negatively cupped tapes.
The results of the peak-to-peak study show that any of the tape samples used
would be acceptable for future use with the exception of AME-NC Tape A. In terms of
LTM it would be highly desirable to use high tension. However, the use of high tension
may cause issues with tape wear and optimization of the overall tape performance would
be needed. Finally, note that varying speed does not appear to have a significant effect on
the LTMP and LTMM measurements.
A few comments should be made in regards to comparing peak-to-peak LTMP
and LTMM measurements. First when looking at the results one can see that the
overriding trends in the LTMP data exist in the LTMM data. MP and Thin MP tape both
show that varying tension does not impact either LTMP or LTMM measurements. Also,
for all of the AME tapes there is an increase in both the LTMP and LTMM measurements
when at low tension. However, there does not appear to be a direct correlation between
an LTMP measurement and an LTMM measurement. This can be illustrated by looking at
the data for AME-PC+ Tape A. The LTMP results show that the low tension low speed

- 74 -
measurement is lower than the low tension high speed data, but the opposite is true in the
LTMM data as the low tension high speed data is higher. This can lead to several
conclusions. First trends can be measured using either measuring technique. Second
there appears to be more variability in the magnetic signal technique. This could lead to
difficulty in identifying trends, or it could mean that the variability in LTM is inherent in
the tape drive system. Lastly, it is apparent that the probe data may see the overall trends,
but it does not capture the overall motion of the tape as clearly as the magnetic signal
technique. This may be due to the fact that the tape edge profile is masking some of the
actual motion, or that the probes cannot accurately pick things up like the tape pivoting
over one of the tape edges.
3.3.1.3. Non-repeatable LTM
Non-repeatable LTM is a measure of tape motion from cycle to cycle. Excessive
non-repeatable LTM could cause problems with the playback of previously written data
tracks. As an example, if something is written to the tape and then after a series of
cycling the tape through the drive so one can read or write other tracks the tape may shift
up or down providing limitations on the ability to have a particular data track read back.
As discussed previously, non-repeatable LTM will be reported in the form of a
measurement termed LTM quality factor. Figure 3.8 presents an example time window
plot that shows how the LTM quality factor is determined. At a specific point in time
(within a limited range, +/- 0.05 seconds) the maximum and minimum points of each

- 75 -
Fig. 3.8 Example of time window plot with illustration of LTM quality factor
measurement

- 76 -
cycle are plotted for both the probe and magnetic signal data. The LTM quality factor for
both LTMP and LTMM is taken as the maximum of all maximum values over the course
of the test multiplied by the appropriate calibration factor minus the minimum of all the
minimum values multiplied by the same appropriate calibration factor. If space permitted
time window plots for all tapes and all tension and speed combinations could be
presented. However, in the interest of brevity reverting back to Figure 3.6 the bottom
most graphs display the LTMP and LTMM quality factor results for all tension and speed
combinations on all six tapes.
Both the LTMP and LTMM quality factor results show the same overriding trend
of increased magnitude when the operating tension is low. This result shows that for all
tape samples used the variation from cycle to cycle is in all cases higher when operating
at low tension. The prevailing reason for this is that at low tension the tape samples do
not have ample edge pinning or surface roughness to secure the same position relative to
the head when the tape transport switches from reverse to forward pass, or vice versa.
While this reasoning intuitively makes sense, it must be noted that only one tape transport
was used in this study. It may be that this particular tape drive has poor tension
controlling when operating at low tensions. This could cause the tape transport to lose
tension during the switch from reverse to forward pass shifting the tape up or down.
However, if the tape transport used in this study has a problem with tension controlling at
low operating tensions it would be reasonable to think that tape drives used commercially

- 77 -
may have similar problems at low tensions. Finally, note that the quality factor results,
particularly the LTMM results, show a higher value in LTM quality factor when the
tension and speed are low compared to when the tension is low and the speed is high.
One final illustration of non-repeatable LTM is displayed in Figure 3.9. The
graphs on these plots show non-repeatable LTM for three different scenarios that
presented themselves throughout this study. Note that the data presented in the figure is
from runs at 4 m/s, but as the results have proven to be independent of speed they could
be from any of the speeds used. The non-repeatable LTM presented in this figure is
calculated by taking the maximum reading at a specific point in time during the forward
pass of a cycle and subtracting out the average maximum value found over the course the
test. This difference is then multiplied by the appropriate calibration factor and can be
taken as a deviation in terms of tape motion from the average position of the tape in the
test. The topmost example in this figure shows non-repeatable LTMP and LTMM that
varies from the average fairly significantly and has several large peaks. This example
typifies what occurred when using a tension of 0.5 N. Two scenarios presented
themselves when running the tape drive at 1.0 or 1.2 N. The first is shown in the middle
graph of this figure and depicts a variation from the mean that is much less severe than
that displayed when using 0.5 N. The second scenario depicts a long term shift in tape
position and is displayed in the bottom graph of this figure. This long term shift results
when the tape position shifts ever so slightly in the same direction cycle after cycle.

- 78 -
Fig. 3.9 Example non-repeatable LTM plots with three scenarios depicting the variability
of tape motion from cycle to cycle

- 79 -
Modern servo followers would not have difficulty adjusting for the small change in tape
position every cycle. That is not necessarily the case with the sudden and more severe
shifts displayed when the operating tension is low. Also of interest in this figure is that it
can be observed, particularly in the 0.5 N example that the non-repeatable LTMP and
LTMM appear to mirror each other. Finally, note that these non-repeatable LTM graphs
could be presented for all tension and speed combinations with all tape samples, but
space does not permit their inclusion. As averaging this data may lose some of its
effectiveness, Figure 3.9 is presented in an attempt to give examples in what occurs when
the operating conditions are varied.
3.3.2. Effect of tape position on LTM
The last portion of the study was completed to see if there was a difference in
LTMM measurements based on where the magnetic signal is written on the tape. In order
to complete this work a magnetic signal was written on the top and bottom portion of the
tape samples, approaching the edges, at each of the tension and speed combinations.
Figure 3.10 (a) displays the results for peak-to-peak LTMM at each combination of
tension and speed on each of the six tape samples. Each of the bar charts represents one
of the tension and speed settings and displays the results from the tests that were written
on the top and bottom portions of the tape. The results from the middle portion of the

- 80 -
Fig 3.10 (a) Summary of peak-to-peak LTMM measurements on the top and bottom edges
(b) Summary of the LTMM quality factor measurements on the top and bottom edges

- 81 -
tape are included for comparison and are the results that have previously been discussed
in this paper. Looking at the data on the basis of either a tension and speed setting or on
the results based on the type of tape there is a failure to find any sort of discernable trend
in the data. For instance if one looks at the 8 m/s 0.5 N data it is clear that for some of
the tapes the results on the edges are the same as they are on the middle portion of the
tape, but some of the results on the edges are higher or lower than those in the middle
portion. Again looking at all of the tension and speed combinations and only for instance
AME-PC Tape A one sees results that vary on the edges from being higher, lower, or
very similar to the results from the middle portion of the tape. This random variation
seems to hold true for all tension and speed settings and from tape to tape, which can be
an indication of the random nature of tape motion. Also note that there does not seem to
be a discernable difference between peak-to-peak LTMM in terms of being on the top or
bottom portion of the tape. This renders the conclusion that peak-to-peak LTMM is not
necessarily affected by physical position on the tape.
In addition to looking at peak-to-peak LTMM on the edges LTMM quality factor
was also monitored on the edges. Figure 3.10 (b) displays the results for LTMM quality
factor on the top and bottom portions of the tape. Again, the results for the middle
portion of the tape are those from previously discussed tests. Examining these results
shows a similar lack of discernable trend from tape to tape or between tension and speed
combination. Additionally there does not seem to be a difference between the top and
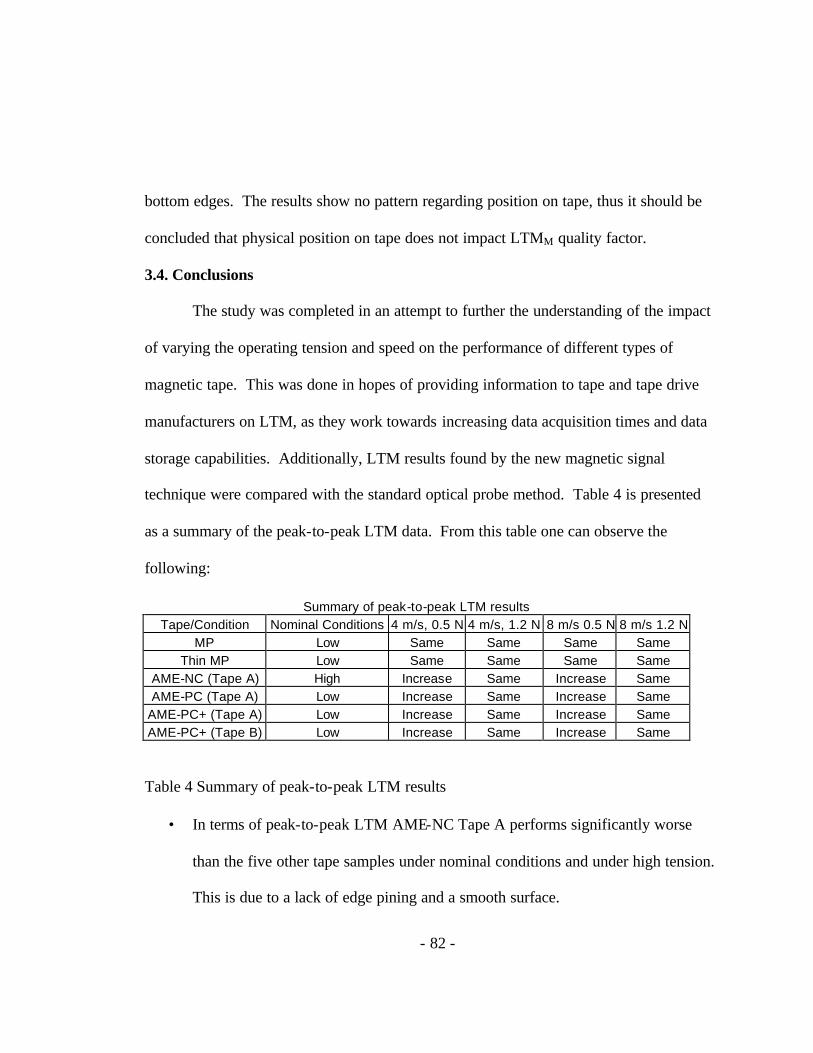
- 82 -
bottom edges. The results show no pattern regarding position on tape, thus it should be
concluded that physical position on tape does not impact LTMM quality factor.
3.4. Conclusions
The study was completed in an attempt to further the understanding of the impact
of varying the operating tension and speed on the performance of different types of
magnetic tape. This was done in hopes of providing information to tape and tape drive
manufacturers on LTM, as they work towards increasing data acquisition times and data
storage capabilities. Additionally, LTM results found by the new magnetic signal
technique were compared with the standard optical probe method. Table 4 is presented
as a summary of the peak-to-peak LTM data. From this table one can observe the
following:
Summary of peak-to-peak LTM results Tape/Condition Nominal Conditions 4 m/s, 0.5 N 4 m/s, 1.2 N 8 m/s 0.5 N 8 m/s 1.2 N
MP Low Same Same Same Same Thin MP Low Same Same Same Same
AME-NC (Tape A) High Increase Same Increase Same AME-PC (Tape A) Low Increase Same Increase Same
AME-PC+ (Tape A) Low Increase Same Increase Same AME-PC+ (Tape B) Low Increase Same Increase Same
Table 4 Summary of peak-to-peak LTM results
• In terms of peak-to-peak LTM AME-NC Tape A performs significantly worse
than the five other tape samples under nominal conditions and under high tension.
This is due to a lack of edge pining and a smooth surface.

- 83 -
• MP and Thin MP tapes are not affected in terms of peak-to-peak LTMP or LTMM
by varying the operating tension and speed.
• All of the AME tapes see an increase in peak-to-peak LTMP and LTMM when the
tension is lowered to 0.5 N. The increase is due to a combination of a lack of
surface roughness and tape edge pinning at low tension.
• The increase in LTMP at low tension is minimized in both of the AME-PC+
samples, as the more aggressive positive cupping provides more edge pinning.
• The same limitation in peak-to-peak data is not seen in LTMM data. One reason
for this may be that the edge pinning allows for the middle of the tape to pivot
around one of the edges.
• Varying speed does not seem to have a noticeable impact on peak-to-peak LTMP
or LTMM on the tapes used in this study.
In addition to these conclusions on peak-to-peak LTM, the following conclusions can be
drawn from this study:
• Varying tension and speed directly impacts the coefficient of friction values for
the AME tapes. This is caused by an increase in hydrodynamic effects.
• LTMP and LTMM quality factors are directly impacted when the operating tension
is lowered to 0.5 N for all of the tapes studied. This shows that at low tension the
tape moves considerably more from cycle to cycle.

- 84 -
• Results have failed to find any discernable difference in peak-to-peak LTMM and
LTMM quality factor for all tapes studied based on the portion of the tape that the
signal was written on.
• The LTMP and LTMM results have shown that the trends can be identified and
studied with either method. However, there does not appear to be a direct
correlation in comparing a specific LTMP value to a LTMM value. This can be
attributed to many causes including the LTMP values convolving tape edge profile
as motion and the probe not being able to accurately capture motion in the middle
of the tape due pivoting of the tape around one of the edges. For these reasons the
magnetic signal readback technique provides the truer measure of LTM.
Solely in terms of performance based on LTM any of the tapes studied with the
exception of AME-NC Tape A can be recommended for future use. It is highly preferred
that higher tensions be used when using these tapes and it appears that the tapes may be
used at high speeds of up to 8 m/s. However, high tension will have an adverse effect on
wear and optimization will be needed to ensure the best overall performance of the
magnetic tapes.

- 85 -
CHAPTER 4
SUMMARY
The drive for increased storage capacity in today’s magnetic tape cartridges has
created a continuing need to improve the understanding of the tribological performance
of magnetic tape. One important area of ongoing tribological research is lateral tape
motion (LTM). The importance of studying LTM will only continue to grow, as the
demands for more storage capacity move forward. The research presented in this thesis
has been conducted in an effort to improve the knowledge base with regards to LTM
generation. Specifically, the goal of the first study was to determine the effects different
operating parameters and types of tape had on LTM. The second study utilized a new
measuring technique based on the readback of a magnetic signal to further study the
effects varying operating tension and speed have on LTM.
Results from the first study showed that there were some differences in LTM
based on type of tape or the varied settings of operating parameters. Specifically,
negatively cupped AME tape was shown to have the highest LTMP. Varying tension was
shown to have an effect in some of the AME tapes, but not in the MP tapes. Head zenith
and wrap angle can affect LTMP, but the air pressure in the porous air bearings does not
appear to have an effect on LTMP. Finally, the bearing placement study and the

- 86 -
staggered pack study showed that increasing LTMP “downstream” minimally, if at all,
affects LTMP at the head.
Due to potential limitations in the optical probe method of LTM measurements a
new method described by Alfano and Bhushan (2006b) was utilized in determining the
effects varying tension and speed have on LTM in different types of tape. The findings
of this study show that varying tension and speed directly impacts the coefficient of
friction for AME tapes. The findings also show that peak-to-peak LTM is not affected in
MP tapes, but it is in AME tapes when the tension is lowered to 0.5 N. Non-repeatable
LTM increases in all tapes at low tensions. Changing operating speeds did not show a
noticeable impact on LTM.
When comparing the optical probe and magnetic signal methods of measuring
LTM it is apparent that both methods accurately follow the trends, however there does
not seem to be a direct relation between the two. The optical probe method may
convolve tape edge contour as motion and it seems that it is not able to accurately capture
motion in the middle of the tape due to pivoting of the tape around one of the edges. This
shows that the magnetic signal method provides a more accurate measurement of LTM.
Lastly, from the conclusions of this study it is recommended that in terms of
minimizing LTM any of the tapes studied with the exception of negatively cupped AME
tape can be used. In regards to LTM it is highly recommended that higher tensions be
used with these tapes. Also, speed does not noticeably impact LTM, so higher speeds

- 87 -
may be used in future tape drives. Note however, that the use of high tension may have a
negative effect on wear, thus optimization will be needed to produce the best overall
performance of the magnetic tapes.

- 88 -
LIST OF REFERENCES
Alfano, A.D. and Bhushan, B. (2006a), “Failure Mechanisms of Advanced Metal Evaporated Tape in an Advanced Linear Tape Drive,” Tribol. Trans., 49, pp 79-91. Alfano, A.D. and Bhushan, B. (2006b), “New technique for monitoring lateral tape motion using a magnetic signal,” Microsyst. Technol., 12, pp 565-570. Alfano, A.D. and Bhushan, B (2006), “Magnetic evaluation of advanced metal evaporated tape in an advanced linear tape drive,” J. Magn. Magn. Mater. (in press). Beauchamp, K. G. and Yuen, C. K. (1979), Digital Methods for Signal Analysis, George Allen & Unwin LTD, London, pp 140-141. Bhushan, B. (1996), Tribology and Mechanics of Magnetic Storage Devices, 2nd Edition, Springer, New York. Bhushan, B. (2000), Mechanics and Reliability of Flexible Magnetic Media, 2nd Edition, Springer, New York. Elrod, H.G. and Eshel, A., (1965), “The Theory of the Infinitely Wide, Perfectly Flexible, Self-Acting Foil Bearing,” Trans. ASME, J. Basic Eng. 87, pp 831-836. Gavit, S.E. (1998), Tape transport apparatus incorporating porous air bearings. US Patent No. 5,777,823, July 7. Goldade, A. and Bhushan, B. (2003), “Measurement and Origin of Edge Damage in a Linear Tape Drive,” Tribol. Lett. 14, pp 167-180.

- 89 -
Goldade, A. and Bhushan, B. (2004), “Tape Edge Study in a Linear Tape Drive with Single-Flanged Guides,” J. Magn. Magn. Mater. 271, pp 409-430. Goldade, A.V. and Bhushan, B. (2005), “Durability Studies of Metal Evaporated Tapes in a Linear Tape Drive: Role of Head Contour and Tape Tension,” Microsyst. Technol., 11, pp 32-47. Hansen, W.S. and Bhushan, B. (2004), “ Effects of operating speed and tension and sources of lateral tape motion in a linear tape drive,” J. Magn. Magn. Mater. 293, pp 826-848. Luitjens, SB., Stupp SE. and Lodder, JC., (1996), “Metal evaporated tape: state of the art and prospects,” J. Magn. Magn. Mater., 155, pp 261-265. Mee, C.D. and Daniel, E.D. (1996), Magnetic Recording Technology, 2nd Edition, McGraw-Hill, New York. Scott, W.W. and Bhushan, B. (2003), “Measurement and Prediction of Tape Cupping under Mechanical and Hygrothermal Loads and its Influence on Debris Generation in Linear Tape Drives,” ASME J. Tribol., 125, pp 364-376. Topoleski, J. J. and Bhushan, B. (2000), "Qualitative and Quantitative Evaluation of the Quality of Factory-Slit Magnetic Tape Edges," J. Inf. Storage Proc. Syst., 2, 109-116. Wright, A.E. and Bhushan, B. (2006), “Effects of different magnetic tapes and operating parameters on lateral tape motion in a linear tape drive,” Tribol. Trans., 49.