Embed Size (px)
Citation preview

Sample to Insight
Application Note
Effects of low A260/A230 ratios in RNA preparations on downstream applications
The efficiency of applications such as real-time RT-PCR and RNA-seq depends strongly on the
purity of the RNA sample used. To assess RNA purity, the absorbance of RNA at 260 nm and the
absorbance of potential contaminants at 280 nm or 230 nm was determined by spectroscopic
measurement (e.g., QIAxpert® or NanoDrop®). An A260/A280 ratio of 1.8–2.1 at pH 7.5 is widely
accepted as indicative of highly pure RNA. Pure RNA should also yield an A260/A230 ratio of
around 2 or slightly higher; however, there is no consensus on the acceptable lower limit of this
ratio. Also, it has not been fully established which contaminants contribute to a low A260/A230
ratio. Possible candidates include salt, carbohydrates, peptides and aromatic compounds such as
phenol (1, 2). In our experience, increased absorbance at 230 nm in RNA samples is almost
always due to contamination by guanidine thiocyanate, a salt which absorbs very strongly at
220–230 nm and can be present at very high concentrations in the lysis buffer or extraction
reagent (e.g., TRIzol®) used in most RNA purification procedures. Our experiments showed that
the A260/A230 ratio of an RNA sample is strongly reduced when guanidine thiocyanate is present
even at submillimolar concentrations (Figure 1A). However, we also found that concentrations
of guanidine thiocyanate of up to 100 mM in an RNA sample do not compromise the reliability
of real-time RT-PCR, even when using PCR chemistries that are sensitive to inhibitors (Figure 1B).
Similar observations have been reported by other researchers (3).
Figure 1. Effect of guanidine salt concentration on the A260/A230 ratio and real-time RT-PCR. (A) Ratio of A260 to A230 for RNA samples (50 ng/μl) containing 0.03–100 mM guanidine hydrochloride (GuHCl) or 0.01–30 mM guanidine thiocyanate (GITC). (B) CT values obtained from real-time one-step RT-PCR using a TaqMan® Gene Expression Assay for beta-actin and a master mix from Supplier AII. The reaction volume was 25 μl, and the template was either 1 μl or 2 μl of a 50 ng/μl RNA sample containing 0.3–1000 mM guanidine salt.
2.5
2.0
1.5
1.0
0.5
0.0
A260/A230
0.01 0.1 1 10 100
Guanidine salt (mM)
A
GITCGuHCI
B
CT value
40
35
30
25
20
150 1 10 100 1000
Guanidine salt (mM)
GITC 1 µlGITC 2 µlGuHCI 1 µlGuHCI 2 µl
2.5
2.0
1.5
1.0
0.5
0.0
A260/A230
0.01 0.1 1 10 100
Guanidine salt (mM)
A
GITCGuHCI
B
CT value
40
35
30
25
20
150 1 10 100 1000
Guanidine salt (mM)
GITC 1 µlGITC 2 µlGuHCI 1 µlGuHCI 2 µl

2 Effects of low A260/A230 ratios in RNA preparations on downstream applications 01/2018
Impact of RNA concentration and contaminants on the A260/A230 ratio
When establishing a suitable lower limit for the A260/A230 ratio, it is important to remember that this
ratio (and other absorbance ratios in general) also depends on RNA concentration. Trace amounts
of contaminants will have virtually no effect on the ratio if the RNA is at a high concentration, but
will have a major impact on the ratio if the RNA concentration is low. However, the most important
factor is the amount of contaminant that is transferred to the downstream reaction (e.g., cDNA
synthesis), rather than the absorbance ratio.
Example with low mass input samples
A low A260/A230 ratio can also be influenced by a low starting sample amount in the RNA extraction
procedure, leading to a low concentrated RNA sample after extraction. Despite recommendations
to use a certain amount of starting material, sometimes the amount is limited due to the source of
material or availability (e.g., tissue, biopsies, etc.). Smaller sample amounts can therefore result in
lower A260/A230 ratios in comparison to recommended starting amounts. The RNA samples below
(from 5 or 0.5 mg brain extracted using the miRNeasy Micro Kit either manually or a QIAcube®
for automated purification procedure) had a normal A260/A280 ratio around 1.8–2.1, but reduced
A260/A230 ratios especially for the 0.5 mg samples (Table 1). The A260/A230 ratios for the low mass
input samples were within 0.8–1.5.
A low A260/A230 ratio does not influence downstream applications
Although the A260/A230 ratio is low, no influence or inhibition is observed in downstream applications,
such as RT-PCR (Figure 2A). In our experiments, the real-time PCR run for the samples with a low
A260/A230 ratio resulted in typical amplification (Figure 2B) and melting curves (Figure 2C). The
ΔCT for both sample input amounts was approximately 3.3, independent of the extraction procedure.
Although this analysis was performed using real-time RT-PCR, similar conclusions apply to microarray
analysis and other applications that rely on cDNA synthesis as the first step — the step that is the
most influenced by contaminants.
Table 1. Effect of standard and low mass sample input on A260/A230 ratio calculated from absorbance measurements made on a Nanodrop® spectrophotometer. RNA from different amounts of brain tissue were extracted using the miRNeasy® Mini Kit either manually or on the QIAcube.
OD 280 nm OD 260 nm A260/A280 A260/A230 ng/μl Vol. Yield Mw Std. Dev.
5 mg
QIAcube10.653 5.159 2.06 1.81 426.1 13.5 5.752
5.731 0.02210.573 5.139 2.06 1.81 422.9 13.5 5.709
Manual 10.089 4.889 2.06 1.75 403.6 11.5 4.6414.702 0.060
10.354 5.05 2.05 1.95 414.1 11.5 4.762
0.5 mg
QIAcube1.036 0.512 2.02 1.51 41.46 14.5 0.601
0.615 0.0141.122 0.576 1.95 0.85 44.87 14.0 0.628
Manual1.25 0.625 2 1.29 50.02 11.5 0.575
0.647 0.0721.563 0.88 1.78 0.89 62.54 11.5 0.719

QIAxpert® and Spectral Content Profiling
The QIAxpert is an innovative µ-volume UV/Vis spectrophotometer that overcomes limitations of
classic spectrophotometry and purity assessment using absorbance ratios.
Using reference spectra of known contaminants, a state of the art software algorithm on the
QIAxpert instrument performs a deconvolution of measured UV/Vis spectra according to the Beer
Lambert law for mixtures, stating that the absorption spectrum of a mixture is a linear combination
of the spectra of its individual constituents. This feature, known as Spectral Content Profiling
(SCP), allows dye-free and easy differentiation between DNA, RNA and other UV/Vis absorbing
contaminants in complex biological samples.
The QIAxpert enables yield and purity assessment in a single measurement while offering accurate
dye-free DNA, RNA fractions quantification irrespective of the buffering conditions and assessment
of the amount of contributing quantities of co-purified substances including sample turbidity,
contaminating nucleic acids, phenol and other contaminants present in the sample. Our experiments
showed that it is possible to get reliable RNA quantification despite increasing guanidine thiocyanate
contamination and decreasing A260/A230 ratios in 50 ng/µl RNA (Figure 3). However, guanidine
thiocyanate in RNA in applied concentrations for QIAxpert measurements had no influence on
CT values obtained with real-time one-step RT-PCR (Figure 1B).
Effects of low A260/A230 ratios in RNA preparations on downstream applications 01/2018 3
Figure 2. Detection of mir16 in a SYBR® Green RT-PCR Assay. (A) CT values obtained from real-time one-step RT-PCR using a miScript® Gene Expression Assay for mir16. The same sample template volumes were used for all reactions. (B) Amplification plots and (C) melting curves showed comparable curves and a single melting peak, indicating homogeneous amplification.
0.1
0.01
0.001
0.0001
ΔRn
2 4 8 10 12 146 16 18 20 22 24 26 28 30 32 34 36 38 40
Cycle
Ampli�cation Plot Melt Curve PlotB
A
0.20
0.24
0.19
0.14
0.09
0.04
DerivativeReporter (–Rn)
70.065.0 80.0 85.0 90.0 95.0
Tn: 76.4
C
75.0
CT sample 1 CT sample 2 Mw Std. Dev
5 mgQIAcube 14.569 14.318 14.444 0.126
Manual 14.409 14.323 14.366 0.043
0.5 mgQIAcube 17.769 18.068 17.919 0.150
Manual 17.697 17.612 17.655 0.043

Note: Some sources have reported that the absorbance maximum for guanidine thiocyanate is
around 260 nm (4), which is similar to that for RNA (Figure 4A). This observation appears to be due
to a saturation effect on the Nanodrop spectrophotometer at high concentrations of the salt, about
10–1000 times higher compared to what may be observed in RNA isolated by GTC-based
methods (Figure 4A). This would incorrectly lead to an optimal A260/A230 ratio and an overestimation
of RNA concentration at high GITC contamination on a Nanodrop. At moderate or low salt
concentrations, the absorbance maximum is around 220–230 nm, leading to low A260/A230 values.
On other spectrophotometers, such as the SpectraMax® or the QIAxpert, the right shoulder of the
GITC absorption spectrum shifts to the right at higher concentrations, due to saturation, while the
absorbance maximum remains below 230 nm wavelength (Figure 4B–C). In conclusion, while
QIAxpert can estimate RNA concentrations precisely despite moderate contamination with GITC
(Figure 3), at very high GITC concentrations, QIAxpert and SpectraMax would overestimate
RNA concentrations with low A260/A230 values. The Nanodrop would also overestimate RNA
concentration and incorrectly show good A260/A230 values.
4 Effects of low A260/A230 ratios in RNA preparations on downstream applications 01/2018
Figure 3. QIAxpert measurements with RNA. RNA concentration and purity were measured on QIAxpert with and without spiked-in guanidine thiocyanate contamination. (Top) Results table and (bottom) spectral content profiling spectra, showing total measured spectrum (black); RNA spectrum (blue); impurities spectrum, including guanidine thiocyanate (orange); residues (yellow); and background (gray). The RNA concentration was the same regardless of increasing guanidine thiocyanate contamination.
Position
Sample name
RNA (ng/μl)
Nucleic acids (ng/μl)
Impurities (A260)
Background (A260)
Residue (%)
A260
A260/A280
A260/A230
A1 RNA 49.9 49.9 0.00 1.10 1.10 1.24 1.80 2.34
B1 RNA + 0.3 mM GITC 50.9 50.9 0.00 0.74 0.74 1.28 2.06 0.74
C1 RNA + 0.6 mM GITC 50.7 50.7 0.02 0.96 0.96 1.28 2.03 0.54
1.4
1.2
1.0
0.8
0.6
0.4
0.2
0.0230 260 290 320 350
Wavelength (nm)
Absorbance (10 mm)
A1 (RNA)
1.4
1.2
1.0
0.8
0.6
0.4
0.2
0.0230 260 290 320 350
Wavelength (nm)
Absorbance (10 mm)
B1 (RNA + 0.3 mM GITC)
1.4
1.2
1.0
0.8
0.6
0.4
0.2
0.0230 260 290 320 350
Wavelength (nm)
Absorbance (10 mm)
C1 (RNA + 0.6 mM GITC)
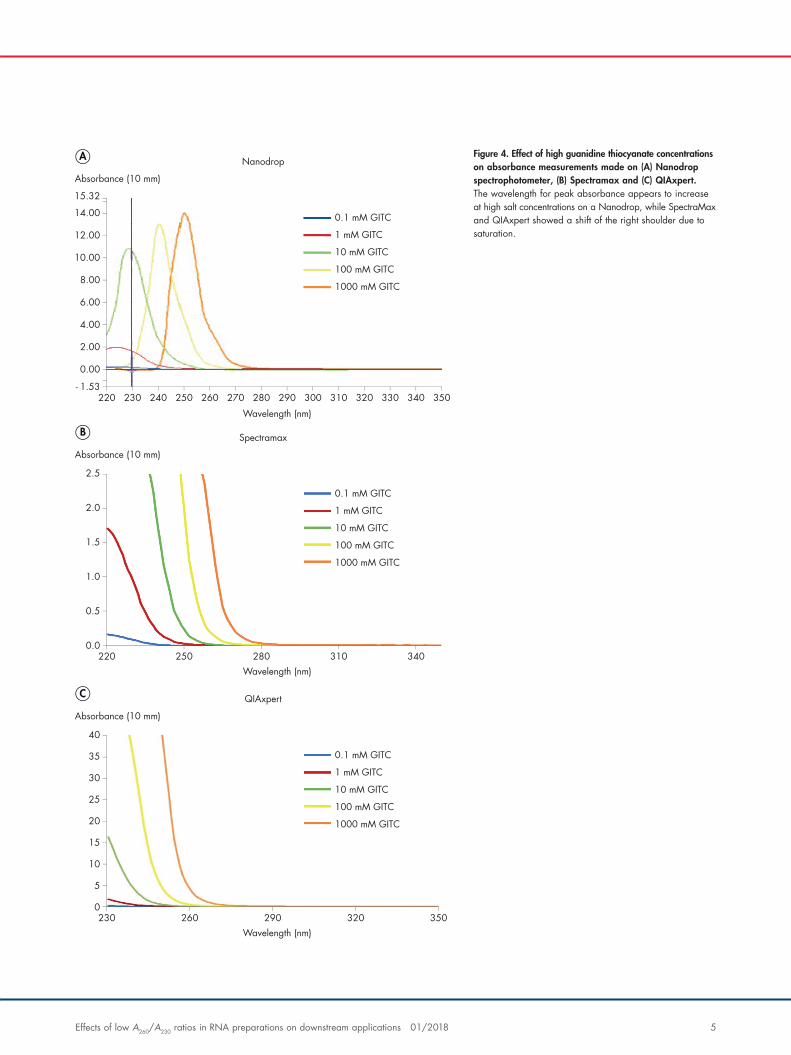
Figure 4. Effect of high guanidine thiocyanate concentrations on absorbance measurements made on (A) Nanodrop spectrophotometer, (B) Spectramax and (C) QIAxpert. The wavelength for peak absorbance appears to increase at high salt concentrations on a Nanodrop, while SpectraMax and QIAxpert showed a shift of the right shoulder due to saturation.
Effects of low A260/A230 ratios in RNA preparations on downstream applications 01/2018 5
B
A
15.32
14.00
12.00
10.00
8.00
6.00
4.00
2.00
0.00
Absorbance (10 mm)
Wavelength (nm)
Wavelength (nm)
240230220 260 270 280 290 300 310 320 330 340 350
0.1 mM GITC
1 mM GITC
10 mM GITC
100 mM GITC
1000 mM GITC
C
250- 1.53
2.5
2.0
1.5
1.0
0.5
0.0
Absorbance (10 mm)
220 280 310 340
0.1 mM GITC
1 mM GITC
10 mM GITC
100 mM GITC
1000 mM GITC
250
Wavelength (nm)
40
35
30
25
20
15
10
5
0
Absorbance (10 mm)
230 290 320 350
0.1 mM GITC
1 mM GITC
10 mM GITC
100 mM GITC
1000 mM GITC
260
Nanodrop
Spectramax
QIAxpert
1112167 01/2018
For up-to-date licensing information and product-specific disclaimers, see the respective QIAGEN kit handbook or user
manual. QIAGEN kit handbooks and user manuals are available at www.qiagen.com or can be requested from QIAGEN
Technical Services or your local distributor.
Visit www.qiagen.com/geneglobe.
Trademarks: QIAGEN®, Sample to Insight®, QIAcube®, QIAxpert®, QIAzol®, MinElute®, miScript®, QuantiTect®, RNeasy® (QIAGEN Group); TaqMan® (Roche Group); Nanodrop® (Thermo Fisher Scientific); SpectraMax® (Molecular Devices, LLC); SYBR® (Life Technologies Corporation); TRIzol® (Molecular Research Center, Inc.). Registered names, trademarks, etc. used in this document, even when not specifically marked as such, are not to be considered unprotected by law.
© 2018 QIAGEN, all rights reserved. 1112167 PROM-11827-001
Ordering www.qiagen.com/shop Technical Support support.qiagen.com Website www.qiagen.com
Ordering Information
Product Contents Cat. no.
miRNeasy Micro Kit (50) For 50 total RNA preps: 50 RNeasy MinElute® Spin Columns, Collection Tubes (1.5 ml and 2 ml), QIAzol® Lysis Reagent, RNase-Free Reagents and Buffers
217084
QIAcube (110 V) Robotic workstation for automated purification of DNA, RNA, or proteins using QIAGEN spin-column kits: includes 1-year warranty on parts and labor
9001292
QIAxpert QIAxpert instrument with 1 year warranty coverage including parts, labor and shipping
9002340
miRNA16miScript Primer Assay (100) 10x miScript Primer Assay (contains one miRNA-specific primer) Varies
miScript II RT Kit (12) For 12 cDNA synthesis reactions: miScript Reverse Transcriptase Mix, 10x miScript Nucleics Mix, 5x miScript HiSpec Buffer, 5x miScript HiFlex Buffer, RNase-Free Water
218160
miScript SYBR Green PCR Kit (200) For 200 reactions: QuantiTect® SYBR Green PCR Master Mix, miScript Universal Primer
218073
References
1. Teare JM, Islam R, Flanagan R, Gallagher S, Davies MG, Grabau C. (1997) Measurement of nucleic acid concentrations using the DyNA Quant and the GeneQuant. Biotechniques. 6, 1170. www.bcm.edu/mcfweb/?PMID=3100
2. Gallagher SR. Quantitation of DNA and RNA with absorption and fluorescence spectroscopy. (2011) Curr Protoc Mol Biol. 10.1002/0471140864.psa04ks52.
3. Cicinnati, V.R., Shen, Q., Sotiropoulos, G.C., Radtke, A., Gerken, G., and Beckebaum, S. (2008) Validation of putative reference genes for gene expression studies in human hepatocellular carcinoma using real-time quantitative RT-PCR. BMC Cancer. 8, 350.
4. Thermo Scientific (2010). T042‐Technical Bulletin NanoDrop Spectrophotometers, 260/280 and 260/230 Ratios [online].