Embed Size (px)
Citation preview
EFFECTS OF LIVESTOCK GRAZING MANAGEMENT ON THE ECOLOGY OF
GRASSLAND BIRDS AND THEIR PREDATORS IN A NORTHERN MIXED-
GRASS PRAIRIE ECOSYSTEM
by
Skyler Thomas Vold
A thesis submitted in partial fulfillment
of the requirements for the degree
of
Master of Science
in
Animal and Range Sciences
MONTANA STATE UNIVERSITY
Bozeman, Montana
April 2018

©COPYRIGHT
by
Skyler Thomas Vold
2018
All Rights Reserved
ii
DEDICATION
The majority of my study area was located on privately-owned rangelands
managed by local ranchers and ranch families for cattle grazing. I cannot express enough
gratitude to these kind folks for allowing us access to their lands to conduct our research.
Not only did they grant land access, they invited us into their homes and showed us
friendship, offered their assistance when we ran into issues in the field, and provided their
expertise and insight regarding sustainable rangeland management practices, attained
through many years of cattle ranching. In this regard, I would like to personally thank
Ron Whited and family, Jason Papineau and family, Duane Ullman, Will McCament,
Craig Iverson, Scott Pippert and family, Tim Franzen and family, Greg Pennington and
family, Connie Buxbaum and family, and Scott Buxbaum.

iii
ACKNOWLEDGEMENTS
The success of this project would not have been possible without the collaboration
and concern of many outstanding individuals. I would like to express the utmost gratitude
to my graduate advisor, Dr. Lance McNew, for his mentorship, encouragement, and
support during the past few years. Lance has always made himself available to help me,
continually pushed me for my best quality work, and deserves much of the credit for
shaping my professional career in the field of wildlife ecology and research. I would like
to acknowledge and thank my graduate committee members, Dr. Lorelle Berkeley and
Dr. Bok Sowell, for their advice, thoughtful conversations, and constructive feedback
during my time as a graduate student.
I thank my graduate colleague on this project, Megan Milligan, for her invaluable
assistance and guidance during field and lab work, and cherished friendship during our
graduate careers. I would also like to thank my other graduate student colleagues in the
Wildlife Habitat Ecology Lab for their friendship and support. I must acknowledge the
exceptional technicians who assisted with data collection during field and lab work, and
thank them for their efforts: Kyla Bas, Adrian Cain, Drew Howing, Elisabeth Krieger,
John Landsiedel, Joshua Luft, Lara Macon, Jessica Majors, and Chris Smith. Finally, I
thank my family and friends for their continual support of my graduate studies and
interest in my research.
Funding for this project was provided by the Montana Department of Fish,
Wildlife, and Parks (FWP). This project would not have been possible without initial
project development and outreach from John Ensign and Melissa Foster, FWP Region 7.
iv
TABLE OF CONTENTS
1. INTRODUCTION AND LITERATURE REVIEW .......................................................1
Current and Historical Ecology of North America’s Grasslands .....................................1
Importance of North American Rangelands to Native Grassland Wildlife .....................3
Spatial Variability among Prairie Ecosystems Drives Management ...............................7
Conclusion .....................................................................................................................12
2. EFFECTS OF LIVESTOCK GRAZING MANAGEMENT ON THE ECOLOGY
OF GRASSLAND BIRDS IN A NORTHERN MIXED-GRASS PRAIRIE
ECOSYSTEM ...............................................................................................................14
Introduction ....................................................................................................................16
Study Area .....................................................................................................................22
Methods..........................................................................................................................24
Sampling ................................................................................................................24
Grazing Systems Descriptions ...................................................................25
Statistical Analyses ................................................................................................32
Grassland Bird Community Composition ..............................................................37
Evaluation of Grazing System on Local Vegetation Conditions ...........................38
Results ............................................................................................................................38
Grasshopper Sparrow .............................................................................................39
Vesper Sparrow ......................................................................................................44
Western Meadowlark .............................................................................................49
Grassland-associated Species .................................................................................54
Grassland Bird Community Composition ..............................................................59
Effects of Grazing System on Local Vegetation Conditions .................................63
Discussion ......................................................................................................................65
Management Implications ..............................................................................................76
3. EFFECTS OF LIVESTOCK GRAZING MANAGEMENT ON THE
OCCUPANCY OF MESOCARNIVORES IN A NORTHERN MIXED-
GRASS PRAIRIE ECOSYSTEM .................................................................................80
Introduction ....................................................................................................................82
Study Area .....................................................................................................................87
Methods..........................................................................................................................89
Field Sampling .......................................................................................................89
Habitat Evaluation .................................................................................................93
Statistical Analyses ................................................................................................96
Results ..........................................................................................................................100
Detection ..............................................................................................................100

v
TABLE OF CONTENTS CONTINUED
Habitat Conditions ...............................................................................................101
Management-level................................................................................................102
Discussion ....................................................................................................................104
Management Implications ............................................................................................111
4. CONCLUSIONS AND MANAGEMENT RECOMMENDATIONS ........................114
REFERENCES CITED ....................................................................................................123
APPENDICES .................................................................................................................144
APPENDIX A: Pasture Locations within the Study Area ...................................145
APPENDIX B: Ecological Sites and Associated Rangeland Production
Potential Values within the Study Area .....................................147
APPENDIX C: Grassland Bird Species List .......................................................149
APPENDIX D: Grassland Bird Model Selection Results....................................152
APPENDIX E: Predictions of Grassland Bird Detection Probabilities ...............160
APPENDIX F: Grassland Bird Standardized Covariate Estimates .....................165
APPENDIX G: Evaluation of Vegetation Conditions among Grazing
Treatments ..................................................................................169
APPENDIX H: Mesocarnivore Model Selection Results ....................................174
vi
LIST OF TABLES
Table Page
1. Size of Study Area Pastures in Eastern Montana, and Number of
Bird Survey Points within Each Pasture, 2016–17 ..........................................25
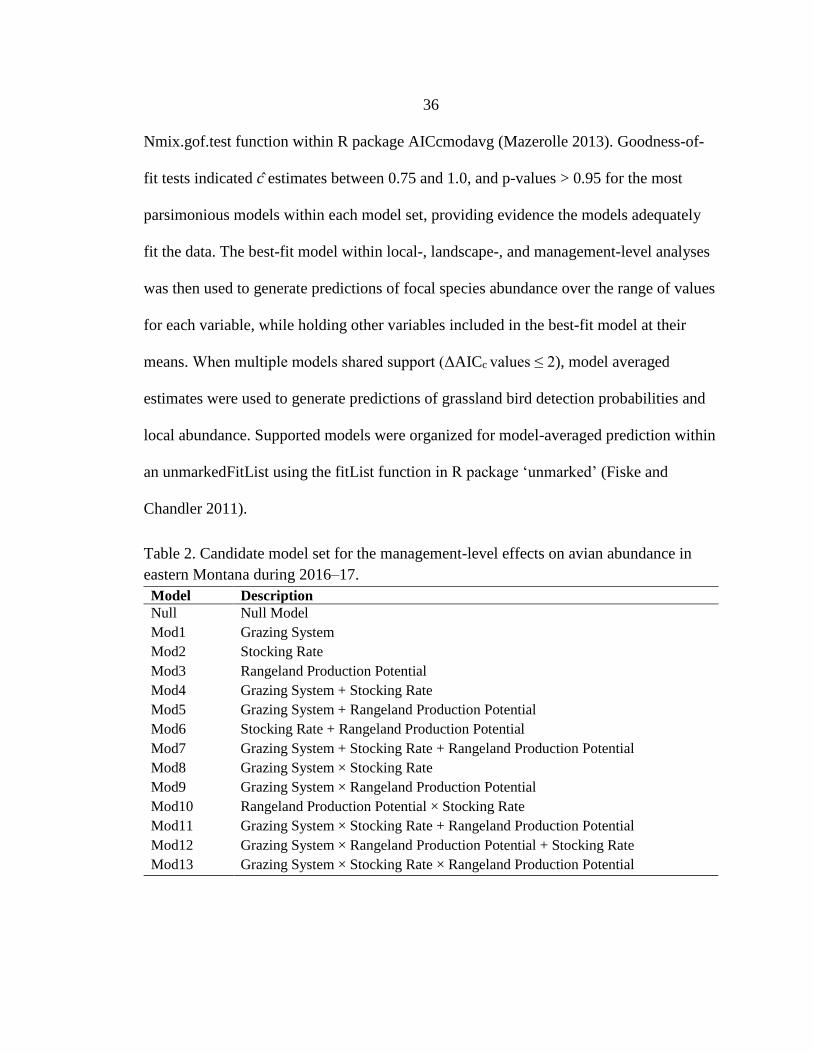
2. Candidate Model Set for the Management-level Effects on Avian
Abundance in Eastern Montana, 2016–17 .......................................................36
3. Size of Study Area Pastures in Eastern Montana, and Number of
Mesocarnivore Camera Traps within Each Pasture, 2016–17 .........................90
4. Sampling Periods for Mesocarnivore Camera Trapping in Eastern
Montana, 2016–17 ...........................................................................................91
5. Candidate Model Set for the Management-level effects on
Mesocarnivore Occupancy in Eastern Montana, 2016–17 ..............................98
6. Standardized Covariate Estimates for the Top Models Describing
Mesocarnivore Detection Probability and Occupancy in Eastern
Montana, 2016–17 .........................................................................................101
vii
LIST OF FIGURES
Figure Page
1. Study Area and Bird Survey Locations in Richland County,
Montana, and McKenzie County, North Dakota, USA, 2016–17 ...................28
2. Effects of Local- and Landscape-scale Habitat Conditions on
Predicted Abundance of Grasshopper Sparrow in Eastern
Montana, 2016–17 ..........................................................................................41
3. Effects of Rangeland Production Potential on Predicted
Abundance of Grasshopper Sparrow among Grazing
Systems in Eastern Montana, 2016–17 ...........................................................43
4. Effects of Stocking Rate on Predicted Abundance of
Grasshopper Sparrow among Grazing Systems in Eastern
Montana, 2016–17 ..........................................................................................44
5. Effects of Local- and Landscape-scale Habitat Conditions
on Predicted Abundance of Vesper Sparrow in Eastern
Montana, 2016–17 ..........................................................................................46
6. Effects of Rangeland Production Potential on Predicted
Abundance of Vesper Sparrow among Grazing Systems
in Eastern Montana, 2016–17 .........................................................................48
7. Effects of Stocking Rate on Predicted Abundance of Vesper
Sparrow among Grazing Systems in Eastern Montana,
2016–17 ...........................................................................................................49
8. Effects of Local- and Landscape-scale Habitat Conditions
on Predicted Abundance of Western Meadowlark in
Eastern Montana, 2016–17 .............................................................................51
9. Effects of Rangeland Production Potential on Predicted
Abundance of Western Meadowlark among Grazing Systems
in Eastern Montana, 2016–17 .........................................................................53
10. Effects of Stocking Rate on Predicted Abundance of Western
Meadowlark among Grazing Systems in Eastern Montana,
2016–17 ...........................................................................................................54
viii
LIST OF FIGURES CONTINUED
Figure Page
11. Effects of Local- and Landscape-scale Habitat Conditions
on Predicted Abundance of Grassland-associated Species
in Eastern Montana, 2016–17 .........................................................................56
12. Effects of Rangeland Production Potential on Predicted
Abundance of Grassland-associated Species among
Grazing Systems in Eastern Montana, 2016–17 .............................................58
13. Effects of Stocking Rate on Predicted Abundance of
Grassland-associated Species among Grazing Systems
in Eastern Montana, 2016–17 .........................................................................59
14. Grassland Bird Community Composition among Grazing
Systems in Eastern Montana, 2016–17 ...........................................................61
15. Grassland Bird Community Composition among Treatments
within the Rest-Rotation Grazing System in Eastern Montana,
2016–17 ...........................................................................................................62
16. Study Area and Mesocarnivore Camera Trap Sites in Richland
County, Montana, and McKenzie County, North Dakota, USA,
2016–17............................................................................................................92
17. Effects of Habitat Conditions on Predicted Occupancy of
Mesocarnivores in Eastern Montana, 2016–17 .............................................103
18. Effects of Stocking Rate on Predicted Occupancy of
Mesocarnivores among Grazing Systems in Eastern
Montana, 2016–17 ........................................................................................104
ix
ABSTRACT
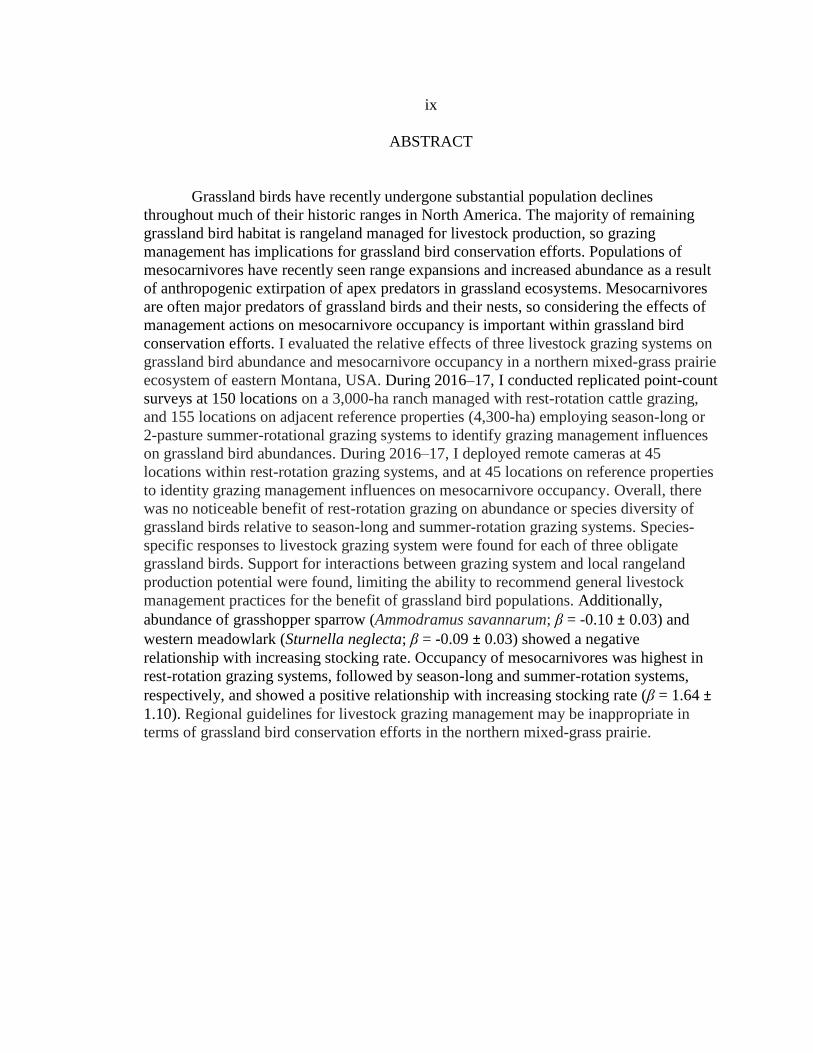
Grassland birds have recently undergone substantial population declines
throughout much of their historic ranges in North America. The majority of remaining
grassland bird habitat is rangeland managed for livestock production, so grazing
management has implications for grassland bird conservation efforts. Populations of
mesocarnivores have recently seen range expansions and increased abundance as a result
of anthropogenic extirpation of apex predators in grassland ecosystems. Mesocarnivores
are often major predators of grassland birds and their nests, so considering the effects of
management actions on mesocarnivore occupancy is important within grassland bird
conservation efforts. I evaluated the relative effects of three livestock grazing systems on
grassland bird abundance and mesocarnivore occupancy in a northern mixed-grass prairie
ecosystem of eastern Montana, USA. During 2016–17, I conducted replicated point-count
surveys at 150 locations on a 3,000-ha ranch managed with rest-rotation cattle grazing,
and 155 locations on adjacent reference properties (4,300-ha) employing season-long or
2-pasture summer-rotational grazing systems to identify grazing management influences
on grassland bird abundances. During 2016–17, I deployed remote cameras at 45
locations within rest-rotation grazing systems, and at 45 locations on reference properties
to identity grazing management influences on mesocarnivore occupancy. Overall, there
was no noticeable benefit of rest-rotation grazing on abundance or species diversity of
grassland birds relative to season-long and summer-rotation grazing systems. Species-
specific responses to livestock grazing system were found for each of three obligate
grassland birds. Support for interactions between grazing system and local rangeland
production potential were found, limiting the ability to recommend general livestock
management practices for the benefit of grassland bird populations. Additionally,
abundance of grasshopper sparrow (Ammodramus savannarum; β = -0.10 ± 0.03) and
western meadowlark (Sturnella neglecta; β = -0.09 ± 0.03) showed a negative
relationship with increasing stocking rate. Occupancy of mesocarnivores was highest in
rest-rotation grazing systems, followed by season-long and summer-rotation systems,
respectively, and showed a positive relationship with increasing stocking rate (β = 1.64 ±
1.10). Regional guidelines for livestock grazing management may be inappropriate in
terms of grassland bird conservation efforts in the northern mixed-grass prairie.
1
INTRODUCTION AND LITERATURE REVIEW
Current and Historical Ecology of North America’s Grasslands
North America’s prairie ecosystems were historically dominated by contiguous
native grassland extending from southeastern Alberta and southern Saskatchewan to
Texas, and through the Midwestern United States from Wyoming to Illinois. Prior to
European settlement, frequent disturbance events on the landscape, characterized by
spatial and temporal variability, defined the evolutionary history of these unique systems
(Kay 1998). Naturally occurring and Native American induced wildfires, coupled with
intensive use of these areas by large grazing ungulates following burn events created a
fluctuating landscape that shaped the ecology of North America’s prairies (Pyne 1993,
Kay 1998).
The unique processes of North America’s prairie ecosystems began to decompose
following arrival of European settlers to the New World. The disturbances under which
prairie ecosystems evolved, namely recurring fire and bison grazing, became significantly
limited and replaced with new disturbances, including domestic livestock grazing and
widespread cultivation of the prairies for agricultural food production. Thousands of
years of graminoid decomposition furnished North America’s Great Plains prairies with
some of the most fertile soils on Earth, ideal for agricultural production, and the new
occupants of these prairies soon realized this agricultural potential, which they were
quick to exploit (Smith 1895, Benedict et al. 1996). Following government incentives
from the Homestead Act of 1862 and the Enlarged Homestead Act of 1909 in the United
States, and the Dominion Lands Act of 1872 in Canada, North America’s prairies were
2
flooded with hundreds of thousands of settlers looking to take advantage of free land
(Sabadell et al. 1982, Ostlie et al. 1997, Samson et al. 2004, Holechek et al. 2011).
Cultivation was the major use of lands appropriated by settlers under these Acts, marking
the onset of widespread prairie conversion.
Agriculture in North America has progressed significantly since the late 19th
century, from small- to large-scale production. Currently, over 81 million hectares of
native prairie have undergone some form of agricultural development in North America’s
Midwest and West (Sabadell et al. 1982). As a result, grassland ecosystems have
experienced the most significant change from their natural, pre-settlement condition of
any ecosystem in North America (Sabadell et al. 1982). Over 50% of temperate
grasslands in North America have been converted from their native state, with the largest
conversion seen in tallgrass prairie (>95% alteration), followed by the mixed-grass prairie
(>70% alteration) and shortgrass prairie (>48% alteration; Howe 1994, Samson et al.
2004, Hoekstra et al. 2005).
Conversion of remnant grasslands to row-crop agriculture is still occurring
throughout the mixed- and tallgrass prairies of the United States’ Grain Belt region at
rates from 1.0 – 5.4% annually, with significant losses in North and South Dakota,
Nebraska, Iowa, and Minnesota (Wright and Wimberly 2013). High commodity grain
prices, government crop subsidies for ethanol-production, and relatively low profitability
for lands enrolled in the Conservation Reserve Program (CRP) provide private
landowners with sufficient economic incentive to shift grasslands into agricultural
production (Holechek 2007, Fargione et al. 2008, Wright and Wimberly 2013). The
3
major issue with widespread conversion of native grasslands to cultivation is that
homogenous landscapes dominated by row-crop agriculture offer little habitat value to
indigenous wildlife (Natural Resources Council 1982, Brennan and Kuvlesky Jr 2005).
As a result, grassland wildlife species requiring contiguous, high-quality grassland
habitats have experienced dramatic population declines in these areas of extensive
agricultural development. Continued alteration of native grasslands in North America
reinforces the importance of remnant native habitat throughout the current and historic
distributions of grassland wildlife species.
Importance of North American Rangelands to Native Grassland Wildlife
Currently, the majority of remaining native grassland in North America is in the
form of rangeland managed for livestock grazing (Holechek et al. 2011). Approximately
50% of land cover in the United States is classified as rangeland, i.e., uncultivated land
that supports grazing and browsing herbivores (Holechek et al. 2011). The majority of
this rangeland is grazed by domestic livestock, giving substantial economic value to
grazing as a dominant land use (Holechek et al. 2011). Energy contained in rangeland
biomass can be harnessed by the livestock, converting this energy into a product directly
consumable by humans (Hormay 1970, Archer and Smeins 1991). In addition to its
economic value, grazing of domestic livestock on native grasslands also has the potential
to mimic historical ecological processes associated with natural ecosystem structure and
functionality (Fuhlendorf and Engle 2001, Fuhlendorf et al. 2012). Livestock grazing on
rangelands has been promoted as a wildlife management tool to mimic the grassland
disturbance of large and small herbivorous grazers, the American bison (Bison bison) and
4
prairie dog (Cynomys spp.), which have both been extirpated from the majority of their
historic ranges in North America following Euro-American colonization (Leopold 1933,
Samson and Knopf 1994, Benedict et al. 1996). Reflected by their status as large,
generalist herbivorous grazers, domestic cattle (Bos taurus) have similar foraging habits
to bison in regard to how they impact grassland vegetation structure, offering a
contemporary substitute for the historic ecological role of bison within prairie landscapes
(Stuth 1991, Plumb and Dodd 1993, Knapp et al. 1999, Fuhlendorf and Engle 2001,
Fuhlendorf and Engle 2004). The ability of livestock to alter vegetation structure and
species composition as the existing dominant large herbivore within native grassland
habitats often solidifies their status as ecosystem engineers (Bock et al. 1993, Jones et al.
1997, WallisDeVries et al. 1998, Derner et al. 2009).
Livestock grazing on native rangelands is an excellent multipurpose application of
land management, as the goal of financial sustainability for ranch managers is potentially
aligned with wildlife habitat needs. With habitat loss at the forefront of grassland wildlife
population declines, rangelands managed for livestock grazing offer a form of market-
based habitat conservation, keeping large areas of native grassland from conversion to
agricultural or other anthropogenic development (Brunson and Huntsinger 2008).
However, protecting rangelands from development, in itself, is not typically sufficient to
sustain proper functionality of these grassland ecosystems.
Grazing domestic livestock on rangelands can either positively or negatively
impact rangeland quality, as well as wildlife abundance and species diversity, so proper
rangeland management practices are crucial for maintaining the health of these systems
5
(Risser et al. 1981, Messmer 1990, Krausman et al. 2009). Grazing of grassland
vegetation has been shown to facilitate ecological functioning, improve rangeland
condition, and increase aboveground vegetation productivity in some grassland
ecosystems, and the ecological process of grazing is important for the grassland wildlife
species that evolved with and depend upon the vegetation structure created by large
herbivorous grazers (Risser 1990, Frank and McNaughton 1993, Fuhlendorf and Engle
2001, Derner et al. 2009, Holechek et al. 2011). However, improper rangeland
management, characterized by sustained high-intensity grazing and vegetative
defoliation, has resulted in reduced plant biodiversity, along with biomass losses of
residual grass, grass roots, and litter, leading to the deterioration of long-term range
condition and native grassland habitat (Dyksterhuis 1949, Fleischner 1994, Ostlie et al.
1997, Biondini et al. 1998, Holechek et al. 2011).
Historical intensive overgrazing and disregard for sustainable forage production
led to widespread rangeland deterioration in the late 19th century, negatively impacting
range quality, forage production for livestock, and habitat quality for native wildlife
(Smith 1895, Smith 1899, Coughenour 1991, Holechek et al. 2011). In the late 19th to
mid-20th centuries, ranch managers began to realize the economic consequences of
continual overgrazing on both livestock production and rangeland quality, resulting in the
establishment of sustainable range management principles, followed by the adoption of
more tenable grazing practices (Smith 1895, Saab et al. 1995, Holechek et al. 2011,
Fuhlendorf et al. 2012). Since this time, research has consistently indicated strong
evidence for decreased economic returns following overgrazing by livestock, resulting in
6
less overgrazing of rangelands for conceivable short-term profit (Torell et al. 1991,
Manley et al. 1997, Holechek et al. 1999, Derner et al. 2008). These more conservative
rangeland management strategies improved range condition and forage production, while
also developing the grazing principle of uniform forage utilization, an ideal still applied
in rangeland management by state and federal agencies, and private ranch managers to
this day (Bailey 2004, Bailey 2005, Toombs and Roberts 2009, Holechek et al. 2011).
Current grazing management practices often implement “manage to the middle”
strategies that employ moderate grazing intensities and attempt even distribution of
livestock to achieve consistent utilization of rangeland forage (Williams 1954, Bailey et
al. 1996, Fuhlendorf and Engle 2001, Derner et al. 2009, Fuhlendorf et al. 2009, Toombs
et al. 2010). Maximizing livestock grazing efficiency on the range through even forage
utilization achieves structural consistency in rangeland vegetation to meet the typical
desires of range managers (Williams 1954, Anderson 1967). Several management
strategies are used to achieve even spatial utilization of forage, including short-duration
grazing, twice-over rotational grazing, and other rotational grazing systems, as well as the
deliberate locational placement of water and mineral within pastures (Coughenour 1991,
Hart et al. 1993, Fuhlendorf and Engle 2001, Toombs and Roberts 2009, Fuhlendorf et al.
2012, Ranellucci et al. 2012).
Although desirable for livestock production, the prevalent management practices
used to achieve uniform forage utilization inherently develop homogeneous vegetation
structure on rangelands, a consequence that may not be optimal for native grassland
wildlife which evolved with the frequent disturbance events that created structural
7
heterogeneity within prairie ecosystems (Fuhlendorf and Engle 2001, Toombs et al.
2010). The importance of restoring structural heterogeneity to rangelands has recently
received much research attention within areas of ecosystem functioning and wildlife
habitat management (Wiens 1997, Fuhlendorf and Engle 2001, Fuhlendorf et al. 2006,
Hovick et al. 2015, Lwiwski et al. 2015). Heterogeneity, as defined in range
management, is the variation in stature, composition, density, and biomass of rangeland
vegetation (Fuhlendorf and Engle 2001). Promoting heterogeneity on the landscape
enhances rangeland biodiversity by mimicking the patchy disturbances under which these
prairie ecosystems evolved (Fuhlendorf and Engle 2001, Fuhlendorf et al. 2006). Historic
disturbance on North American prairies resulted from spatio-temporal variation in
drought, natural fire, and native grazers (Knapp et al. 1999, Fuhlendorf and Engle 2001,
Fuhlendorf et al. 2006). When bison dominated the grasslands of North America pre-
European settlement, they created a mosaic of spatially variable vegetation structure on
the landscape through patchy grazing patterns and selective foraging that followed
wildfire (Knapp et al. 1999, Askins et al. 2007). Disturbance from fires coupled with
intensive, patchy grazing, along with the addition of periodic drought, characterized
Great Plains grasslands as truly dynamic ecosystems (Anderson 1982, Ostlie et al. 1997).
Spatial Variability among Prairie Ecosystems Drives Management
Practices and principles within rangeland management are fundamentally
dependent upon geographic location (Holechek et al. 2011). The broad spatial extent of
North America’s prairie ecosystems accentuates the importance of recognizing innate
structural variability when managing rangelands. Merely considering prairies of the Great
8
Plains, rangeland management actions implemented within the tallgrass prairies of
Kansas, Nebraska, and Iowa will not produce similar results when applied to the northern
mixed-grass prairies of North Dakota, South Dakota, and eastern Montana. Variable
rangeland productivity among prairie ecosystems, driven largely by regional climate,
influences the vegetative characteristics within a specific grassland landscape (Holechek
et al. 2011). Even within a single prairie ecosystem, the northern mixed-grass prairie for
example, annual variability in precipitation from one growing season to the next has been
shown to significantly affect range vegetation structure and composition (Lwiwski et al.
2015). Without accounting for these differences between geographic regions in the
rangelands’ ability to produce vegetation, even on an annual temporal scale, management
actions may not improve range condition in terms of climax community regeneration or
wildlife habitat quality.
The majority of recent research focused on restoring structural heterogeneity to
rangelands comes from tallgrass prairie ecosystems (Voleti et al. 2014), in areas
characterized by higher amounts of annual precipitation and often considerably higher
values of average rangeland production than mixed- or short-grass prairies (Holechek et
al. 2011). In these areas, intensive management practices developed to restore
heterogeneity to the prairie landscape, such as ‘patch-burn grazing,’ have proven quite
effective in terms of improving wildlife habitat quality (Fuhlendorf et al. 2006,
Churchwell et al. 2008, Coppedge et al. 2008, McNew et al. 2015, Ricketts and
Sandercock 2016, Winder et al. 2017). Some of the original research supporting
heterogeneity-based rangeland management in the tallgrass and mixed-grass prairies
9
recommended the application of intensively grazed focal points within pastures, which
would shift throughout the pasture over multiple grazing seasons, and allow previously
grazed focal points recovery from intensive grazing (Fuhlendorf and Engle 2001). Patch-
burn grazing techniques establish heterogeneity within grasslands by subjecting different
areas within a pasture to prescribed fire annually, effectively dividing the pasture into
regions of variable vegetation structure (Hobbs et al. 1991, Fuhlendorf and Engle 2001).
Regions within the pasture not subjected to fire receive less intensive grazing pressure
than recently burned areas due to the tendencies of large ungulates to graze selectively on
higher quality forage following burn events (Bailey et al. 1996, Fuhlendorf and Engle
2004, Fuhlendorf et al. 2009, Allred et al. 2011). This interaction between fire and
grazing, termed ‘pyric-herbivory,’ effectively mimics historical grassland disturbance and
creates a mosaic of large-scale, patch-size structural heterogeneity in grassland vegetation
on the prairie landscape (Fuhlendorf and Engle 2004, Fuhlendorf et al. 2009).
An alternative conservation-based approach to patch-burn grazing is currently
being applied to rangelands in the state of Montana, and may improve wildlife habitat
quality and rangeland condition through restoring structural heterogeneity of rangeland
vegetation on the landscape without the use of fire (Montana Department of Fish,
Wildlife, and Parks 2010). The Montana Department of Fish, Wildlife, and Parks
(hereafter “Montana FWP”) collaborates with private ranches and public agencies
throughout Montana to influence management of approximately 180,000 ha for
improvements in wildlife habitat quality while maintaining sustainable livestock grazing
on the rangeland. Incentive programs available to landowners through Montana FWP
10
include conservation easements and Upland Game Bird Enhancement Program (UGBEP)
projects. Within these programs, minimum grazing standards require implementation of a
rest-rotation grazing system (Hormay 1970).
The rest-rotation grazing system described by Hormay (1970) was initially
designed to maintain healthy rangelands and sustainable annual forage production, and
was implemented on the bunchgrass rangelands of northeastern California at the edge of
the Great Basin biome and the intermountain transitional zone (Hormay and Talbot
1961). In this region, historical grazing intensity by large ungulates was relatively low,
compared to areas of the shortgrass, tallgrass, and mixed-grass prairies of western and
mid-western North America, which evolved with relatively intensive grazing pressure.
The rest-rotation grazing system incorporates a full year of rest from grazing in a
designated pasture within the system, as well as deferment from grazing during the
growing season in another pasture (Hormay 1970). Due to the selectivity of grazing
livestock, the most palatable grass species are subject to overgrazing (Stuth 1991, Bailey
et al. 1998). Continued defoliation of these highly selected species results in lowered
capacity for shoot and root growth the following growing season, and loss of stored
reserves will eventually lead to death of the plant (Hormay 1970). Allowing multiple
pastures deferment from grazing during the growing season is intended to benefit the
regrowth of rangeland vegetation and restore vigor to plants that did not evolve in a
system historically grazed by large ungulates, and which are not well adapted to heavy
grazing (Hormay and Talbot 1961, Hormay 1970).
11
Although the rest-rotation grazing system was neither designed for improving
wildlife habitat nor developed in a grassland ecosystem with evolutionary adaptations to
grazing by large herbivores, there is scientific merit for implementing this system in the
northern mixed-grass prairie for the benefit of native wildlife. The rest-rotation grazing
system hypothetically creates large patches of herbaceous vegetation structure from low
to high height and density among pastures within the system. More intensively managed
grazing systems, such as rest-rotation grazing, will inherently result in less fine-scale
heterogeneity in vegetation structure within a pasture by reducing the potential for
livestock forage selectivity (Coughenour 1991, Holechek et al. 2011). Dividing a large
pasture into smaller pastures will result in more even forage utilization within the grazed
pastures, effectively creating large-scale, patch-heterogeneity on the landscape (Hart et
al. 1993, Briske et al. 2008).
In regard to patch-size heterogeneity, the rest-rotation grazing system is
conceptually similar to patch-burn grazing, an effective strategy for improving wildlife
habitat quality in the tallgrass prairie. Rest-rotation grazing, however, may be a more
viable management option for creating patch-heterogeneity in the more arid regions of
the northern mixed-grass prairie due to socio-cultural aversions to prescribed fire within
rangeland management practices (Sliwinski 2017). Rather than using prescribed fire to
concentrate grazing on burned patches or defer grazing from unburned patches on the
landscape, the rest-rotation grazing system uses fences to divide a large pasture into
smaller pastures that are either heavily grazed or deferred from grazing during one or
more parts of the year.
12
Conclusion
North America’s grasslands have seen some of the greatest alterations of any
ecosystem over the past 300 years. The majority of remaining contiguous, native
grasslands are in the form of rangelands managed for livestock grazing. As a result,
responsible (conservation-based) rangeland management practices are necessary for
sustaining or improving range condition and wildlife habitat quality to achieve proper
ecosystem functioning. Prairie ecosystems evolved under frequent yet sporadic
disturbance events in the form of fire and grazing, creating a dynamic, heterogeneous
landscape in terms of rangeland vegetation structure and composition. Economically
viable rangeland management practices that restore structural heterogeneity to prairie
landscapes and mimic historical disturbance processes have been recently upheld as
conservation-based approaches that will achieve proper ecosystem functionality.
One such application of heterogeneity-based management being used by the state
of Montana Department of Fish, Wildlife, and Parks is the rest-rotation grazing system.
Hypothetically, this system creates patch-heterogeneity in vegetation structure on the
landscape through the strategic rotation of both intensive cattle grazing and deferment of
grazing among pastures within the system. However, the rest-rotation grazing system has
not been tested for effects on wildlife habitat quality in the northern mixed-grass prairie.
Results of research comparing rotational grazing systems and season-long grazing have
been inconsistent (Holechek et al. 1999), and evaluations of grazing systems in numerous
grassland ecosystems have not shown rotational grazing to significant improve forage
production, standing crop biomass, or animal production over that of continuous, season-
13
long grazing systems (Rogler 1951, Launchbaugh et al. 1978, Manley et al. 1997, Briske
et al. 2008, Vermeire et al. 2008).
In general, the effects of grazing systems on grassland wildlife have not been
well-established (Schieltz and Rubenstein 2016). My research evaluates the rest-rotation
grazing system in terms of its effects on the ecology of obligate grassland birds and their
predators in the northern mixed-grass prairie. In Chapter 2, I evaluate the effects of
livestock grazing management on the diversity of grassland birds and the abundance of
three specific obligate grassland bird species in a northern mixed-grass prairie ecosystem.
In Chapter 3, I evaluate the effects of livestock grazing management on the occupancy of
mesocarnivores in a northern mixed-grass prairie ecosystem. In Chapter 4, I provide
conclusions from my research and offer management recommendations to agencies and
private landowners for improving grassland bird habitat quality, and for reducing the
potential impacts of mesocarnivore depredation of grassland birds and their nests in
northern mixed-grass prairie ecosystems.

14
CHAPTER TWO
EFFECTS OF LIVESTOCK GRAZING MANAGEMENT ON THE ECOLOGY OF
GRASSLAND BIRDS IN A NORTHERN MIXED-GRASS
PRAIRIE ECOSYSTEM
Contribution of Authors and Co-Authors
Manuscript in Chapter 2
Author: Skyler T. Vold
Contributions: Conceptualization, data curation, formal analysis, investigation,
methodology, supervision, validation, writing – original draft, writing – review & editing.
Co-Author: Lance B. McNew
Contributions: Conceptualization, funding acquisition, methodology, project
administration, supervision, validation, writing – review & editing.
Co-Author: Lorelle I. Berkeley
Contributions: Conceptualization, funding acquisition, methodology, project
administration, supervision, validation, writing – review & editing.

15
Manuscript Information
Skyler T. Vold, Lance B. McNew, Lorelle I. Berkeley
Rangeland Ecology & Management
Status of Manuscript:
__X__ Prepared for submission to a peer-reviewed journal
____ Officially submitted to a peer-reviewed journal
____ Accepted by a peer-reviewed journal
____ Published in a peer-reviewed journal
Elsevier, on behalf of the Society of Range Management
16
CHAPTER TWO
EFFECTS OF LIVESTOCK GRAZING MANAGEMENT ON THE ECOLOGY OF
GRASSLAND BIRDS IN A NORTHERN MIXED-GRASS PRAIRIE ECOSYSTEM
INTRODUCTION
Population declines for many species of grassland birds have been well
documented using long-term datasets from the North American Breeding Bird Survey,
and grassland birds have been cited as the most rapidly declining guild of terrestrial birds
in North America during the last 50 years (Knopf 1994;1996, Peterjohn and Sauer 1999,
Sauer et al. 2013). Diversity and abundance of grassland birds within grassland
ecosystems are considered indicators of habitat quality due to their species-specific
habitat requirements, and can be used to assess the effects of local land management
practices or the impacts of anthropogenic disturbance within these ecosystems (Browder
et al. 2002, VerCauteren and Gillihan 2004, Coppedge et al. 2006, Askins et al. 2007,
Rosenberg et al. 2016). Therefore, current grassland bird population trends should not
only be disconcerting because of the ecological services these birds fill within grasslands,
such as regulation of insect populations (Whelan et al. 2008), but current trends should
also raise concern for the overall health of our grassland ecosystems.
Many factors have been associated with the decline of grassland bird populations,
including habitat fragmentation, woody vegetation encroachment, and improper or
inadequate grassland management (Knopf 1994, Peterjohn and Sauer 1999, Johnson and
Igl 2001, Brennan and Kuvlesky Jr 2005). The most significant, however, is the alteration
of native breeding and wintering habitat within North America’s grassland ecosystems
17
resulting from widespread agricultural cultivation and other anthropogenic development
(Knopf 1994, Johnson and Igl 2001, Brennan and Kuvlesky Jr 2005, Askins et al. 2007).
Conserving and properly managing remaining tracts of native grassland habitats are now
some of the most important responses to confront current grassland bird population
declines (Knopf 1996, Vickery et al. 1999, Askins et al. 2007, With et al. 2008). Intensive
agricultural development throughout North America’s grassland ecosystems has resulted
in rangelands managed for livestock grazing composing the majority of remaining
contiguous grassland habitat, emphasizing the importance of maintaining and managing
these rangelands as remnant habitat for conserving grassland bird populations (Knopf
1996, Davis et al. 2014). Implementing rangeland management practices that improve
grassland habitats to the quality required by grassland birds may act to moderate
population declines.
Physical habitat structure is important for birds, as it influences foraging
efficiency and nesting success (Cody 1985, Orians and Wittenberger 1991, Bock et al.
1993, Winter et al. 2005). Grassland birds tend to select habitat and establish territories
based on cues for suitable vegetation structure upon their arrival to breeding areas
(Ahlering and Faaborg 2006). Several factors may contribute to spatial and temporal
variability in the structure of vegetation within grassland ecosystems. Annual
precipitation significantly influences vegetation structure and composition, and the
interaction between moisture and rangeland productivity – i.e., the vegetation produced
by a specific ecological site annually – results in wide structural variability within
grassland habitats (Ahlering and Faaborg 2006, Vermeire et al. 2008, Lwiwski et al.
18
2015). Relationships have been found between regional grassland bird densities during
the breeding season and previous years’ precipitation, likely due to the effect of soil
moisture on herbaceous vegetation growth (Igl and Johnson 1999, Niemuth et al. 2008,
Lipsey and Naugle 2017). The action of grazing by large herbivores is the other main
factor to significantly influence vegetation structure within grassland ecosystems, and
grassland birds have shown strong responses to grazed grasslands in terms of habitat
selection and demography (Knopf 1996, Fondell and Ball 2004, VerCauteren and
Gillihan 2004, Derner et al. 2009, Lwiwski et al. 2015). Species diversity and abundance
of grassland birds are often lower in ungrazed pastures compared to grazed pastures,
providing evidence that large grazers create components of vegetation structure within
prairie habitats that grassland birds historically required (Skinner 1975, Renken and
Dinsmore 1987, Messmer 1990, Báldi et al. 2005).
Rangeland management practices that restore structural heterogeneity to prairie
landscapes through the use of fire and grazing have recently been promoted within
grassland bird conservation (Fuhlendorf and Engle 2001, Fuhlendorf et al. 2006, Derner
et al. 2009). Grassland bird communities are evolutionarily adapted to the variation in
vegetation structure created by disturbance events on the landscape (Fuhlendorf and
Engle 2001, Pool and Austin 2006). Structural heterogeneity within grassland habitats
has been shown to increase diversity and abundance of native grassland birds, and the
variations in specific vegetation structure and composition present within grasslands are
important habitat requirements selected by grassland birds (Winter et al. 2005, Askins et
19
al. 2007, Fisher and Davis 2010, Henderson and Davis 2014, Hovick et al. 2015, Lipsey
2015).
Livestock grazing management designed to restore structural heterogeneity to
rangelands, such patch-burn grazing, have been successfully applied to areas of the
tallgrass prairie, and, in many cases, grassland birds have shown a positive response to
these management practices (Fuhlendorf et al. 2006, Churchwell et al. 2008, Coppedge et
al. 2008, Hovick et al. 2015, McNew et al. 2015, Davis et al. 2016). Traditionally,
prescribed burning was not necessarily promoted as a rangeland management tool in
more arid regions of the mixed-grass prairies, especially those at the northern- and
western-most extents. The historical fire return interval in these more arid ecosystems
was typically longer than that of tallgrass prairie ecosystems, so burning may not
consistently result in increased vegetative productivity and is often dependent upon
precipitation (Anderson 1982, Umbanhowar Jr 1996). Prescribed burning is not widely
accepted by local land managers in semi-arid regions of the mixed-grass prairie, despite
recent research suggesting resilience of these areas to fire and supporting use of fire-
grazing interactions for mimicking historical disturbance regimes (Gates et al. 2017,
Sliwinski 2017, Powell et al. 2018). Therefore, conservation agencies looking to restore
grassland heterogeneity for the benefit of native wildlife are restricted in management
options, even though the interaction of fire and grazing has been promoted for the
conservation of grassland birds in the northern mixed-grass prairie (Richardson et al.
2014).
20
An alternative heterogeneity-based rangeland management technique is currently
being employed in the state of Montana, USA, through the use of a rest-rotation grazing
system and intensive manipulation of livestock. This system hypothetically establishes
patch-size structural heterogeneity on the landscape similar to patch-burn grazing,
creating large areas of variable disturbance, and patches of low to high vegetation height
and density annually (Hagen et al. 2004, Derner et al. 2009, Toombs et al. 2010). Recent
research has suggested that solely manipulating stocking rates is not adequate to provide
the vegetation heterogeneity grassland birds require in the northern mixed-prairie due to
spatial and temporal variability in precipitation, justifying the use of a more intensive
livestock grazing management system for filling this role in the absence of fire (Lipsey
and Naugle 2017, Powell et al. 2018). However, the response of grassland birds to rest-
rotation grazing has not been evaluated in the northern mixed-grass prairie. Grassland
bird densities and community composition are excellent indicators of the condition and
habitat quality of native grasslands due to their species-specific habitat requirements,
making them useful for assessing potential effects of rangeland management strategies
(Browder et al. 2002, VerCauteren and Gillihan 2004, Coppedge et al. 2006).
Finally, the success of specific livestock grazing systems for improving rangeland
or wildlife habitat quality varies widely in the literature (Holechek et al. 1999, Briske et
al. 2008, Krausman et al. 2009, Schieltz and Rubenstein 2016). The regional evolution of
grassland ecosystems to a continuum of grazing pressures, as well as large-scale
differences in average annual rangeland productivity may largely contribute to these
inconsistencies, i.e., a livestock grazing system that improves grassland bird habitat
21
quality in a highly productive tallgrass prairie ecosystem (Fuhlendorf et al. 2006,
Coppedge et al. 2008) may not have a similar effect in the semi-arid shortgrass prairie
(Augustine and Derner 2015). However, even within a single grassland ecosystem such
as the northern mixed-grass prairie, researchers have found variable responses to
livestock grazing management in terms of obligate grassland bird habitat selection,
ranging from no response to grazing system (Davis et al. 2014), to a positive response to
rotational grazing systems (Messmer 1990, Buskness et al. 2001) or a positive response
to season-long grazing systems (Ranellucci et al. 2012). Additionally, grassland birds
have shown species- or guild-specific responses to livestock grazing intensity within the
context of variable rangeland productivity at the landscape-scale (Lipsey and Naugle
2017). I hypothesize that even fine-scale variability in rangeland production potential
within the northern mixed-grass prairie should be accounted for within livestock grazing
management, and may explain the inconsistencies related to the implementation of
livestock grazing systems on grassland bird habitat quality.
I conducted point-count surveys of grassland birds in northeastern Montana, USA,
at points randomly located across eight pastures enrolled in one of three livestock grazing
systems. I was interested in the effects of livestock grazing management on grassland
bird abundance and community composition in the northern mixed-grass prairie. My
objectives were to 1) evaluate how species-specific abundances and community
composition of grassland birds were affected by livestock grazing management in the
context of site-specific rangeland production potential, 2) estimate the importance of
vegetation characteristics for grassland birds mediated by livestock grazing treatment, 3)
22
evaluate the effectiveness of rest-rotation grazing to create patch-heterogeneity in
rangeland vegetation structure, as conceptualized by previous researchers, and 4) provide
management recommendations to agencies and private landowners for improving habitat
quality for grassland birds in northern mixed-grass prairie ecosystems.
I predicted that pastures managed with the conservation-based rest-rotation
grazing system would support overall higher abundances and a wider species diversity of
grassland birds than pastures managed with more commonly used season-long or
summer-rotation grazing systems, as rangeland management efforts focused on restoring
patch-heterogeneity to prairie landscapes have been recently promoted to benefit
grassland bird conservation. Alternatively, there may be no effect of grazing system on
abundance or species diversity of grassland birds, but rather species-specific grassland
bird habitat selection is closely tied with particular vegetation conditions at the local-
scale (Davis et al. 2014). Finally, I predicted grazing system type would influence fine-
scale vegetation conditions and, if the alternative is true, I expected to find relationships
between species-specific grassland bird abundance and the local vegetation
characteristics mediated by livestock grazing systems.
STUDY AREA
My study area is located within the northern mixed-grass prairie of the Great
Plains Missouri Plateau, and situated just northwest of the rugged Little Missouri
Badlands. The study site is centered on a ~3,000-ha Upland Gamebird Enhancement
Program (UGBEP) project established by the Montana Department of Fish, Wildlife, and
Parks (hereafter “Montana FWP”) in 1993, located in eastern Richland County, Montana,

23
20 km southeast of Sidney, Montana (48° 30’ N, 104° 04’W; Figure 1). Five pastures of
~4,300-ha bordering the UGBEP were used as reference treatments, with three pastures
located on private lands adjacent to the UGBEP in Montana, and two pastures located on
U.S. Forest Service National Grasslands adjacent to the UGBEP in McKenzie County,
North Dakota.
Montana FWP collaborates with private ranches throughout the state of Montana
to influence management of native rangeland for improvements in wildlife habitat
quality, while maintaining economically sustainable livestock production. Incentive
programs available to landowners through Montana FWP include conservation easements
and the Upland Game Bird Enhancement Program, which is designed to “effectively and
responsibly conserve and enhance upland game bird habitats and populations – providing
quality public hunting opportunities for present and future generations” (Montana
Department of Fish, Wildlife, and Parks 2015). Montana FWP also manages grazing
leases on Wildlife Management Areas, Department of Natural Resources and
Conservation (DNRC) lands leased by Montana FWP, and an assortment of Bureau of
Land Management, U.S. Forest Service, and private lands that are managed under the
terms of lease agreements (Kelvin Johnson, Montana FWP, pers. comm.). For all
programs and leases, Montana FWP currently manages grazing on ~182,000 ha, of which
~81,000 ha are managed under rest-rotation grazing systems (Rick Northrup, Montana
FWP, pers. comm.).
The study area in eastern Montana is dominated by contiguous rangelands
managed for cattle grazing, and is characterized by rolling, gently sloping plains
24
(generally < 5 degrees; Bluemle 1991). Elevation ranges from 660 to 730 meters above
sea level. Annual precipitation is variable, but long-term average (1911 – 2017) was ~360
± 86 mm (SD), based on the nearest weather station (Savage 1.0 S, MT US, 20 km west)
to the study site (NOAA 2017). Precipitation 12 months prior to 2016 field work (April
2015 – March 2016) was 288 mm, and prior to 2017 field work (April 2016 – March
2017) was 392 mm (NOAA 2017). Mean annual temperature is ~6°C. Winter
temperatures range from -40°C to 5°C and summer temperatures range from 8°C to 43°C
(NOAA 2017). Vegetation on the study site is composed of mainly graminoids, including
western wheatgrass (Pascopyrum smithii), little bluestem (Schizachyrium scoparium),
needle-and-thread (Hesperostipa comata), prairie junegrass (Koeleria macrantha),
Kentucky bluegrass (Poa pratensis), and blue grama (Bouteloua gracilis), along with
low- to mid-height shrubs, including western snowberry (Symphoricarpos occidentalis),
silver sagebrush (Artemisia cana), skunkbrush sumac (Rhus trilobata), silver
buffaloberry (Shepherdia argentea), chokecherry (Prunus virginiana), wild roses (Rosa
spp.), and creeping juniper (Juniperus horizontalis), as well as two prevalent sub-shrub
species, winterfat (Krascheninnikovia lanata), and fringed sagewort (Artemisia frigida).
METHODS
Sampling
I collected data during two grassland bird breeding seasons (May – June, 2016–
17). Prior to the 2016 field season, I randomly generated 305 survey points across
gradients of habitat conditions within a Montana FWP Upland Gamebird Enhancement
Program project managed under rest-rotation grazing, and on adjacent private and federal
25
lands managed under season-long or 2-pasture summer-rotation grazing systems (Table
1, Figure 1). I used the same survey points during the 2017 field season, as grassland
birds show low site fidelity among breeding seasons (Jones et al. 2007). Additionally, I
was not interested in effects between seasons, such as colonization or extinction, allowing
us to pool data between field seasons, resulting in a robust sample size of 610
independent grassland bird survey points.
In each year, I surveyed 150 points within rest-rotation grazing systems, with 50
points in each of the three pasture treatments. Within enrolled conservation easements
and Upland Gamebird Enhancement Program projects, Montana FWP minimum grazing
standards require implementation of a 3-pasture rest-rotation grazing system (Hormay
1970). Minimum grazing standards are designed to improve rangeland condition and
increase the structural heterogeneity of grassland vegetation on the landscape for the
benefit of native grassland wildlife (Montana FWP 2010).
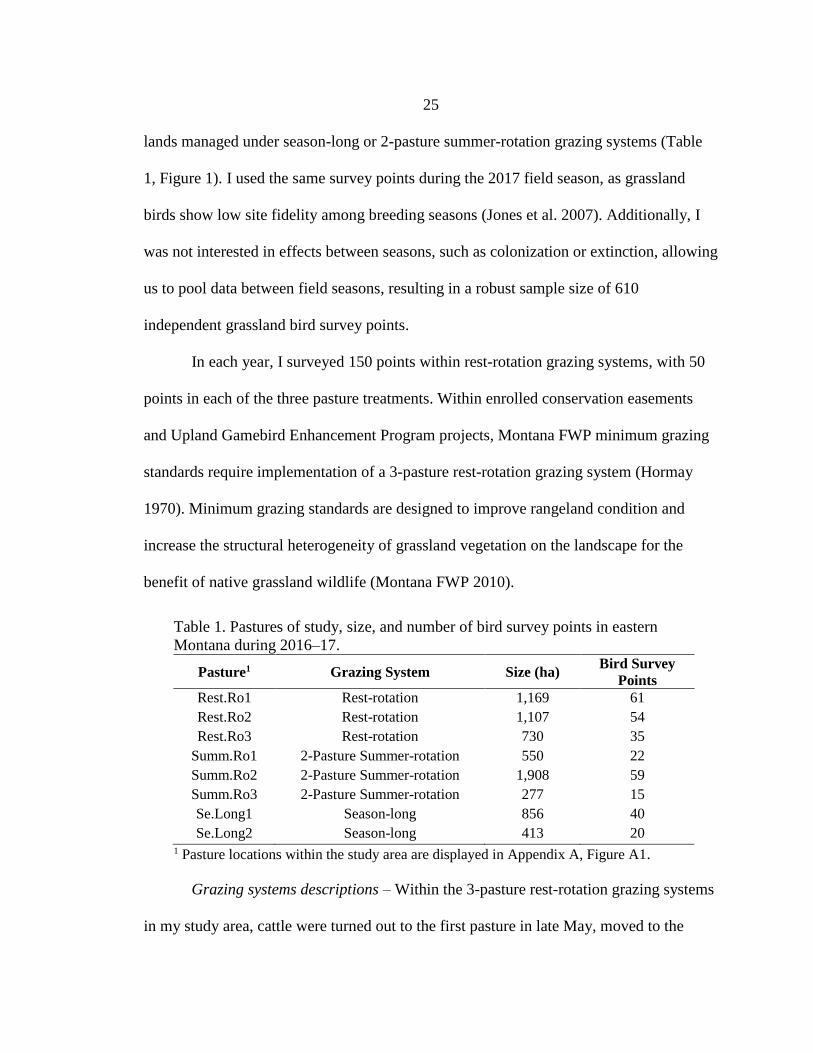
Table 1. Pastures of study, size, and number of bird survey points in eastern
Montana during 2016–17.
Pasture1 Grazing System Size (ha) Bird Survey
Points
Rest.Ro1 Rest-rotation 1,169 61
Rest.Ro2 Rest-rotation 1,107 54
Rest.Ro3 Rest-rotation 730 35
Summ.Ro1 2-Pasture Summer-rotation 550 22
Summ.Ro2 2-Pasture Summer-rotation 1,908 59
Summ.Ro3 2-Pasture Summer-rotation 277 15
Se.Long1 Season-long 856 40
Se.Long2 Season-long 413 20 1 Pasture locations within the study area are displayed in Appendix A, Figure A1.
Grazing systems descriptions – Within the 3-pasture rest-rotation grazing systems
in my study area, cattle were turned out to the first pasture in late May, moved to the
26
second pasture mid-August, and turned in for the season after 8 – 10 weeks; the third
pasture in the system was rested from grazing. For comparison to the conservation-based
rest-rotation grazing system implemented on Montana FWP’s UGBEP project in eastern
Montana, my study included two more commonly employed grazing systems. I surveyed
155 points on reference pastures adjacent to the UGBEP project, with 60 points located
within season-long grazing systems, and 95 points within 2-pasture summer-rotation
grazing systems. Season-long grazing systems in the study area allowed cattle to graze
continuously from May or early June through October or mid-November. Within 2-
pasture summer-rotation grazing systems in the study area, cattle were turned out to the
first pasture in early June, moved to the second pasture after 6 – 8 weeks, and turned in
for the season early November. The summer-rotation grazing systems in my study area
stocked cattle in the same pastures each year, during approximately the same period of
the summer grazing season. This is unlike typical 2-pasture deferred-rotations grazing
systems, where pastures are not grazed during the same period of the summer grazing
season in consecutive years.
Avian point count surveys began after all grassland bird species had arrived for
the breeding season, and were completed within a 4-week period to assume breeding
population closure. To avoid double counting of individuals and assure statistical
independence, survey points were spaced ≥ 300 m apart. Points were located ≥ 200 m
from pasture boundaries to avoid counting birds using multiple treatments, ≥ 400 m from
oil pads, and ≥ 250 m from gravel roads to control for bird avoidance of these areas
(Thompson et al. 2015). At each randomly generated location, grassland birds were
27
surveyed with three consecutive, yet independent 5-minute point count surveys. This
survey method maximized observer efficiency, while simultaneously achieving
population closure between survey visits, an assumption commonly required for
statistical modeling of these types of data (Royle 2004, Kéry et al. 2005). A single trained
observer identified and tallied all birds detected visually or aurally within 100 m of the
survey point, noting the time of first detection and the distance from observer to the bird
when it was first detected (0-25 m, 26-50 m, 51-75 m, 76-100 m; Ralph et al. 1993).
Other data recorded included sex (dimorphic species only), vocalization, and behavior of
each identified bird. At each survey location, the observer recorded the date and time,
percent overcast, precipitation, temperature, and wind speed. Point count surveys were
conducted from one-half hour before sunrise through no later than 0900h MST. Sunrise
ranged from 0515h MST at the beginning of the survey season in mid-May to 0459h
MST at the end of the survey season in mid-June. Surveys were not conducted if average
wind speed exceeded 16 km/hr, or during rainfall.
28
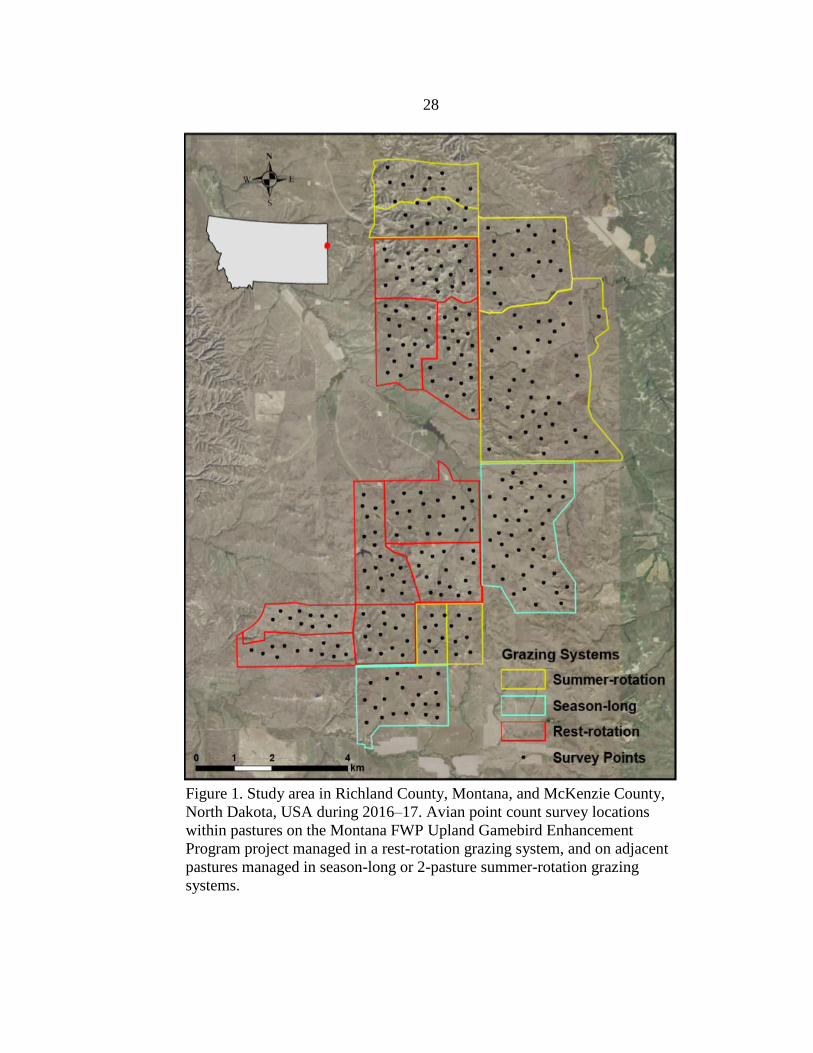
Figure 1. Study area in Richland County, Montana, and McKenzie County,
North Dakota, USA during 2016–17. Avian point count survey locations
within pastures on the Montana FWP Upland Gamebird Enhancement
Program project managed in a rest-rotation grazing system, and on adjacent
pastures managed in season-long or 2-pasture summer-rotation grazing
systems.
29
Local vegetation conditions were measured within bird survey areas the same day
point count surveys were conducted. I established three 20-m transects within 100 m of
each survey point, with one transect located at the survey point and oriented in a random
direction, and two transects located and oriented randomly within 100 m of the survey
point. Subplots were spaced 5 m apart along each transect. At each subplot, I measured
visual obstruction from the north at a distance of 2 m and a height of 0.5 m (VOR; Robel
et al. 1970). At each subplot, I measured vegetation coverages using methods of
Daubenmire (1959), where overlapping coverages of residual grass, litter, forb, and bare
ground were recorded in one of six percentage classes (0–5, 5–25, 25–50, 50–75, 75–95,
and 95–100 %). Midpoints of percentage classes were recorded for each vegetation
coverage measurement. I measured heights (cm) of the nearest plant to the center of the
frame for each residual grass, litter, and forb. I conducted line-intercept surveys along
each of three 20-m transects to estimate shrub foliar cover (hereafter “shrub cover”)
within point count survey areas. The species of each shrub intersecting the transect was
recorded, as well as the height and length of the shrub as it crossed the transect (Canfield
1941). I estimated slope at each bird survey location by averaging three measurements of
slope (degrees) recorded at each of the three habitat transects within the survey area.
I used ArcMap 10.4 to digitize the wooded coulees and pasture fences within the
study area using five band 1-m resolution aerial imagery from the National Agricultural
Imagery Program (NAIP) developed by the U.S. Farm Service Agency (ESRI 2011,
v10.4). Data was obtained from Montana State Library GIS Clearinghouse and North
Dakota GIS Hub Data Portal. I intersected bird survey locations with these digitized
30
wooded coulee and fence layers (ESRI 2011, v10.1). I used the ArcMap ‘Calculate
Geometry’ tool to estimate the area of wooded coulee within 100-m, 500-m, and 1,000-m
radial areas of bird survey plots, and to estimate the total length of fences within 500-m
and 1,000-m radial areas of bird survey plots to calculate fence densities (ESRI 2011,
v10.1).
Rangeland managers implement grazing systems based on the expected annual
vegetative production of rangelands in an average year. I quantified rangeland production
potential associated with each bird survey area using Soil Survey Geographic Database
(SSURGO) ecological site data from the Natural Resources Conservation Service
(NRCS) Web Soil Survey (NRCS 2017). NRCS defines rangeland production as “the
amount of vegetation that can be expected to grow annually in a well-managed area that
is supporting the potential natural plant community” (NRCS 2017). Previous researchers
have found NRCS estimates of rangeland production potential based on SSURGO
ecological site data were reasonable estimates of true average rangeland productivity
(Relyea et al. 2000). I calculated the weighted average rangeland production potential
within 100 m of each bird survey location using the representative values (RV) of
rangeland production for each ecological site type in the study area (Appendix B, Table
B1), effectively accounting for point count areas which encompassed multiple ecological
sites. I used the representative values of rangeland production potential, as precipitation
during the years prior to field work was approximately average, and the RV’s are based
on an average year’s precipitation.
31
I interviewed landowners to gather cattle turn-out/turn-in dates and number of
head stocked to calculate stocking rates for the pastures within the study area. These
dates and numbers were validated by observation of when and approximately how many
cattle were present in pastures during both summer grazing seasons. I calculated stocking
rates within pastures based on an animal unit month (AUM), the amount of forage,
measured on a dry weight basis, to feed a 1,000-lb cow-calf pair for a 30-day period
(Holechek et al. 2011). The average cow-calf pair grazing on the pastures within the
study area was approximately 1,400 lbs (635 kg) based on landowner interviews, so I
accounted for this in my calculation of stocking rate. Typically, stocking rates consider
all pastures within a multi-pasture grazing system, resulting in a single stocking rate for
the system. I calculated the stocking rates of each individual pasture within the 3-pasture
rest-rotation and 2-pasture summer-rotation grazing systems because I was interested in
the indirect effects of livestock grazing on grassland bird abundance and diversity
through the alteration of vegetation structure by grazing livestock. Grassland bird
selection of breeding territory is likely based on residual vegetation from previous
growing seasons, as the majority of new growth initiates after grassland bird breeding
territories have been established in the northern mixed-grass prairie. Stocking rates from
the previous year’s grazing season were used as a predictor of grassland bird abundance,
as breeding territories have already been established within pastures prior to cattle turn-
out dates in the study area (Ahlering and Merkord 2016).
32
Statistical Analyses
I evaluated the effects of vegetation conditions on grassland bird abundance at the
local-scale (100-m radius from the survey point) and landscape-scale (500-m and 1,000-
m radius from the survey point), and rangeland production potential, stocking rate, and
grazing system on grassland bird abundance at the management-level. The local- and
landscape-scale habitat variables were considered for their direct effect on abundance of
grassland birds through species-specific habitat use, whereas the three management-level
variables were considered for their indirect effect on grassland bird abundance through
the ability of livestock grazing practices to alter vegetation structure. Rangeland
production potential is included in the management-level model set because range
managers consider the average production potential of rangelands when implementing
grazing systems or manipulating livestock stocking rates. I conducted all analyses in
program R (R Core Team 2016) with use of packages ‘unmarked’ (Fiske and Chandler
2011) and ‘AICcmodavg’ (Mazerolle 2013) to identify specific effects on abundance of
each focal species, where N-mixture modeling allowed for simultaneous estimation of
detection probability and abundance.
The binomial N-mixture model simultaneously estimates detection probability
and abundance of unmarked individuals identified during spatially replicated count data.
The model assumes absence of false positive detections, and population closure, where
births/deaths and emigration/immigration are equal to zero for the duration of the
surveying period (Royle 2004). By conducting replicated surveys within a period of
population closure, detection probability can be can be quantified, resulting in unbiased
33
estimates of abundance. To meet the closure assumption, I conducted repeated avian
point count surveys within the same morning at each point. Additionally, meeting the
assumptions of adequate spatial replication is necessary for the validation of N-mixture
models (Kéry and Royle 2015). During two field seasons, I conducted 3 replicated point
count surveys at 610 spatially independent sites. I measured local vegetation conditions at
each of 610 bird survey location immediately following the survey during both seasons,
and evaluated the effect of vegetation conditions on avian detection probabilities and
local relative abundance during the same seasons point counts were conducted. This
eliminated a potential year-effect among local-scale vegetation conditions within the
survey area and associated local abundances of focal species.
For each covariate included in detection and abundance models, I evaluated
whether a linear, quadratic, or pseudo-threshold (pseudo-asymptotic) effect (Franklin et
al. 2000) was best supported for its influence on avian detection probability or
abundance. I tested all covariates for multicollinearity, removing those which were highly
correlated (Pearson’s correlation estimate |r| > 0.6) from analyses. Litter cover and litter
depth were highly correlated. I removed litter cover and included the variable litter depth
in analyses, as previous researchers have suggested that measurements of litter cover may
underestimate the true amount of litter available, and litter depth is a better metric
(Ricketts and Sandercock 2016). Wooded coulee edge and wooded coulee area were
highly correlated at all spatial scales; I removed wooded coulee edge and included the
variable wooded coulee area in analyses as some obligate grassland birds avoid wooded
habitat, and some facultative grassland birds require a certain amount of wooded habitat.
34
Wooded coulee area at the two landscape scales (500-m and 1,000-m radius from the
survey point) were correlated, as well as fence density at these two landscape scales. I
evaluated which spatial scale (500-m or 1,000-m) for wooded coulee area and fence
density was best supported for its influence on species-specific abundance, and included
the more influential of the two spatial scales in the final landscape-scale model for each
focal species.
I used stepwise model selection techniques (backward selection) to identify the
factors influencing detection probability and abundance for each focal grassland bird
species, where I started with a highly parameterized model and eliminated uninformative
parameters based on their lack of influence on species-specific detection probabilities or
abundance of focal grassland bird species (Montgomery et al. 2012, Ahlering and
Merkord 2016). Most of the vegetation conditions I measured in the field have previously
been shown to influence grassland bird detection probability or local abundance (Fisher
and Davis 2010, Ahlering and Merkord 2016), so stepwise model selection was most
appropriate in the absence of any a priori hypotheses. Models related to species-specific
detection probabilities of grassland birds were fit prior to fitting models for local
abundance.
Variables considered to influence detection probability of grassland birds were
observer, year, Julian day (139 – 175), time of day, wind speed, average slope, shrub
cover, and shrub height. Visual obstruction, grass coverage and height, litter depth, bare
ground, and woody vegetation prevalence have previously been cited as important
correlates of grassland bird abundance (Grant et al. 2004, Fisher and Davis 2010,
35
Thompson et al. 2014). Variables considered to influence local abundance were visual
obstruction reading (VOR), standard deviation of visual obstruction readings (sdVOR),
residual grass coverage, residual grass height, litter depth, bare ground coverage, shrub
cover, shrub height, and wooded coulee area. I eliminated potential effects of the
variables typically associated with grassland bird avoidance at the landscape-scale, such
as roads, oil wells, open water, and agriculture by buffering these areas prior to
establishing avian point count survey locations. As a result, only two variables were
considered to influence abundance of grassland birds the landscape-scale (500-m and
1000-m), wooded coulee area and fence density.
I used Akaike’s Information Criterion adjusted for finite samples (AICc) to
compare models and identify important variables to include in the final detection or
abundance model for each grassland bird species. Supported models with large model
weights (wi) and AICc values ≤ 2 from the best-fit model were considered parsimonious
(Burnham et al. 2011). When a supported model differed from the best-fit model by a
single parameter, I considered the additional parameter to be uninformative and excluded
this parameter from inclusion in the final model (Arnold 2010). I built a candidate model
set for the management-level effects on avian abundance based on a priori hypotheses,
which included additive effects, along with 2- and 3-way interactions (Table 2). Factors
hypothesized to affect avian abundance at the management-level were grazing system,
stocking rate, and rangeland production potential.
I assessed model fit for the top model within local-, landscape-, and management-
level analyses for each focal species from 1,000 simulated datasets using the
36
Nmix.gof.test function within R package AICcmodavg (Mazerolle 2013). Goodness-of-
fit tests indicated c ̂ estimates between 0.75 and 1.0, and p-values > 0.95 for the most
parsimonious models within each model set, providing evidence the models adequately
fit the data. The best-fit model within local-, landscape-, and management-level analyses
was then used to generate predictions of focal species abundance over the range of values
for each variable, while holding other variables included in the best-fit model at their
means. When multiple models shared support (ΔAICc values ≤ 2), model averaged
estimates were used to generate predictions of grassland bird detection probabilities and
local abundance. Supported models were organized for model-averaged prediction within
an unmarkedFitList using the fitList function in R package ‘unmarked’ (Fiske and
Chandler 2011).
Table 2. Candidate model set for the management-level effects on avian abundance in
eastern Montana during 2016–17.
Model Description
Null Null Model
Mod1 Grazing System
Mod2 Stocking Rate
Mod3 Rangeland Production Potential
Mod4 Grazing System + Stocking Rate
Mod5 Grazing System + Rangeland Production Potential
Mod6 Stocking Rate + Rangeland Production Potential
Mod7 Grazing System + Stocking Rate + Rangeland Production Potential
Mod8 Grazing System × Stocking Rate
Mod9 Grazing System × Rangeland Production Potential
Mod10 Rangeland Production Potential × Stocking Rate
Mod11 Grazing System × Stocking Rate + Rangeland Production Potential
Mod12 Grazing System × Rangeland Production Potential + Stocking Rate
Mod13 Grazing System × Stocking Rate × Rangeland Production Potential
37
Grassland Bird Community Composition
I conducted a principle component analysis (PCA) of the 31 grassland-associated
species detected during bird surveys (Appendix C, Table C1) to assess the effects of
livestock grazing management on grassland bird community composition. Multivariate
analyses allowed for the detection of patterns among many species within a community
in relation to variables of interest, such as habitat metrics or treatment effects (Conner
and Adkisson 1977). However, this approach does not consider heterogeneity in detection
probabilities of the grassland bird species within my study area. Previous researchers
have suggested that failure to account for variable detection probabilities of species
among habitats may lead to biased ecological inferences (McNew and Handel 2015). I
considered this potential source of bias, but assumed constant detection probability of
species among treatments within my study area. Conducting multiple visits to sites
increases the probability of species detection, and results in less biased estimates of
species occurrence when compared to single-visit surveys. Additionally, the relatively
high detection probability of grassland bird species during the breeding season and the
relatively low species diversity within grassland ecosystems when compared to other
ecosystems (Wiens 1973, Cody 1985, Rahmig et al. 2009) helped justify my assumption
of constant detection probability of grassland bird species among treatments.
I created a matrix of presence/absence designation for all grassland-associated
species at each of 610 survey sites within three livestock grazing systems. I used the
principle component object created from the species matrix to plot the grassland bird
community associated with each survey site relative to the three grazing systems. I
38
assessed grassland bird community separation among grazing systems from ellipses of
95% probability based on a normal distribution using ‘ggbiplot,’ an extension within R
package ‘ggplot2’ (Vu 2011, Wickham 2016).
Effects of Grazing System on Local Vegetation Conditions
To evaluate whether vegetation conditions varied among grazing treatments, I
tested for significant differences (p < 0.05) among vegetation measurements using a
Kruskal-Wallis non-parametric test, as the assumptions for evaluation using a one-way
ANOVA were not met for every variable.
RESULTS
I conducted 1,830 point count surveys within eight pastures managed for cattle
grazing: two pastures managed in season-long grazing systems, three pastures in 2-
pasture summer-rotation grazing systems, and three pastures in rest-rotation grazing
systems. I identified a total of 68 species during point count surveys, 31 of which were
grassland-associated species (Appendix C1). I defined grassland-associated species as a
“species that has become adapted to and reliant on some variety of grassland habitat for
part or all of its life cycle” (Vickery et al. 1999). I selected three focal species as
representative of three broader guilds of grassland birds, where ‘guild’ was defined as an
assemblage of grassland bird species with overlapping niche requirements within their
habitats (Root 1967). Within my study area in the northern mixed-grass prairie, the
grasshopper sparrow (Ammodramus savannarum) was representative of the dense grass
guild of grassland birds (Dechant et al. 2002b, Fritcher et al. 2004, Lipsey and Naugle
2017), the vesper sparrow (Pooecetes gramineus) was representative of the sparse grass
39
guild (Browder et al. 2002, Dechant et al. 2002a), and the western meadowlark (Sturnella
neglecta) was representative of the generalist guild (Davis and Lanyon 2008). These
three ground-nesting obligate grassland species have specific habitat requirements of
native grasslands for breeding, recruitment, and survival throughout the summer grazing
season (Poole 2005). These three species also had the three largest sample sizes within
my study. Given these three focal species were not sexually dimorphic and the majority
of detections were of vocalizing males defending breeding territory, my estimates were
not of true abundance, but rather were estimates of local relative abundance. I assumed
that the bias in sex-specific detection probability was consistent among treatments for the
three focal species, making relative abundance an appropriate metric to assess local
grassland bird populations.
Grasshopper Sparrow
Grasshopper sparrows were detected at 498 (82%) of survey sites. The average (±
SE) probability of detecting a grasshopper sparrow at my study area was 0.819 ± 0.008.
The top model describing grasshopper sparrow detection probability, with full support
included variables Julian day, time of day, slope, and shrub height (Appendix D, Table
D1). The probability of detecting a grasshopper sparrow decreased with slope and time of
day, and showed a quadratic relationship with Julian day and shrub height, where
detection was maximized during the middle of the survey season (~160 Julian day) and a
shrub height of ~30 cm (Appendix E, Figure E1).
After accounting for detection probability, three models shared support (ΔAICc ≤
2.0) for local-scale habitat effects on abundance of grasshopper sparrows (Appendix D,
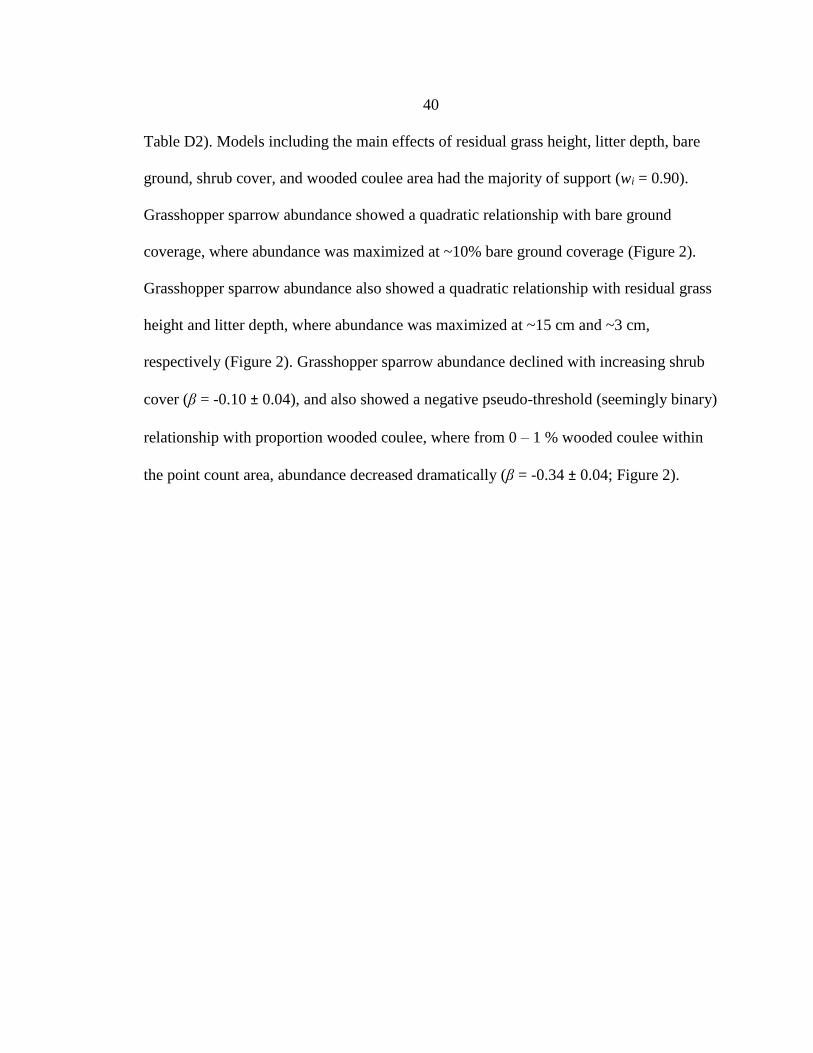
40
Table D2). Models including the main effects of residual grass height, litter depth, bare
ground, shrub cover, and wooded coulee area had the majority of support (wi = 0.90).
Grasshopper sparrow abundance showed a quadratic relationship with bare ground
coverage, where abundance was maximized at ~10% bare ground coverage (Figure 2).
Grasshopper sparrow abundance also showed a quadratic relationship with residual grass
height and litter depth, where abundance was maximized at ~15 cm and ~3 cm,
respectively (Figure 2). Grasshopper sparrow abundance declined with increasing shrub
cover (β = -0.10 ± 0.04), and also showed a negative pseudo-threshold (seemingly binary)
relationship with proportion wooded coulee, where from 0 – 1 % wooded coulee within
the point count area, abundance decreased dramatically (β = -0.34 ± 0.04; Figure 2).
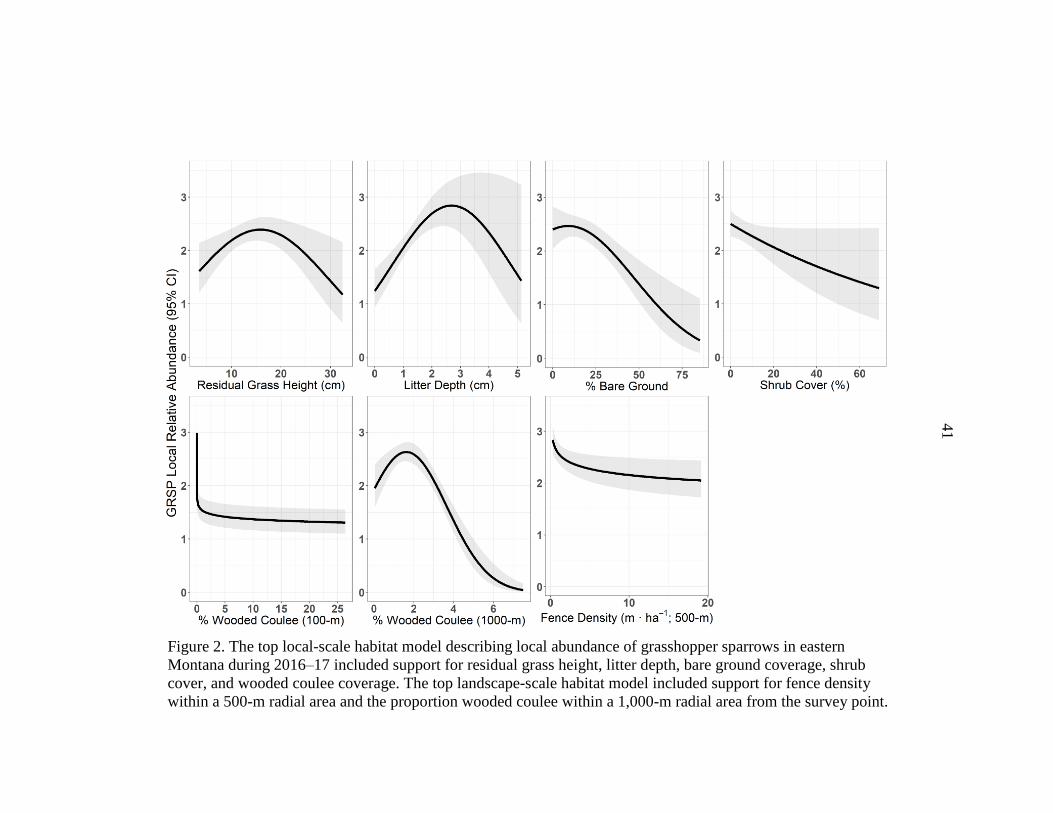
41
Figure 2. The top local-scale habitat model describing local abundance of grasshopper sparrows in eastern
Montana during 2016–17 included support for residual grass height, litter depth, bare ground coverage, shrub
cover, and wooded coulee coverage. The top landscape-scale habitat model included support for fence density
within a 500-m radial area and the proportion wooded coulee within a 1,000-m radial area from the survey point.
42
The top landscape-scale habitat model describing grasshopper sparrow abundance
included variables fence density within a 500-m radius and the proportion wooded coulee
within a 1,000-m radius of survey points (Appendix D, Table D3). Grasshopper sparrow
abundance showed a negative pseudo-asymptotic relationship with increasing fence
density (500-m), where abundance decreased sharply from 0 to 5 m ⋅ ha-1 (β = -0.08 ±
0.03; Figure 2). Grasshopper sparrow abundance showed a quadratic relationship with
increasing proportion coulee (1,000-m), where abundance was maximized at ~1.75%
wooded coulee, and decreased sharply beyond 2% wooded coulee at the 1,000-m scale
(Figure 2).
The top management-level model for grasshopper sparrow, which had the
majority of model support (AICc wi = 0.86), included an interaction between grazing
system and rangeland production potential, and main effect of stocking rate (Appendix D,
Table D4). Grasshopper sparrow abundance showed a positive relationship with
increasing rangeland production potential in season-long grazing systems (β = 0.25 ±
0.11; -0.02 ± 0.07), while a quadratic relationship was supported in summer-rotation (β =
0.60 ± 0.08; -0.30 ± 0.08) and rest-rotation grazing systems (β = 0.38 ± 0.05; -0.18 ±
0.04), where abundance was maximized at intermediate production potential (Figure 3).
Grasshopper sparrow abundance showed a negative relationship with increasing stocking
rate (β = -0.10 ± 0.03), and the effect was similar among grazing systems (Figure 4).
43
Figure 3. The top management-level model describing grasshopper sparrow abundance in
eastern Montana during 2016–17 included an interaction between grazing system and
rangeland production potential.
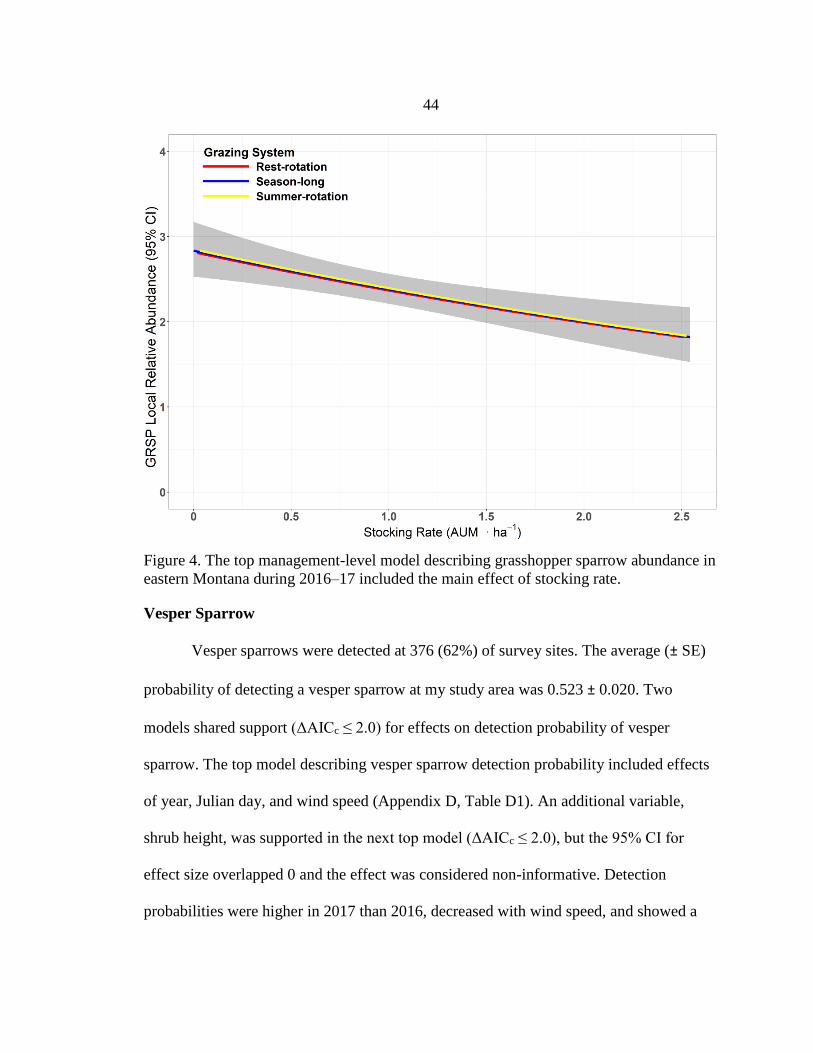
44
Figure 4. The top management-level model describing grasshopper sparrow abundance in
eastern Montana during 2016–17 included the main effect of stocking rate.
Vesper Sparrow
Vesper sparrows were detected at 376 (62%) of survey sites. The average (± SE)
probability of detecting a vesper sparrow at my study area was 0.523 ± 0.020. Two
models shared support (ΔAICc ≤ 2.0) for effects on detection probability of vesper
sparrow. The top model describing vesper sparrow detection probability included effects
of year, Julian day, and wind speed (Appendix D, Table D1). An additional variable,
shrub height, was supported in the next top model (ΔAICc ≤ 2.0), but the 95% CI for
effect size overlapped 0 and the effect was considered non-informative. Detection
probabilities were higher in 2017 than 2016, decreased with wind speed, and showed a
45
quadratic relationship with Julian day, where vesper sparrow detection probability was
highest at the beginning and end of the survey season (Appendix E, Figure E2).
After accounting for detection probability, five models shared support (ΔAICc ≤
2.0) for local-scale habitat effects on abundance of vesper sparrows (Appendix D, Table
D2). Models including the main effects of visual obstruction, forb coverage, litter depth,
bare ground coverage, and shrub cover had the majority of support (wi = 0.68). Vesper
sparrow abundance showed a positive relationship with increasing bare ground coverage
(β = 0.18 ± 0.05), litter depth (β = 0.11 ± 0.05), and forb coverage (β = 0.08 ± 0.05), and a
negative relationship with visual obstruction (β = -0.11 ± 0.05; Figure 5, Appendix F,
Table F1). Vesper sparrow abundance showed a positive pseudo-asymptotic relationship
with shrub cover (β = 0.17 ± 0.05), where from 0 – 1 % shrub cover, abundance increased
sharply, and beyond 1 % shrub cover the effect on abundance was similar (Figure 5,
Appendix F, Table F1). Residual grass height and coverage were not included in the top
model, but a model including these variables did have support (ΔAICc < 1). Vesper
sparrow abundance showed a positive relationship with residual grass height (β = 0.07 ±
0.05), and a negative relationship with residual grass coverage (β = -0.07 ± 0.06).
Two models shared support (ΔAICc ≤ 2.0) for landscape-scale effects on
abundance of vesper sparrows. Supported variables included fence density and the
amount of wooded coulee within a 1,000-m radius from survey points (Appendix D,
Table D3). Vesper sparrow abundance showed a negative relationship with increasing
fence density (β = -0.07 ± 0.04) and a positive pseudo-asymptotic relationship with
increasing wooded coulee at the 1,000-m scale (β = 0.16 ± 0.05; Figure 5).
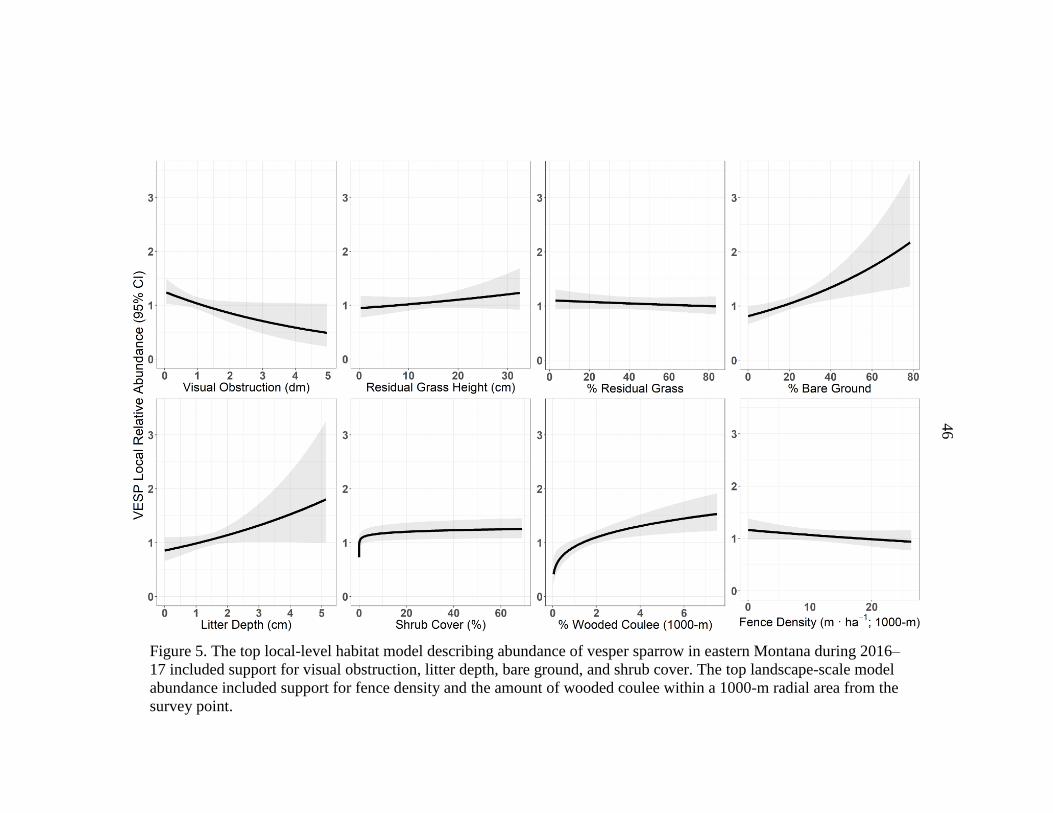
46
Figure 5. The top local-level habitat model describing abundance of vesper sparrow in eastern Montana during 2016–
17 included support for visual obstruction, litter depth, bare ground, and shrub cover. The top landscape-scale model
abundance included support for fence density and the amount of wooded coulee within a 1000-m radial area from the
survey point.
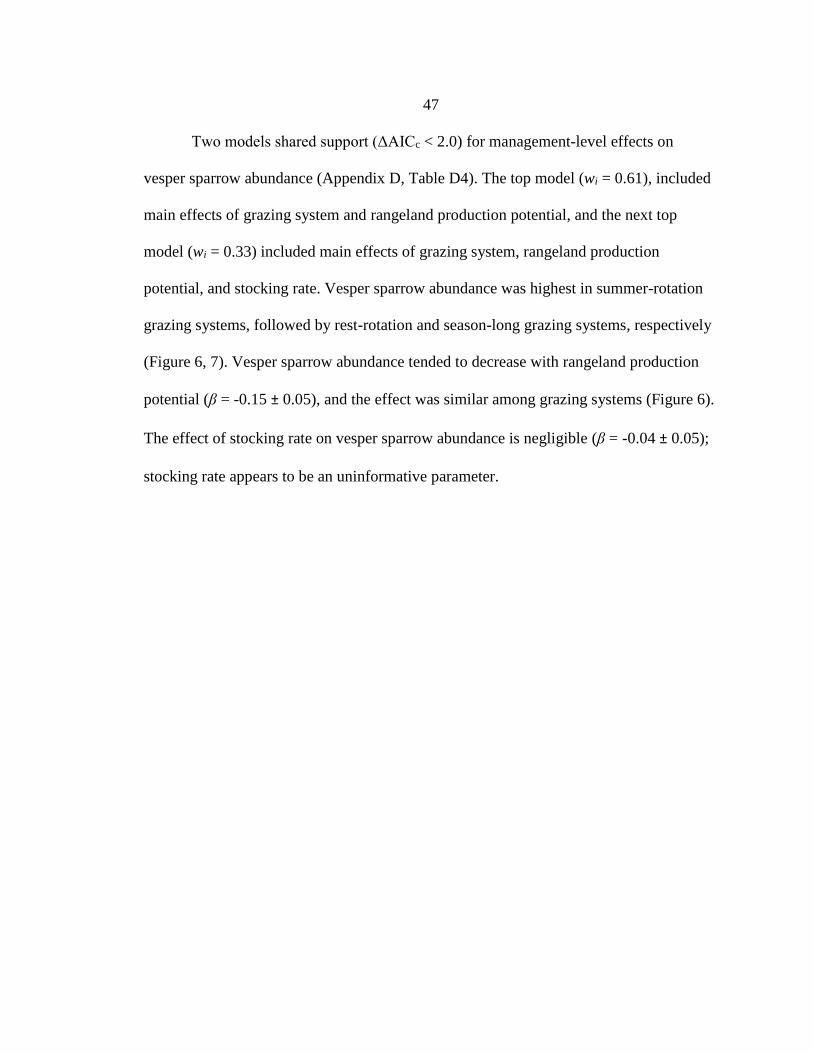
47
Two models shared support (ΔAICc < 2.0) for management-level effects on
vesper sparrow abundance (Appendix D, Table D4). The top model (wi = 0.61), included
main effects of grazing system and rangeland production potential, and the next top
model (wi = 0.33) included main effects of grazing system, rangeland production
potential, and stocking rate. Vesper sparrow abundance was highest in summer-rotation
grazing systems, followed by rest-rotation and season-long grazing systems, respectively
(Figure 6, 7). Vesper sparrow abundance tended to decrease with rangeland production
potential (β = -0.15 ± 0.05), and the effect was similar among grazing systems (Figure 6).
The effect of stocking rate on vesper sparrow abundance is negligible (β = -0.04 ± 0.05);
stocking rate appears to be an uninformative parameter.
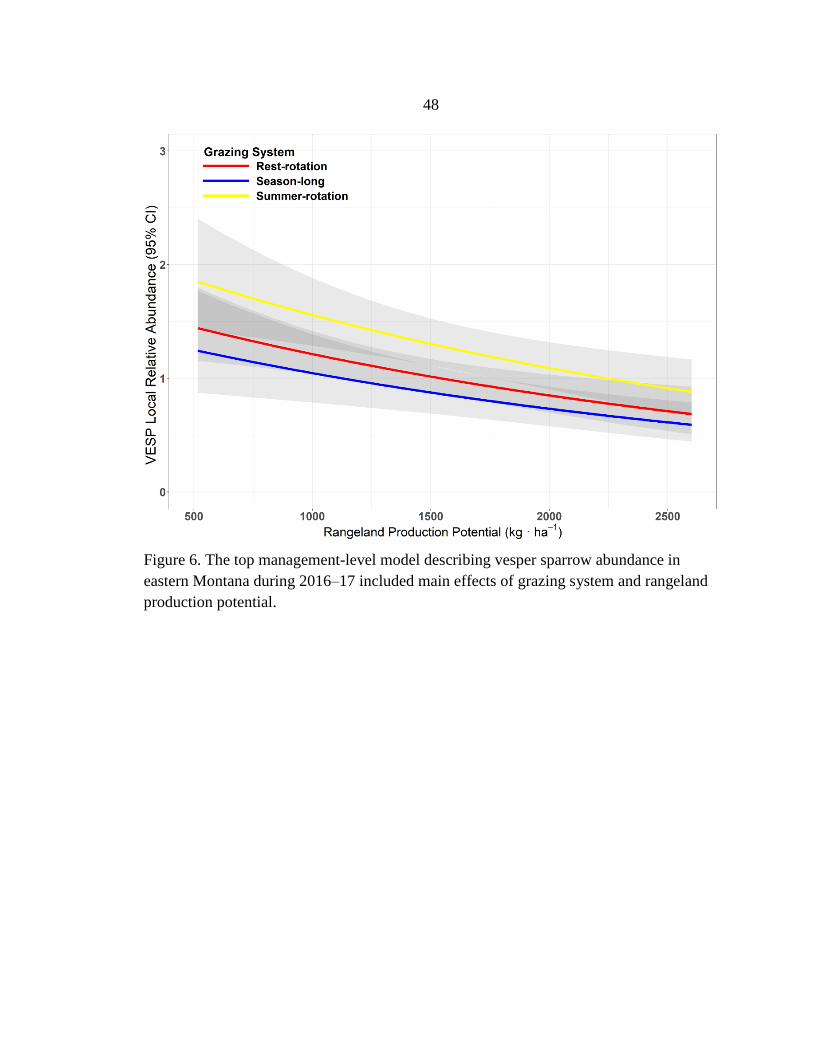
48
Figure 6. The top management-level model describing vesper sparrow abundance in
eastern Montana during 2016–17 included main effects of grazing system and rangeland
production potential.
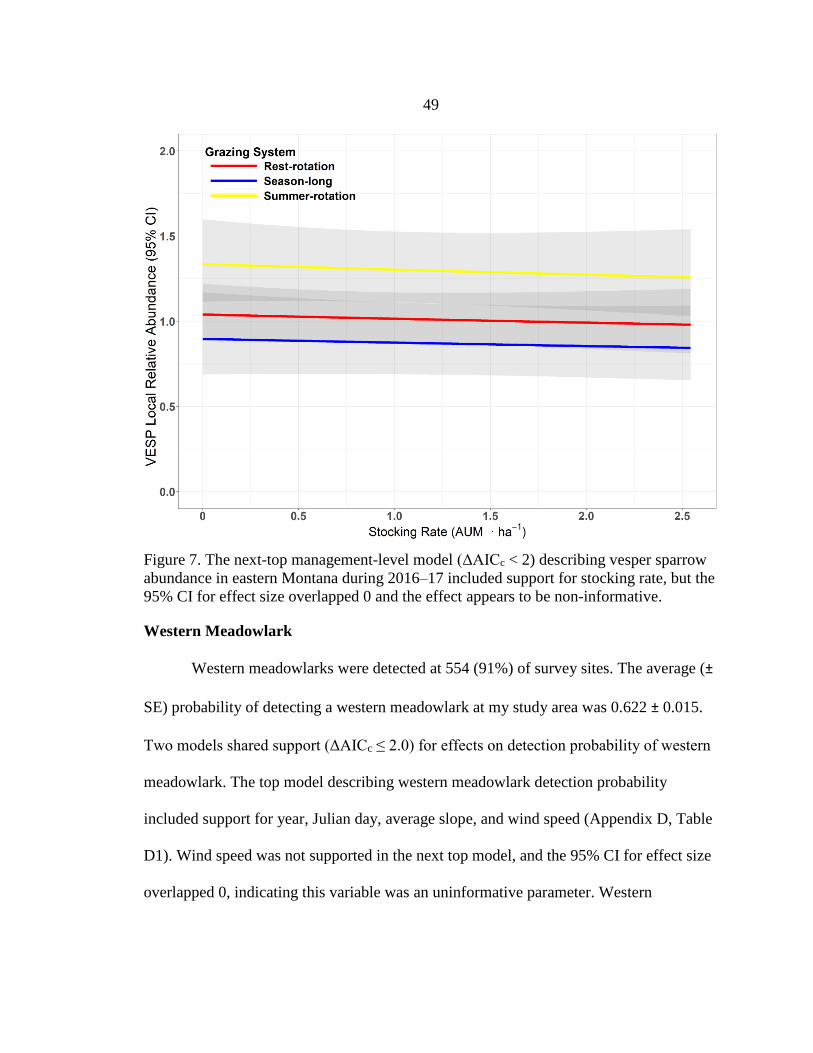
49
Figure 7. The next-top management-level model (ΔAICc < 2) describing vesper sparrow
abundance in eastern Montana during 2016–17 included support for stocking rate, but the
95% CI for effect size overlapped 0 and the effect appears to be non-informative.
Western Meadowlark
Western meadowlarks were detected at 554 (91%) of survey sites. The average (±
SE) probability of detecting a western meadowlark at my study area was 0.622 ± 0.015.
Two models shared support (ΔAICc ≤ 2.0) for effects on detection probability of western
meadowlark. The top model describing western meadowlark detection probability
included support for year, Julian day, average slope, and wind speed (Appendix D, Table
D1). Wind speed was not supported in the next top model, and the 95% CI for effect size
overlapped 0, indicating this variable was an uninformative parameter. Western
50
meadowlark detection probabilities were higher in 2017 than 2016, and decreased with
increasing Julian day and slope (Appendix E, Figure E3).
After accounting for detection probability, four models shared support (ΔAICc ≤
2.0) for local-scale habitat effects on abundance of western meadowlarks (Appendix D,
Table D2). Models including the main effects of visual obstruction, residual grass
coverage, forb coverage, litter depth, and bare ground coverage had the majority of
support (wi = 0.68). Western meadowlark abundance showed a negative relationship with
visual obstruction (β = -0.16 ± 0.04), residual grass coverage (β = -0.11 ± 0.04), and bare
ground coverage (β = -0.09 ± 0.04; Table 3, Figure 8). Western meadowlark abundance
showed a positive pseudo-asymptotic relationship with increasing litter depth (β = 0.22 ±
0.05) and forb coverage (β = 0.09 ± 0.03; Table 3, Figure 8).
The top landscape-scale habitat model describing western meadowlark abundance
included the main effect of wooded coulee (1000-m), where abundance responded
negatively to increasing amounts of wooded coulee within 1,000-m radius of survey
points (β = -0.05 ± 0.03). However, model selection results included support (ΔAICc ≤
2.0) for the null model, indicating little support for landscape-scale effects on abundance
of western meadowlarks.
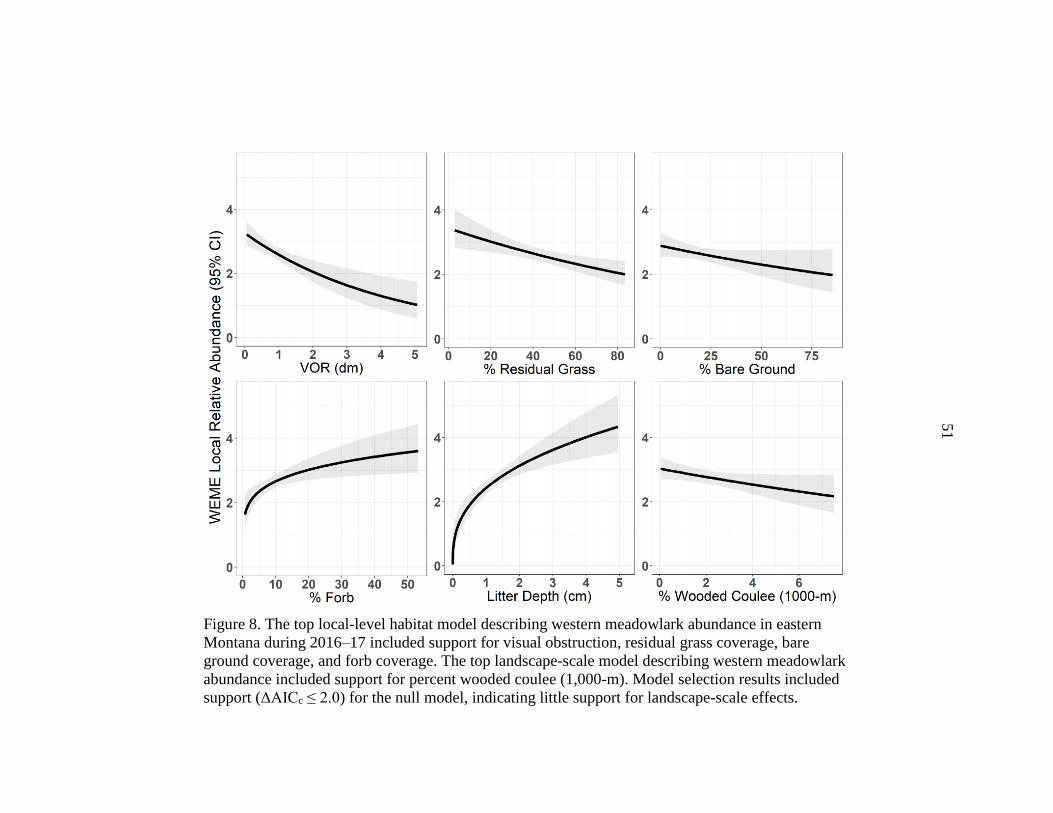
51
Figure 8. The top local-level habitat model describing western meadowlark abundance in eastern
Montana during 2016–17 included support for visual obstruction, residual grass coverage, bare
ground coverage, and forb coverage. The top landscape-scale model describing western meadowlark
abundance included support for percent wooded coulee (1,000-m). Model selection results included
support (ΔAICc ≤ 2.0) for the null model, indicating little support for landscape-scale effects.
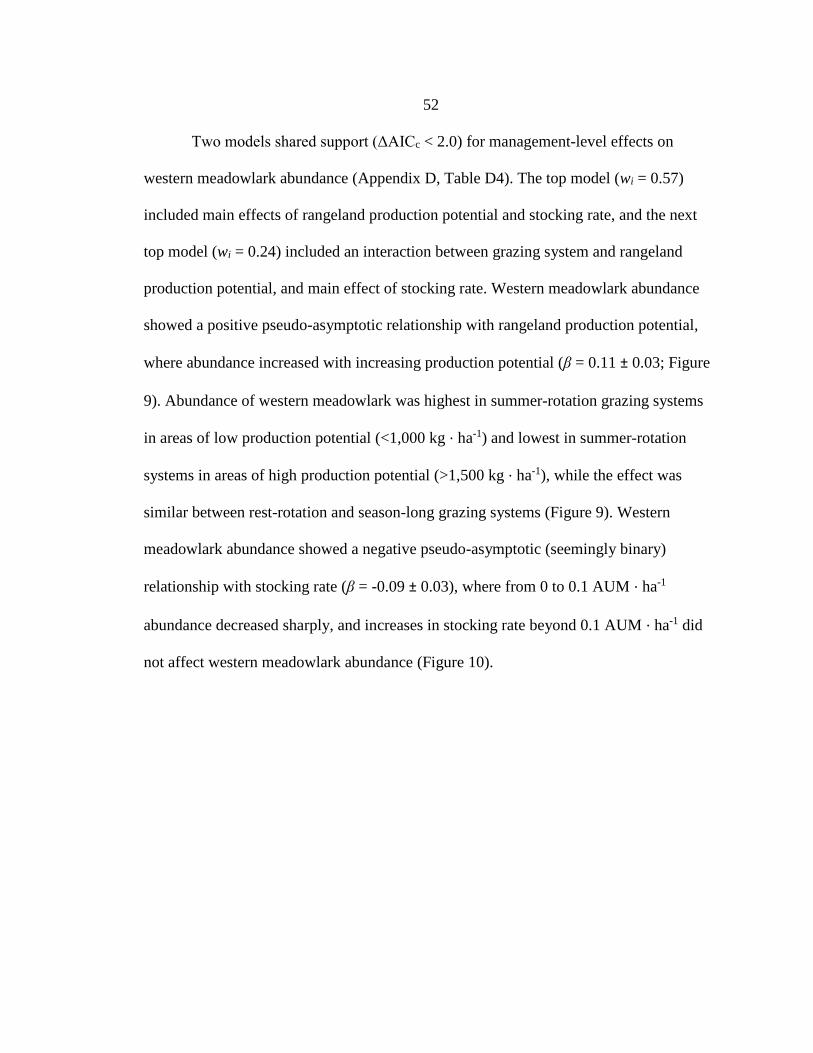
52
Two models shared support (ΔAICc < 2.0) for management-level effects on
western meadowlark abundance (Appendix D, Table D4). The top model (wi = 0.57)
included main effects of rangeland production potential and stocking rate, and the next
top model (wi = 0.24) included an interaction between grazing system and rangeland
production potential, and main effect of stocking rate. Western meadowlark abundance
showed a positive pseudo-asymptotic relationship with rangeland production potential,
where abundance increased with increasing production potential (β = 0.11 ± 0.03; Figure
9). Abundance of western meadowlark was highest in summer-rotation grazing systems
in areas of low production potential (<1,000 kg ⋅ ha-1) and lowest in summer-rotation
systems in areas of high production potential (>1,500 kg ⋅ ha-1), while the effect was
similar between rest-rotation and season-long grazing systems (Figure 9). Western
meadowlark abundance showed a negative pseudo-asymptotic (seemingly binary)
relationship with stocking rate (β = -0.09 ± 0.03), where from 0 to 0.1 AUM ⋅ ha-1
abundance decreased sharply, and increases in stocking rate beyond 0.1 AUM ⋅ ha-1 did
not affect western meadowlark abundance (Figure 10).
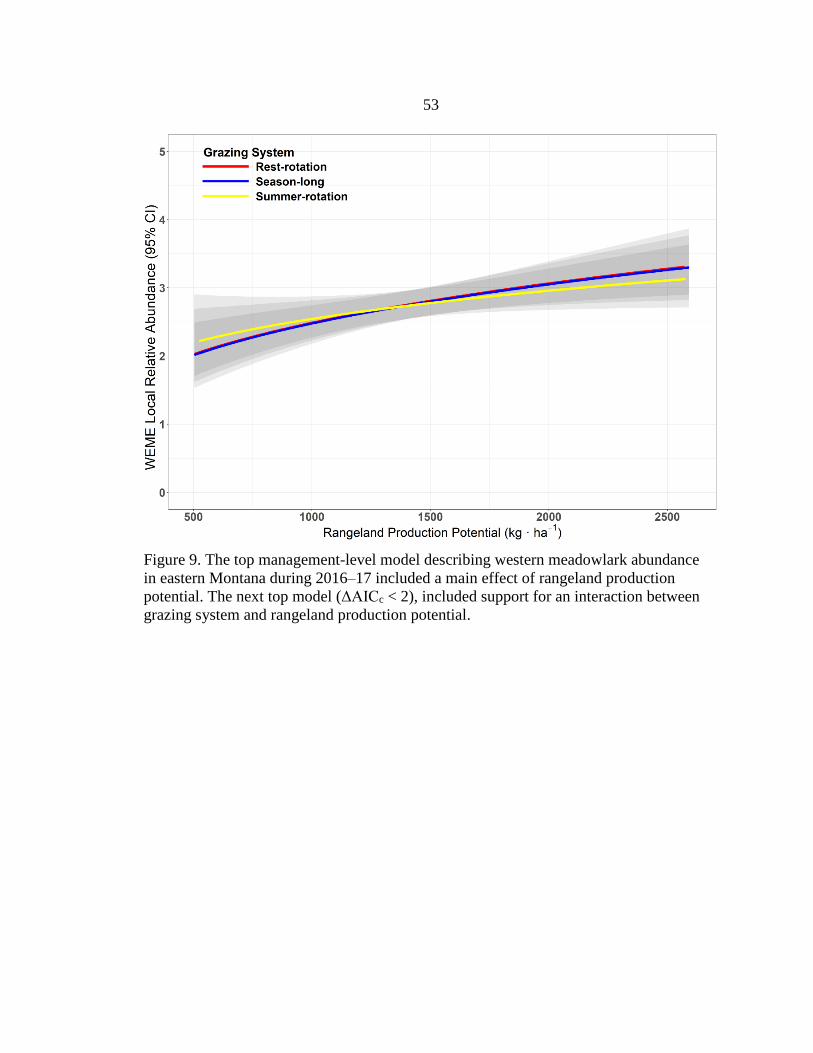
53
Figure 9. The top management-level model describing western meadowlark abundance
in eastern Montana during 2016–17 included a main effect of rangeland production
potential. The next top model (ΔAICc < 2), included support for an interaction between
grazing system and rangeland production potential.
54
Figure 10. The top management-level model describing western meadowlark abundance
in eastern Montana during 2016–17 included main effect of stocking rate.
Grassland-Associated Species
I detected 31 grassland-associated species during point count surveys (Appendix
C, Table C1), and at least one grassland bird was detected at each of 610 bird survey
locations. This analysis combined all 31 grassland-associated species into one group, i.e.
‘grassland birds,’ for each visit to bird survey locations. This specific analysis is not an
index of grassland bird biodiversity, but rather an evaluation of the relationships between
vegetation conditions or rangeland management and the overall abundance of all
grassland birds. The average (± SE) probability of detecting a grassland bird at my study
area was 0.622 ± 0.015. Two models shared support (ΔAICc ≤ 2.0) for effects on
detection probability of grassland birds (Appendix D, Table D1). Models including the
55
main effects of year, observer, Julian day, time, wind speed, and average slope had the
majority of AICc weight (wi = 0.72). Detection probability of total grassland birds was
higher in 2017 than 2016, and observer 1 had the highest detection probability, followed
by observers 2 and 3, respectively (Appendix E, Figure E4). Grassland bird detection
probabilities decreased with increasing Julian day, time of day, and slope.
After accounting for detection probability, four models shared support (ΔAICc ≤
2.0) for local-scale habitat effects on abundance of grassland birds (Appendix D, Table
D2). Models including the main effects of visual obstruction, residual grass coverage,
forb coverage, litter depth, and wooded coulee area had the majority of AICc weight (wi =
0.76). Grassland bird abundance showed a positive relationship with forb coverage (β =
0.05 ± 0.02) and a negative relationship with visual obstruction (β = -0.05 ± 0.02) and
residual grass coverage (β = -0.04 ± 0.02; Figure 11, Appendix F, Table F1). Grassland
bird abundance showed a quadratic relationship with litter depth, where abundance was
maximized at ~3 cm litter depth (Figure 11). Grassland bird abundance showed a positive
pseudo-asymptotic relationship with wooded coulee (β = 0.04 ± 0.02), where from 0 – 1
% coulee, abundance increased sharply, and increases beyond 1 % coulee did not affect
grassland bird abundance (Figure 11).
The top landscape-scale habitat model describing local abundance of all grassland
birds included variables wooded coulee and fence density within a 500-m and 1,000-m
radius of survey points, respectively (Appendix D, Table D3). Grassland bird abundance
decreased with increasing fence density (β = -0.03 ± 0.02), and showed a positive
pseudo-asymptotic relationship with wooded coulee at the 500-m scale (β = 0.03 ± 0.02).
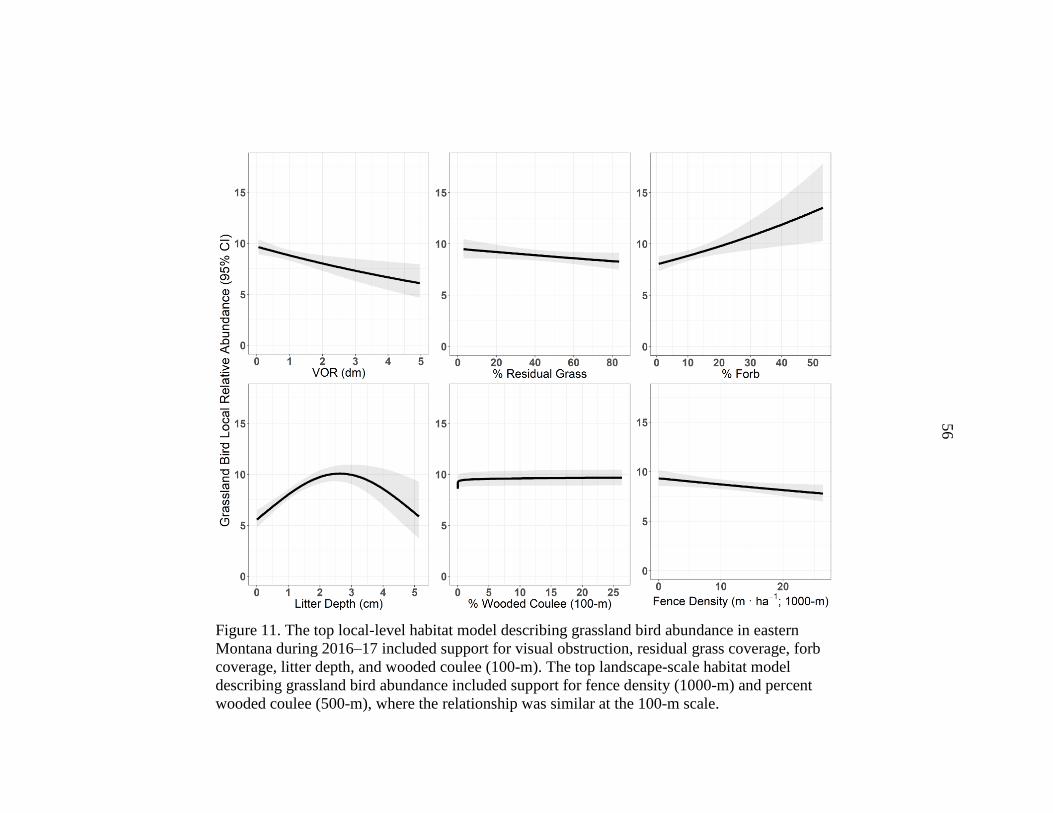
56
Figure 11. The top local-level habitat model describing grassland bird abundance in eastern
Montana during 2016–17 included support for visual obstruction, residual grass coverage, forb
coverage, litter depth, and wooded coulee (100-m). The top landscape-scale habitat model
describing grassland bird abundance included support for fence density (1000-m) and percent
wooded coulee (500-m), where the relationship was similar at the 100-m scale.
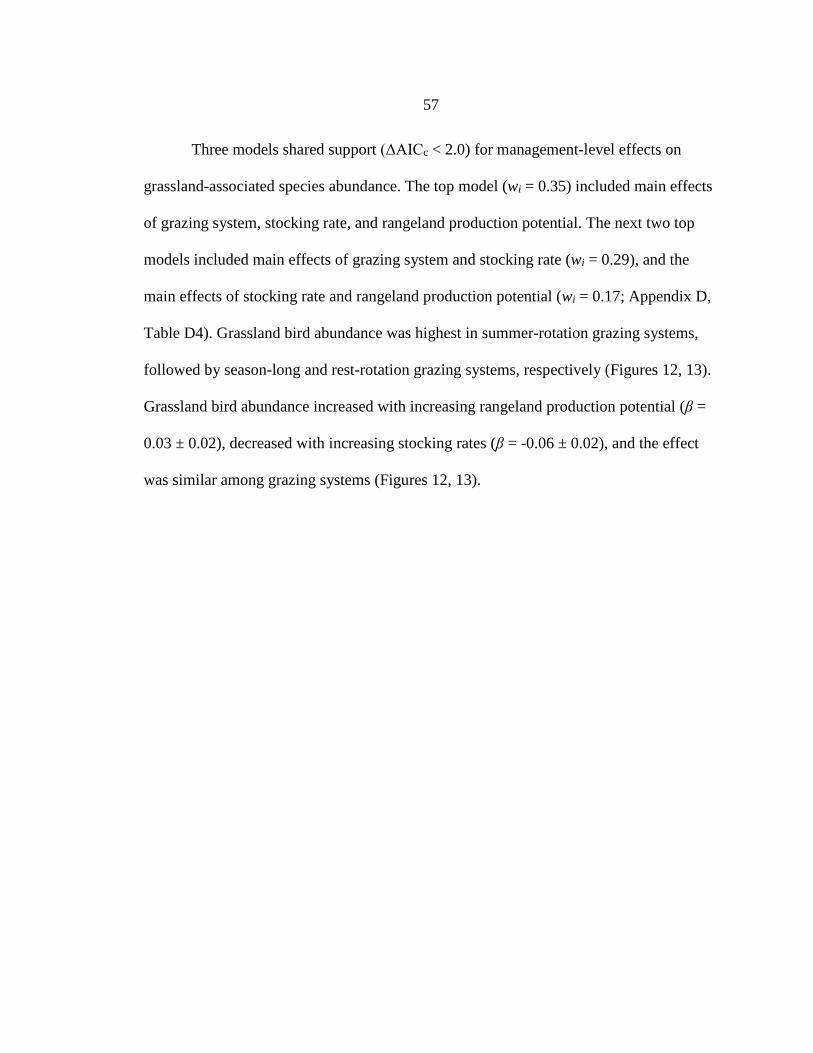
57
Three models shared support (ΔAICc < 2.0) for management-level effects on
grassland-associated species abundance. The top model (wi = 0.35) included main effects
of grazing system, stocking rate, and rangeland production potential. The next two top
models included main effects of grazing system and stocking rate (wi = 0.29), and the
main effects of stocking rate and rangeland production potential (wi = 0.17; Appendix D,
Table D4). Grassland bird abundance was highest in summer-rotation grazing systems,
followed by season-long and rest-rotation grazing systems, respectively (Figures 12, 13).
Grassland bird abundance increased with increasing rangeland production potential (β =
0.03 ± 0.02), decreased with increasing stocking rates (β = -0.06 ± 0.02), and the effect
was similar among grazing systems (Figures 12, 13).
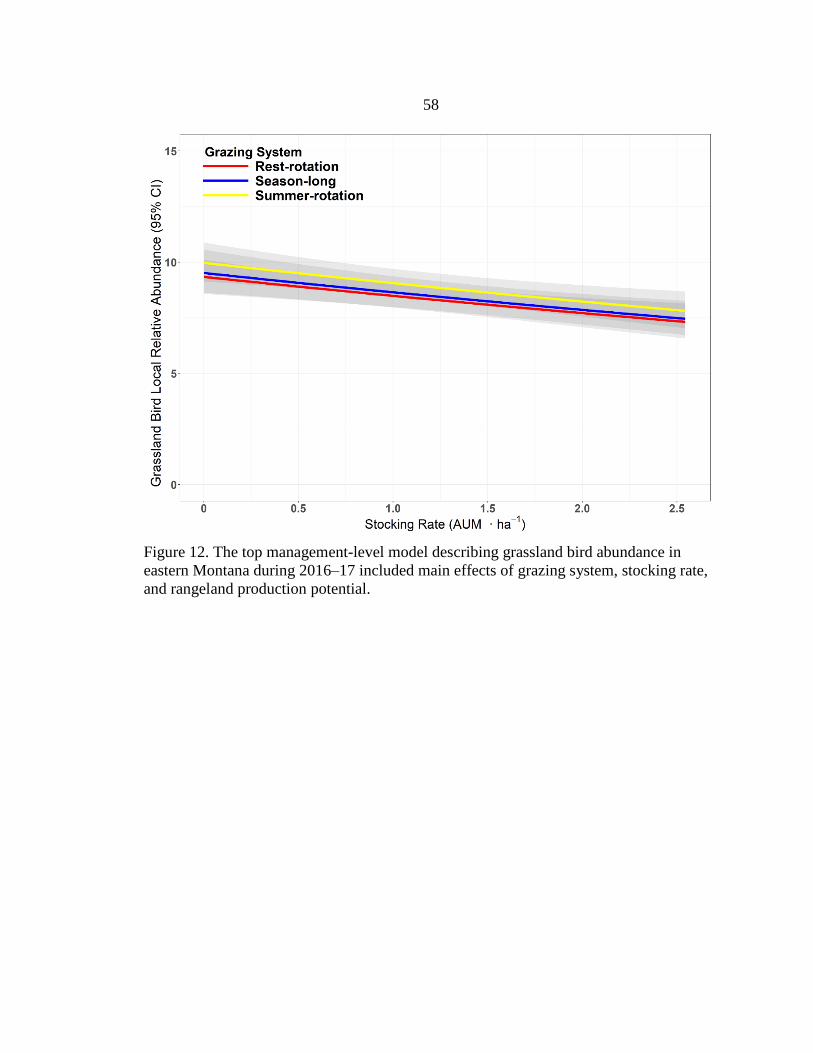
58
Figure 12. The top management-level model describing grassland bird abundance in
eastern Montana during 2016–17 included main effects of grazing system, stocking rate,
and rangeland production potential.
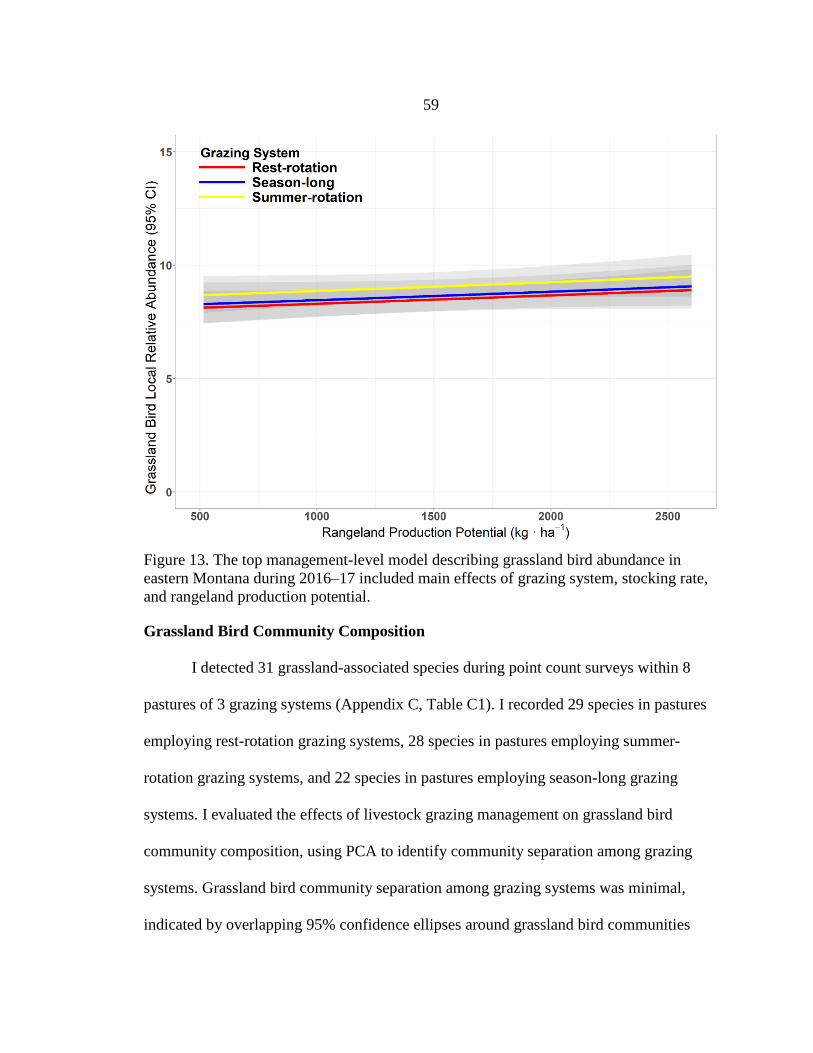
59
Figure 13. The top management-level model describing grassland bird abundance in
eastern Montana during 2016–17 included main effects of grazing system, stocking rate,
and rangeland production potential.
Grassland Bird Community Composition
I detected 31 grassland-associated species during point count surveys within 8
pastures of 3 grazing systems (Appendix C, Table C1). I recorded 29 species in pastures
employing rest-rotation grazing systems, 28 species in pastures employing summer-
rotation grazing systems, and 22 species in pastures employing season-long grazing
systems. I evaluated the effects of livestock grazing management on grassland bird
community composition, using PCA to identify community separation among grazing
systems. Grassland bird community separation among grazing systems was minimal,
indicated by overlapping 95% confidence ellipses around grassland bird communities
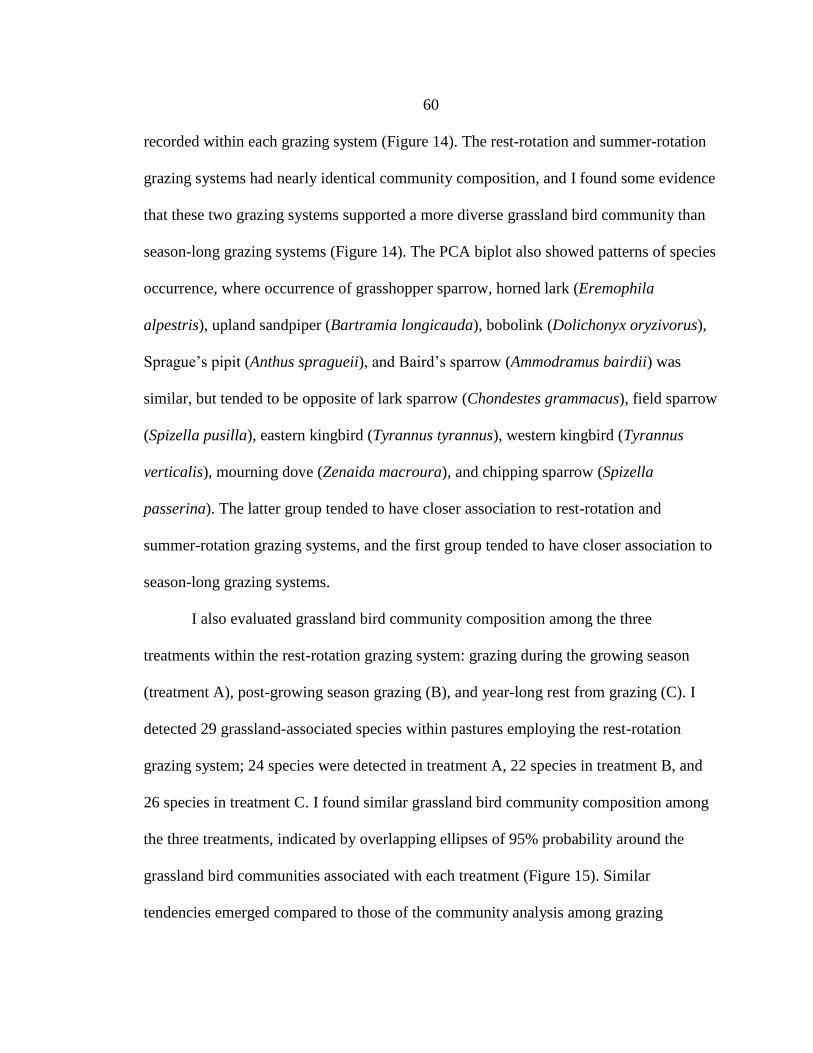
60
recorded within each grazing system (Figure 14). The rest-rotation and summer-rotation
grazing systems had nearly identical community composition, and I found some evidence
that these two grazing systems supported a more diverse grassland bird community than
season-long grazing systems (Figure 14). The PCA biplot also showed patterns of species
occurrence, where occurrence of grasshopper sparrow, horned lark (Eremophila
alpestris), upland sandpiper (Bartramia longicauda), bobolink (Dolichonyx oryzivorus),
Sprague’s pipit (Anthus spragueii), and Baird’s sparrow (Ammodramus bairdii) was
similar, but tended to be opposite of lark sparrow (Chondestes grammacus), field sparrow
(Spizella pusilla), eastern kingbird (Tyrannus tyrannus), western kingbird (Tyrannus
verticalis), mourning dove (Zenaida macroura), and chipping sparrow (Spizella
passerina). The latter group tended to have closer association to rest-rotation and
summer-rotation grazing systems, and the first group tended to have closer association to
season-long grazing systems.
I also evaluated grassland bird community composition among the three
treatments within the rest-rotation grazing system: grazing during the growing season
(treatment A), post-growing season grazing (B), and year-long rest from grazing (C). I
detected 29 grassland-associated species within pastures employing the rest-rotation
grazing system; 24 species were detected in treatment A, 22 species in treatment B, and
26 species in treatment C. I found similar grassland bird community composition among
the three treatments, indicated by overlapping ellipses of 95% probability around the
grassland bird communities associated with each treatment (Figure 15). Similar
tendencies emerged compared to those of the community analysis among grazing
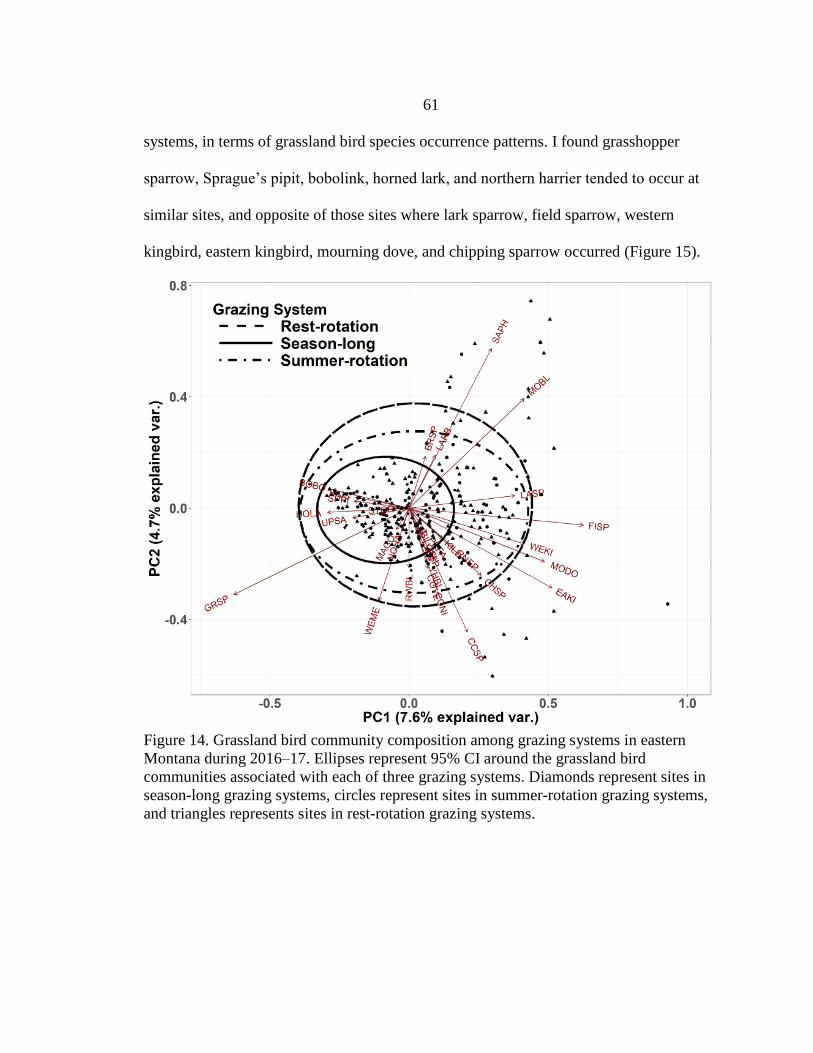
61
systems, in terms of grassland bird species occurrence patterns. I found grasshopper
sparrow, Sprague’s pipit, bobolink, horned lark, and northern harrier tended to occur at
similar sites, and opposite of those sites where lark sparrow, field sparrow, western
kingbird, eastern kingbird, mourning dove, and chipping sparrow occurred (Figure 15).
Figure 14. Grassland bird community composition among grazing systems in eastern
Montana during 2016–17. Ellipses represent 95% CI around the grassland bird
communities associated with each of three grazing systems. Diamonds represent sites in
season-long grazing systems, circles represent sites in summer-rotation grazing systems,
and triangles represents sites in rest-rotation grazing systems.
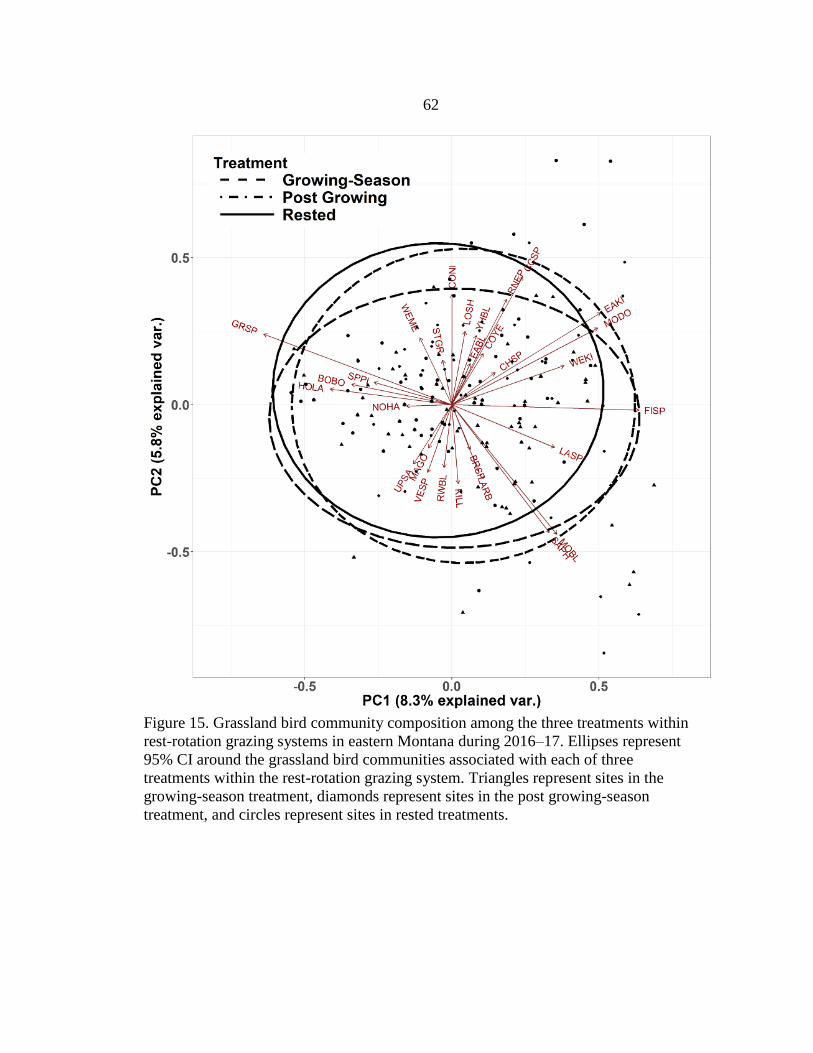
62
Figure 15. Grassland bird community composition among the three treatments within
rest-rotation grazing systems in eastern Montana during 2016–17. Ellipses represent
95% CI around the grassland bird communities associated with each of three
treatments within the rest-rotation grazing system. Triangles represent sites in the
growing-season treatment, diamonds represent sites in the post growing-season
treatment, and circles represent sites in rested treatments.
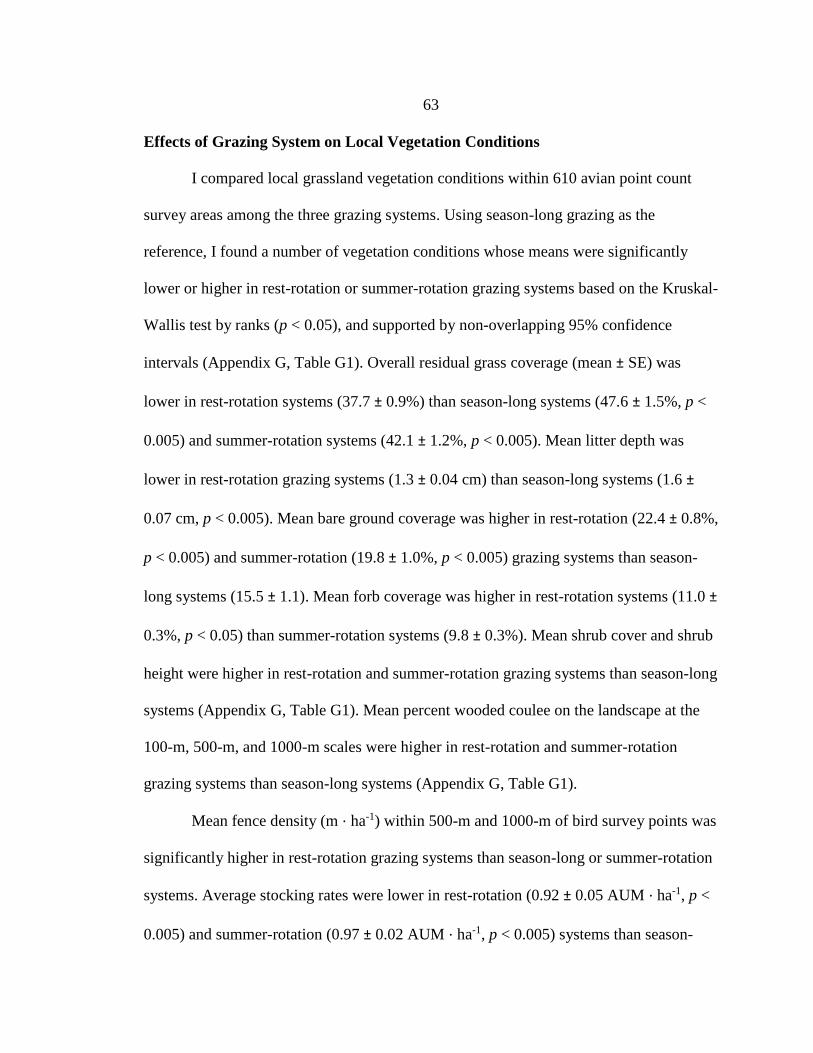
63
Effects of Grazing System on Local Vegetation Conditions
I compared local grassland vegetation conditions within 610 avian point count
survey areas among the three grazing systems. Using season-long grazing as the
reference, I found a number of vegetation conditions whose means were significantly
lower or higher in rest-rotation or summer-rotation grazing systems based on the Kruskal-
Wallis test by ranks (p < 0.05), and supported by non-overlapping 95% confidence
intervals (Appendix G, Table G1). Overall residual grass coverage (mean ± SE) was
lower in rest-rotation systems (37.7 ± 0.9%) than season-long systems (47.6 ± 1.5%, p <
0.005) and summer-rotation systems (42.1 ± 1.2%, p < 0.005). Mean litter depth was
lower in rest-rotation grazing systems (1.3 ± 0.04 cm) than season-long systems (1.6 ±
0.07 cm, p < 0.005). Mean bare ground coverage was higher in rest-rotation (22.4 ± 0.8%,
p < 0.005) and summer-rotation (19.8 ± 1.0%, p < 0.005) grazing systems than season-
long systems (15.5 ± 1.1). Mean forb coverage was higher in rest-rotation systems (11.0 ±
0.3%, p < 0.05) than summer-rotation systems (9.8 ± 0.3%). Mean shrub cover and shrub
height were higher in rest-rotation and summer-rotation grazing systems than season-long
systems (Appendix G, Table G1). Mean percent wooded coulee on the landscape at the
100-m, 500-m, and 1000-m scales were higher in rest-rotation and summer-rotation
grazing systems than season-long systems (Appendix G, Table G1).
Mean fence density (m ⋅ ha-1) within 500-m and 1000-m of bird survey points was
significantly higher in rest-rotation grazing systems than season-long or summer-rotation
systems. Average stocking rates were lower in rest-rotation (0.92 ± 0.05 AUM ⋅ ha-1, p <
0.005) and summer-rotation (0.97 ± 0.02 AUM ⋅ ha-1, p < 0.005) systems than season-
64
long grazing systems (1.3 ± 0.02 AUM ⋅ ha-1). Average rangeland production potential
was lower in rest-rotation (1,372 ± 27 kg ⋅ ha-1, p < 0.005) and summer-rotation (1,518 ±
26 kg ⋅ ha-1, p < 0.005) grazing systems than season-long systems (1,789 ± 29 kg ⋅ ha-1).
I evaluated local vegetation conditions among the three grazing treatments within
the rest-rotation grazing system (growing season, post seed-ripe, and rested), based on
cattle stocking from the previous year’s grazing season. The grazing periods for each of
these treatments are approximately June 1 – August 15 for grazing during the growing
season, August 15 – November 15 for grazing after the growing season (post seed-ripe),
and rest from grazing for one grazing season. Using the growing-season treatment as the
reference, I found a number of vegetation conditions whose means were significantly
lower or higher in post seed-ripe or rested treatments, based on the Kruskal-Wallis test by
ranks (p < 0.05), and supported by non-overlapping 95% confidence intervals (Appendix
G, Table G2). Rested pastures had higher visual obstruction readings (VOR), residual
grass heights, and litter depth than pastures grazed during the growing season or post
seed-ripe (Appendix G, Table G2). Rested pastures had lower bare ground coverage (18.3
± 1.2%) than pastures grazed during the growing season (24.7 ± 1.5%, p < 0.005) or post
seed-ripe (24.2 ± 1.4%, p < 0.005). Pastures grazed post seed-ripe had lower residual
grass coverage (32.5 ± 1.3%) than pastures grazed during the growing season (40.3 ±
1.9%, p < 0.005) or pastures rested from grazing (39.9 ± 1.5%, p < 0.005). Rested
pastures had higher average rangeland production potential than grazed pastures (p <
0.005), which may have accounted for some of the effects I found in local vegetation
conditions in these pastures compared to grazed pastures.
65
DISCUSSION
Grassland birds have displayed guild-specific (dense-grass vs. sparse-grass)
habitat selection along gradients of low to high rangeland productivity at the landscape
scale (Lipsey and Naugle 2017). Researchers have suggested that in wet years, sparse-
grass species will tend to select areas of lower rangeland productivity, and that higher
livestock grazing intensity in these years may help create desirable habitat for the sparse-
grass guild. Contrarily, in dry years, dense-grass species will tend to select areas of
higher rangeland productivity, and lower grazing intensity in these years may help create
desirable habitat for the dense-grass guild (Lipsey and Naugle 2017). I evaluated the
response of grassland birds to rangeland production potential in the context of both
livestock grazing systems and stocking rates in eastern Montana, during two years of
nearly average precipitation. The wide range of annual rangeland production potential
among pastures within my study area made this an ideal site to evaluate the effects of
rangeland production potential on abundance of grassland birds.
Results from my analyses indicated relationships between the relative local
abundances of three grassland obligate bird species and three management-scale
variables: grazing system, stocking rate, and rangeland production potential. The effect of
rangeland production potential on the local abundance of grasshopper sparrow and
western meadowlark depended upon the specific livestock grazing system. The ability of
an ecological site to produce the vegetation structure required by a specific species or
guild of grassland birds varies annually depending upon soil moisture (Lipsey and Naugle
2017). Even during average years, my results indicate that the response of grassland birds
66
to grazing system may not be similar across areas of variable rangeland production
potential within grassland ecosystems, and the effects of grazing system on grassland bird
ecology may be mediated by rangeland production. These findings suggest that
inconsistencies within published literature reporting effects of livestock grazing systems
on the ecology of grassland birds, even within a single prairie ecosystem (i.e., northern
mixed-grass prairie; Messmer 1990, Buskness et al. 2001, Ranellucci et al. 2012, Davis et
al. 2014) may be due to the influence of variable rangeland productivity or other
mediating factors among study sites.
The typical range management goals of rotational grazing systems are even
distribution and consistent forage utilization among pastures, and the implementation of
this type of rotational system has been suggested to work at cross-purposes with wildlife
conservation goals of increasing structural heterogeneity within rangelands (Toombs and
Roberts 2009). The effect of grazing system was supported for each of three obligate
grassland birds. Abundance of grasshopper sparrow, representing the dense-grass guild,
was generally highest in season-long grazing systems. Abundance of vesper sparrow,
representing the sparse-grass guild, was highest in summer-rotation grazing systems. The
main effect of grazing system was also supported in the most parsimonious model for all
grassland-associated species combined, and predicted abundance was highest in summer-
rotation grazing systems. These results are inconsistent with my hypothesis that grassland
birds will generally benefit from rest-rotation grazing, a system that conceptually creates
patch-heterogeneity on the landscape when compared to the two more commonly
employed grazing systems in my study area. Additionally, my analysis of grassland bird
67
community composition among the three grazing systems showed that summer-rotation
and rest-rotation grazing systems had nearly identical apparent species diversity and
community composition. The diversity of grassland birds was also similar among the
three treatments (grazing during the growing-season, grazing post seed-ripe, and rested
from grazing) within the rest-rotation grazing system, with no guild-specific distinction
among treatments. Overall, I did not find support for a noticeable benefit of rest-rotation
grazing on abundance or diversity of grassland birds relative to two more commonly
employed grazing systems, season-long and summer-rotation grazing, in mixed-grass
prairie rangelands of northeastern Montana.
There are a number of potential explanations for my results at the management-
level, the most probable being 1) the rest-rotation grazing system did not create patch-
heterogeneity in vegetation structure on the rangeland, 2) the rest-rotation grazing system
created patch-heterogeneity, but not at the scale required by grassland birds at my study
area, 3) the response of grassland birds to patch-heterogeneity at my study area is
conditional upon precipitation, and was not apparent during 2 years of average
conditions, 4) grassland birds at my study area do not select for patch-heterogeneity, but
rather require small-scale, within-pasture heterogeneity, or 5) grassland birds at my study
area do not require structural heterogeneity within their habitats. My evaluation of local
vegetation conditions among pasture types within the rest-rotation grazing system found
that the system did create patch-size heterogeneity in rangeland vegetation structure
among treatments, as conceptualized by previous researchers (Hagen et al. 2004, With et
al. 2008, Toombs et al. 2010). Pastures rested from livestock grazing the previous year
68
had significantly (p < 0.05) higher visual obstruction, residual grass height, and litter
depth, and significantly lower bare ground than the two grazed treatments, and the post-
seed ripe grazing treatment had significantly lower residual grass coverage than the other
two treatments.
Because the rest-rotation grazing system created patch-heterogeneity in vegetation
structure, the level of heterogeneity or the scale at which it occurred may not have been
that required by the suite of grassland birds occupying my study area. Despite patch-
heterogeneity, overall residual grass coverage and height, and litter depth were lower, and
bare ground coverage was higher in rest-rotation grazing systems than season-long or
summer-rotation grazing systems. Additionally, my analysis of the vegetation conditions
associated with only the rested treatment within the rest-rotation system showed that this
system fell short of a major objective; it failed to create patches of dense-grass habitat
compared to vegetation conditions created by adjacent season-long or summer-rotation
grazing systems. While the rested treatment within the rest-rotation grazing system did
have taller residual grass height on average, residual grass coverage was higher and bare
ground coverage was lower in season-long and summer-rotation grazing systems than the
rested treatment within rest-rotation grazing systems, and average litter depth between the
rested treatment of rest-rotation systems and season-long grazing systems was similar. As
a result, the only patches of structurally distinct vegetation that the rest-rotation grazing
system may have created compared to the other grazing systems within my study area
were patches of sparse-grass vegetation structure, characterized by low residual grass
height and density, low litter depth, and high bare ground coverage. The mean stocking
69
rate within growing-season treatments was 1.36 AUM ⋅ ha-1, and within post growing-
season treatments was 1.46 AUM ⋅ ha-1. A year of rest from grazing may not be adequate
to overcome the impact of higher stocking rates the previous two years within grazed
treatments, in terms of producing dense-grass vegetation structure for grassland birds at
the patch-scale.
Assuming breeding season abundances of grassland birds within contiguous
native grasslands of the northern mixed-grass prairie are reliable indicators of habitat
quality (Bock and Jones 2004), my evaluation of local vegetation conditions among the
three grazing systems showed that season-long systems created relatively higher habitat
quality for dense-grass species, and rest-rotation grazing systems created relatively higher
quality habitat for sparse-grass species. The relationship between grazing system and
predicted abundance of the dense-grass representative, the grasshopper sparrow, was not
similar among grazing systems, but rather depended upon rangeland production potential.
Local relative abundance of grasshopper sparrow was highest in summer-rotational
grazing systems in areas of moderate rangeland production potential (1,500 – 2,000 kg ⋅
ha-1), but in areas of lower (<1,250 kg ⋅ ha-1) and higher (>2,200 kg ⋅ ha-1) production
potential, season-long grazing systems tended to support greater abundances of
grasshopper sparrow. Local abundance of the sparse-grass representative, the vesper
sparrow, was highest in summer-rotation grazing systems, followed by rest-rotation and
season-long grazing systems, respectively. This result is unexpected based on my
evaluation of vegetation conditions among grazing systems, as rest-rotation grazing
appeared to create the shortest, sparsest vegetation among the three grazing systems.
70
However, abundance of vesper sparrows decreased with rangeland production potential,
possibly indicating that within the sparse-grass guild, habitat selection may be more
closely tied to specific conditions within regions of lower rangeland productivity than to
the vegetation structure created by grazing systems. Additionally, two true sparse-grass
representatives, chestnut-collared longspur (Calcarius ornatus) and McCown’s longspur
(Rhynchophanes mccownii), were not present within my study area during two seasons of
intensive surveying. Based on my habitat evaluation among grazing systems, the rest-
rotation grazing system may have created the most ideal longspur vegetation structure of
the grazing systems in my study, and recent research in a grassland-sagebrush ecosystem
of central Montana observed positive associations between McCown’s longspur
abundance and rest-rotation grazing systems (Golding and Dreitz 2017). If rangeland
productivity is the main driver of habitat selection within the sparse-grass guild of
grassland birds, rest-rotation grazing within an area of highly variable rangeland
production potential, such as that found within my study area, may not provide suitable
habitat at the appropriate scale for this guild of grassland birds.
The scale at which grassland birds require heterogeneity within their breeding
habitats is generally inconsistent in the literature (Wiens 1997, Derner et al. 2009, Hovick
et al. 2015). Small scale, within-pasture heterogeneity is often a product of selective
foraging by grazing livestock, especially when stocking rates are low to moderate and
livestock are allowed to graze season-long, resulting in pastures that have areas of light
and heavily grazed vegetation (Coughenour 1991, Bailey et al. 1998, Fuhlendorf and
Engle 2001, Joseph et al. 2003, Bailey 2005). Within most pastures, areas near water
71
sources and areas with highly palatable or higher quality forage will experience heavy
grazing, and areas far from water sources or with less palatable forage will experience
less intensive grazing (Hormay 1970, Coughenour 1991, Stuth 1991, Hart et al. 1993). In
larger pastures, livestock will not always occupy the entire area, but rather move around
on the landscape and create small-scale heterogeneity within the pasture (Coughenour
1991). My results are consistent with previous work that suggest within-pasture
heterogeneity created by selectively foraging livestock may create vegetation structure at
the appropriate scale required by ground-nesting grassland birds in the northern mixed-
grass prairie (Lusk and Koper 2013).
Fuhlendorf and Engle (2001) suggest that the small-scale heterogeneity created by
moderate intensity, continuous grazing may not produce adequate spatial heterogeneity to
fulfill the diverse requirements of grassland bird species that occupy rangelands. Rather,
more intensive grazing systems that develop larger areas of structurally similar vegetation
should be employed to create large-scale, patch-heterogeneity. Although the rest-rotation
grazing system seemed to create patch-size heterogeneity among treatments, I did not
find evidence supporting its benefit to grassland birds over season-long grazing or
summer-rotation grazing systems, in terms of obligate grassland bird abundance or
grassland bird community composition within my study area during years of average
precipitation conditions. My results may differ from previous work because much of the
research supporting intensive management for the restoration of patch-heterogeneity in
herbaceous vegetation structure has come from tallgrass prairie ecosystems (Fuhlendorf
et al. 2006, Hovick et al. 2015). Additionally, the tallgrass prairie inherently has the
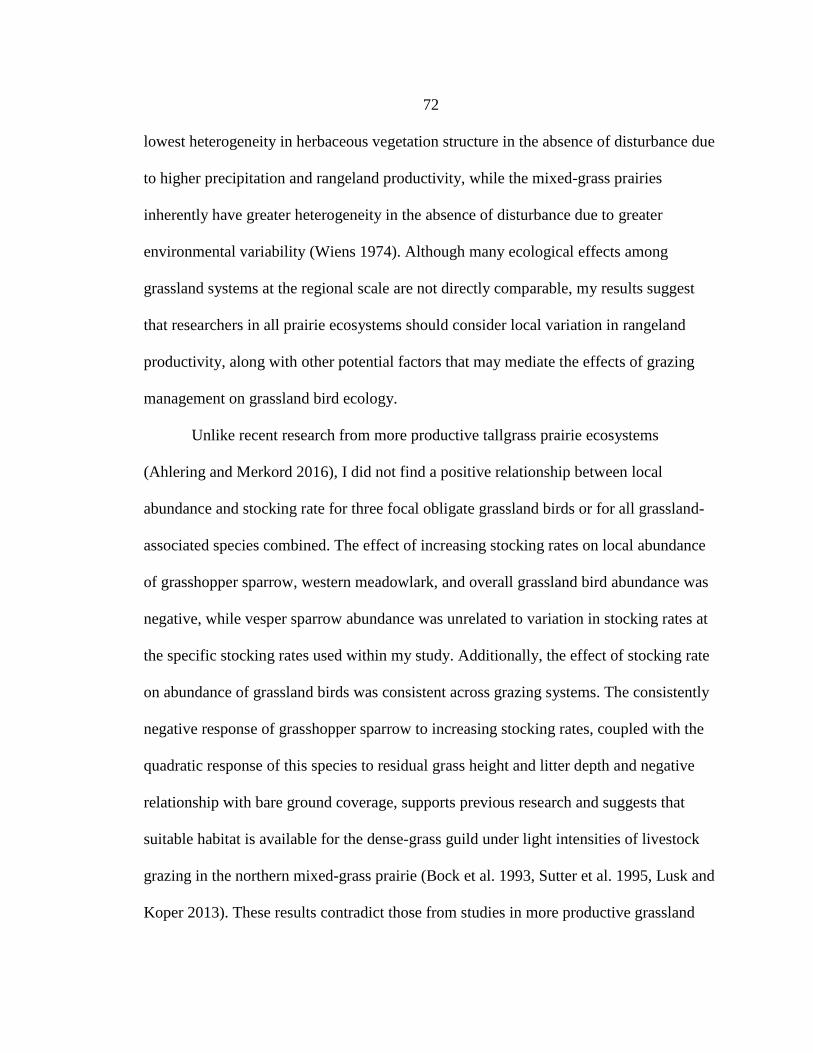
72
lowest heterogeneity in herbaceous vegetation structure in the absence of disturbance due
to higher precipitation and rangeland productivity, while the mixed-grass prairies
inherently have greater heterogeneity in the absence of disturbance due to greater
environmental variability (Wiens 1974). Although many ecological effects among
grassland systems at the regional scale are not directly comparable, my results suggest
that researchers in all prairie ecosystems should consider local variation in rangeland
productivity, along with other potential factors that may mediate the effects of grazing
management on grassland bird ecology.
Unlike recent research from more productive tallgrass prairie ecosystems
(Ahlering and Merkord 2016), I did not find a positive relationship between local
abundance and stocking rate for three focal obligate grassland birds or for all grassland-
associated species combined. The effect of increasing stocking rates on local abundance
of grasshopper sparrow, western meadowlark, and overall grassland bird abundance was
negative, while vesper sparrow abundance was unrelated to variation in stocking rates at
the specific stocking rates used within my study. Additionally, the effect of stocking rate
on abundance of grassland birds was consistent across grazing systems. The consistently
negative response of grasshopper sparrow to increasing stocking rates, coupled with the
quadratic response of this species to residual grass height and litter depth and negative
relationship with bare ground coverage, supports previous research and suggests that
suitable habitat is available for the dense-grass guild under light intensities of livestock
grazing in the northern mixed-grass prairie (Bock et al. 1993, Sutter et al. 1995, Lusk and
Koper 2013). These results contradict those from studies in more productive grassland
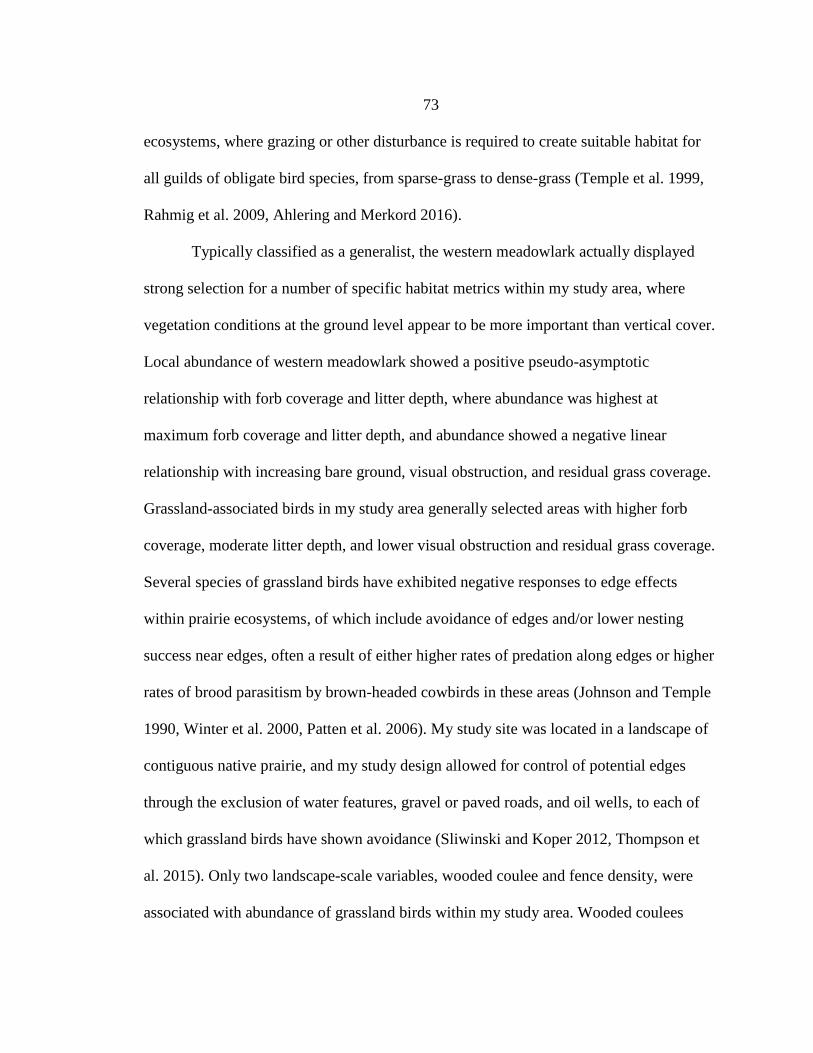
73
ecosystems, where grazing or other disturbance is required to create suitable habitat for
all guilds of obligate bird species, from sparse-grass to dense-grass (Temple et al. 1999,
Rahmig et al. 2009, Ahlering and Merkord 2016).
Typically classified as a generalist, the western meadowlark actually displayed
strong selection for a number of specific habitat metrics within my study area, where
vegetation conditions at the ground level appear to be more important than vertical cover.
Local abundance of western meadowlark showed a positive pseudo-asymptotic
relationship with forb coverage and litter depth, where abundance was highest at
maximum forb coverage and litter depth, and abundance showed a negative linear
relationship with increasing bare ground, visual obstruction, and residual grass coverage.
Grassland-associated birds in my study area generally selected areas with higher forb
coverage, moderate litter depth, and lower visual obstruction and residual grass coverage.
Several species of grassland birds have exhibited negative responses to edge effects
within prairie ecosystems, of which include avoidance of edges and/or lower nesting
success near edges, often a result of either higher rates of predation along edges or higher
rates of brood parasitism by brown-headed cowbirds in these areas (Johnson and Temple
1990, Winter et al. 2000, Patten et al. 2006). My study site was located in a landscape of
contiguous native prairie, and my study design allowed for control of potential edges
through the exclusion of water features, gravel or paved roads, and oil wells, to each of
which grassland birds have shown avoidance (Sliwinski and Koper 2012, Thompson et
al. 2015). Only two landscape-scale variables, wooded coulee and fence density, were
associated with abundance of grassland birds within my study area. Wooded coulees
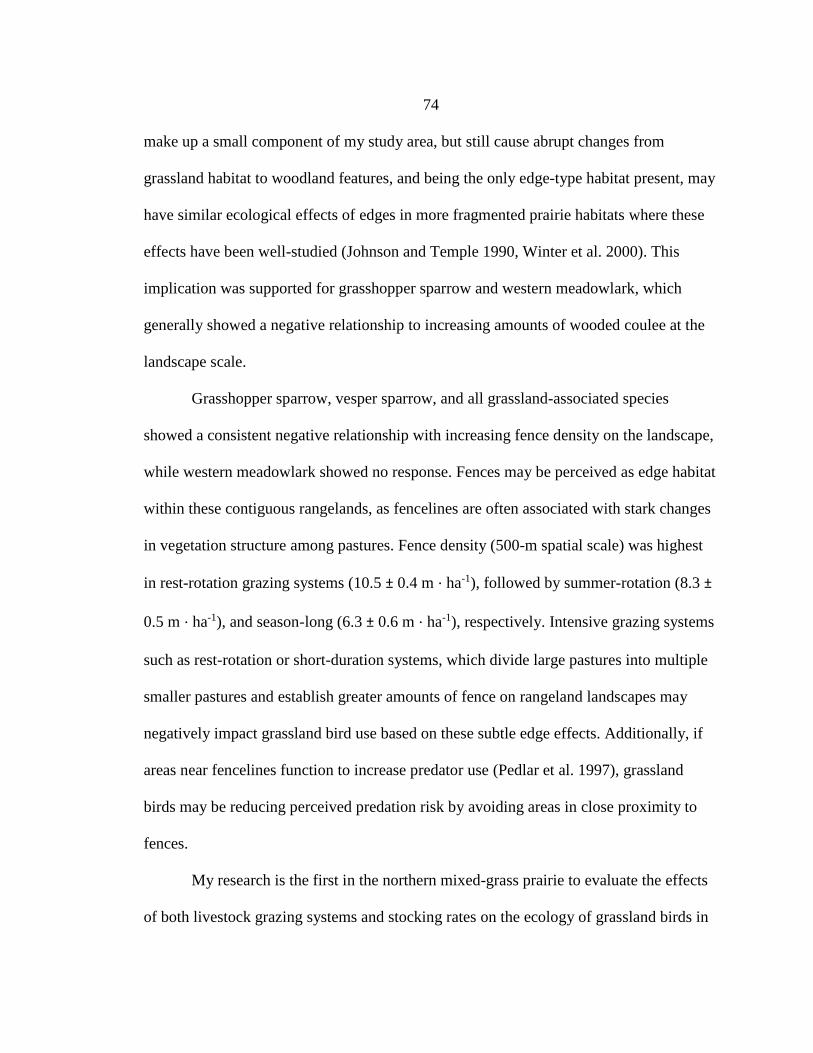
74
make up a small component of my study area, but still cause abrupt changes from
grassland habitat to woodland features, and being the only edge-type habitat present, may
have similar ecological effects of edges in more fragmented prairie habitats where these
effects have been well-studied (Johnson and Temple 1990, Winter et al. 2000). This
implication was supported for grasshopper sparrow and western meadowlark, which
generally showed a negative relationship to increasing amounts of wooded coulee at the
landscape scale.
Grasshopper sparrow, vesper sparrow, and all grassland-associated species
showed a consistent negative relationship with increasing fence density on the landscape,
while western meadowlark showed no response. Fences may be perceived as edge habitat
within these contiguous rangelands, as fencelines are often associated with stark changes
in vegetation structure among pastures. Fence density (500-m spatial scale) was highest
in rest-rotation grazing systems (10.5 ± 0.4 m ⋅ ha-1), followed by summer-rotation (8.3 ±
0.5 m ⋅ ha-1), and season-long (6.3 ± 0.6 m ⋅ ha-1), respectively. Intensive grazing systems
such as rest-rotation or short-duration systems, which divide large pastures into multiple
smaller pastures and establish greater amounts of fence on rangeland landscapes may
negatively impact grassland bird use based on these subtle edge effects. Additionally, if
areas near fencelines function to increase predator use (Pedlar et al. 1997), grassland
birds may be reducing perceived predation risk by avoiding areas in close proximity to
fences.
My research is the first in the northern mixed-grass prairie to evaluate the effects
of both livestock grazing systems and stocking rates on the ecology of grassland birds in
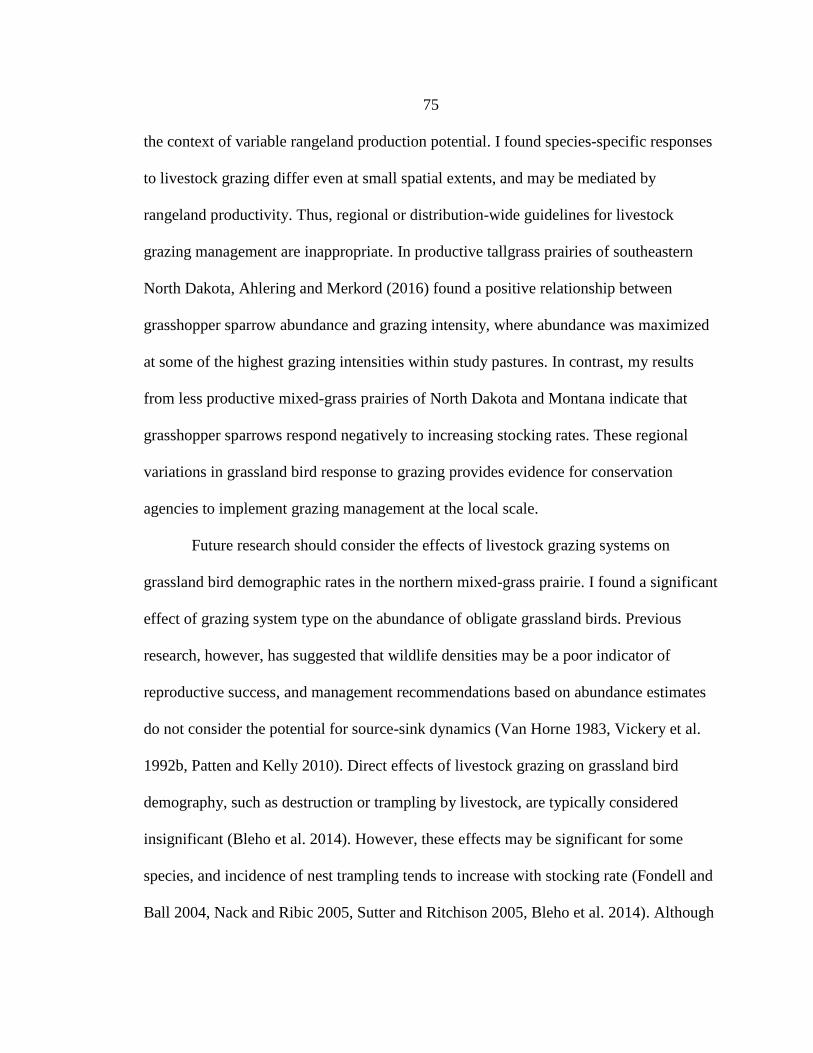
75
the context of variable rangeland production potential. I found species-specific responses
to livestock grazing differ even at small spatial extents, and may be mediated by
rangeland productivity. Thus, regional or distribution-wide guidelines for livestock
grazing management are inappropriate. In productive tallgrass prairies of southeastern
North Dakota, Ahlering and Merkord (2016) found a positive relationship between
grasshopper sparrow abundance and grazing intensity, where abundance was maximized
at some of the highest grazing intensities within study pastures. In contrast, my results
from less productive mixed-grass prairies of North Dakota and Montana indicate that
grasshopper sparrows respond negatively to increasing stocking rates. These regional
variations in grassland bird response to grazing provides evidence for conservation
agencies to implement grazing management at the local scale.
Future research should consider the effects of livestock grazing systems on
grassland bird demographic rates in the northern mixed-grass prairie. I found a significant
effect of grazing system type on the abundance of obligate grassland birds. Previous
research, however, has suggested that wildlife densities may be a poor indicator of
reproductive success, and management recommendations based on abundance estimates
do not consider the potential for source-sink dynamics (Van Horne 1983, Vickery et al.
1992b, Patten and Kelly 2010). Direct effects of livestock grazing on grassland bird
demography, such as destruction or trampling by livestock, are typically considered
insignificant (Bleho et al. 2014). However, these effects may be significant for some
species, and incidence of nest trampling tends to increase with stocking rate (Fondell and
Ball 2004, Nack and Ribic 2005, Sutter and Ritchison 2005, Bleho et al. 2014). Although
76
Bleho et al. (2014) found no effect of livestock grazing system on grassland bird nest
success in Canadian grasslands, grazing systems which act to defer livestock grazing
during grassland bird nesting seasons have potential to benefit grassland bird nesting
success due to the exclusion of cattle (Fondell and Ball 2004). Grassland bird nest
success in grazed compared to ungrazed grasslands is species-dependent, but researchers
have found higher nest success in ungrazed plots for some species (Fondell and Ball
2004, Sutter and Ritchison 2005). Additionally, indirect effects associated with livestock
grazing may negatively impact grassland bird reproductive success. Management
practices that result in uniform utilization of rangeland vegetation could contribute to
higher rates of nest predation, as predator search efficiency and predation of ground-
nesting bird nests decrease with increasing structural heterogeneity in vegetation
(Bowman and Harris 1980).
MANAGEMENT IMPLICATIONS
My results and those of previous researchers suggest that contiguous grasslands
managed in season-long or summer-rotational grazing systems, with light to moderate
stocking rates (0.3 to 1.4 AUM ⋅ ha-1), may provide structural habitat heterogeneity at the
appropriate scale (within-pasture) required by grassland birds in northern mixed-grass
prairies. Two main influences of within-pasture structural heterogeneity in these systems
are livestock forage selectivity, coupled with considerable environmental variability
within northern mixed-grass prairie landscapes (Bailey et al. 1998, Fuhlendorf and Engle
2001, Lipsey and Naugle 2017). Significant interactions between grazing management
and local rangeland productivity may severely limit our ability to recommend general
77
management practices to benefit grassland bird populations, or even specific species, on
rangelands managed for livestock production. Based on my results and other recent
grassland bird research, I suggest management occur at the local, individual pasture scale.
Effective management of rangelands for grassland bird conservation in the northern
mixed-grass prairie requires continuous consideration of, 1) species or guilds (sparse-
grass, dense-grass, etc.) of management concern, 2) variable rangeland productivity at the
local (pasture) scale, 3) local annual precipitation prior to the summer grazing season and
the interaction of rangeland productivity and precipitation at the pasture level, and 4)
livestock utilization of rangeland vegetation within a specific pasture in the context of
each of these variables. The universal implementation of conservation-based rangeland
management practices in the northern mixed-grass prairie may fail to reach conservation
goals due to this need for meticulous, local-scale management considerations rather than
general ‘wildlife-friendly’ rangeland management (Davis et al. 2014). Nevertheless, I did
find a consistent negative relationship with increased livestock stocking rate on
abundance of grassland birds. This response indicates that implementation of high
stocking rates may negatively impact grassland birds in the northern mixed-grass prairie,
and should be avoided in this region.
Employing conservation-based, rest-rotation livestock grazing management did
not result in significant increases in grassland bird abundance or shifts in grassland bird
community composition within my study area in the northern mixed-grass prairie during
years of average precipitation. Realistically, reversing the decline of grassland bird
populations in the northern mixed-grass prairie may depend on our ability to preserve
78
large tracts of grassland habitat (Davis 2004), given the use of prescribed fire to manage
rangelands for the restoration of patch-heterogeneity is currently not a socially-acceptable
option (Sliwinski 2017). Resources or funds being used to manage rangelands for the
conservation of grassland birds in this region would likely be more beneficial if they were
allocated to native grassland acquisition or to preventing grassland conversion or
development. Another option for conservation organizations that do not have the funds to
purchase grassland or to sponsor lands for enrollment in easements, is through working
closely with local conservation-minded ranch managers. This may involve identifying
specific values of a ranch in regard to wildlife conservation, and then providing ranch
managers with information on how to maximize habitat quality for species of interest or
for a guild of grassland species, in the context of spatial and temporal variability.
Engaging local landowners to support ranch-specific management would be time and
resources well-spent in terms of grassland wildlife conservation, and should also be
promoted over general conservation-based grazing management guidelines.
Results from my study indicate that establishing conservations easements which
keep grassland ecosystems from further human development, rather than allocating funds
for the implementation of rest-rotation grazing systems, would be more beneficial for the
conservation of grassland birds in the northern mixed-grass prairie. However, my study
was conducted during two years of average precipitation conditions, resulting in a
potential caveat to these management recommendations. Researchers have suggested that
patch-heterogeneity based rangeland management may provide ecological benefits in the
face of increasingly variable annual precipitation, especially in drought years (Ricketts
79
and Sandercock 2016, Fuhlendorf et al. 2017). This hypothesis is supported by research
evaluating livestock gains in years of below average precipitation conditions, where
results indicated that patch-heterogeneity based rangeland management may buffer the
effects of precipitation on cattle gains (Allred et al. 2014). Further research may be
needed to evaluate the response of grassland birds to livestock grazing management,
specifically conservation-based rangeland management such as rest-rotation grazing, in
years of extreme conditions.
80
CHAPTER THREE
EFFECTS OF LIVESTOCK GRAZING MANAGEMENT ON THE OCCUPANCY OF
MESOCARNIVORES IN A NORTHERN MIXED-GRASS
PRAIRIE ECOSYSTEM
Contribution of Authors and Co-Authors
Manuscript in Chapter 3
Author: Skyler T. Vold
Contributions: Conceptualization, data curation, formal analysis, investigation,
methodology, supervision, validation, writing – original draft, writing – review & editing.
Co-Author: Lance B. McNew
Contributions: Conceptualization, funding acquisition, methodology, project
administration, supervision, validation, writing – review & editing.
Co-Author: Lorelle I. Berkeley
Contributions: Conceptualization, funding acquisition, methodology, project
administration, supervision, validation, writing – review & editing.
81
Manuscript Information
Skyler T. Vold, Lance B. McNew, Lorelle I. Berkeley
The Journal of Wildlife Management
Status of Manuscript:
__X__ Prepared for submission to a peer-reviewed journal
____ Officially submitted to a peer-reviewed journal
____ Accepted by a peer-reviewed journal
____ Published in a peer-reviewed journal
John Wiley & Sons, on behalf of The Wildlife Society
82
CHAPTER THREE
EFFECTS OF LIVESTOCK GRAZING MANAGEMENT ON THE OCCUPANCY OF
MESOCARNIVORES IN A NORTHERN MIXED-GRASS PRAIRIE ECOSYSTEM
INTRODUCTION
The extirpation or acute population reductions of apex predators throughout much
of their historic ranges in North America has resulted in increased abundances and range
expansions of secondary predators, an ecological phenomenon known as “mesopredator
release” (Soulé et al. 1988, Crooks and Soulé 1999, Prugh et al. 2009, Brashares et al.
2010). The removal of apex predators from terrestrial ecosystems disrupts the balances
among predators in the highest ecological trophic levels, allowing for population
expansions of small- and medium-sized predators (hereafter "mesocarnivores" ;
Elmhagen and Rushton 2007, Prugh et al. 2009, Ritchie and Johnson 2009).
Mesocarnivore populations are supported by diet flexibility and resource sharing, as they
have adapted to a wide variety of prey items and do not often exhibit prey-specific
selection typical of apex predators (Prugh et al. 2009). Resulting mesocarnivore
population growth and range expansions have increased pressure on the mesocarnivore
prey base within numerous ecosystems throughout North America, and has been
attributed to ecosystem instability, along with population declines of birds, small
mammals, and reptiles (Ritchie and Johnson 2009, Brashares et al. 2010).
Grassland birds have undergone steep population declines throughout a majority
of their historic range over the past century (Knopf 1994;1996, Peterjohn and Sauer 1999,
83
Sauer et al. 2013). Mesocarnivores can have a substantial impact on the annual fecundity
of ground-nesting birds in grassland ecosystems through their depredation of eggs and
young at nest sites while foraging, as well as predation of fledglings and adults while
hunting (Vickery et al. 1992a, Rollins and Carroll 2001, Hovick et al. 2011, Ribic et al.
2012). Mesocarnivores are a major cause of nest mortality in ground-nesting birds within
numerous grassland ecosystems (Crabtree et al. 1989, Sargeant et al. 1993, Pasitschniak-
Arts and Messier 1995, Renfrew and Ribic 2003, Hartman and Oring 2009, Pietz et al.
2012, Lyons et al. 2015). Depredation is the main cause of nest failure for most grassland
birds (Ricklefs 1969, Davis 2003, Jones et al. 2010, Kerns et al. 2010), and birds
inhabiting grasslands experience higher rates of predation than those inhabiting other
ecosystems, such as forests or wetlands (Martin 1993). These concerns emphasize the
importance of considering nest predators and their potential impacts on grassland bird
reproductive output within grassland bird management and conservation efforts.
In the northern mixed-grass prairie, mesocarnivore predators of grassland birds
and their nests include the American badger (Taxidea taxus), American mink (Neovison
vison), coyote (Canis latrans), least weasel (Mustela nivalis), long-tailed weasel (Mustela
frenata), Northern raccoon (Procyon lotor), red fox (Vulpes vulpes), short-tailed weasel
(Mustela erminea), and striped skunk (Mephitis mephitis; Sargeant et al. 1993, Seabloom
et al. 2011, Foresman 2012, Burr et al. 2017). Mesocarnivores are typically considered
adaptive generalists with high habitat plasticity and, unlike grassland birds, often show a
positive response to increased habitat edge associated with prairie fragmentation (Gates
and Gysel 1978, Johnson and Temple 1990, Andrén 1995, Donovan et al. 1995, Winter et
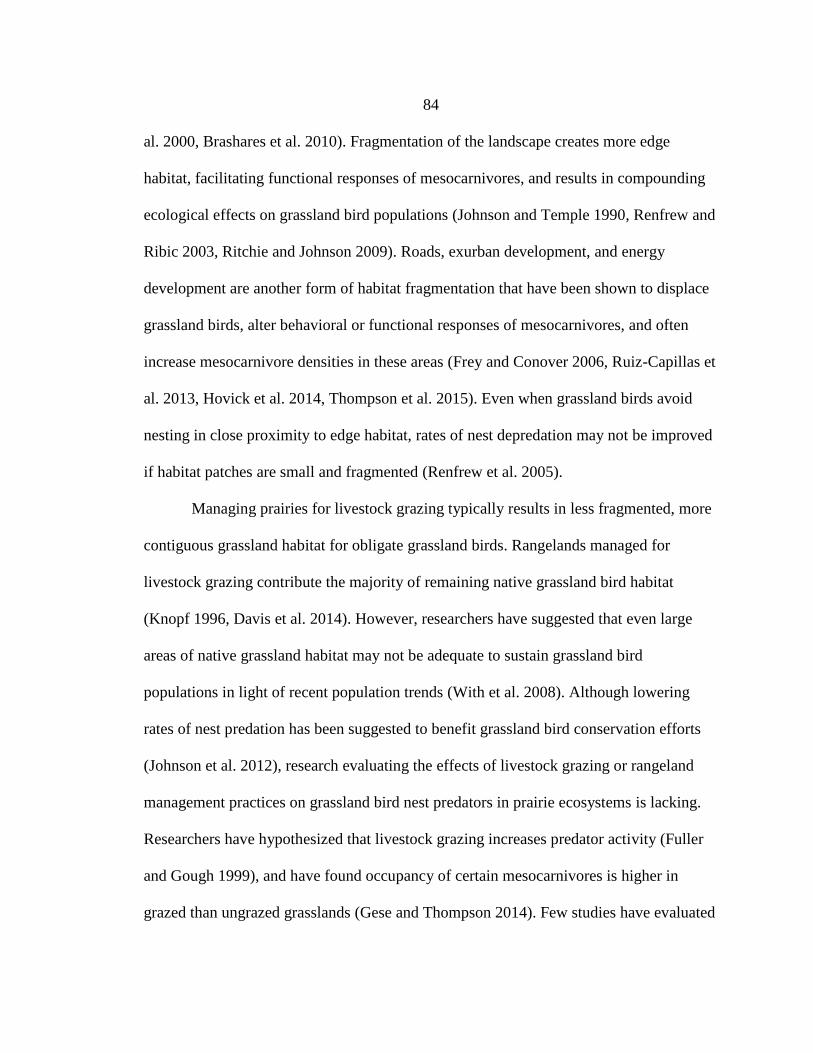
84
al. 2000, Brashares et al. 2010). Fragmentation of the landscape creates more edge
habitat, facilitating functional responses of mesocarnivores, and results in compounding
ecological effects on grassland bird populations (Johnson and Temple 1990, Renfrew and
Ribic 2003, Ritchie and Johnson 2009). Roads, exurban development, and energy
development are another form of habitat fragmentation that have been shown to displace
grassland birds, alter behavioral or functional responses of mesocarnivores, and often
increase mesocarnivore densities in these areas (Frey and Conover 2006, Ruiz-Capillas et
al. 2013, Hovick et al. 2014, Thompson et al. 2015). Even when grassland birds avoid
nesting in close proximity to edge habitat, rates of nest depredation may not be improved
if habitat patches are small and fragmented (Renfrew et al. 2005).
Managing prairies for livestock grazing typically results in less fragmented, more
contiguous grassland habitat for obligate grassland birds. Rangelands managed for
livestock grazing contribute the majority of remaining native grassland bird habitat
(Knopf 1996, Davis et al. 2014). However, researchers have suggested that even large
areas of native grassland habitat may not be adequate to sustain grassland bird
populations in light of recent population trends (With et al. 2008). Although lowering
rates of nest predation has been suggested to benefit grassland bird conservation efforts
(Johnson et al. 2012), research evaluating the effects of livestock grazing or rangeland
management practices on grassland bird nest predators in prairie ecosystems is lacking.
Researchers have hypothesized that livestock grazing increases predator activity (Fuller
and Gough 1999), and have found occupancy of certain mesocarnivores is higher in
grazed than ungrazed grasslands (Gese and Thompson 2014). Few studies have evaluated
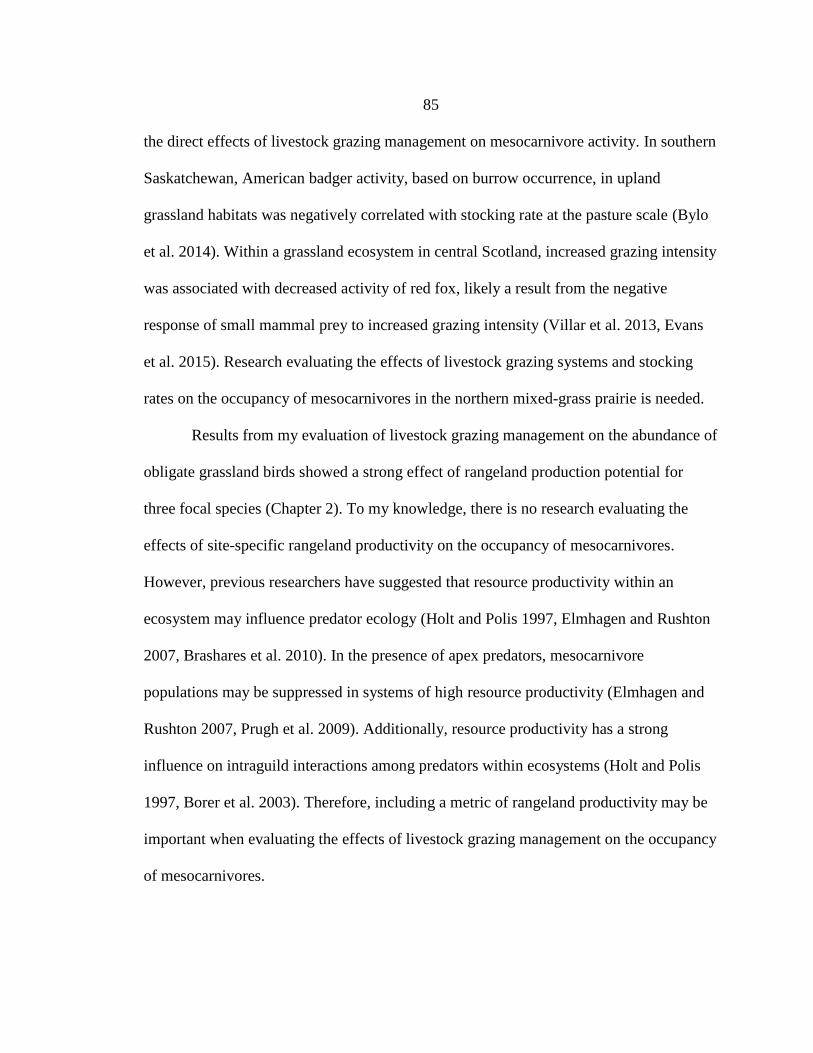
85
the direct effects of livestock grazing management on mesocarnivore activity. In southern
Saskatchewan, American badger activity, based on burrow occurrence, in upland
grassland habitats was negatively correlated with stocking rate at the pasture scale (Bylo
et al. 2014). Within a grassland ecosystem in central Scotland, increased grazing intensity
was associated with decreased activity of red fox, likely a result from the negative
response of small mammal prey to increased grazing intensity (Villar et al. 2013, Evans
et al. 2015). Research evaluating the effects of livestock grazing systems and stocking
rates on the occupancy of mesocarnivores in the northern mixed-grass prairie is needed.
Results from my evaluation of livestock grazing management on the abundance of
obligate grassland birds showed a strong effect of rangeland production potential for
three focal species (Chapter 2). To my knowledge, there is no research evaluating the
effects of site-specific rangeland productivity on the occupancy of mesocarnivores.
However, previous researchers have suggested that resource productivity within an
ecosystem may influence predator ecology (Holt and Polis 1997, Elmhagen and Rushton
2007, Brashares et al. 2010). In the presence of apex predators, mesocarnivore
populations may be suppressed in systems of high resource productivity (Elmhagen and
Rushton 2007, Prugh et al. 2009). Additionally, resource productivity has a strong
influence on intraguild interactions among predators within ecosystems (Holt and Polis
1997, Borer et al. 2003). Therefore, including a metric of rangeland productivity may be
important when evaluating the effects of livestock grazing management on the occupancy
of mesocarnivores.
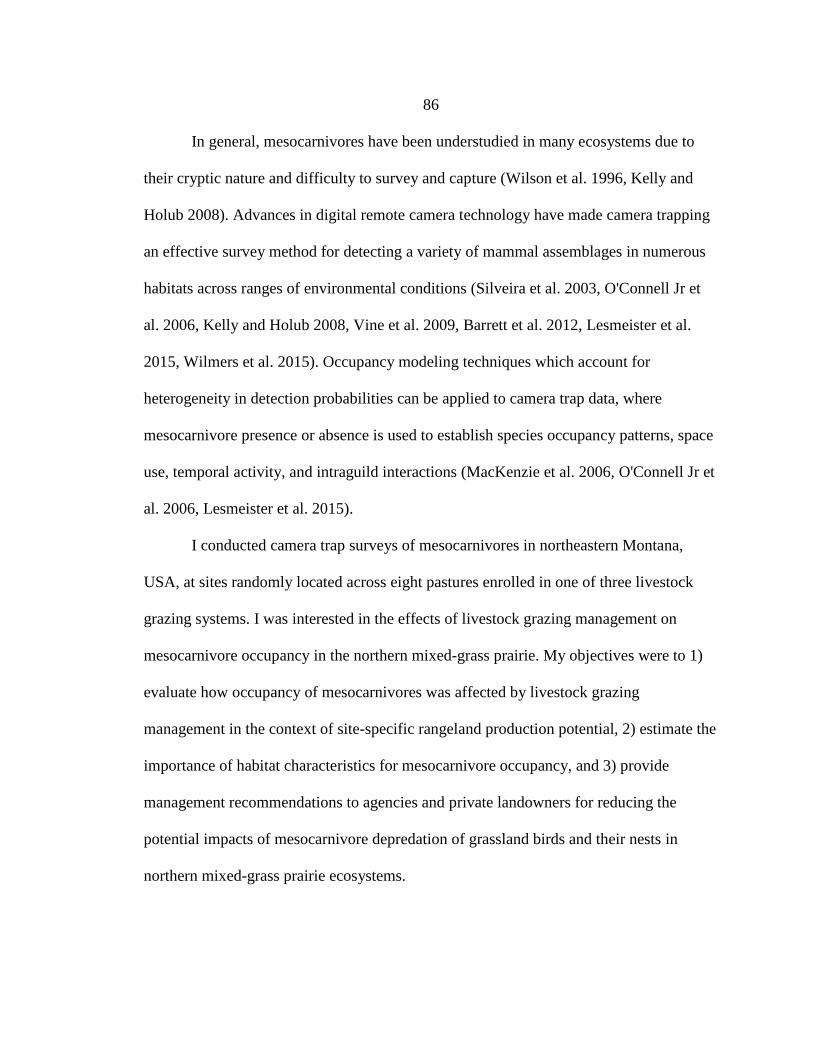
86
In general, mesocarnivores have been understudied in many ecosystems due to
their cryptic nature and difficulty to survey and capture (Wilson et al. 1996, Kelly and
Holub 2008). Advances in digital remote camera technology have made camera trapping
an effective survey method for detecting a variety of mammal assemblages in numerous
habitats across ranges of environmental conditions (Silveira et al. 2003, O'Connell Jr et
al. 2006, Kelly and Holub 2008, Vine et al. 2009, Barrett et al. 2012, Lesmeister et al.
2015, Wilmers et al. 2015). Occupancy modeling techniques which account for
heterogeneity in detection probabilities can be applied to camera trap data, where
mesocarnivore presence or absence is used to establish species occupancy patterns, space
use, temporal activity, and intraguild interactions (MacKenzie et al. 2006, O'Connell Jr et
al. 2006, Lesmeister et al. 2015).
I conducted camera trap surveys of mesocarnivores in northeastern Montana,
USA, at sites randomly located across eight pastures enrolled in one of three livestock
grazing systems. I was interested in the effects of livestock grazing management on
mesocarnivore occupancy in the northern mixed-grass prairie. My objectives were to 1)
evaluate how occupancy of mesocarnivores was affected by livestock grazing
management in the context of site-specific rangeland production potential, 2) estimate the
importance of habitat characteristics for mesocarnivore occupancy, and 3) provide
management recommendations to agencies and private landowners for reducing the
potential impacts of mesocarnivore depredation of grassland birds and their nests in
northern mixed-grass prairie ecosystems.
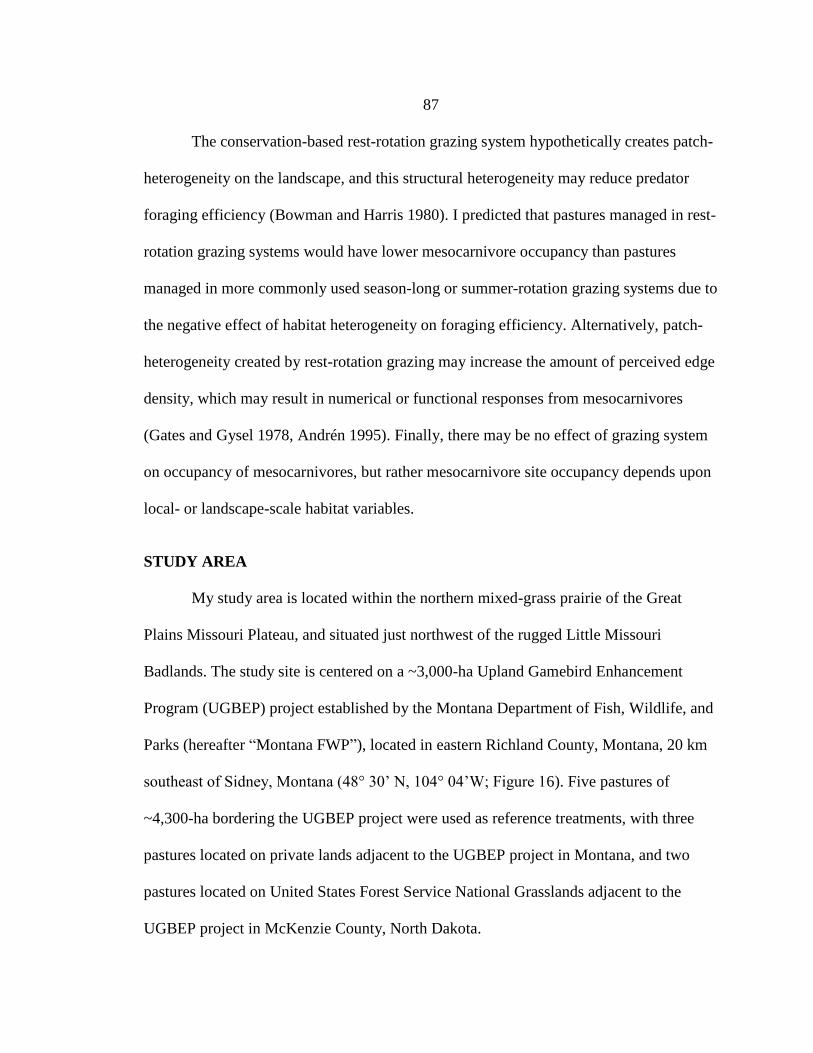
87
The conservation-based rest-rotation grazing system hypothetically creates patch-
heterogeneity on the landscape, and this structural heterogeneity may reduce predator
foraging efficiency (Bowman and Harris 1980). I predicted that pastures managed in rest-
rotation grazing systems would have lower mesocarnivore occupancy than pastures
managed in more commonly used season-long or summer-rotation grazing systems due to
the negative effect of habitat heterogeneity on foraging efficiency. Alternatively, patch-
heterogeneity created by rest-rotation grazing may increase the amount of perceived edge
density, which may result in numerical or functional responses from mesocarnivores
(Gates and Gysel 1978, Andrén 1995). Finally, there may be no effect of grazing system
on occupancy of mesocarnivores, but rather mesocarnivore site occupancy depends upon
local- or landscape-scale habitat variables.
STUDY AREA
My study area is located within the northern mixed-grass prairie of the Great
Plains Missouri Plateau, and situated just northwest of the rugged Little Missouri
Badlands. The study site is centered on a ~3,000-ha Upland Gamebird Enhancement
Program (UGBEP) project established by the Montana Department of Fish, Wildlife, and
Parks (hereafter “Montana FWP”), located in eastern Richland County, Montana, 20 km
southeast of Sidney, Montana (48° 30’ N, 104° 04’W; Figure 16). Five pastures of
~4,300-ha bordering the UGBEP project were used as reference treatments, with three
pastures located on private lands adjacent to the UGBEP project in Montana, and two
pastures located on United States Forest Service National Grasslands adjacent to the
UGBEP project in McKenzie County, North Dakota.
88
Montana FWP collaborates with private ranches throughout the state of Montana
to influence management of native rangeland for improvements in wildlife habitat
quality, while maintaining economically sustainable livestock production on the ranches.
Incentive programs available to landowners through Montana FWP include conservation
easements and the Upland Game Bird Enhancement Program. Montana FWP also
manages grazing leases on Wildlife Management Areas, Department of Natural
Resources and Conservation (DNRC) lands leased by Montana FWP, and a mix of
Bureau of Land Management, U.S. Forest Service, and private lands that are managed
under the terms of lease agreements (Kelvin Johnson, Montana FWP, pers. comm.). For
all programs and leases, Montana FWP currently manages grazing on ~182,000 ha, of
which ~81,000 ha are managed under rest-rotation grazing systems (Rick Northrup,
Montana FWP, pers. comm.).
The study area is dominated by contiguous rangelands managed for cattle grazing,
and is characterized by rolling, gently sloping plains (generally < 5 degrees; Bluemle
1991). Elevation ranges from 660 to 730 meters above sea level. Annual precipitation is
variable, but long-term average (1911 – 2017) was ~360 ± 86 mm (SD), based on the
nearest weather station (Savage 1.0 S, MT US, 20 km west) to the study site (NOAA
2017). Precipitation 12 months prior to 2016 field work (April 2015 – March 2016) was
288 mm, and prior to 2017 field work (April 2016 – March 2017) was 392 mm (NOAA
2017). Mean annual temperature is ~6°C. Winter temperatures range from -40°C to 5°C
and summer temperatures range from 8°C to 43°C (NOAA 2017). Vegetation on the
study site is composed of mainly graminoids, including western wheatgrass (Pascopyrum
89
smithii), little bluestem (Schizachyrium scoparium), needle-and-thread (Hesperostipa
comata), prairie junegrass (Koeleria macrantha), Kentucky bluegrass (Poa pratensis),
and blue grama (Bouteloua gracilis), along with low- to mid-height shrubs, including
western snowberry (Symphoricarpos occidentalis), silver sagebrush (Artemisia cana),
skunkbrush sumac (Rhus trilobata), silver buffaloberry (Shepherdia argentea),
chokecherry (Prunus virginiana), wild roses (Rosa spp.), and creeping juniper (Juniperus
horizontalis), as well as two prevalent sub-shrub species, winterfat (Krascheninnikovia
lanata), and fringed sagewort (Artemisia frigida).
METHODS
Field Sampling
I collected data during two summer field seasons (May – July, 2016–17). Using
ArcGIS (ESRI 2011, v10.1), I randomly generated 180 camera trap survey sites (90 each
season) across gradients of habitat conditions within a Montana FWP Upland Gamebird
Enhancement Program project managed under rest-rotation grazing, and on adjacent
private and federal lands managed under season-long or 2-pasture summer-rotation
grazing systems (Table 3, Figure 16). Within the 3-pasture rest-rotation grazing systems
in my study area, cattle were turned out to the first pasture in late May, moved to the
second pasture mid-August, and turned in after grazing the second pasture for 8 – 10
weeks; the third pasture in the system was rested from grazing. Season-long grazing
systems in my study area allowed cattle to graze continuously from May or early June
through October or mid-November. Within 2-pasture summer-rotation grazing systems in
my study area, cattle were turned out to the first pasture in early June, moved to the
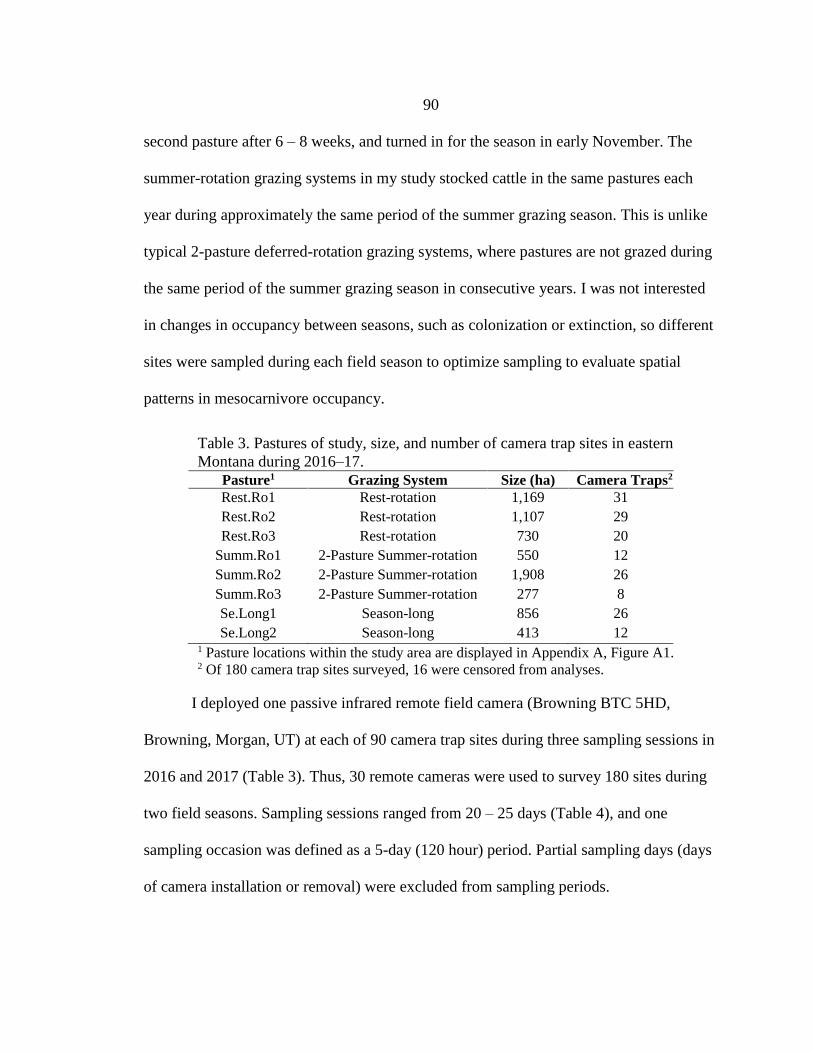
90
second pasture after 6 – 8 weeks, and turned in for the season in early November. The
summer-rotation grazing systems in my study stocked cattle in the same pastures each
year during approximately the same period of the summer grazing season. This is unlike
typical 2-pasture deferred-rotation grazing systems, where pastures are not grazed during
the same period of the summer grazing season in consecutive years. I was not interested
in changes in occupancy between seasons, such as colonization or extinction, so different
sites were sampled during each field season to optimize sampling to evaluate spatial
patterns in mesocarnivore occupancy.
Table 3. Pastures of study, size, and number of camera trap sites in eastern
Montana during 2016–17.
Pasture1 Grazing System Size (ha) Camera Traps2
Rest.Ro1 Rest-rotation 1,169 31
Rest.Ro2 Rest-rotation 1,107 29
Rest.Ro3 Rest-rotation 730 20
Summ.Ro1 2-Pasture Summer-rotation 550 12
Summ.Ro2 2-Pasture Summer-rotation 1,908 26
Summ.Ro3 2-Pasture Summer-rotation 277 8
Se.Long1 Season-long 856 26
Se.Long2 Season-long 413 12 1 Pasture locations within the study area are displayed in Appendix A, Figure A1. 2 Of 180 camera trap sites surveyed, 16 were censored from analyses.
I deployed one passive infrared remote field camera (Browning BTC 5HD,
Browning, Morgan, UT) at each of 90 camera trap sites during three sampling sessions in
2016 and 2017 (Table 3). Thus, 30 remote cameras were used to survey 180 sites during
two field seasons. Sampling sessions ranged from 20 – 25 days (Table 4), and one
sampling occasion was defined as a 5-day (120 hour) period. Partial sampling days (days
of camera installation or removal) were excluded from sampling periods.
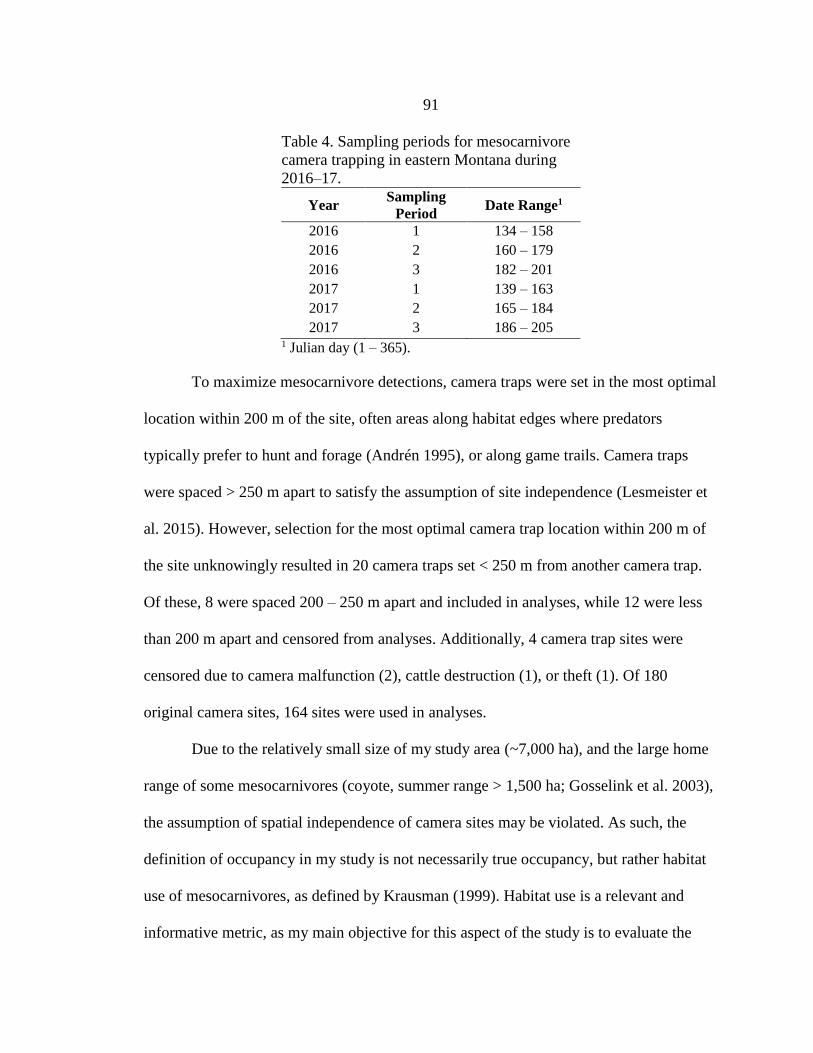
91
Table 4. Sampling periods for mesocarnivore
camera trapping in eastern Montana during
2016–17.
Year Sampling
Period Date Range1
2016 1 134 – 158
2016 2 160 – 179
2016 3 182 – 201
2017 1 139 – 163
2017 2 165 – 184
2017 3 186 – 205 1 Julian day (1 – 365).
To maximize mesocarnivore detections, camera traps were set in the most optimal
location within 200 m of the site, often areas along habitat edges where predators
typically prefer to hunt and forage (Andrén 1995), or along game trails. Camera traps
were spaced > 250 m apart to satisfy the assumption of site independence (Lesmeister et
al. 2015). However, selection for the most optimal camera trap location within 200 m of
the site unknowingly resulted in 20 camera traps set < 250 m from another camera trap.
Of these, 8 were spaced 200 – 250 m apart and included in analyses, while 12 were less
than 200 m apart and censored from analyses. Additionally, 4 camera trap sites were
censored due to camera malfunction (2), cattle destruction (1), or theft (1). Of 180
original camera sites, 164 sites were used in analyses.
Due to the relatively small size of my study area (~7,000 ha), and the large home
range of some mesocarnivores (coyote, summer range > 1,500 ha; Gosselink et al. 2003),
the assumption of spatial independence of camera sites may be violated. As such, the
definition of occupancy in my study is not necessarily true occupancy, but rather habitat
use of mesocarnivores, as defined by Krausman (1999). Habitat use is a relevant and
informative metric, as my main objective for this aspect of the study is to evaluate the
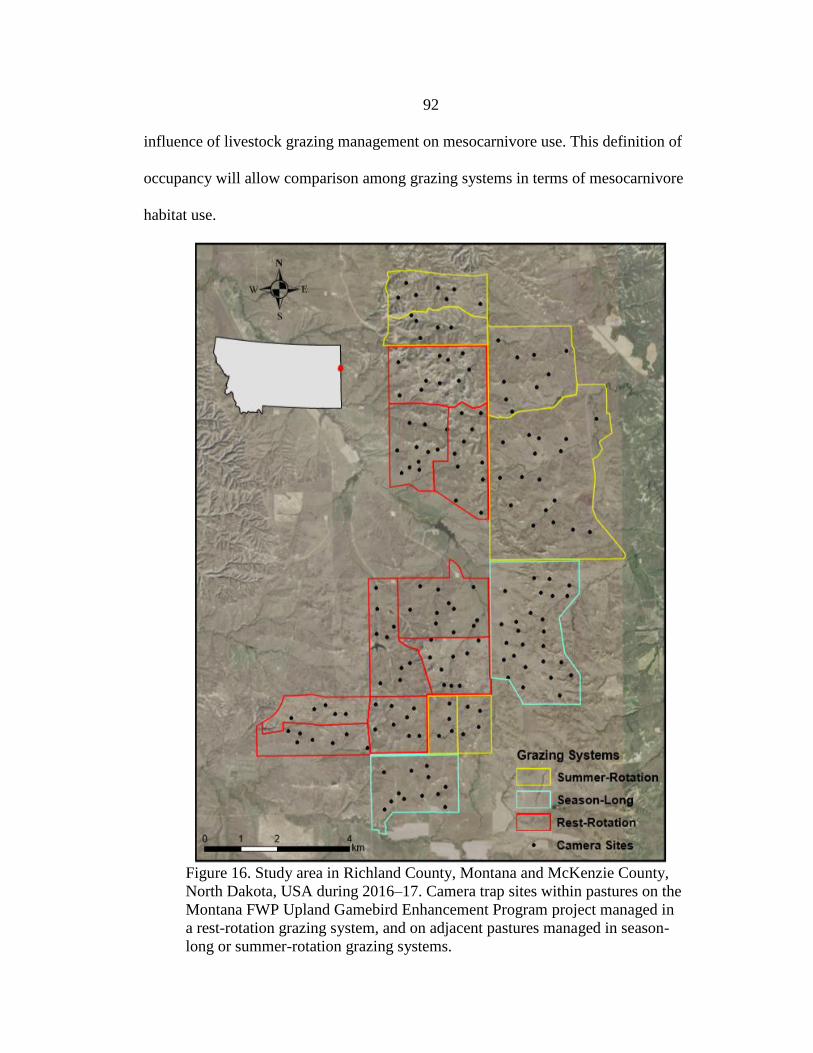
92
influence of livestock grazing management on mesocarnivore use. This definition of
occupancy will allow comparison among grazing systems in terms of mesocarnivore
habitat use.
Figure 16. Study area in Richland County, Montana and McKenzie County,
North Dakota, USA during 2016–17. Camera trap sites within pastures on the
Montana FWP Upland Gamebird Enhancement Program project managed in
a rest-rotation grazing system, and on adjacent pastures managed in season-
long or summer-rotation grazing systems.
93
Cameras were programmed to be active 24 hours per day, with a two photo burst
for each photographic event and a 1-minute delay between events. Cameras were motion-
activated, so a photographic event occurred when the remote camera was triggered by the
presence of a mesocarnivore. Date, time, and camera identity were recorded by the
camera for each photographic event. Cameras were secured to tree trunks or mounted on
metal stakes and positioned approximately 0.5 m above the ground. When present,
cameras were faced toward game trails to maximize detections. The area in front of each
camera was cleared of obstructive vegetation, and a scent or bait lure was placed 2 m in
front of the camera. Lures were used to increase mesocarnivore detections, and in 2016,
consisted of a combination of fatty acid scent disks (U.S. Department of Agriculture
Pocatello Supply Depot, Pocatello, ID), trapping lure (Gusto; Minnesota Trapline
Products, Inc., Pennock, MN), and/or sardines. Only trapping lure was used in 2017. All
camera sites during each sampling period received the same lure. During each sampling
period, camera sites were revisited weekly to replenish lures, swap memory cards, change
camera batteries, and remove any new obstructive vegetation.
Habitat Evaluation
My study site is an area of contiguous, native grassland managed for livestock
grazing, resulting in relatively few areas of common edge habitats, with which
mesocarnivores are typically associated. I identified 5 potential habitat edges within my
study site, wooded coulees, roads and two-tracks, pasture fences, water features, and oil
pads. I used ArcMap 10.4 to digitize each of these features within the study site using
five band 1-m resolution aerial imagery from the National Agricultural Imagery Program
94
(NAIP) developed by the U.S. Farm Service Agency (ESRI 2011, v10.4). Data was
obtained from Montana State Library GIS Clearinghouse and North Dakota GIS Hub
Data Portal. I merged each of these features into a single ‘edge’ layer, and intersected this
layer with buffered camera sites at 100-m, 500-m, and 1,000-m radial areas for analyses
at multiple spatial scales (ESRI 2011, v10.4). I used the ArcMap ‘Calculate Geometry’
tool to estimate the total length of edge habitat associated at camera sites, and calculated
edge density by dividing edge length by area at each of 100-m, 500-m, and 1,000-m
spatial scales (ESRI 2011, v10.4). I used the ArcMap ‘Near’ tool to estimate the distance
from each camera site to the nearest wooded coulee, pasture fence, road or two-track,
water feature, or oil pad (ESRI 2011, v10.4).
Rangeland managers implement grazing systems based on the expected annual
vegetative production of rangelands in an average year. I quantified rangeland production
potential associated with each camera trap site using the Soil Survey Geographic database
(SSURGO) ecological site data from the Natural Resources Conservation Service
(NRCS) Web Soil Survey (NRCS 2017). NRCS defines rangeland production as “the
amount of vegetation that can be expected to grow annually in a well-managed area that
is supporting the potential natural plant community” (NRCS 2017). Previous researchers
have found NRCS estimates of rangeland production potential based on the SSURGO
ecological site data were reasonable estimates of true average rangeland productivity
(Relyea et al. 2000). I calculated the weighted average rangeland production potential
within 100 m of each camera trap site using the representative values (RV) of rangeland
production for each ecological site type in the study area (Appendix B, Table B1),
95
effectively accounting for camera trap sites which encompassed multiple ecological sites.
I used the representative values of rangeland production potential, as precipitation during
the years prior to field work was approximately average, and the RV’s are based on an
average year’s precipitation.
I interviewed landowners to gather cattle turn-out/turn-in dates and number of
head stocked to calculate stocking rates for the pastures within my study area. These
dates and numbers were validated by observation of when and approximately how many
cattle were present in pastures during both grazing seasons. I calculated stocking rates
within pastures based on an animal unit month (AUM), the amount of forage, measured
on a dry weight basis, to feed a 1,000-lb cow-calf pair for a 30-day period (Holechek et
al. 2011). The average cow-calf pair grazing on the pastures within my study area was
approximately 1,400 lbs (635 kg) based on landowner interviews, so I accounted for this
in my calculation of stocking rate. Typically, stocking rates consider all pastures within a
multi-pasture grazing system, resulting in a single stocking rate for the system. I
calculated the stocking rates of each individual pasture within the 3-pasture rest-rotation
and 2-pasture summer-rotation grazing systems because I was interested in the indirect
effects of livestock grazing on mesocarnivore occupancy through livestock alteration of
vegetation structure. Stocking rates from the previous year’s grazing season were used as
a predictor of mesocarnivore occupancy, as residual vegetation from the previous year’s
grazing establishes habitat structure used by mesocarnivores for hunting and foraging
activities during the grassland bird breeding season when I conducted camera trap
surveys.
96
Statistical Analyses
I evaluated the effects of edge density (100-m, 500-m, and 1,000-m scale) and
distance to the nearest wooded coulee, road, fence, water, and oil pad on mesocarnivore
occupancy. I also evaluated the management-level effects of rangeland production
potential (100-m scale), stocking rate, and grazing system on mesocarnivore occupancy.
The habitat variables were considered for their direct effect on mesocarnivore occupancy
through habitat use, whereas the three management-level variables were considered for
their indirect effect on mesocarnivore occupancy through the ability of livestock grazing
to alter vegetation structure within rangelands. Rangeland production potential is
included in the management-level model set because range managers consider the
average production potential of rangelands when implementing grazing systems or
manipulating livestock stocking rates.
I conducted all analyses in program R (R Core Team 2016) with use of packages
‘unmarked’ (Fiske and Chandler 2011) and ‘AICcmodavg’ (Mazerolle 2013) to identify
specific effects on occupancy of mesocarnivores, where single-season occupancy
modeling allowed for simultaneous estimation of detection probability and occupancy
(MacKenzie et al. 2006). Accounting for imperfect detection is important to avoid bias in
studies evaluating mesocarnivore occupancy using remote camera traps (Lesmeister et al.
2015). I used single-season occupancy modeling to increase the number of sites, as I was
not interested in immigration or emigration from sites among years.
I used stepwise model selection techniques (backward selection) to identify the
factors influencing mesocarnivore detection probability and occupancy, where I started
97
with a highly parameterized model and eliminated uninformative parameters based on
their lack of influence on mesocarnivore detection probability or occupancy
(Montgomery et al. 2012). Models related to mesocarnivore detection probability were fit
prior to fitting models for local mesocarnivore occupancy. I pooled all mesocarnivore
species for analyses due to low detection probabilities within each single species
(MacKenzie et al. 2002). If a mesocarnivore was detected at a camera site during a
sampling occasion, the site was considered occupied. Previous researchers have
suggested, in grassland ecosystems with relatively high predator diversity, management
actions to reduce grassland bird nest depredation may not prove successful if they do not
consider the entire predator community (Renfrew and Ribic 2003, Pietz et al. 2012).
Prior to fitting occupancy models, I tested all covariates for multicollinearity,
removing those which were highly correlated (Pearson’s correlation estimate |r| > 0.6)
from further analyses. Edge density at 100-m and 500-m spatial scales were correlated (r
= 0.66), and edge density at 500-m and 1000-m scales were correlated (r = 0.77). I
removed edge density at the 500-m spatial scale from further analyses because it was
correlated across the other two spatial scales (100-m and 1,000-m), and this metric
assessed at two scales was uncorrelated. Edge density (100-m) and distance to nearest
wooded coulee were correlated (r = -0.63). I kept edge density and removed distance to
the nearest coulee from analyses because mesocarnivores typically use habitat edges
while hunting and foraging (Andrén 1995), and my metric of edge density includes
wooded coulee, along with other habitat edges. For each variable included in detection
and occupancy models, I evaluated whether a linear, quadratic, or pseudo-threshold
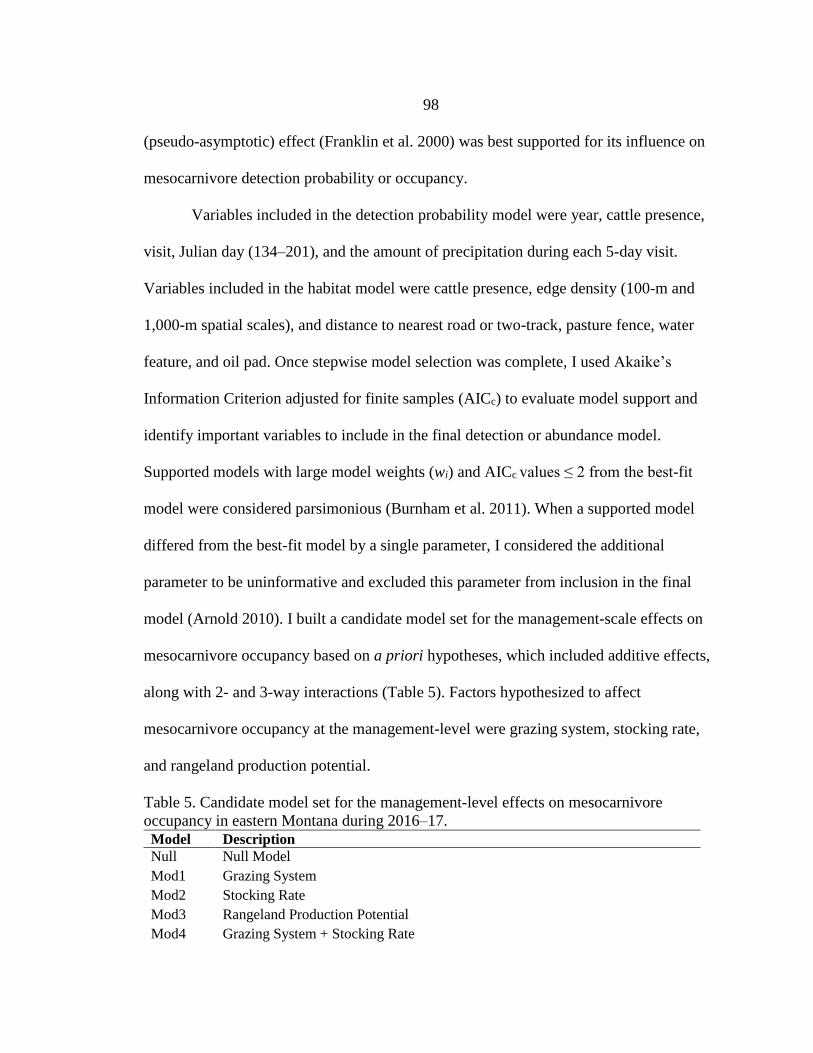
98
(pseudo-asymptotic) effect (Franklin et al. 2000) was best supported for its influence on
mesocarnivore detection probability or occupancy.
Variables included in the detection probability model were year, cattle presence,
visit, Julian day (134–201), and the amount of precipitation during each 5-day visit.
Variables included in the habitat model were cattle presence, edge density (100-m and
1,000-m spatial scales), and distance to nearest road or two-track, pasture fence, water
feature, and oil pad. Once stepwise model selection was complete, I used Akaike’s
Information Criterion adjusted for finite samples (AICc) to evaluate model support and
identify important variables to include in the final detection or abundance model.
Supported models with large model weights (wi) and AICc values ≤ 2 from the best-fit
model were considered parsimonious (Burnham et al. 2011). When a supported model
differed from the best-fit model by a single parameter, I considered the additional
parameter to be uninformative and excluded this parameter from inclusion in the final
model (Arnold 2010). I built a candidate model set for the management-scale effects on
mesocarnivore occupancy based on a priori hypotheses, which included additive effects,
along with 2- and 3-way interactions (Table 5). Factors hypothesized to affect
mesocarnivore occupancy at the management-level were grazing system, stocking rate,
and rangeland production potential.
Table 5. Candidate model set for the management-level effects on mesocarnivore
occupancy in eastern Montana during 2016–17.
Model Description
Null Null Model
Mod1 Grazing System
Mod2 Stocking Rate
Mod3 Rangeland Production Potential
Mod4 Grazing System + Stocking Rate
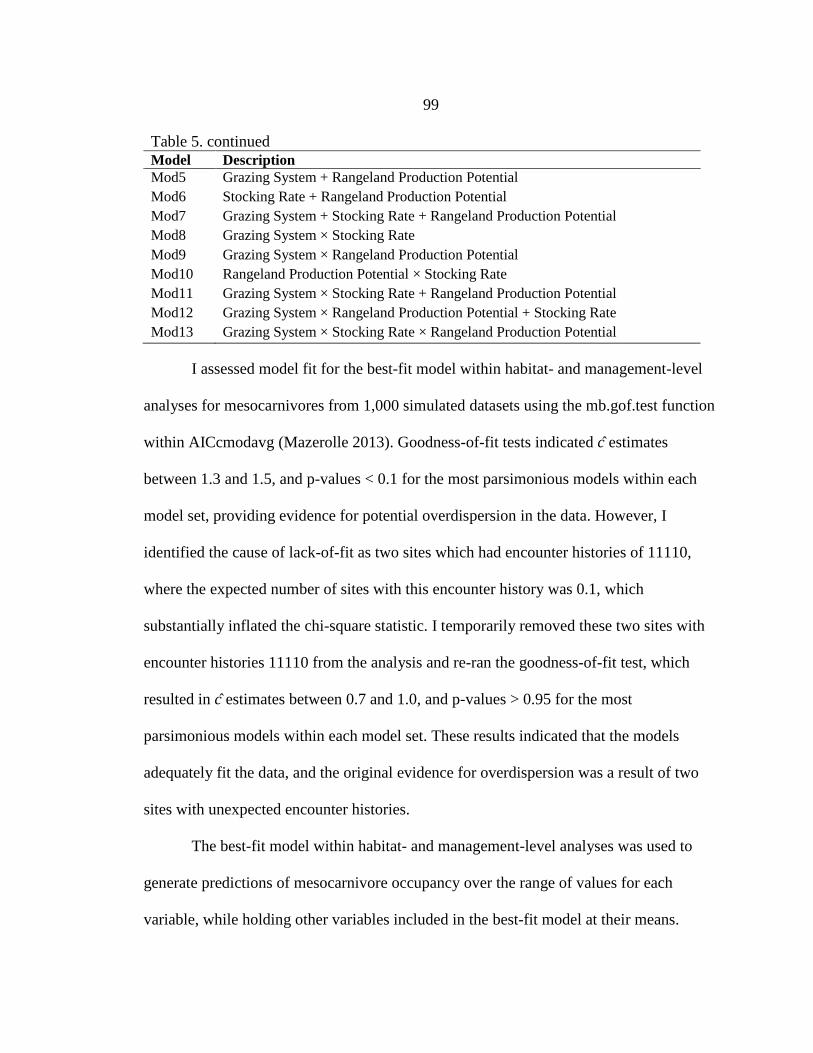
99
Table 5. continued
Model Description
Mod5 Grazing System + Rangeland Production Potential
Mod6 Stocking Rate + Rangeland Production Potential
Mod7 Grazing System + Stocking Rate + Rangeland Production Potential
Mod8 Grazing System × Stocking Rate
Mod9 Grazing System × Rangeland Production Potential
Mod10 Rangeland Production Potential × Stocking Rate
Mod11 Grazing System × Stocking Rate + Rangeland Production Potential
Mod12 Grazing System × Rangeland Production Potential + Stocking Rate
Mod13 Grazing System × Stocking Rate × Rangeland Production Potential
I assessed model fit for the best-fit model within habitat- and management-level
analyses for mesocarnivores from 1,000 simulated datasets using the mb.gof.test function
within AICcmodavg (Mazerolle 2013). Goodness-of-fit tests indicated c ̂ estimates
between 1.3 and 1.5, and p-values < 0.1 for the most parsimonious models within each
model set, providing evidence for potential overdispersion in the data. However, I
identified the cause of lack-of-fit as two sites which had encounter histories of 11110,
where the expected number of sites with this encounter history was 0.1, which
substantially inflated the chi-square statistic. I temporarily removed these two sites with
encounter histories 11110 from the analysis and re-ran the goodness-of-fit test, which
resulted in c ̂ estimates between 0.7 and 1.0, and p-values > 0.95 for the most
parsimonious models within each model set. These results indicated that the models
adequately fit the data, and the original evidence for overdispersion was a result of two
sites with unexpected encounter histories.
The best-fit model within habitat- and management-level analyses was used to
generate predictions of mesocarnivore occupancy over the range of values for each
variable, while holding other variables included in the best-fit model at their means.
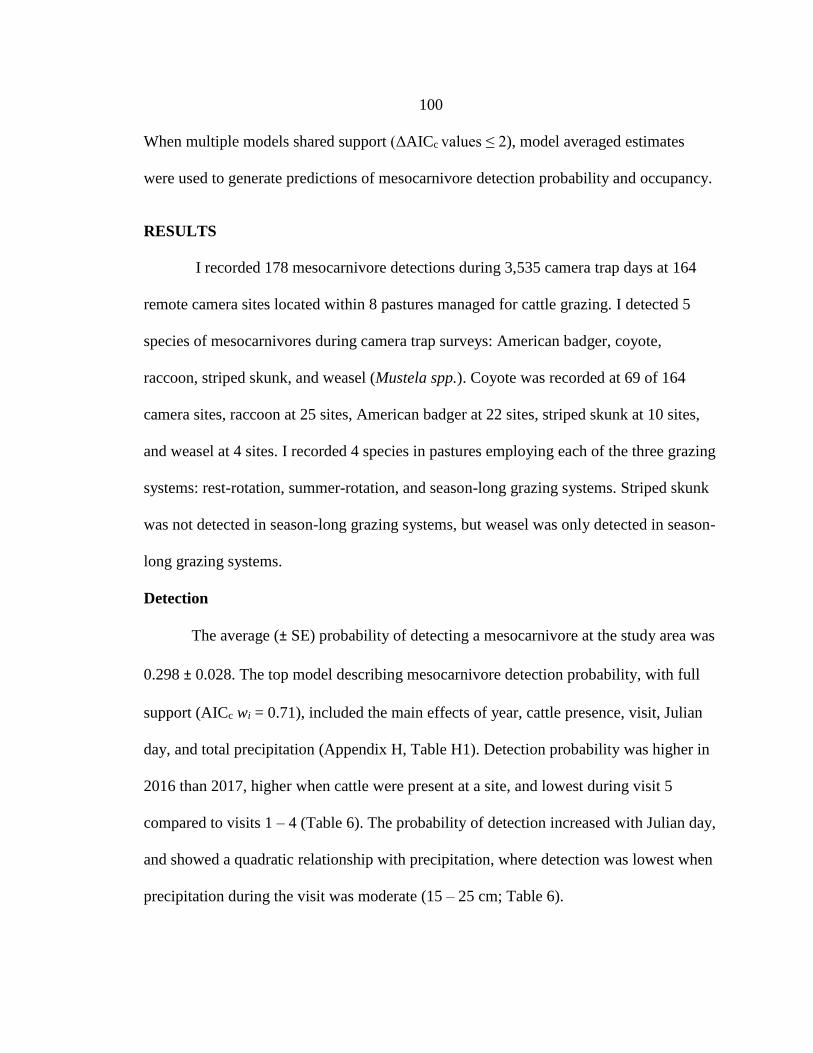
100
When multiple models shared support (ΔAICc values ≤ 2), model averaged estimates
were used to generate predictions of mesocarnivore detection probability and occupancy.
RESULTS
I recorded 178 mesocarnivore detections during 3,535 camera trap days at 164
remote camera sites located within 8 pastures managed for cattle grazing. I detected 5
species of mesocarnivores during camera trap surveys: American badger, coyote,
raccoon, striped skunk, and weasel (Mustela spp.). Coyote was recorded at 69 of 164
camera sites, raccoon at 25 sites, American badger at 22 sites, striped skunk at 10 sites,
and weasel at 4 sites. I recorded 4 species in pastures employing each of the three grazing
systems: rest-rotation, summer-rotation, and season-long grazing systems. Striped skunk
was not detected in season-long grazing systems, but weasel was only detected in season-
long grazing systems.
Detection
The average (± SE) probability of detecting a mesocarnivore at the study area was
0.298 ± 0.028. The top model describing mesocarnivore detection probability, with full
support (AICc wi = 0.71), included the main effects of year, cattle presence, visit, Julian
day, and total precipitation (Appendix H, Table H1). Detection probability was higher in
2016 than 2017, higher when cattle were present at a site, and lowest during visit 5
compared to visits 1 – 4 (Table 6). The probability of detection increased with Julian day,
and showed a quadratic relationship with precipitation, where detection was lowest when
precipitation during the visit was moderate (15 – 25 cm; Table 6).
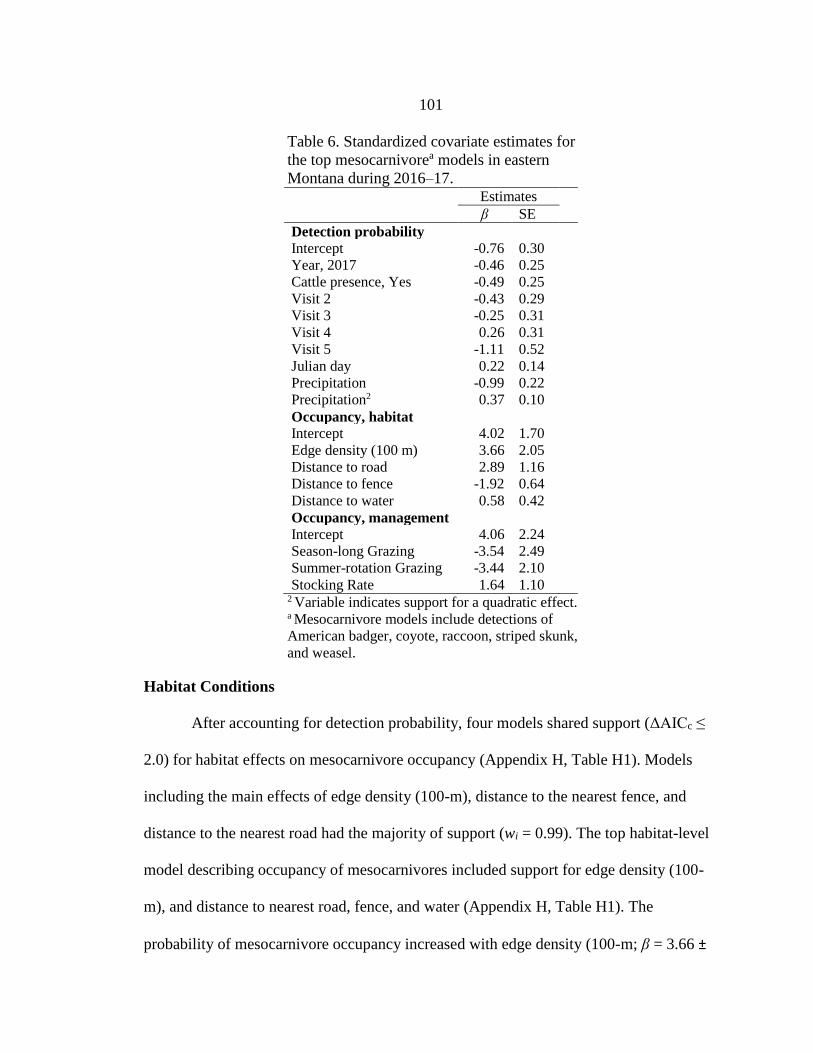
101
Table 6. Standardized covariate estimates for
the top mesocarnivorea models in eastern
Montana during 2016–17. Estimates
β SE
Detection probability
Intercept -0.76 0.30
Year, 2017 -0.46 0.25
Cattle presence, Yes -0.49 0.25
Visit 2 -0.43 0.29
Visit 3 -0.25 0.31
Visit 4 0.26 0.31
Visit 5 -1.11 0.52
Julian day 0.22 0.14
Precipitation -0.99 0.22
Precipitation2 0.37 0.10
Occupancy, habitat
Intercept 4.02 1.70
Edge density (100 m) 3.66 2.05
Distance to road 2.89 1.16
Distance to fence -1.92 0.64
Distance to water 0.58 0.42
Occupancy, management
Intercept 4.06 2.24
Season-long Grazing -3.54 2.49
Summer-rotation Grazing -3.44 2.10
Stocking Rate 1.64 1.10 2 Variable indicates support for a quadratic effect. a Mesocarnivore models include detections of
American badger, coyote, raccoon, striped skunk,
and weasel.
Habitat Conditions
After accounting for detection probability, four models shared support (ΔAICc ≤
2.0) for habitat effects on mesocarnivore occupancy (Appendix H, Table H1). Models
including the main effects of edge density (100-m), distance to the nearest fence, and
distance to the nearest road had the majority of support (wi = 0.99). The top habitat-level
model describing occupancy of mesocarnivores included support for edge density (100-
m), and distance to nearest road, fence, and water (Appendix H, Table H1). The
probability of mesocarnivore occupancy increased with edge density (100-m; β = 3.66 ±
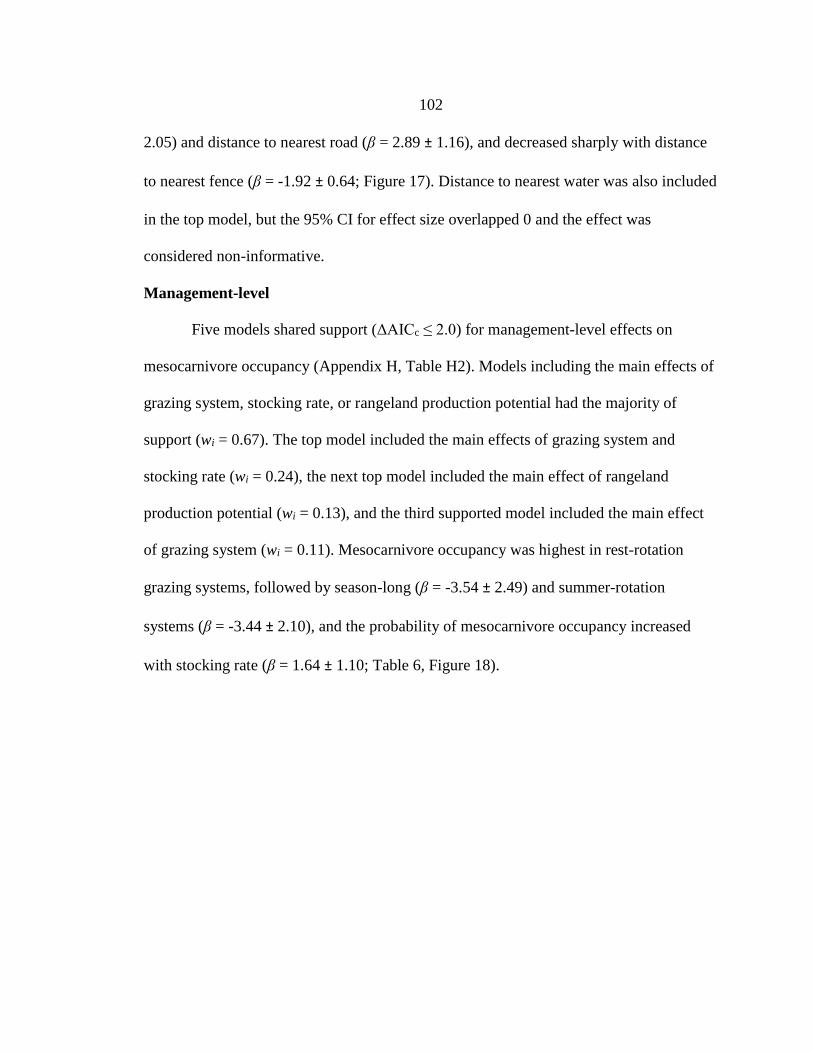
102
2.05) and distance to nearest road (β = 2.89 ± 1.16), and decreased sharply with distance
to nearest fence (β = -1.92 ± 0.64; Figure 17). Distance to nearest water was also included
in the top model, but the 95% CI for effect size overlapped 0 and the effect was
considered non-informative.
Management-level
Five models shared support (ΔAICc ≤ 2.0) for management-level effects on
mesocarnivore occupancy (Appendix H, Table H2). Models including the main effects of
grazing system, stocking rate, or rangeland production potential had the majority of
support (wi = 0.67). The top model included the main effects of grazing system and
stocking rate (wi = 0.24), the next top model included the main effect of rangeland
production potential (wi = 0.13), and the third supported model included the main effect
of grazing system (wi = 0.11). Mesocarnivore occupancy was highest in rest-rotation
grazing systems, followed by season-long (β = -3.54 ± 2.49) and summer-rotation
systems (β = -3.44 ± 2.10), and the probability of mesocarnivore occupancy increased
with stocking rate (β = 1.64 ± 1.10; Table 6, Figure 18).
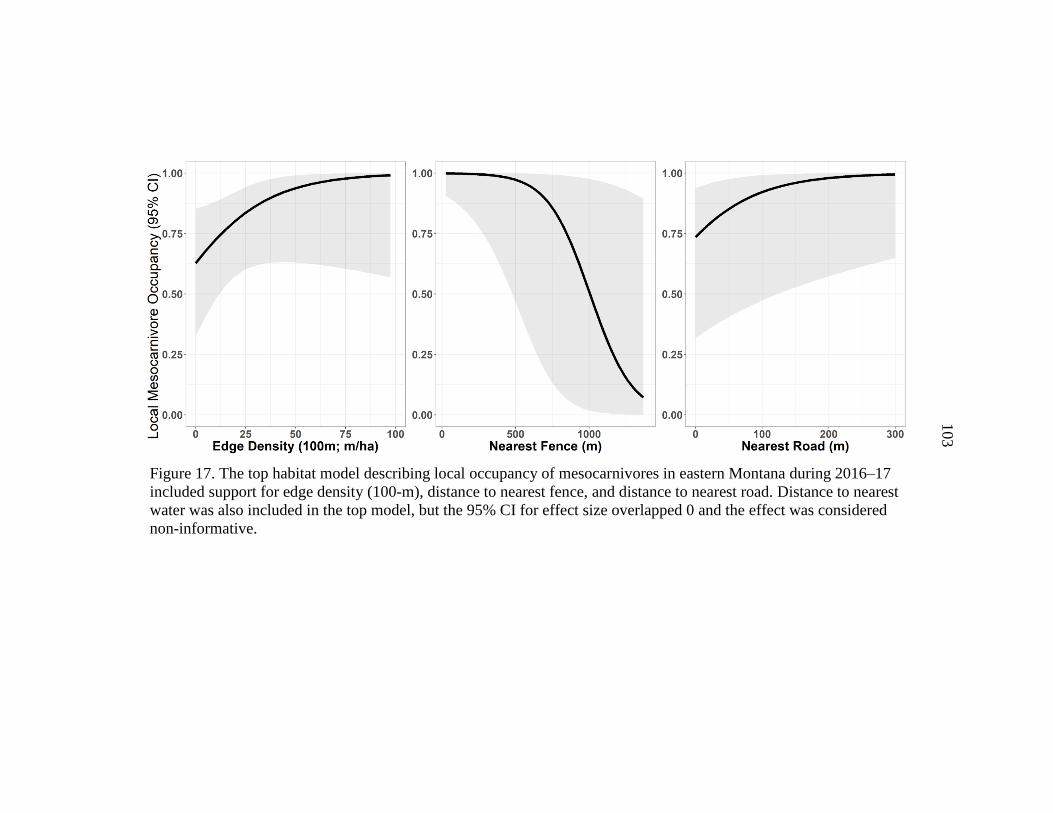
103
Figure 17. The top habitat model describing local occupancy of mesocarnivores in eastern Montana during 2016–17
included support for edge density (100-m), distance to nearest fence, and distance to nearest road. Distance to nearest
water was also included in the top model, but the 95% CI for effect size overlapped 0 and the effect was considered
non-informative.
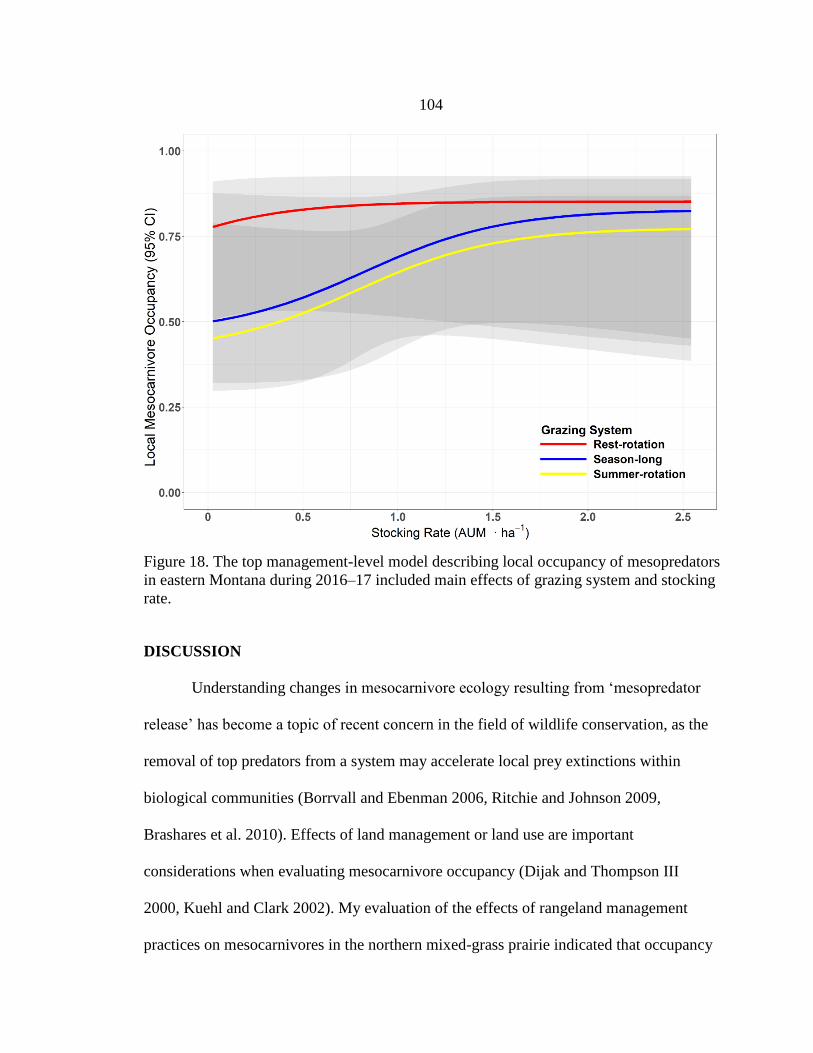
104
Figure 18. The top management-level model describing local occupancy of mesopredators
in eastern Montana during 2016–17 included main effects of grazing system and stocking
rate.
DISCUSSION
Understanding changes in mesocarnivore ecology resulting from ‘mesopredator
release’ has become a topic of recent concern in the field of wildlife conservation, as the
removal of top predators from a system may accelerate local prey extinctions within
biological communities (Borrvall and Ebenman 2006, Ritchie and Johnson 2009,
Brashares et al. 2010). Effects of land management or land use are important
considerations when evaluating mesocarnivore occupancy (Dijak and Thompson III
2000, Kuehl and Clark 2002). My evaluation of the effects of rangeland management
practices on mesocarnivores in the northern mixed-grass prairie indicated that occupancy
105
of mesocarnivores was highest in rest-rotation grazing systems, followed by season-long
and summer-rotation grazing systems. Assuming that hunting and foraging activities are
related to site occupancy in my study area, mesocarnivores may occupy more sites within
rest-rotation grazing systems potentially due to higher foraging success or prey
availability (Fuller and Sievert 2001). Three possible explanations arise: 1) the vegetation
structure created by rest-rotation grazing provides mesocarnivores with greater foraging
efficiency, 2) increased fence density within rest-rotation grazing systems (Chapter 2;
Appendix G, Table G1) facilitates higher mesocarnivore occupancy, or 3) rest-rotation
grazing systems may support a greater abundance of prey, inherently resulting in more
predators to exploit additional prey resources.
Vegetation structure in grassland ecosystems may influence mesocarnivore
foraging efficiency (Bowman and Harris 1980, Crabtree et al. 1989). My analysis of
vegetation conditions among grazing treatments within the rest-rotation grazing system
showed that rest-rotation grazing created patch-size heterogeneity among treatments
within the system (Chapter 2; Appendix G, Table G2). The grazed treatments within the
rest-rotation grazing system also created distinct vegetation structure on the landscape
when compared to adjacent pastures. I found that grazed pastures within the rest-rotation
grazing system were characterized by lower residual grass height and density, lower litter
depth, and higher bare ground coverage compared to the other two grazing systems
within my study area. Previous researchers have suggested that predator foraging
efficiency may be higher in areas of low vegetation height and density (Johnson and
Temple 1990, Sutter and Ritchison 2005). Grazing systems with more intensive
106
manipulation of livestock, such as rest-rotation grazing, will typically result in more even
forage utilization and lower within-pasture heterogeneity in vegetation structure as a
result of reduced cattle forage selectivity (Coughenour 1991, Hart et al. 1993, Holechek
et al. 2011). Mesocarnivores in my study area may have higher site occupancy in pastures
managed with rest-rotation grazing due to increased foraging or hunting efficiency in a
system which creates patch-size heterogeneity among pastures by reducing the amount of
small-scale, within-pasture heterogeneity. Additionally, the overall shorter, sparser
vegetation structure of pastures within the rest-rotation grazing system in my study area
may facilitate increased mesocarnivore foraging efficiency.
Low livestock stocking rates (relative to the specific grassland ecosystem)
typically result in higher cattle forage selectivity and higher within-pasture heterogeneity
in vegetation structure, when compared to high stocking rates (Bailey et al. 1998,
Fuhlendorf and Engle 2001, Toombs et al. 2010). I found mesocarnivore occupancy
increased with stocking rate, and these results were consistent with previous research
suggesting that livestock grazing may facilitate increased use by mesocarnivores (Gese
and Thompson 2014). These results support the hypothesis that mesocarnivore foraging
or hunting efficiency decreases in areas of rangeland dominated by small-scale, within-
pasture heterogeneity, compared to large-scale patch-heterogeneity. However, these
results also differ from previous research which has suggested that mesocarnivore
activity declines with increasing livestock grazing intensity, potentially from decreased
small mammal prey abundance associated with livestock grazing (Villar et al. 2013, Bylo
et al. 2014). Likely due to the difficulty of surveying mesocarnivores, these studies used
107
burrow occurrence or scat counts as an index of mesocarnivore activity rather than
techniques to estimate true occupancy or abundance, which may account for the
inconsistencies among studies. Additionally, imperfect detection of burrows was not
accounted for, but due to rigorous survey methods, assumed to be equal to 1.0. Other
potential explanations for inconsistencies between my results and previous work include
the absence of small mammal density data relative to grazing systems and mesocarnivore
occupancy in my study, and the overall low-moderate stocking rates at my study area.
Strategies to restore patch-size structural heterogeneity to North American
prairies have recently been promoted in rangeland management (Fuhlendorf et al. 2006,
Fuhlendorf et al. 2012). Within the context of patch-heterogeneity based grazing
management, researchers have shown that some mesocarnivores do not necessarily
occupy those habitats with the highest prey abundance, suggesting that foraging
efficiency may be more important than prey density (Ricketts 2016). In my study area,
mesocarnivores appear to select vegetation conditions created by rest-rotation grazing
systems over those of season-long or summer-rotation grazing systems. If heterogeneity
in vegetation structure functions to decrease predator foraging efficiency as previous
researchers have suggested (Bowman and Harris 1980, Crabtree et al. 1989, Martin
1993), the scale at which this occurs may not be at the patch-scale. My evaluation of
vegetation conditions showed that the rest-rotation grazing systems within my study area
created patch-heterogeneity in vegetation structure. However, I found occupancy of
mesocarnivores was highest in rest-rotation grazing systems, indicating that heterogeneity
at the patch-scale may not act to decrease predator foraging efficiency. Rather, small-
108
scale within-pasture heterogeneity created by higher livestock forage selectivity within
the season-long or summer-rotation grazing systems may reduce predator foraging
efficiency, relative to rest-rotation grazing in my study area.
The alternative to increased foraging efficiency explaining higher mesocarnivore
occupancy is the potential for increased prey abundance in rest-rotation grazing systems
to result in more predators to exploit additional prey resources. The typical goal of
conservation-based livestock grazing systems which incorporate rotations or deferments
from grazing, such as the rest-rotation grazing system, is to support grassland wildlife
populations through livestock exclusion or extended periods of rest from livestock
grazing (Krausman et al. 2009). However, there are numerous inconsistencies in the
literature concerning the benefits of rotational or conservation-based grazing systems on
wildlife populations or ecosystem functioning (Briske et al. 2008, Krausman et al. 2009,
Roche et al. 2015). Thus, making generalizations to wildlife populations based on the
type of grazing management being implemented is inappropriate. I found abundance of
grassland birds was lowest in rest-rotation grazing systems, relative to season-long or
summer-rotation systems. These results do not support the hypothesis that mesocarnivore
occupancy is higher within rest-rotation grazing systems due to a higher prey availability.
However, I have no data on abundance of small mammals, another main food resource of
mesocarnivores. Previous researchers have found that patch-heterogeneity based
rangeland management has a positive influence on community structure and species
diversity of small mammals in prairie ecosystems (Ricketts and Sandercock 2016).
However, occupancy of some mesocarnivores is not necessarily highest in areas of
109
greatest primary prey abundance (Ricketts 2016). Small mammal abundance is often
lower in pastures grazed by livestock compared to ungrazed pastures, and abundance may
decrease with increasing grazing intensity (Runge 2005, Schmidt et al. 2005, Evans et al.
2006, Bueno et al. 2011, Evans et al. 2015, Schieltz and Rubenstein 2016).
Mesocarnivore occupancy would likely not respond positively to increasing stocking rate
if prey abundance was significantly lower in areas of high stocking rates, unless prey
search efficiency is increased. Habitat structure may be a more important influence on
occupancy of mesocarnivores than prey abundance, and the reduced small-scale, within-
pasture heterogeneity created by higher stocking rates and by rest-rotation grazing
systems in my study area may increase predator foraging or hunting efficiency.
In my analyses of the habitat variables which may influence mesocarnivore
occupancy in northern mixed-grass prairie ecosystems, I found strong support for edge
density (100-m), distance to nearest fence, and distance to nearest road. The positive
relationship I found between mesocarnivore occupancy and edge density was not
surprising, as predators typically forage and hunt along edges (Andrén 1995, Pedlar et al.
1997, Dijak and Thompson III 2000). I also found a positive relationship between
mesocarnivore occupancy and distance to the nearest road or two-track, where areas
further from roads had higher predicted site occupancy. This may be due to
mesocarnivore avoidance of human presence, as previous researchers have found
mesocarnivores avoid areas of high-traffic or human presence associated with oil
development activities (Burr et al. 2017).
110
In agricultural landscapes, researchers have suggested that fencerows may be
perceived as edge habitat, and that fences are often used as travel corridors for
mesocarnivores (Pedlar et al. 1997). Additionally, previous researchers evaluating
mesocarnivore occupancy using remote cameras in grassland habitats specifically
selected camera trap locations along fencelines to maximize mesocarnivore detections,
suggesting fences are associated with high mesocarnivore activity (Smith et al. 2017).
Within contiguous rangeland landscapes such as that of my study area, I hypothesized
that fences may represent effective habitat edges, potentially due to their physical
structure and/or the difference in vegetation structure created by variable grazing regimes
among pastures divided by fence. I found a negative relationship between mesocarnivore
occupancy and distance to the nearest fence, which was consistent with my hypothesis
and supported previous work in regard to mesocarnivore use of fencelines. In areas
beyond 500 m from fences, predicted mesocarnivore site occupancy declined sharply. My
results could have implications for mesocarnivore prey species occupying rangelands
managed with multi-pasture rotational livestock grazing systems, such as rest-rotation or
short-duration grazing systems. These more intensively managed grazing systems use
fencing to divide larger pastures into multiple smaller pastures, effectively achieving the
desired forage utilization of the range manager (Williams 1954, Hart et al. 1993). Adding
more fence to the landscape may facilitate mesocarnivore occupancy and/or foraging
efficiency in these areas, potentially reducing survival or reproductive output of grassland
birds and small mammals, common mesocarnivore prey.
111
My research provides evidence for increased mesocarnivore occupancy in
rangelands managed in rest-rotation grazing systems and rangelands managed with high
stocking rates. Previous researchers have suggested that mesocarnivore nest depredation
may often be opportunistic (Vickery et al. 1992a). As such, conservation-based rest-
rotation grazing systems which support higher occupancy of mesocarnivores have the
potential to facilitate unintended impacts on grassland bird nesting ecology in grassland
ecosystems. This implication is based on the assumption that increased mesocarnivore
site occupancy results in decreased grassland bird reproductive output or survival, which
may depend upon a number of factors. However, recent work from the northern mixed-
grass prairie found a negative correlation between nest survival of a ground-nesting
obligate grassland bird, the sharp-tailed grouse (Tympanuchus phasianellus) and
mesocarnivore occupancy (Burr et al. 2017). Further research is needed to relate
mesocarnivore occupancy to grassland bird demographic and survival rates in the context
of livestock grazing management.
MANAGEMENT IMPLICATIONS
I found mesocarnivore occupancy was highest in rest-rotation grazing systems,
followed by season-long and summer-rotation grazing systems. These results may be due
to lower within-pasture heterogeneity, or overall shorter and sparser vegetation structure
in rest-rotation grazing systems, resulting in increased mesocarnivore foraging or hunting
efficiency. Additionally, the patch-heterogeneity in vegetation structure, along with
increased fence density in rest-rotation grazing systems may function as perceived edge
112
habitat and increase mesocarnivore occupancy, as I found a strong negative relationship
between mesopredator occupancy and distance to the nearest fence.
Previous researchers have suggested that livestock grazing intensity may have a
negative effect on mesocarnivore habitat use (Villar et al. 2013, Bylo et al. 2014, Evans
et al. 2015). I found a positive relationship between mesopredator occupancy and
stocking rate, where occupancy was maximized at the highest stocking rates within my
study area. However, stocking rates within my study were generally low to moderate, so
habitat use of mesocarnivores may respond negatively to higher stocking rates than were
included in my study. I cannot make inferences regarding the relationship between
occupancy of mesopredators and higher livestock stocking rates, especially above 2.5
AUM ⋅ ha-1.
My results indicate that rest-rotation grazing systems, as well as livestock grazing
management which employs relatively high stocking rates, may facilitate higher
mesocarnivore occupancy. Nest depredation by mesocarnivores is often opportunistic, so
management that facilitates increased mesocarnivore occupancy has the potential to
negatively impact grassland bird reproductive output. However, mesocarnivore
occupancy may not translate to negative effects on grassland bird demography relative to
other grazing systems if nest or brood survival is higher in rest-rotation grazing systems,
as previous researchers have suggested (Rice and Carter 1982). A demographic study
comparing mesopredator occupancy to grassland bird fecundity within the context of
grazing management practices in grassland ecosystems is needed confirm or deny the
implication that grassland bird reproductive success is negatively impacted by increased

113
mesocarnivore occupancy in the northern mixed-grass prairie, and would support the
implications of my results on grassland bird populations.
114
CONCLUSIONS AND RECOMMENDATIONS
Grassland birds have experienced steeper population declines than any other avian
guild during the past century (Knopf 1996, Brennan and Kuvlesky Jr 2005, Sauer et al.
2013). Breeding and wintering habitat historically dominated by contiguous, native
grassland has undergone substantial degradation through widespread agricultural
development and habitat fragmentation (Knopf 1994, Brennan and Kuvlesky Jr 2005,
Askins et al. 2007). As a result, rangelands managed for livestock grazing constitute the
majority of remaining grassland bird habitat (Knopf 1996, Davis et al. 2014).
Unfortunately, conserving large tracts of grassland habitat, in itself, may not be sufficient
to reverse grassland bird population trends (With et al. 2008). Proper management of
remaining grassland habitat is necessary to incorporate within current grassland bird
conservation efforts (With et al. 2008). Additionally, mesocarnivores as a guild have
recently seen increased abundances and have undergone substantial range expansions in
grassland ecosystems following extirpation of apex predators (Prugh et al. 2009).
Mesocarnivores are a main predator of grassland birds and their nests (Rollins and
Carroll 2001, Hovick et al. 2011, Pietz et al. 2012, Burr et al. 2017), and ‘mesopredator
release’ has been attributed to population declines of birds and other mesocarnivore prey
(Ritchie and Johnson 2009, Brashares et al. 2010). Therefore, understanding the effects of
rangeland management on mesocarnivores is also an important consideration within
grassland bird conservation efforts.
Grassland ecosystems in the shortgrass, tallgrass, and mixed-grass prairie regions
of North America were historically heterogeneous landscapes dominated by frequent, yet
115
sporadic disturbance from bison grazing and natural or Native American induced wildfire
(Pyne 1993, Kay 1998, Knapp et al. 1999). Rangeland management practices which
restore this patchy heterogeneity in vegetation structure within grassland ecosystems,
such as patch-burn grazing, have proven ecologically beneficial for numerous wildlife
taxa native to these habitats, including grassland birds (Fuhlendorf et al. 2006, Coppedge
et al. 2008, McNew et al. 2015, Ricketts and Sandercock 2016, Winder et al. 2018). The
rest-rotation grazing system may have a similar effect on grassland wildlife, conceptually
creating patch-heterogeneity in rangeland vegetation structure with the use of fence and
strategic manipulation of livestock grazing among pastures within the system (Hagen et
al. 2004, Derner et al. 2009, Toombs et al. 2010). However, little information exists
regarding the effects of rest-rotation grazing on grassland wildlife, or the ability of this
system to create the patch-heterogeneity in vegetation structure which effectively mimics
historical grassland disturbance.
Research in the field of avian ecology has recently focused on understanding
grassland bird habitat selection and demography in the context of variable land
management practices, annual precipitation, and rangeland productivity within prairie
ecosystems (Golding and Dreitz 2017, Lipsey and Naugle 2017). In the northern mixed-
grass prairie, precipitation may have a more significant influence on vegetation structure
and composition than livestock grazing management (Vermeire et al. 2008). Grassland
birds have responded positively to the patch-heterogeneity created through grazing
management practices which utilize pyric-herbivory (i.e., patch-burn grazing). The
absence of fire in the northern mixed-grass prairie conceptually justifies implementation
116
of an intensive, conservation-based livestock grazing system (i.e., rest-rotation grazing)
to overcome effects of variable annual precipitation and restore patch-heterogeneity in
grassland vegetation structure.
My research evaluated the effects of livestock grazing management on the
abundance of grassland birds and occupancy of mesocarnivores in the northern mixed-
grass prairie, specifically comparing rest-rotation grazing to more commonly
implemented grazing systems, season-long and summer-rotation grazing. My objectives
were to 1) evaluate how species-specific abundances and community composition of
grassland birds were affected by livestock grazing management in the context of site-
specific rangeland production potential, 2) evaluate how occupancy of mesocarnivores
was affected by livestock grazing management in the context of site-specific rangeland
production potential, 3) estimate the importance of habitat conditions and vegetation
characteristics for grassland birds and mesocarnivores, as mediated by livestock grazing
management, 4) evaluate the effectiveness of rest-rotation grazing to create patch-
heterogeneity in rangeland vegetation structure, and 5) provide management
recommendations to agencies and private landowners for improving grassland bird
habitat quality, and for reducing the potential impacts of mesocarnivore depredation of
grassland birds and their nests in northern mixed-grass prairie ecosystems.
My analysis of vegetation conditions among treatments within the rest-rotation
grazing system showed that this system created patch-size heterogeneity in rangeland
vegetation structure among treatments, as conceptualized by previous researchers (Hagen
et al. 2004, With et al. 2008, Toombs et al. 2010). Pastures deferred from grazing the
117
previous year had significantly (p < 0.05) higher visual obstruction, residual grass height,
and litter depth, and significantly lower bare ground than the two grazed treatments, and
the post-seed ripe grazing treatment had significantly lower residual grass coverage than
the other two treatments.
The rest-rotation grazing systems in my study area also created patches of distinct
vegetation structure when compared to adjacent pastures in two more commonly
employed grazing systems, season-long and summer-rotation grazing. I found that grazed
pastures within the rest-rotation grazing system were characterized by lower residual
grass height and density, lower litter depth, and higher bare ground coverage compared to
the other two grazing systems within my study area. However, it appears the rest-rotation
grazing systems within my study area failed to create structurally distinct vegetation
conditions for species which require dense-grass habitats, when compared to adjacent
pastures managed under the two other grazing systems. Results from my assessment of
vegetation conditions were supported by the relationship I found between abundance of
grasshopper sparrows, the dense-grass representative in my study, and grazing system,
where season-long grazing systems supported the highest overall abundance of
grasshopper sparrows. Evaluating the effects of grazing systems on the ecology of other
dense-grass species in the northern mixed-grass prairie is necessary to support the
implications of my results to this guild of grassland birds.
Hypothetically, pastures within the rest-rotation grazing system which
experienced rest from livestock grazing during the previous grazing season should be
characterized by the tallest, densest herbaceous vegetation structure, relative to adjacent
118
grazed pastures. However, average residual grass coverage was higher and bare ground
coverage was lower in season-long and summer-rotation grazing systems than the rested
treatment within the rest-rotation grazing system. Average litter depth between the rested
treatment of the rest-rotation grazing system and the season-long grazing system was
similar. As a result, the only structurally distinct grassland habitat that the rest-rotation
grazing system appeared to create, relative to the other two grazing systems in my study
area, were patches of short, sparse vegetation with high bare ground and low litter depth.
These findings may contribute to the reason I did not find evidence that grassland bird
community composition differed among treatments within the rest-rotation grazing
system, or among grazing systems, and may indicate that the distinction among patches
in terms of vegetation structure was not adequate for exhibition of species-specific habitat
selection in my study area.
At the management-level, I found evidence for an effect of livestock grazing
system and stocking rate on abundance of grassland birds and occupancy of
mesocarnivores within my study area. Abundance of grasshopper sparrow (β = -0.10 ±
0.03), western meadowlark (β = -0.09 ± 0.03), and all grassland-associated species (β = -
0.06 ± 0.02) showed a negative relationship with increasing stocking rate, and the effect
was similar among grazing systems. Occupancy of mesocarnivores showed a positive
relationship with increasing stocking rate (β = 1.64 ± 1.10). Within my study area in the
northern mixed-grass prairie, low stocking rates (0 – 1 AUM ⋅ ha-1) appear to support
overall higher abundances of grassland birds, and facilitate lower occupancy of
mesocarnivores.
119
I found species-specific responses of grassland birds to livestock grazing
management differ even at small spatial extents, and may be mediated by rangeland
production. Two grassland obligate species, grasshopper sparrow and western
meadowlark, showed support for an interaction between grazing system and rangeland
production potential. Abundance of grasshopper sparrow, a dense-grass representative in
my study area, showed a positive relationship with increasing rangeland production
potential in season-long grazing systems, while a quadratic response was supported in
summer-rotation and rest-rotation grazing systems, where abundance was maximized at
intermediate estimates of production potential. Abundance of western meadowlark,
typically a generalist species, was highest in summer-rotation grazing systems in sites of
low rangeland production potential (<1,000 kg ⋅ ha-1) and lowest in summer-rotation
systems in sites of high production potential (>1,500 kg ⋅ ha-1), while the effect was
similar between rest-rotation and season-long grazing systems. The vesper sparrow, a
sparse-grass representative in my study area, showed support for an effect of grazing
system, where abundance was highest in summer-rotation grazing systems, followed by
rest-rotation and season-long grazing systems.
A caveat to making management recommendations based on estimates of
abundance is the potential dissociation between abundance and demography (Van Horne
1983, Bock and Jones 2004). However, estimates of avian abundances within native
landscapes that are characterized by light human disturbance likely make reliable indices
of habitat quality (Bock and Jones 2004). Habitats characterized by greater alteration
from their native form have a higher probability of functioning as ecological sinks, where
120
disturbed habitats appear desirable and are selected by more individuals, but these
individuals ultimately experience lower reproductive output (Van Horne 1983). Further
research is needed to evaluate the effects of livestock grazing management on the
demography of grassland birds in northern mixed-grass prairie ecosystems.
Occupancy of mesocarnivores was highest in rest-rotation grazing systems,
followed by season-long and summer-rotation systems. Previous researchers have
suggested that predator foraging efficiency may be higher in areas of low vegetation
height and density (Johnson and Temple 1990, Sutter and Ritchison 2005). Grazing
systems with more intensive manipulation of livestock, such as rest-rotation grazing, will
result in even forage utilization and lower within-pasture heterogeneity in vegetation
structure as a result of reduced cattle forage selectivity (Coughenour 1991, Hart et al.
1993, Holechek et al. 2011). Mesocarnivores in my study area may have higher site
occupancy in pastures managed with rest-rotation grazing due to increased foraging or
hunting efficiency in a system which creates patch-size heterogeneity among pastures by
reducing the amount of small-scale, within-pasture heterogeneity. Additionally, the
overall shorter, sparser vegetation structure of pastures within the rest-rotation grazing
system in my study area may facilitate increased mesocarnivore foraging efficiency.
My research provides an evaluation of the effects of livestock grazing
management, specifically grazing system type and stocking rate, on the ecology of
grassland birds and mesocarnivores in northern mixed grass prairie rangelands of
northeastern Montana. Overall, I did not find support for a noticeable benefit of rest-
rotation grazing on abundance or diversity of grassland birds relative to two more
121
commonly employed grazing systems, season-long and summer-rotation grazing.
Significant interactions between grazing management and local rangeland productivity
may severely limit our ability to recommend general management practices to benefit
grassland bird populations, or even specific species, on rangelands managed for livestock
production. Thus, regional or distribution-wide guidelines for livestock grazing
management are inappropriate in terms of grassland bird conservation efforts. Rather,
efforts for conserving grassland birds on rangelands in the northern mixed-grass prairie
should identify specific conservation goals and management should occur at the local,
individual pasture scale.
I found evidence that occupancy of mesocarnivores is higher in rest-rotation
grazing systems, relative to season-long and summer-rotation grazing systems. Grassland
bird nest depredation is often opportunistic (Vickery et al. 1992a), so higher
mesocarnivore occupancy has the potential to negatively impact grassland bird
reproductive output if occupancy and avian nest depredation are correlated, as previous
research has suggested (Burr et al. 2017). Further research is necessary to evaluate the
demographic responses of grassland birds to livestock grazing systems and stocking rates,
especially in the context of variable rangeland production potential and mesocarnivore
occupancy.
My research was conducted during two years of average precipitation conditions.
Further research may be necessary to evaluate the effects of rest-rotation livestock
grazing on grassland bird ecology in years of drought conditions. However, if my results
are applicable during years of average and extreme precipitation and weather conditions,

122
allocating funds to establish conservations easements which keep grassland ecosystems
from further human development, rather than for the implementation of rest-rotation
grazing systems would be more beneficial for the conservation of grassland birds in the
northern mixed-grass prairie.

123
REFERENCES CITED
124
Ahlering, M. A., and J. Faaborg. 2006. Avian habitat management meets conspecific
attraction: If you build it, will they come? The Auk 123:301-312.
Ahlering, M. A., and C. L. Merkord. 2016. Cattle grazing and grassland birds in the
northern tallgrass prairie. Journal of Wildlife Management 80:643-654.
Allred, B. W., S. D. Fuhlendorf, D. M. Engle, and R. D. Elmore. 2011. Ungulate
preference for burned patches reveals strength of fire–grazing interaction.
Ecology and Evolution 1:132-144.
Allred, B. W., J. D. Scasta, T. J. Hovick, S. D. Fuhlendorf, and R. G. Hamilton. 2014.
Spatial heterogeneity stabilizes livestock productivity in a changing climate.
Agriculture, ecosystems & environment 193:37-41.
Anderson, E. W. 1967. Grazing systems as methods of managing the range resources.
Journal of Range Management 20:383-388.
Anderson, R. C. 1982. An evolutionary model summarizing the roles of fire, climate, and
grazing animals in the origin and maintenance of grasslands: an end paper. Pages
295-305 in Grasses and grasslands: systematics and ecology. Univ. Oklahoma
Press, Norman, Oklahoma, USA.
Andrén, H. 1995. Effects of landscape composition on predation rates at habitat edges.
Pages 225-255 in L. Hansson, L. Fahrig, and G. Merriam, editors. Mosaic
landscapes and ecological processes. Chapman & Hall, New York, New York,
USA.
Archer, S., and F. E. Smeins. 1991. Ecosystem-level processes. Pages 109-139 in R.K.
Heitschmidt and J. W. Stuth, editors. Grazing management: An ecological
perspective. Timber Press, Portland, Oregon, USA.
Arnold, T. W. 2010. Uninformative parameters and model selection using Akaike's
Information Criterion. Journal of Wildlife Management 74:1175-1178.
Askins, R. A., F. Chávez-Ramírez, B. C. Dale, C. A. Haas, J. R. Herkert, F. L. Knopf,
and P. D. Vickery. 2007. Conservation of grassland birds in North America:
understanding ecological processes in different regions. Ornithological
Monographs 64:1-46.
Augustine, D. J., and J. D. Derner. 2015. Patch‐burn grazing management, vegetation
heterogeneity, and avian responses in a semi‐arid grassland. The Journal of
Wildlife Management 79:927-936.
Bailey, D. 2004. Management strategies for optimal grazing distribution and use of arid
rangelands. Journal of Animal Science 82:E147-E153.
125
Bailey, D. W. 2005. Identification and creation of optimum habitat conditions for
livestock. Rangeland Ecology & Management 58:109-118.
Bailey, D. W., B. Dumont, and M. F. WallisDeVries. 1998. Utilization of heterogeneous
grasslands by domestic herbivores: theory to management. Annales de Zootechnie
47:321-333.
Bailey, D. W., J. E. Gross, E. A. Laca, L. R. Rittenhouse, M. B. Coughenour, D. M.
Swift, and P. L. Sims. 1996. Mechanisms that result in large herbivore grazing
distribution patterns. Journal of Range Management 49:386-400.
Báldi, A., P. Batáry, and S. Erdős. 2005. Effects of grazing intensity on bird assemblages
and populations of Hungarian grasslands. Agriculture, ecosystems & environment
108:251-263.
Barrett, K. J., E. L. Kalies, and C. L. Chambers. 2012. Predator occupancy rates in a
thinned ponderosa pine forest, Arizona: a pilot study. Wildlife Society Bulletin
36:232-239.
Benedict, R. A., P. W. Freeman, and H. H. Genoways. 1996. Prairie legacies-mammals.
Pages 149-166 in F. B. Sampson and F. L. Knopf, editors. Prairie conservation:
preserving North America's most endangered ecosystem. Island Press,
Washington, D.C., USA.
Biondini, M. E., B. D. Patton, and P. E. Nyren. 1998. Grazing intensity and ecosystem
processes in a northern mixed‐grass prairie, USA. Ecological Applications 8:469-
479.
Bleho, B. I., N. Koper, and C. S. Machtans. 2014. Direct effects of cattle on grassland
birds in Canada. Conservation Biology 28:724-734.
Bluemle, J. P. 1991. The face of North Dakota. Revised edition. North Dokota
Geological Survey Educational Series 21.
Bock, C. E., and Z. F. Jones. 2004. Avian habitat evaluation: should counting birds
count? Frontiers in Ecology and the Environment 2:403-410.
Bock, C. E., V. A. Saab, T. D. Rich, and D. S. Dobkin. 1993. Effects of livestock grazing
on neotropical migratory landbirds in western North America. Pages 296-309 in
D. M. Finch and P. W. Stangel, editors. Status and management of Neotropical
migratory birds. U.S. Forest Service General Technical Report RM-229.
Borer, E. T., C. J. Briggs, W. W. Murdoch, and S. L. Swarbrick. 2003. Testing intraguild
predation theory in a field system: does numerical dominance shift along a
gradient of productivity? Ecology letters 6:929-935.
126
Borrvall, C., and B. Ebenman. 2006. Early onset of secondary extinctions in ecological
communities following the loss of top predators. Ecology letters 9:435-442.
Bowman, G. B., and L. Harris. 1980. Effect of spatial heterogeneity on ground-nest
depredation. The Journal of Wildlife Management 44:806-813.
Brashares, J. S., L. R. Prugh, C. J. Stoner, and C. W. Epps. 2010. Ecological and
conservation implications of mesopredator release. Pages 221–240 in Terborgh,
J., and J. A. Estes, editors. Trophic Cascades: Predators, Prey, and the Changing
Dynamics of Nature. Island Press, Washington, D. C., USA.
Brennan, L. A., and W. P. Kuvlesky Jr. 2005. Invited Paper: North American Grassland
Birds: An Unfolding Conservation Crisis? Journal of Wildlife Management 69:1-
13.
Briske, D. D., J. Derner, J. Brown, S. Fuhlendorf, W. Teague, K. Havstad, R. L. Gillen,
A. J. Ash, and W. Willms. 2008. Rotational grazing on rangelands: reconciliation
of perception and experimental evidence. Rangeland Ecology & Management
61:3-17.
Browder, S. F., D. H. Johnson, and I. Ball. 2002. Assemblages of breeding birds as
indicators of grassland condition. Ecological Indicators 2:257-270.
Brunson, M. W., and L. Huntsinger. 2008. Ranching as a conservation strategy: can old
ranchers save the New West? Rangeland Ecology & Management 61:137-147.
Bueno, C., K. Ruckstuhl, N. Arrigo, A. Aivaz, and P. Neuhaus. 2011. Impacts of cattle
grazing on small-rodent communities: an experimental case study. Canadian
Journal of Zoology 90:22-30.
Burnham, K. P., D. R. Anderson, and K. P. Huyvaert. 2011. AIC model selection and
multimodel inference in behavioral ecology: some background, observations, and
comparisons. Behavioral Ecology and Sociobiology 65:23-35.
Burr, P. C., A. C. Robinson, R. T. Larsen, R. A. Newman, and S. N. Ellis-Felege. 2017.
Sharp-Tailed Grouse Nest Survival and Nest Predator Habitat Use in North
Dakota’s Bakken Oil Field. PLOS ONE 12:e0170177.
Buskness, N. A., R. K. Murphy, K. F. Higgins, and J. Jenks. 2001. Breeding bird
abundance and habitat on two livestock grazing regimes in North Dakota.
Proceedings of the South Dakota Academy of Science 80:247-258.
Bylo, L. N., N. Koper, and K. A. Molloy. 2014. Grazing intensity influences ground
squirrel and American badger habitat use in mixed-grass prairies. Rangeland
Ecology & Management 67:247-254.
127
Canfield, R. H. 1941. Application of the line interception method in sampling range
vegetation. Journal of Forestry 39:388-394.
Churchwell, R. T., C. A. Davis, S. D. Fuhlendorf, and D. M. Engle. 2008. Effects of
patch-burn management on dickcissel nest success in a tallgrass prairie. Journal of
Wildlife Management 72:1596-1604.
Cody, M. L. 1985. Habitat selection in grassland and open-country birds. Pages 191-226
in M. L. Cody, editor. Habitat Selection in Birds. Academic Press, Orlando,
Florida, USA.
Conner, R. N., and C. S. Adkisson. 1977. Principal component analysis of woodpecker
nesting habitat. The Wilson Bulletin 89:122-129.
Coppedge, B. R., D. M. Engle, R. E. Masters, and M. S. Gregory. 2006. Development of
a grassland integrity index based on breeding bird assemblages. Environmental
Monitoring and Assessment 118:125-145.
Coppedge, B. R., S. D. Fuhlendorf, W. C. Harrell, and D. M. Engle. 2008. Avian
community response to vegetation and structural features in grasslands managed
with fire and grazing. Biological Conservation 141:1196-1203.
Coughenour, M. B. 1991. Spatial components of plant-herbivore interactions in pastoral,
ranching, and native ungulate ecosystems. Journal of Range Management 44:530-
542.
Crabtree, R. L., L. S. Broome, and M. L. Wolfe. 1989. Effects of habitat characteristics
on gadwall nest predation and nest-site selection. The Journal of Wildlife
Management 53:129-137.
Crooks, K. R., and M. E. Soulé. 1999. Mesopredator release and avifaunal extinctions in
a fragmented system. Nature 400:563-566.
Daubenmire, R. 1959. A canopy-coverage method of vegetational analysis. Northwest
Science 33:43-64.
Davis, C. A., R. T. Churchwell, S. D. Fuhlendorf, D. M. Engle, and T. J. Hovick. 2016.
Effect of pyric herbivory on source–sink dynamics in grassland birds. Journal of
Applied Ecology 53:1004-1012.
Davis, S. K. 2003. Nesting ecology of mixed-grass prairie songbirds in southern
Saskatchewan. The Wilson Bulletin 115:119-130.
_____. 2004. Area sensitivity in grassland passerines: effects of patch size, patch shape,
and vegetation structure on bird abundance and occurrence in southern
Saskatchewan. The Auk 121:1130-1145.
128
Davis, S. K., B. C. Dale, T. Harrison, and D. C. Duncan. 2014. Response of grassland
songbirds to grazing system type and range condition. Pages 110-119 in
Proceedings of the North American Prairie Conference.
Davis, S. K., and W. E. Lanyon. 2008. Western Meadowlark (Sturnella neglecta). in A.
Poole, editor. The Birds of North America Online. Ithaca, New York, USA.
Accessed 1 Sept 2017.
Dechant, J. A., M. F. Dinkins, D. H. Johnson, L. D. Igl, C. M. Goldade, and B. R. Euliss.
2002a. Effects of management practices on grassland birds: Vesper Sparrow. —
USGS Northern Prairie Wildlife Research Center. Jamestown, ND, p. 117.
Dechant, J. A., M. L. Sondreal, D. H. Johnson, L. D. Igl, C. M. Goldade, M. P.
Nenneman, and B. R. Euliss. 2002b. Effects of management practices on
grassland birds: Grasshopper Sparrow. — USGS Northern Prairie Wildlife
Research Center. Jamestown, ND, p. 147.
Derner, J. D., R. H. Hart, M. A. Smith, and J. W. Waggoner. 2008. Long-term cattle gain
responses to stocking rate and grazing systems in northern mixed-grass prairie.
Livestock Science 117:60-69.
Derner, J. D., W. K. Lauenroth, P. Stapp, and D. J. Augustine. 2009. Livestock as
ecosystem engineers for grassland bird habitat in the western Great Plains of
North America. Rangeland Ecology & Management 62:111-118.
Dijak, W. D., and F. R. Thompson III. 2000. Landscape and edge effects on the
distribution of mammalian predators in Missouri. The Journal of Wildlife
Management 64:209-216.
Donovan, T. M., F. R. Thompson, J. Faaborg, and J. R. Probst. 1995. Reproductive
success of migratory birds in habitat sources and sinks. Conservation Biology
9:1380-1395.
Dyksterhuis, E. 1949. Condition and management of range land based on quantitative
ecology. Journal of Range Management 2:104-115.
Elmhagen, B., and S. P. Rushton. 2007. Trophic control of mesopredators in terrestrial
ecosystems: top‐down or bottom‐up? Ecology letters 10:197-206.
ESRI. 2011. ArcGIS Desktop: Release 10.4. Environmental Systems Research Institute.
Redlands, CA.
Evans, D. M., S. M. Redpath, D. A. Elston, S. A. Evans, R. J. Mitchell, and P. Dennis.
2006. To graze or not to graze? Sheep, voles, forestry and nature conservation in
the British uplands. Journal of Applied Ecology 43:499-505.
129
Evans, D. M., N. Villar, N. A. Littlewood, R. J. Pakeman, S. A. Evans, P. Dennis, J.
Skartveit, and S. M. Redpath. 2015. The cascading impacts of livestock grazing in
upland ecosystems: a 10‐year experiment. Ecosphere 6:1-15.
Fargione, J., J. Hill, D. Tilman, S. Polasky, and P. Hawthorne. 2008. Land clearing and
the biofuel carbon debt. Science 319:1235-1238.
Fisher, R. J., and S. K. Davis. 2010. From Wiens to Robel: a review of grassland-bird
habitat selection. Journal of Wildlife Management 74:265-273.
Fiske, I. J., and R. B. Chandler. 2011. Unmarked: An R Package for Fitting Hierarchical
Models of Wildlife Occurrence and Abundance. Journal of Statistical Software
43:1-23.
Fleischner, T. L. 1994. Ecological costs of livestock grazing in western North America.
Conservation Biology 8:629-644.
Fondell, T. F., and I. Ball. 2004. Density and success of bird nests relative to grazing on
western Montana grasslands. Biological Conservation 117:203-213.
Foresman, K. R. 2012. Mammals of Montana. second ed. Missoula, Montana: Mountain
Press Publishing Company, Missoula, Montana, USA.
Frank, D. A., and S. J. McNaughton. 1993. Evidence for the promotion of aboveground
grassland production by native large herbivores in Yellowstone National Park.
Oecologia 96:157-161.
Franklin, A. B., D. R. Anderson, R. Gutiérrez, and K. P. Burnham. 2000. Climate, habitat
quality, and fitness in northern spotted owl populations in northwestern
California. Ecological Monographs 70:539-590.
Frey, S. N., and M. R. Conover. 2006. Habitat use by meso-predators in a corridor
environment. Journal of Wildlife Management 70:1111-1118.
Fritcher, S. C., M. A. Rumble, and L. D. Flake. 2004. Grassland bird densities in seral
stages of mixed-grass prairie. Journal of Range Management 57:351-357.
Fuhlendorf, S., and D. Engle. 2004. Application of the fire–grazing interaction to restore
a shifting mosaic on tallgrass prairie. Journal of Applied Ecology 41:604-614.
Fuhlendorf, S. D., and D. M. Engle. 2001. Restoring Heterogeneity on Rangelands:
Ecosystem Management Based on Evolutionary Grazing Patterns We propose a
paradigm that enhances heterogeneity instead of homogeneity to promote
biological diversity and wildlife habitat on rangelands grazed by livestock.
BioScience 51:625-632.
130
Fuhlendorf, S. D., D. M. Engle, R. D. Elmore, R. F. Limb, and T. G. Bidwell. 2012.
Conservation of pattern and process: developing an alternative paradigm of
rangeland management. Rangeland Ecology & Management 65:579-589.
Fuhlendorf, S. D., D. M. Engle, J. Kerby, and R. Hamilton. 2009. Pyric herbivory:
rewilding landscapes through the recoupling of fire and grazing. Conservation
Biology 23:588-598.
Fuhlendorf, S. D., R. W. Fynn, D. A. McGranahan, and D. Twidwell. 2017.
Heterogeneity as the basis for rangeland management. Pages 169-196 in D. D.
Briske, editor. Rangeland Systems. Springer. Cham, Switzerland.
Fuhlendorf, S. D., W. C. Harrell, D. M. Engle, R. G. Hamilton, C. A. Davis, and D. M.
Leslie. 2006. Should heterogeneity be the basis for conservation? Grassland bird
response to fire and grazing. Ecological Applications 16:1706-1716.
Fuller, R., and S. Gough. 1999. Changes in sheep numbers in Britain: implications for
bird populations. Biological Conservation 91:73-89.
Fuller, T. K., and P. R. Sievert. 2001. Carnivore demography and the consequences of
changes in prey availability. Pages 163-178 in Gittleman, J.L., Funk, S.M.,
Macdonald, D.W., Wayne, R.K., editors. Carnivore conservation. Cambridge
University Press, Cambridge, U.K.
Gates, E. A., L. T. Vermeire, C. B. Marlow, and R. C. Waterman. 2017. Reconsidering
rest following fire: Northern mixed-grass prairie is resilient to grazing following
spring wildfire. Agriculture, ecosystems & environment 237:258-264.
Gates, J. E., and L. W. Gysel. 1978. Avian nest dispersion and fledging success in field‐
forest ecotones. Ecology 59:871-883.
Gese, E. M., and C. M. Thompson. 2014. Does habitat heterogeneity in a multi-use
landscape influence survival rates and density of a native mesocarnivore? PLOS
ONE 9:e100500.
Golding, J. D., and V. J. Dreitz. 2017. Songbird response to rest-rotation and season-long
cattle grazing in a grassland sagebrush ecosystem. Journal of environmental
management 204:605-612.
Gosselink, T. E., T. R. Van Deelen, R. E. Warner, and M. G. Joselyn. 2003. Temporal
habitat partitioning and spatial use of coyotes and red foxes in east-central
Illinois. The Journal of Wildlife Management 67:90-103.
Grant, T. A., E. Madden, and G. B. Berkey. 2004. Tree and shrub invasion in northern
mixed-grass prairie: implications for breeding grassland birds. Wildlife Society
Bulletin 32:807-818.
131
Hagen, C. A., B. E. Jamison, K. M. Giesen, and T. Z. Riley. 2004. Guidelines for
managing lesser prairie-chicken populations and their habitats. Wildlife Society
Bulletin 32:69-82.
Hart, R., J. Bissio, M. Samuel, and J. Waggoner Jr. 1993. Grazing systems, pasture size,
and cattle grazing behavior, distribution and gains. Journal of Range Management
46:81-87.
Hartman, C. A., and L. W. Oring. 2009. Reproductive success of Long-billed Curlews
(Numenius americanus) in northeastern Nevada hay fields. The Auk 126:420-430.
Henderson, A. E., and S. K. Davis. 2014. Rangeland health assessment: A useful tool for
linking range management and grassland bird conservation? Rangeland Ecology
and Management 67:88-98.
Hobbs, N. T., D. S. Schimel, C. E. Owensby, and D. S. Ojima. 1991. Fire and grazing in
the tallgrass prairie: contingent effects on nitrogen budgets. Ecology 72:1374-
1382.
Hoekstra, J. M., T. M. Boucher, T. H. Ricketts, and C. Roberts. 2005. Confronting a
biome crisis: global disparities of habitat loss and protection. Ecology letters 8:23-
29.
Holechek, J. L. 2007. National security and rangelands. Rangelands 29:33-38.
Holechek, J. L., H. Gomez, F. Molinar, and D. Galt. 1999. Grazing studies: what we've
learned. Rangelands 21:12-16.
Holechek, J. L., R. D. Pieper, and C. H. Herbel. 2011. Range management. Principles and
practices. 6th edition. Prentice-Hall. Englewood Cliffs, New Jersey, USA.
Holt, R. D., and G. A. Polis. 1997. A theoretical framework for intraguild predation. The
American Naturalist 149:745-764.
Hormay, A. L. 1970. Principles of rest-rotation grazing and multiple-use land
management. US Dept. Inter. Bull. 26 p.
Hormay, A. L., and M. Talbot. 1961. Rest-rotation grazing. A new management system
for perennial bunchgrass ranges. US Dep. Agr., Forest Service, Prod. Res. Rep.
No. 51, 43 p.
Hovick, T. J., R. D. Elmore, D. K. Dahlgren, S. D. Fuhlendorf, and D. M. Engle. 2014.
REVIEW: Evidence of negative effects of anthropogenic structures on wildlife: a
review of grouse survival and behaviour. Journal of Applied Ecology 51:1680-
1689.
132
Hovick, T. J., R. D. Elmore, S. D. Fuhlendorf, D. M. Engle, and R. G. Hamilton. 2015.
Spatial heterogeneity increases diversity and stability in grassland bird
communities. Ecological Applications 25:662-672.
Hovick, T. J., J. R. Miller, R. R. Koford, D. M. Engle, and D. M. Debinski. 2011.
Postfledging survival of grasshopper sparrows in grasslands managed with fire
and grazing. The Condor 113:429-437.
Howe, H. F. 1994. Managing species diversity in tallgrass prairie: assumptions and
implications. Conservation Biology 8:691-704.
Igl, L. D., and D. H. Johnson. 1999. Le Conte's Sparrows breeding in Conservation
Reserve Program fields: precipitation and patterns of population change. Studies
in Avian Biology 19:178-186.
Johnson, D. H., and L. D. Igl. 2001. Area requirements of grassland birds: a regional
perspective. The Auk 118:24-34.
Johnson, R. G., and S. A. Temple. 1990. Nest predation and brood parasitism of tallgrass
prairie birds. The Journal of Wildlife Management 54:106-111.
Johnson, T. N., P. L. Kennedy, and M. A. Etterson. 2012. Nest success and cause‐specific
nest failure of grassland passerines breeding in prairie grazed by livestock. The
Journal of Wildlife Management 76:1607-1616.
Jones, C. G., J. H. Lawton, and M. Shachak. 1997. Positive and negative effects of
organisms as physical ecosystem engineers. Ecology 78:1946-1957.
Jones, S. L., J. S. Dieni, and P. J. Gouse. 2010. Reproductive biology of a grassland
songbird community in northcentral Montana. Wilson Journal of ornithology
122:455-464.
Jones, S. L., J. S. Dieni, M. T. Green, and P. J. Gouse. 2007. Annual return rates of
breeding grassland songbirds. The Wilson Journal of Ornithology 119:89-94.
Joseph, J., M. Collins, J. Holechek, R. Valdez, and R. Steiner. 2003. Conservative and
moderate grazing effects on Chihuahuan Desert wildlife sightings. Western North
American Naturalist 63:43-49.
Kay, C. E. 1998. Are ecosystems structured from the top-down or bottom-up: a new look
at an old debate. Wildlife Society Bulletin 26:484-498.
Kelly, M. J., and E. L. Holub. 2008. Camera trapping of carnivores: trap success among
camera types and across species, and habitat selection by species, on Salt Pond
Mountain, Giles County, Virginia. Northeastern naturalist 15:249-262.
133
Kerns, C. K., M. R. Ryan, R. K. Murphy, F. R. Thompson, and C. S. Rubin. 2010.
Factors Affecting Songbird Nest Survival in Northern Mixed-Grass Prairie.
Journal of Wildlife Management 74:257-264.
Kéry, M., and J. A. Royle. 2015. Applied Hierarchical Modeling in Ecology: Analysis of
distribution, abundance and species richness in R and BUGS: Volume 1: Prelude
and Static Models. Academic Press.
Kéry, M., J. A. Royle, and H. Schmid. 2005. Modeling avian abundance from replicated
counts using binomial mixture models. Ecological Applications 15:1450-1461.
Knapp, A. K., J. M. Blair, J. M. Briggs, S. L. Collins, D. C. Hartnett, L. C. Johnson, and
E. G. Towne. 1999. The keystone role of bison in North American tallgrass
prairie: Bison increase habitat heterogeneity and alter a broad array of plant,
community, and ecosystem processes. BioScience 49:39-50.
Knopf, F. L. 1994. Avian assemblages on altered grasslands. Studies in Avian Biology
15:247-257.
_____. 1996. Prairie legacies—birds. Pages 135-148 in E.B. Samson and F.L. Knopf,
editors. Preserving North America’s most endangered ecosystem. Island Press,
Covello, California and Washington, D.C., USA.
Krausman, P. R. 1999. Some basic principles of habitat use. Grazing behavior of
livestock and wildlife 70:85-90.
Krausman, P. R., D. E. Naugle, M. R. Frisina, R. Northrup, V. C. Bleich, W. M. Block,
M. C. Wallace, and J. D. Wright. 2009. Livestock grazing, wildlife habitat, and
rangeland values. Rangelands 31:15-19.
Kuehl, A. K., and W. R. Clark. 2002. Predator activity related to landscape features in
northern Iowa. The Journal of Wildlife Management 66:1224-1234.
Launchbaugh, J. L., C. E. Owensby, F. L. Schwartz, and L. R. Corah. 1978. Grazing
management to meet nutritional and functional needs of livestock. Pages 541-546
in Proc. 1st Internat. Rangelands Congress.
Leopold, A. 1933. The conservation ethic. Journal of Forestry 31:634-643.
Lesmeister, D. B., C. K. Nielsen, E. M. Schauber, and E. C. Hellgren. 2015. Spatial and
temporal structure of a mesocarnivore guild in Midwestern North America.
Wildlife Monographs 191:1-61.
Lipsey, M. K. 2015. Cows and plows: science-based conservation for grassland songbirds
in agricultural landscapes. Dissertation. University of Montana, Missoula, MT,
USA.
134
Lipsey, M. K., and D. E. Naugle. 2017. Precipitation and Soil Productivity Explain
Effects of Grazing on Grassland Songbirds. Rangeland Ecology & Management
70:331-340.
Lusk, J. S., and N. Koper. 2013. Grazing and songbird nest survival in southwestern
Saskatchewan. Rangeland Ecology & Management 66:401-409.
Lwiwski, T. C., N. Koper, and D. C. Henderson. 2015. Stocking Rates and Vegetation
Structure, Heterogeneity, and Community in a Northern Mixed-Grass Prairie.
Rangeland Ecology & Management 68:322-331.
Lyons, T. P., J. R. Miller, D. M. Debinski, and D. M. Engle. 2015. Predator identity
influences the effect of habitat management on nest predation. Ecological
Applications 25:1596-1605.
MacKenzie, D. I., J. D. Nichols, G. B. Lachman, S. Droege, J. Andrew Royle, and C. A.
Langtimm. 2002. Estimating site occupancy rates when detection probabilities are
less than one. Ecology 83:2248-2255.
MacKenzie, D. I., J. D. Nichols, J. A. Royle, K. H. Pollock, L. Bailey, and J. E. Hines.
2006. Occupancy estimation and modeling: inferring patterns and dynamics of
species occurrence. Elsevier, San Diego, California, USA.
Manley, W., R. Hart, M. Samuel, M. Smith, J. Waggoner Jr, and J. Manley. 1997.
Vegetation, cattle, and economic responses to grazing strategies and pressures.
Journal of Range Management 50:638-646.
Martin, T. E. 1993. Nest predation among vegetation layers and habitat types: revising
the dogmas. The American Naturalist 141:897-913.
Mazerolle, M. J. 2013. AICcmodavg: model selection and multimodel inference based on
(Q) AIC (c). R package version 1:35. https://cran.r-
project.org/web/packages/AICcmodavg/AICcmodavg.pdf. Accessed 1 Sept 2016.
McNew, L. B., and C. M. Handel. 2015. Evaluating species richness: biased ecological
inference results from spatial heterogeneity in detection probabilities. Ecological
Applications 25:1669-1680.
McNew, L. B., V. L. Winder, J. C. Pitman, and B. K. Sandercock. 2015. Alternative
rangeland management strategies and the nesting ecology of Greater Prairie-
Chickens. Rangeland Ecology and Management 68:298-304.
Messmer, T. A. 1990. Influence of grazing treatments on nongame birds and vegetation
structure in south central North Dakota. North Dakota State University, Fargo,
ND, USA.
135
Montana Department of Fish, Wildlife, and Parks. 2010. Montana FWP Minimum
Standards for Grazing Livestock. Retrieved from:
fwp.mt.gov/fwpDoc.html?id=63252. Accessed 15 Sept 2016.
_____. 2015. Upland Game Bird Enhancement Program User's Manual. Retrieved from:
fwp.mt.gov/fishAndWildlife/habitat/wildlife/programs/uplandgamebird/.
Accessed 15 Sept 2016.
Montgomery, D. C., E. A. Peck, and G. G. Vining. 2012. Introduction to linear regression
analysis. Volume 821. John Wiley & Sons, New York, New York, USA.
Nack, J. L., and C. A. Ribic. 2005. Apparent predation by cattle at grassland bird nests.
The Wilson Bulletin 117:56-62.
National Research Council. 1982. Impacts of emerging agricultural trends on fish and
wildlife habitat. National Academy, Washington, D.C., USA.
Niemuth, N. D., J. W. Solberg, and T. L. Shaffer. 2008. Influence of moisture on density
and distribution of grassland birds in North Dakota. The Condor 110:211-222.
NOAA. 2017. National Oceanic and Atmospheric Administration. National Centers for
Environmental Information. Available online at: ncdc.noaa.gov/cdo-
web/datatools. Accessed 15 Sept 2017.
NRCS. 2017. Natural Resources Conservation Service Soil Survey Staff, United State
Department of Agriculture. Web Soil Survey. Available online at:
http://websoilsurvey.nrcs.usda.gov/. Accessed 15 Sept 2017.
O'Connell Jr, A. F., N. W. Talancy, L. L. Bailey, J. R. Sauer, R. Cook, and A. T. Gilbert.
2006. Estimating site occupancy and detection probability parameters for meso-
and large mammals in a coastal ecosystem. Journal of Wildlife Management
70:1625-1633.
Orians, G. H., and J. F. Wittenberger. 1991. Spatial and temporal scales in habitat
selection. The American Naturalist 137:S29-S49.
Ostlie, W., R. E. Schneider, J. M. Aldrich, T. M. Faust, R. L. McKim, and S. J. Chaplin.
1997. The status of biodiversity in the Great Plains. The Nature Conservancy,
Arlington, Virginia, USA.
Pasitschniak-Arts, M., and F. Messier. 1995. Risk of predation on waterfowl nests in the
Canadian prairies: effects of habitat edges and agricultural practices. Oikos
73:347-355.
Patten, M. A., and J. F. Kelly. 2010. Habitat selection and the perceptual trap. Ecological
Applications 20:2148-2156.
136
Patten, M. A., E. Shochat, D. L. Reinking, D. H. Wolfe, and S. K. Sherrod. 2006. Habitat
edge, land management, and rates of brood parasitism in tallgrass prairie.
Ecological Applications 16:687-695.
Pedlar, J. H., L. Fahrig, and H. G. Merriam. 1997. Raccoon habitat use at 2 spatial scales.
The Journal of Wildlife Management 61:102-112.
Peterjohn, B., and J. R. Sauer. 1999. Population status of North American grassland birds
from the North American breeding bird survey, 1966-1996. Studies in Avian
Biology 19:27-44.
Pietz, P. J., D. A. Granfors, C. A. Ribic, and F. Thompson. 2012. Knowledge gained from
video-monitoring grassland passerine nests. Video surveillance of nesting birds
43:3-22.
Plumb, G. E., and J. L. Dodd. 1993. Foraging ecology of bison and cattle on a mixed
prairie: implications for natural area management. Ecological Applications 3:631-
643.
Pool, D., and J. Austin. 2006. Migratory Bird Management for the Northern Great Plains
Joint Venture: Implementation Plan. General Technical Report TC-01. Bismarck,
ND, USA: Northern Great Plains Joint Venture. 171 p
Poole, A. E. 2005. The Birds of North America Online. Available at:
http://bna.birds.cornell.edu. Accessed 1 Sept. 2017.
Powell, J., B. Martin, V. J. Dreitz, and B. W. Allred. 2018. Grazing Preferences and
Vegetation Feedbacks of the Fire-Grazing Interaction in the Northern Great
Plains. Rangeland Ecology & Management 71:45-52.
Prugh, L. R., C. J. Stoner, C. W. Epps, W. T. Bean, W. J. Ripple, A. S. Laliberte, and J.
S. Brashares. 2009. The rise of the mesopredator. BioScience 59:779-791.
Pyne, S. J. 1993. Keeper of the flame: A survey of anthropogenic fire. Pages 245-266 in
P. J. Cruzan and J. G. Goldammer, editors. Fire in the environment: Its ecological,
climatic, and at- mospheric chemical importance. John Wiley and Sons, New
York, New York, USA.
R Core Team. 2016. R: a language and environment for statistical computing. R
Foundation for Statistical Computing, Vienna, Austria.
Rahmig, C. J., W. E. Jensen, and K. A. With. 2009. Grassland bird responses to land
management in the largest remaining tallgrass prairie. Conservation Biology
23:420-432.
137
Ralph, C. J., G. R. Geupel, P. Pyle, T. E. Martin, and D. F. DeSante. 1993. Handbook of
field methods for monitoring landbirds. U.S. Department of Agriculture Forest
Service General Technical Report PSW-GTR-144, Albany, California, USA.
Ranellucci, C. L., N. Koper, and D. C. Henderson. 2012. Twice-over rotational grazing
and its impacts on grassland songbird abundance and habitat structure. Rangeland
Ecology & Management 65:109-118.
Relyea, R. A., R. K. Lawrence, and S. Demarais. 2000. Home range of desert mule deer:
testing the body-size and habitat-productivity hypotheses. The Journal of Wildlife
Management 64:146-153.
Renfrew, R. B., and C. A. Ribic. 2003. Grassland passerine nest predators near pasture
edges identified on videotape. The Auk 120:371-383.
Renfrew, R. B., C. A. Ribic, and J. L. Nack. 2005. Edge avoidance by nesting grassland
birds: a futile strategy in a fragmented landscape. The Auk 122:618-636.
Renken, R., and J. Dinsmore. 1987. Nongame bird communities on managed grasslands
in North Dakota. Canadian Field-Naturalist 101:551-557.
Ribic, C. A., M. J. Guzy, T. J. Anderson, D. W. Sample, and J. L. Nack. 2012. Bird
productivity and nest predation in agricultural grasslands. Video surveillance of
nesting birds 43:119-134.
Rice, L., and A. Carter. 1982. Evaluation of South Dakota grassland management
practices as they affect prairie chicken populations, 1974–1978. Pierre, SD, USA:
South Dakota Department of Game Fish and Parks. Completion report:84-11.
Richardson, A., N. Koper, and K. White. 2014. Interactions between ecological
disturbances: burning and grazing and their effects on songbird communities in
northern mixed-grass prairies. Avian Conservation and Ecology 9:5.
Ricketts, A. M. 2016. Of mice and coyotes: mammalian responses to rangeland
management practices in tallgrass prairie. Kansas State University, Manhattan,
Kansas, USA.
Ricketts, A. M., and B. K. Sandercock. 2016. Patch‐burn grazing increases habitat
heterogeneity and biodiversity of small mammals in managed rangelands.
Ecosphere 7:e01431.
Ricklefs, R. E. 1969. An analysis of nesting mortality in birds. Smithsonian Contributions
to Zoology 9:1-48.
Risser, P.G., E.C. Birney, H.D. Blocker, S.W. May, J.W. Parton, and J.A. Wiens. 1981.
The true prairie ecosystem. US IBP. Synthesis series 16. Hutch & Ross PubI. Co.
138
_____. 1990. Landscape processes and the vegetation of the North American grassland.
Pages 133-146 in S. L. Collins and L. L. Wallace, editors. Fire in North American
prairies. University of Oklahoma Press, Norman, Oklahoma, USA.
Ritchie, E. G., and C. N. Johnson. 2009. Predator interactions, mesopredator release and
biodiversity conservation. Ecology letters 12:982-998.
Robel, R., J. Briggs, A. Dayton, and L. Hulbert. 1970. Relationships between visual
obstruction measurements and weight of grassland vegetation. Journal of Range
Management 13:295-297.
Roche, L., B. Cutts, J. Derner, M. Lubell, and K. Tate. 2015. On-ranch grazing strategies:
context for the rotational grazing dilemma. Rangeland Ecology & Management
68:248-256.
Rogler, G. A. 1951. A twenty-five year comparison of continuous and rotation grazing in
the Northern Plains. Journal of Range Management 4:35-41.
Rollins, D., and J. P. Carroll. 2001. Impacts of predation on northern bobwhite and scaled
quail. Wildlife Society Bulletin 29:39-51.
Root, R. B. 1967. The niche exploitation pattern of the blue‐gray gnatcatcher. Ecological
Monographs 37:317-350.
Rosenberg, K. V., J. A. Kennedy, R. Dettmers, R. P. Ford, D. Reynolds, J.D. Alexander,
C. J. Beardmore, P. J. Blancher, R. E., G. S. B. Bogart, A. F. Camfield, A.
Couturier, D. W. Demarest, W. E. Easton, J.J. Giocomo, R.H. Keller, A. E. Mini,
A. O., and D. N. P. Panjabi, T. D. Rich, J. M. Ruth, H. Stabins, J. Stanton, T.
Will. 2016. Partners in Flight Landbird Conservation Plan: 2016 Revision for
Canada and Continental United States. Partners in Flight Science Committee.
Available at: www.partnersinflight.org/plans/landbird-conservation-plan.
Accessed 1 Sept 2017.
Royle, J. A. 2004. N‐mixture models for estimating population size from spatially
replicated counts. Biometrics 60:108-115.
Ruiz-Capillas, P., C. Mata, and J. E. Malo. 2013. Community response of mammalian
predators and their prey to motorways: implications for predator–prey dynamics.
Ecosystems 16:617-626.
Runge, J. P. 2005. Spatial population dynamics of Microtus in grazed and ungrazed
grasslands. Dissertation. University of Montana, Missoula, Montana, USA.
139
Saab, V. A., C. E. Bock, T. D. Rich, and D. S. Dobkin. 1995. Livestock grazing effects in
western North America. Pages 311-353 in T. E. Martin and D. M. Finch, editors.
Ecology and management of neotropical migratory birds. Oxford University
Press, New York, USA.
Sabadell, J. E., E. Risley, H. Jorgenson, and B. Thornton. 1982. Desertification in the
United States: status and issues. Washington, D.C.: Bureau of Land Management,
Department of the Interior. 277 p.
Samson, F., and F. Knopf. 1994. Prairie conservation in north america. BioScience
44:418-421.
Samson, F. B., F. L. Knopf, and W. R. Ostlie. 2004. Great Plains ecosystems: past,
present, and future. Wildlife Society Bulletin 32:6-15.
Sargeant, A. B., R. J. Greenwood, M. A. Sovada, and T. L. Shaffer. 1993. Distribution
and abundance of predators that affect duck production-Prairie Pothole Region.
U.S. Fish and Wildlife Service Resource Publication 194. Northern Prairie
Wildlife Research Center, Jamestown, ND, USA.
Sauer, J. R., W. A. Link, J. E. Fallon, K. L. Pardieck, and D. J. Ziolkowski Jr. 2013. The
North American breeding bird survey 1966–2011: summary analysis and species
accounts. North American Fauna 79:1-32.
Schieltz, J. M., and D. I. Rubenstein. 2016. Evidence based review: positive versus
negative effects of livestock grazing on wildlife. What do we really know?
Environmental Research Letters 11:113003.
Schmidt, N. M., H. Olsen, M. Bildsøe, V. Sluydts, and H. Leirs. 2005. Effects of grazing
intensity on small mammal population ecology in wet meadows. Basic and
Applied Ecology 6:57-66.
Seabloom, R. W., J. W. Hoganson, and W. F. Jensen. 2011. Mammals of North Dakota.
North Dakota Institute of Regional Studies, North Dakota State Univeristy, Fargo,
North Dakota, USA.
Silveira, L., A. T. Jacomo, and J. A. F. Diniz-Filho. 2003. Camera trap, line transect
census and track surveys: a comparative evaluation. Biological Conservation
114:351-355.
Skinner, R. M. 1975. Grassland use pattern and prairie bird populations in Missouri.
Pages 171- 180 in M. K. Wali, editor. Prairie: a multiple view. Univ. of North
Dakota Press, Grand Forks, North Dakota, USA.
Sliwinski, M., and N. Koper. 2012. Grassland bird responses to three edge types in a
fragmented mixed-grass prairie. Avian Conservation and Ecology 7:6.
140
Sliwinski, M. S. 2017. Heterogeneity of avian breeding habitat on grazing lands of the
northern Great Plains. Dissertation. University of Nebraska, Lincoln, Nebraska,
USA.
Smith, J., M. Brown, J. Harrison, and L. Powell. 2017. Predation risk: a potential
mechanism for effects of a wind energy facility on Greater Prairie‐Chicken
survival. Ecosphere 8:e01835.
Smith, J. G. 1895. Forage conditions of the prairie region. Pages 309-324 in USDA
Yearbook of Agriculture-1895. Washington, DC, USA..
Smith, J. G. 1899. Grazing problems in the Southwest and how to meet them. US
Department of Agriculture, Division of Agrostology Bulletin. 16. 47 p.
Soulé, M. E., D. T. Bolger, A. C. Alberts, J. Wrights, M. Sorice, and S. Hill. 1988.
Reconstructed dynamics of rapid extinctions of chaparral‐requiring birds in urban
habitat islands. Conservation Biology 2:75-92.
Stuth, J. W. 1991. Foraging behavior. Pages 65-83 in R. K. Heitschmidt and J. W. Stuth,
editors. Grazing management: an ecological approach. Timber Press, Portland,
Oregon, USA.
Sutter, B., and G. Ritchison. 2005. Effects of grazing on vegetation structure, prey
availability, and reproductive success of Grasshopper Sparrows. Journal of Field
Ornithology 76:345-351.
Sutter, G. C., T. Troupe, and M. Forbes. 1995. Abundance of Baird’s sparrows,
Ammodramus bairdii, in native prairie and introduced vegetation. Ecoscience
2:344-348.
Temple, S. A., B. M. Fevold, L. K. Paine, D. J. Undersander, and D. W. Sample. 1999.
Nesting birds and grazing cattle: accommodating both on Midwestern pastures.
Studies in Avian Biology 19:196-202.
Thompson, S. J., T. W. Arnold, and C. L. Amundson. 2014. A multiscale assessment of
tree avoidance by prairie birds. The Condor 116:303-315.
Thompson, S. J., D. H. Johnson, N. D. Niemuth, and C. A. Ribic. 2015. Avoidance of
unconventional oil wells and roads exacerbates habitat loss for grassland birds in
the North American Great Plains. Biological Conservation 192:82-90.
Toombs, T. P., J. D. Derner, D. J. Augustine, B. Krueger, and S. Gallagher. 2010.
Managing for Biodiversity and Livestock: A scale-dependent approach for
promoting vegetation heterogeneity in western Great Plains grasslands.
Rangelands 32:10-15.
141
Toombs, T. P., and M. G. Roberts. 2009. Are natural resources conservation service
range management investments working at cross-purposes with wildlife habitat
goals on western United States rangelands? Rangeland Ecology & Management
62:351-355.
Torell, L. A., K. S. Lyon, and E. B. Godfrey. 1991. Long-run versus short-run planning
horizons and the rangeland stocking rate decision. American Journal of
Agricultural Economics 73:795-807.
Umbanhowar Jr, C. E. 1996. Recent fire history of the northern Great Plains. American
Midland Naturalist 135:115-121.
Van Horne, B. 1983. Density as a misleading indicator of habitat quality. The Journal of
Wildlife Management 47:893-901.
VerCauteren, T., and S. W. Gillihan. 2004. Integrating bird conservation into range
management. Rocky Mountain Bird Observatory Brighton, CO, USA.
Vermeire, L. T., R. K. Heitschmidt, and M. R. Haferkamp. 2008. Vegetation response to
seven grazing treatments in the Northern Great Plains. Agriculture, ecosystems &
environment 125:111-119.
Vickery, P. D., M. L. Hunter Jr, and J. V. Wells. 1992a. Evidence of incidental nest
predation and its effects on nests of threatened grassland birds. Oikos 63:281-288.
_____. 1992b. Is density an indicator of breeding success? The Auk 109:706-710.
Vickery, P. D., P. L. Tubaro, J. C. Da Silva, B. Peterjohn, J. R. Herkert, and R. B.
Cavalcanti. 1999. Conservation of grassland birds in the western hemisphere.
Studies in Avian Biology 19:2-26.
Villar, N., X. Lambin, D. Evans, R. Pakeman, and S. Redpath. 2013. Experimental
evidence that livestock grazing intensity affects the activity of a generalist
predator. Acta oecologica 49:12-16.
Vine, S., M. Crowther, S. Lapidge, C. R. Dickman, N. Mooney, M. Piggott, and A.
English. 2009. Comparison of methods to detect rare and cryptic species: a case
study using the red fox (Vulpes vulpes). Wildlife Research 36:436-446.
Voleti, R., S. L. Winter, and S. Leis. 2014. Patch burn‐grazing: an annotated
bibliography. Great Plains Fire Science Exchange Publication 2014–16.
Vu, V. Q. 2011. ggbiplot: A ggplot2 based biplot. R package.
142
WallisDeVries, M. F., J. P. Bakker, and S. E. Van Wieren. 1998. Grazing and
conservation management. Conservation Biology Series Kluwer Academic
Publishers. the Netherlands. 374 p.
Whelan, C. J., D. G. Wenny, and R. J. Marquis. 2008. Ecosystem services provided by
birds. Annals of the New York academy of sciences 1134:25-60.
Wickham, H. 2016. ggplot2: elegant graphics for data analysis. New York: Springer.
Wiens, J. A. 1973. Pattern and process in grassland bird communities. Ecological
Monographs 43:237-270.
_____. 1974. Habitat heterogeneity and avian community structure in North American
grasslands. American Midland Naturalist 91:195-213.
_____. 1997. The emerging role of patchiness in conservation biology. Pages 93-107 in
The ecological basis of conservation. Chapman and Hall, New York, NY, USA.
Williams, R. E. 1954. Modern methods of getting uniform use of ranges. Journal of
Range Management 7:77-81.
Wilmers, C. C., B. Nickel, C. M. Bryce, J. A. Smith, R. E. Wheat, and V. Yovovich.
2015. The golden age of bio‐logging: how animal‐borne sensors are advancing the
frontiers of ecology. Ecology 96:1741-1753.
Wilson, D. E., R. F. Cole, J. D. Nichols, and M. S. Foster. 1996. Measuring and
monitoring biological diversity: standard methods for mammals. Smithsonian
Institution Press. Washington, D.C., USA.
Winder, V. L., L. B. McNew, J. C. Pitman, and B. K. Sandercock. 2017. Space Use of
Female Greater Prairie-Chickens in Response to Fire and Grazing Interactions.
Rangeland Ecology & Management 70:165-174.
Winder, V. L., L. B. McNew, J. C. Pitman, and B. K. Sandercock. 2018. Effects of
rangeland management on survival of female greater prairie‐chickens. The
Journal of Wildlife Management 82:113-122.
Winter, M., D. H. Johnson, and J. Faaborg. 2000. Evidence for edge effects on multiple
levels in tallgrass prairie. The Condor 102:256-266.
Winter, M., D. H. Johnson, and J. A. Shaffer. 2005. Variability in vegetation effects on
density and nesting success of grassland birds. Journal of Wildlife Management
69:185-197.
143
With, K. A., A. W. King, and W. E. Jensen. 2008. Remaining large grasslands may not
be sufficient to prevent grassland bird declines. Biological Conservation
141:3152-3167.
Wright, C. K., and M. C. Wimberly. 2013. Recent land use change in the Western Corn
Belt threatens grasslands and wetlands. Proceedings of the National Academy of
Sciences 110:4134-4139.

144
APPENDICES
145
APPENDIX A
PASTURE LOCATIONS WITHIN THE STUDY AREA
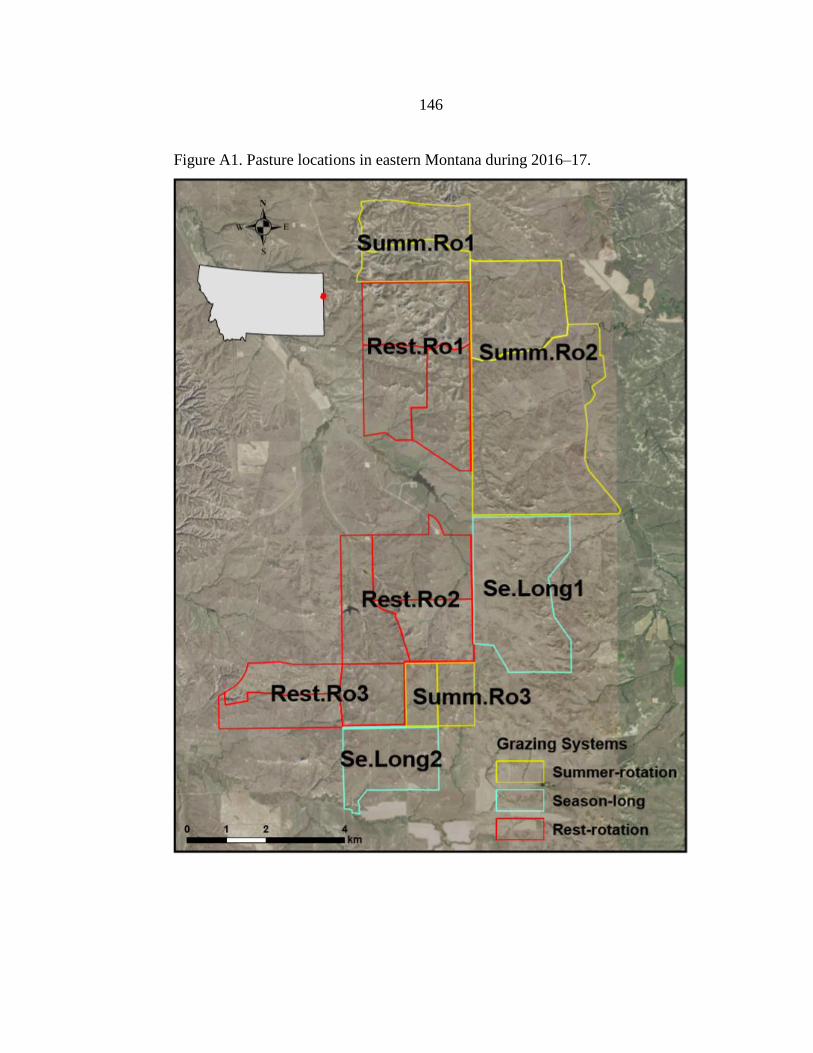
146
Figure A1. Pasture locations in eastern Montana during 2016–17.
147
APPENDIX B
ECOLOGICAL SITES AND ASSOCIATED RANGELAND PRODUCTION
POTENTIAL VALUES WITHIN THE STUDY AREA
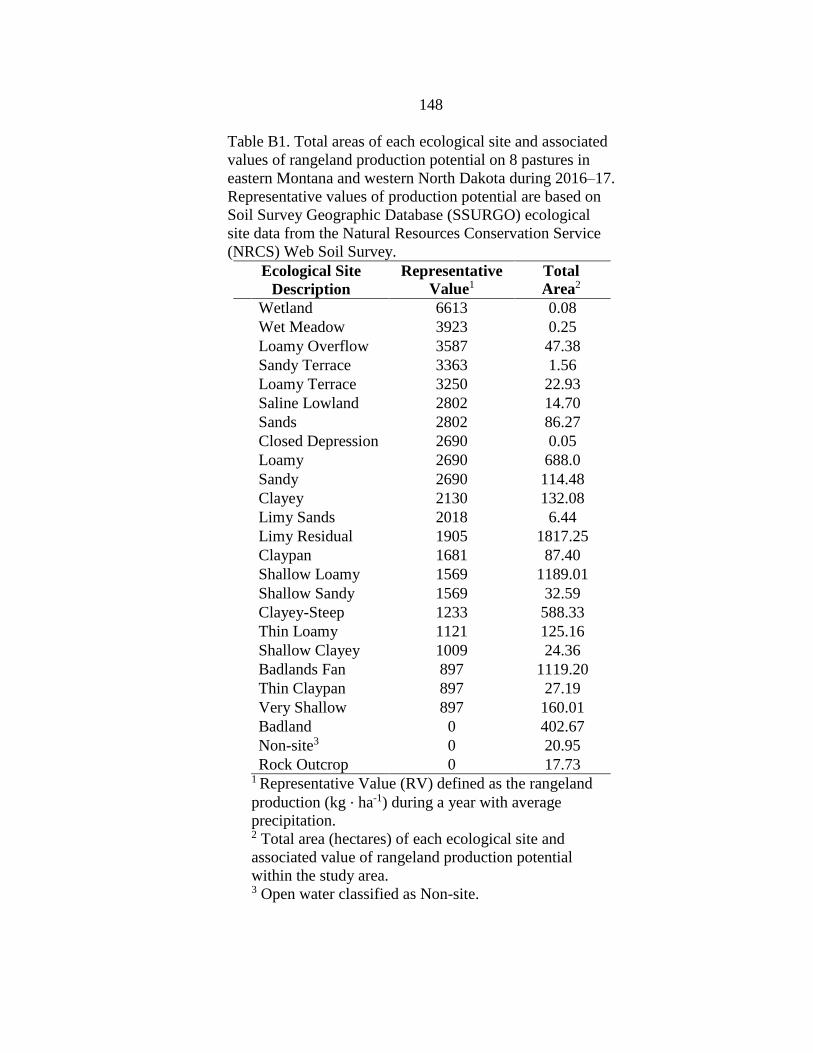
148
Table B1. Total areas of each ecological site and associated
values of rangeland production potential on 8 pastures in
eastern Montana and western North Dakota during 2016–17.
Representative values of production potential are based on
Soil Survey Geographic Database (SSURGO) ecological
site data from the Natural Resources Conservation Service
(NRCS) Web Soil Survey.
Ecological Site
Description
Representative
Value1 Total
Area2
Wetland 6613 0.08
Wet Meadow 3923 0.25
Loamy Overflow 3587 47.38
Sandy Terrace 3363 1.56
Loamy Terrace 3250 22.93
Saline Lowland 2802 14.70
Sands 2802 86.27
Closed Depression 2690 0.05
Loamy 2690 688.0
Sandy 2690 114.48
Clayey 2130 132.08
Limy Sands 2018 6.44
Limy Residual 1905 1817.25
Claypan 1681 87.40
Shallow Loamy 1569 1189.01
Shallow Sandy 1569 32.59
Clayey-Steep 1233 588.33
Thin Loamy 1121 125.16
Shallow Clayey 1009 24.36
Badlands Fan 897 1119.20
Thin Claypan 897 27.19
Very Shallow 897 160.01
Badland 0 402.67
Non-site3 0 20.95
Rock Outcrop 0 17.73 1 Representative Value (RV) defined as the rangeland
production (kg ⋅ ha-1) during a year with average
precipitation. 2 Total area (hectares) of each ecological site and
associated value of rangeland production potential
within the study area. 3 Open water classified as Non-site.

149
APPENDIX C
GRASSLAND BIRD SPECIES LIST
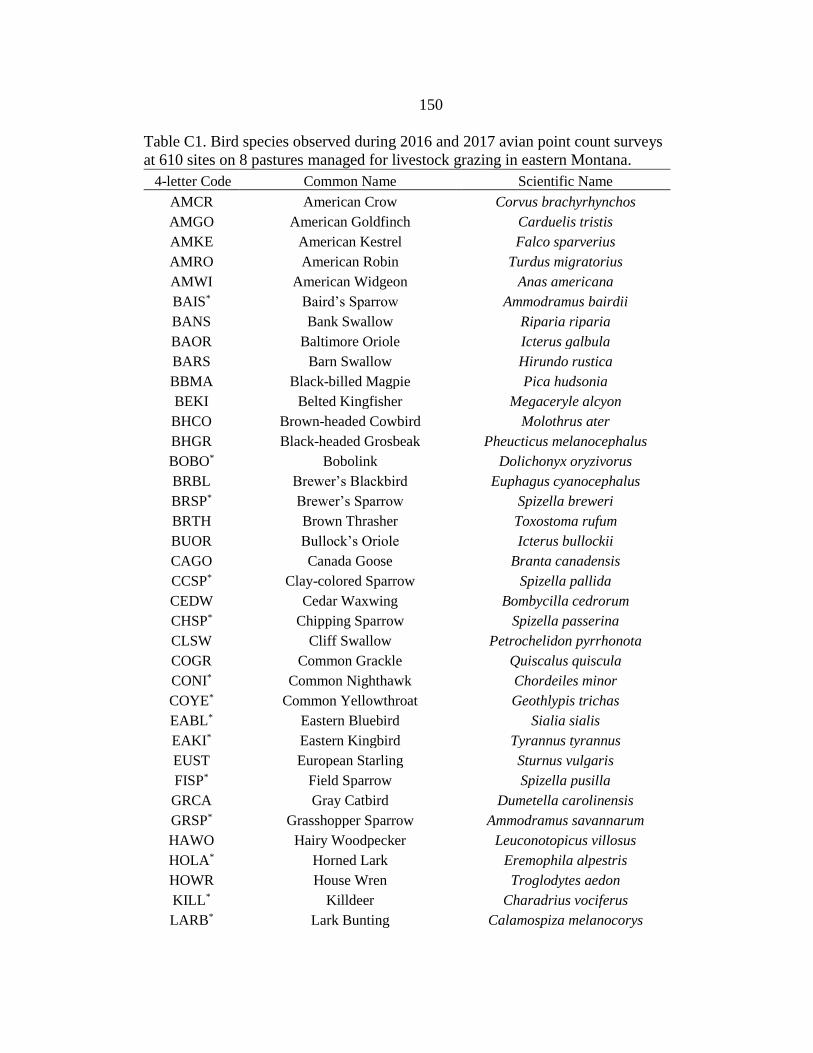
150
Table C1. Bird species observed during 2016 and 2017 avian point count surveys
at 610 sites on 8 pastures managed for livestock grazing in eastern Montana.
4-letter Code Common Name Scientific Name
AMCR American Crow Corvus brachyrhynchos
AMGO American Goldfinch Carduelis tristis
AMKE American Kestrel Falco sparverius
AMRO American Robin Turdus migratorius
AMWI American Widgeon Anas americana
BAIS* Baird’s Sparrow Ammodramus bairdii
BANS Bank Swallow Riparia riparia
BAOR Baltimore Oriole Icterus galbula
BARS Barn Swallow Hirundo rustica
BBMA Black-billed Magpie Pica hudsonia
BEKI Belted Kingfisher Megaceryle alcyon
BHCO Brown-headed Cowbird Molothrus ater
BHGR Black-headed Grosbeak Pheucticus melanocephalus
BOBO* Bobolink Dolichonyx oryzivorus
BRBL Brewer’s Blackbird Euphagus cyanocephalus
BRSP* Brewer’s Sparrow Spizella breweri
BRTH Brown Thrasher Toxostoma rufum
BUOR Bullock’s Oriole Icterus bullockii
CAGO Canada Goose Branta canadensis
CCSP* Clay-colored Sparrow Spizella pallida
CEDW Cedar Waxwing Bombycilla cedrorum
CHSP* Chipping Sparrow Spizella passerina
CLSW Cliff Swallow Petrochelidon pyrrhonota
COGR Common Grackle Quiscalus quiscula
CONI* Common Nighthawk Chordeiles minor
COYE* Common Yellowthroat Geothlypis trichas
EABL* Eastern Bluebird Sialia sialis
EAKI* Eastern Kingbird Tyrannus tyrannus
EUST European Starling Sturnus vulgaris
FISP* Field Sparrow Spizella pusilla
GRCA Gray Catbird Dumetella carolinensis
GRSP* Grasshopper Sparrow Ammodramus savannarum
HAWO Hairy Woodpecker Leuconotopicus villosus
HOLA* Horned Lark Eremophila alpestris
HOWR House Wren Troglodytes aedon
KILL* Killdeer Charadrius vociferus
LARB* Lark Bunting Calamospiza melanocorys
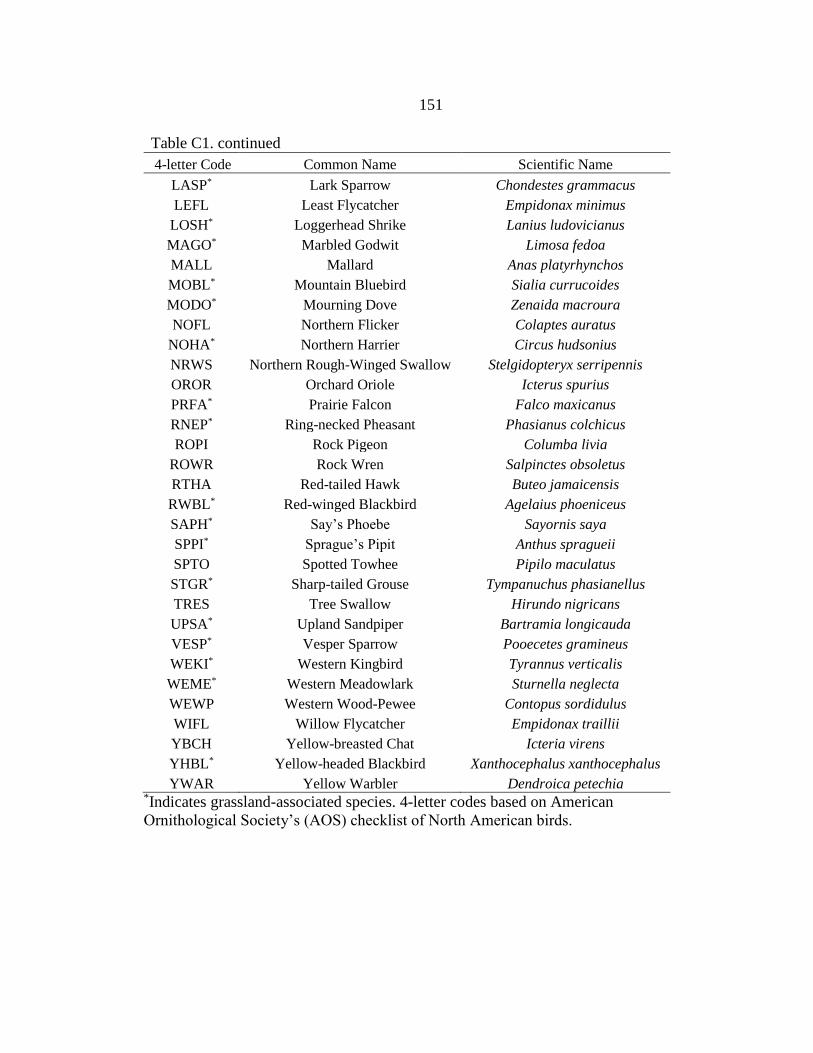
151
Table C1. continued
4-letter Code Common Name Scientific Name
LASP* Lark Sparrow Chondestes grammacus
LEFL Least Flycatcher Empidonax minimus
LOSH* Loggerhead Shrike Lanius ludovicianus
MAGO* Marbled Godwit Limosa fedoa
MALL Mallard Anas platyrhynchos
MOBL* Mountain Bluebird Sialia currucoides
MODO* Mourning Dove Zenaida macroura
NOFL Northern Flicker Colaptes auratus
NOHA* Northern Harrier Circus hudsonius
NRWS Northern Rough-Winged Swallow Stelgidopteryx serripennis
OROR Orchard Oriole Icterus spurius
PRFA* Prairie Falcon Falco maxicanus
RNEP* Ring-necked Pheasant Phasianus colchicus
ROPI Rock Pigeon Columba livia
ROWR Rock Wren Salpinctes obsoletus
RTHA Red-tailed Hawk Buteo jamaicensis
RWBL* Red-winged Blackbird Agelaius phoeniceus
SAPH* Say’s Phoebe Sayornis saya
SPPI* Sprague’s Pipit Anthus spragueii
SPTO Spotted Towhee Pipilo maculatus
STGR* Sharp-tailed Grouse Tympanuchus phasianellus
TRES Tree Swallow Hirundo nigricans
UPSA* Upland Sandpiper Bartramia longicauda
VESP* Vesper Sparrow Pooecetes gramineus
WEKI* Western Kingbird Tyrannus verticalis
WEME* Western Meadowlark Sturnella neglecta
WEWP Western Wood-Pewee Contopus sordidulus
WIFL Willow Flycatcher Empidonax traillii
YBCH Yellow-breasted Chat Icteria virens
YHBL* Yellow-headed Blackbird Xanthocephalus xanthocephalus
YWAR Yellow Warbler Dendroica petechia *Indicates grassland-associated species. 4-letter codes based on American
Ornithological Society’s (AOS) checklist of North American birds.
152
APPENDIX D
MODEL SELECTION RESULTS DESCRIBING SUPPORT FOR EFFECTS ON
GRASSLAND BIRD DETECTION PROBABILITY AND LOCAL ABUNDANCE
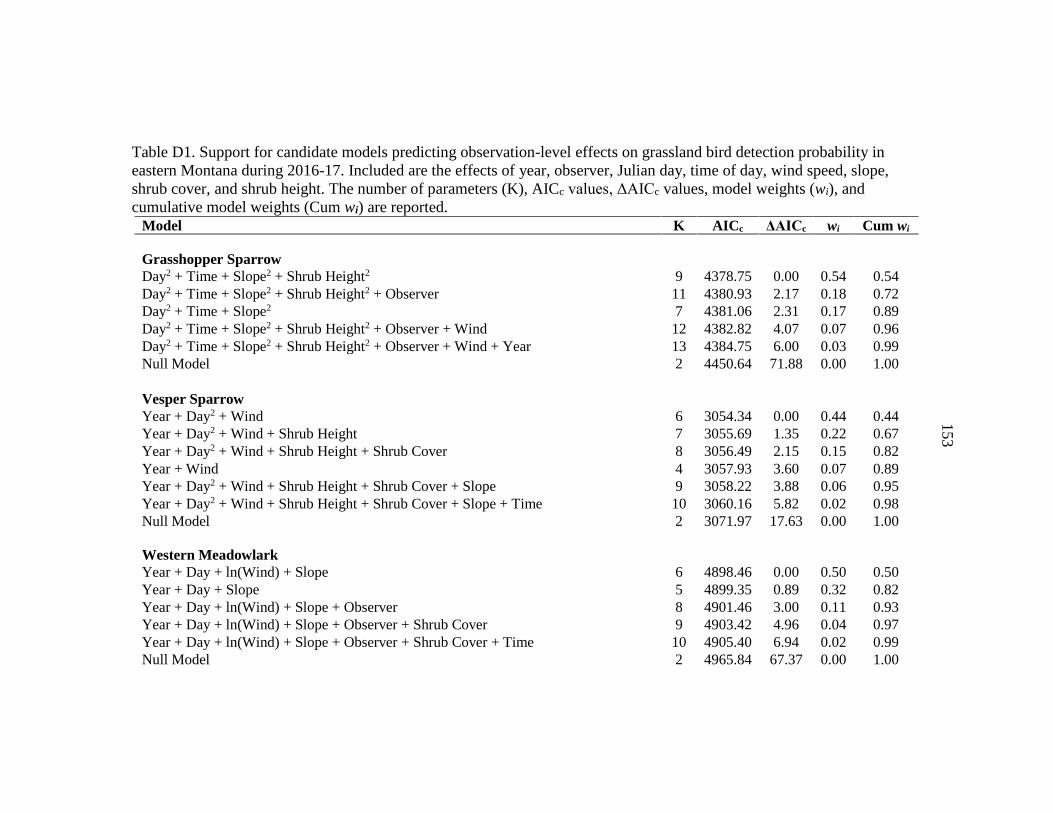
153
Table D1. Support for candidate models predicting observation-level effects on grassland bird detection probability in
eastern Montana during 2016-17. Included are the effects of year, observer, Julian day, time of day, wind speed, slope,
shrub cover, and shrub height. The number of parameters (K), AICc values, ΔAICc values, model weights (wi), and
cumulative model weights (Cum wi) are reported.
Model K AICc ΔAICc wi Cum wi
Grasshopper Sparrow
Day2 + Time + Slope2 + Shrub Height2 9 4378.75 0.00 0.54 0.54
Day2 + Time + Slope2 + Shrub Height2 + Observer 11 4380.93 2.17 0.18 0.72
Day2 + Time + Slope2 7 4381.06 2.31 0.17 0.89
Day2 + Time + Slope2 + Shrub Height2 + Observer + Wind 12 4382.82 4.07 0.07 0.96
Day2 + Time + Slope2 + Shrub Height2 + Observer + Wind + Year 13 4384.75 6.00 0.03 0.99
Null Model 2 4450.64 71.88 0.00 1.00
Vesper Sparrow
Year + Day2 + Wind 6 3054.34 0.00 0.44 0.44
Year + Day2 + Wind + Shrub Height 7 3055.69 1.35 0.22 0.67
Year + Day2 + Wind + Shrub Height + Shrub Cover 8 3056.49 2.15 0.15 0.82
Year + Wind 4 3057.93 3.60 0.07 0.89
Year + Day2 + Wind + Shrub Height + Shrub Cover + Slope 9 3058.22 3.88 0.06 0.95
Year + Day2 + Wind + Shrub Height + Shrub Cover + Slope + Time 10 3060.16 5.82 0.02 0.98
Null Model 2 3071.97 17.63 0.00 1.00
Western Meadowlark
Year + Day + ln(Wind) + Slope 6 4898.46 0.00 0.50 0.50
Year + Day + Slope 5 4899.35 0.89 0.32 0.82
Year + Day + ln(Wind) + Slope + Observer 8 4901.46 3.00 0.11 0.93
Year + Day + ln(Wind) + Slope + Observer + Shrub Cover 9 4903.42 4.96 0.04 0.97
Year + Day + ln(Wind) + Slope + Observer + Shrub Cover + Time 10 4905.40 6.94 0.02 0.99
Null Model 2 4965.84 67.37 0.00 1.00
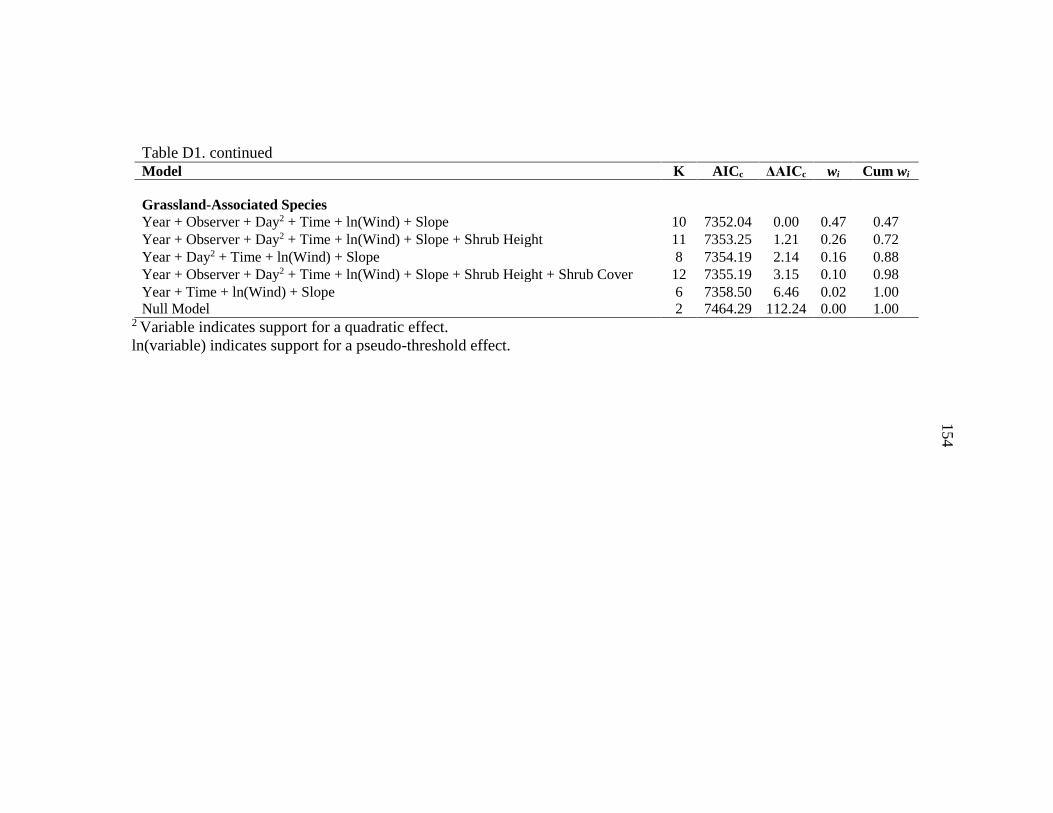
154
Table D1. continued
Model K AICc ΔAICc wi Cum wi
Grassland-Associated Species
Year + Observer + Day2 + Time + ln(Wind) + Slope 10 7352.04 0.00 0.47 0.47
Year + Observer + Day2 + Time + ln(Wind) + Slope + Shrub Height 11 7353.25 1.21 0.26 0.72
Year + Day2 + Time + ln(Wind) + Slope 8 7354.19 2.14 0.16 0.88
Year + Observer + Day2 + Time + ln(Wind) + Slope + Shrub Height + Shrub Cover 12 7355.19 3.15 0.10 0.98
Year + Time + ln(Wind) + Slope 6 7358.50 6.46 0.02 1.00
Null Model 2 7464.29 112.24 0.00 1.00 2 Variable indicates support for a quadratic effect.
ln(variable) indicates support for a pseudo-threshold effect.
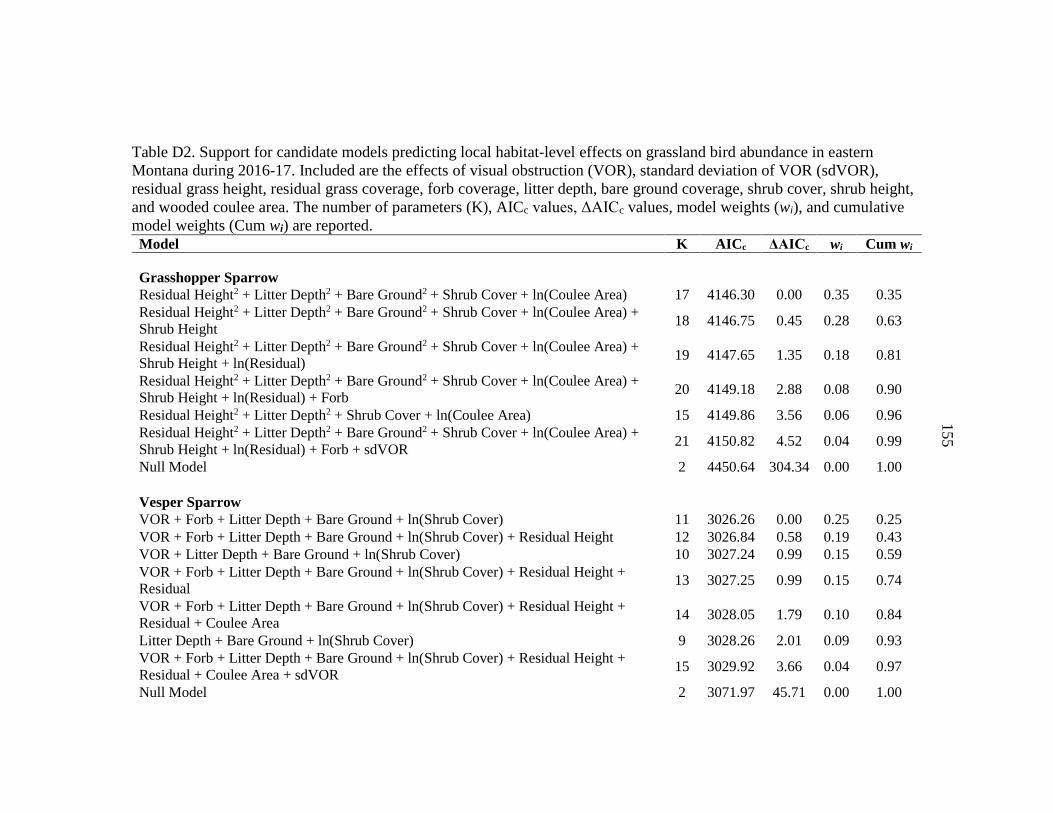
155
Table D2. Support for candidate models predicting local habitat-level effects on grassland bird abundance in eastern
Montana during 2016-17. Included are the effects of visual obstruction (VOR), standard deviation of VOR (sdVOR),
residual grass height, residual grass coverage, forb coverage, litter depth, bare ground coverage, shrub cover, shrub height,
and wooded coulee area. The number of parameters (K), AICc values, ΔAICc values, model weights (wi), and cumulative
model weights (Cum wi) are reported.
Model K AICc ΔAICc wi Cum wi
Grasshopper Sparrow
Residual Height2 + Litter Depth2 + Bare Ground2 + Shrub Cover + ln(Coulee Area) 17 4146.30 0.00 0.35 0.35
Residual Height2 + Litter Depth2 + Bare Ground2 + Shrub Cover + ln(Coulee Area) +
Shrub Height 18 4146.75 0.45 0.28 0.63
Residual Height2 + Litter Depth2 + Bare Ground2 + Shrub Cover + ln(Coulee Area) +
Shrub Height + ln(Residual) 19 4147.65 1.35 0.18 0.81
Residual Height2 + Litter Depth2 + Bare Ground2 + Shrub Cover + ln(Coulee Area) +
Shrub Height + ln(Residual) + Forb 20 4149.18 2.88 0.08 0.90
Residual Height2 + Litter Depth2 + Shrub Cover + ln(Coulee Area) 15 4149.86 3.56 0.06 0.96
Residual Height2 + Litter Depth2 + Bare Ground2 + Shrub Cover + ln(Coulee Area) +
Shrub Height + ln(Residual) + Forb + sdVOR 21 4150.82 4.52 0.04 0.99
Null Model 2 4450.64 304.34 0.00 1.00
Vesper Sparrow
VOR + Forb + Litter Depth + Bare Ground + ln(Shrub Cover) 11 3026.26 0.00 0.25 0.25
VOR + Forb + Litter Depth + Bare Ground + ln(Shrub Cover) + Residual Height 12 3026.84 0.58 0.19 0.43
VOR + Litter Depth + Bare Ground + ln(Shrub Cover) 10 3027.24 0.99 0.15 0.59
VOR + Forb + Litter Depth + Bare Ground + ln(Shrub Cover) + Residual Height +
Residual 13 3027.25 0.99 0.15 0.74
VOR + Forb + Litter Depth + Bare Ground + ln(Shrub Cover) + Residual Height +
Residual + Coulee Area 14 3028.05 1.79 0.10 0.84
Litter Depth + Bare Ground + ln(Shrub Cover) 9 3028.26 2.01 0.09 0.93
VOR + Forb + Litter Depth + Bare Ground + ln(Shrub Cover) + Residual Height +
Residual + Coulee Area + sdVOR 15 3029.92 3.66 0.04 0.97
Null Model 2 3071.97 45.71 0.00 1.00
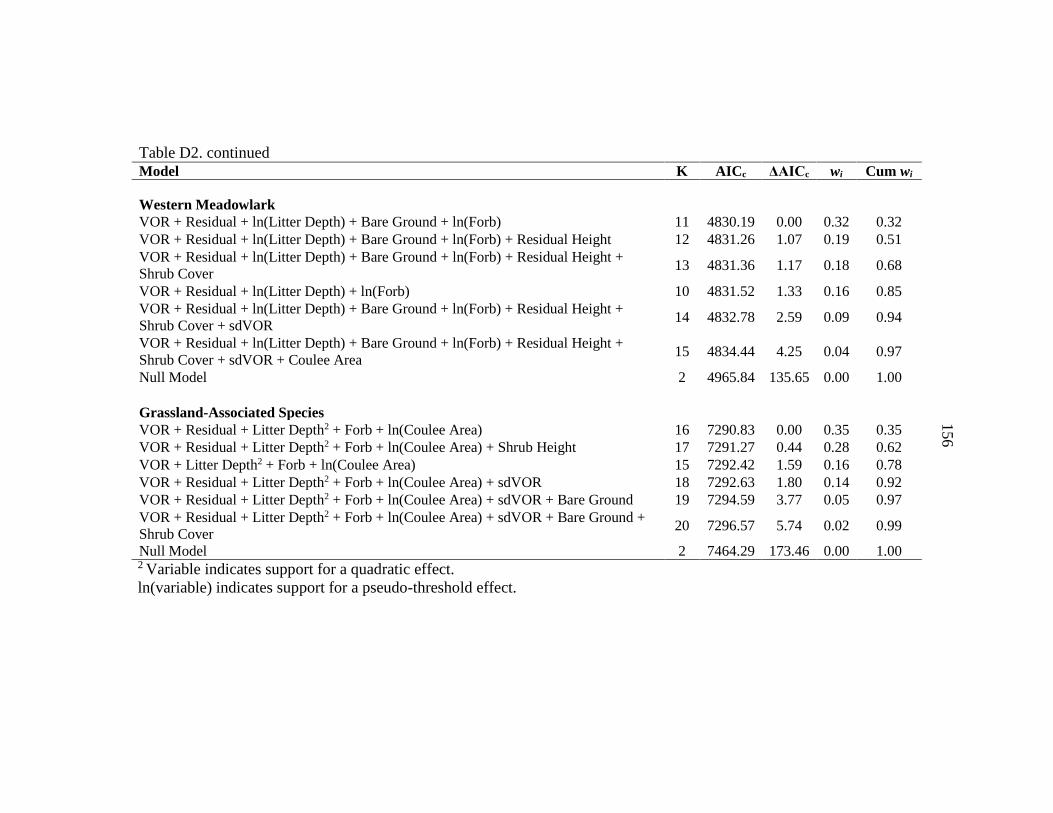
156
Table D2. continued
Model K AICc ΔAICc wi Cum wi
Western Meadowlark
VOR + Residual + ln(Litter Depth) + Bare Ground + ln(Forb) 11 4830.19 0.00 0.32 0.32
VOR + Residual + ln(Litter Depth) + Bare Ground + ln(Forb) + Residual Height 12 4831.26 1.07 0.19 0.51
VOR + Residual + ln(Litter Depth) + Bare Ground + ln(Forb) + Residual Height +
Shrub Cover 13 4831.36 1.17 0.18 0.68
VOR + Residual + ln(Litter Depth) + ln(Forb) 10 4831.52 1.33 0.16 0.85
VOR + Residual + ln(Litter Depth) + Bare Ground + ln(Forb) + Residual Height +
Shrub Cover + sdVOR 14 4832.78 2.59 0.09 0.94
VOR + Residual + ln(Litter Depth) + Bare Ground + ln(Forb) + Residual Height +
Shrub Cover + sdVOR + Coulee Area 15 4834.44 4.25 0.04 0.97
Null Model 2 4965.84 135.65 0.00 1.00
Grassland-Associated Species
VOR + Residual + Litter Depth2 + Forb + ln(Coulee Area) 16 7290.83 0.00 0.35 0.35
VOR + Residual + Litter Depth2 + Forb + ln(Coulee Area) + Shrub Height 17 7291.27 0.44 0.28 0.62
VOR + Litter Depth2 + Forb + ln(Coulee Area) 15 7292.42 1.59 0.16 0.78
VOR + Residual + Litter Depth2 + Forb + ln(Coulee Area) + sdVOR 18 7292.63 1.80 0.14 0.92
VOR + Residual + Litter Depth2 + Forb + ln(Coulee Area) + sdVOR + Bare Ground 19 7294.59 3.77 0.05 0.97
VOR + Residual + Litter Depth2 + Forb + ln(Coulee Area) + sdVOR + Bare Ground +
Shrub Cover 20 7296.57 5.74 0.02 0.99
Null Model 2 7464.29 173.46 0.00 1.00 2 Variable indicates support for a quadratic effect.
ln(variable) indicates support for a pseudo-threshold effect.
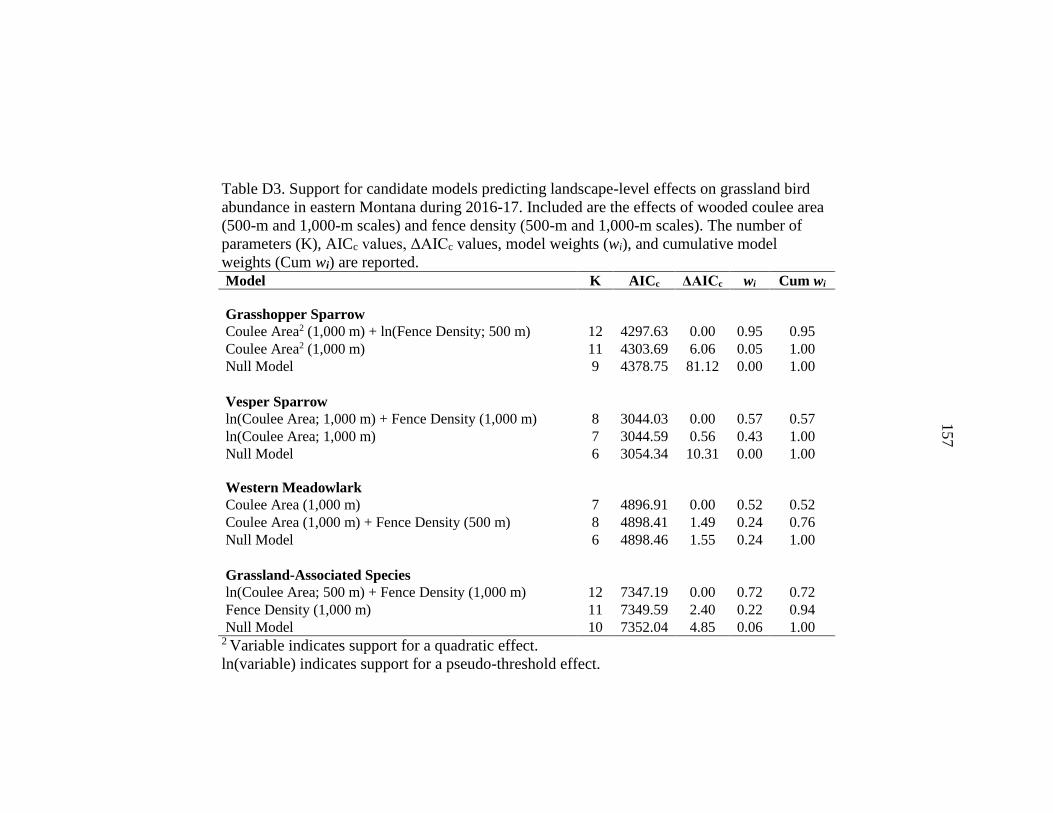
157
Table D3. Support for candidate models predicting landscape-level effects on grassland bird
abundance in eastern Montana during 2016-17. Included are the effects of wooded coulee area
(500-m and 1,000-m scales) and fence density (500-m and 1,000-m scales). The number of
parameters (K), AICc values, ΔAICc values, model weights (wi), and cumulative model
weights (Cum wi) are reported.
Model K AICc ΔAICc wi Cum wi
Grasshopper Sparrow
Coulee Area2 (1,000 m) + ln(Fence Density; 500 m) 12 4297.63 0.00 0.95 0.95
Coulee Area2 (1,000 m) 11 4303.69 6.06 0.05 1.00
Null Model 9 4378.75 81.12 0.00 1.00
Vesper Sparrow
ln(Coulee Area; 1,000 m) + Fence Density (1,000 m) 8 3044.03 0.00 0.57 0.57
ln(Coulee Area; 1,000 m) 7 3044.59 0.56 0.43 1.00
Null Model 6 3054.34 10.31 0.00 1.00
Western Meadowlark
Coulee Area (1,000 m) 7 4896.91 0.00 0.52 0.52
Coulee Area (1,000 m) + Fence Density (500 m) 8 4898.41 1.49 0.24 0.76
Null Model 6 4898.46 1.55 0.24 1.00
Grassland-Associated Species
ln(Coulee Area; 500 m) + Fence Density (1,000 m) 12 7347.19 0.00 0.72 0.72
Fence Density (1,000 m) 11 7349.59 2.40 0.22 0.94
Null Model 10 7352.04 4.85 0.06 1.00 2 Variable indicates support for a quadratic effect.
ln(variable) indicates support for a pseudo-threshold effect.
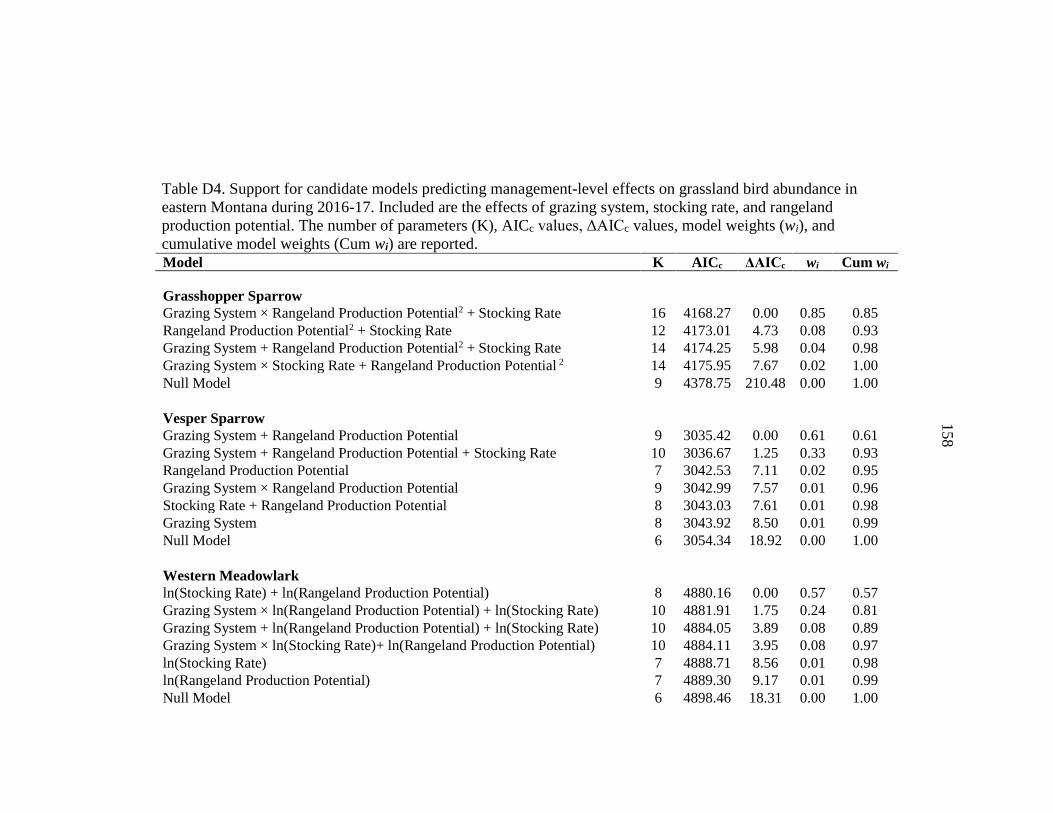
158
Table D4. Support for candidate models predicting management-level effects on grassland bird abundance in
eastern Montana during 2016-17. Included are the effects of grazing system, stocking rate, and rangeland
production potential. The number of parameters (K), AICc values, ΔAICc values, model weights (wi), and
cumulative model weights (Cum wi) are reported.
Model K AICc ΔAICc wi Cum wi
Grasshopper Sparrow
Grazing System × Rangeland Production Potential2 + Stocking Rate 16 4168.27 0.00 0.85 0.85
Rangeland Production Potential2 + Stocking Rate 12 4173.01 4.73 0.08 0.93
Grazing System + Rangeland Production Potential2 + Stocking Rate 14 4174.25 5.98 0.04 0.98
Grazing System × Stocking Rate + Rangeland Production Potential 2 14 4175.95 7.67 0.02 1.00
Null Model 9 4378.75 210.48 0.00 1.00
Vesper Sparrow
Grazing System + Rangeland Production Potential 9 3035.42 0.00 0.61 0.61
Grazing System + Rangeland Production Potential + Stocking Rate 10 3036.67 1.25 0.33 0.93
Rangeland Production Potential 7 3042.53 7.11 0.02 0.95
Grazing System × Rangeland Production Potential 9 3042.99 7.57 0.01 0.96
Stocking Rate + Rangeland Production Potential 8 3043.03 7.61 0.01 0.98
Grazing System 8 3043.92 8.50 0.01 0.99
Null Model 6 3054.34 18.92 0.00 1.00
Western Meadowlark
ln(Stocking Rate) + ln(Rangeland Production Potential) 8 4880.16 0.00 0.57 0.57
Grazing System × ln(Rangeland Production Potential) + ln(Stocking Rate) 10 4881.91 1.75 0.24 0.81
Grazing System + ln(Rangeland Production Potential) + ln(Stocking Rate) 10 4884.05 3.89 0.08 0.89
Grazing System × ln(Stocking Rate)+ ln(Rangeland Production Potential) 10 4884.11 3.95 0.08 0.97
ln(Stocking Rate) 7 4888.71 8.56 0.01 0.98
ln(Rangeland Production Potential) 7 4889.30 9.17 0.01 0.99
Null Model 6 4898.46 18.31 0.00 1.00
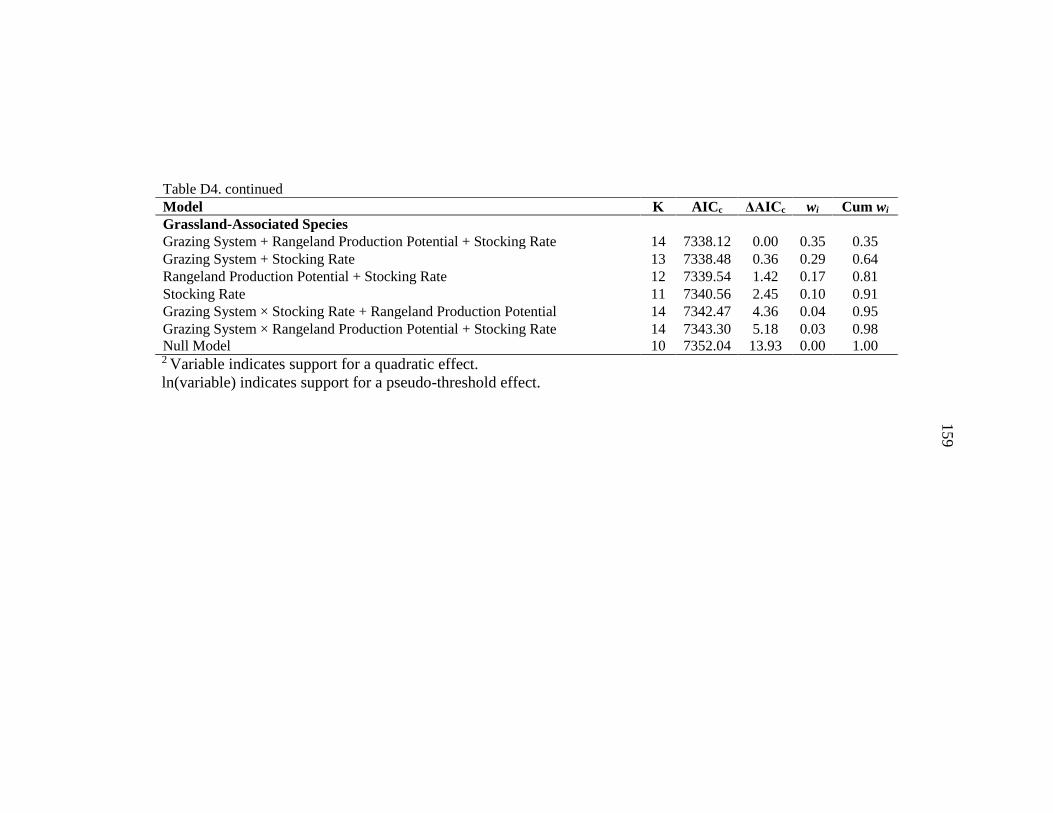
159
Table D4. continued
Model K AICc ΔAICc wi Cum wi
Grassland-Associated Species
Grazing System + Rangeland Production Potential + Stocking Rate 14 7338.12 0.00 0.35 0.35
Grazing System + Stocking Rate 13 7338.48 0.36 0.29 0.64
Rangeland Production Potential + Stocking Rate 12 7339.54 1.42 0.17 0.81
Stocking Rate 11 7340.56 2.45 0.10 0.91
Grazing System × Stocking Rate + Rangeland Production Potential 14 7342.47 4.36 0.04 0.95
Grazing System × Rangeland Production Potential + Stocking Rate 14 7343.30 5.18 0.03 0.98
Null Model 10 7352.04 13.93 0.00 1.00 2 Variable indicates support for a quadratic effect.
ln(variable) indicates support for a pseudo-threshold effect.
160
APPENDIX E
PREDICTIONS OF GRASSLAND BIRD DETECTION PROBABILITIES
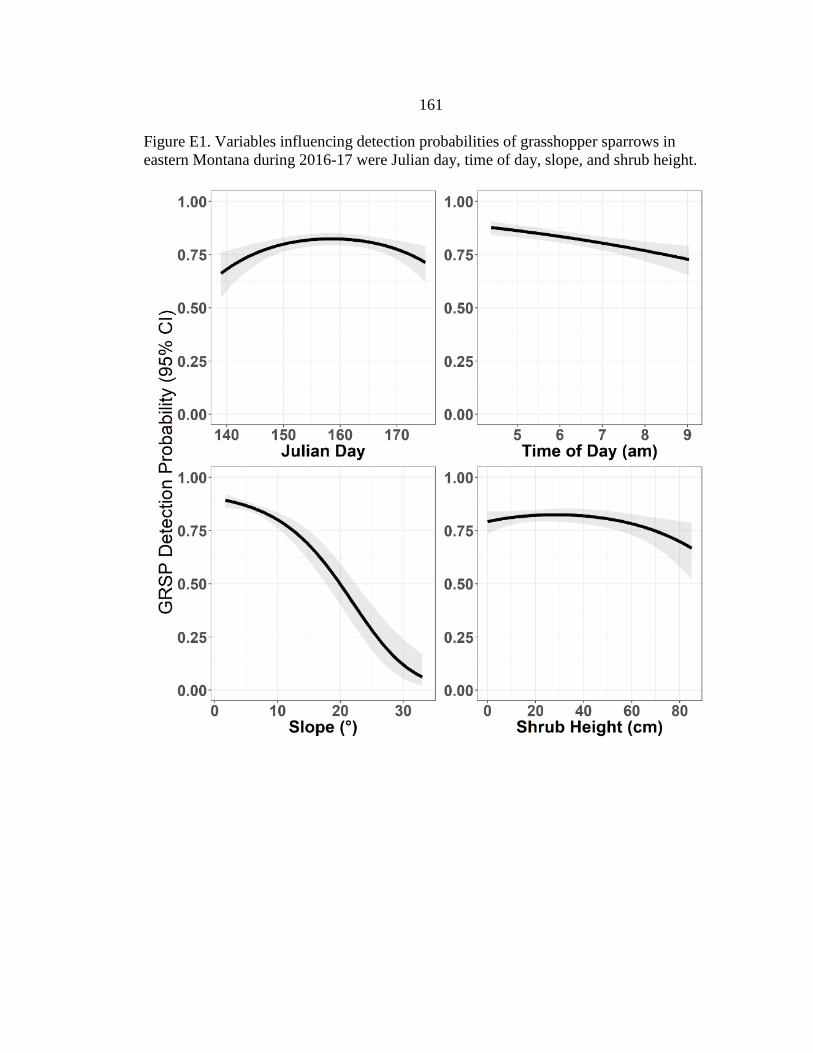
161
Figure E1. Variables influencing detection probabilities of grasshopper sparrows in
eastern Montana during 2016-17 were Julian day, time of day, slope, and shrub height.
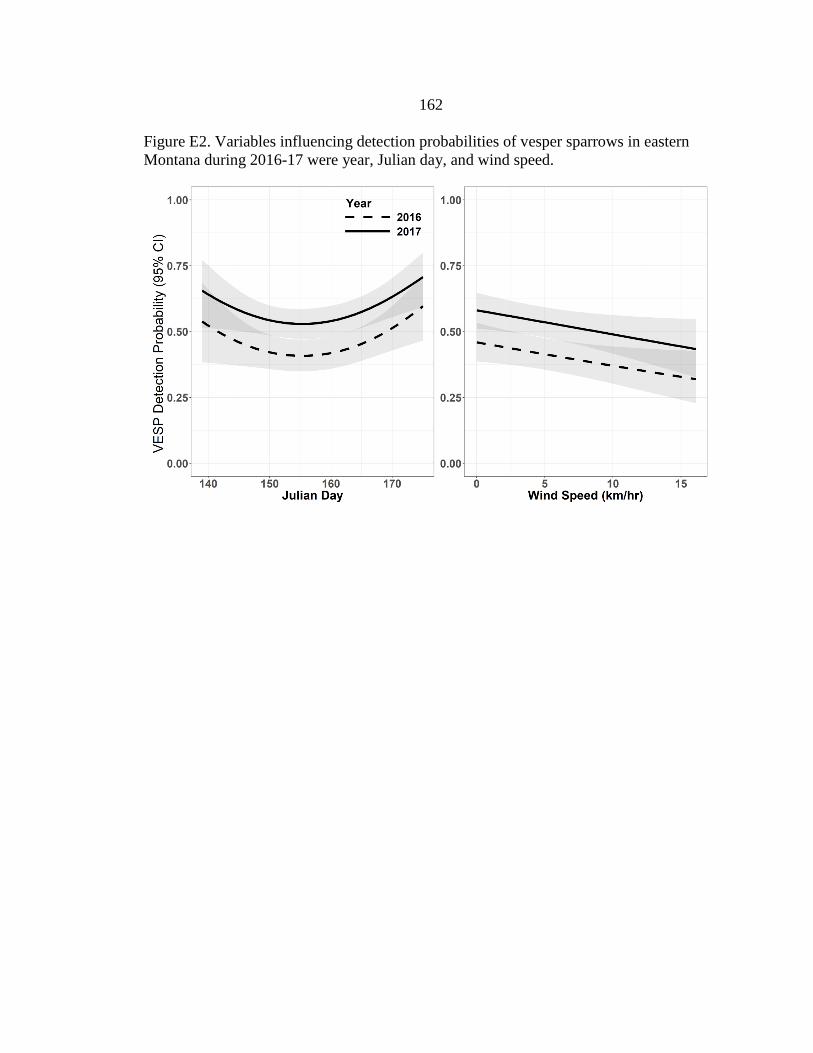
162
Figure E2. Variables influencing detection probabilities of vesper sparrows in eastern
Montana during 2016-17 were year, Julian day, and wind speed.
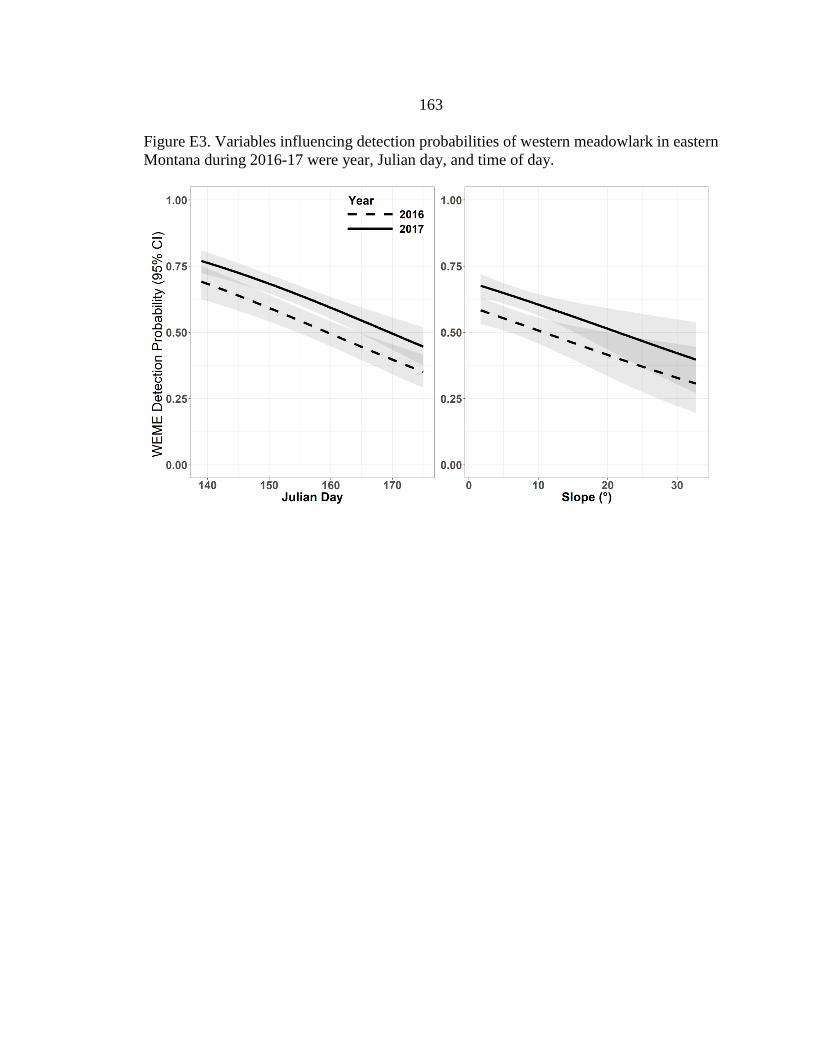
163
Figure E3. Variables influencing detection probabilities of western meadowlark in eastern
Montana during 2016-17 were year, Julian day, and time of day.
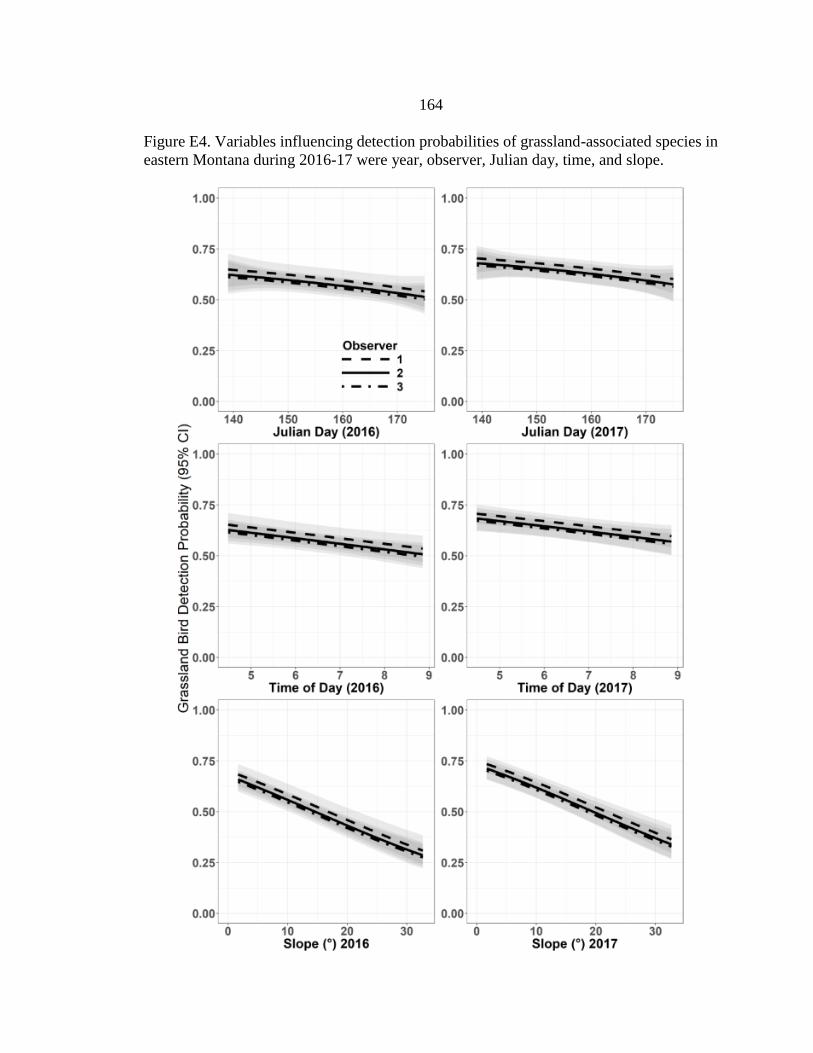
164
Figure E4. Variables influencing detection probabilities of grassland-associated species in
eastern Montana during 2016-17 were year, observer, Julian day, time, and slope.

165
APPENDIX F
STANDARDIZED COVARIATE ESTIAMTES FOR THE TOP MODELS OF
GRASSLAND BIRD DETECTION PROBABILITY AND ABUNDANCE
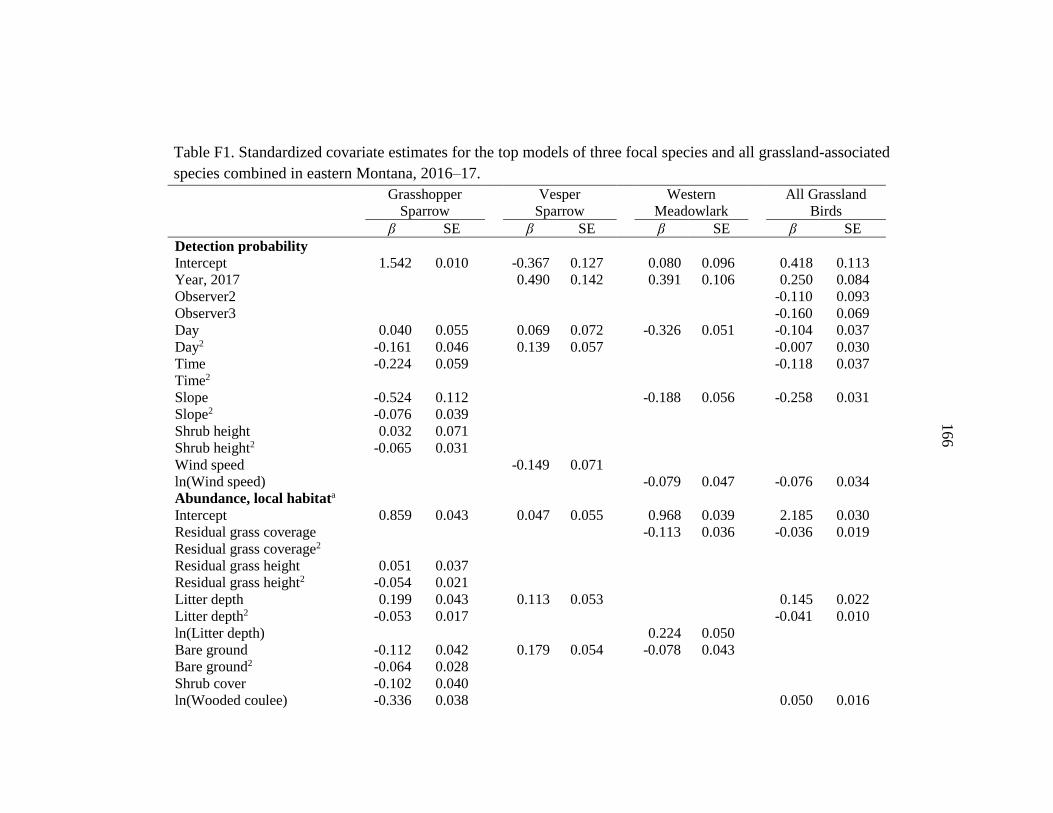
166
Table F1. Standardized covariate estimates for the top models of three focal species and all grassland-associated
species combined in eastern Montana, 2016–17.
Grasshopper
Sparrow
Vesper
Sparrow
Western
Meadowlark
All Grassland
Birds
β SE β SE β SE β SE
Detection probability
Intercept 1.542 0.010 -0.367 0.127 0.080 0.096 0.418 0.113
Year, 2017 0.490 0.142 0.391 0.106 0.250 0.084
Observer2 -0.110 0.093
Observer3 -0.160 0.069
Day 0.040 0.055 0.069 0.072 -0.326 0.051 -0.104 0.037
Day2 -0.161 0.046 0.139 0.057 -0.007 0.030
Time -0.224 0.059 -0.118 0.037
Time2
Slope -0.524 0.112 -0.188 0.056 -0.258 0.031
Slope2 -0.076 0.039
Shrub height 0.032 0.071
Shrub height2 -0.065 0.031
Wind speed -0.149 0.071
ln(Wind speed) -0.079 0.047 -0.076 0.034
Abundance, local habitata
Intercept 0.859 0.043 0.047 0.055 0.968 0.039 2.185 0.030
Residual grass coverage -0.113 0.036 -0.036 0.019
Residual grass coverage2
Residual grass height 0.051 0.037
Residual grass height2 -0.054 0.021
Litter depth 0.199 0.043 0.113 0.053 0.145 0.022
Litter depth2 -0.053 0.017 -0.041 0.010
ln(Litter depth) 0.224 0.050
Bare ground -0.112 0.042 0.179 0.054 -0.078 0.043
Bare ground2 -0.064 0.028
Shrub cover -0.102 0.040
ln(Wooded coulee) -0.336 0.038 0.050 0.016
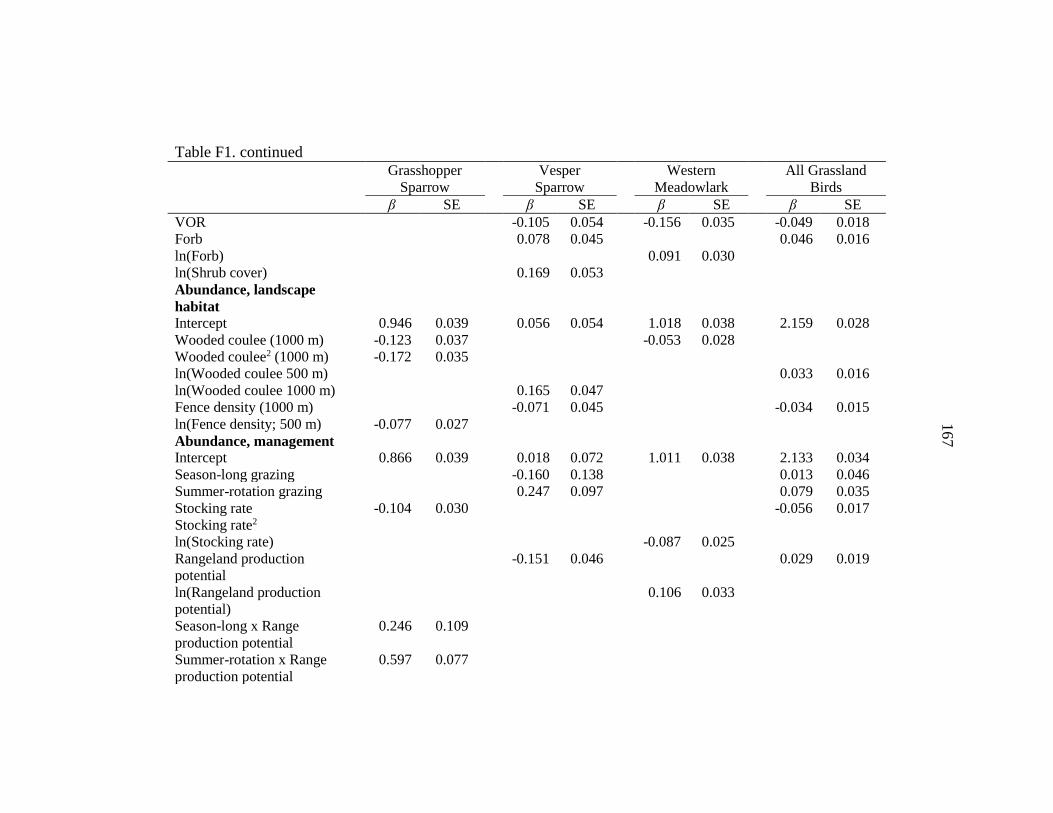
167
Table F1. continued
Grasshopper
Sparrow
Vesper
Sparrow
Western
Meadowlark
All Grassland
Birds
β SE β SE β SE β SE
VOR -0.105 0.054 -0.156 0.035 -0.049 0.018
Forb 0.078 0.045 0.046 0.016
ln(Forb) 0.091 0.030
ln(Shrub cover) 0.169 0.053
Abundance, landscape
habitat
Intercept 0.946 0.039 0.056 0.054 1.018 0.038 2.159 0.028
Wooded coulee (1000 m) -0.123 0.037 -0.053 0.028
Wooded coulee2 (1000 m) -0.172 0.035
ln(Wooded coulee 500 m) 0.033 0.016
ln(Wooded coulee 1000 m) 0.165 0.047
Fence density (1000 m) -0.071 0.045 -0.034 0.015
ln(Fence density; 500 m) -0.077 0.027
Abundance, management
Intercept 0.866 0.039 0.018 0.072 1.011 0.038 2.133 0.034
Season-long grazing -0.160 0.138 0.013 0.046
Summer-rotation grazing 0.247 0.097 0.079 0.035
Stocking rate -0.104 0.030 -0.056 0.017
Stocking rate2
ln(Stocking rate) -0.087 0.025
Rangeland production
potential
-0.151 0.046 0.029 0.019
ln(Rangeland production
potential)
0.106 0.033
Season-long x Range
production potential
0.246 0.109
Summer-rotation x Range
production potential
0.597 0.077
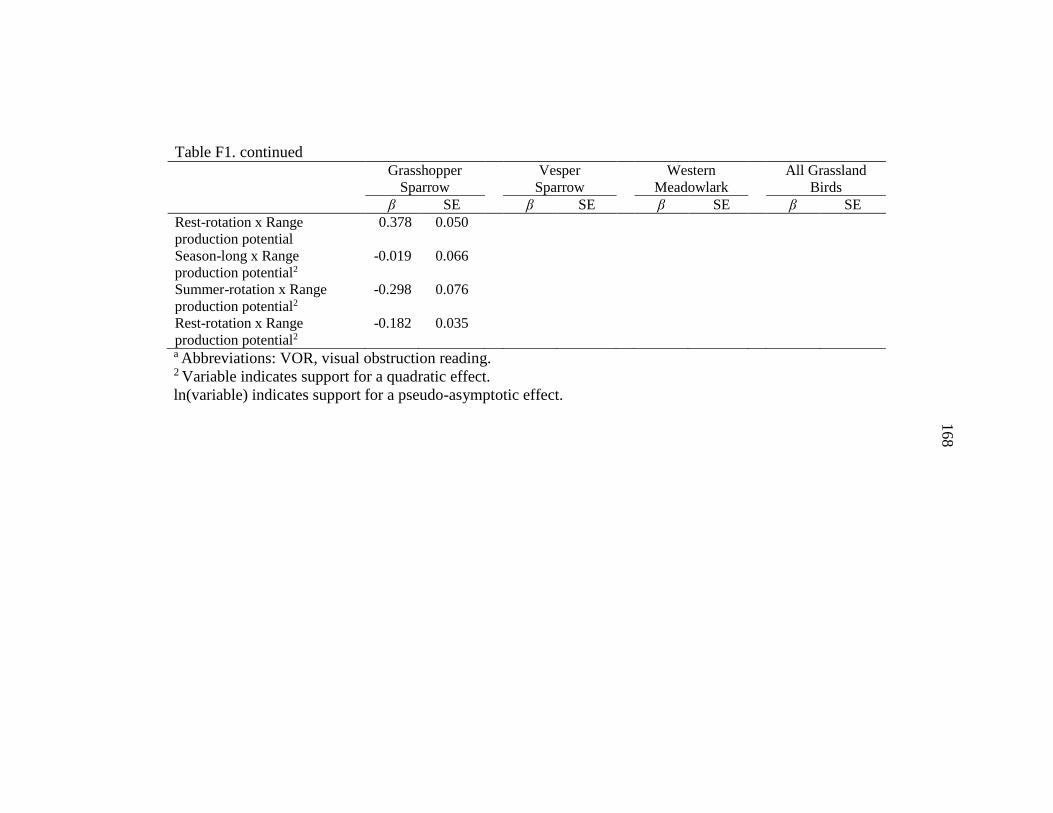
168
Table F1. continued
Grasshopper
Sparrow
Vesper
Sparrow
Western
Meadowlark
All Grassland
Birds
β SE β SE β SE β SE
Rest-rotation x Range
production potential
0.378 0.050
Season-long x Range
production potential2
-0.019 0.066
Summer-rotation x Range
production potential2
-0.298 0.076
Rest-rotation x Range
production potential2
-0.182 0.035
a Abbreviations: VOR, visual obstruction reading. 2 Variable indicates support for a quadratic effect.
ln(variable) indicates support for a pseudo-asymptotic effect.

169
APPENDIX G
LOCAL VEGETATION CONDITIONS AMONG GRAZING SYSTEMS AND
AMONG TREATMENTS WITHIN REST-ROTATION GRAZING SYSTEMS
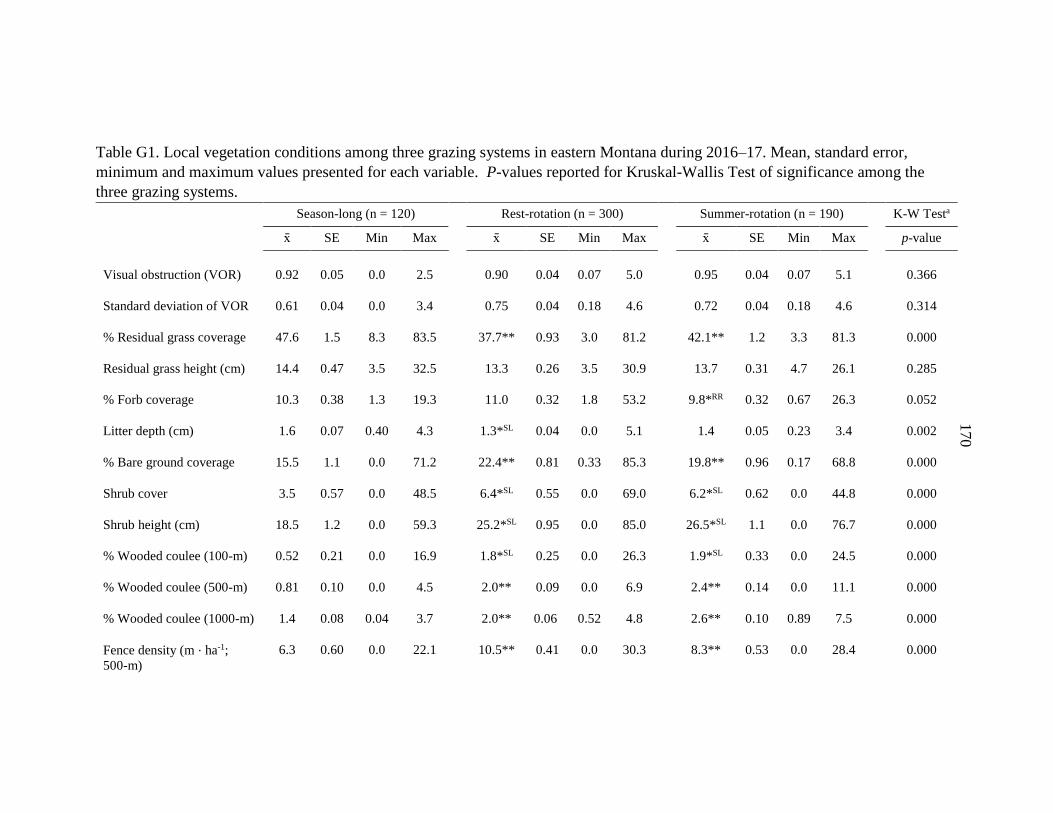
170
Table G1. Local vegetation conditions among three grazing systems in eastern Montana during 2016–17. Mean, standard error,
minimum and maximum values presented for each variable. P-values reported for Kruskal-Wallis Test of significance among the
three grazing systems. Season-long (n = 120) Rest-rotation (n = 300) Summer-rotation (n = 190) K-W Testa
x̄ SE Min Max x̄ SE Min Max x̄ SE Min Max p-value
Visual obstruction (VOR) 0.92 0.05 0.0 2.5 0.90 0.04 0.07 5.0 0.95 0.04 0.07 5.1 0.366
Standard deviation of VOR 0.61 0.04 0.0 3.4 0.75 0.04 0.18 4.6 0.72 0.04 0.18 4.6 0.314
% Residual grass coverage 47.6 1.5 8.3 83.5 37.7** 0.93 3.0 81.2 42.1** 1.2 3.3 81.3 0.000
Residual grass height (cm) 14.4 0.47 3.5 32.5 13.3 0.26 3.5 30.9 13.7 0.31 4.7 26.1 0.285
% Forb coverage 10.3 0.38 1.3 19.3 11.0 0.32 1.8 53.2 9.8*RR 0.32 0.67 26.3 0.052
Litter depth (cm) 1.6 0.07 0.40 4.3 1.3*SL 0.04 0.0 5.1 1.4 0.05 0.23 3.4 0.002
% Bare ground coverage 15.5 1.1 0.0 71.2 22.4** 0.81 0.33 85.3 19.8** 0.96 0.17 68.8 0.000
Shrub cover 3.5 0.57 0.0 48.5 6.4*SL 0.55 0.0 69.0 6.2*SL 0.62 0.0 44.8 0.000
Shrub height (cm) 18.5 1.2 0.0 59.3 25.2*SL 0.95 0.0 85.0 26.5*SL 1.1 0.0 76.7 0.000
% Wooded coulee (100-m) 0.52 0.21 0.0 16.9 1.8*SL 0.25 0.0 26.3 1.9*SL 0.33 0.0 24.5 0.000
% Wooded coulee (500-m) 0.81 0.10 0.0 4.5 2.0** 0.09 0.0 6.9 2.4** 0.14 0.0 11.1 0.000
% Wooded coulee (1000-m) 1.4 0.08 0.04 3.7 2.0** 0.06 0.52 4.8 2.6** 0.10 0.89 7.5 0.000
Fence density (m ⋅ ha-1;
500-m)
6.3 0.60 0.0 22.1 10.5** 0.41 0.0 30.3 8.3** 0.53 0.0 28.4 0.000
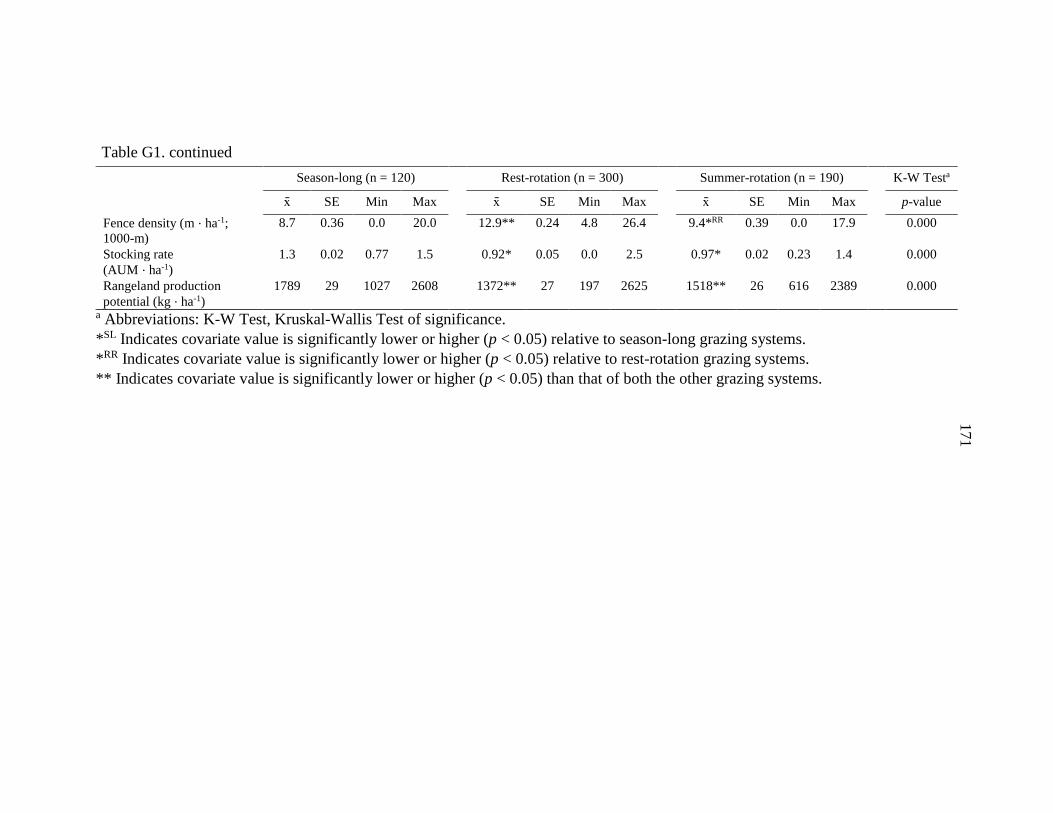
171
Table G1. continued
Season-long (n = 120) Rest-rotation (n = 300) Summer-rotation (n = 190) K-W Testa
x̄ SE Min Max x̄ SE Min Max x̄ SE Min Max p-value
Fence density (m ⋅ ha-1;
1000-m)
8.7 0.36 0.0 20.0 12.9** 0.24 4.8 26.4 9.4*RR 0.39 0.0 17.9 0.000
Stocking rate
(AUM ⋅ ha-1)
1.3 0.02 0.77 1.5 0.92* 0.05 0.0 2.5 0.97* 0.02 0.23 1.4 0.000
Rangeland production
potential (kg ⋅ ha-1)
1789 29 1027 2608 1372** 27 197 2625 1518** 26 616 2389 0.000
a Abbreviations: K-W Test, Kruskal-Wallis Test of significance.
*SL Indicates covariate value is significantly lower or higher (p < 0.05) relative to season-long grazing systems.
*RR Indicates covariate value is significantly lower or higher (p < 0.05) relative to rest-rotation grazing systems.
** Indicates covariate value is significantly lower or higher (p < 0.05) than that of both the other grazing systems.
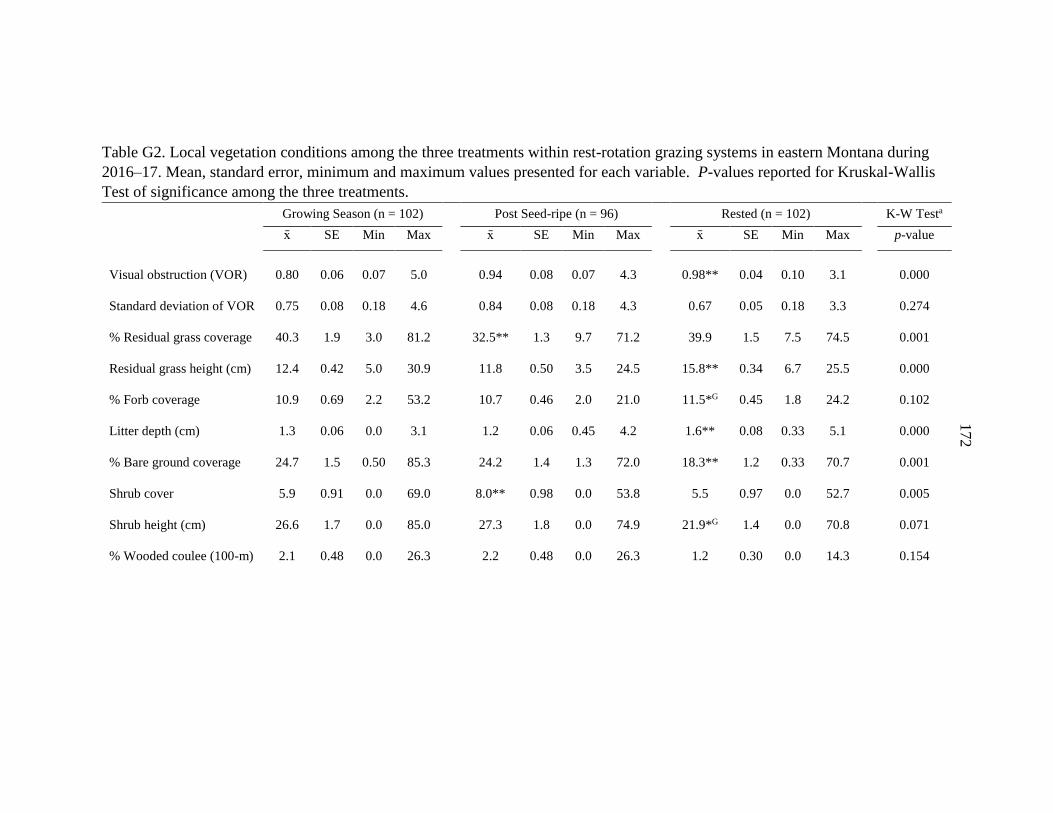
172
Table G2. Local vegetation conditions among the three treatments within rest-rotation grazing systems in eastern Montana during
2016–17. Mean, standard error, minimum and maximum values presented for each variable. P-values reported for Kruskal-Wallis
Test of significance among the three treatments. Growing Season (n = 102) Post Seed-ripe (n = 96) Rested (n = 102) K-W Testa
x̄ SE Min Max x̄ SE Min Max x̄ SE Min Max p-value
Visual obstruction (VOR) 0.80 0.06 0.07 5.0 0.94 0.08 0.07 4.3 0.98** 0.04 0.10 3.1 0.000
Standard deviation of VOR 0.75 0.08 0.18 4.6 0.84 0.08 0.18 4.3 0.67 0.05 0.18 3.3 0.274
% Residual grass coverage 40.3 1.9 3.0 81.2 32.5** 1.3 9.7 71.2 39.9 1.5 7.5 74.5 0.001
Residual grass height (cm) 12.4 0.42 5.0 30.9 11.8 0.50 3.5 24.5 15.8** 0.34 6.7 25.5 0.000
% Forb coverage 10.9 0.69 2.2 53.2 10.7 0.46 2.0 21.0 11.5*G 0.45 1.8 24.2 0.102
Litter depth (cm) 1.3 0.06 0.0 3.1 1.2 0.06 0.45 4.2 1.6** 0.08 0.33 5.1 0.000
% Bare ground coverage 24.7 1.5 0.50 85.3 24.2 1.4 1.3 72.0 18.3** 1.2 0.33 70.7 0.001
Shrub cover 5.9 0.91 0.0 69.0 8.0** 0.98 0.0 53.8 5.5 0.97 0.0 52.7 0.005
Shrub height (cm) 26.6 1.7 0.0 85.0 27.3 1.8 0.0 74.9 21.9*G 1.4 0.0 70.8 0.071
% Wooded coulee (100-m) 2.1 0.48 0.0 26.3 2.2 0.48 0.0 26.3 1.2 0.30 0.0 14.3 0.154
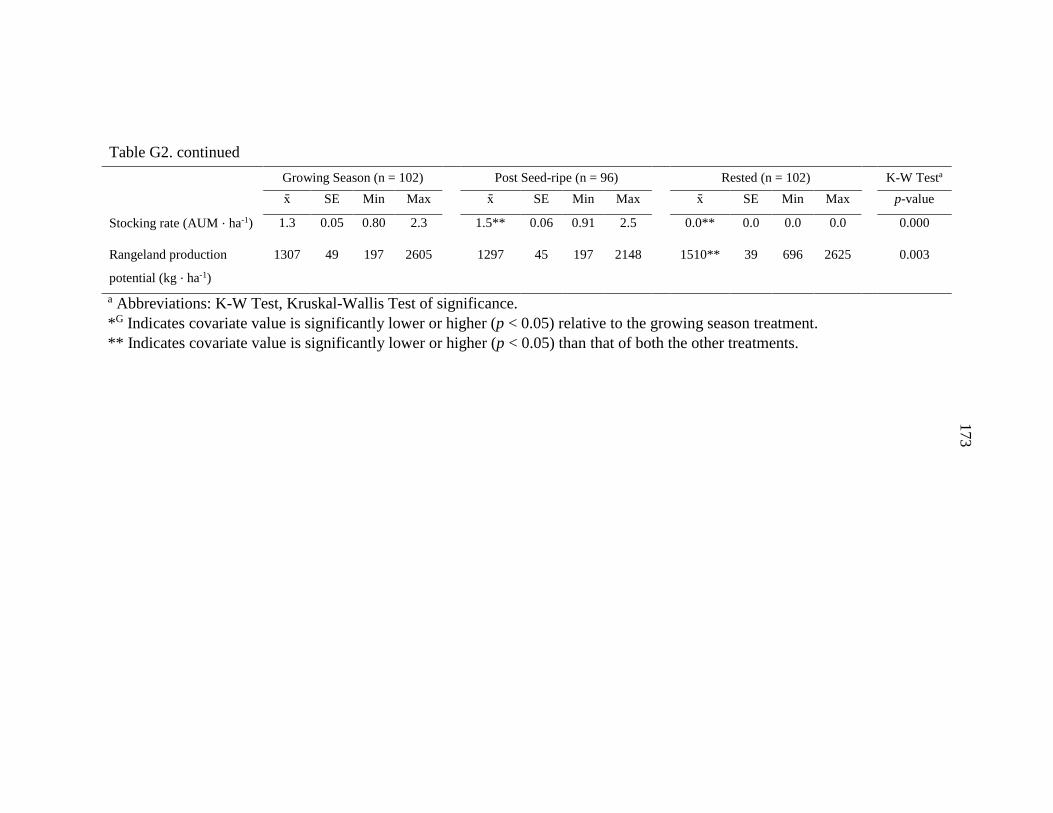
173
Table G2. continued
Growing Season (n = 102) Post Seed-ripe (n = 96) Rested (n = 102) K-W Testa
x̄ SE Min Max x̄ SE Min Max x̄ SE Min Max p-value
Stocking rate (AUM ⋅ ha-1) 1.3 0.05 0.80 2.3 1.5** 0.06 0.91 2.5 0.0** 0.0 0.0 0.0 0.000
Rangeland production
potential (kg ⋅ ha-1)
1307 49 197 2605 1297 45 197 2148 1510** 39 696 2625 0.003
a Abbreviations: K-W Test, Kruskal-Wallis Test of significance.
*G Indicates covariate value is significantly lower or higher (p < 0.05) relative to the growing season treatment.
** Indicates covariate value is significantly lower or higher (p < 0.05) than that of both the other treatments.

174
Pag
e1 7 4
APPENDIX H
MODEL SELECTION RESULTS DESCRIBING SUPPORT FOR EFFECTS ON
MESOCARNIVORE DETECTION PROBABILITY AND LOCAL OCCUPANCY
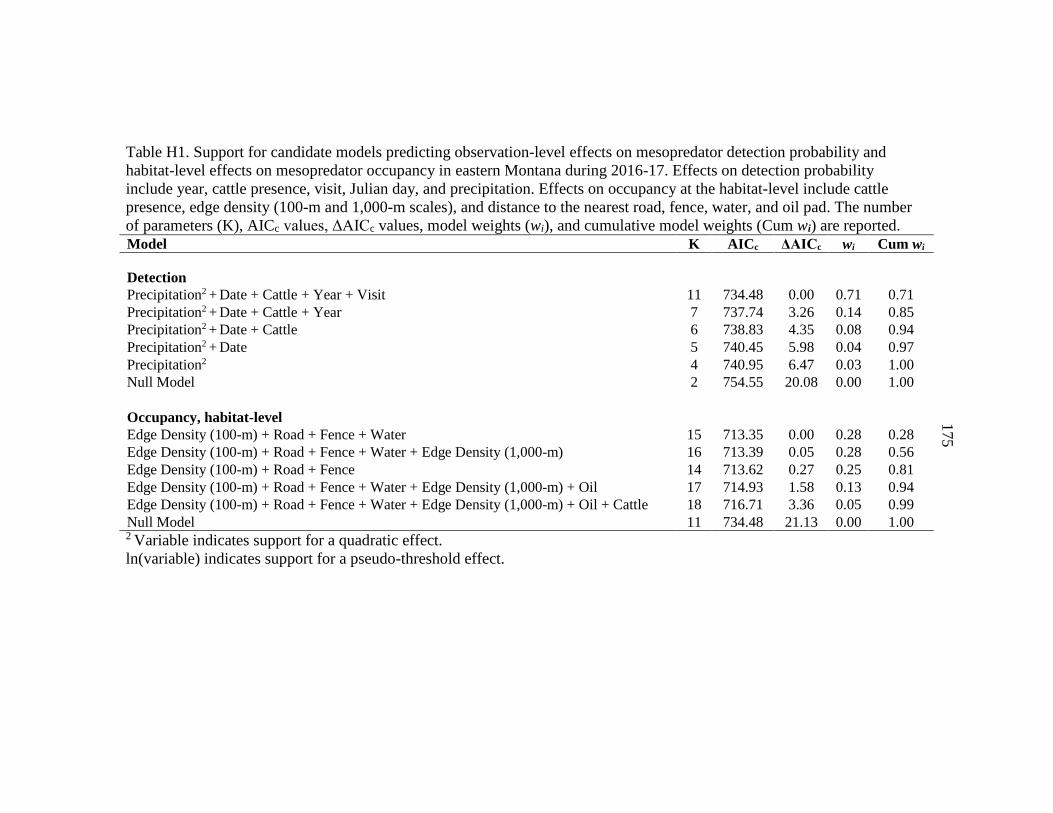
175
Table H1. Support for candidate models predicting observation-level effects on mesopredator detection probability and
habitat-level effects on mesopredator occupancy in eastern Montana during 2016-17. Effects on detection probability
include year, cattle presence, visit, Julian day, and precipitation. Effects on occupancy at the habitat-level include cattle
presence, edge density (100-m and 1,000-m scales), and distance to the nearest road, fence, water, and oil pad. The number
of parameters (K), AICc values, ΔAICc values, model weights (wi), and cumulative model weights (Cum wi) are reported.
Model K AICc ΔAICc wi Cum wi
Detection
Precipitation2 + Date + Cattle + Year + Visit 11 734.48 0.00 0.71 0.71
Precipitation2 + Date + Cattle + Year 7 737.74 3.26 0.14 0.85
Precipitation2 + Date + Cattle 6 738.83 4.35 0.08 0.94
Precipitation2 + Date 5 740.45 5.98 0.04 0.97
Precipitation2 4 740.95 6.47 0.03 1.00
Null Model 2 754.55 20.08 0.00 1.00
Occupancy, habitat-level
Edge Density (100-m) + Road + Fence + Water 15 713.35 0.00 0.28 0.28
Edge Density (100-m) + Road + Fence + Water + Edge Density (1,000-m) 16 713.39 0.05 0.28 0.56
Edge Density (100-m) + Road + Fence 14 713.62 0.27 0.25 0.81
Edge Density (100-m) + Road + Fence + Water + Edge Density (1,000-m) + Oil 17 714.93 1.58 0.13 0.94
Edge Density (100-m) + Road + Fence + Water + Edge Density (1,000-m) + Oil + Cattle 18 716.71 3.36 0.05 0.99
Null Model 11 734.48 21.13 0.00 1.00 2 Variable indicates support for a quadratic effect.
ln(variable) indicates support for a pseudo-threshold effect.
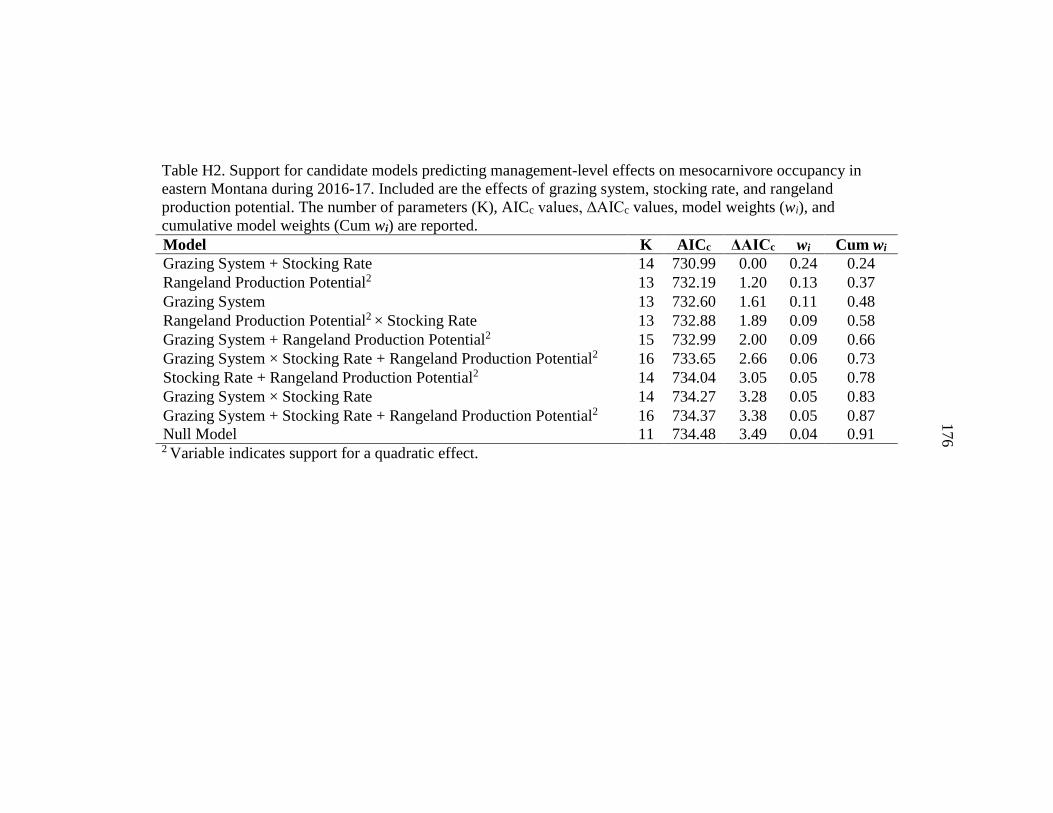
176
Table H2. Support for candidate models predicting management-level effects on mesocarnivore occupancy in
eastern Montana during 2016-17. Included are the effects of grazing system, stocking rate, and rangeland
production potential. The number of parameters (K), AICc values, ΔAICc values, model weights (wi), and
cumulative model weights (Cum wi) are reported.
Model K AICc ΔAICc wi Cum wi
Grazing System + Stocking Rate 14 730.99 0.00 0.24 0.24
Rangeland Production Potential2 13 732.19 1.20 0.13 0.37
Grazing System 13 732.60 1.61 0.11 0.48
Rangeland Production Potential2 × Stocking Rate 13 732.88 1.89 0.09 0.58
Grazing System + Rangeland Production Potential2 15 732.99 2.00 0.09 0.66
Grazing System × Stocking Rate + Rangeland Production Potential2 16 733.65 2.66 0.06 0.73
Stocking Rate + Rangeland Production Potential2 14 734.04 3.05 0.05 0.78
Grazing System × Stocking Rate 14 734.27 3.28 0.05 0.83
Grazing System + Stocking Rate + Rangeland Production Potential2 16 734.37 3.38 0.05 0.87
Null Model 11 734.48 3.49 0.04 0.91 2 Variable indicates support for a quadratic effect.